Operator
Good morning. My name is Erica, and I will be your conference operator today. At this time, I would like to welcome everyone to the Pangaea Logistics Solutions First Quarter 2026 Results Conference Call. Today's call is being recorded and will be available for replay beginning at 11:00 a.m. Eastern. The recording can be accessed by dialing (800) 938-2241 for domestic or (402) 220-1121 for international. It is now my pleasure to turn the floor over to Stefan Neely with Vallum Advisors. Please go ahead.
Thank you, operator, and welcome to the Pangaea Logistics Solutions First Quarter 2026 Results Conference Call. Leading the call with me today are CEO, Mads Petersen; and Chief Financial Officer, Gianni Del Signore. Today's discussion contains forward-looking statements about future business and financial expectations. Actual results may differ significantly from those projected in today's forward-looking statements due to various risks and uncertainties, including the risks described in our periodic reports filed with the SEC. Except as required by law, we undertake no obligation to update our forward-looking statements. At the conclusion of our prepared remarks, we will open the line for questions. With that, I would like to turn the call over to Mads.
Speaker 2
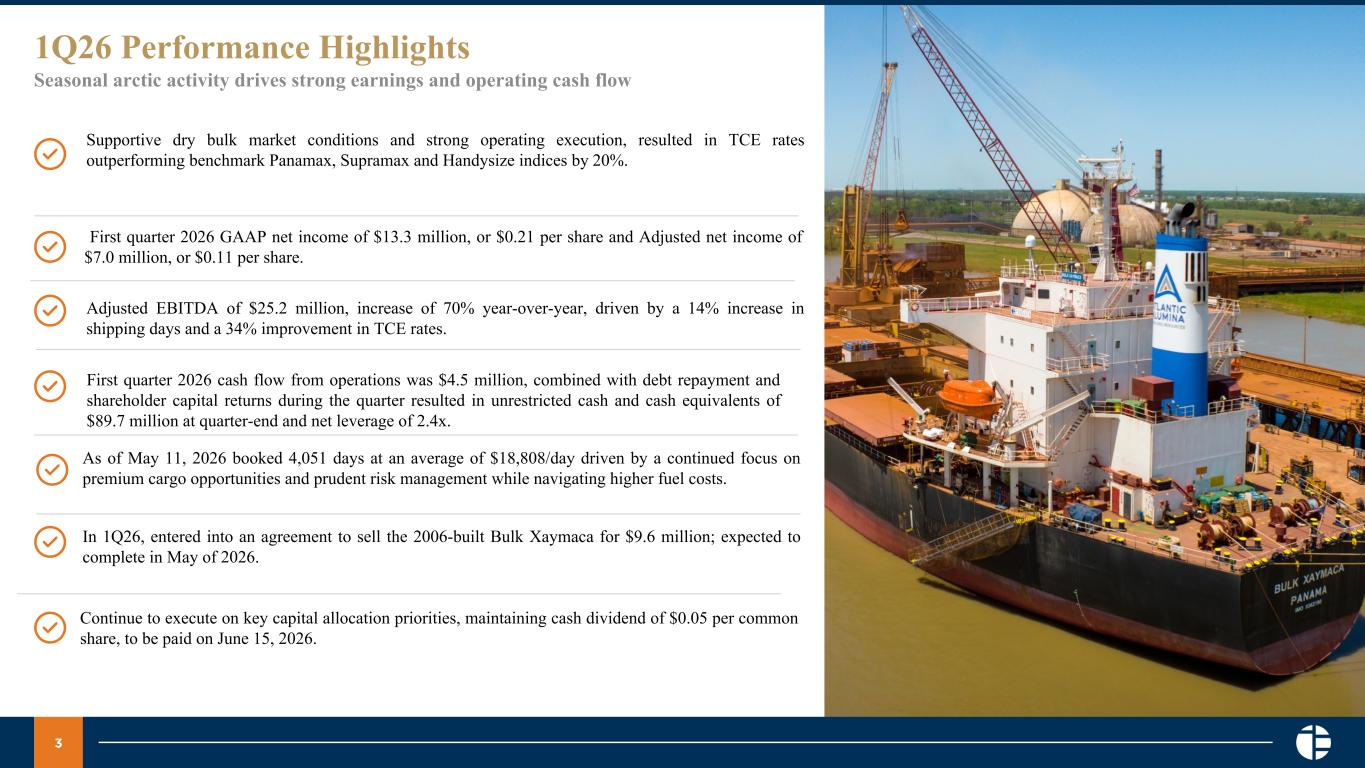
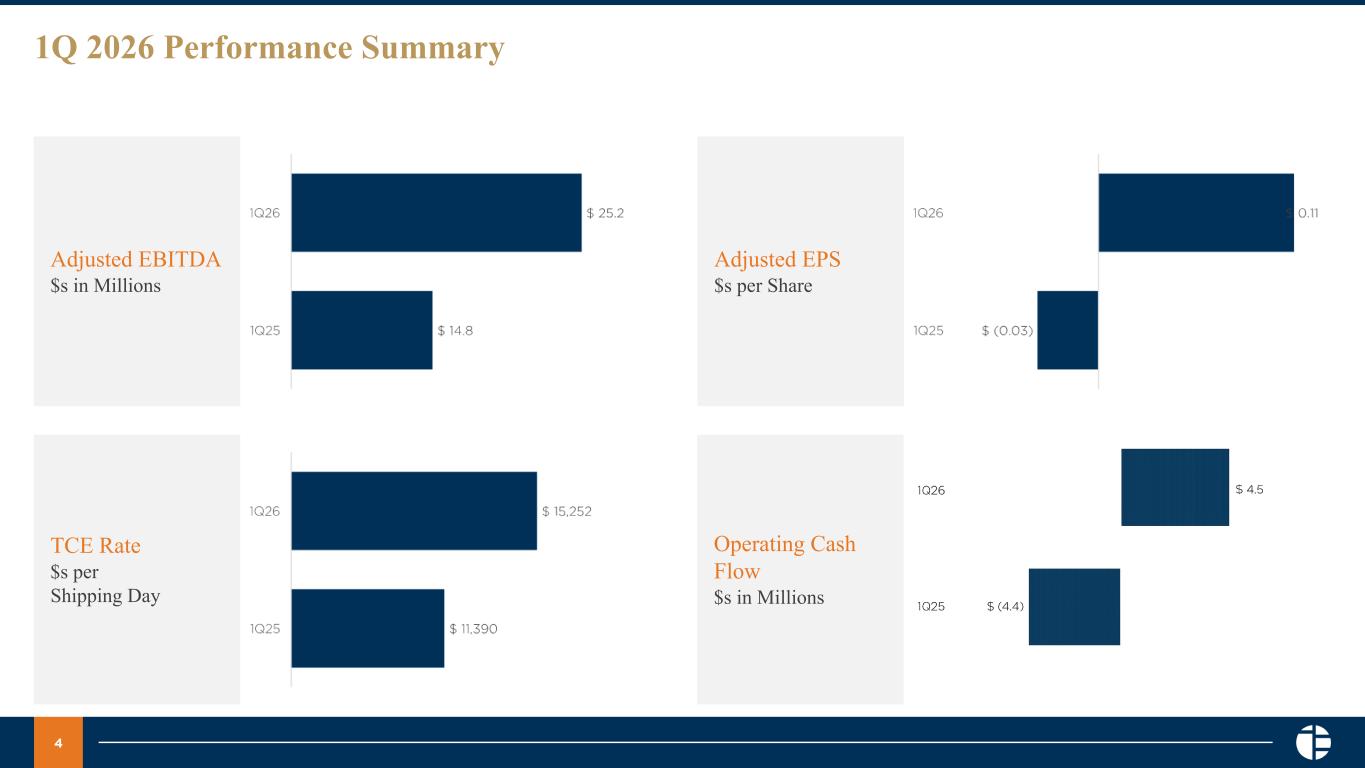
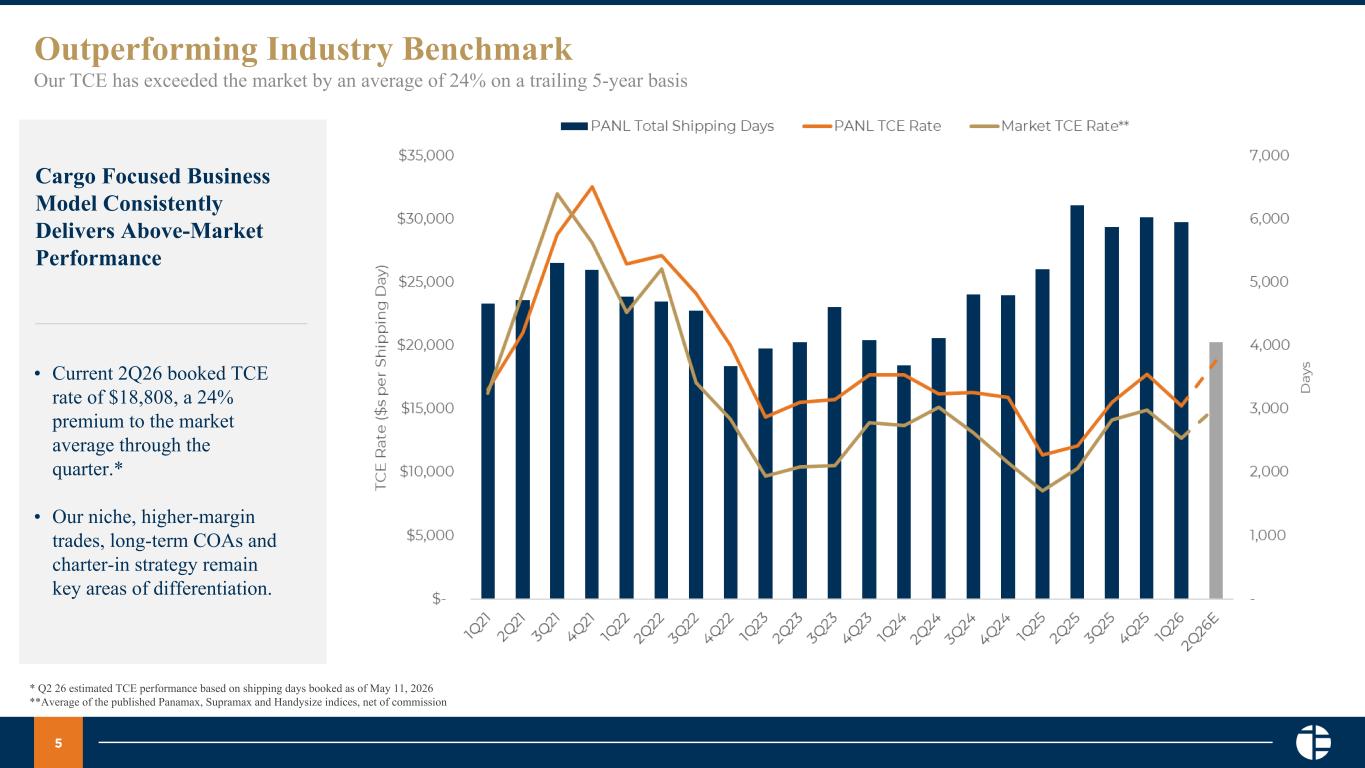
Thank you, Stefan, and welcome to those joining us on the call today. We delivered a strong start to 2026 with year-over-year growth across revenue and profitability. Our performance was driven by higher activity, strong market fundamentals and the continued benefits of Pangaea's operating model. In the first quarter, our TCE rates averaged 20% above the prevailing market for the Panamax, Supramax and Handysize indices. This premium reflects the value of our operating platform, long-standing customer relationships and ability to manage a volatile market effectively across trade routes. Total shipping days increased 14% year-over-year, supported by a strong market and our use of chartered-in capacity to complement our own fleet. Our chartered-in fleet increased by 54% during the quarter, allowing us to capture market opportunities without compromising our long-term flexibility. That better market and increased activity translated into meaningful operating leverage. Adjusted EBITDA grew by more than $10 million year-over-year to $25.2 million. We also benefited from the second consecutive quarter of record EBITDA contribution from our terminal, Stevedoring and Port Services operation. We continue to expand our integrated Logistics platform in the first quarter as we began activities in the ports of Aransas, Texas and Lake Charles, Louisiana. We also expect operations in Tampa, Florida to begin in June. These investments strengthen and deepen the integration of our services across our customer supply chains while creating additional recurring revenue beyond ocean freight. We also advanced our fleet renewal strategy. As previously announced, we entered into an agreement to sell the Bulk Xaymaca for $9.6 million, and we expect the sale to close during May. This transaction is consistent with our focus on fleet renewal and maintaining an efficient fleet that meets our customers' needs as well as commercial and environmental performance. We continue to evaluate potential additions to our fleet as part of our disciplined approach to capital allocation. Our balance sheet remains strong, giving us the flexibility to allocate capital towards the growth and modernization of our fleet and the expansion of our port operations while also enabling us to return value to shareholders. We ended the first quarter with $19 million of cash after paying out $3.9 million of dividends during the period. Looking at the market, near-term dry bulk fundamentals remain supportive for our mix of minor bulks. Stronger Chinese iron ore imports and the recent improvement in Indonesian coal exports have contributed to a firmer seasonal backdrop and a healthy demand over the medium term. Limited effective supply growth and continued strong ton-mile demand supports a positive market outlook. Geopolitical developments in the Arabian Gulf have not directly impacted Pangaea as we do not currently have vessels in the region, and it has not historically represented a significant part of our trade patterns. That said, the broader industry continues to see indirect effects through shifting trade flows and greater volatility in fuel prices. We remain focused on actively managing these risks, and Gianni will provide more detail on our fuel cost management later in the call. At the same time, our flexible operating model has allowed us to respond quickly to changing market conditions. For example, the suspension of the Jones Act created an opportunity for us to support a long-standing customer with a voyage between U.S. ports. The ability to quickly adjust to changing market dynamics and take advantage of opportunities like these are a core strength of the Pangaea operating platform. As we move through the second quarter, market sentiment remains positive, showing strength ahead of the usually stronger markets in the second half of the year. We are entering this seasonally stronger part of the year with a good visibility, healthier customer demand and continued focus on managing fuel cost volatility. To date, we have booked 4,051 shipping days at a TCE of $18,808 per day for Q2. Overall, we are pleased with our first quarter performance and the momentum we are carrying into the balance of 2026. Our strategy remains consistent, operate with discipline, expand where we see attractive returns, maintain balance sheet flexibility and create long-term value for customers and shareholders. With that, I'll turn the call over to Gianni to walk through our first quarter financial results.
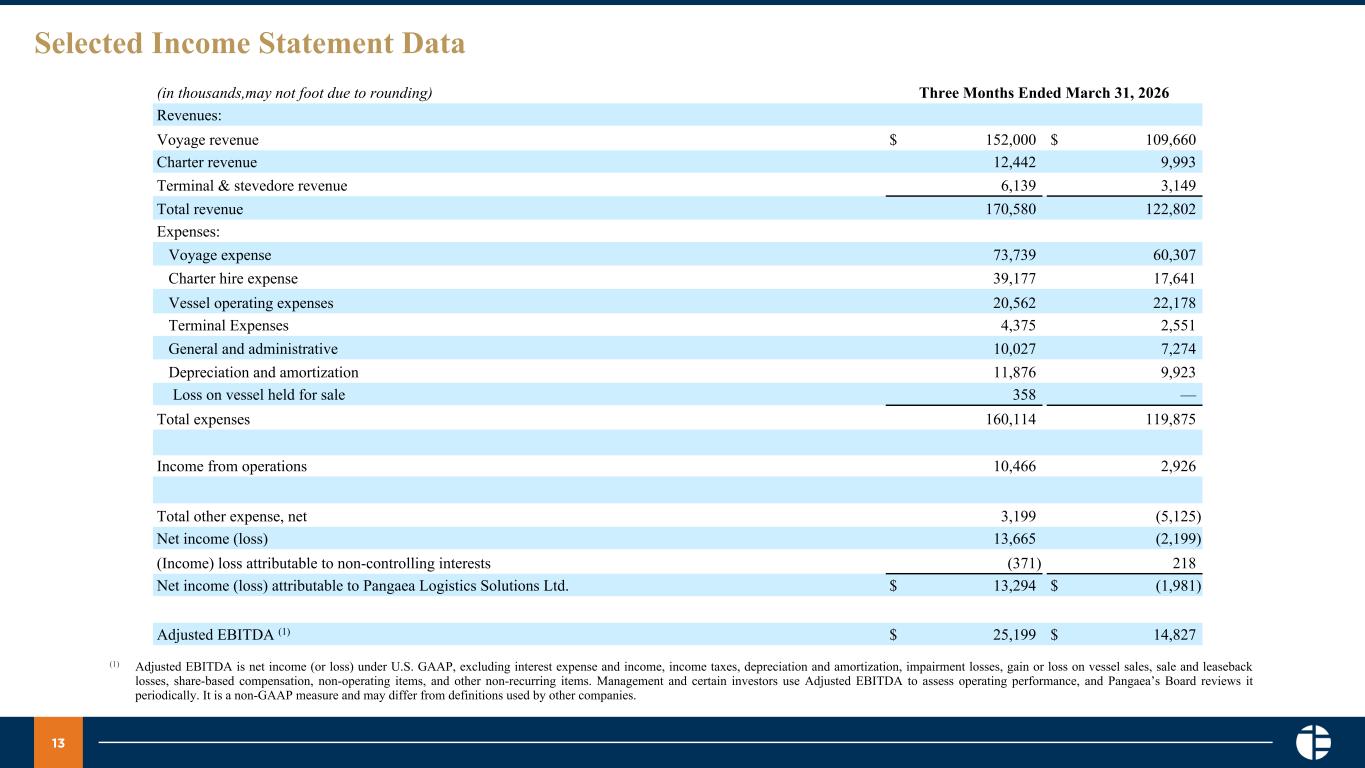
Thank you, Mads, and welcome to those joining us on the call today. Our first quarter financial results were highlighted by sustained TCE premiums relative to the prevailing market. First quarter TCE rates were $15,252 per day, a premium of 20% over the average published market rates for Panamax, Supramax and Handysize vessels in the period. Our adjusted EBITDA for the first quarter was $25.2 million, an increase of approximately $10 million, driven by a 34% increase in TCE earnings year-over-year. Our total charter hire expenses increased by 122% due to a year-over-year increase in charter-in vessels used to complement our own fleet as well as an increase in market rates to charter-in vessels. Our charter-in cost on a per day basis was $14,488 in the first quarter of 2026. And through today, we've booked 1,550 days at $16,880 per day for the second quarter. Vessel operating expenses decreased by 7% year-over-year as a result of a decrease in owned days due to the sale of 2 vessels in 2025. On a per day basis, vessel operating expenses net of technical management fees was $5,644 per day, a 2% increase from the prior year. Total general and administrative expenses increased by 38% from $7.3 million to approximately $10 million. The increase was primarily due to an increase in noncash stock compensation expense, along with higher compensation costs associated with added headcount across the organization as we grow our business. In 2026, we made a prospective change to our depreciation policy on non-ice class vessels in our fleet to reduce the depreciation period from 30 years to 25 years. This change resulted in $1.6 million of incremental depreciation expense for the quarter. In total, our reported GAAP net income for the first quarter was $13.3 million or $0.21 per diluted share. Our GAAP net income included a significant gain resulting from our hedging strategy on bunker fuel exposure given the significant increase in fuel prices we've experienced in recent months. As we've discussed in the past, we utilize bunker swaps and options to selectively hedge our exposure to the market on our long-term cargo contracts and forward cargo bookings. While this approach locks in future cash flows, the mark-to-market unrealized gains or losses can lead to fluctuations in our reported results on a period-to-period basis. When excluding the impact of these unrealized gains from derivative instruments as well as other non-GAAP adjustments, our reported adjusted net income was $7 million or $0.11 per diluted share. Moving on to cash flows. During the quarter, we paid off the remaining balance on the Bulk Xaymaca finance lease for $1.3 million in advance of the sale, as Mads previously mentioned. At quarter end, we had approximately $90 million in unrestricted cash and total debt, including finance lease obligations of approximately $359 million. Our capital allocation priorities remain disciplined and balanced. Looking ahead, we will continue to allocate capital with a focus on preserving financial flexibility, supporting the growth of our integrated logistics platform and returning capital to shareholders. We remain focused on investments that enhance the durability of our earnings base, including the expansion of our terminal and port services capabilities and ongoing fleet renewal initiatives that improve efficiency, support customer needs and position us for evolving regulatory requirements. With that, we will now open the line for questions.
Operator
We'll take our first question from Liam Burke with B. Riley Securities.
Speaker 4
Mads, you had chartered-in vessels up 54% year-over-year. Now that's part of the flexible charter — I mean cargo-first strategy. But is there any pressure on you to add vessels rather than continue to charter in?
Speaker 2
No, I wouldn't say that that's pressure as such. I expect that you mean to add owned vessels?
Speaker 2
Yes. I mean we're always looking, right? And — but as you say, that sort of increase in the chartered-in fleet when the market is good, and we like the outlook is that will not change depending on how many owned vessels we have in the fleet. So I wouldn't say that we charter in more if we have sold a ship, for instance. So the chartered-in fleet is — the primary function of that is an arbitrage against the owned vessels. And in markets such as these, we will always look to take advantage of those opportunities.
Speaker 4
Great. And as we move into the summer season, the Arctic activity picks up. Are there any geopolitical ripples that will affect your Arctic business during the summer?
Speaker 2
No, I do not expect so. Our business in the Arctic is between Canada and Europe mainly. And we are gearing up to start that around the same usual time towards the end of — or in early Q3. So I don't expect — I don't see any disruption there.
Operator
And we'll take our next question from Poe Fratt with AGP Alliance Global Partners.
Speaker 5
Gianni, just a quick question on G&A. I know that you talked about headcount expansion to support the business model. If I back out noncash comp of $1.7 million, I get a run rate that's about $8.3 million. What — is that a reasonable run rate for the rest of the year? Or sort of can you give me an idea of sort of how G&A looks for the rest of the year?
Yes. You picked up exactly. One of the issues with G&A for the first quarter is the recognition of noncash stock compensation expense that hits the quarter, and it's $1.7 million. So backing that out, that is definitely something that impacts first quarter. So removing that, it's more reflective of a run rate for the year. The other item that's in our first quarter and will also impact future quarters is the — its recognition of incentive compensation for the year. So that is a variable component of our G&A that will impact future quarters. But I think subtracting backing out the noncash, that's going to be more reflective for the balance of the year.
Speaker 5
Okay. And then when you look at your TCE Mads for the quarter, you booked just over 4,000 days and close to 19,000. Are you currently booking in that range or higher or lower for the rest of the quarter? I'm assuming a little bit higher, but if you can just give me some color on what the rest of the quarter might look like from a TCE standpoint.
Speaker 2
Yes. I think it's likely going to be right around there, maybe a tick higher on average, I would guess. I mean we also do have some voyages that we have yet to perform in Q2. But I think you will see that the indices where they're trading at the moment, and that's, of course, around the levels where we are fixing business now.
Speaker 5
And then in your remarks, you mentioned the suspension of the Jones Act. Did that have a — is that going to have a more meaningful impact over the rest of the year? Or is it sort of just something that just happened in the quarter, but it's more just color, not actually a meaningful impact?
Speaker 2
I would say that it was sort of more on an opportunistic approach. It's a customer that we are working with already, have been for a long time, and they had an opportunity that we could work together on, something that we would like to do more of as long as it remains possible for us to do so. But I wouldn't attribute sort of a sizable contribution from that activity right away.
Speaker 5
Okay. And then just lastly, nice to see a nice bump sequentially and year-over-year in the terminaling business or Stevedoring. Is that a reasonable run rate for the rest of the year? You mentioned another expansion in Florida. What's the rest of the year look like for the terminal and Stevedoring business?
Yes. Q1 in terminal and Stevedoring was definitely one of our highest quarters. We had the addition of two port operations that we mentioned previously. And then also in Port Everglades, it was a busy quarter from a dry bulk perspective. We had a really busy quarter that drove, I would say, $200,000 to $300,000 of incremental income in that quarter. So Q2, we'll probably see a small decline, about $200,000. And then after that, I expect it to be somewhat like Q1 for the third quarter and fourth quarter.
Speaker 5
Okay. And that's helpful. How about on a margin basis because it's the highest margin that I've seen over the last two years or so, close to 30% gross margin. Is that sustainable? Or — I mean, should that sort of moderate over the rest of the year?
Yes. I think some of that is from the dry bulk activity, which does pay a higher margin. But we expect that to be sustainable for Q3 and Q4 for sure. And then the other thing to point out, when we think about our terminal and Stevedore operations, also in our P&L, we have other income below the line. That is also attributable to our port operations. It's the income on our JVs that are in Gramercy. So that also is part of the income for the quarter.
Speaker 5
Sorry, I didn't notice that. Is that the $2 million? Or is that — I thought that was interest income was $2 million.
No, it's the other income. It's about $500,000. I think it's $484,000 in other income. That is the recognition of our ownership interest in Port and Stevedore joint ventures.
Operator
We'll take our next question from Climent Molins with Value Investor's Edge.
Speaker 6
Most has already been covered, but I wanted to touch upon operating expenses. What were the key drivers behind the significant quarter-over-quarter decrease? Is this kind of like a sustainable run rate going forward?
Yes. On OpEx, Climent, I think the decrease, one is we sold two vessels in the prior year that reduced our total owned days. So driving it from an absolute figure, it has declined. On a per day basis, we're seeing a slight increase. It was about, I think, a 2% increase on a per day basis on the ships — but still within reason and our expectation of a declining vessel operating expense. So it was what we expected going into the year, and we hope we'll see it continue for the balance of the year.
Speaker 6
And I also wanted to ask about your fleet positioning. As you think about fleet renewal or expansion, are you seeing any attractive acquisition opportunities? Where do you currently see the most value?
Speaker 2
Yes. I mean, we are positive on the near and sort of medium-term outlook for the markets, and we are always evaluating the opportunities that we see. We can still make sense of those at today's prices, even though they are, in historical terms, quite high, we have the business to support that. So in the secondhand market, we do expect to be more active there on the buying side over the next year or so. We still see good value there.
Operator
It appears we have no further questions in queue. I'd like to turn it back over to Mads Petersen for any closing comments.
Speaker 2
Thank you. Once again, thank you for joining our call. Should you have any questions, please feel free to contact us at [email protected], and a member of our team will follow up with you. This concludes our call today. You may now disconnect.
Operator
Thank you. This brings us to the end of today's meeting. We appreciate your time and participation. Have a nice day.