
Pembina Pipeline Corp 6-K, filed Nov 5, 2024
Pembina Pipeline Corp (PBA)
6-K
2024-11-05
For: 2024-09-30
View Original
Added on
April 09, 2026
About this 6-K
Pembina Pipeline Corp filed this 6-K on November 5, 2024.
UNITED STATES
SECURITIES AND EXCHANGE COMMISSION
Washington, D.C. 20549
FORM 6-K
REPORT OF FOREIGN PRIVATE ISSUER PURSUANT TO RULE 13a-16 OR 15d-16
UNDER THE SECURITIES EXCHANGE ACT OF 1934
For the month of November, 2024
Commission File Number: 001-35563
PEMBINA PIPELINE CORPORATION
(Name of registrant)
(Room #39-095) 4000, 585 8th Avenue S.W.
Calgary, Alberta T2P 1G1
(Address of principal executive offices)
Indicate by check mark whether the registrant files or will file annual reports under cover of Form 20-F or Form 40-F.
o Form 20-F | x Form 40-F | ||||||||||
INCORPORATION BY REFERENCE
Exhibit 99.1 to this Report on Form 6-K is hereby incorporated by reference as an exhibit to the Registration Statement on Form F-10 (File No. 333-261207) of Pembina Pipeline Corporation.
SIGNATURES
Pursuant to the requirements of the Securities Exchange Act of 1934, the registrant has duly caused this report to be signed on its behalf by the undersigned, thereunto duly authorized.
| PEMBINA PIPELINE CORPORATION | |||||||||||
| Date: | November 5, 2024 | By: | /s/ Cameron J. Goldade | ||||||||
| Name: Cameron J. Goldade | |||||||||||
| Title: Senior Vice President & Chief Financial Officer | |||||||||||
Form 6-K Exhibit Index
| Exhibit Number | Document Description | |||||||
| 99.1 | ||||||||
| 99.2 | ||||||||
| 99.3 | ||||||||
REPORT TO SHAREHOLDERS |  | ||||||||||
| Third Quarter 2024 | |||||||||||
| MANAGEMENT'S DISCUSSION AND ANALYSIS | |||||||||||
Table of Contents | |||||||||||
6. Capital Expenditures | |||||||||||
Basis of Presentation
The following Management's Discussion and Analysis ("MD&A") of the financial and operating results of Pembina Pipeline Corporation ("Pembina" or the "Company") is dated November 5, 2024, and is supplementary to, and should be read in conjunction with, Pembina's unaudited condensed consolidated interim financial statements for the three and nine months ended September 30, 2024 ("Interim Financial Statements") as well as Pembina's audited consolidated annual financial statements ("Consolidated Financial Statements") and MD&A for the year ended December 31, 2023. All financial information provided in this MD&A has been prepared in accordance with International Accounting Standard ("IAS") 34 Interim Financial Reporting and is expressed in Canadian dollars, unless otherwise noted. A description of Pembina's operating segments and additional information about Pembina is filed with Canadian and U.S. securities commissions, including quarterly and annual reports, annual information forms (filed with the U.S. Securities and Exchange Commission under Form 40-F) and management information circulars, and can be found online at www.sedarplus.ca, www.sec.gov and through Pembina's website at www.pembina.com. Information contained in or otherwise accessible through Pembina's website does not form part of this MD&A and is not incorporated into this document by reference.
Abbreviations
For a list of abbreviations that may be used in this MD&A, refer to the Abbreviations section of this MD&A.
Non-GAAP and Other Financial Measures
Pembina has disclosed certain financial measures and ratios within this MD&A that management believes provide meaningful information in assessing Pembina's underlying performance, but which are not specified, defined or determined in accordance with the Canadian generally accepted accounting principles ("GAAP") and which are not disclosed in Pembina's Interim Financial Statements or Consolidated Financial Statements. Such non-GAAP financial measures and non-GAAP ratios do not have any standardized meaning prescribed by IFRS and may not be comparable to similar financial measures or ratios disclosed by other issuers. Refer to the "Non-GAAP & Other Financial Measures" section of this MD&A for additional information regarding these non-GAAP measures and non-GAAP ratios.
Risk Factors and Forward-Looking Information
Management has identified the primary risk factors that could have a material impact on the financial results and operations of Pembina. Such risk factors are described in the "Risk Factors" section of Pembina's MD&A and Annual Information Form ("AIF"), each for the year ended December 31, 2023. The Company's financial and operational performance is potentially affected by a number of factors, including, but not limited to, the factors described within the "Forward-Looking Statements & Information" section of this MD&A. This MD&A contains forward-looking statements based on Pembina's current expectations, estimates, projections and assumptions. This information is provided to assist readers in understanding the Company's future plans and expectations and may not be appropriate for other purposes.
Pembina Pipeline Corporation Third Quarter 2024 1
1. ABOUT PEMBINA
Pembina Pipeline Corporation is a leading energy transportation and midstream service provider that has served North America's energy industry for 70 years. Pembina owns an integrated network of hydrocarbon liquids and natural gas pipelines, gas gathering and processing facilities, oil and natural gas liquids infrastructure and logistics services, and an export terminals business. Through our integrated value chain, we seek to provide safe and reliable energy solutions that connect producers and consumers across the world, support a more sustainable future and benefit our customers, investors, employees and communities. For more information, please visit www.pembina.com.
Pembina's Purpose and Strategy
We deliver extraordinary energy solutions so the world can thrive.
Pembina will build on its strengths by continuing to invest in and grow the core businesses that provide critical transportation and midstream services to help ensure reliable and secure energy supply. Pembina will capitalize on exciting opportunities to leverage its assets and expertise into new service offerings that proactively respond to the transition to a lower-carbon economy. In continuing to meet global energy demand and its customers' needs, while ensuring Pembina's long-term success and resilience, the Company has established four strategic priorities:
1.To be resilient, we will sustain, decarbonize, and enhance our businesses. This priority is focused on strengthening and growing our existing franchise and demonstrating environmental leadership.
2.To thrive, we will invest in the energy transition to improve the basins in which we operate. We will expand our portfolio to include new businesses associated with lower-carbon commodities.
3.To meet global demand, we will transform and export our products. We will continue our focus on supporting the transformation of Western Canadian Sedimentary Basin commodities into higher margin products and enabling more coastal egress.
4.To set ourselves apart, we will create a differentiated experience for our stakeholders. We remain committed to delivering excellence for our four key stakeholder groups meaning that:
a.Employees say we are the 'employer of choice' and value our safe, respectful, collaborative, and inclusive work culture.
b.Communities welcome us and recognize the net positive impact of our social and environmental commitment.
c.Customers choose us first for reliable and value-added services.
d.Investors receive sustainable industry-leading total returns.
2 Pembina Pipeline Corporation Third Quarter 2024
Alliance/Aux Sable Acquisition
On April 1, 2024, Pembina completed the acquisition of Enbridge Inc.'s ("Enbridge") interests in the Alliance, Aux Sable, and NRGreen joint ventures (the "Acquirees") for an aggregate purchase price of $2.8 billion, net of $327 million of assumed debt, representing Enbridge's proportionate share of the indebtedness of Alliance (the "Alliance/Aux Sable Acquisition" or the "Acquisition"). Pursuant to the Acquisition, Pembina acquired all equity interests in Alliance, Aux Sable's Canadian operations, and NRGreen businesses, and an 85.4 percent interest in Aux Sable's U.S. operations. On August 1, 2024, Pembina acquired the remaining 14.6 percent interest in Aux Sable's U.S. operations from certain subsidiaries of The Williams Companies for U.S. $160 million. The accounting for the results of the Acquirees changed from the equity method of accounting to being fully consolidated and incorporated into Pembina's financial results commencing April 1, 2024. Following the Acquisition, Alliance and NRGreen are fully consolidated into the financial results of the Pipelines Division, while Aux Sable is reported within the Facilities Division and Marketing & New Ventures Division. Refer to Note 3 to the Interim Financial Statements for more information.
The Alliance/Aux Sable Acquisition was funded through a combination of: (i) the net proceeds of Pembina's bought deal offering of 29.9 million subscription receipts (the "Subscription Receipt Offering"), which closed on December 19, 2023; (ii) a portion of the net proceeds of the offering of $1.8 billion aggregate principal amount of senior unsecured medium-term notes (the "January MTN Offering"), which closed on January 12, 2024; and (iii) amounts drawn under Pembina's credit facilities and cash on hand. Refer to the "Share Capital" and "Liquidity & Capital Resources – Financing Activity" sections of this MD&A for additional information.
The Cedar LNG Project
On June 25, 2024, the Haisla Nation and Pembina, partners in Cedar LNG Partners LP ("Cedar LNG"), announced a positive Final Investment Decision ("FID") in respect of the Cedar LNG project (the "Cedar LNG Project"), a floating liquefied natural gas facility located in Kitimat, British Columbia, Canada, within the traditional territory of the Haisla Nation. Refer to the "Segment Results – Marketing & New Ventures Division – Projects & New Developments" section of this MD&A for additional information.
Pembina Pipeline Corporation Third Quarter 2024 3
2. FINANCIAL & OPERATING OVERVIEW
Consolidated Financial Overview for the Three Months Ended September 30
Results of Operations
| ($ millions, except where noted) | 2024 | 2023 | Change | |||||||||||
Revenue(1) | 1,844 | 1,455 | 389 | |||||||||||
Net revenue(1)(2) | 1,259 | 989 | 270 | |||||||||||
Gross profit | 747 | 659 | 88 | |||||||||||
Adjusted EBITDA(2) | 1,019 | 1,021 | (2) | |||||||||||
Earnings | 385 | 346 | 39 | |||||||||||
Earnings per common share – basic (dollars) | 0.60 | 0.58 | 0.02 | |||||||||||
Earnings per common share – diluted (dollars) | 0.60 | 0.57 | 0.03 | |||||||||||
| Cash flow from operating activities | 922 | 644 | 278 | |||||||||||
Cash flow from operating activities per common share – basic (dollars) | 1.59 | 1.17 | 0.42 | |||||||||||
Adjusted cash flow from operating activities(2) | 724 | 659 | 65 | |||||||||||
Adjusted cash flow from operating activities per common share – basic (dollars)(2) | 1.25 | 1.20 | 0.05 | |||||||||||
| Capital expenditures | 262 | 169 | 93 | |||||||||||
Change in Earnings ($ millions)

Results Overview
Earnings in the third quarter of 2024 increased by $39 million over the prior period. Significant factors impacting the quarter by segment include:
•Pipelines: The change over prior period was primarily due to the positive impacts from the Alliance/Aux Sable Acquisition, offset by lower net revenues and volumes on the Cochin Pipeline, and earlier recognition of take-or-pay revenue in the first half of 2024 on the Peace Pipeline system, which more than offset the increase from higher contracted volumes.
•Facilities: The change over prior period was largely due to Pembina acquiring a controlling ownership interest in Aux Sable following the Acquisition, offset by lower Share of Profit from PGI largely due to unrealized losses on interest rate derivative financial instruments and lower other income as the third quarter of 2023 included a gain resulting from the recognition of a finance lease.
•Marketing & New Ventures: The change over prior period was largely due to unrealized gains on NGL-based and crude oil-based derivatives in the period compared to losses in the third quarter of 2023, combined with higher net revenue resulting from higher NGL margins and the Acquisition, partially offset by larger unrealized losses on renewable power purchase agreements and larger realized losses on NGL-based derivatives.
•Corporate and Income Tax: The change over prior period was primarily due to higher net finance costs largely due to higher interest expense, and higher long-term incentive costs.
Additional factors impacting the segments are discussed in the table below and in the "Segment Results" section of this MD&A.
4 Pembina Pipeline Corporation Third Quarter 2024
Changes in Results for the Three Months Ended September 30 | ||||||||
Net revenue(1)(2) | $270 million increase, largely due to the Acquisition, in which Pembina acquired a controlling ownership interest in Alliance and Aux Sable, resulting in a change from equity accounting to being fully consolidated on April 1, 2024. Refer to the "About Pembina – Alliance/Aux Sable Acquisition" section of this MD&A. The third quarter of 2024 includes $275 million in consolidated net revenue related to Alliance and Aux Sable as wholly-owned entities. Additionally, the Marketing & New Ventures Division saw higher NGL margins, and higher revenue from risk management and physical derivative contracts largely due to unrealized gains on NGL-based and crude oil-based derivatives in the quarter, compared to losses in the third quarter of 2023. These results were partially offset by larger unrealized losses on renewable power purchase agreements, and lower operating recoveries largely related to lower power costs in the Pipelines and Facilities Divisions. Additionally, on the Cochin Pipeline, there was lower net revenue of $40 million due to lower tolls on new contracts ($21 million), which replaced long-term contracts that expired in mid-July 2024, lower volumes from a contracting gap from mid-July 2024 to August 1 associated with the return of line fill to certain customers, and lower interruptible demand during the quarter resulting from a narrower condensate price differential between western Canada and the U.S. Gulf Coast. This was combined with lower net revenue on the Peace Pipeline system due to earlier recognition of take-or-pay deferred revenue in the first half of 2024 ($15 million), which more than offset the increase from higher contracted volumes ($13 million), a nine-day unplanned outage at Aux Sable in July 2024 ($13 million), and larger realized losses on NGL-based derivatives in the third quarter of 2024 compared to the third quarter of 2023. | |||||||
| Operating expenses | $58 million increase, primarily due to operating expenses from Alliance and Aux Sable now being fully consolidated, and higher integrity spending on certain Pipeline assets. The third quarter of 2024 includes $54 million in operating expenses related to Alliance and Aux Sable as wholly-owned entities. These increases were partially offset by lower recoverable power costs resulting from the lower power pool price during the period. | |||||||
| Cash flow from operating activities | $278 million increase, primarily driven by the change in non-cash working capital, an increase in earnings adjusted for items not involving cash, an increase in payments collected through contract liabilities, and lower taxes paid, partially offset by lower distributions from equity accounted investees, and higher net interest paid. | |||||||
Adjusted cash flow from operating activities(2) | $65 million increase, primarily due to the same items impacting cash flow from operating activities, discussed above, excluding the change in non-cash working capital, and taxes paid, combined with lower current income tax expense. The increase is partially offset by higher accrued share-based payment expense. | |||||||
Adjusted EBITDA(2) | $2 million decrease. Results in the third quarter of 2024 were impacted by lower net revenue and volumes on the Cochin Pipeline, combined with earlier recognition of take-or-pay revenue in the first half of 2024 on the Peace Pipeline system, which more than offset the increase from higher contracted volumes. This is combined with lower realized gains on commodity-related derivatives compared to the third quarter of 2023, higher long-term incentive costs and lower other income in the Facilities Division as the third quarter of 2023 included a $16 million gain resulting from the recognition of a finance lease upon contract renewal of an asset, as well as the nine-day unplanned outage at Aux Sable in July 2024. These factors were largely offset by the positive net impacts of the increase in Pembina's ownership interest in Alliance and Aux Sable, and higher NGL margins. | |||||||
(1) Comparative 2023 period has been adjusted. See "Accounting Policies & Estimates – Change in Accounting Policies" and Note 2 to the Interim Financial Statements.
(2) Refer to the "Non-GAAP & Other Financial Measures" section of this MD&A.
Pembina Pipeline Corporation Third Quarter 2024 5
Consolidated Financial Overview for the Nine Months Ended September 30
Results of Operations
| ($ millions, except where noted) | 2024 | 2023 | Change | |||||||||||
Revenue(1) | 5,239 | 4,495 | 744 | |||||||||||
Net revenue(1)(2) | 3,393 | 2,831 | 562 | |||||||||||
Gross profit | 2,292 | 1,990 | 302 | |||||||||||
Adjusted EBITDA(2) | 3,154 | 2,791 | 363 | |||||||||||
Earnings | 1,302 | 1,078 | 224 | |||||||||||
Earnings per common share – basic (dollars) | 2.08 | 1.79 | 0.29 | |||||||||||
Earnings per common share – diluted (dollars) | 2.08 | 1.78 | 0.30 | |||||||||||
| Cash flow from operating activities | 2,312 | 1,755 | 557 | |||||||||||
Cash flow from operating activities per common share – basic (dollars) | 4.06 | 3.19 | 0.87 | |||||||||||
Adjusted cash flow from operating activities(2) | 2,343 | 1,899 | 444 | |||||||||||
Adjusted cash flow from operating activities per common share – basic (dollars)(2) | 4.11 | 3.45 | 0.66 | |||||||||||
| Capital expenditures | 713 | 429 | 284 | |||||||||||
Change in Earnings ($ millions)

Results Overview
Earnings during the first nine months of 2024 increased by $224 million over the prior period. Significant factors impacting the quarter by segment include:
•Pipelines: The change over prior period was primarily due to the positive impacts from the Alliance/Aux Sable Acquisition, the current period not being impacted by the Northern Pipeline system outage and the wildfires that affected the same period in 2023, as well as higher net revenues due to increased volumes and contractual inflation adjustments on tolls. These factors were partially offset by lower net revenue and volumes on the Cochin Pipeline.
•Facilities: The change over prior period was largely due to Pembina acquiring a controlling ownership interest in Aux Sable following the Acquisition and the current period not being impacted by the Northern Pipeline system outage that affected the same period in 2023. These positive factors were partially offset by lower other income as the third quarter of 2023 included a gain resulting from the recognition of a finance lease, and lower Share of Profit from PGI driven by unrealized losses on interest rate derivative financial instruments.
•Marketing & New Ventures: The change over prior period was primarily due to higher NGL margins and higher marketed NGL and crude oil volumes, higher other income due to gains related to Pembina's financial assurances assumed by Cedar LNG, and lower losses from Pembina's share of equity accounted investees. These factors were partially offset by larger unrealized losses on renewable power purchase agreements and realized losses on NGL-based derivatives in the period.
•Corporate and Income Tax: The change over prior period was largely due to higher interest expense, acquisition and integration costs, and higher long-term incentive costs, partially offset by the net impact of the deferred tax recovery recognized from the Acquisition and the loss on Acquisition recognized during the second quarter of 2024.
Additional factors impacting the segments are discussed in the table below and in the "Segment Results" section of this MD&A.
6 Pembina Pipeline Corporation Third Quarter 2024
Changes in Results for the Nine Months Ended September 30 | ||||||||
Net revenue(1)(2) | $562 million increase, largely due to the Acquisition, in which Pembina acquired a controlling ownership interest in Alliance and Aux Sable. The current period includes $545 million in consolidated net revenue related to Alliance and Aux Sable as wholly-owned entities. Additionally, there were higher net revenues in the Pipelines and Facilities Divisions due to higher volumes compared to the same period in 2023, which was impacted by the Northern Pipeline system outage and the wildfires. Contractual inflation adjustments on tolls and earlier recognition of take-or-pay deferred revenue in the first half of 2024 ($13 million) further contributed to the increase. Higher net revenue in the Marketing & New Ventures Division was driven by higher NGL margins and the impacts of the Acquisition, as well as higher NGL and crude oil volumes. These results were partially offset by lower revenue from risk management and physical derivative contracts due to larger unrealized losses on renewable power purchase agreements, and realized losses on NGL-based derivatives in 2024 compared to gains in 2023. Lower operating recoveries were largely related to lower power costs in the Pipelines and Facilities Divisions. Additionally, on the Cochin Pipeline, there was lower net revenue due to lower tolls on new contracts ($21 million), which replaced long-term contracts that expired in mid-July 2024, lower volumes from a contracting gap from mid-July 2024 to August 1 associated with the return of line fill to certain customers, and lower interruptible demand during the quarter resulting from a narrower condensate price differential between western Canada and the U.S. Gulf Coast. This is combined with a nine-day unplanned outage at Aux Sable in July 2024 ($13 million) which also partially offset the increase in net revenue. | |||||||
| Operating expenses | $98 million increase, primarily due to operating expenses from Alliance and Aux Sable now being fully consolidated, and higher recoverable geotechnical costs primarily on the Peace Pipeline system. The current period includes $107 million in consolidated operating expenses related to Alliance and Aux Sable as wholly-owned entities. These increases were partially offset by lower recoverable power costs, and lower costs in the Pipelines Division in 2024 compared to the same period in 2023, as 2023 was impacted by the Northern Pipeline system outage. | |||||||
| Cash flow from operating activities | $557 million increase, primarily driven by an increase in earnings adjusted for items not involving cash, the change in non-cash working capital, and an increase in payments collected through contract liabilities, partially offset by higher taxes paid, lower distributions from equity accounted investees, and higher net interest paid. | |||||||
Adjusted cash flow from operating activities(2) | $444 million increase, primarily due to the same items impacting cash flow from operating activities, discussed above, excluding the change in non-cash working capital, and taxes paid, combined with lower current income tax expense. The increase is partially offset by higher accrued share-based payment expense and distributions to non-controlling interest. | |||||||
Adjusted EBITDA(2) | $363 million increase, largely due to the net impacts of the increase in Pembina's ownership interest in Alliance and Aux Sable, higher net revenue and volumes on certain of Pembina's Pipelines and Facilities assets compared to 2023, which was affected by the Northern Pipeline system outage and the wildfires, and higher NGL margins and marketed volumes in the Marketing & New Ventures Division. Also contributing to the increase were contractual inflation adjustments on tolls, higher volumes on the Peace Pipeline system resulting from earlier recognition of take-or-pay deferred revenue in the first half of 2024, and higher adjusted EBITDA from PGI. These results were partially offset by lower realized gains on commodity-related derivatives in 2024 compared to the same period in 2023, lower net revenue and volumes on the Cochin Pipeline, and higher long-term incentive costs, combined with lower other income in the Facilities Division as the third quarter of 2023 included a $16 million gain resulting from the recognition of a finance lease upon contract renewal of an asset, and a nine-day unplanned outage at Aux Sable in July 2024. | |||||||
(1) Comparative 2023 period has been adjusted. See "Accounting Policies & Estimates – Change in Accounting Policies" and Note 2 to the Interim Financial Statements.
(2) Refer to the "Non-GAAP & Other Financial Measures" section of this MD&A.
Pembina Pipeline Corporation Third Quarter 2024 7
3. SEGMENT RESULTS
Business Overview
The Pipelines Division provides customers with pipeline transportation, terminalling, and storage in key market hubs in Canada and the United States for crude oil, condensate, natural gas liquids and natural gas. The Pipelines Division manages pipeline transportation capacity of 3.0 mmboe/d(1) and above ground storage capacity of approximately 10 mmbbls(1) within its conventional, oil sands and heavy oil, and transmission assets. The conventional assets include strategically located pipelines and terminalling hubs that gather and transport light and medium crude oil, condensate and natural gas liquids from western Alberta and northeast British Columbia to the Edmonton, Alberta area for further processing or transportation on downstream pipelines. The oil sands and heavy oil assets transport heavy and synthetic crude oil produced within Alberta to the Edmonton, Alberta area and offer associated storage and terminalling. The transmission assets transport natural gas, ethane and condensate throughout Canada and the United States on long haul pipelines linking various key market hubs. In addition, the Pipelines Division assets provide linkages to Pembina's Facilities Division assets across North America, enabling integrated customer service offerings. Together, these assets supply products from hydrocarbon producing regions to refineries, fractionators and market hubs in Alberta, British Columbia, and Illinois, as well as other regions throughout North America.
The Facilities Division includes infrastructure that provides Pembina's customers with natural gas, condensate and NGL services. Through its wholly-owned assets and its interest in PGI, Pembina's natural gas gathering and processing facilities are strategically positioned in active, liquids-rich areas of the WCSB and Williston Basin and are integrated with the Company's other businesses. Pembina provides sweet and sour gas gathering, compression, condensate stabilization, and both shallow cut and deep cut gas processing services with a total capacity of approximately 6.7 bcf/d(1) for its customers. Condensate and NGL extracted at virtually all Canadian-based facilities have access to transportation on Pembina's pipelines. In addition, all NGL transported along the Alliance Pipeline are extracted through the Channahon Facility at the terminus. The Facilities Division includes approximately 430 mbpd(1) of NGL fractionation capacity, 21 mmbbls(1) of cavern storage capacity and associated pipeline and rail terminalling facilities and a liquefied propane export facility on Canada's West Coast. These facilities are fully integrated with the Company's other divisions, providing customers with the ability to access a comprehensive suite of services to enhance the value of their hydrocarbons. In addition, Pembina owns a bulk marine import/export terminal in Vancouver, British Columbia.
The Marketing & New Ventures Division leverages Pembina's integrated value chain and existing network of pipelines, facilities, and energy infrastructure assets to maximize the value of hydrocarbon liquids and natural gas originating in the basins where the Company operates. Pembina pursues the creation of new markets, and further enhances existing markets, to support both the Company's and its customers' business interests. In particular, Pembina seeks to identify opportunities to connect hydrocarbon production to new demand locations through the development of infrastructure.
Within the Marketing & New Ventures Division, Pembina undertakes value-added commodity marketing activities including buying and selling products (natural gas, ethane, propane, butane, condensate, crude oil, electricity, and carbon credits), commodity arbitrage, and optimizing storage opportunities. The marketing business enters into contracts for capacity on both Pembina's and third-party infrastructure, handles proprietary and customer volumes and aggregates production for onward sale. Through this infrastructure capacity, including Pembina's Prince Rupert Terminal, as well as utilizing the Company's expansive rail fleet and logistics capabilities, Pembina's marketing business adds incremental value to the commodities by accessing high value markets across North America and globally.
The Marketing & New Ventures Division is also responsible for the development of new large-scale, or value chain extending projects, including those that provide enhanced access to global markets and support a transition to a lower-carbon economy. The Marketing & New Ventures Division includes Pembina's interest in the Cedar LNG Project, a liquified natural gas ("LNG") export facility currently under construction. Additionally, Pembina is pursuing opportunities associated with low-carbon commodities and large-scale greenhouse gas ("GHG") emissions reductions.
(1)Net capacity.
8 Pembina Pipeline Corporation Third Quarter 2024
Financial and Operational Overview by Division
| 3 Months Ended September 30 | ||||||||||||||||||||||||||||||||
| 2024 | 2023 | |||||||||||||||||||||||||||||||
($ millions, except where noted) | Volumes(1) | Earnings (Loss) | Adjusted EBITDA(2) | Volumes(1) | Earnings (Loss) | Adjusted EBITDA(2) | ||||||||||||||||||||||||||
| Pipelines | 2,738 | 433 | 593 | 2,595 | 437 | 591 | ||||||||||||||||||||||||||
| Facilities | 810 | 131 | 324 | 803 | 179 | 319 | ||||||||||||||||||||||||||
Marketing & New Ventures | 344 | 125 | 159 | 255 | (4) | 159 | ||||||||||||||||||||||||||
| Corporate | — | (215) | (57) | — | (170) | (48) | ||||||||||||||||||||||||||
| Income tax expense | — | (89) | — | — | (96) | — | ||||||||||||||||||||||||||
| Total | 385 | 1,019 | 346 | 1,021 | ||||||||||||||||||||||||||||
| 9 Months Ended September 30 | ||||||||||||||||||||||||||||||||
| 2024 | 2023 | |||||||||||||||||||||||||||||||
($ millions, except where noted) | Volumes(1) | Earnings (Loss) | Adjusted EBITDA(2) | Volumes(1) | Earnings (Loss) | Adjusted EBITDA(2) | ||||||||||||||||||||||||||
| Pipelines | 2,684 | 1,373 | 1,847 | 2,500 | 1,163 | 1,617 | ||||||||||||||||||||||||||
| Facilities | 823 | 489 | 974 | 757 | 467 | 889 | ||||||||||||||||||||||||||
Marketing & New Ventures | 319 | 324 | 490 | 261 | 231 | 424 | ||||||||||||||||||||||||||
| Corporate | — | (1,210) | (157) | — | (487) | (139) | ||||||||||||||||||||||||||
| Income tax expense/recovery | — | 326 | — | — | (296) | — | ||||||||||||||||||||||||||
| Total | 1,302 | 3,154 | 1,078 | 2,791 | ||||||||||||||||||||||||||||
(1) Volumes in mboe/d. See the "Abbreviations" section of this MD&A for definition. Volumes for Pipelines and Facilities divisions are revenue volumes, which are physical volumes plus volumes recognized from take-or-pay commitments. Volumes for Marketing & New Ventures are marketed crude and NGL volumes.
(2) Refer to the "Non-GAAP & Other Financial Measures" section of this MD&A.
Equity Accounted Investees Overview by Division
| 3 Months Ended September 30 | ||||||||||||||||||||||||||||||||
| 2024 | 2023 | |||||||||||||||||||||||||||||||
| ($ millions, except where noted) | Share of (loss) profit | Adjusted EBITDA(4) | Contributions | Distributions(5) | Volumes(6) | Share of profit (loss) | Adjusted EBITDA(4) | Contributions | Distributions(5) | Volumes(6) | ||||||||||||||||||||||
Pipelines(1) | (1) | 1 | — | — | — | 23 | 65 | — | 64 | 137 | ||||||||||||||||||||||
Facilities(2) | 34 | 173 | 124 | 133 | 360 | 68 | 168 | — | 118 | 368 | ||||||||||||||||||||||
Marketing & New Ventures(3) | (50) | (1) | — | — | — | (48) | 17 | 20 | 20 | 32 | ||||||||||||||||||||||
| Total | (17) | 173 | 124 | 133 | 360 | 43 | 250 | 20 | 202 | 537 | ||||||||||||||||||||||
| 9 Months Ended September 30 | ||||||||||||||||||||||||||||||||
| 2024 | 2023 | |||||||||||||||||||||||||||||||
| ($ millions, except where noted) | Share of profit (loss) | Adjusted EBITDA(4) | Contributions | Distributions(5) | Volumes(6) | Share of profit (loss) | Adjusted EBITDA(4) | Contributions | Distributions(5) | Volumes(6) | ||||||||||||||||||||||
Pipelines(1) | 42 | 88 | 5 | 80 | 49 | 78 | 205 | 1 | 200 | 139 | ||||||||||||||||||||||
Facilities(2) | 172 | 522 | 124 | 384 | 358 | 185 | 488 | 33 | 347 | 349 | ||||||||||||||||||||||
Marketing & New Ventures(3) | (19) | 39 | 242 | 31 | 12 | (41) | 37 | 35 | 45 | 33 | ||||||||||||||||||||||
| Total | 195 | 649 | 371 | 495 | 419 | 222 | 730 | 69 | 592 | 521 | ||||||||||||||||||||||
(1) Pipelines includes Alliance and Grand Valley. Pembina owned a 50 percent interest in Alliance up to the closing of the Alliance/Aux Sable Acquisition on April 1, 2024. Refer to the "About Pembina – Alliance/Aux Sable Acquisition" and "Abbreviations" sections of this MD&A for more information.
(2) Facilities includes PGI and Fort Corp.
(3) Marketing and New Ventures includes Aux Sable, CKPC (which was dissolved on December 31, 2023), Cedar LNG, and ACG. Pembina owned approximately a 42.7 percent ownership in Aux Sable's U.S operations and a 50 percent ownership in Aux Sable's Canadian operations up to the closing of the Alliance/Aux Sable Acquisition on April 1, 2024. Refer to the "About Pembina – Alliance/Aux Sable Acquisition" and "Abbreviations" sections of this MD&A for more information.
(4) Refer to the "Non-GAAP & Other Financial Measures" section of this MD&A.
(5) Distributions exclude returns of capital. During the second quarter of 2024, Pembina received $63 million from Cedar LNG as a return of capital (2023: $26 million from PGI as a return of capital).
(6) Volumes in mboe/d. See the "Abbreviations" section of this MD&A for definition.
In 2024, contributions in Marketing & New Ventures were made to Cedar LNG to fund the Cedar LNG Project. Refer to the "Segment Results – Marketing & New Ventures Division – Projects & New Developments" sections of this MD&A for additional information. Contributions in the Facilities Division in 2024 were made to PGI to partially fund growth capital projects and the previously announced acquisition of midstream assets.
Pembina Pipeline Corporation Third Quarter 2024 9
Pipelines
Financial Overview for the Three Months Ended September 30
Results of Operations
| ($ millions, except where noted) | 2024 | 2023 | Change | |||||||||||
Pipelines revenue(1) | 860 | 734 | 126 | |||||||||||
Cost of goods sold(1) | 9 | 6 | 3 | |||||||||||
Net revenue(1)(2) | 851 | 728 | 123 | |||||||||||
Operating expenses(1) | 244 | 192 | 52 | |||||||||||
| Depreciation and amortization included in operations | 151 | 104 | 47 | |||||||||||
| Share of (loss) profit from equity accounted investees | (1) | 23 | (24) | |||||||||||
| Gross profit | 455 | 455 | — | |||||||||||
| Earnings | 433 | 437 | (4) | |||||||||||
Adjusted EBITDA(2) | 593 | 591 | 2 | |||||||||||
Volumes(3) | 2,738 | 2,595 | 143 | |||||||||||
| Change in Results | ||||||||
Net revenue(1)(2) | Higher largely due to the Acquisition, in which Pembina acquired a controlling ownership interest in Alliance, combined with the reactivation of the Nipisi Pipeline in the fourth quarter of 2023. The third quarter of 2024 includes $199 million in net revenue related to Alliance as a wholly-owned entity. These increases were partially offset by lower net revenue of $40 million on the Cochin Pipeline due to lower tolls on new contracts ($21 million), which replaced long-term contracts that expired in mid-July 2024, lower volumes from a contracting gap from mid-July 2024 to August 1 associated with the return of line fill to certain customers, and lower interruptible demand during the quarter resulting from a narrower condensate price differential between western Canada and the U.S. Gulf Coast. Additionally, there was lower net revenue on the Peace Pipeline system due to earlier recognition of take-or-pay deferred revenue in the first half of 2024 ($15 million) and net loss allowance, which more than offset the increase from higher contracted volumes ($13 million), and lower operating recoveries largely related to lower power costs. | |||||||
Operating expenses(1) | Increase largely due to the Acquisition, combined with higher integrity spending. The third quarter of 2024 includes $52 million in operating expenses related to Alliance as a wholly-owned entity. These increases were partially offset by lower recoverable power costs due to the lower power pool price during the period. | |||||||
| Depreciation and amortization included in operations | Higher largely due to the Acquisition, combined with the reactivation of the Nipisi Pipeline, partially offset by fewer asset retirements compared to the third quarter of 2023. | |||||||
| Share of (loss) profit from equity accounted investees | Following the Acquisition on April 1, 2024, the results from Alliance are no longer accounted for in Share of Profit and are now being fully consolidated. The loss in the current period relates to Grand Valley. | |||||||
| Earnings | Consistent with prior period. The decrease is primarily due to lower net revenue and volumes on both the Cochin Pipeline and on the Peace Pipeline system. This was largely offset by the net impacts of the Acquisition, and the reactivation of the Nipisi Pipeline. | |||||||
Adjusted EBITDA(2) | Consistent with prior period. The increases due to higher adjusted EBITDA from Alliance due to higher demand on seasonal contracts, along with the net impacts of the Acquisition and the reactivation of the Nipisi Pipeline, were largely offset by lower net revenue on both the Cochin Pipeline and Peace Pipeline system, as discussed above. | |||||||
Volumes(3) | Higher largely due to the Acquisition, discussed above, combined with the reactivation of the Nipisi Pipeline, partially offset by lower volumes on the Cochin Pipeline resulting from a contracting gap from mid-July 2024 to August 1 associated with the return of line fill to certain customers, and lower interruptible demand during the quarter resulting from a narrower condensate price differential between western Canada and the U.S. Gulf Coast. The increase was also partially offset by lower volumes on the Drayton Valley Pipeline, and lower volumes on the Peace Pipeline system due to earlier recognition of take-or-pay deferred revenue in the first half of 2024, which more than offset the increase from higher contracted volumes. | |||||||
Change in Adjusted EBITDA ($ millions)(1)(2)

(1) Includes inter-segment transactions. See Note 4 to the Interim Financial Statements.
(2) Refer to the "Non-GAAP & Other Financial Measures" section of this MD&A.
(3) Revenue volumes in mboe/d. See the "Abbreviations" section of this MD&A for definition.
10 Pembina Pipeline Corporation Third Quarter 2024
Financial Overview for the Nine Months Ended September 30
Results of Operations
| ($ millions, except where noted) | 2024 | 2023 | Change | |||||||||||
Pipelines revenue(1) | 2,438 | 1,970 | 468 | |||||||||||
Cost of goods sold(1) | 35 | 6 | 29 | |||||||||||
Net revenue(1)(2) | 2,403 | 1,964 | 439 | |||||||||||
Operating expenses(1) | 601 | 524 | 77 | |||||||||||
| Depreciation and amortization included in operations | 410 | 304 | 106 | |||||||||||
| Share of profit from equity accounted investees | 42 | 78 | (36) | |||||||||||
| Gross profit | 1,434 | 1,214 | 220 | |||||||||||
| Earnings | 1,373 | 1,163 | 210 | |||||||||||
Adjusted EBITDA(2) | 1,847 | 1,617 | 230 | |||||||||||
Volumes(3) | 2,684 | 2,500 | 184 | |||||||||||
| Change in Results | ||||||||
Net revenue(1)(2) | Higher largely due to the Acquisition, in which Pembina acquired a controlling ownership interest in Alliance. The current period includes $395 million in net revenue related to Alliance as a wholly-owned entity. Also contributing to the increase in net revenue were contractual inflation adjustments on tolls, and higher volumes compared to 2023, which was impacted by the Northern Pipeline system outage and the wildfires. Additionally, there was higher net revenue on the Peace Pipeline system due to higher contracted volumes ($13 million), earlier recognition of take-or-pay deferred revenue ($13 million), and net loss allowance. The reactivation of the Nipisi Pipeline also contributed to the increase. These factors were partially offset by lower recoverable power costs and lower project cost recoveries. Additionally, there was lower net revenue on the Cochin Pipeline due to lower tolls on new contracts ($21 million), which replaced long-term contracts that expired in mid-July 2024, lower volumes from a contracting gap from mid-July 2024 to August 1 associated with the return of line fill to certain customers, and lower interruptible demand during the quarter resulting from a narrower condensate price differential between western Canada and the U.S. Gulf Coast. | |||||||
Operating expenses(1) | Increase largely due to the Acquisition, discussed above, and higher recoverable geotechnical costs primarily on the Peace Pipeline system. The current period includes $102 million in operating expenses related to Alliance as a wholly-owned entity. These increases are partially offset by lower recoverable power costs resulting from a lower power pool price, and lower costs as 2023 was impacted by the Northern Pipeline system outage. | |||||||
Depreciation and amortization included in operations | Higher largely due to the Acquisition, discussed above, combined with the reactivation of the Nipisi Pipeline. | |||||||
Share of profit from equity accounted investees | Following the Acquisition on April 1, 2024, the results from Alliance are no longer accounted for in Share of Profit and are now being fully consolidated. | |||||||
| Earnings | Higher largely due to the net impacts of the Acquisition, and no impacts in 2024 from the Northern Pipeline system outage and the wildfires, which affected 2023. Higher net revenue and volumes, primarily on the Peace Pipeline system, contractual inflation adjustments on tolls, and the reactivation of the Nipisi Pipeline, also contributed to the increase, partially offset by lower net revenue and volumes on the Cochin Pipeline. | |||||||
Adjusted EBITDA(2) | Increase largely due to higher adjusted EBITDA from Alliance driven by higher demand on seasonal contracts, along with the net impacts of the Acquisition. This is combined with higher net revenue and volumes on the Peace Pipeline system, contractual inflation adjustments on tolls, and the reactivation of the Nipisi Pipeline, partially offset by lower net revenue and volumes on the Cochin Pipeline. | |||||||
Volumes(3) | Higher largely due to the Acquisition, and higher volumes compared to 2023 which was impacted by the Northern Pipeline system outage and the wildfires, combined with the reactivation of the Nipisi Pipeline, and higher volumes on the Peace Pipeline system due to earlier recognition of take-or-pay deferred revenue and higher contracted volumes. The increase was partially offset by lower volumes on the Cochin Pipeline resulting from a contracting gap from mid-July 2024 to August 1 associated with the return of line fill to certain customers, and lower interruptible demand during the quarter resulting from a narrower condensate price differential between western Canada and the U.S. Gulf Coast. | |||||||
Change in Adjusted EBITDA ($ millions)(1)(2)

(1) Includes inter-segment transactions. See Note 4 to the Interim Financial Statements.
(2) Refer to the "Non-GAAP & Other Financial Measures" section of this MD&A.
(3) Revenue volumes in mboe/d. See the "Abbreviations" section of this MD&A for definition.
Pembina Pipeline Corporation Third Quarter 2024 11
Financial and Operational Overview
| 3 Months Ended September 30 | 9 Months Ended September 30 | |||||||||||||||||||||||||||||||||||||
| 2024 | 2023 | 2024 | 2023 | |||||||||||||||||||||||||||||||||||
| ($ millions, except where noted) | Volumes(1) | Earnings | Adjusted EBITDA(2) | Volumes(1) | Earnings | Adjusted EBITDA(2) | Volumes(1) | Earnings | Adjusted EBITDA(2) | Volumes(1) | Earnings | Adjusted EBITDA(2) | ||||||||||||||||||||||||||
Pipelines(3) | ||||||||||||||||||||||||||||||||||||||
| Conventional | 992 | 266 | 320 | 1,034 | 304 | 358 | 990 | 831 | 1,000 | 939 | 774 | 926 | ||||||||||||||||||||||||||
| Transmission | 713 | 136 | 208 | 582 | 107 | 176 | 675 | 432 | 641 | 585 | 304 | 513 | ||||||||||||||||||||||||||
| Oil Sands & Heavy Oil | 1,033 | 33 | 67 | 979 | 28 | 59 | 1,019 | 113 | 209 | 976 | 90 | 183 | ||||||||||||||||||||||||||
| General & administrative | — | (2) | (2) | — | (2) | (2) | — | (3) | (3) | — | (5) | (5) | ||||||||||||||||||||||||||
| Total | 2,738 | 433 | 593 | 2,595 | 437 | 591 | 2,684 | 1,373 | 1,847 | 2,500 | 1,163 | 1,617 | ||||||||||||||||||||||||||
(1) Revenue volumes in mboe/d. See the "Abbreviations" section of this MD&A for definition.
(2) Refer to the "Non-GAAP & Other Financial Measures" section of this MD&A.
(3) Includes values attributed to Pembina's conventional, transmission and oil sands and heavy oil assets within the Pipelines Division. Refer to Pembina's AIF for the year ended December 31, 2023.
Projects & New Developments(1)
Pipelines continues to focus on the execution of various system expansions. The projects in the following table were recently placed into service.
| Significant Projects | In-service Date | ||||
Phase VIII Peace Pipeline Expansion | May 2024 | ||||
The following outlines the projects and new developments within Pipelines:
| NEBC MPS Expansion | ||||||||
Capital Budget: $90 million | In-service Date: Fourth quarter of 2024 | Status: On time, trending under budget | ||||||
The NEBC MPS Expansion includes a new mid-point pump station, terminal upgrades, and additional storage, which will support approximately 40,000 bpd of incremental capacity on the NEBC Pipeline system. This additional capacity is expected to fulfill customer demand resulting from growing production volumes from NEBC and the previously announced long-term midstream service agreements with three premier NEBC Montney producers. Terminal upgrades and additional storage were completed in October. The mid-point pump station is expected to be completed before the end of 2024. | ||||||||
(1) For further details on Pembina's significant assets, including definitions for capitalized terms used herein that are not otherwise defined, refer to Pembina's AIF for the year ended December 31, 2023 filed at www.sedarplus.ca (filed with the U.S. Securities and Exchange Commission at www.sec.gov under Form 40-F) and on Pembina's website at www.pembina.com.
12 Pembina Pipeline Corporation Third Quarter 2024
Facilities
Financial Overview for the Three Months Ended September 30
Results of Operations
| ($ millions, except where noted) | 2024 | 2023 | Change | |||||||||||
Facilities revenue(1) | 282 | 233 | 49 | |||||||||||
Operating expenses(1) | 123 | 95 | 28 | |||||||||||
Depreciation and amortization included in operations | 50 | 38 | 12 | |||||||||||
Share of profit from equity accounted investees | 34 | 68 | (34) | |||||||||||
| Gross profit | 143 | 168 | (25) | |||||||||||
| Earnings | 131 | 179 | (48) | |||||||||||
Adjusted EBITDA(2) | 324 | 319 | 5 | |||||||||||
Volumes(3) | 810 | 803 | 7 | |||||||||||
| Changes in Results | ||||||||
Revenue(1) | Increase largely due to Pembina acquiring a controlling ownership interest in Aux Sable, pursuant to the Alliance/Aux Sable Acquisition on April 1, 2024. The third quarter of 2024 includes $68 million in revenue related to Aux Sable as a wholly-owned entity. The increase in net revenue was partially offset by lower recoverable power costs. | |||||||
Operating expenses(1) | Increase largely due to the Acquisition, discussed above, partially offset by lower recoverable power costs. The third quarter of 2024 includes $42 million in operating expenses related to Aux Sable as a wholly-owned entity. | |||||||
| Depreciation and amortization included in operations | Higher largely due to the Acquisition, discussed above. | |||||||
Share of profit from equity accounted investees | Decrease due to unrealized losses recognized by PGI on interest rate derivative financial instruments compared to gains in the third quarter of 2023, partially offset by lower income tax expense. Lower recoverable power costs resulted in both lower net revenue and lower operating expenses in PGI, thus having no net impact on the change in earnings. | |||||||
| Earnings | Decrease largely due to lower Share of Profit from PGI, discussed above, partially offset by the net impacts of the Acquisition, and lower other income as the third quarter of 2023 included a $16 million gain resulting from the recognition of a finance lease upon contract renewal of an asset. | |||||||
Adjusted EBITDA(2) | Consistent with prior period. The increase largely due to the net impacts of the Acquisition was partially offset by lower other income as the third quarter of 2023 included a gain on the recognition of a finance lease, discussed above. Included in adjusted EBITDA is $170 million (2023: $165 million) related to PGI. | |||||||
Volumes(3) | Consistent with prior period. Higher volumes due to the volumes now being recognized at Aux Sable following the Acquisition, were largely offset by lower volumes at the Redwater Complex and at Younger due to a planned outage and a rail strike impacting the Redwater Complex, resulting in volume curtailments. Additionally, lower volumes due to earlier recognition of take-or-pay deferred revenue in the first half of 2024 more than offset higher interruptible volumes on certain PGI assets. Volumes include 360 mboe/d (2023: 368 mboe/d) related to PGI. | |||||||
Change in Adjusted EBITDA ($ millions)(1)(2)

(1) Includes inter-segment transactions. See Note 4 to the Interim Financial Statements.
(2) Refer to the "Non-GAAP & Other Financial Measures" section of this MD&A.
(3) Revenue volumes in mboe/d. See the "Abbreviations" section of this MD&A for definition.
Pembina Pipeline Corporation Third Quarter 2024 13
Financial Overview for the Nine Months Ended September 30
Results of Operations
($ millions, except where noted) | 2024 | 2023 | Change | |||||||||||
Facilities revenue(1) | 807 | 661 | 146 | |||||||||||
Operating expenses(1) | 336 | 265 | 71 | |||||||||||
Depreciation and amortization included in operations | 128 | 113 | 15 | |||||||||||
Share of profit from equity accounted investees | 172 | 185 | (13) | |||||||||||
| Gross profit | 515 | 468 | 47 | |||||||||||
| Earnings | 489 | 467 | 22 | |||||||||||
Adjusted EBITDA(2) | 974 | 889 | 85 | |||||||||||
Volumes(3) | 823 | 757 | 66 | |||||||||||
| Changes in Results | ||||||||
Revenue(1)(2) | Increase largely due to Pembina acquiring a controlling ownership interest in Aux Sable, pursuant to the Alliance/Aux Sable Acquisition on April 1, 2024. The current period includes $141 million in revenue related to Aux Sable as a wholly-owned entity. Higher net revenue at Younger and higher terminalling revenue at the Redwater Complex also contributed to the increase in revenue, as 2023 was impacted by the Northern Pipeline system outage. These increases were partially offset by lower recoverable power costs. | |||||||
Operating expenses(1) | Increase largely due to the Acquisition, discussed above, partially offset by lower recoverable power costs. The current period includes $86 million in operating expenses related to Aux Sable as a wholly-owned entity. | |||||||
| Depreciation and amortization included in operations | Higher largely due to the Acquisition, discussed above. | |||||||
Share of profit from equity accounted investees | Decrease due to unrealized losses recognized by PGI on interest rate derivative financial instruments compared to gains in 2023, partially offset by higher contributions from certain PGI assets, primarily due to higher interruptible volumes. | |||||||
| Earnings | Increase largely due to the net impacts of the Acquisition. Additionally, higher revenue at Younger and higher terminalling revenue at the Redwater Complex also contributed to higher earnings, as 2023 was impacted by the Northern Pipeline system outage. The increase was partially offset by lower other income as the third quarter of 2023 included a $16 million gain resulting from the recognition of a finance lease upon contract renewal of an asset, and lower Share of Profit from PGI, discussed above. | |||||||
Adjusted EBITDA(2) | Increase largely due to the net impacts of the Acquisition, higher adjusted EBITDA from PGI, largely due to higher interruptible volumes, combined with higher revenue at Younger and higher terminalling revenue at the Redwater Complex as 2023 was impacted by the Northern Pipeline system outage. These increases were partially offset by lower other income as the third quarter of 2023 included a gain on the recognition of a finance lease. Included in adjusted EBITDA is $516 million (2023: $478 million) related to PGI. | |||||||
Volumes(3) | Increase primarily due to the volumes now being recognized at Aux Sable following the Acquisition, and higher volumes at Younger and the Redwater Complex as 2023 was impacted by the Northern Pipeline system outage, combined with higher interruptible volumes on certain PGI assets. These increases were partially offset by lower volumes largely due to a planned outage and a rail strike at the Redwater Complex, resulting in volume curtailments. Volumes include 358 mboe/d (2023: 349 mboe/d) related to PGI. | |||||||
Change in Adjusted EBITDA ($ millions)(1)(2)

(1) Includes inter-segment transactions. See Note 4 to the Interim Financial Statements.
(2) Refer to the "Non-GAAP & Other Financial Measures" section of this MD&A.
(3) Revenue volumes in mboe/d. See the "Abbreviations" section of this MD&A for definition.
14 Pembina Pipeline Corporation Third Quarter 2024
Financial and Operational Overview
| 3 Months Ended September 30 | 9 Months Ended September 30 | |||||||||||||||||||||||||||||||||||||
| 2024 | 2023 | 2024 | 2023 | |||||||||||||||||||||||||||||||||||
| ($ millions, except where noted) | Volumes(1) | Earnings | Adjusted EBITDA(2) | Volumes(1) | Earnings | Adjusted EBITDA(2) | Volumes(1) | Earnings | Adjusted EBITDA(2) | Volumes(1) | Earnings | Adjusted EBITDA(2) | ||||||||||||||||||||||||||
Facilities(3) | ||||||||||||||||||||||||||||||||||||||
| Gas Services | 584 | 47 | 194 | 605 | 85 | 192 | 598 | 223 | 596 | 577 | 228 | 552 | ||||||||||||||||||||||||||
| NGL Services | 226 | 84 | 130 | 198 | 94 | 127 | 225 | 267 | 379 | 180 | 240 | 338 | ||||||||||||||||||||||||||
| General & administrative | — | — | — | — | — | — | — | (1) | (1) | — | (1) | (1) | ||||||||||||||||||||||||||
| Total | 810 | 131 | 324 | 803 | 179 | 319 | 823 | 489 | 974 | 757 | 467 | 889 | ||||||||||||||||||||||||||
(1) Revenue volumes in mboe/d. See the "Abbreviations" section of this MD&A for definition.
(2) Refer to the "Non-GAAP & Other Financial Measures" section of this MD&A.
(3) Includes values attributed to Pembina's gas services and NGL services assets within the Facilities operating segment. For a description of Pembina's gas and NGL assets, refer to Pembina's AIF for the year ended December 31, 2023.
Projects & New Developments(1)
Facilities continues to build-out its natural gas and NGL processing and fractionation assets to service customer demand. The following outlines the projects and new developments within Facilities:
| RFS IV | ||||||||
Capital Budget: $525 million | In-service Date(2): First half of 2026 | Status: On time, on updated budget | ||||||
RFS IV is a 55,000 bpd propane-plus fractionator at the existing Redwater fractionation and storage complex (the "Redwater Complex"). The project includes additional rail loading capacity and will leverage the design, engineering, and operating best practices of the existing facilities at the Redwater Complex. With the addition of RFS IV, the fractionation capacity at the Redwater Complex will total 256,000 bpd. As previously announced, the estimated project cost has been revised to $525 million (previously $460 million), reflecting project scope changes as well as higher equipment, material and labour costs in light of growing Alberta construction activity. Pembina has entered into a lump-sum engineering, procurement and construction agreement, for more than 70 percent of the project cost. Site clearing activities have been completed, engineering and procurement activities and site construction continued in the third quarter of 2024. | ||||||||
| Wapiti Expansion | ||||||||
Capital Budget: $140 million (net to Pembina) | In-service Date(2): First half of 2026 | Status: Recently sanctioned | ||||||
PGI is developing an expansion that will increase natural gas processing capacity at the Wapiti Plant by 115 mmcf/d (gross to PGI). The expansion opportunity is driven by strong customer demand supported by growing Montney production and is fully underpinned by long-term, take-or-pay contracts. The project includes a new sales gas pipeline and other related infrastructure. | ||||||||
| K3 Cogeneration Facility | ||||||||
Capital Budget: $70 million (net to Pembina) | In-service Date(2): First half of 2026 | Status: On time, on budget | ||||||
PGI is developing a 28 MW cogeneration facility at its K3 Plant, which is expected to reduce overall operating costs by providing power and heat to the gas processing facility, while reducing customers' exposure to power prices. The K3 Cogeneration Facility is expected to fully supply the K3 Plant's power requirements, with excess power sold to the grid at market rates. Further, through the utilization of the cogeneration waste heat and the low-emission power generated, the project is expected to contribute to a reduction in annual emissions compliance costs at the K3 Plant. | ||||||||
(1) For further details on Pembina's significant assets, including definitions for capitalized terms used herein that are not otherwise defined, refer to Pembina's AIF for the year ended December 31, 2023 filed at www.sedarplus.ca (filed with the U.S. Securities and Exchange Commission at www.sec.gov under Form 40-F) and on Pembina's website at www.pembina.com.
(2) Subject to environmental and regulatory approvals. See the "Forward-Looking Statements & Information" section of this MD&A.
Pembina Pipeline Corporation Third Quarter 2024 15
Marketing & New Ventures
Financial Overview for the Three Months Ended September 30
Results of Operations
| ($ millions, except where noted) | 2024 | 2023 | Change | |||||||||||
Marketing revenue(1)(2) | 938 | 675 | 263 | |||||||||||
Cost of goods sold(1)(2) | 732 | 594 | 138 | |||||||||||
Net revenue(1)(2)(3) | 206 | 81 | 125 | |||||||||||
Operating expenses(2) | 5 | 3 | 2 | |||||||||||
| Depreciation and amortization included in operations | 15 | 11 | 4 | |||||||||||
| Share of (loss) profit from equity accounted investees | (50) | (48) | (2) | |||||||||||
| Gross profit | 136 | 19 | 117 | |||||||||||
| Earnings | 125 | (4) | 129 | |||||||||||
Adjusted EBITDA(3) | 159 | 159 | — | |||||||||||
Crude oil sales volumes(4) | 117 | 89 | 28 | |||||||||||
NGL sales volumes(4) | 227 | 166 | 61 | |||||||||||
| Change in Results | ||||||||
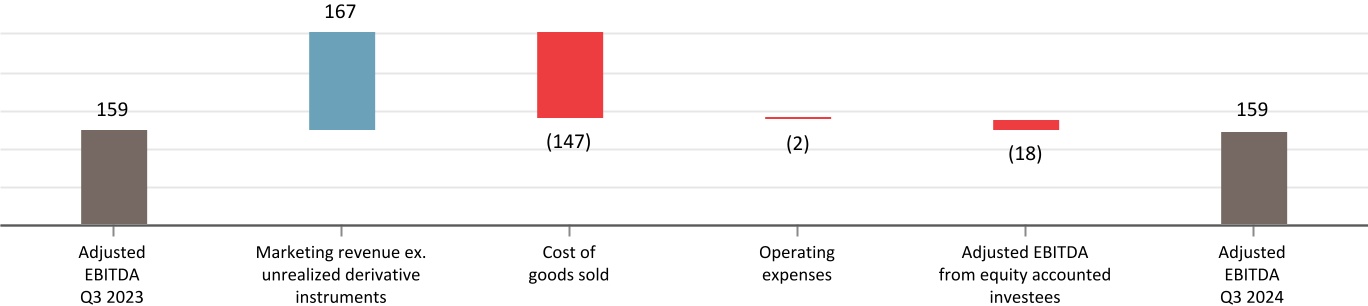
Net revenue(1)(2)(3) | Higher revenue from risk management and physical derivative contracts was largely due to unrealized gains on NGL-based derivatives and crude oil-based derivatives compared to losses in the third quarter of 2023, primarily due to changes in pricing. These increases were partially offset by larger unrealized losses on renewable power purchase agreements due to a decline in forward power prices, larger realized losses on NGL-based derivatives, and lower realized gains on crude oil-based derivatives compared to the third quarter of 2023. The third quarter of 2024 includes unrealized gains on commodity-related derivatives of $18 million (2023: $78 million loss) and realized gains on commodity-related derivatives of $70 million (2023: $91 million gain). Higher NGL net revenue from contracts with customers was largely due to higher NGL margins and the Acquisition, in which Pembina acquired a controlling ownership interest in Aux Sable. A cost recovery related to a storage insurance settlement also contributed to higher net revenue. These increases were partially offset by a nine-day unplanned outage at Aux Sable in July 2024 ($13 million). The third quarter of 2024 includes $47 million in net revenue related to Aux Sable as a wholly-owned entity. Net revenue from crude oil sales was largely consistent with prior period as higher volumes were partially offset by lower prices. | |||||||
| Share of (loss) profit from equity accounted investees | The current period loss is due to unrealized losses on interest rate derivative financial instruments recognized by Cedar LNG which were entered into in the third quarter of 2024, while the loss in the third quarter of 2023 largely relates to provisions recognized by Aux Sable. Following the Acquisition on April 1, 2024, the results from Aux Sable are no longer accounted for in Share of Profit and are now being fully consolidated. | |||||||
| Earnings | Increase largely due to higher revenue from risk management and physical derivative contracts, and higher net revenue from contracts with customers, discussed above. | |||||||
Adjusted EBITDA(3) | Consistent with prior period. Higher NGL margins and the impacts of the Acquisition were largely offset by lower realized gains on commodity-related derivatives, discussed above, and the nine-day unplanned outage at Aux Sable in July 2024. | |||||||
Crude oil sales volumes(4) | Increase largely due to higher condensate blending opportunities due to favorable price differentials in the third quarter of 2024 compared to the third quarter of 2023. | |||||||
NGL sales volumes(4) | Increase primarily due to higher ethane, propane, and butane sales largely due to the increase in Pembina's ownership interest in Aux Sable. | |||||||
Change in Adjusted EBITDA ($ millions)(1)(2)(3)
(1) Comparative 2023 period has been adjusted. See "Accounting Policies & Estimates – Change in Accounting Policies" and Note 2 to the Interim Financial Statements.
(2) Includes inter-segment transactions. See Note 4 to the Interim Financial Statements.
(3) Refer to the "Non-GAAP & Other Financial Measures" section of this MD&A.
(4) Marketed crude and NGL volumes in mboe/d. See the "Abbreviations" section of this MD&A for definition.
16 Pembina Pipeline Corporation Third Quarter 2024
Financial Overview for the Nine Months Ended September 30
Results of Operations
| ($ millions, except where noted) | 2024 | 2023 | Change | |||||||||||
Marketing revenue(1)(2) | 2,663 | 2,263 | 400 | |||||||||||
Cost of goods sold(1)(2) | 2,279 | 1,915 | 364 | |||||||||||
Net revenue(1)(2)(3) | 384 | 348 | 36 | |||||||||||
Operating expenses(2) | 13 | 3 | 10 | |||||||||||
| Depreciation and amortization included in operations | 47 | 34 | 13 | |||||||||||
| Share of (loss) profit from equity accounted investees | (19) | (41) | 22 | |||||||||||
| Gross profit | 305 | 270 | 35 | |||||||||||
| Earnings | 324 | 231 | 93 | |||||||||||
Adjusted EBITDA(3) | 490 | 424 | 66 | |||||||||||
Crude oil sales volumes(4) | 99 | 87 | 12 | |||||||||||
NGL sales volumes(4) | 220 | 174 | 46 | |||||||||||
| Change in Results | ||||||||
Net revenue(1)(2)(3) | Higher net NGL revenue from contracts with customers was largely due to higher NGL margins and the Acquisition, in which Pembina acquired a controlling ownership interest in Aux Sable. A cost recovery related to a storage insurance settlement also contributed to higher net revenue. These increases were partially offset by a nine-day unplanned outage at Aux Sable in July 2024 ($13 million). The current period includes $90 million in net revenue related to Aux Sable as a wholly-owned entity. Higher marketed NGL and crude oil volumes also contributed to the increase. Higher revenue from contracts with customers was partially offset by lower revenue from risk management and physical derivative contracts, primarily due to larger unrealized losses on renewable power purchase agreements due to a decline in forward power prices, and realized losses on NGL-based derivatives in 2024 compared to gains in 2023. These results were partially offset by unrealized gains on NGL-based derivatives in 2024 compared to losses in 2023, and larger gains on crude oil-based derivatives compared to 2023. The current period includes unrealized losses on commodity-related derivatives of $129 million (2023: $78 million loss) and realized gains on commodity-related derivatives of $189 million (2023: $249 million gain). | |||||||
| Share of (loss) profit from equity accounted investees | The current period loss is due to unrealized losses on interest rate derivative financial instruments recognized by Cedar LNG which were entered into in the third quarter of 2024, partially offset by strong results from Aux Sable in the first quarter of 2024 being included in Share of Profit. Following the Acquisition on April 1, 2024, the results from Aux Sable are no longer accounted for in Share of Profit and are now being fully consolidated. The loss in 2023 largely relates to provisions recognized by Aux Sable. | |||||||
| Depreciation and amortization included in operations | Increase largely due to a change in the expected useful life of certain intangible assets. | |||||||
| Earnings | Increase largely due to higher net revenue, discussed above, and gains associated with the derecognition of the provision related to financial assurances provided by Pembina which were assumed by Cedar LNG following the positive FID in June 2024, as well as lower share of loss from equity accounted investees, partially offset by higher depreciation and general & administrative expenses. | |||||||
Adjusted EBITDA(3) | Increase largely due to higher NGL margins and the impacts of the Acquisition, partially offset by lower realized gains on commodity-related derivatives, discussed above, the nine-day unplanned outage at Aux Sable in July 2024, and higher general & administrative expenses. | |||||||
Crude oil sales volumes(4) | Increase largely due to higher condensate blending opportunities due to favorable price differentials in 2024 compared to the same period in 2023. | |||||||
NGL sales volumes(4) | Increase primarily due to higher ethane, propane, and butane sales largely due to the increase in Pembina's ownership interest in Aux Sable, and the impact of lower supply volumes from the Redwater Complex in 2023 due to the impacts of the Northern Pipeline system outage. | |||||||
Change in Adjusted EBITDA ($ millions)(1)(2)(3)

(1) Comparative 2023 period has been adjusted. See "Accounting Policies & Estimates – Change in Accounting Policies" and Note 2 to the Interim Financial Statements.
(2) Includes inter-segment transactions. See Note 4 to the Interim Financial Statements.
(3) Refer to the "Non-GAAP & Other Financial Measures" section of this MD&A.
(4) Marketed crude and NGL volumes in mboe/d. See the "Abbreviations" section of this MD&A for definition.
Pembina Pipeline Corporation Third Quarter 2024 17
Financial and Operational Overview
| 3 Months Ended September 30 | 9 Months Ended September 30 | |||||||||||||||||||||||||||||||||||||
| 2024 | 2023 | 2024 | 2023 | |||||||||||||||||||||||||||||||||||
| ($ millions, except where noted) | Volumes(1) | Earnings (loss) | Adjusted EBITDA(2) | Volumes(1) | Earnings (loss) | Adjusted EBITDA(2) | Volumes(1) | Earnings (loss) | Adjusted EBITDA(2) | Volumes(1) | Earnings (loss) | Adjusted EBITDA(2) | ||||||||||||||||||||||||||
Marketing & New Ventures(3) | ||||||||||||||||||||||||||||||||||||||
| Marketing | 344 | 178 | 163 | 166 | 5 | 168 | 220 | 336 | 494 | 174 | 259 | 451 | ||||||||||||||||||||||||||
New Ventures(4) | — | (53) | (4) | — | (9) | (9) | — | (12) | (4) | — | (28) | (27) | ||||||||||||||||||||||||||
| Total | 344 | 125 | 159 | 166 | (4) | 159 | 220 | 324 | 490 | 174 | 231 | 424 | ||||||||||||||||||||||||||
(1) Marketed crude and NGL volumes in mboe/d. See the "Abbreviations" section of this MD&A for definition.
(2) Refer to the "Non-GAAP & Other Financial Measures" section of this MD&A.
(3) Includes values attributed to Pembina's marketing activities and new ventures projects within the Marketing & New Ventures operating segment. For further details on Pembina's marketing activities and projects, refer to Pembina's AIF for the year ended December 31, 2023.
(4) All New Ventures projects have not yet commenced operations and therefore have no volumes.
Projects & New Developments(1)
The New Ventures group is responsible for the development of new large-scale, or value chain extending projects, including those that provide enhanced access to global markets and support a transition to a lower-carbon economy. Currently, Pembina is pursuing opportunities associated with LNG, low-carbon commodities, and large-scale GHG emissions reductions.
Cedar LNG
Pembina and its partner, the Haisla Nation, in June 2024 announced a positive FID in respect of the Cedar LNG Project, a 3.3 million tonne per annum ("mtpa") floating liquefied natural gas ("LNG") facility in Kitimat, British Columbia, within the traditional territory of the Haisla Nation. The Cedar LNG Project will provide a valuable outlet for WCSB natural gas to access global markets and is expected to achieve higher prices for Canadian producers and enhance global energy security. Given it will be a floating LNG facility, manufactured in the controlled conditions of a shipyard, it is expected that the Cedar LNG Project will have lower construction and execution risk. Further, powered by BC Hydro, the Cedar LNG Project is expected to be one of the lowest emissions LNG facilities in the world.
Cedar LNG has secured a 20-year take-or-pay, fixed toll contract with ARC Resources Ltd. for 1.5 mtpa of LNG. As part of the agreement, ARC Resources Ltd. will supply Cedar LNG approximately 200 million cubic feet per day of natural gas via the Coastal GasLink pipeline from its production base in the Montney. Pembina has also entered into an identical bridging agreement with Cedar LNG for 1.5 mtpa of capacity. The process to assign Pembina's capacity in Cedar LNG to a third party is ongoing and expected to extend into 2025.
The Cedar LNG Project has an estimated cost of approximately U.S. $3.4 billion (gross), including U.S. $2.3 billion (gross), or approximately 70 percent, for the floating LNG production unit, which is being constructed under a fixed-price, lump-sum agreement with Samsung Heavy Industries and Black & Veatch, U.S. $1.1 billion (gross) related to onshore infrastructure, owner's costs, commissioning and start-up costs, financial assurances during construction, and other costs. The total Cedar LNG Project cost, including approximately U.S. $0.6 billion (gross) of interest during construction and transaction costs, is expected to be approximately U.S. $4.0 billion (gross). The anticipated in-service date of the Cedar LNG Project is in late 2028. Site clearing and civil works on the marine terminal site commenced in the third quarter of 2024 and construction of the floating LNG facility is expected to begin in mid-2025.
18 Pembina Pipeline Corporation Third Quarter 2024
Alberta Carbon Grid
Pembina and TC Energy Corporation ("TC Energy") have formed a partnership to develop the Alberta Carbon Grid ("ACG"), a carbon transportation and sequestration platform that is intended to enable Alberta-based industries located in and around the Alberta Industrial Heartland to effectively manage their GHG emissions, contribute positively to Alberta's lower-carbon economy, and create sustainable long-term value for Pembina and TC Energy stakeholders. ACG is developing the Industrial Heartland project, which will have the potential to transport and store up to ten million tonnes of carbon dioxide annually. ACG completed the appraisal well drilling, logging and testing in December 2023. Well data has been incorporated into a detailed subsurface model, which is predicting sequestration capability in excess of original expectations. ACG continues commercial conversations with potential customers and refining the project scope.
(1) For further details on Pembina's significant assets, including definitions for capitalized terms used herein that are not otherwise defined, refer to Pembina's AIF for the year ended December 31, 2023 filed at www.sedarplus.ca (filed with the U.S. Securities and Exchange Commission at www.sec.gov under Form 40-F) and on Pembina's website at www.pembina.com.
Pembina Pipeline Corporation Third Quarter 2024 19
Corporate and Income Tax
Financial Overview for the Three Months Ended September 30
Results of Operations
| ($ millions) | 2024 | 2023 | Change | |||||||||||
Revenue(1) | 11 | 13 | (2) | |||||||||||
| General and administrative | 84 | 77 | 7 | |||||||||||
| Other expense | 5 | — | 5 | |||||||||||
| Net finance costs | 139 | 110 | 29 | |||||||||||
| Earnings (loss) | (215) | (170) | (45) | |||||||||||
Adjusted EBITDA(2) | (57) | (48) | (9) | |||||||||||
| Income tax expense | 89 | 96 | (7) | |||||||||||
| Change in Results | ||||||||
Revenue(1) | Consistent with prior period. Relates primarily to fixed fee income related to shared service agreements with PGI. | |||||||
| General and administrative | Consistent with prior period. Higher long-term incentive costs driven by Pembina's performance relative to peers in the third quarter of 2024 compared to the third quarter of 2023, and the change in Pembina's share price, were largely offset by lower consulting fees. | |||||||
| Net finance costs | Increase largely due to higher interest expense on long-term debt due to a combination of higher debt levels following the Acquisition, and higher interest rates, partially offset by higher interest income. | |||||||
| Earnings (loss) | Decrease largely due to higher net finance costs and long-term incentive costs, partially offset by lower consulting fees. | |||||||
Adjusted EBITDA(2) | Consistent with prior period. | |||||||
Financial Overview for the Nine Months Ended September 30
Results of Operations
| ($ millions) | 2024 | 2023 | Change | |||||||||||
Revenue(1) | 34 | 35 | (1) | |||||||||||
General and administrative | 238 | 211 | 27 | |||||||||||
| Other expense | 27 | — | 27 | |||||||||||
| Loss on Alliance/Aux Sable Acquisition | 616 | — | 616 | |||||||||||
| Net finance costs | 367 | 314 | 53 | |||||||||||
| Earnings (loss) | (1,210) | (487) | (723) | |||||||||||
Adjusted EBITDA(2) | (157) | (139) | (18) | |||||||||||
| Income tax (recovery) expense | (326) | 296 | (622) | |||||||||||
| Change in Results | ||||||||
Revenue(1) | Consistent with prior period. Relates primarily to fixed fee income related to shared service agreements with PGI. | |||||||
| General and administrative | Increase largely due to higher long-term incentive costs driven by the change in Pembina's share price and Pembina's performance relative to peers in 2024 compared to the same period in 2023, higher salaries and wages, and higher information technology-related maintenance costs, partially offset by lower consulting fees. | |||||||
| Other expense | Increase largely due to higher acquisition fees and integration costs related to the Alliance/Aux Sable Acquisition. | |||||||
| Loss on Alliance/Aux Sable Acquisition | $616 million loss recognized from the deemed disposition of Pembina's previous investments in the Acquirees following the Acquisition, offset by a $626 million deferred tax recovery recognized from the Acquisition, resulting in a net gain of $10 million. Refer to Note 2 and Note 3 to the Interim Financial Statements for further details. | |||||||
| Net finance costs | Increase largely due to higher interest expense on long-term debt due to a combination of higher debt levels following the Acquisition, and higher interest rates, partially offset by higher interest income. | |||||||
| Earnings (loss) | Decrease largely due to the loss recognized on the Acquisition, higher net finance costs, higher acquisition fees and integration costs related to the Acquisition, and higher general & administrative costs. | |||||||
Adjusted EBITDA(2) | Decrease largely due to higher general & administrative costs, discussed above. | |||||||
| Income tax (recovery) expense | The income tax recovery in 2024 is largely due to a deferred tax recovery recognized in connection with the Acquisition, combined with an adjustment in the tax basis of an investment in partnership, partially offset by higher earnings, which resulted in a 33 percent effective tax recovery rate in 2024, compared to an effective tax rate of 22 percent in 2023. Refer to Note 3 to the Interim Financial Statements for further details. | |||||||
(1) Excludes inter-segment eliminations.
(2) Refer to the "Non-GAAP & Other Financial Measures" section of this MD&A.
20 Pembina Pipeline Corporation Third Quarter 2024
4. LIQUIDITY & CAPITAL RESOURCES
Available Sources of Liquidity
($ millions) | September 30, 2024 | December 31, 2023 | ||||||
Working capital(1) | (813) | (588) | ||||||
Variable rate debt | ||||||||
Senior unsecured credit facilities(2) | 1,066 | 778 | ||||||
| Interest rate swapped debt | (337) | (31) | ||||||
Total variable rate loans and borrowings outstanding (weighted average interest rate of 6.1% (2023: 6.3%)) | 729 | 747 | ||||||
Fixed rate debt | ||||||||
| Senior unsecured medium-term notes | 11,050 | 9,100 | ||||||
| Interest rate swapped debt | 337 | 31 | ||||||
Total fixed rate loans and borrowings outstanding (weighted average interest rate of 4.4% (2023: 4.0%)) | 11,387 | 9,131 | ||||||
| Total loans and borrowings outstanding | 12,116 | 9,878 | ||||||
| Cash and unutilized debt facilities | 2,651 | 2,240 | ||||||
Subordinated hybrid notes (weighted average interest rate of 4.8% (2023: 4.8%)) | 600 | 600 | ||||||
(1) Current assets of $1.5 billion (December 31, 2023: $2.6 billion) less current liabilities of $2.3 billion (December 31, 2023: $3.2 billion). As at September 30, 2024, working capital included $946 million (December 31, 2023: $650 million) associated with the current portion of long-term debt.
(2) Includes U.S. $250 million variable rate debt outstanding at September 30, 2024 (December 31, 2023: U.S. $250 million), with the full notional amount hedged using an interest rate swap at 1.47 percent.
Pembina currently anticipates that its cash flow from operating activities, the majority of which is derived from fee-based contracts, will be more than sufficient to meet its operating obligations, to fund its dividends and to fund its capital expenditures in the short term and long term. Pembina expects to source funds required for debt maturities from cash, its credit facilities and by accessing the capital markets, as required. Based on its successful access to financing in the capital markets over the past several years, Pembina expects to continue to have access to additional funds as required. Refer to "Risk Factors – General Risk Factors – Additional Financing and Capital Resources" in Pembina's MD&A for the year ended December 31, 2023 and Note 23 to the Consolidated Financial Statements for more information. Management continues to monitor Pembina's liquidity and remains satisfied that the leverage employed in Pembina's capital structure is sufficient and appropriate given the characteristics and operations of the underlying asset base.
Management may adjust Pembina's capital structure as a result of changes in economic conditions or the risk characteristics of the underlying assets. To maintain or modify Pembina's capital structure in the future, Pembina may renegotiate debt terms, repay existing debt, seek new borrowings, issue additional equity or hybrid securities and/or repurchase or redeem additional common or preferred shares.
As at September 30, 2024, Pembina's credit facilities consisted of: an unsecured $1.5 billion (December 31, 2023: $1.5 billion) revolving credit facility, which includes a $750 million (December 31, 2023: $750 million) accordion feature, which provides Pembina with the ability to increase the credit facility subject to lender approval, and matures in June 2029 (the "Revolving Facility"); an unsecured $1.0 billion (December 31, 2023: $1.0 billion) sustainability linked revolving credit facility, which matures in June 2027 (the "SLL Credit Facility"); an unsecured U.S. $250 million (December 31, 2023: U.S. $250 million) non-revolving term loan, which matures in May 2025; and an operating facility of $50 million (December 31, 2023: $50 million), which matures in June 2025 and is typically renewed on an annual basis (collectively, the "Credit Facilities").
There are no mandatory principal repayments due over the term of the Credit Facilities. Pembina is required to meet certain specific and customary affirmative and negative financial covenants under the indenture governing its medium-term notes and the agreements governing its Credit Facilities, including a requirement to maintain certain financial ratios. See "Liquidity & Capital Resources – Covenants" below for more information.
Pembina Pipeline Corporation Third Quarter 2024 21
The SLL Credit Facility contains pricing adjustments that reduce or increase borrowing costs based on Pembina's performance relative to a GHG emissions intensity reduction performance target. Previously, Pembina announced its commitment to reduce its GHG emissions intensity by 30 percent by 2030, relative to baseline 2019 levels. The specific terms of the SLL Credit Facility include annual intermediate targets that align with Pembina's trajectory towards its 2030 target.
Pembina is also subject to customary restrictions on its operations and activities under the indenture governing its medium-term notes and the agreements governing its Credit Facilities, including restrictions on the granting of security, incurring indebtedness and the sale of its assets.
With the exception of the sustainability-linked adjustments to borrowing costs, the terms and conditions of the SLL Credit Facility and the Revolving Facility, including financial covenants, are substantially similar to each other.
Following the Alliance/Aux Sable Acquisition, Pembina assumed Alliance's unsecured credit facilities, including a $315 million term loan, a U.S. $250 million term loan, and two multi-use operating/revolving facilities of $30 million and U.S. $30 million, all of which primarily mature in December 2025. Additionally, Pembina assumed Aux Sable's unsecured credit facilities including a U.S. $20 million revolving credit facility and a U.S. $45 million revolving credit facility, both of which mature in December 2024. In the third quarter of 2024, in identifying synergies following the Acquisition, Pembina cancelled the two multi-use operating/revolving facilities.
Financing Activity
On January 12, 2024, Pembina closed the January MTN Offering of $1.8 billion aggregate principal amount of senior unsecured medium-term notes. The January MTN Offering was conducted in three tranches, consisting of the issuance of $600 million aggregate principal amount of senior unsecured medium-term notes, series 20 (the "Series 20 notes"), having a fixed coupon of 5.02 percent per annum, payable semi-annually and maturing on January 12, 2032; $600 million aggregate principal amount of senior unsecured medium-term notes, series 21, having a fixed coupon of 5.21 percent per annum, payable semi-annually and maturing on January 12, 2034; and $600 million aggregate principal amount of senior unsecured medium-term notes, series 22 (the "Series 22 notes"), having a fixed coupon of 5.67 percent per annum, payable semi-annually and maturing on January 12, 2054. Pembina used a portion of the net proceeds of the January MTN Offering to repay indebtedness of the Company under the Revolving Facility and for general corporate purposes. Pembina used the remaining net proceeds of the January MTN Offering to fund a portion of the purchase price for the Acquisition. Refer to the "Alliance/Aux Sable Acquisition" section of this MD&A for additional information.
On January 22, 2024, Pembina's $650 million aggregate principal amount of senior unsecured medium-term notes, series 8, matured and were fully repaid.
On April 18, 2024, Pembina completed an extension on its $1.5 billion Revolving Facility, which now matures on June 1, 2029, and an extension on its $50 million operating facility, which now matures on June 1, 2025.
On June 28, 2024, Pembina closed an offering of $950 million aggregate principal amount of senior unsecured medium-term notes (the "June MTN Offering"). The June MTN Offering was conducted in three tranches, consisting of the issuance of $650 million aggregate principal amount of senior unsecured medium-term notes, series 23 (the "Series 23 notes") having a fixed coupon of 5.22 percent per annum, paid semi-annually, and maturing on June 28, 2033; $150 million aggregate principal amount issued through a re-opening of the Series 20 notes; and $150 million aggregate principal amount issued through a re-opening of the Series 22 notes. The net proceeds of the June MTN Offering were used to repay indebtedness of the Company under the Revolving Facility, to fund the partial redemption of the Series 19 notes (as defined below), and for general corporate purposes.
22 Pembina Pipeline Corporation Third Quarter 2024
Effective July 6, 2024, Pembina completed the redemption of $150 million aggregate principal amount of its outstanding $300 million aggregate principal amount of senior unsecured medium-term notes, series 19 (the "Series 19 notes") due June 22, 2026 for cash. The Series 19 notes were redeemed at a redemption price of approximately $1,002 for each $1,000 principal amount of Series 19 notes, being equal to the outstanding principal amount, plus accrued but unpaid interest up until, but excluding, July 6, 2024. Pembina funded the redemption of the Series 19 notes through a portion of the net proceeds of the June MTN Offering.
Covenants
Pembina is subject to certain financial covenants under the indentures governing its medium-term notes and the agreements governing the senior unsecured credit facilities. As at September 30, 2024, Pembina was in compliance with those covenants (December 31, 2023: in compliance).
| Debt | Financial Covenant(1) | Ratio | Ratio as at September 30, 2024 | |||||||||||
| Senior unsecured medium-term notes | Funded Debt to Capitalization | Maximum 0.70(2) | 0.41 | |||||||||||
| Credit facilities | Debt to Capital | Maximum 0.70(3) | 0.41 | |||||||||||
(1) Terms as defined in relevant agreements.
(2) Covenant must be met at the reporting date and filed within 90 days after the end of each fiscal year and within 10 business days after filing of the Consolidated Financial Statements.
(3) Covenant must be met at the reporting date and filed within 120 days after the end of each fiscal year and 60 days after each quarter.
Credit Risk
Pembina continues to actively monitor and reassess the creditworthiness of its counterparties. The majority of Pembina's credit exposure is to investment grade counterparties. Pembina assesses all high exposure counterparties during the on-boarding process and actively monitors credit limits and exposure across the business. Pembina may reduce or mitigate its exposure to certain counterparties where it is deemed warranted and permitted under contractual terms. Where warranted, financial assurances may be sought from counterparties to mitigate and reduce risk, and such assurances may include guarantees, letters of credit and cash collateral. Letters of credit totaling $270 million (December 31, 2023: $124 million) were held as at September 30, 2024, primarily in respect of customer trade receivables.
Credit Ratings
The following information with respect to Pembina's credit ratings is provided as such information relates to Pembina's financing costs and liquidity. Specifically, credit ratings affect Pembina's ability to obtain short-term and long-term financing and the cost of such financing. A reduction in the current ratings of Pembina's debt by its rating agencies, particularly a downgrade below investment-grade ratings, could adversely affect Pembina's cost of financing and its access to sources of liquidity and capital. In addition, changes in credit ratings and the associated costs may affect Pembina's ability to enter into normal course derivative or hedging transactions. Credit ratings are intended to provide investors with an independent measure of the credit quality of any issues of securities. The credit ratings assigned by the rating agencies are not recommendations to purchase, hold or sell the securities, nor do the credit rating agencies comment on the market price or suitability for a particular investor. Any credit rating may not remain in effect for a given period of time or may be revised or withdrawn entirely by a rating agency in the future if, in its judgment, circumstances so warrant.
DBRS Limited ("DBRS") rates Pembina's senior unsecured medium-term notes 'BBB (high)'. DBRS has also assigned a debt rating of 'BBB (low)' to Pembina's Fixed-To-Fixed Rate Subordinated Notes, Series 1 (the "Series 1 Subordinated Notes") and a rating of 'Pfd-3 (high)' for each issued series of Pembina's Class A Preferred Shares, other than the Class A Preferred Shares, Series 2021-A (the "Series 2021-A Class A Preferred Shares"), which are deliverable to the holders of the Series 1 Subordinated Notes following the occurrence of certain bankruptcy or insolvency events in respect of Pembina.
Pembina Pipeline Corporation Third Quarter 2024 23
The long-term corporate credit rating assigned by S&P Global Ratings ("S&P") on Pembina is 'BBB'. S&P has also assigned a debt rating of 'BBB' to Pembina's senior unsecured medium-term notes, a debt rating of 'BB+' to the Series 1 Subordinated Notes, and a rating of 'P-3 (High)' to each issued series of Pembina's Class A Preferred Shares, other than the Series 2021-A Class A Preferred Shares.
Refer to "Description of the Capital Structure of Pembina – Credit Ratings" in the AIF for the year ended December 31, 2023 for further information.
Commitments and Off-Balance Sheet Arrangements
Commitments
Pembina had the following contractual obligations outstanding as at September 30, 2024:
Contractual Obligations(1) | Payments Due By Period | ||||||||||||||||
| ($ millions) | Total | Less than 1 year | 1 – 3 years | 3 – 5 years | After 5 years | ||||||||||||
Long-term debt(2) | 19,987 | 1,575 | 2,910 | 2,223 | 13,279 | ||||||||||||
Transportation and processing(3) | 10,744 | 57 | 81 | 440 | 10,166 | ||||||||||||
Leases(4) | 880 | 112 | 198 | 165 | 405 | ||||||||||||
Construction commitments(5) | 494 | 448 | 46 | — | — | ||||||||||||
Other commitments related to lease contracts(6) | 424 | 43 | 82 | 76 | 223 | ||||||||||||
| Funding commitments, software, and other | 51 | 20 | 18 | 11 | 2 | ||||||||||||
Total contractual obligations | 32,580 | 2,255 | 3,335 | 2,915 | 24,075 | ||||||||||||
(1)Pembina enters into product purchase agreements and power purchase agreements to secure supply for future operations. Purchase prices of both NGL and power are dependent on current market prices. Volumes and prices for NGL and power contracts cannot be reasonably determined, and therefore, an amount has not been included in the contractual obligations schedule. Product purchase agreements range from one to eight years and involve the purchase of NGL products from producers. Assuming product is available, Pembina has secured between 16 and 177 mbpd of NGL each year up to and including 2031. Power purchase agreements range from one to 25 years and involve the purchase of power from electrical service providers. Pembina has secured up to 78 megawatts per day each year up to and including 2048.
(2)Includes loans and borrowings, subordinated hybrid notes and interest payments on Pembina's senior unsecured medium-term notes. Excludes deferred financing costs.
(3)On April 1, 2024, Pembina signed commercial agreements for 50 percent of Cedar LNG's operating capacity. Pembina plans to reassign its respective capacity prior to the in-service date of the Cedar LNG Project. As a result of having signed these commercial arrangements, as at September 30, 2024, Pembina has disclosed related transportation and processing commitments of approximately $10.5 billion.
(4)Includes pipelines, facilities, terminals, rail, office space, land and vehicle leases.
(5)Excludes significant projects that are awaiting regulatory approval, projects which Pembina is not committed to construct, and projects that are executed by equity accounted investees.
(6)Relates to expected variable lease payments excluded from the measurements of the lease liability and payments related to non-lease components in lessee lease contracts.
Contingencies
Pembina, including its subsidiaries and its investments in equity accounted investees, are subject to various legal and regulatory and tax proceedings, actions and audits arising in the normal course of business. Pembina represents its interests vigorously in all proceedings in which it is involved. Legal and administrative proceedings involving possible losses are inherently complex, and the Company applies significant judgment in estimating probable outcomes. As at September 30, 2024, there were no significant claims filed against Pembina for which management believes the resolution of any such actions or proceedings would have a material impact on Pembina's financial position or results of operations.
Off-Balance Sheet Arrangements
As at September 30, 2024, Pembina does not have any off-balance sheet arrangements that have, or are reasonably likely to have, a current or future effect on Pembina's financial condition, results of operations, liquidity or capital expenditures.
Letters of Credit
Pembina has provided letters of credit to various third parties in the normal course of conducting business. The letters of credit include financial guarantees to counterparties for product purchases and sales, transportation services, utilities, engineering and construction services. The letters of credit have not had, and are not expected to have, a material impact on Pembina's financial position, earnings, liquidity or capital resources. As at September 30, 2024, Pembina had $219 million (December 31, 2023: $201 million) in letters of credit issued.
24 Pembina Pipeline Corporation Third Quarter 2024
5. SHARE CAPITAL
Common Shares
On May 13, 2024, the Toronto Stock Exchange ("TSX") accepted the renewal of Pembina's normal course issuer bid (the "NCIB") that allowed the Company to repurchase, at its discretion, up to five percent of the Company's outstanding common shares (representing approximately 29 million common shares) through the facilities of the TSX, the New York Stock Exchange and/or alternative Canadian trading systems or as otherwise permitted by applicable securities law, subject to certain restrictions on the number of common shares that may be purchased on a single day. The NCIB commenced on May 16, 2024 and will expire on the earlier of May 15, 2025 and the date on which Pembina has acquired the maximum number of common shares allowable under the NCIB or the date on which Pembina otherwise decides not to make any further repurchases under the NCIB. No common shares were purchased by Pembina during the three and nine months ended September 30, 2024.
Common Share Dividends
Common share dividends are payable if, as and when declared by Pembina's Board of Directors. The amount and frequency of dividends declared and payable is at the discretion of Pembina's Board of Directors, which considers earnings, cash flow, capital requirements, the financial condition of Pembina and other relevant factors when making its dividend determination.
Preferred Shares
On February 15, 2024, Pembina announced that none of the six million Cumulative Redeemable Rate Reset Class A Preferred Shares, Series 3 ("Series 3 Class A Preferred Shares") outstanding were converted into Cumulative Redeemable Floating Rate Class A Preferred Shares, Series 4. The annual dividend rate for the Series 3 Class A Preferred Shares for the five-year period from and including March 1, 2024 to, but excluding, March 1, 2029 will be 6.019 percent.
On March 18, 2024, Pembina announced that none of the six million Cumulative Redeemable Rate Reset Class A Preferred Shares, Series 17 ("Series 17 Class A Preferred Shares") outstanding were converted into Cumulative Redeemable Floating Rate Class A Preferred Shares, Series 18. The annual dividend rate for the Series 17 Class A Preferred Shares for the five-year period from and including March 31, 2024 to, but excluding, March 31, 2029 will be 6.605 percent.
On May 17, 2024, Pembina announced that none of the ten million Cumulative Redeemable Rate Reset Class A Preferred Shares, Series 5 ("Series 5 Class A Preferred Shares") outstanding were converted into Cumulative Redeemable Floating Rate Class A Preferred Shares, Series 6. The annual dividend rate for the Series 5 Class A Preferred Shares for the five-year period from and including June 1, 2024 to, but excluding, June 1, 2029 will be 6.814 percent.
Preferred Share Dividends
Other than in respect of the Series 2021-A Class A Preferred Shares, the holders of Pembina's Class A Preferred Shares are entitled to receive fixed or floating cumulative dividends, as applicable. Dividends on the Series 1, 3, 5, 7, 9, 21 and 22 Class A Preferred Shares are payable quarterly on the first day of March, June, September and December, if, as and when declared by the Board of Directors of Pembina. Dividends on the Series 15, 17 and 19 Class A Preferred Shares are payable on the last day of March, June, September and December in each year, if, as and when declared by the Board of Directors of Pembina. Dividends on the Series 25 Class A Preferred Shares are payable on the 15th day of February, May, August and November in each year, if, as and when declared by the Board of Directors of Pembina.
Dividends are not payable on the Series 2021-A Class A Preferred Shares, nor shall any dividends accumulate or accrue, prior to delivery of Series 2021-A Class A Preferred Shares to the holders of the Series 1 Subordinated Notes following the occurrence of certain bankruptcy or insolvency events in respect of Pembina. Thereafter, dividends on the Series 2021-A Class A Preferred Shares are payable on the 25th day of January and July in each year, if, as and when declared by the Board of Directors.
Pembina Pipeline Corporation Third Quarter 2024 25
Subscription Receipts
In connection with the Alliance/Aux Sable Acquisition, on December 19, 2023, Pembina closed its Subscription Receipt Offering of 29.9 million subscription receipts (including 3.9 million subscription receipts issued pursuant to the exercise in full by the underwriters for the offering of the over-allotment option granted to them by Pembina) at a price of $42.85 per subscription receipt for total gross proceeds of $1.3 billion.
Pursuant to the terms of the subscription receipts, on March 28, 2024, a payment of $0.6675 per subscription receipt (a "Dividend Equivalent Payment") was made to the holders of subscription receipts of record as of March 15, 2024. The amount of the Dividend Equivalent Payment was equivalent to the dividend paid per common share on the same date to the holders of common shares.
After accounting for the Dividend Equivalent Payment, the underwriter fees, other expenses, and interest income related to the Subscription Receipt Offering, net proceeds were $1.2 billion. The net proceeds of the Subscription Receipt Offering were received by Pembina on March 27, 2024 and were used to fund a portion of the purchase price of the Acquisition which closed on April 1, 2024. Concurrent with the closing of the Acquisition, each holder of subscription receipts received, automatically and without additional consideration or further action on the part of the holder, one common share of the Company.
Outstanding Share Data
Issued and outstanding (thousands)(1) | November 1, 2024 | ||||
| Common shares | 580,531 | ||||
Stock options(2) | 4,368 | ||||
| Series 1 Class A Preferred Shares | 10,000 | ||||
| Series 3 Class A Preferred Shares | 6,000 | ||||
| Series 5 Class A Preferred Shares | 10,000 | ||||
| Series 7 Class A Preferred Shares | 10,000 | ||||
| Series 9 Class A Preferred Shares | 9,000 | ||||
| Series 15 Class A Preferred Shares | 8,000 | ||||
| Series 17 Class A Preferred Shares | 6,000 | ||||
| Series 19 Class A Preferred Shares | 8,000 | ||||
| Series 21 Class A Preferred Shares | 14,972 | ||||
| Series 22 Class A Preferred Shares | 1,028 | ||||
| Series 25 Class A Preferred Shares | 10,000 | ||||
(1) Pembina issued 600,000 Series 2021-A Class A Preferred Shares to the Computershare Trust Company of Canada, to be held in trust to satisfy its obligations under the indenture governing the Series 1 Subordinated Notes, in connection with the issuance of the Series 1 Subordinated Notes.
(2) Balance includes 2.5 million exercisable stock options.
26 Pembina Pipeline Corporation Third Quarter 2024
6. CAPITAL EXPENDITURES
| 3 Months Ended September 30 | 9 Months Ended September 30 | |||||||||||||
| ($ millions) | 2024 | 2023 | 2024 | 2023 | ||||||||||
| Pipelines | 130 | 130 | 442 | 313 | ||||||||||
| Facilities | 110 | 24 | 218 | 77 | ||||||||||
| Marketing & New Ventures | 10 | 4 | 21 | 7 | ||||||||||
| Corporate and other projects | 12 | 11 | 32 | 32 | ||||||||||
Total capital expenditures(1) | 262 | 169 | 713 | 429 | ||||||||||
(1) Includes $53 million for the three months ended September 30, 2024 (2023: $26 million) and $100 million for the nine months ended September 30, 2024 (2023: $73 million) related to non-recoverable sustainment activities.
In both the third quarter and first nine months of 2024 and 2023, Pipelines capital expenditures continued to be largely related to Pembina's Peace Pipeline system expansion projects, including the Phase VIII Expansion which was placed into service in the second quarter of 2024, and the NEBC MPS Expansion. Facilities capital expenditures in the third quarter of 2024 and 2023 primarily related to Redwater expansion projects. In the third quarter of 2024 and 2023, there were no significant projects for Marketing & New Ventures capital expenditures. Corporate capital expenditures in the third quarter of 2024 and 2023 related mainly to information technology infrastructure and systems development.
Future capital expenditures for the remaining months of 2024 are estimated to be between $270 million and $300 million and are primarily related to the construction of RFS IV, the NEBC MPS Expansion, and investments in smaller growth projects, including various laterals and terminals, and spending on projects previously placed into service. Of the total future capital expenditure, between $75 million and $85 million is designated for non-recoverable sustaining capital to ensure safe and reliable operations.
For contributions to equity accounted investees, refer to the "Segment Results – Equity Accounted Investees Overview by Division" section of this MD&A.
Pembina Pipeline Corporation Third Quarter 2024 27
7. SELECTED QUARTERLY INFORMATION
Selected Quarterly Operating Information
| (mboe/d) | 2024 | 2023 | 2022 | ||||||||||||||||||||||||||||||||
| Q3 | Q2 | Q1 | Q4 | Q3 | Q2 | Q1 | Q4 | ||||||||||||||||||||||||||||
Volumes(1)(2) | |||||||||||||||||||||||||||||||||||
Pipelines – transportation volumes | |||||||||||||||||||||||||||||||||||
Conventional Pipelines | 992 | 969 | 1,007 | 1,054 | 1,034 | 881 | 900 | 1,024 | |||||||||||||||||||||||||||
| Transmission Pipelines | 713 | 726 | 588 | 590 | 582 | 580 | 594 | 593 | |||||||||||||||||||||||||||
| Oil Sands and Heavy Oil Pipelines | 1,033 | 1,021 | 1,003 | 1,008 | 979 | 977 | 973 | 976 | |||||||||||||||||||||||||||
Facilities – processing and fractionation volumes | |||||||||||||||||||||||||||||||||||
Gas Services | 584 | 599 | 612 | 602 | 605 | 564 | 563 | 588 | |||||||||||||||||||||||||||
| NGL Services | 226 | 256 | 193 | 199 | 198 | 185 | 158 | 211 | |||||||||||||||||||||||||||
| Total revenue volumes | 3,548 | 3,571 | 3,403 | 3,453 | 3,398 | 3,187 | 3,188 | 3,392 | |||||||||||||||||||||||||||
Marketing & New Ventures – sales volumes | |||||||||||||||||||||||||||||||||||
| Marketed crude | 117 | 100 | 80 | 82 | 89 | 98 | 73 | 96 | |||||||||||||||||||||||||||
| Marketed NGL | 227 | 219 | 215 | 217 | 166 | 163 | 194 | 193 | |||||||||||||||||||||||||||
(1) Volumes in mboe/d. See the "Abbreviations" section of this MD&A for definition. Volumes for Pipelines and Facilities divisions are revenue volumes, which are physical volumes plus volumes recognized from take-or-pay commitments. Volumes for Marketing & New Ventures are marketed crude and NGL volumes and are excluded from total volumes to avoid double counting.
(2) Includes Pembina's proportionate share of volumes from equity accounted investees.
Take-or-pay Contract Liabilities
| ($ millions) | 2024 | 2023 | 2022 | ||||||||||||||||||||||||||||||||||||||
| Q3 | Q2 | Q1 | Q4 | Q3 | Q2 | Q1 | Q4 | ||||||||||||||||||||||||||||||||||
Opening balance | 12 | 7 | 1 | 22 | 40 | 26 | 3 | 15 | |||||||||||||||||||||||||||||||||
Revenue deferred | 67 | 55 | 52 | 56 | 59 | 50 | 43 | 48 | |||||||||||||||||||||||||||||||||
| Revenue recognized | (68) | (50) | (46) | (77) | (77) | (36) | (20) | (60) | |||||||||||||||||||||||||||||||||
Ending take-or-pay contract liability balance | 11 | 12 | 7 | 1 | 22 | 40 | 26 | 3 | |||||||||||||||||||||||||||||||||
Selected Quarterly Market Pricing
| 2024 | 2023 | 2022 | ||||||||||||||||||||||||||||||||||||
| ($ average) | Q3 | Q2 | Q1 | Q4 | Q3 | Q2 | Q1 | Q4 | ||||||||||||||||||||||||||||||
WTI (USD/bbl) | 75.10 | 80.57 | 76.96 | 78.32 | 82.26 | 73.78 | 76.13 | 82.64 | ||||||||||||||||||||||||||||||
FX (USD/CAD) | 1.36 | 1.37 | 1.35 | 1.36 | 1.34 | 1.34 | 1.35 | 1.36 | ||||||||||||||||||||||||||||||
AECO Natural Gas (CAD/GJ) | 0.77 | 1.36 | 1.94 | 2.52 | 2.26 | 2.22 | 4.12 | 5.29 | ||||||||||||||||||||||||||||||
Station 2 Natural Gas (CAD/GJ) | 0.47 | 0.72 | 2.45 | 1.95 | 2.08 | 1.79 | 2.74 | 3.06 | ||||||||||||||||||||||||||||||
| Chicago Citygate Natural Gas (USD/mmbtu) | 1.76 | 1.60 | 2.49 | 2.63 | 2.31 | 1.99 | 4.32 | 5.86 | ||||||||||||||||||||||||||||||
Mt Belvieu Propane (USD/gal) | 0.73 | 0.75 | 0.84 | 0.67 | 0.69 | 0.68 | 0.82 | 0.80 | ||||||||||||||||||||||||||||||
| Alberta Power Pool (CAD/MWh) | 55.23 | 45.28 | 98.89 | 81.74 | 151.18 | 159.87 | 141.42 | 213.64 | ||||||||||||||||||||||||||||||
Pembina 20-day volume-weighted average share price | 55.19 | 50.22 | 47.54 | 45.13 | 41.43 | 41.57 | 43.63 | 46.26 | ||||||||||||||||||||||||||||||
28 Pembina Pipeline Corporation Third Quarter 2024
Quarterly Financial Information
($ millions, except where noted) | 2024 | 2023(2) | 2022(2) | |||||||||||||||||||||||||||||||||||
| Q3 | Q2 | Q1 | Q4 | Q3 | Q2 | Q1 | Q4 | |||||||||||||||||||||||||||||||
| Revenue | 1,844 | 1,855 | 1,540 | 1,836 | 1,455 | 1,422 | 1,618 | 1,771 | ||||||||||||||||||||||||||||||
Net revenue(1) | 1,259 | 1,222 | 912 | 1,142 | 989 | 906 | 936 | 994 | ||||||||||||||||||||||||||||||
| Operating expenses | 277 | 240 | 189 | 217 | 219 | 189 | 200 | 240 | ||||||||||||||||||||||||||||||
| Share of (loss) profit from equity accounted investees | (17) | 61 | 151 | 94 | 43 | 97 | 82 | 79 | ||||||||||||||||||||||||||||||
| Gross profit | 747 | 815 | 730 | 850 | 659 | 659 | 672 | 681 | ||||||||||||||||||||||||||||||
Adjusted EBITDA(1) | 1,019 | 1,091 | 1,044 | 1,033 | 1,021 | 823 | 947 | 925 | ||||||||||||||||||||||||||||||
| Earnings | 385 | 479 | 438 | 698 | 346 | 363 | 369 | 243 | ||||||||||||||||||||||||||||||
Earnings per common share – basic (dollars) | 0.60 | 0.75 | 0.74 | 1.21 | 0.58 | 0.60 | 0.61 | 0.39 | ||||||||||||||||||||||||||||||
Earnings per common share – diluted (dollars) | 0.60 | 0.75 | 0.73 | 1.21 | 0.57 | 0.60 | 0.61 | 0.39 | ||||||||||||||||||||||||||||||
| Cash flow from operating activities | 922 | 954 | 436 | 880 | 644 | 653 | 458 | 947 | ||||||||||||||||||||||||||||||
Cash flow from operating activities per common share – basic (dollars) | 1.59 | 1.64 | 0.79 | 1.60 | 1.17 | 1.19 | 0.83 | 1.72 | ||||||||||||||||||||||||||||||
Adjusted cash flow from operating activities(1) | 724 | 837 | 782 | 747 | 659 | 606 | 634 | 690 | ||||||||||||||||||||||||||||||
Adjusted cash flow from operating activities per common share – basic (dollars)(1) | 1.25 | 1.44 | 1.42 | 1.36 | 1.20 | 1.10 | 1.15 | 1.25 | ||||||||||||||||||||||||||||||
Common shares outstanding (millions): | ||||||||||||||||||||||||||||||||||||||
| Weighted average – basic | 580 | 580 | 549 | 549 | 549 | 550 | 550 | 551 | ||||||||||||||||||||||||||||||
| Weighted average – diluted | 581 | 581 | 550 | 550 | 550 | 551 | 551 | 553 | ||||||||||||||||||||||||||||||
| End of period | 580 | 580 | 549 | 549 | 549 | 549 | 550 | 550 | ||||||||||||||||||||||||||||||
| Common share dividends declared | 401 | 400 | 367 | 367 | 366 | 367 | 359 | 359 | ||||||||||||||||||||||||||||||
Dividends per common share | 0.69 | 0.69 | 0.67 | 0.67 | 0.67 | 0.67 | 0.65 | 0.65 | ||||||||||||||||||||||||||||||
| Preferred share dividends declared | 34 | 33 | 31 | 30 | 31 | 31 | 28 | 32 | ||||||||||||||||||||||||||||||
| Capital expenditures | 262 | 265 | 186 | 177 | 169 | 123 | 137 | 143 | ||||||||||||||||||||||||||||||
| Contributions to equity accounted investees | 124 | 144 | 103 | 202 | 20 | 11 | 38 | 46 | ||||||||||||||||||||||||||||||
| Distributions from equity accounted investees | 133 | 123 | 239 | 227 | 202 | 191 | 199 | 235 | ||||||||||||||||||||||||||||||
(1) Refer to the "Non-GAAP & Other Financial Measures" section of this MD&A.
(2) Comparative 2023 and 2022 periods have been adjusted. See "Accounting Policies & Estimates - Change in Accounting Policies" and Note 2 to the Interim Financial Statements.
During the periods highlighted in the table above, there were new large-scale growth projects across Pembina's business being placed into service. The Company's financial and operating results have also been impacted by the volatility of commodity market prices, fluctuations in foreign exchange rates, and inflation. In addition to these factors, several other notable elements have impacted Pembina's financial and operating results during the specified periods above, including:
•the completion of the Alliance/Aux Sable Acquisition;
•the closing of the Subscription Receipt Offering and the conversion of 29.9 million subscription receipts into common shares of the Company, concurrent with the closing of the Acquisition on April 1, 2024;
•the impairment reversal of $231 million recognized in the fourth quarter of 2023 in the Pipelines Division related to successful contract negotiations on the Nipisi Pipeline and the pipeline being put back into service in October 2023;
•contributions made by Pembina of $145 million to Aux Sable in the fourth quarter of 2023, representing Pembina's proportionate share of a claim filed by a counterparty to an NGL supply agreement with Aux Sable which was settled and discontinued in the fourth quarter of 2023; and
•the Northern Pipeline system outage in the first and second quarter of 2023 and the wildfires in Alberta and British Columbia in the second quarter of 2023, collectively resulted in a total impact on earnings of $95 million in 2023.
Pembina Pipeline Corporation Third Quarter 2024 29
8. SELECTED EQUITY ACCOUNTED INVESTEE INFORMATION
Loans and Borrowings of Equity Accounted Investees
Under equity accounting, the assets and liabilities of an investee are reported as a single line item in the Consolidated Statement of Financial Position, "Investments in Equity Accounted Investees". To assist readers' understanding and to evaluate the capitalization of Pembina's investments, loans and borrowings associated with investments in equity accounted investees are presented below based on Pembina's proportionate ownership in such investees, as at September 30, 2024. The loans and borrowings are presented and classified by the division in which the results for the investee are reported. Please refer to the "Abbreviations" section for a summary of Pembina's investments in equity accounted investees and the division in which their results are reported.
($ millions)(1) | September 30, 2024 | December 31, 2023 | ||||||
Pipelines(2) | 19 | 344 | ||||||
| Facilities | 2,520 | 2,461 | ||||||
Marketing & New Ventures(3) | 231 | — | ||||||
| Total | 2,770 | 2,805 | ||||||
(1) Balances reflect Pembina's ownership percentage of the outstanding balance face value.
(2) Pipelines included Alliance up to the closing of the Alliance/Aux Sable Acquisition on April 1, 2024. Refer to the "About Pembina – Alliance/Aux Sable Acquisition" and "Abbreviations" sections of this MD&A for more information.
(3) Relates to the Cedar Term Loan (as defined below).
Financing Activities for Equity Accounted Investees
Cedar LNG
On June 25, 2024, Pembina and its partner, the Haisla Nation, announced a positive FID in respect of the Cedar LNG Project. Prior to the positive FID, various letters of credit and other parental guarantees were issued by Pembina on behalf of Cedar LNG, which had given rise to an insurance contract liability on Pembina's financial statements. Following the positive FID, the required financial assurances were assumed by Cedar LNG and a gain on derecognition of $34 million was recorded in Pembina's earnings in the second quarter of 2024. This included $102 million in letters of credit previously issued by Pembina and assumed by Cedar in July 2024. Cedar LNG has secured a letter of credit facility whereby future financial assurances will be provided directly by Cedar LNG.
In connection with the positive FID, Cedar LNG entered into project financing including a U.S. $2.7 billion senior secured construction/term loan facility ("Cedar Term Loan") and a $2.6 billion senior secured revolving credit facility ("Cedar Revolving Facility"). The borrowings on the Cedar Term Loan will be used to finance approximately 60 percent of the Project's costs. The Cedar Revolving Facility will be utilized to provide various letters of credit in support of the Project, including replacing the financial assurances previously issued by Pembina on behalf of Cedar.
Further, during the third quarter of 2024, Cedar LNG also entered into a series of economic interest rate hedges. These hedges, at a weighted average effective rate of 3.84 percent, fix a minimum of 75 percent of Cedar LNG's senior secured debt instruments. The floating debt is priced at USD Secured Overnight Financing Rate ("SOFR").
Commitments to Equity Accounted Investees
Pembina has commitments to provide contributions to certain equity accounted investees based on annual budgets approved by the joint venture partners and contractual agreements.
Credit Risk for Equity Accounted Investees
As at September 30, 2024, Pembina's various equity accounted investees held letters of credit totaling $154 million (December 31, 2023: $62 million) primarily in respect of obligations for engineering, procurement and construction.
30 Pembina Pipeline Corporation Third Quarter 2024
9. RELATED PARTY TRANSACTIONS
Pembina enters into transactions with related parties in the normal course of business and all transactions are measured at their exchange amount, unless otherwise noted. Pembina provides management and operational oversight services, on a fixed fee and cost recovery basis, to certain equity accounted investees. Pembina also contracts for services and capacity from certain of its equity accounted investees, advances funds to support operations and provides letters of credit, including financial guarantees.
A summary of the significant related party transactions and balances are as follows:
| 3 Months Ended September 30 | 9 Months Ended September 30 | |||||||||||||
| ($ millions) | 2024 | 2023 | 2024 | 2023 | ||||||||||
Services provided(1) | ||||||||||||||
| PGI | 43 | 66 | 175 | 194 | ||||||||||
Aux Sable(2) | — | 34 | 32 | 99 | ||||||||||
Alliance(2) | — | 4 | 4 | 11 | ||||||||||
| Cedar LNG | 12 | 4 | 18 | 8 | ||||||||||
Other(3) | — | — | 2 | 1 | ||||||||||
| Total services provided | 55 | 108 | 231 | 313 | ||||||||||
| Services received | ||||||||||||||
| PGI | 2 | 2 | 6 | 10 | ||||||||||
Alliance(2) | — | 3 | 3 | 9 | ||||||||||
| Total services received | 2 | 5 | 9 | 19 | ||||||||||
As at ($ millions) | September 30, 2024 | December 31, 2023 | ||||||||||||
Trade receivables and other(4) | 32 | 36 | ||||||||||||
| Trade payables and other | — | 1 | ||||||||||||
(1) Services provided by Pembina include payments made by Pembina on behalf of related parties.
(2) Prior to the Acquisition, Pembina held a joint control equity interest in Aux Sable and Alliance. As of April 1, 2024, following the completion of the Acquisition, Alliance and Aux Sable became consolidated subsidiaries of Pembina and, as such, are no longer related parties.
(3) Other includes transactions with Grand Valley and ACG.
(4) As at September 30, 2024, trade receivables and other includes $28 million due from PGI (December 31, 2023: $33 million), and $3 million due from Cedar LNG (December 31, 2023: $2 million).
Pembina Pipeline Corporation Third Quarter 2024 31
10. ACCOUNTING POLICIES & ESTIMATES
Changes in Accounting Policies
Voluntary Change in Accounting Policies
Physical derivative instruments include purchases and sales of commodities (crude, natural gas liquids, natural gas, and others), which are physically settled by receipt or delivery of the commodity. Unrealized gains and losses and the settlement of physical derivative instruments, including any realized gains and losses, have historically been recorded as revenue from contracts with customers and cost of sales for sales and purchases, respectively.
Commodity-related financial derivative instruments include purchases and sales of commodities executed for risk management purposes that are net settled in cash, with no receipt or delivery of the underlying commodity. Unrealized gains and losses and the settlement of commodity-related financial 'sale' and 'purchase' derivative instruments, including any realized gains and losses, have historically been recorded net as 'Loss (gain) on commodity-related derivative financial instruments', which was previously presented separately from the Company's revenue-generating activities.
Foreign exchange and interest rate risk management activities give rise to financial derivative contracts. Unrealized gains and losses for instruments that did not apply hedge accounting and the settlement of other financial derivative instruments, including any realized gains and losses, have historically been recorded as 'Net finance costs'. Consequently, all other non-commodity related financial derivative contracts have been recorded and presented on a net basis in the Condensed Consolidated Interim Statements of Earnings and Comprehensive Income.
With respect to the related accounting policies above, Pembina has made the following voluntary changes retrospectively: (a) all unrealized and realized gains and losses and the settlement of physical derivative instruments and commodity-related financial derivative instruments recorded at fair value (purchases and sales) will be recorded on a net basis in revenue as 'Revenue from risk management and physical derivative contracts'; and (b) all unrealized and realized gains and losses and the settlement of foreign exchange-related financial derivative instruments that are executed to economically hedge foreign exchange risk on commodity-related contracts will be recorded on a net basis in revenue as 'Revenue from risk management and physical derivative contracts'. These voluntary changes in accounting policies were made for the following reasons in aid of providing more reliable and relevant information: (a) to improve consistency with peer and industry financial reporting and practices; (b) to better align the related financial reporting with the Company's business model; and (c) to provide a more suitable illustration of the Company's use of derivative instruments for the purpose of asset optimization, risk management, and servicing customer needs.
The Interim Financial Statements have been adjusted to reflect adjustments made as a result of these voluntary changes in accounting policies. There is no impact to the Condensed Consolidated Interim Statements of Financial Position, Changes in Equity and Cash Flows for the current or any historic reporting period. The following table presents the impacts of the voluntary changes in accounting policies on the Condensed Consolidated Interim Statements of Earnings and Comprehensive Income for each of the line items affected:
Reconciliation of the Condensed Consolidated Interim Statements of Earnings and Comprehensive Income
| 3 Months Ended September 30, 2023 | 9 Months Ended September 30, 2023 | |||||||||||||||||||
($ millions) | Previously reported | Policy change | Adjusted | Previously reported | Policy change | Adjusted | ||||||||||||||
| Revenue | 2,292 | (837) | 1,455 | 6,659 | (2,164) | 4,495 | ||||||||||||||
| Cost of sales | 1,592 | (753) | 839 | 4,845 | (2,118) | 2,727 | ||||||||||||||
| Loss on commodity-related derivative financial instruments | 84 | (84) | — | 46 | (46) | — | ||||||||||||||
| Gross profit | 659 | — | 659 | 1,990 | — | 1,990 | ||||||||||||||
| Earnings before income tax | 442 | — | 442 | 1,374 | — | 1,374 | ||||||||||||||
32 Pembina Pipeline Corporation Third Quarter 2024
Critical Accounting Judgments & Estimates
Critical accounting judgments and estimates used in preparing the Interim Financial Statements are described in Note 2 of the Consolidated Financial Statements. The preparation of consolidated financial statements in conformity with IFRS requires management to make both judgments and estimates that could materially affect the amounts recognized in the financial statements. By their nature, judgments and estimates may change in light of new facts and circumstances in the internal and external environment. There have been no material changes to Pembina's critical accounting estimates and judgments during the three and nine months ended September 30, 2024, except for significant estimates as it relates to control synergies valued in determining the fair value of the previously held equity accounted investments in Alliance, Aux Sable, and NRGreen. Refer to Note 3 to the Interim Financial Statements for more details on the significant estimates.
Pembina Pipeline Corporation Third Quarter 2024 33
11. NON-GAAP & OTHER FINANCIAL MEASURES
Throughout this MD&A, Pembina has disclosed certain financial measures that are not specified, defined or determined in accordance with GAAP and which are not disclosed in Pembina's financial statements. Non-GAAP financial measures either exclude an amount that is included in, or include an amount that is excluded from, the composition of the most directly comparable financial measure specified, defined and determined in accordance with GAAP. These non-GAAP financial measures and non-GAAP ratios, together with financial measures and ratios specified, defined and determined in accordance with GAAP, are used by management to evaluate the performance and cash flows of Pembina and its businesses and to provide additional useful information respecting Pembina's financial performance and cash flows to investors and analysts.
In this MD&A, Pembina has disclosed the following non-GAAP financial measures and non-GAAP ratios: net revenue, earnings before interest, taxes, depreciation, and amortization ("adjusted EBITDA"), adjusted EBITDA per common share, adjusted EBITDA from equity accounted investees, adjusted cash flow from operating activities and adjusted cash flow from operating activities per common share.
Non-GAAP financial measures and non-GAAP ratios disclosed in this MD&A do not have any standardized meaning under IFRS and may not be comparable to similar financial measures disclosed by other issuers. The financial measures and ratios should not, therefore, be considered in isolation or as a substitute for, or superior to, measures and ratios of Pembina's financial performance, or cash flows specified, defined or determined in accordance with IFRS, including revenue, earnings, share of profit from equity accounted investees and cash flow from operating activities.
Except as otherwise described herein, these non-GAAP financial measures and non-GAAP ratios are calculated on a consistent basis from period to period. Specific reconciling items may only be relevant in certain periods.
Below is a description of each non-GAAP financial measure and non-GAAP ratio disclosed in this MD&A, together with, as applicable, disclosure of: the most directly comparable financial measure that is specified, defined and determined in accordance with GAAP to which each non-GAAP financial measure relates; a quantitative reconciliation of each non-GAAP financial measure to such directly comparable GAAP financial measure; the composition of each non-GAAP financial measure and non-GAAP ratio; an explanation of how each non-GAAP financial measure and non-GAAP ratio provides useful information to investors and the additional purposes, if any, for which management uses each non-GAAP financial measure and non-GAAP ratio; and an explanation of the reason for any change in the label or composition of each non-GAAP financial measure and non-GAAP ratio from what was previously disclosed.
Net Revenue
Net revenue is a non-GAAP financial measure which is defined as total revenue less cost of goods sold. Management believes that net revenue provides investors with a single measure to indicate the margin on sales before non-product operating expenses that is comparable between periods. Management utilizes net revenue to compare consecutive results, to aggregate revenue generated by each of the Company's divisions and to set comparable objectives. The most directly comparable financial measure to net revenue that is specified, defined and determined in accordance with GAAP and disclosed in Pembina's financial statements is revenue.
| 3 Months Ended September 30 | Pipelines | Facilities | Marketing & New Ventures(1) | Corporate & Inter-segment Eliminations | Total(1) | |||||||||||||||||||||||||||
| ($ millions) | ||||||||||||||||||||||||||||||||
| 2024 | 2023 | 2024 | 2023 | 2024 | 2023 | 2024 | 2023 | 2024 | 2023 | |||||||||||||||||||||||
| Revenue | 860 | 734 | 282 | 233 | 938 | 675 | (236) | (187) | 1,844 | 1,455 | ||||||||||||||||||||||
Cost of goods sold | 9 | 6 | — | — | 732 | 594 | (156) | (134) | 585 | 466 | ||||||||||||||||||||||
| Net revenue | 851 | 728 | 282 | 233 | 206 | 81 | (80) | (53) | 1,259 | 989 | ||||||||||||||||||||||
(1) Comparative 2023 period has been adjusted. See "Accounting Policies & Estimates – Change in Accounting Policies" and Note 2 to the Interim Financial Statements.
34 Pembina Pipeline Corporation Third Quarter 2024
| 9 Months Ended September 30 | Pipelines | Facilities | Marketing & New Ventures(1) | Corporate & Inter-segment Eliminations | Total(1) | |||||||||||||||||||||||||||
| ($ millions) | ||||||||||||||||||||||||||||||||
| 2024 | 2023 | 2024 | 2023 | 2024 | 2023 | 2024 | 2023 | 2024 | 2023 | |||||||||||||||||||||||
| Revenue | 2,438 | 1,970 | 807 | 661 | 2,663 | 2,263 | (669) | (399) | 5,239 | 4,495 | ||||||||||||||||||||||
Cost of goods sold | 35 | 6 | — | — | 2,279 | 1,915 | (468) | (257) | 1,846 | 1,664 | ||||||||||||||||||||||
| Net revenue | 2,403 | 1,964 | 807 | 661 | 384 | 348 | (201) | (142) | 3,393 | 2,831 | ||||||||||||||||||||||
(1) Comparative 2023 period has been adjusted. See "Accounting Policies & Estimates – Change in Accounting Policies" and Note 2 to the Interim Financial Statements.
Adjusted EBITDA and Adjusted EBITDA per Common Share
Adjusted EBITDA is a non-GAAP financial measure and is calculated as earnings before net finance costs, income taxes, depreciation and amortization (included in operations and general and administrative expense), and unrealized gains or losses from derivative instruments. The exclusion of unrealized gains or losses from derivative instruments eliminates the non-cash impact of such gains or losses.
Adjusted EBITDA also includes adjustments to earnings for non-controlling interest, losses (gains) on disposal of assets, transaction costs incurred in respect of acquisitions, dispositions and restructuring, impairment charges or reversals in respect of goodwill, intangible assets, investments in equity accounted investees and property, plant and equipment, certain non-cash provisions and other amounts not reflective of ongoing operations. These additional adjustments are made to exclude various non-cash and other items that are not reflective of ongoing operations. Following completion of the Alliance/Aux Sable Acquisition, Pembina revised the definition of adjusted EBITDA to deduct earnings for the 14.6 percent non-controlling interest in the Aux Sable U.S. operations. Pembina's subsequent acquisition of the remaining interest in Aux Sable's U.S. operations in the third quarter of 2024 resulted in all of Aux Sable's results being included in the adjusted EBITDA calculation beginning on August 1, 2024.
Management believes that adjusted EBITDA provides useful information to investors as it is an important indicator of Pembina's ability to generate liquidity through cash flow from operating activities and equity accounted investees. Management also believes that adjusted EBITDA provides an indicator of operating income generated from capital expenditures, which includes operational finance income and gains from lessor lease arrangements. Adjusted EBITDA is also used by investors and analysts for assessing financial performance and for the purpose of valuing Pembina, including calculating financial and leverage ratios. Management utilizes adjusted EBITDA to set objectives and as a key performance indicator of the Company's success. Pembina presents adjusted EBITDA as management believes it is a measure frequently used by analysts, investors and other stakeholders in evaluating the Company's financial performance. The most directly comparable financial measure to adjusted EBITDA that is specified, defined and determined in accordance with GAAP and disclosed in Pembina's financial statements is earnings.
Adjusted EBITDA per common share is a non-GAAP ratio which is calculated by dividing adjusted EBITDA by the weighted average number of common shares outstanding.
Pembina Pipeline Corporation Third Quarter 2024 35
| 3 Months Ended September 30 | Pipelines | Facilities | Marketing & New Ventures | Corporate & Inter-segment Eliminations | Total | |||||||||||||||||||||||||||
| ($ millions, except per share amounts) | ||||||||||||||||||||||||||||||||
| 2024 | 2023 | 2024 | 2023 | 2024 | 2023 | 2024 | 2023 | 2024 | 2023 | |||||||||||||||||||||||
Earnings (loss) | 433 | 437 | 131 | 179 | 125 | (4) | (215) | (170) | 385 | 346 | ||||||||||||||||||||||
| Income tax expense | — | — | — | — | — | — | — | — | 89 | 96 | ||||||||||||||||||||||
| Adjustments to share of profit from equity accounted investees and other | 2 | 42 | 139 | 100 | 49 | 65 | — | — | 190 | 207 | ||||||||||||||||||||||
Net finance cost | 6 | 7 | 3 | 2 | 1 | 11 | 139 | 110 | 149 | 130 | ||||||||||||||||||||||
Depreciation and amortization | 153 | 104 | 50 | 38 | 15 | 11 | 13 | 11 | 231 | 164 | ||||||||||||||||||||||
Unrealized loss (gain) from derivative instruments | — | — | — | — | (18) | 78 | — | — | (18) | 78 | ||||||||||||||||||||||
Non-controlling interest(1) | — | — | — | — | (2) | — | — | — | (2) | — | ||||||||||||||||||||||
| Transaction and integration costs in respect of acquisitions | — | — | — | — | — | — | 4 | — | 4 | — | ||||||||||||||||||||||
| Gain on disposal of assets, other non-cash provisions, and other | (1) | 1 | 1 | — | (11) | (2) | 2 | 1 | (9) | — | ||||||||||||||||||||||
| Adjusted EBITDA | 593 | 591 | 324 | 319 | 159 | 159 | (57) | (48) | 1,019 | 1,021 | ||||||||||||||||||||||
Adjusted EBITDA per common share – basic (dollars) | 1.76 | 1.86 | ||||||||||||||||||||||||||||||
| 9 Months Ended September 30 | Pipelines | Facilities | Marketing & New Ventures | Corporate & Inter-segment Eliminations | Total | |||||||||||||||||||||||||||
| ($ millions, except per share amounts) | ||||||||||||||||||||||||||||||||
| 2024 | 2023 | 2024 | 2023 | 2024 | 2023 | 2024 | 2023 | 2024 | 2023 | |||||||||||||||||||||||
| Earnings (loss) | 1,373 | 1,163 | 489 | 467 | 324 | 231 | (1,210) | (487) | 1,302 | 1,078 | ||||||||||||||||||||||
| Income tax (recovery) expense | — | — | — | — | — | — | — | — | (326) | 296 | ||||||||||||||||||||||
| Adjustments to share of profit from equity accounted investees and other | 46 | 127 | 350 | 303 | 58 | 78 | — | — | 454 | 508 | ||||||||||||||||||||||
| Net finance costs | 19 | 22 | 8 | 6 | 4 | 8 | 367 | 314 | 398 | 350 | ||||||||||||||||||||||
| Depreciation and amortization | 412 | 305 | 128 | 113 | 47 | 34 | 40 | 33 | 627 | 485 | ||||||||||||||||||||||
| Unrealized loss from derivative instruments | — | — | — | — | 129 | 78 | — | — | 129 | 78 | ||||||||||||||||||||||
Non-controlling interest(1) | — | — | — | — | (12) | — | — | — | (12) | — | ||||||||||||||||||||||
| Loss on Alliance/Aux Sable Acquisition | — | — | — | — | — | — | 616 | — | 616 | — | ||||||||||||||||||||||
| Derecognition of insurance contract provision | — | — | — | — | (34) | — | — | — | (34) | — | ||||||||||||||||||||||
| Transaction and integration costs in respect of acquisition | — | — | — | — | — | — | 18 | — | 18 | — | ||||||||||||||||||||||
| Gain on disposal of assets, other non-cash provisions, and other | (3) | — | (1) | — | (26) | (5) | 12 | 1 | (18) | (4) | ||||||||||||||||||||||
| Adjusted EBITDA | 1,847 | 1,617 | 974 | 889 | 490 | 424 | (157) | (139) | 3,154 | 2,791 | ||||||||||||||||||||||
Adjusted EBITDA per common share – basic (dollars) | 5.53 | 5.08 | ||||||||||||||||||||||||||||||
(1) Presented net of adjusting items.
36 Pembina Pipeline Corporation Third Quarter 2024
Adjusted EBITDA from Equity Accounted Investees
In accordance with IFRS, Pembina's joint ventures are accounted for using equity accounting. Under equity accounting, the assets and liabilities of the investment are presented net in a single line item in the Consolidated Statement of Financial Position, "Investments in Equity Accounted Investees". Net earnings from investments in equity accounted investees are recognized in a single line item in the Consolidated Statement of Earnings and Comprehensive Income "Share of Profit from Equity Accounted Investees". The adjustments made to earnings, in adjusted EBITDA above, are also made to share of profit from investments in equity accounted investees. Cash contributions and distributions from investments in equity accounted investees represent Pembina's share paid and received in the period to and from the investments in equity accounted investees.
To assist in understanding and evaluating the performance of these investments, Pembina is supplementing the IFRS disclosure with non-GAAP proportionate consolidation of Pembina's interest in the investments in equity accounted investees. Pembina's proportionate interest in equity accounted investees has been included in adjusted EBITDA.
| 3 Months Ended September 30 | Pipelines | Facilities | Marketing & New Ventures | Total | ||||||||||||||||||||||||||||
| ($ millions) | ||||||||||||||||||||||||||||||||
| 2024 | 2023 | 2024 | 2023 | 2024 | 2023 | 2024 | 2023 | |||||||||||||||||||||||||
Share of (loss) profit from equity accounted investees | (1) | 23 | 34 | 68 | (50) | (48) | (17) | 43 | ||||||||||||||||||||||||
| Adjustments to share of profit from equity accounted investees: | ||||||||||||||||||||||||||||||||
Net finance costs | 1 | 5 | 69 | 22 | 49 | 1 | 119 | 28 | ||||||||||||||||||||||||
| Income tax (recovery) expense | — | (1) | 9 | 20 | — | — | 9 | 19 | ||||||||||||||||||||||||
Depreciation and amortization | 1 | 38 | 53 | 51 | — | 6 | 54 | 95 | ||||||||||||||||||||||||
| Unrealized loss on commodity-related derivative financial instruments | — | — | 8 | — | — | — | 8 | — | ||||||||||||||||||||||||
| Transaction costs incurred in respect of acquisitions and non-cash provisions | — | — | — | 7 | — | 58 | — | 65 | ||||||||||||||||||||||||
| Total adjustments to share of profit from equity accounted investees | 2 | 42 | 139 | 100 | 49 | 65 | 190 | 207 | ||||||||||||||||||||||||
| Adjusted EBITDA from equity accounted investees | 1 | 65 | 173 | 168 | (1) | 17 | 173 | 250 | ||||||||||||||||||||||||
| 9 Months Ended September 30 | Pipelines | Facilities | Marketing & New Ventures | Total | ||||||||||||||||||||||||||||
| ($ millions) | ||||||||||||||||||||||||||||||||
| 2024 | 2023 | 2024 | 2023 | 2024 | 2023 | 2024 | 2023 | |||||||||||||||||||||||||
Share of profit (loss) from equity accounted investees | 42 | 78 | 172 | 185 | (19) | (41) | 195 | 222 | ||||||||||||||||||||||||
| Adjustments to share of profit from equity accounted investees: | ||||||||||||||||||||||||||||||||
Net finance costs | 7 | 15 | 138 | 76 | 51 | 1 | 196 | 92 | ||||||||||||||||||||||||
| Income tax expense | — | — | 50 | 54 | — | — | 50 | 54 | ||||||||||||||||||||||||
Depreciation and amortization | 39 | 112 | 155 | 147 | 7 | 19 | 201 | 278 | ||||||||||||||||||||||||
| Unrealized loss on commodity-related derivative financial instruments | — | — | 5 | 9 | — | — | 5 | 9 | ||||||||||||||||||||||||
| Transaction costs incurred in respect of acquisitions and non-cash provisions | — | — | 2 | 17 | — | 58 | 2 | 75 | ||||||||||||||||||||||||
| Total adjustments to share of profit from equity accounted investees | 46 | 127 | 350 | 303 | 58 | 78 | 454 | 508 | ||||||||||||||||||||||||
| Adjusted EBITDA from equity accounted investees | 88 | 205 | 522 | 488 | 39 | 37 | 649 | 730 | ||||||||||||||||||||||||
Pembina Pipeline Corporation Third Quarter 2024 37
Adjusted Cash Flow from Operating Activities and Adjusted Cash Flow from Operating Activities per Common Share
Adjusted cash flow from operating activities is a non-GAAP measure which is defined as cash flow from operating activities adjusting for the change in non-cash operating working capital, adjusting for current tax and share-based compensation payments, and deducting distributions to non-controlling interests and preferred share dividends paid. Adjusted cash flow from operating activities deducts distributions to non-controlling interest and preferred share dividends paid because they are not attributable to common shareholders. The calculation has been modified to include current tax expense and accrued share-based payment expense as it allows management to better assess the obligations discussed below. Management believes that adjusted cash flow from operating activities provides comparable information to investors for assessing financial performance during each reporting period. Management utilizes adjusted cash flow from operating activities to set objectives and as a key performance indicator of the Company's ability to meet interest obligations, dividend payments and other commitments. Adjusted cash flow from operating activities per common share is a non-GAAP financial ratio which is calculated by dividing adjusted cash flow from operating activities by the weighted average number of common shares outstanding.
Following completion of the Alliance/Aux Sable Acquisition, Pembina revised the definition of adjusted cash flow from operating activities to deduct distributions related to non-controlling interest in the Aux Sable U.S. operations. On August 1, 2024, Pembina acquired the remaining interest in Aux Sable's U.S. operations.
| 3 Months Ended September 30 | 9 Months Ended September 30 | |||||||||||||
| ($ millions, except per share amounts) | 2024 | 2023 | 2024 | 2023 | ||||||||||
| Cash flow from operating activities | 922 | 644 | 2,312 | 1,755 | ||||||||||
Cash flow from operating activities per common share – basic (dollars) | 1.59 | 1.17 | 4.06 | 3.19 | ||||||||||
| Add (deduct): | ||||||||||||||
| Change in non-cash operating working capital | (136) | 76 | (30) | 264 | ||||||||||
| Current tax expense | (48) | (94) | (188) | (271) | ||||||||||
| Taxes paid, net of foreign exchange | 62 | 74 | 352 | 187 | ||||||||||
| Accrued share-based payment expense | (40) | (10) | (79) | (23) | ||||||||||
| Share-based compensation payment | — | — | 86 | 77 | ||||||||||
| Preferred share dividends paid | (34) | (31) | (98) | (90) | ||||||||||
| Distributions to non-controlling interest | (2) | — | (12) | — | ||||||||||
| Adjusted cash flow from operating activities | 724 | 659 | 2,343 | 1,899 | ||||||||||
Adjusted cash flow from operating activities per common share – basic (dollars) | 1.25 | 1.20 | 4.11 | 3.45 | ||||||||||
38 Pembina Pipeline Corporation Third Quarter 2024
12. OTHER
Risk Management
Pembina's risk management strategies, policies and limits, ensure risks and exposures are aligned to its business strategy and risk tolerance. Pembina's Board of Directors is responsible for providing risk management oversight at Pembina and oversees how management monitors compliance with Pembina's risk management policies and procedures and reviews the adequacy of this risk framework in relation to the risks faced by Pembina.
Pembina has exposure to counterparty credit risk, liquidity risk and market risk. Pembina utilizes derivative instruments to stabilize the results of its business and, as at September 30, 2024, the Company has entered into certain financial derivative contracts in order to manage commodity price, interest rate, cost of power and foreign exchange risk. Pembina has also entered into power purchase agreements to secure cost-competitive renewable energy, fix the price for a portion of the power Pembina consumes, and reduce its emissions.
Financial Instruments
Fair Values
The fair value of financial instruments utilizes a variety of valuation inputs. When measuring fair value, Pembina uses observable market data to the greatest extent possible. Depending on the nature of these valuation inputs, financial instruments are categorized as follows:
a. Level 1
Level 1 fair values are based on inputs that are unadjusted observable quoted prices from active markets for identical assets or liabilities as at the measurement date.
b. Level 2
Level 2 fair values are based on inputs, other than quoted market prices included in Level 1, that are either directly or indirectly observable. Level 2 fair value inputs include quoted forward market prices, time value, and broker quotes that are observable for the duration of the financial instrument's contractual term. These inputs are often adjusted for factors specific to the asset or liability, such as, location differentials and credit risk.
Financial instruments that utilize Level 2 fair valuation inputs, include derivatives arising from physical commodity forward contracts, commodity swaps and options, and forward interest rate and foreign-exchange swaps. In addition, Pembina's loans and borrowings utilize Level 2 fair valuation inputs, whereby the valuation technique is based on discounted future interest and principal payments using the current market interest rates of instruments with similar terms.
c. Level 3
Level 3 fair values utilize inputs that are not based on observable market data. Rather, various valuation techniques are used to develop inputs.
Financial instruments that utilize Level 3 fair valuation inputs include embedded derivative instruments arising from long-term power purchase agreements. The fair value of long-term power purchase agreements is measured using a pricing and cash flow model that accounts for forward power prices, renewable wind power pricing discounts and differentials, and inflationary metrics. The rate used to discount the respective estimated cash flows is a government risk-free interest rate that is adjusted for an appropriate credit spread. The fair valuation of the embedded derivative instruments is judged to be a significant management estimate. These assumptions and inputs are susceptible to change and may differ from actual future developments. This estimation uncertainty could materially impact the quantified fair value; and therefore, the gains and losses on commodity-related derivative financial instruments.
Pembina Pipeline Corporation Third Quarter 2024 39
Gains and Losses from Derivative Instruments
| 3 Months Ended September 30 | 9 Months Ended September 30 | |||||||||||||
| ($ millions) | 2024 | 2023 | 2024 | 2023 | ||||||||||
| Derivative instruments held at fair value through earnings | ||||||||||||||
| Realized (gain) loss | ||||||||||||||
Commodity-related gain recorded in revenue from risk management and physical derivative contracts(1) | (70) | (91) | (189) | (249) | ||||||||||
| Foreign exchange loss recorded in net finance costs | — | — | — | 13 | ||||||||||
| Unrealized (gain) loss | ||||||||||||||
Commodity-related (gain) loss recorded in revenue from risk management and physical derivative contracts(1) | (18) | 78 | 129 | 78 | ||||||||||
| Foreign exchange loss (gain) recorded in net finance costs | — | 10 | — | (11) | ||||||||||
| Derivative instruments in hedging relationships | ||||||||||||||
Interest rate loss recorded in other comprehensive income(2) | 6 | 2 | 8 | 6 | ||||||||||
(1) Comparative 2023 period has been adjusted. See "Accounting Policies & Estimates – Change in Accounting Policies" and Note 2 to the Interim Financial Statements.
(2) Unrealized losses or gains for designated cash flow hedges are recognized in impact of hedging activities in the Consolidated Statements of Earnings and Comprehensive Income, with realized losses or gains being reclassified to net finance costs. The movement in other comprehensive income for the three and nine months ended September 30, 2024 includes a realized gain of $4 million and gain of $13 million (2023: $8 million and $16 million realized gain), respectively, that was reclassified to net finance costs. No losses or gains have been recognized in net income relating to discontinued cash flow hedges.
Tax Regulations
Under Pillar Two legislation, Pembina is liable to pay a top-up tax for differences between the Company's Global Anti-Base Erosion effective tax rate and the 15.0 percent minimum tax rate. For jurisdictions where Pembina operates that have enacted the Pillar Two legislation, it was determined that there is no material impact to the Company. Pembina also operates in jurisdictions where Pillar Two regime has not been adopted. For these jurisdictions, Pembina has assessed the exposure to the Pillar Two legislation and foresees no material impact to the Company.
The excessive interest and financing expenses limitation regime has been enacted in Canada as of June 20, 2024. Pembina has assessed this limitation and determined that there are no material impacts to the Company as a result of this legislation.
Disclosure Controls and Procedures ("DC&P") and Internal Control over Financial Reporting ("ICFR")
Management's Report on Internal Control over Financial Reporting
Pembina's management is responsible for establishing and maintaining disclosure controls and procedures and internal control over financial reporting, as those terms are defined in National Instrument 52-109 Certification of Disclosure in Issuers' Annual and Interim Filings. The objective of this instrument is to improve the quality, reliability and transparency of information that is filed or submitted under Canadian securities legislation.
The President and Chief Executive Officer and Senior Vice President and Chief Financial Officer have designed, with the assistance of management, DC&P and ICFR to provide reasonable assurance that material information relating to Pembina's business is made known to them, is reported on a timely basis, that financial reporting is reliable and that financial statements prepared for external purposes are in accordance with IFRS.
Changes in Internal Control Over Financial Reporting
There were no changes in the third quarter of 2024 that had or are likely to have a material impact on Pembina's ICFR.
On April 1, 2024, Pembina completed the Alliance/Aux Sable Acquisition, as more fully described in the "Alliance/Aux Sable Acquisition" section of this MD&A and Note 3 to the Interim Financial Statements. The controls, policies and procedures of each of the Acquirees were excluded from Pembina's design of ICFR as of September 30, 2024. As at and for the period ended September 30, 2024, the assets and revenue of the Acquirees represented approximately 20 percent and 22 percent, respectively, of Pembina's total assets and revenue.
40 Pembina Pipeline Corporation Third Quarter 2024
13. ABBREVIATIONS
The following is a list of abbreviations that may be used in this MD&A:
Other | |||||
| AECO | Alberta Energy Company benchmark price for natural gas | ||||
B.C. | British Columbia | ||||
GAAP | Canadian generally accepted accounting principles | ||||
IFRS | International Financial Reporting Standards | ||||
NGL | Natural gas liquids | ||||
| LNG | Liquefied natural gas | ||||
U.S. | United States | ||||
WCSB | Western Canadian Sedimentary Basin | ||||
Deep cut | Ethane-plus capacity extraction gas processing capabilities | ||||
Shallow cut | Sweet gas processing with propane and/or condensate-plus extraction capabilities | ||||
Volumes | Volumes for Pipelines and Facilities are revenue volumes, defined as physical volumes plus volumes from take-or-pay commitments. Volumes for Marketing & New Ventures are marketed crude and NGL volumes. Volumes are stated in mboe/d, with natural gas volumes converted to mboe/d from MMcf/d at a 6:1 ratio, and also include revenue volumes from Pembina's equity accounted investees. | ||||
Measurement | |||||||||||
bpd | barrels per day | ||||||||||
mbbls | thousands of barrels | ||||||||||
mbpd | thousands of barrels per day | ||||||||||
mmbpd | millions of barrels per day | ||||||||||
mmbbls | millions of barrels | ||||||||||
mboe/d | thousands of barrels of oil equivalent per day | ||||||||||
mmboe/d | millions of barrels of oil equivalent per day | ||||||||||
| mtpa | million tonnes per annum | ||||||||||
MMcf/d | millions of cubic feet per day | ||||||||||
bcf/d | billions of cubic feet per day | ||||||||||
km | kilometer | ||||||||||
Investments in Equity Accounted Investees | |||||
| Pipelines: | |||||
| Alliance | Prior to the completion of the Alliance/Aux Sable Acquisition on April 1, 2024, Pembina owned a 50 percent interest in Alliance Pipeline Limited Partnership, Alliance Pipeline L.P., and NRGreen Power Limited Partnership | ||||
| Grand Valley | 75 percent interest in Grand Valley 1 Limited Partnership wind farm | ||||
| Facilities: | |||||
| PGI | 60 percent interest in Pembina Gas Infrastructure Inc., a premier gas processing entity in western Canada serving customers throughout the Montney and Duvernay trends from central Alberta to northeast British Columbia | ||||
| Fort Corp | 50 percent interest in Fort Saskatchewan Ethylene Storage Limited Partnership and Fort Saskatchewan Ethylene Storage Corporation | ||||
| Marketing & New Ventures: | |||||
| Aux Sable | Prior to the completion of the Alliance/Aux Sable Acquisition on April 1, 2024, Pembina owned an ownership interest in Aux Sable (approximately 42.7 percent in Aux Sable U.S. and 50 percent in Aux Sable Canada), which includes an NGL fractionation facility and gas processing capacity near Chicago, Illinois and other natural gas and NGL processing facilities, logistics and distribution assets in the U.S. and Canada, and transportation contracts on Alliance. | ||||
| CKPC | 50 percent interest in Canada Kuwait Petrochemical Corporation which was dissolved on December 31, 2023, and the PDH/PP Facility which was cancelled in the third quarter of 2022. | ||||
| Cedar LNG | 49.9 percent interest in Cedar LNG Partners LP and the proposed floating LNG facility in Kitimat, British Columbia, Canada | ||||
| ACG | 50 percent interest in Alberta Carbon Grid Heartland Limited Partnership and the proposed Heartland carbon dioxide transportation and sequestration system. | ||||
Readers are referred to the AIF for the year ended December 31, 2023 for additional descriptions, which is available at www.sedarplus.ca, www.sec.gov and through Pembina's website at www.pembina.com.
Pembina Pipeline Corporation Third Quarter 2024 41
14. FORWARD-LOOKING STATEMENTS & INFORMATION
In the interest of providing Pembina's security holders and potential investors with information regarding Pembina, including management's assessment of the Company's future plans and operations, certain statements contained in this MD&A constitute forward-looking statements or forward-looking information (collectively, "forward-looking statements"). Forward-looking statements are typically identified by words such as "anticipate", "continue", "estimate", "expect", "may", "will", "project", "should", "could", "would", "believe", "plan", "intend", "design", "target", "undertake", "view", "indicate", "maintain", "explore", "entail", "schedule", "objective", "strategy", "likely", "potential", "outlook", "aim", "purpose", "goal" and similar expressions suggesting future events or future performance.
By their nature, such forward-looking statements involve known and unknown risks, uncertainties and other factors that may cause actual results or events to differ materially from those anticipated in such forward-looking statements. Pembina believes the expectations reflected in those forward-looking statements are reasonable but no assurance can be given that these expectations will prove to be correct and such forward-looking statements included in this MD&A should not be unduly relied upon. These forward-looking statements speak only as of the date of the MD&A.
In particular, this MD&A contains forward-looking statements pertaining to the following:
•future levels and sustainability of cash dividends that Pembina intends to pay to its shareholders and the dividend payment dates;
•planning, construction, locations, capital expenditure estimates, schedules, regulatory and environmental applications and anticipated approvals, expected capacity, incremental volumes, contractual arrangements, completion and in-service dates, rights, sources of product, activities, benefits and operations with respect to new construction of, or expansions on existing, pipelines, systems, gas services facilities, processing and fractionation facilities, terminalling, storage and hub facilities and other facilities or energy infrastructure, as well as the impact of Pembina's new projects on its future financial performance;
•future pipeline, processing, fractionation, and storage facility and system operations;
•treatment under existing and proposed governmental regulatory regimes, including taxes, environmental and project assessment laws and regulations;
•Pembina's strategy and the development and expected timing of new business; initiatives and growth opportunities and the impact thereof;
•increased processing capacity and fractionation capacity due to increased oil and gas industry activity and new connections and other initiatives on Pembina's pipelines and at Pembina's facilities;
•expected future cash flows and the sufficiency thereof, financial strength, sources of and access to funds at acceptable rates, future contractual obligations, future financing options, availability of capital for capital expenditures, operating obligations, debt maturities, letters of credit and the use of proceeds from financings;
•Pembina's capital structure, including the sufficiency of the amount of leverage employed therein and future actions that may be taken with respect thereto, including expectations regarding the repurchase or redemption of common shares, repayments of existing debt, new borrowings, equity or hybrid securities issuances and the timing thereof;
•potential actions undertaken by Pembina to mitigate counterparty risk;
•processing, transportation, fractionation, storage and services commitments and contracts;
•the outcomes and effectiveness of Pembina's DC&P and ICFR;
•the expected demand for, and prices and inventory levels of, crude oil and other petroleum products, including NGL;
•the development and anticipated benefits of Pembina's new projects and developments, including RFS IV, the NEBC MPS Expansion, the Wapiti Expansion, the K3 Cogeneration Facility, the Cedar LNG Project and ACG, including the timing thereof; and
•the impact of current market conditions on Pembina.
Various factors or assumptions are typically applied by Pembina in drawing conclusions or making the forecasts, projections, predictions or estimations set out in forward-looking statements based on information currently available to Pembina. These factors and assumptions include, but are not limited to:
•oil and gas industry exploration and development activity levels and the geographic region of such activity;
•the success of Pembina's operations;
•prevailing commodity prices, interest rates, carbon prices, tax rates, exchange rates and inflation rates;
•the ability of Pembina to maintain current credit ratings;
•the availability and cost of capital to fund future capital requirements relating to existing assets, projects and the repayment of refinancing existing debt as it becomes due;
•future operating costs, including geotechnical and integrity costs being consistent with historical costs;
•oil and gas industry compensation levels remaining consistent;
•in respect of current developments, expansions, planned capital expenditures, completion dates and capacity expectations: that third parties will provide any necessary support; that any third-party projects relating to Pembina's growth projects will be sanctioned and completed as expected; that any required commercial agreements can be reached; that all required regulatory and environmental approvals can be obtained on the necessary terms in a timely manner; that there are no supply chain disruptions impacting Pembina's ability to obtain required equipment, materials or labour; that counterparties will comply with contracts in a timely manner; that there are no unforeseen events preventing the performance of contracts or the completion of the relevant facilities, and that there are no unforeseen material costs relating to the facilities which are not recoverable from customers;
•in respect of the stability of Pembina's dividends: prevailing commodity prices, margins and exchange rates; that Pembina's future results of operations will be consistent with past performance and management expectations in relation thereto; the continued availability of capital at attractive prices to fund future capital requirements relating to existing assets and projects, including but not limited to future capital expenditures relating to expansion, upgrades and maintenance shutdowns; the success of growth projects; future operating costs; that counterparties to agreements will continue to perform their obligations in a timely manner; that there are no unforeseen events preventing the performance of contracts; and that there are no unforeseen material construction or other costs related to current growth projects; current operations or the repayment or refinancing of existing debt as it becomes due;
•the inputs used by Pembina's management in the fair valuation of embedded derivative instruments remaining consistent;
•prevailing regulatory, tax and environmental laws and regulations and tax pool utilization; and
•the amount of future liabilities relating to lawsuits and environmental incidents and the availability of coverage under Pembina's insurance policies (including in respect of Pembina's business interruption insurance policy).
The actual results of Pembina could differ materially from those anticipated in these forward-looking statements as a result of the material risk factors set forth below:
•the regulatory environment and decisions and Indigenous and landowner consultation requirements;
•the impact of competitive entities and pricing;
•reliance on third parties to successfully operate and maintain certain assets;
•labour and material shortages;
•reliance on key relationships, joint venture partners, and agreements and the outcome of stakeholder engagement;
•the strength and operations of the oil and natural gas production industry and related commodity prices;
•non-performance or default by counterparties to agreements which Pembina or one or more of its subsidiaries has entered into in respect of its business;
•actions by joint venture partners or other partners which hold interests in certain of Pembina's assets;
•actions by governmental or regulatory authorities including changes in tax laws and treatment, changes in royalty rates, changes in regulatory processes or increased environmental regulation;
•fluctuations in operating results;
•adverse general economic and market conditions, including potential recessions in Canada, North America and worldwide, resulting in changes, or prolonged weaknesses, as applicable, in interest rates, foreign currency exchange rates, inflation rates, commodity prices, supply/demand trends and overall industry activity levels;
•constraints on, or the unavailability of adequate infrastructure;
•the political environment in North America and elsewhere, and public opinion thereon;
•ability to access various sources of debt and equity capital on acceptable terms;
•adverse changes in credit ratings;
•counterparty credit risk;
•operating risks, including the amount of future liabilities related to pipelines spills and other environmental incidents;
•technology and security risks, including cyber-security risks;
•natural catastrophes; and
•the other factors discussed under "Risk Factors" in Pembina's MD&A and AIF for the year ended December 31, 2023, which are available at www.sedarplus.ca, www.sec.gov and through Pembina's website at www.pembina.com.
These factors should not be construed as exhaustive. Unless required by law, Pembina does not undertake any obligation to publicly update or revise any forward-looking statements, whether as a result of new information, future events or otherwise. Management approved the 2024 capital expenditure guidance contained herein as of the date of MD&A. The purpose of the 2024 capital expenditure guidance is to assist readers in understanding Pembina's expected future capital expenditures, and this information may not be appropriate for other purposes. Any forward-looking statements contained herein are expressly qualified by this cautionary statement.
42 Pembina Pipeline Corporation Third Quarter 2024
CONDENSED CONSOLIDATED INTERIM STATEMENTS OF FINANCIAL POSITION
(unaudited)
($ millions) | September 30, 2024 | December 31, 2023 | ||||||||||||
| Assets Current assets | ||||||||||||||
| Cash and cash equivalents | 104 | 137 | ||||||||||||
Trade receivables and other | 1,026 | 852 | ||||||||||||
Subscription receipts (Note 9) | — | 1,256 | ||||||||||||
| Inventory | 322 | 333 | ||||||||||||
Derivative financial instruments (Note 13) | 35 | 55 | ||||||||||||
| 1,487 | 2,633 | |||||||||||||
| Non-current assets | ||||||||||||||
Property, plant and equipment (Note 5) | 22,339 | 15,798 | ||||||||||||
Intangible assets and goodwill (Note 6) | 6,461 | 6,065 | ||||||||||||
Investments in equity accounted investees (Note 7) | 4,263 | 6,987 | ||||||||||||
| Right-of-use assets | 545 | 523 | ||||||||||||
| Finance lease receivables | 225 | 230 | ||||||||||||
| Deferred tax assets | — | 285 | ||||||||||||
| Other assets | 92 | 97 | ||||||||||||
| 33,925 | 29,985 | |||||||||||||
| Total assets | 35,412 | 32,618 | ||||||||||||
| Liabilities and equity Current liabilities | ||||||||||||||
| Trade payables and other | 1,187 | 1,154 | ||||||||||||
Loans and borrowings (Note 8) | 946 | 650 | ||||||||||||
Subscription receipts (Note 9) | — | 1,281 | ||||||||||||
| Lease liabilities | 87 | 77 | ||||||||||||
Contract liabilities (Note 10) | 63 | 33 | ||||||||||||
Derivative financial instruments (Note 13) | 17 | 26 | ||||||||||||
| 2,300 | 3,221 | |||||||||||||
| Non-current liabilities | ||||||||||||||
Loans and borrowings (Note 8) | 11,182 | 9,253 | ||||||||||||
Subordinated hybrid notes (Note 8) | 596 | 596 | ||||||||||||
| Lease liabilities | 583 | 567 | ||||||||||||
| Decommissioning provision | 411 | 336 | ||||||||||||
Contract liabilities (Note 10) | 278 | 126 | ||||||||||||
| Deferred tax liabilities | 2,758 | 2,623 | ||||||||||||
Derivative financial instruments (Note 13) | 120 | 15 | ||||||||||||
| Other liabilities | 161 | 68 | ||||||||||||
| 16,089 | 13,584 | |||||||||||||
| 18,389 | 16,805 | |||||||||||||
| Equity | ||||||||||||||
| Attributable to shareholders | 17,023 | 15,813 | ||||||||||||
| Total equity | 17,023 | 15,813 | ||||||||||||
| Total liabilities and equity | 35,412 | 32,618 | ||||||||||||
See accompanying notes to the condensed consolidated interim financial statements
Pembina Pipeline Corporation Third Quarter 2024 43
CONDENSED CONSOLIDATED INTERIM STATEMENTS OF EARNINGS AND COMPREHENSIVE INCOME
(unaudited)
| 3 Months Ended September 30 | 9 Months Ended September 30 | |||||||||||||
| ($ millions, except per share amounts) | 2024 | 2023(1) | 2024 | 2023(1) | ||||||||||
Revenue (Note 10) | 1,844 | 1,455 | 5,239 | 4,495 | ||||||||||
Cost of sales (Note 4) | 1,080 | 839 | 3,142 | 2,727 | ||||||||||
Share of (loss) profit from equity accounted investees (Note 7) | (17) | 43 | 195 | 222 | ||||||||||
| Gross profit | 747 | 659 | 2,292 | 1,990 | ||||||||||
| General and administrative | 120 | 104 | 340 | 280 | ||||||||||
Loss on acquisition (Note 3) | — | — | 616 | — | ||||||||||
| Other expense (income) | 4 | (17) | (38) | (14) | ||||||||||
| Results from operating activities | 623 | 572 | 1,374 | 1,724 | ||||||||||
Net finance costs (Note 11) | 149 | 130 | 398 | 350 | ||||||||||
| Earnings before income tax | 474 | 442 | 976 | 1,374 | ||||||||||
| Current tax expense | 48 | 94 | 188 | 271 | ||||||||||
Deferred tax expense (recovery) (Note 3) | 41 | 2 | (514) | 25 | ||||||||||
| Income tax expense (recovery) | 89 | 96 | (326) | 296 | ||||||||||
| Earnings | 385 | 346 | 1,302 | 1,078 | ||||||||||
| Earnings attributable to: | ||||||||||||||
| Shareholders | 383 | 346 | 1,292 | 1,078 | ||||||||||
| Non-controlling interest | 2 | — | 10 | — | ||||||||||
Other comprehensive (loss) income, net of tax (Note 12) | ||||||||||||||
| Exchange (loss) gain on translation of foreign operations | (82) | 100 | 61 | 6 | ||||||||||
| Impact of hedging activities | (2) | (10) | (17) | (7) | ||||||||||
| Other comprehensive (loss) income, net of tax | (84) | 90 | 44 | (1) | ||||||||||
| Total comprehensive income | 301 | 436 | 1,346 | 1,077 | ||||||||||
| Comprehensive income attributable to: | ||||||||||||||
| Shareholders | 299 | 436 | 1,336 | 1,077 | ||||||||||
| Non-controlling interest | 2 | — | 10 | — | ||||||||||
Earnings attributable to common shareholders, net of preferred share dividends | 346 | 316 | 1,186 | 982 | ||||||||||
Earnings per common share – basic (dollars) | 0.60 | 0.58 | 2.08 | 1.79 | ||||||||||
Earnings per common share – diluted (dollars) | 0.60 | 0.57 | 2.08 | 1.78 | ||||||||||
Weighted average number of common shares (millions) | ||||||||||||||
| Basic | 580 | 549 | 570 | 550 | ||||||||||
| Diluted | 581 | 550 | 571 | 551 | ||||||||||
(1) Comparative 2023 period has been adjusted. See Note 2 Changes in Accounting Policies.
See accompanying notes to the condensed consolidated interim financial statements
44 Pembina Pipeline Corporation Third Quarter 2024
CONDENSED CONSOLIDATED INTERIM STATEMENTS OF CHANGES IN EQUITY
(unaudited)
| Attributable to Shareholders of the Company | Total Equity | |||||||||||||||||||||||||
($ millions) | Common Share Capital | Preferred Share Capital | Deficit | AOCI(1) | Total | Non-Controlling Interest(2) | ||||||||||||||||||||
| December 31, 2023 | 15,765 | 2,199 | (2,372) | 221 | 15,813 | — | 15,813 | |||||||||||||||||||
Total comprehensive income | ||||||||||||||||||||||||||
Earnings | — | — | 1,292 | — | 1,292 | 10 | 1,302 | |||||||||||||||||||
Other comprehensive income (Note 12) | — | — | — | 44 | 44 | — | 44 | |||||||||||||||||||
Total comprehensive income | — | — | 1,292 | 44 | 1,336 | 10 | 1,346 | |||||||||||||||||||
Transactions with shareholders of the Company (Note 9) | ||||||||||||||||||||||||||
Common shares issued, net of issue costs | 1,230 | — | — | — | 1,230 | — | 1,230 | |||||||||||||||||||
Part VI.1 tax on preferred shares | — | (7) | — | — | (7) | — | (7) | |||||||||||||||||||
Share-based payment transactions | 11 | — | — | — | 11 | — | 11 | |||||||||||||||||||
Dividends declared – common | — | — | (1,168) | — | (1,168) | — | (1,168) | |||||||||||||||||||
Dividends declared – preferred | — | — | (98) | — | (98) | — | (98) | |||||||||||||||||||
Dividend equivalent payment – subscription receipts | — | — | (20) | — | (20) | — | (20) | |||||||||||||||||||
Distributions to non-controlling interests | — | — | — | — | — | (12) | (12) | |||||||||||||||||||
Non-controlling interest recognized on acquisition (Note 3) | — | — | — | — | — | 148 | 148 | |||||||||||||||||||
Purchase of non-controlling interest (Note 3) | — | — | (74) | — | (74) | (146) | (220) | |||||||||||||||||||
| Total transactions with shareholders of the Company | 1,241 | (7) | (1,360) | — | (126) | (10) | (136) | |||||||||||||||||||
| September 30, 2024 | 17,006 | 2,192 | (2,440) | 265 | 17,023 | — | 17,023 | |||||||||||||||||||
| December 31, 2022 | 15,793 | 2,208 | (2,613) | 341 | 15,729 | 60 | 15,789 | |||||||||||||||||||
Total comprehensive income | ||||||||||||||||||||||||||
Earnings | — | — | 1,078 | — | 1,078 | — | 1,078 | |||||||||||||||||||
Other comprehensive loss | — | — | — | (1) | (1) | — | (1) | |||||||||||||||||||
| Total comprehensive income (loss) | — | — | 1,078 | (1) | 1,077 | — | 1,077 | |||||||||||||||||||
Transactions with shareholders of the Company (Note 9) | ||||||||||||||||||||||||||
Part VI.1 tax on preferred shares | — | (7) | — | — | (7) | — | (7) | |||||||||||||||||||
| Repurchase of common shares | (34) | — | (16) | — | (50) | — | (50) | |||||||||||||||||||
Share-based payment transactions | 5 | — | — | — | 5 | — | 5 | |||||||||||||||||||
Dividends declared – common | — | — | (1,092) | — | (1,092) | — | (1,092) | |||||||||||||||||||
Dividends declared – preferred | — | — | (90) | — | (90) | — | (90) | |||||||||||||||||||
| Total transactions with shareholders of the Company | (29) | (7) | (1,198) | — | (1,234) | — | (1,234) | |||||||||||||||||||
| September 30, 2023 | 15,764 | 2,201 | (2,733) | 340 | 15,572 | 60 | 15,632 | |||||||||||||||||||
(1) Accumulated Other Comprehensive Income ("AOCI").
(2) In the fourth quarter of 2023, Williams Partners Operating, LLC provided notice to Pacific Gas Pipeline, LLC of its intent to withdraw from the Limited Partnership, effective
December 31, 2023. As a result, the $60 million originally recognized in non-controlling interest was reclassified to owner's equity on December 31, 2023.
See accompanying notes to the condensed consolidated interim financial statements
Pembina Pipeline Corporation Third Quarter 2024 45
CONDENSED CONSOLIDATED INTERIM STATEMENTS OF CASH FLOWS
(unaudited)
| 3 Months Ended September 30 | 9 Months Ended September 30 | |||||||||||||
| ($ millions) | 2024 | 2023 | 2024 | 2023 | ||||||||||
| Cash provided by (used in) | ||||||||||||||
| Operating activities | ||||||||||||||
| Earnings | 385 | 346 | 1,302 | 1,078 | ||||||||||
| Adjustments for items not involving cash: | ||||||||||||||
| Share of loss (profit) from equity accounted investees | 17 | (43) | (195) | (222) | ||||||||||
| Depreciation and amortization | 231 | 164 | 627 | 485 | ||||||||||
Loss on Acquisition (Note 3) | — | — | 616 | — | ||||||||||
Unrealized (gain) loss from derivative instruments | (18) | 78 | 129 | 78 | ||||||||||
| Net finance costs | 149 | 130 | 398 | 350 | ||||||||||
| Share-based compensation expense | 41 | 11 | 81 | 26 | ||||||||||
| Income tax expense (recovery) | 89 | 96 | (326) | 296 | ||||||||||
| Gain on asset disposal | (4) | (16) | (24) | (19) | ||||||||||
Derecognition of insurance contract provision (Note 7) | — | — | (34) | — | ||||||||||
| Cash items paid or received: | ||||||||||||||
| Distributions from equity accounted investees | 133 | 202 | 495 | 592 | ||||||||||
| Net interest paid | (171) | (126) | (382) | (349) | ||||||||||
| Share-based compensation payment | — | — | (86) | (77) | ||||||||||
| Taxes paid | (62) | (74) | (352) | (187) | ||||||||||
| Change in non-cash operating working capital | 136 | (76) | 30 | (264) | ||||||||||
| Net change in contract liabilities | (1) | (23) | 31 | — | ||||||||||
| Other | (3) | (25) | 2 | (32) | ||||||||||
Cash flow from operating activities | 922 | 644 | 2,312 | 1,755 | ||||||||||
| Financing activities | ||||||||||||||
| Net increase (decrease) in bank borrowings | 77 | (35) | (370) | 82 | ||||||||||
| Proceeds from issuance of long-term debt, net of issue costs | (2) | — | 2,733 | 491 | ||||||||||
Proceeds from subscription receipts (Note 9) | — | — | 1,228 | — | ||||||||||
| Repayment of long-term debt | (150) | — | (800) | (600) | ||||||||||
| Repayment of lease liability | (19) | (18) | (57) | (58) | ||||||||||
| Issuance of common shares on exercise of options | — | — | 10 | 1 | ||||||||||
| Repurchase of common shares | — | — | — | (50) | ||||||||||
| Common share dividends paid | (401) | (366) | (1,168) | (1,092) | ||||||||||
| Preferred share dividends paid | (34) | (31) | (98) | (90) | ||||||||||
| Distributions to non-controlling interest | (2) | — | (12) | — | ||||||||||
| Purchase of non-controlling interest | (220) | — | (220) | — | ||||||||||
| Cash flow (used in) from financing activities | (751) | (450) | 1,246 | (1,316) | ||||||||||
| Investing activities | ||||||||||||||
| Capital expenditures | (262) | (169) | (713) | (429) | ||||||||||
| Contributions to equity accounted investees | (124) | (16) | (371) | (65) | ||||||||||
Acquisition net of cash acquired (Note 3) | — | — | (2,621) | — | ||||||||||
| Proceeds from sale of assets | 11 | — | 34 | 15 | ||||||||||
| Interest paid during construction | (5) | (4) | (21) | (10) | ||||||||||
| Return of capital from equity accounted investees | — | — | 63 | 26 | ||||||||||
| Changes in non-cash investing working capital and other | 59 | 23 | 19 | 17 | ||||||||||
| Cash flow used in investing activities | (321) | (166) | (3,610) | (446) | ||||||||||
| Change in cash and cash equivalents | (150) | 28 | (52) | (7) | ||||||||||
| Effect of movement in exchange rates on cash held | (2) | 1 | 5 | (1) | ||||||||||
| Cash and cash equivalents, beginning of period | 256 | 70 | 151 | 107 | ||||||||||
| Cash and cash equivalents, end of period | 104 | 99 | 104 | 99 | ||||||||||
| Long-term restricted cash included in other assets | — | 13 | — | 13 | ||||||||||
| Short-term cash and cash equivalents, end of period | 104 | 86 | 104 | 86 | ||||||||||
See accompanying notes to the condensed consolidated interim financial statements
46 Pembina Pipeline Corporation Third Quarter 2024
NOTES TO THE CONDENSED CONSOLIDATED UNAUDITED INTERIM FINANCIAL STATEMENTS
1. REPORTING ENTITY
Pembina Pipeline Corporation ("Pembina" or the "Company") is a Calgary-based, leading transportation and midstream service provider serving North America's energy industry. These condensed consolidated unaudited interim financial statements ("Interim Financial Statements") include the accounts of the Company, its subsidiary companies, partnerships and any investments in associates and joint arrangements as at and for the three and nine months ended September 30, 2024.
Pembina owns an integrated network of hydrocarbon liquids and natural gas pipelines, gas gathering and processing facilities, oil and natural gas liquids infrastructure and logistics services, and an export terminals business. Pembina's integrated assets and commercial operations along the majority of the hydrocarbon value chain allow it to offer a full spectrum of midstream and marketing services to the energy sector.
These Interim Financial Statements and the notes hereto have been prepared in accordance with International Accounting Standard 34, Interim Financial Reporting, as issued by the International Accounting Standards Board. The accounting policies applied are in accordance with International Financial Reporting Standards ("IFRS"), and other than as described in Note 2, are consistent with the audited annual consolidated financial statements of the Company as at and for the year ended December 31, 2023 ("Consolidated Financial Statements"), and should be read in conjunction with those Consolidated Financial Statements. The Interim Financial Statements were authorized for issue by Pembina's Board of Directors on November 5, 2024.
Use of Estimates and Judgments
Management is required to make estimates and assumptions and use judgment in the application of accounting policies that could have a significant impact on the amounts recognized in the Interim Financial Statements. Actual results may differ from estimates and those differences may be material. By their nature, judgments and estimates may change in light of new facts and circumstances in the internal and external environment. There have been no material changes to Pembina's critical accounting estimates and judgments during the three and nine months ended September 30, 2024, except for significant estimates as it relates to control synergies valued in determining the fair value of the previously held equity accounted investments in Alliance, Aux Sable, and NRGreen. Refer to Note 3 for more details on the significant estimates.
2. CHANGES IN ACCOUNTING POLICIES
Business Combinations Achieved in Stages and Non-Controlling Interests
When Pembina acquires control of investees that it previously had joint control or significant influence of, all previously recognized equity investment assets and other assets and liabilities representing previous relationships with the investees are derecognized at fair value, and a corresponding gain or loss recognized for the difference between the fair value and the carrying value on the acquisition date. An allocation of goodwill is included in the carrying value of the net assets disposed, however, the derecognition of deferred tax liabilities previously recognized by Pembina on its investment in the investees is excluded from the measurement of the gain or loss and presented separately.
When measuring the acquired assets, assumed liabilities, non-controlling interests, and goodwill acquired in the business combination, the fair value of Pembina's ownership in the investees as well as the fair value of the other previous relationships with the investees are included as part of the consideration paid in exchange for the business.
For the Acquisition (as defined in Note 3), Pembina has elected to measure its initial carrying value of the non-controlling interests equal to the proportionate value of the net assets that the non-controlling interests relate to. Refer to Note 3 for further details on the Acquisition.
Pembina Pipeline Corporation Third Quarter 2024 47
Amendments to IAS 1 - Classification of Liabilities as Current or Non-current and Non-current Liabilities with Covenants
The Company adopted Amendments to IAS 1 Classification of Liabilities as Current or Non-current and Non-current Liabilities with Covenants effective January 1, 2024. The amendments did not have an impact on the Interim Financial Statements, other than additional disclosure related to debt covenants (refer to Note 8 Long-Term Debt – Covenants for further information).
Voluntary Change in Accounting Policies
Physical derivative instruments include purchases and sales of commodities (crude, natural gas liquids, natural gas, and others), which are physically settled by receipt or delivery of the commodity. Unrealized gains and losses and the settlement of physical derivative instruments, including any realized gains and losses, have historically been recorded as revenue from contracts with customers and cost of sales for sales and purchases, respectively.
Commodity-related financial derivative instruments include purchases and sales of commodities executed for risk management purposes that are net settled in cash, with no receipt or delivery of the underlying commodity. Unrealized gains and losses and the settlement of commodity-related financial 'sale' and 'purchase' derivative instruments, including any realized gains and losses, have historically been recorded net as 'Loss (gain) on commodity-related derivative financial instruments', which was previously presented separately from the Company's revenue-generating activities.
Foreign exchange and interest rate risk management activities give rise to financial derivative contracts. Unrealized gains and losses for instruments that did not apply hedge accounting and the settlement of other financial derivative instruments, including any realized gains and losses, have historically been recorded as 'Net finance costs'. Consequently, all other non-commodity related financial derivative contracts have been recorded and presented on a net basis in the Condensed Consolidated Interim Statements of Earnings and Comprehensive Income.
With respect to the related accounting policies above, Pembina has made the following voluntary changes retrospectively: (a) all unrealized and realized gains and losses and the settlement of physical derivative instruments and commodity-related financial derivative instruments recorded at fair value (purchases and sales) will be recorded on a net basis in revenue as 'Revenue from risk management and physical derivative contracts'; and (b) all unrealized and realized gains and losses and the settlement of foreign exchange-related financial derivative instruments that are executed to economically hedge foreign exchange risk on commodity-related contracts will be recorded on a net basis in revenue as 'Revenue from risk management and physical derivative contracts'. These voluntary changes in accounting policies were made for the following reasons in aid of providing more reliable and relevant information: (a) to improve consistency with peer and industry financial reporting and practices; (b) to better align the related financial reporting with the Company's business model; and (c) to provide a more suitable illustration of the Company's use of derivative instruments for the purpose of asset optimization, risk management, and servicing customer needs.
The Interim Financial Statements have been adjusted to reflect adjustments made as a result of these voluntary changes in accounting policies. There is no impact to the Condensed Consolidated Interim Statements of Financial Position, Changes in Equity and Cash Flows for the current or any historic reporting period. The following table presents the impacts of the voluntary changes in accounting policies on the Condensed Consolidated Interim Statements of Earnings and Comprehensive Income for each of the line items affected:
Reconciliation of the Condensed Consolidated Interim Statements of Earnings and Comprehensive Income
| 3 Months Ended September 30, 2023 | 9 Months Ended September 30, 2023 | ||||||||||||||||||||||
($ millions) | Previously reported | Policy change | Adjusted | Previously reported | Policy change | Adjusted | |||||||||||||||||
| Revenue | 2,292 | (837) | 1,455 | 6,659 | (2,164) | 4,495 | |||||||||||||||||
| Cost of sales | 1,592 | (753) | 839 | 4,845 | (2,118) | 2,727 | |||||||||||||||||
| Loss on commodity-related derivative financial instruments | 84 | (84) | — | 46 | (46) | — | |||||||||||||||||
| Gross profit | 659 | — | 659 | 1,990 | — | 1,990 | |||||||||||||||||
| Earnings before income tax | 442 | — | 442 | 1,374 | — | 1,374 | |||||||||||||||||
48 Pembina Pipeline Corporation Third Quarter 2024
New Standards and Interpretations Not Yet Adopted
IFRS 18 Presentation and Disclosure in Financial Statements, was issued on April 9, 2024 and effective January 1, 2027, with early application permitted. The standard introduces key changes to the structure of the statement of earnings and comprehensive income, required disclosures for certain management-defined performance measures, and aggregation and disaggregation of line items in the financial statements. Pembina is currently reviewing the impact of this standard on its consolidated financial statements.
Pembina Pipeline Corporation Third Quarter 2024 49
3. ACQUISITION
On April 1, 2024, Pembina completed the acquisition of Enbridge Inc.'s ("Enbridge") interests in the Alliance, Aux Sable, and NRGreen joint ventures (the "Acquirees") for an aggregate purchase price of $2.8 billion, net of $327 million of assumed debt, representing Enbridge's proportionate share of the indebtedness of Alliance (the "Acquisition"). As a result of the Acquisition, Pembina obtained control over the Alliance, Aux Sable, and NRGreen joint ventures (the "Acquirees") and, as such, the accounting for the results of the Acquirees following completion of the Acquisition changed from the equity method of accounting to being fully consolidated and incorporated into Pembina's financial results. Pembina's previous investments under the equity method of accounting of $2.8 billion in the Acquirees, as well as allocated goodwill of $380 million, was considered disposed of at a fair value of $2.6 billion, resulting in a loss on disposition of $616 million, offset by a deferred tax recovery of $626 million recorded in the condensed consolidated interim statement of earnings for the nine months ended September 30, 2024. The fair value of the previously held equity investment in the Acquirees is included as a component of the purchase price.
Following the Acquisition, Pembina owned all equity interests in Alliance, Aux Sable's Canadian operations and NRGreen businesses, and an 85.4 percent interest in Aux Sable's U.S. operations. Alliance and NRGreen are fully consolidated into the financial results of the Pipelines Division, while Aux Sable is reported within the Facilities Division and Marketing & New Ventures Division. These assets complement Pembina's strategy of providing access to long-life resources from the Western Canadian Sedimentary Basin to premium end markets and increases exposure to lighter hydrocarbons, including natural gas and NGL.
The Acquisition was accounted for as a business combination using the acquisition method where the acquired tangible and intangible assets and assumed liabilities were recorded at their estimated fair values at the date of acquisition, with the exception of right-of-use assets, deferred tax liabilities, and lease liabilities, which are measured in accordance with Pembina's accounting policies. Pembina elected to take the accounting policy choice to measure the non-controlling interest at the proportionate value of Aux Sable's U.S. operations' net assets.
The purchase price equation, subject to finalization, is based on assessed fair values and is as follows:
| As at April 1, 2024 | Previously reported | Adjustments | Updated | ||||||||||||||||||||||||||
| ($ millions) | in Q2 2024 | in Q3 2024 | |||||||||||||||||||||||||||
| Purchase Price Consideration | |||||||||||||||||||||||||||||
| Cash (net of cash acquired) | 2,620 | — | 2,620 | ||||||||||||||||||||||||||
| Equity investment in Acquirees | 2,562 | — | 2,562 | ||||||||||||||||||||||||||
| Other | 12 | — | 12 | ||||||||||||||||||||||||||
| 5,194 | — | 5,194 | |||||||||||||||||||||||||||
| Fair Value of Net Assets Acquired | |||||||||||||||||||||||||||||
| Current assets | 240 | — | 240 | ||||||||||||||||||||||||||
| Property, plant and equipment | 6,339 | 6 | 6,345 | ||||||||||||||||||||||||||
| Other long-term assets | 38 | 11 | 49 | ||||||||||||||||||||||||||
| Goodwill | 805 | — | 805 | ||||||||||||||||||||||||||
| Current liabilities | (219) | (4) | (223) | ||||||||||||||||||||||||||
| Long-term debt | (596) | — | (596) | ||||||||||||||||||||||||||
| Deferred tax liabilities | (937) | — | (937) | ||||||||||||||||||||||||||
| Provisions | (52) | — | (52) | ||||||||||||||||||||||||||
| Other long-term liabilities | (276) | (13) | (289) | ||||||||||||||||||||||||||
| Non-controlling interest in Aux Sable's U.S. operations | (148) | — | (148) | ||||||||||||||||||||||||||
| 5,194 | — | 5,194 | |||||||||||||||||||||||||||
50 Pembina Pipeline Corporation Third Quarter 2024
Pembina engaged an independent valuator to assist with determining the preliminary fair value of Pembina's previously held equity investments in the Acquirees, as well as certain tangible and intangible assets within the purchase price equation. The fair value of Pembina's previous equity investment in the Acquirees was determined based on the negotiated purchase price paid to Enbridge, adjusted for an estimated control premium, which was determined using comparable market transactions and identified control synergies. The control synergies include significant estimates for timing, amount, and likelihood. Changes in any of the estimates could impact the amounts assigned to property, plant and equipment, other assets, deferred tax liabilities, non-controlling interest as well as the loss on disposition. Property, plant and equipment assets of $6.3 billion were valued primarily using a cost approach, which includes the determination of the replacement cost for a market participant buyer to acquire or construct a comparable asset, adjusted for external conditions, including physical, functional and economic obsolescence.
Goodwill of $805 million recognized on the transaction is a result of deferred taxes recognized on the transaction, which are recorded at the Company's effective tax rate without discounting. Pembina recognized $20 million in acquisition-related expenses. All acquisition-related expenses have been expensed as incurred and are included in other expenses in the Interim Financial Statements.
The purchase price allocation is not final, as Pembina continues to obtain and verify information required to determine the acquisition date value of certain assets and liabilities arising from acquired contracts, contingencies, and deferred income taxes. During the third quarter of 2024, Pembina adjusted the preliminary fair value of the identifiable net assets to reflect updated information. This included an increase in the value of right-of-use assets and corresponding lease liabilities, as well as an increase in the value of contract liabilities, with a corresponding increase in the recognized value of property, plant, and equipment. Any further adjustments to the purchase price allocation will be made as soon as practicable but no later than one year from the date of acquisition.
Revenue generated by the acquisition for the period from the acquisition date of April 1, 2024 to September 30, 2024 was $807 million. Net earnings for the same period were $305 million. If the acquisition had occurred on January 1, 2024, management estimates that consolidated revenue would have increased by an additional $524 million and consolidated net earnings for the period would have increased by an additional $74 million. In determining these amounts, management has assumed that the fair value adjustments that arose on the date of acquisition would have been the same if the acquisition had occurred on January 1, 2024.
On August 1, 2024, Pembina acquired the remaining 14.6 percent interest in Aux Sable's U.S. operations from certain subsidiaries of The Williams Companies for U.S. $160 million. Pembina's subsequent acquisition of the non-controlling interest was recorded as an equity transaction recognized directly in equity.
Pembina Pipeline Corporation Third Quarter 2024 51
4. OPERATING SEGMENTS
Pembina's operating segments are organized by three divisions: Pipelines, Facilities and Marketing & New Ventures.
| 3 Months Ended September 30, 2024 | Pipelines(1) | Facilities | Marketing & New Ventures(2) | Corporate & Inter-segment Eliminations | Total | ||||||||||||
| ($ millions) | |||||||||||||||||
| Revenue from external customers | 810 | 86 | 937 | 11 | 1,844 | ||||||||||||
| Inter-segment revenue | 50 | 196 | 1 | (247) | — | ||||||||||||
Total revenue(3) | 860 | 282 | 938 | (236) | 1,844 | ||||||||||||
| Operating expenses | 244 | 123 | 5 | (95) | 277 | ||||||||||||
| Cost of goods sold | 9 | — | 732 | (156) | 585 | ||||||||||||
| Depreciation and amortization included in operations | 151 | 50 | 15 | 2 | 218 | ||||||||||||
| Cost of sales | 404 | 173 | 752 | (249) | 1,080 | ||||||||||||
| Share of (loss) profit from equity accounted investees | (1) | 34 | (50) | — | (17) | ||||||||||||
| Gross profit | 455 | 143 | 136 | 13 | 747 | ||||||||||||
| Depreciation included in general and administrative | 2 | — | — | 11 | 13 | ||||||||||||
| Other general and administrative | 14 | 8 | 12 | 73 | 107 | ||||||||||||
| Other expense (income) | — | 1 | (2) | 5 | 4 | ||||||||||||
Results from operating activities | 439 | 134 | 126 | (76) | 623 | ||||||||||||
| Net finance costs | 6 | 3 | 1 | 139 | 149 | ||||||||||||
Earnings (loss) before tax | 433 | 131 | 125 | (215) | 474 | ||||||||||||
| Income tax expense | — | — | — | — | 89 | ||||||||||||
Earnings (loss) | 433 | 131 | 125 | (215) | 385 | ||||||||||||
Capital expenditures | 130 | 110 | 10 | 12 | 262 | ||||||||||||
| Contributions to equity accounted investees | — | 124 | — | — | 124 | ||||||||||||
| 3 Months Ended September 30, 2023 | Pipelines(1) | Facilities | Marketing & New Ventures(2)(4) | Corporate & Inter-segment Eliminations | Total(4) | ||||||||||||
| ($ millions) | |||||||||||||||||
| Revenue from external customers | 675 | 92 | 675 | 13 | 1,455 | ||||||||||||
| Inter-segment revenue | 59 | 141 | — | (200) | — | ||||||||||||
Total revenue(3) | 734 | 233 | 675 | (187) | 1,455 | ||||||||||||
| Operating expenses | 192 | 95 | 3 | (71) | 219 | ||||||||||||
| Cost of goods sold | 6 | — | 594 | (134) | 466 | ||||||||||||
| Depreciation and amortization included in operations | 104 | 38 | 11 | 1 | 154 | ||||||||||||
| Cost of sales | 302 | 133 | 608 | (204) | 839 | ||||||||||||
| Share of profit (loss) from equity accounted investees | 23 | 68 | (48) | — | 43 | ||||||||||||
| Gross profit | 455 | 168 | 19 | 17 | 659 | ||||||||||||
| Depreciation included in general and administrative | — | — | — | 10 | 10 | ||||||||||||
| Other general and administrative | 11 | 3 | 13 | 67 | 94 | ||||||||||||
| Other income | — | (16) | (1) | — | (17) | ||||||||||||
Results from operating activities | 444 | 181 | 7 | (60) | 572 | ||||||||||||
| Net finance costs | 7 | 2 | 11 | 110 | 130 | ||||||||||||
| Earnings (loss) before tax | 437 | 179 | (4) | (170) | 442 | ||||||||||||
| Income tax expense | — | — | — | — | 96 | ||||||||||||
Earnings (loss) | 437 | 179 | (4) | (170) | 346 | ||||||||||||
Capital expenditures | 130 | 24 | 4 | 11 | 169 | ||||||||||||
| Contributions to equity accounted investees | — | — | 20 | — | 20 | ||||||||||||
(1) Pipelines revenue includes $130 million (2023: $78 million) associated with U.S. pipeline revenue.
(2) Marketing & New Ventures includes revenue of $234 million (2023: $37 million) associated with U.S. midstream sales.
(3) During the three months ended September 30, 2024 and 2023, no one customer accounted for 10 percent or more of total revenues reported throughout all segments.
(4) Comparative 2023 period has been adjusted. See Note 2 Changes in Accounting Policies.
52 Pembina Pipeline Corporation Third Quarter 2024
| 9 Months Ended September 30, 2024 | Pipelines(1) | Facilities | Marketing & New Ventures(2) | Corporate & Inter-segment Eliminations | Total | ||||||||||||
| ($ millions) | |||||||||||||||||
| Revenue from external customers | 2,285 | 259 | 2,661 | 34 | 5,239 | ||||||||||||
| Inter-segment revenue | 153 | 548 | 2 | (703) | — | ||||||||||||
Total revenue(3) | 2,438 | 807 | 2,663 | (669) | 5,239 | ||||||||||||
| Operating expenses | 601 | 336 | 13 | (244) | 706 | ||||||||||||
| Cost of goods sold | 35 | — | 2,279 | (468) | 1,846 | ||||||||||||
| Depreciation and amortization included in operations | 410 | 128 | 47 | 5 | 590 | ||||||||||||
| Cost of sales | 1,046 | 464 | 2,339 | (707) | 3,142 | ||||||||||||
| Share of profit (loss) from equity accounted investees | 42 | 172 | (19) | — | 195 | ||||||||||||
| Gross profit | 1,434 | 515 | 305 | 38 | 2,292 | ||||||||||||
| Depreciation included in general and administrative | 2 | — | — | 35 | 37 | ||||||||||||
| Other general and administrative | 42 | 19 | 39 | 203 | 303 | ||||||||||||
| Other (income) expense | (2) | (1) | (62) | 27 | (38) | ||||||||||||
Loss on Acquisition (Note 3) | — | — | — | 616 | 616 | ||||||||||||
Results from operating activities | 1,392 | 497 | 328 | (843) | 1,374 | ||||||||||||
| Net finance costs | 19 | 8 | 4 | 367 | 398 | ||||||||||||
Earnings (loss) before tax | 1,373 | 489 | 324 | (1,210) | 976 | ||||||||||||
| Income tax recovery | — | — | — | — | (326) | ||||||||||||
| Earnings (loss) | 1,373 | 489 | 324 | (1,210) | 1,302 | ||||||||||||
Capital expenditures | 442 | 218 | 21 | 32 | 713 | ||||||||||||
| Contributions to equity accounted investees | 5 | 124 | 242 | — | 371 | ||||||||||||
| 9 Months Ended September 30, 2023 | Pipelines(1) | Facilities | Marketing & New Ventures(2)(4) | Corporate & Inter-segment Eliminations | Total(4) | ||||||||||||
| ($ millions) | |||||||||||||||||
| Revenue from external customers | 1,851 | 346 | 2,263 | 35 | 4,495 | ||||||||||||
| Inter-segment revenue | 119 | 315 | — | (434) | — | ||||||||||||
Total revenue(3) | 1,970 | 661 | 2,263 | (399) | 4,495 | ||||||||||||
| Operating expenses | 524 | 265 | 3 | (184) | 608 | ||||||||||||
| Cost of goods sold | 6 | — | 1,915 | (257) | 1,664 | ||||||||||||
| Depreciation and amortization included in operations | 304 | 113 | 34 | 4 | 455 | ||||||||||||
| Cost of sales | 834 | 378 | 1,952 | (437) | 2,727 | ||||||||||||
| Share of profit (loss) from equity accounted investees | 78 | 185 | (41) | — | 222 | ||||||||||||
| Gross profit | 1,214 | 468 | 270 | 38 | 1,990 | ||||||||||||
| Depreciation included in general and administrative | 1 | — | — | 29 | 30 | ||||||||||||
| Other general and administrative | 28 | 11 | 29 | 182 | 250 | ||||||||||||
| Other (income) expense | — | (16) | 2 | — | (14) | ||||||||||||
| Results from operating activities | 1,185 | 473 | 239 | (173) | 1,724 | ||||||||||||
| Net finance costs | 22 | 6 | 8 | 314 | 350 | ||||||||||||
| Earnings (loss) before tax | 1,163 | 467 | 231 | (487) | 1,374 | ||||||||||||
| Income tax expense | — | — | — | — | 296 | ||||||||||||
| Earnings (loss) | 1,163 | 467 | 231 | (487) | 1,078 | ||||||||||||
| Capital expenditures | 313 | 77 | 7 | 32 | 429 | ||||||||||||
| Contributions to equity accounted investees | 1 | 33 | 35 | — | 69 | ||||||||||||
(1) Pipelines revenue includes $360 million (2023: $217 million) associated with U.S. pipeline revenue.
(2) Marketing & New Ventures includes revenue of $535 million (2023: $140 million) associated with U.S. midstream sales.
(3) During the nine months ended September 30, 2024 and 2023, no one customer accounted for 10 percent or more of total revenues reported throughout all segments.
(4) Comparative 2023 period has been adjusted. See Note 2 Changes in Accounting Policies.
Pembina Pipeline Corporation Third Quarter 2024 53
5. PROPERTY, PLANT AND EQUIPMENT
| ($ millions) | Land and Land Rights | Pipelines | Facilities and Equipment | Cavern Storage and Other(1) | Assets Under Construction | Total | ||||||||||||||
| Cost | ||||||||||||||||||||
| Balance at December 31, 2023 | 480 | 9,613 | 7,048 | 2,027 | 588 | 19,756 | ||||||||||||||
| Additions and transfers | 3 | 335 | 159 | 93 | 99 | 689 | ||||||||||||||
| Change in decommissioning provision | — | 4 | 8 | 2 | — | 14 | ||||||||||||||
Acquisition (Note 3) | 197 | 4,547 | 1,501 | 43 | 57 | 6,345 | ||||||||||||||
| Dispositions, foreign exchange and other | (1) | (20) | 11 | (86) | (3) | (99) | ||||||||||||||
| Balance at September 30, 2024 | 679 | 14,479 | 8,727 | 2,079 | 741 | 26,705 | ||||||||||||||
| Depreciation | ||||||||||||||||||||
| Balance at December 31, 2023 | 38 | 2,083 | 1,316 | 521 | — | 3,958 | ||||||||||||||
| Depreciation | 6 | 195 | 188 | 67 | — | 456 | ||||||||||||||
| Dispositions and other | — | (10) | 21 | (59) | — | (48) | ||||||||||||||
| Balance at September 30, 2024 | 44 | 2,268 | 1,525 | 529 | — | 4,366 | ||||||||||||||
| Carrying amounts | ||||||||||||||||||||
| Balance at December 31, 2023 | 442 | 7,530 | 5,732 | 1,506 | 588 | 15,798 | ||||||||||||||
| Balance at September 30, 2024 | 635 | 12,211 | 7,202 | 1,550 | 741 | 22,339 | ||||||||||||||
(1) At September 30, 2024, the movement in Cavern Storage and Other includes nil in net assets transferred to finance lease receivables (December 31, 2023: $25 million).
6. INTANGIBLE ASSETS AND GOODWILL
| Intangible Assets | ||||||||||||||||||||
| ($ millions) | Goodwill | Purchase and Sale Contracts and Other | Customer Relationships | Total | Total Goodwill & Intangible Assets | |||||||||||||||
| Cost | ||||||||||||||||||||
| Balance at December 31, 2023 | 4,551 | 296 | 1,826 | 2,122 | 6,673 | |||||||||||||||
| Additions | — | 19 | 26 | 45 | 45 | |||||||||||||||
Acquisition (Note 3) | 805 | — | — | — | 805 | |||||||||||||||
Dispositions and other (Note 3) | (380) | — | (38) | (38) | (418) | |||||||||||||||
| Foreign exchange adjustments | 1 | — | 13 | 13 | 14 | |||||||||||||||
| Balance at September 30, 2024 | 4,977 | 315 | 1,827 | 2,142 | 7,119 | |||||||||||||||
| Amortization | ||||||||||||||||||||
| Balance at December 31, 2023 | — | 48 | 560 | 608 | 608 | |||||||||||||||
| Amortization | — | 12 | 75 | 87 | 87 | |||||||||||||||
| Dispositions and other | — | — | (37) | (37) | (37) | |||||||||||||||
| Balance at September 30, 2024 | — | 60 | 598 | 658 | 658 | |||||||||||||||
| Carrying amounts | ||||||||||||||||||||
| Balance at December 31, 2023 | 4,551 | 248 | 1,266 | 1,514 | 6,065 | |||||||||||||||
| Balance at September 30, 2024 | 4,977 | 255 | 1,229 | 1,484 | 6,461 | |||||||||||||||
54 Pembina Pipeline Corporation Third Quarter 2024
7. INVESTMENTS IN EQUITY ACCOUNTED INVESTEES
Ownership Interest (percent) | Share of Profit from Equity Accounted Investees | Investments in Equity Accounted Investees | ||||||||||||||||||
| 9 Months Ended September 30 | ||||||||||||||||||||
| ($ millions) | September 30, 2024 | December 31, 2023 | 2024 | 2023 | September 30, 2024 | December 31, 2023 | ||||||||||||||
Alliance | 100 | 50 | 42 | 78 | — | 2,427 | ||||||||||||||
Aux Sable | 100 | 42.7 - 50 | 33 | (32) | — | 362 | ||||||||||||||
| PGI | 60 | 60 | 169 | 180 | 3,808 | 3,894 | ||||||||||||||
| Cedar LNG | 49.9 | 49.9 | (52) | (8) | 357 | 202 | ||||||||||||||
Other(1) | 50 - 75 | 50 - 75 | 3 | 4 | 98 | 102 | ||||||||||||||
| 195 | 222 | 4,263 | 6,987 | |||||||||||||||||
(1) Other includes Pembina's interest in CKPC, Grand Valley, Fort Corp, and ACG. On December 31, 2023, CKPC was dissolved.
On April 1, 2024, Pembina completed its acquisition of Enbridge's interests in the Alliance, Aux Sable, and NRGreen joint ventures. On August 1, 2024, Pembina acquired the remaining non-controlling interest in Aux Sable's U.S. operations. As a result, Pembina now holds 100 percent equity ownership in all Alliance, Aux Sable, and NRGreen businesses. Refer to Note 3 for further information.
At September 30, 2024, as a result of the Acquisition, Pembina had no investments in equity accounted investees held by entities whose functional currency is the U.S. dollar. Previously recognized foreign exchange gains and losses are included in other comprehensive income. For the three months ended September 30, 2024, there was no foreign exchange gain or loss recognized by Pembina, and for the nine months ended September 30, 2024, Pembina recorded a gain of $38 million (2023: gain of $40 million and $4 million).
Financing Activities for Equity Accounted Investees
Cedar LNG
On June 25, 2024, Pembina and its partner, the Haisla Nation, announced a positive Final Investment Decision ("FID") on the Cedar LNG Project (the "Project"), a floating liquefied natural gas facility to be located in Kitimat, British Columbia. Cedar LNG expects to use asset-level funding to finance approximately 60 percent of the Project's costs with the remaining 40 percent of the Project's costs expected to be financed through equity contributions from both partners.
In advance of the positive FID, various financing arrangements were established between Pembina, the Haisla Nation, and Cedar LNG, to ensure the joint venture had sufficient and adequate cash-flow for all necessary pre-FID activities. As a result of the positive FID, various provisions within these financing arrangements were triggered, whereby Pembina became entitled to either (a) returns of pre-FID contributions; or (b) principal and interest relating to lending arrangements that had been established.
During the first six months of 2024, Pembina made total pre-FID cash payments of $446 million to Cedar LNG, with $241 million as Pembina's equity contributions and $205 million recognized as a loan receivable from its partner. Following the positive FID, Pembina received full repayment of the loan receivable including accrued interest. In addition, Pembina received $63 million in equity distributions from Cedar LNG as a return of pre-FID capital that had been provided on behalf of its partner or in support of other pre-FID commitments. On FID, Pembina also recognized a liability for amounts previously recorded as a provision for contingent consideration on acquisition of Cedar LNG in 2021.
Prior to the positive FID, various letters of credit and other parental guarantees were issued by Pembina on behalf of Cedar LNG, which had given rise to an insurance contract liability on Pembina's financial statements. Following the positive FID, the required financial assurances were assumed by Cedar LNG and a gain on derecognition of $34 million was recorded in Pembina's earnings in the second quarter of 2024. This included $102 million in letters of credit previously issued by Pembina and assumed by Cedar in July 2024. Cedar LNG has secured a letter of credit facility whereby future financial assurances will be provided directly by Cedar LNG.
Pembina Pipeline Corporation Third Quarter 2024 55
In connection with the positive FID, Cedar LNG entered into project financing including a U.S. $2.7 billion senior secured construction/term loan facility ("Cedar Term Loan") and a $2.6 billion senior secured revolving credit facility ("Cedar Revolving Facility"). The borrowings on the Cedar Term Loan will be used to finance approximately 60 percent of the Project's costs. The Cedar Revolving Facility will be utilized to provide various letters of credit in support of the Project, including replacing the financial assurances previously issued by Pembina on behalf of Cedar.
Further, during the third quarter of 2024, Cedar LNG also entered into a series of economic interest rate hedges. These hedges, at a weighted average effective rate of 3.84 percent, fix a minimum of 75 percent of Cedar LNG's senior secured debt instruments. The floating debt is priced at USD Secured Overnight Financing Rate ("SOFR").
PGI Goodwill Impairment Testing
At each reporting date, Pembina determines whether there is objective evidence that its equity accounted investments are impaired. For the period ended September 30, 2024, it was determined that there is no objective evidence indicating that Pembina's equity accounted investments are impaired. Pembina's assessment of whether there is objective evidence the equity accounted investment in PGI is impaired requires significant judgment as it is sensitive to a decrease in PGI's projected cash flows, a decrease in the long-term growth rate, or an increase in the after-tax discount rate; any of which could be objective evidence that Pembina's equity accounted investment in PGI is impaired. Pembina also believes an impairment loss recognized by PGI as a result of its annual goodwill impairment test would provide objective evidence that Pembina's equity accounted investment in PGI is impaired.
PGI performed its annual goodwill impairment test in the third quarter of 2024 calculating the recoverable amount based on the fair value less cost to sell. No impairment loss was recognized.
There is measurement uncertainty associated with PGI's annual impairment test. The key assumptions used by PGI that impact the recoverable amount were the projected cash flows for the remaining useful life of the assets, the after-tax discount rate and the long-term growth rate. The following table provides sensitivities to reasonably possible changes in each estimate that could result in an impairment of PGI's goodwill.
| Actual | Change required for impairment (percent) | |||||||
| Key assumptions used | ||||||||
Average annual pre-tax cash flow ($ millions)(1) | 1,232 | 6.0 | ||||||
After-tax discount rate (percent) | 7.6 | 0.6 | ||||||
Long-term growth rate (percent) | 1.4 | 0.7 | ||||||
(1) Average annual forecasted pre-tax cash flows represent 100 percent of PGI's forecasted cash flows.
56 Pembina Pipeline Corporation Third Quarter 2024
8. LONG-TERM DEBT
This note provides information about the contractual terms of Pembina's interest-bearing long-term debt, which is measured at amortized cost.
Carrying Value, Terms and Conditions, and Debt Maturity Schedule
Carrying Value | |||||||||||||||||
($ millions) | Authorized at September 30, 2024 | Nominal Interest Rate | Year of Maturity | September 30, 2024 | December 31, 2023 | ||||||||||||
| Variable rate debt | |||||||||||||||||
Senior unsecured credit facilities(1)(2)(3)(4) | 3,627 | 6.11(5) | Various(1)(2) | 1,066 | 778 | ||||||||||||
| Fixed rate debt | |||||||||||||||||
| Senior unsecured medium-term notes series 3 | 450 | 4.75 | 2043 | 450 | 450 | ||||||||||||
| Senior unsecured medium-term notes series 4 | 600 | 4.81 | 2044 | 600 | 600 | ||||||||||||
| Senior unsecured medium-term notes series 5 | 550 | 3.54 | 2025 | 550 | 550 | ||||||||||||
| Senior unsecured medium-term notes series 6 | 600 | 4.24 | 2027 | 600 | 600 | ||||||||||||
| Senior unsecured medium-term notes series 7 | 600 | 3.71 | 2026 | 600 | 600 | ||||||||||||
| Senior unsecured medium-term notes series 8 | — | 2.99 | 2024 | — | 650 | ||||||||||||
| Senior unsecured medium-term notes series 9 | 550 | 4.74 | 2047 | 550 | 550 | ||||||||||||
| Senior unsecured medium-term notes series 10 | 650 | 4.02 | 2028 | 650 | 650 | ||||||||||||
| Senior unsecured medium-term notes series 11 | 800 | 4.75 | 2048 | 800 | 800 | ||||||||||||
| Senior unsecured medium-term notes series 12 | 650 | 3.62 | 2029 | 650 | 650 | ||||||||||||
| Senior unsecured medium-term notes series 13 | 700 | 4.54 | 2049 | 700 | 700 | ||||||||||||
| Senior unsecured medium-term notes series 15 | 600 | 3.31 | 2030 | 600 | 600 | ||||||||||||
| Senior unsecured medium-term notes series 16 | 400 | 4.67 | 2050 | 400 | 400 | ||||||||||||
| Senior unsecured medium-term notes series 17 | 500 | 3.53 | 2031 | 500 | 500 | ||||||||||||
| Senior unsecured medium-term notes series 18 | 500 | 4.49 | 2051 | 500 | 500 | ||||||||||||
| Senior unsecured medium-term notes series 19 | 150 | 5.72 | 2026 | 150 | 300 | ||||||||||||
| Senior unsecured medium-term notes series 20 | 750 | 5.02 | 2032 | 750 | — | ||||||||||||
| Senior unsecured medium-term notes series 21 | 600 | 5.21 | 2034 | 600 | — | ||||||||||||
| Senior unsecured medium-term notes series 22 | 750 | 5.67 | 2054 | 750 | — | ||||||||||||
| Senior unsecured medium-term notes series 23 | 650 | 5.22 | 2033 | 650 | — | ||||||||||||
| Total fixed rate loans and borrowings outstanding | 11,050 | 9,100 | |||||||||||||||
| Deferred financing costs | 12 | 25 | |||||||||||||||
| Total loans and borrowings | 12,128 | 9,903 | |||||||||||||||
| Less current portion loans and borrowings | (946) | (650) | |||||||||||||||
| Total non-current loans and borrowings | 11,182 | 9,253 | |||||||||||||||
| Subordinated hybrid notes | |||||||||||||||||
| Subordinated notes, series 1 | 600 | 4.80 | 2081 | 596 | 596 | ||||||||||||
(1) Pembina's unsecured credit facilities include a $1.5 billion revolving facility that matures in June 2029, a $1.0 billion sustainability linked revolving facility that matures in June 2027, a U.S. $250 million non-revolving term loan that matures in May 2025 and a $50 million operating facility that matures in June 2025, which is typically renewed on an annual basis.
(2) Alliance's unsecured credit facilities include a $315 million term loan, and a U.S. $250 million term loan, both of which primarily mature in December 2025. Aux Sable's unsecured credit facilities include a U.S. $20 million revolving credit facility and a U.S. $45 million revolving credit facility, both of which mature in December 2024.
(3) Includes U.S. $250 million variable rate debt outstanding at September 30, 2024 (2023: U.S. $250 million), with the full notional amount hedged using an interest rate swap at 1.47 percent.
(4) The U.S. dollar denominated non-revolving term loan is designated as a hedge of the Company's net investment in selected foreign operations with a U.S. dollar functional currency.
(5) The nominal interest rate is the weighted average of all drawn credit facilities based on Pembina's credit rating at September 30, 2024. Borrowings under the credit facilities bear interest at prime, CORRA or SOFR rates, plus applicable margins. The impact of interest rate hedges described in the footnote above are not reflected in this figure.
Pembina Pipeline Corporation Third Quarter 2024 57
On January 12, 2024, Pembina closed an offering of $1.8 billion aggregate principal amount of senior unsecured medium-term notes (the "January MTN Offering"). The January MTN Offering was conducted in three tranches, consisting of the issuance of $600 million aggregate principal amount of senior unsecured medium-term notes, series 20 (the "Series 20 notes"), having a fixed coupon of 5.02 percent per annum, payable semi-annually and maturing on January 12, 2032; $600 million aggregate principal amount of senior unsecured medium-term notes, series 21, having a fixed coupon of 5.21 percent per annum, payable semi-annually and maturing on January 12, 2034; and $600 million aggregate principal amount of senior unsecured medium-term notes, series 22 (the "Series 22 notes"), having a fixed coupon of 5.67 percent per annum, payable semi-annually and maturing on January 12, 2054.
Pembina used a portion of the net proceeds of the January MTN Offering to repay indebtedness of the Company under the Revolving Facility and for general corporate purposes. Pembina used the remaining net proceeds of the January MTN Offering to fund a portion of the purchase price for the Acquisition.
On January 22, 2024, Pembina's $650 million aggregate principal amount of senior unsecured medium-term notes, series 8, matured and were fully repaid.
On April 18, 2024, Pembina completed an extension on its $1.5 billion Revolving Facility, which now matures on June 1, 2029, and an extension on its $50 million operating facility, which now matures on June 1, 2025.
On June 28, 2024, Pembina closed an offering of $950 million aggregate principal amount of senior unsecured medium-term notes (the "June MTN Offering"). The June MTN Offering was conducted in three tranches, consisting of the issuance of $650 million aggregate principal amount of senior unsecured medium-term notes, series 23 (the "Series 23 notes") having a fixed coupon of 5.22 percent per annum, paid semi-annually, and maturing on June 28, 2033; $150 million aggregate principal amount issued through a re-opening of the Series 20 notes; and $150 million aggregate principal amount issued through a re-opening of the Series 22 notes. The net proceeds of the June MTN Offering were used to repay indebtedness of the Company under the Revolving Facility, to fund the partial redemption of the Series 19 notes (as defined below), and for general corporate purposes.
Effective July 6, 2024, Pembina completed the redemption of $150 million aggregate principal amount of its outstanding $300 million aggregate principal amount of senior unsecured medium-term notes, series 19 (the "Series 19 notes") due June 22, 2026 for cash. The Series 19 notes were redeemed at a redemption price of approximately $1,002 for each $1,000 principal amount of Series 19 notes, being equal to the outstanding principal amount, plus accrued but unpaid interest up until, but excluding, July 6, 2024. Pembina funded the redemption of the Series 19 notes through a portion of the net proceeds of the June MTN Offering.
Covenants
Pembina is subject to certain financial covenants under its medium-term note indentures and credit facilities agreements and complies with all financial covenants as of September 30, 2024. Pembina's financial covenants under the indenture governing its medium-term notes and the agreements governing the credit facilities include the following:
| Debt | Financial Covenant(1) | Ratio | ||||||||||||
| Senior unsecured medium-term notes | Funded Debt to Capitalization | Maximum 0.70(2) | ||||||||||||
| Credit facilities | Debt to Capital | Maximum 0.70(3) | ||||||||||||
(1) Terms as defined in relevant agreements.
(2) Covenant must be met at the reporting date and filed within 90 days after the end of each fiscal year and within 10 business days after filing of the Consolidated Financial Statements.
(3) Covenant must be met at the reporting date and filed within 120 days after the end of each fiscal year and 60 days after each quarter.
58 Pembina Pipeline Corporation Third Quarter 2024
9. SHARE CAPITAL
Common Share Capital
| ($ millions, except as noted) | Number of Common Shares (millions) | Common Share Capital | ||||||
| Balance at December 31, 2023 | 549 | 15,765 | ||||||
| Issued in connection with subscription receipts conversion, net of issue costs | 30 | 1,230 | ||||||
Share-based payment transactions(1) | 1 | 11 | ||||||
| Balance at September 30, 2024 | 580 | 17,006 | ||||||
(1) Exercised options are settled by issuing the net number of common shares equivalent to the gain upon exercise.
Subscription Receipts
In connection with the Acquisition, on December 19, 2023, Pembina closed its offering of 29.9 million subscription receipts (including 3.9 million subscription receipts issued pursuant to the exercise in full by the underwriters for the offering of the over-allotment option granted to them by Pembina) at a price of $42.85 per subscription receipt for total gross proceeds of $1.3 billion (the "Subscription Receipt Offering").
Pursuant to the terms of the subscription receipts, on March 28, 2024, a payment of $0.6675 per subscription receipt (a "Dividend Equivalent Payment") was made to the holders of subscription receipts of record as of March 15, 2024. The amount of the Dividend Equivalent Payment was equivalent to the dividend paid per common share on the same date to the holders of common shares.
After accounting for the Dividend Equivalent Payment, the underwriter fees, other expenses, and interest income related to the Subscription Receipt Offering, net proceeds were $1.2 billion. The net proceeds of the Subscription Receipt Offering were received by Pembina on March 27, 2024 and were used to fund a portion of the purchase price of the Acquisition which closed on April 1, 2024. Concurrent with the closing of the Acquisition, each holder of subscription receipts received, automatically and without additional consideration or further action on the part of the holder, one common share of the Company.
Share Repurchase Program
On May 13, 2024, the Toronto Stock Exchange ("TSX") accepted the renewal of Pembina's normal course issuer bid (the "NCIB") that allowed the Company to repurchase, at its discretion, up to five percent of the Company's outstanding common shares (representing approximately 29 million common shares) through the facilities of the TSX, the New York Stock Exchange and/or alternative Canadian trading systems or as otherwise permitted by applicable securities law, subject to certain restrictions on the number of common shares that may be purchased on a single day. The NCIB commenced on May 16, 2024 and will expire on the earlier of May 15, 2025 and the date on which Pembina has acquired the maximum number of common shares allowable under the NCIB or the date on which Pembina otherwise decides not to make any further repurchases under the NCIB. No common shares were purchased by Pembina during the three and nine months ended September 30, 2024.
Preferred Share Capital
| ($ millions, except as noted) | Number of Preferred Shares (millions) | Preferred Share Capital | ||||||
| Balance at December 31, 2023 | 93 | 2,199 | ||||||
| Part VI.1 tax | — | (7) | ||||||
| Balance at September 30, 2024 | 93 | 2,192 | ||||||
On February 15, 2024, Pembina announced that none of the six million Cumulative Redeemable Rate Reset Class A Preferred Shares, Series 3 ("Series 3 Class A Preferred Shares") outstanding were converted into Cumulative Redeemable Floating Rate Class A Preferred Shares, Series 4. The annual dividend rate for the Series 3 Class A Preferred Shares for the five-year period from and including March 1, 2024 to, but excluding, March 1, 2029 will be 6.019 percent.
Pembina Pipeline Corporation Third Quarter 2024 59
On March 18, 2024, Pembina announced that none of the six million Cumulative Redeemable Rate Reset Class A Preferred Shares, Series 17 ("Series 17 Class A Preferred Shares") outstanding were converted into Cumulative Redeemable Floating Rate Class A Preferred Shares, Series 18. The annual dividend rate for the Series 17 Class A Preferred Shares for the five-year period from and including March 31, 2024 to, but excluding, March 31, 2029 will be 6.605 percent.
On May 17, 2024, Pembina announced that none of the ten million Cumulative Redeemable Rate Reset Class A Preferred Shares, Series 5 ("Series 5 Class A Preferred Shares") outstanding were converted into Cumulative Redeemable Floating Rate Class A Preferred Shares, Series 6. The annual dividend rate for the Series 5 Class A Preferred Shares for the five-year period from and including June 1, 2024 to, but excluding, June 1, 2029 will be 6.814 percent.
Dividends
The following dividends were declared and paid by Pembina:
| 9 Months Ended September 30 | ||||||||
| ($ millions) | 2024 | 2023 | ||||||
| Common shares | ||||||||
$2.05 per common share (2023: $1.99) | 1,168 | 1,092 | ||||||
| Class A preferred shares | ||||||||
$1.22 per Series 1 Class A Preferred Share (2023: $0.92) | 12 | 9 | ||||||
$1.03 per Series 3 Class A Preferred Share (2023: $0.84) | 6 | 5 | ||||||
$1.00 per Series 5 Class A Preferred Share (2023: $0.85) | 10 | 9 | ||||||
$0.82 per Series 7 Class A Preferred Share (2023: $0.82) | 8 | 8 | ||||||
$0.81 per Series 9 Class A Preferred Share (2023: $0.80) | 7 | 7 | ||||||
$1.16 per Series 15 Class A Preferred Share (2023: $1.16) | 9 | 10 | ||||||
$1.13 per Series 17 Class A Preferred Share (2023: $0.90) | 7 | 5 | ||||||
$0.88 per Series 19 Class A Preferred Share (2023: $0.88) | 7 | 7 | ||||||
$1.18 per Series 21 Class A Preferred Share (2023: $1.09) | 18 | 17 | ||||||
$1.56 per Series 22 Class A Preferred Share (2023: $0.97) | 2 | 1 | ||||||
$1.22 per Series 25 Class A Preferred Share (2023: $1.14) | 12 | 12 | ||||||
| 98 | 90 | |||||||
On November 5, 2024, Pembina announced that its Board of Directors had declared a common share cash dividend for the fourth quarter of 2024 of $0.69 per share to be paid on December 31, 2024, to shareholders of record on December 16, 2024.
Pembina's Board of Directors also declared quarterly dividends for Pembina's Class A preferred shares on July 9, 2024 as outlined in the following table:
| Series | Record Date | Payable Date | Per Share Amount | Dividend Amount ($ millions) | ||||||||||
| Series 1 | November 1, 2024 | December 2, 2024 | $0.407813 | 4 | ||||||||||
| Series 3 | November 1, 2024 | December 2, 2024 | $0.376188 | 2 | ||||||||||
| Series 5 | November 1, 2024 | December 2, 2024 | $0.425875 | 4 | ||||||||||
| Series 7 | November 1, 2024 | December 2, 2024 | $0.273750 | 3 | ||||||||||
| Series 9 | November 1, 2024 | December 2, 2024 | $0.268875 | 2 | ||||||||||
| Series 15 | December 16, 2024 | December 31, 2024 | $0.385250 | 3 | ||||||||||
| Series 17 | December 16, 2024 | December 31, 2024 | $0.412813 | 3 | ||||||||||
| Series 19 | December 16, 2024 | December 31, 2024 | $0.292750 | 2 | ||||||||||
| Series 21 | November 1, 2024 | December 2, 2024 | $0.393875 | 6 | ||||||||||
| Series 22 | November 1, 2024 | December 2, 2024 | $0.476693 | 1 | ||||||||||
| Series 25 | October 31, 2024 | November 15, 2024 | $0.405063 | 4 | ||||||||||
60 Pembina Pipeline Corporation Third Quarter 2024
10. REVENUE
Revenue has been disaggregated into categories to reflect how the nature, timing and uncertainty of revenue and cash flows are affected by economic factors.
a.Revenue Disaggregation
| 2024 | 2023 | |||||||||||||||||||||||||||||||
| 3 Months Ended September 30 | Pipelines | Facilities | Marketing & New Ventures | Corporate | Total | Pipelines | Facilities | Marketing & New Ventures | Corporate | Total | ||||||||||||||||||||||
| ($ millions) | ||||||||||||||||||||||||||||||||
Take-or-pay(1) | 634 | 44 | 3 | — | 681 | 499 | 57 | — | — | 556 | ||||||||||||||||||||||
Fee-for-service(1) | 121 | 21 | 37 | — | 179 | 116 | 24 | 28 | — | 168 | ||||||||||||||||||||||
Product sales(2)(3) | — | — | 804 | — | 804 | — | — | 634 | — | 634 | ||||||||||||||||||||||
| Revenue from contracts with customers | 755 | 65 | 844 | — | 1,664 | 615 | 81 | 662 | — | 1,358 | ||||||||||||||||||||||
| Realized gain from derivative instruments | — | — | 70 | — | 70 | — | — | 91 | — | 91 | ||||||||||||||||||||||
| Unrealized gain (loss) from derivative instruments | — | — | 18 | — | 18 | — | — | (78) | — | (78) | ||||||||||||||||||||||
Revenue from risk management and physical derivative contracts(3) | — | — | 88 | — | 88 | — | — | 13 | — | 13 | ||||||||||||||||||||||
| Lease income | 54 | 14 | 3 | — | 71 | 59 | 8 | — | — | 67 | ||||||||||||||||||||||
Shared service revenue(4) and other | 1 | 7 | 2 | 11 | 21 | 1 | 3 | — | 13 | 17 | ||||||||||||||||||||||
| Total external revenue | 810 | 86 | 937 | 11 | 1,844 | 675 | 92 | 675 | 13 | 1,455 | ||||||||||||||||||||||
| 2024 | 2023 | |||||||||||||||||||||||||||||||||||||
| 9 Months Ended September 30 | Pipelines | Facilities | Marketing & New Ventures | Total | Pipelines | Facilities | Marketing & New Ventures | Corporate | Total | |||||||||||||||||||||||||||||
($ millions) | Corporate | |||||||||||||||||||||||||||||||||||||
Take-or-pay(1) | 1,723 | 155 | 3 | — | 1,881 | 1,328 | 228 | — | — | 1,556 | ||||||||||||||||||||||||||||
Fee-for-service(1) | 382 | 56 | 94 | — | 532 | 348 | 81 | 28 | — | 457 | ||||||||||||||||||||||||||||
Product sales(2)(3) | — | — | 2,497 | — | 2,497 | — | — | 2,064 | — | 2,064 | ||||||||||||||||||||||||||||
| Revenue from contracts with customers | 2,105 | 211 | 2,594 | — | 4,910 | 1,676 | 309 | 2,092 | — | 4,077 | ||||||||||||||||||||||||||||
| Realized gain from derivative instruments | — | — | 189 | — | 189 | — | — | 249 | — | 249 | ||||||||||||||||||||||||||||
| Unrealized loss from derivative instruments | — | — | (129) | — | (129) | — | — | (78) | — | (78) | ||||||||||||||||||||||||||||
Revenue from risk management and physical derivative contracts(3) | — | — | 60 | — | 60 | — | — | 171 | — | 171 | ||||||||||||||||||||||||||||
| Lease income | 170 | 29 | 3 | — | 202 | 170 | 28 | — | — | 198 | ||||||||||||||||||||||||||||
Shared service revenue(4) and other | 10 | 19 | 4 | 34 | 67 | 5 | 9 | — | 35 | 49 | ||||||||||||||||||||||||||||
| Total external revenue | 2,285 | 259 | 2,661 | 34 | 5,239 | 1,851 | 346 | 2,263 | 35 | 4,495 | ||||||||||||||||||||||||||||
(1) Revenue recognized over time.
(2) Revenue recognized at a point in time.
(3) Comparative 2023 period has been adjusted. See Note 2 Changes in Accounting Policies.
(4) Includes $14 million for the three months ended September 30, 2024 (2023: $16 million) and $44 million for the nine months ended September 30, 2024 (2023: $48 million) for fixed fee income related to shared service agreements with joint ventures.
Pembina Pipeline Corporation Third Quarter 2024 61
b.Contract Liabilities
Significant changes in the contract liabilities balances during the period are as follows:
| 9 Months Ended September 30, 2024 | 12 Months Ended December 31, 2023 | |||||||||||||||||||
($ millions) | Take-or-Pay | Other Contract Liabilities | Total Contract Liabilities | Take-or-Pay | Other Contract Liabilities | Total Contract Liabilities | ||||||||||||||
| Opening balance | 1 | 158 | 159 | 3 | 191 | 194 | ||||||||||||||
Additions (net in the period) | 10 | 47 | 57 | (2) | 21 | 19 | ||||||||||||||
| Acquisition | — | 163 | 163 | — | — | — | ||||||||||||||
Revenue recognized from contract liabilities(1) | — | (28) | (28) | — | (54) | (54) | ||||||||||||||
| Disposition | — | (10) | (10) | — | — | — | ||||||||||||||
Closing balance | 11 | 330 | 341 | 1 | 158 | 159 | ||||||||||||||
Less current portion(2) | (11) | (52) | (63) | (1) | (32) | (33) | ||||||||||||||
| Ending balance | — | 278 | 278 | — | 126 | 126 | ||||||||||||||
(1) Recognition of revenue related to performance obligations satisfied in the current period that were included in the opening balance of contract liabilities.
(2) Represents cash collected under take-or-pay contracts which will be recognized within one year as the customer chooses to ship, process, or otherwise forego the associated service.
Contract liabilities depict Pembina's obligation to perform services in the future for cash and non-cash consideration which have been received from customers. Contract liabilities include up-front payments or non-cash consideration received from customers for future transportation, gas processing, terminalling, and storage services. Contract liabilities also include consideration received from customers for take-or-pay commitments where the customer has a make-up right to ship or process future volumes under a firm contract. These amounts are non-refundable should the customer not use its make-up rights. In all instances where goods or services have been transferred to a customer in advance of the receipt of customer consideration, Pembina's right to consideration is unconditional and has therefore been presented as a receivable.
c.Revenue Allocated to Remaining Performance Obligations
Pembina expects to recognize revenue in future periods that includes current unsatisfied remaining performance obligations. As a result of the Acquisition, Pembina's unsatisfied remaining performance obligations and expected revenue recognition from these obligations as at September 30, 2024 increased by $4.3 billion compared to December 31, 2023.
11. NET FINANCE COSTS
| 3 Months Ended September 30 | 9 Months Ended September 30 | |||||||||||||
($ millions) | 2024 | 2023 | 2024 | 2023 | ||||||||||
| Interest expense on financial liabilities measured at amortized cost: | ||||||||||||||
| Loans and borrowings | 136 | 100 | 380 | 296 | ||||||||||
| Subordinated hybrid notes | 7 | 7 | 22 | 22 | ||||||||||
| Leases | 8 | 8 | 24 | 23 | ||||||||||
| Interest income | (7) | (1) | (45) | (4) | ||||||||||
| Unwinding of discount rate | 5 | 4 | 15 | 12 | ||||||||||
| Loss (gain) in fair value of non-commodity-related derivative financial instruments | — | 10 | — | (11) | ||||||||||
| Foreign exchange losses and other | — | 2 | 2 | 12 | ||||||||||
| Net finance costs | 149 | 130 | 398 | 350 | ||||||||||
62 Pembina Pipeline Corporation Third Quarter 2024
12. ACCUMULATED OTHER COMPREHENSIVE INCOME
| ($ millions) | Currency Translation Reserve | Cash Flow Hedge Reserve | Pension and other Post-Retirement Benefit Plan Adjustments(2) | Total | ||||||||||
| Balance at December 31, 2023 | 211 | 18 | (8) | 221 | ||||||||||
| Other comprehensive gain before hedging activities | 61 | — | — | 61 | ||||||||||
Other comprehensive loss resulting from hedging activities(1) | (9) | (8) | — | (17) | ||||||||||
| Balance at September 30, 2024 | 263 | 10 | (8) | 265 | ||||||||||
(1) Amounts relate to hedges of the Company's net investment in foreign operations (reported in Currency Translation Reserve) and interest rate forward swaps (reported in Cash Flow Hedge Reserve) (Note 13). At September 30, 2024, the other comprehensive loss resulting from hedging activities for interest rate forward swaps includes a realized gain of $13 million that was reclassified to net finance costs.
(2) Pension and other Post-Retirement Benefit Plan Adjustments will not be reclassified into earnings.
13. FINANCIAL INSTRUMENTS & RISK MANAGEMENT
Fair Values
The fair value of financial instruments utilizes a variety of valuation inputs. When measuring fair value, Pembina uses observable market data to the greatest extent possible. Depending on the nature of these valuation inputs, financial instruments are categorized as follows:
a. Level 1
Level 1 fair values are based on inputs that are unadjusted observable quoted prices from active markets for identical assets or liabilities as at the measurement date.
b. Level 2
Level 2 fair values are based on inputs, other than quoted market prices included in Level 1, that are either directly or indirectly observable. Level 2 fair value inputs include quoted forward market prices, time value, and broker quotes that are observable for the duration of the financial instrument's contractual term. These inputs are often adjusted for factors specific to the asset or liability, such as, location differentials and credit risk.
Financial instruments that utilize Level 2 fair valuation inputs, include derivatives arising from physical commodity forward contracts, commodity swaps and options, and forward interest rate and foreign-exchange swaps. In addition, Pembina's loans and borrowings utilize Level 2 fair valuation inputs, whereby the valuation technique is based on discounted future interest and principal payments using the current market interest rates of instruments with similar terms.
c. Level 3
Level 3 fair values utilize inputs that are not based on observable market data. Rather, various valuation techniques are used to develop inputs.
Financial instruments that utilize Level 3 fair valuation inputs include embedded derivative instruments arising from long-term power purchase agreements. The fair value of long-term power purchase agreements is measured using a pricing and cash flow model that accounts for forward power prices, renewable wind power pricing discounts and differentials, and inflationary metrics. The rate used to discount the respective estimated cash flows is a government risk-free interest rate that is adjusted for an appropriate credit spread. The fair valuation of the embedded derivative instruments is judged to be a significant management estimate. These assumptions and inputs are susceptible to change and may differ from actual future developments. This estimation uncertainty could materially impact the quantified fair value; and therefore, the gains and losses on commodity-related derivative financial instruments.
Pembina Pipeline Corporation Third Quarter 2024 63
The carrying values of financial assets and liabilities in relation to their respective fair values, together with their appropriate fair value categorization are illustrated in the table below. Certain other non-derivative financial instruments measured at amortized cost, including cash and cash equivalents, trade receivables and other, trade payables and other, and other liabilities have been excluded since their carrying values are judged to approximate their fair values due to their nature and short maturity. These instruments would be categorized as Level 2 in the fair value hierarchy.
| September 30, 2024 | December 31, 2023 | ||||||||||||||||||||||||||||
Carrying Value | Fair Value | Carrying Value | Fair Value | ||||||||||||||||||||||||||
| ($ millions) | Level 1 | Level 2 | Level 3 | Level 1 | Level 2 | Level 3 | |||||||||||||||||||||||
Financial assets carried at fair value | |||||||||||||||||||||||||||||
Derivative financial instruments(1) | 35 | — | 35 | — | 80 | — | 51 | 29 | |||||||||||||||||||||
Financial liabilities carried at fair value | |||||||||||||||||||||||||||||
Derivative financial instruments(1) | 137 | — | 16 | 121 | 40 | — | 26 | 14 | |||||||||||||||||||||
Contingent consideration(2) | — | — | — | — | 39 | — | — | 39 | |||||||||||||||||||||
Financial liabilities carried at amortized cost | |||||||||||||||||||||||||||||
Long-term debt(3) | 12,724 | — | 12,581 | — | 10,499 | — | 9,989 | — | |||||||||||||||||||||
(1) At September 30, 2024, all derivative financial instruments are carried at fair value through earnings, except for $7 million in interest rate derivative financial assets that have been designated as cash flow hedges (December 31, 2023: $18 million).
(2) Under the terms of the agreements on Pembina's investment in the Cedar LNG Project, Pembina had committed to make additional payments on a positive FID. Following the positive FID outcome in June 2024, the consideration payable is no longer contingent in nature.
(3) Carrying value of current and non-current balances. Includes loans and borrowings and subordinated hybrid notes.
Changes in fair value of the derivative net liabilities classified as Level 3 in the fair value hierarchy were as follows:
| ($ millions) | 2024 | |||||||
Level 3 derivative net asset at January 1 | 15 | |||||||
Loss included in revenue from risk management and physical derivative contracts | (136) | |||||||
Level 3 derivative net liability at September 30 | (121) | |||||||
There were no transfers into or out of Level 3 during the nine months ended September 30, 2024.
Gains and Losses from Derivative Instruments
| 3 Months Ended September 30 | 9 Months Ended September 30 | |||||||||||||
| ($ millions) | 2024 | 2023 | 2024 | 2023 | ||||||||||
| Derivative instruments held at fair value through earnings | ||||||||||||||
| Realized (gain) loss | ||||||||||||||
Commodity-related gain recorded in revenue from risk management and physical derivative contracts(1) | (70) | (91) | (189) | (249) | ||||||||||
| Foreign exchange loss recorded in net finance costs | — | — | — | 13 | ||||||||||
| Unrealized (gain) loss | ||||||||||||||
Commodity-related (gain) loss recorded in revenue from risk management and physical derivative contracts(1) | (18) | 78 | 129 | 78 | ||||||||||
| Foreign exchange loss (gain) recorded in net finance costs | — | 10 | — | (11) | ||||||||||
| Derivative instruments in hedging relationships | ||||||||||||||
Interest rate loss recorded in other comprehensive income(2) | 6 | 2 | 8 | 6 | ||||||||||
(1) Comparative 2023 period has been adjusted. See Note 2 Changes in Accounting Policies.
(2) Unrealized losses or gains for designated cash flow hedges are recognized in impact of hedging activities in the Consolidated Statements of Earnings and Comprehensive Income, with realized losses or gains being reclassified to net finance costs. The movement in other comprehensive income for the three and nine months ended September 30, 2024 includes a realized gain of $4 million and gain of $13 million (2023: $8 million and $16 million realized gain), respectively, that was reclassified to net finance costs. No losses or gains have been recognized in net income relating to discontinued cash flow hedges.
64 Pembina Pipeline Corporation Third Quarter 2024
14. RELATED PARTIES
Pembina enters into transactions with related parties in the normal course of business and all transactions are measured at their exchange amount, unless otherwise noted. Pembina provides management and operational oversight services, on a fixed fee and cost recovery basis, to certain equity accounted investees. Pembina also contracts for services and capacity from certain of its equity accounted investees, advances funds to support operations and provides letters of credit, including financial guarantees.
A summary of the significant related party transactions and balances are as follows:
3 Months Ended September 30 | 9 Months Ended September 30 | |||||||||||||
| ($ millions) | 2024 | 2023 | 2024 | 2023 | ||||||||||
Services provided(1) | ||||||||||||||
| PGI | 43 | 66 | 175 | 194 | ||||||||||
Aux Sable(2) | — | 34 | 32 | 99 | ||||||||||
Alliance(2) | — | 4 | 4 | 11 | ||||||||||
| Cedar LNG | 12 | 4 | 18 | 8 | ||||||||||
Other(3) | — | — | 2 | 1 | ||||||||||
| Total services provided | 55 | 108 | 231 | 313 | ||||||||||
| Services received | ||||||||||||||
| PGI | 2 | 2 | 6 | 10 | ||||||||||
Alliance(2) | — | 3 | 3 | 9 | ||||||||||
| Total services received | 2 | 5 | 9 | 19 | ||||||||||
As at ($ millions) | September 30, 2024 | December 31, 2023 | ||||||||||||
Trade receivables and other(4) | 32 | 36 | ||||||||||||
| Trade payables and other | — | 1 | ||||||||||||
(1) Services provided by Pembina include payments made by Pembina on behalf of related parties.
(2) Prior to the Acquisition, Pembina held a joint control equity interest in Aux Sable and Alliance. As of April 1, 2024, following the completion of the Acquisition, Alliance and Aux Sable became consolidated subsidiaries of Pembina and, as such, are no longer related parties. Refer to Note 3 for more information.
(3) Other includes transactions with Grand Valley and ACG.
(4) As at September 30, 2024, trade receivables and other includes $28 million due from PGI (December 31, 2023: $33 million), and $3 million due from Cedar LNG (December 31, 2023: $2 million).
15. COMMITMENTS AND CONTINGENCIES
Commitments
Pembina was committed for the following amounts under its contracts and arrangements as at September 30, 2024:
Contractual Obligations(1) | Payments Due by Period | ||||||||||||||||
| ($ millions) | Total | Less than 1 year | 1 – 3 years | 3 – 5 years | After 5 years | ||||||||||||
Transportation and processing(2) | 10,744 | 57 | 81 | 440 | 10,166 | ||||||||||||
Construction commitments(3) | 494 | 448 | 46 | — | — | ||||||||||||
Other commitments related to lease contracts(4) | 424 | 43 | 82 | 76 | 223 | ||||||||||||
Funding commitments, software, and other | 51 | 20 | 18 | 11 | 2 | ||||||||||||
Total contractual obligations | 11,713 | 568 | 227 | 527 | 10,391 | ||||||||||||
(1)Pembina enters into product purchase agreements and power purchase agreements to secure supply for future operations. Purchase prices of both NGL and power are dependent on current market prices. Volumes and prices for NGL and power contracts cannot be reasonably determined, and therefore, an amount has not been included in the contractual obligations schedule. Product purchase agreements range from one to eight years and involve the purchase of NGL products from producers. Assuming product is available, Pembina has secured between 16 and 177 mbpd of NGL each year up to and including 2031. Power purchase agreements range from one to 25 years and involve the purchase of power from electrical service providers. Pembina has secured up to 78 megawatts per day each year up to and including 2048.
(2)On April 1, 2024, Pembina signed commercial agreements for 50 percent of Cedar LNG's operating capacity. Pembina plans to reassign its respective capacity prior to the in-service date of the Cedar LNG Project. As a result of having signed these commercial arrangements, as at September 30, 2024, Pembina has disclosed related transportation and processing commitments of approximately $10.5 billion.
(3)Excludes significant projects that are awaiting regulatory approval, projects which Pembina is not committed to construct, and projects that are executed by equity accounted investees.
(4)Relates to expected variable lease payments excluded from the measurements of the lease liability and payments related to non-lease components in lessee lease contracts.
Pembina Pipeline Corporation Third Quarter 2024 65
Commitments to Equity Accounted Investees
Pembina has commitments to provide contributions to certain equity accounted investees based on annual budgets approved by the joint venture partners and contractual agreements.
Contingencies
Pembina, including its subsidiaries and its investments in equity accounted investees, are subject to various legal and regulatory and tax proceedings, actions and audits arising in the normal course of business. Pembina represents its interests vigorously in all proceedings in which it is involved. Legal and administrative proceedings involving possible losses are inherently complex, and the Company applies significant judgment in estimating probable outcomes. As at September 30, 2024, there were no significant claims filed against Pembina for which management believes the resolution of any such actions or proceedings would have a material impact on Pembina's financial position or results of operations.
Letters of Credit
Pembina has provided letters of credit to various third parties in the normal course of conducting business. The letters of credit include financial guarantees to counterparties for product purchases and sales, transportation services, utilities, engineering and construction services. The letters of credit have not had and are not expected to have a material impact on Pembina's financial position, earnings, liquidity or capital resources. As at September 30, 2024, Pembina had $219 million (December 31, 2023: $201 million) in letters of credit issued.
66 Pembina Pipeline Corporation Third Quarter 2024
HEAD OFFICE Pembina Pipeline Corporation Suite 4000, 585 - 8th Avenue SW Calgary, Alberta T2P 1G1 AUDITORS KPMG LLP Chartered Professional Accountants Calgary, Alberta TRUSTEE, REGISTRAR & TRANSFER AGENT Computershare Trust Company of Canada Suite 600, 530 - 8th Avenue SW Calgary, Alberta T2P 3S8 1.800.564.6253 STOCK EXCHANGE Pembina Pipeline Corporation Toronto Stock Exchange listing symbols for: COMMON SHARES PPL PREFERRED SHARES PPL.PR.A, PPL.PR.C, PPL.PR.E, PPL.PR.G, PPL.PR.I, PPL.PR.O, PPL.PR.Q, PPL.PR.S, PPL.PF.A, PPL.PF.B and PPL.PF.E New York Stock Exchange listing symbol for: COMMON SHARES PBA INVESTOR INQUIRIES PHONE 403.231.3156 FAX 403.237.0254 TOLL FREE 1.855.880.7404 EMAIL investor-relations@pembina.com WEBSITE www.pembina.com | |||||

FORM 52-109F2
CERTIFICATION OF INTERIM FILINGS
FULL CERTIFICATE
I, J. Scott Burrows, President and Chief Executive Officer of Pembina Pipeline Corporation, certify the following:
1. Review: I have reviewed the interim financial report and interim MD&A (together, the "interim filings") of Pembina Pipeline Corporation (the "issuer") for the interim period ended September 30, 2024.
2. No misrepresentations: Based on my knowledge, having exercised reasonable diligence, the interim filings do not contain any untrue statement of a material fact or omit to state a material fact required to be stated or that is necessary to make a statement not misleading in light of the circumstances under which it was made, with respect to the period covered by the interim filings.
3. Fair presentation: Based on my knowledge, having exercised reasonable diligence, the interim financial report together with the other financial information included in the interim filings fairly present in all material respects the financial condition, financial performance and cash flows of the issuer, as of the date of and for the periods presented in the interim filings.
4. Responsibility: The issuer's other certifying officer(s) and I are responsible for establishing and maintaining disclosure controls and procedures (DC&P) and internal control over financial reporting (ICFR), as those terms are defined in National Instrument 52-109 Certification of Disclosure in Issuers' Annual and Interim Filings, for the issuer.
5. Design: Subject to the limitations, if any, described in paragraphs 5.2 and 5.3, the issuer's other certifying officer(s) and I have, as at the end of the period covered by the interim filings
(a)designed DC&P, or caused it to be designed under our supervision, to provide reasonable assurance that
(i)material information relating to the issuer is made known to us by others, particularly during the period in which the interim filings are being prepared; and
(ii)information required to be disclosed by the issuer in its annual filings, interim filings or other reports filed or submitted by it under securities legislation is recorded, processed, summarized and reported within the time periods specified in securities legislation; and
(b)designed ICFR, or caused it to be designed under our supervision, to provide reasonable assurance regarding the reliability of financial reporting and the preparation of financial statements for external purposes in accordance with the issuer's GAAP.
5.1 Control framework: The control framework the issuer's other certifying officer(s) and I used to design the issuer's ICFR is Internal Control – Integrated Framework issued by the Committee of Sponsoring Organizations of the Treadway Commission.
5.2 ICFR - material weakness relating to design: N/A
5.3 Limitation on scope of design: The issuer has disclosed in its interim MD&A
(a) the fact that the issuer's other certifying officer(s) and I have limited the scope of our design of ICFR to exclude controls, policies and procedures of
(i) businesses that the issuer acquired not more than 365 days before the last day of the period covered by the interim filings; and
(b) summary financial information about the businesses that the issuer acquired that have been consolidated in the issuer's financial statements.
6. Reporting changes in ICFR: The issuer has disclosed in its interim MD&A any change in the issuer's ICFR that occurred during the period beginning on July 1, 2024 and ended on September 30, 2024 that has materially affected, or is reasonably likely to materially affect, the issuer's ICFR.
Date: November 5, 2024
(signed) "J. Scott Burrows"
J. Scott Burrows
President and Chief Executive Officer
of Pembina Pipeline Corporation
FORM 52-109F2
CERTIFICATION OF INTERIM FILINGS
FULL CERTIFICATE
I, Cameron J. Goldade, Senior Vice President & Chief Financial Officer of Pembina Pipeline Corporation, certify the following:
1. Review: I have reviewed the interim financial report and interim MD&A (together, the "interim filings") of Pembina Pipeline Corporation (the "issuer") for the interim period ended September 30, 2024.
2. No misrepresentations: Based on my knowledge, having exercised reasonable diligence, the interim filings do not contain any untrue statement of a material fact or omit to state a material fact required to be stated or that is necessary to make a statement not misleading in light of the circumstances under which it was made, with respect to the period covered by the interim filings.
3. Fair presentation: Based on my knowledge, having exercised reasonable diligence, the interim financial report together with the other financial information included in the interim filings fairly present in all material respects the financial condition, financial performance and cash flows of the issuer, as of the date of and for the periods presented in the interim filings.
4. Responsibility: The issuer's other certifying officer(s) and I are responsible for establishing and maintaining disclosure controls and procedures (DC&P) and internal control over financial reporting (ICFR), as those terms are defined in National Instrument 52-109 Certification of Disclosure in Issuers' Annual and Interim Filings, for the issuer.
5. Design: Subject to the limitations, if any, described in paragraphs 5.2 and 5.3, the issuer's other certifying officer(s) and I have, as at the end of the period covered by the interim filings
(a)designed DC&P, or caused it to be designed under our supervision, to provide reasonable assurance that
(i)material information relating to the issuer is made known to us by others, particularly during the period in which the interim filings are being prepared; and
(ii)information required to be disclosed by the issuer in its annual filings, interim filings or other reports filed or submitted by it under securities legislation is recorded, processed, summarized and reported within the time periods specified in securities legislation; and
(b)designed ICFR, or caused it to be designed under our supervision, to provide reasonable assurance regarding the reliability of financial reporting and the preparation of financial statements for external purposes in accordance with the issuer's GAAP.
5.1 Control framework: The control framework the issuer's other certifying officer(s) and I used to design the issuer's ICFR is Internal Control – Integrated Framework issued by the Committee of Sponsoring Organizations of the Treadway Commission.
5.2 ICFR - material weakness relating to design: N/A
5.3 Limitation on scope of design: The issuer has disclosed in its interim MD&A
(a) the fact that the issuer's other certifying officer(s) and I have limited the scope of our design of ICFR to exclude controls, policies and procedures of
(i) businesses that the issuer acquired not more than 365 days before the last day of the period covered by the interim filings; and
(b) summary financial information about the businesses that the issuer acquired that have been consolidated in the issuer's financial statements.
6. Reporting changes in ICFR: The issuer has disclosed in its interim MD&A any change in the issuer's ICFR that occurred during the period beginning on July 1, 2024 and ended on September 30, 2024 that has materially affected, or is reasonably likely to materially affect, the issuer's ICFR.
Date: November 5, 2024
(signed) "Cameron J. Goldade"
Cameron J. Goldade
Senior Vice President & Chief Financial Officer
of Pembina Pipeline Corporation