Operator
Hello, and thank you for standing by. Welcome to the Portillo's fourth quarter 2025 conference call and webcast. I would now like to turn the call over to Chris Brandon, Vice President of the Investor Relations at Portillo's to begin.
Thanks, Operator, and good morning, everyone. Welcome to the Portillo's fourth quarter and full year 2025 earnings call. With me today are Mike Miles, Chairman of the Board and Principal Executive Officer, and Michelle Hook, Chief Financial Officer. You can find our 10-K earnings press release and supplemental presentation on investors.portillos.com. Any commentary made here about our future results and business conditions are forward-looking statements, which are based on management's current expectations and are not guarantees of future performance. We do not update these forward-looking statements unless required by law. Our 10-K identifies risk factors that may cause our actual results to vary materially from these forward-looking statements. Today's earnings call will make reference to non-GAAP financial measures, which are not an alternative to GAAP measures. Reconciliations of these non-GAAP measures to their most comparable GAAP counterparts are included in this morning's posted materials. Finally, after we deliver our prepared remarks, we will be happy to take questions from our covering sell-side analysts. And with that, I will turn the call over to Mike.
Thanks, Chris, and good morning. The fourth quarter reflected the strengths and challenges facing Portillo's in 2025. While our core markets continued to have outstanding AUVs and profitability, our Texas market expansion continued to be a headwind for our business. As we announced last fall we have reset our development strategy, slowing new store openings and focusing on healthy unit economics. While it will take time for our new approach to bear fruit and a number of restaurants opening in 2026 reflect prior strategy, our entry into the Atlanta market in the fourth quarter confirms the potential in our future growth strategy. Our restaurant in Kennesaw opened in November and through its first eight weeks registered over $2 million in sales. Portillo's fans drove from all over Metro Atlanta, indeed from all over the southeast, to get a taste of their Portillo's favorites. In addition to the outstanding top line, Kennesaw is the latest example of our reduced-cost Restaurant of the Future 1.0 format, a 6,200-square-foot building that is about 20% smaller than most of the restaurants opened over the prior five years. For our new philosophy of separating new unit openings with more time and distance, the next restaurant in Atlanta will not open until 2027 and will be about 50 miles from Kennesaw. We are gratified and, frankly, not really surprised by the results at Kennesaw. Each time we have entered a new market over the last 10 years, we've seen a similar response, with seven of those restaurants also exceeding $2 million over their first eight weeks. Our approach over the next several years will consist of more of these types of entries, tapping into the pent-up demand from Portillo's fans to support our first-in-market openings, then letting awareness and demand build before opening subsequent restaurants. We will continue to iterate on our prototypes as we look to develop the best possible offering for customers and shareholders with four-wall profit potential driving each decision. our perks program continues to show promise we now have more than two million members enrolled and have seen strong results for promotions delivered through the program we are just scratching the surface and have a lot of opportunity to more precisely target offers i am confident that perks will play a valuable role in driving traffic improvements in 2026 And while traffic and sales continue to be our primary focus, we also took steps to improve labor management and profitability of the lower-volume restaurants in Texas during the fourth quarter. I am also pleased to report, as you likely saw in our announcement two weeks ago, that Brett Patterson has joined Portillo's as our new chief executive officer. Brett has had a stellar career in the restaurant industry, working his way up from the front lines. He has all the qualities that the board was looking for to lead Portillo's next phase of growth, operations experience, a strategic mindset, and a people-first leadership style. Most importantly, he's a great cultural fit with Portillo's. The board and I look forward to working with Brett to provide our customers with the best restaurant experience, our people with a great place to work, and our shareholders with a profitable, growing business. Before I hand it to Michelle, I would like to take a moment to hear to personally thank the board, our executive team, and all of the people at Portillo's for their support and commitment over these last several months. My time as interim CEO has only strengthened my conviction that this brand has a very bright future.
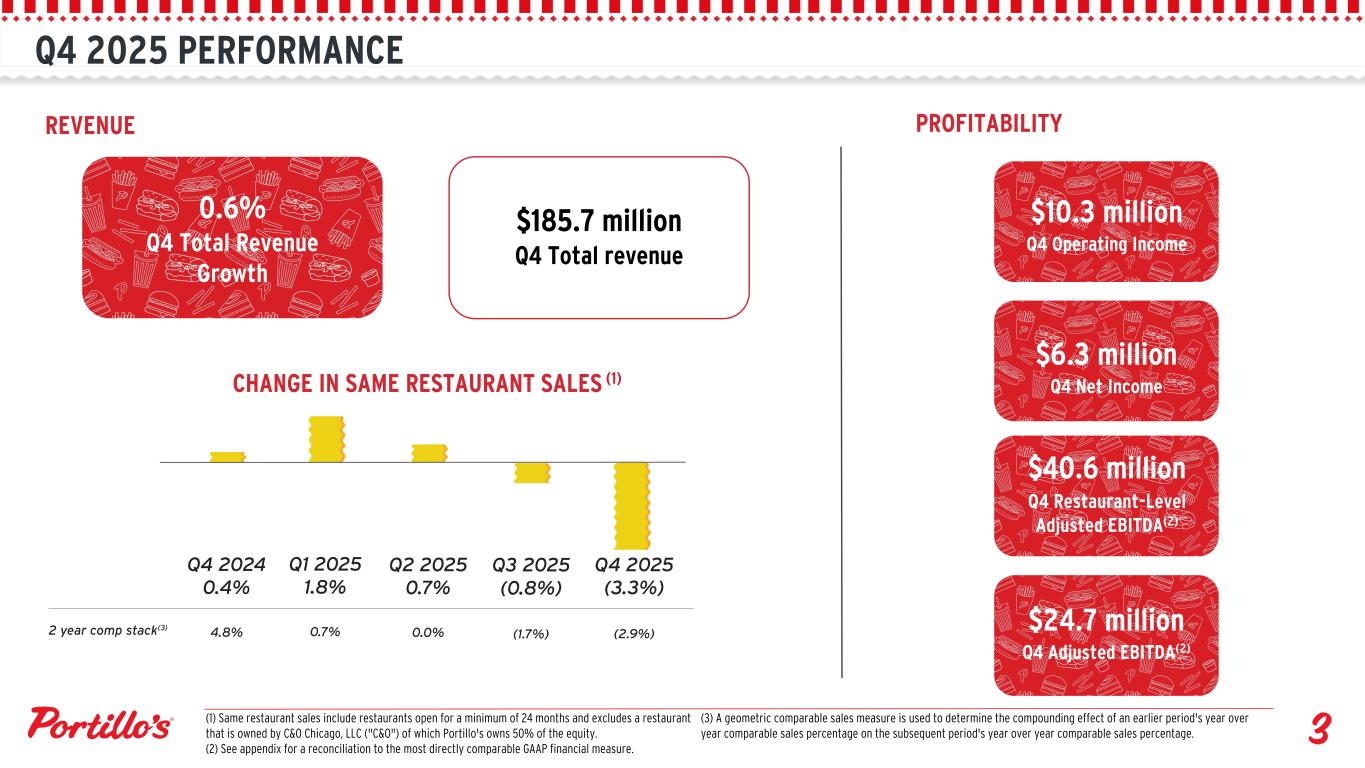
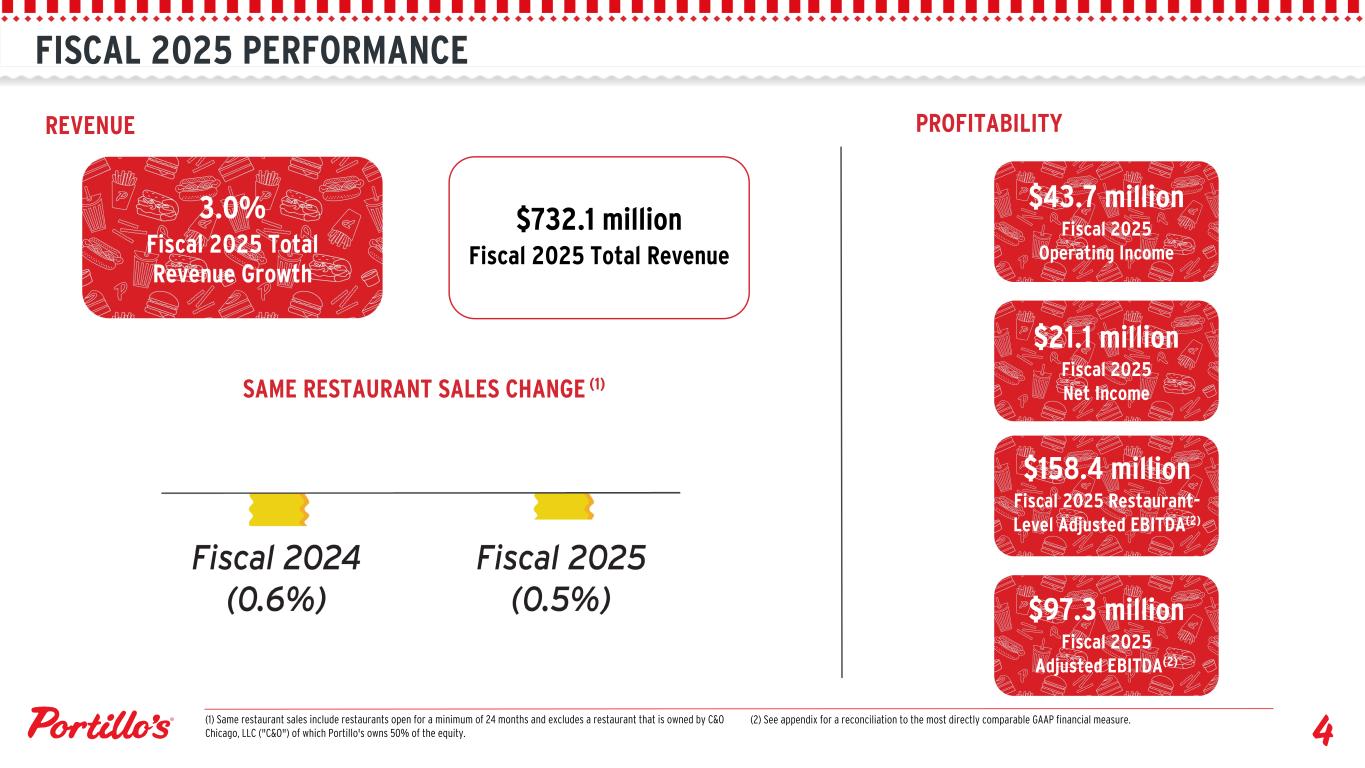
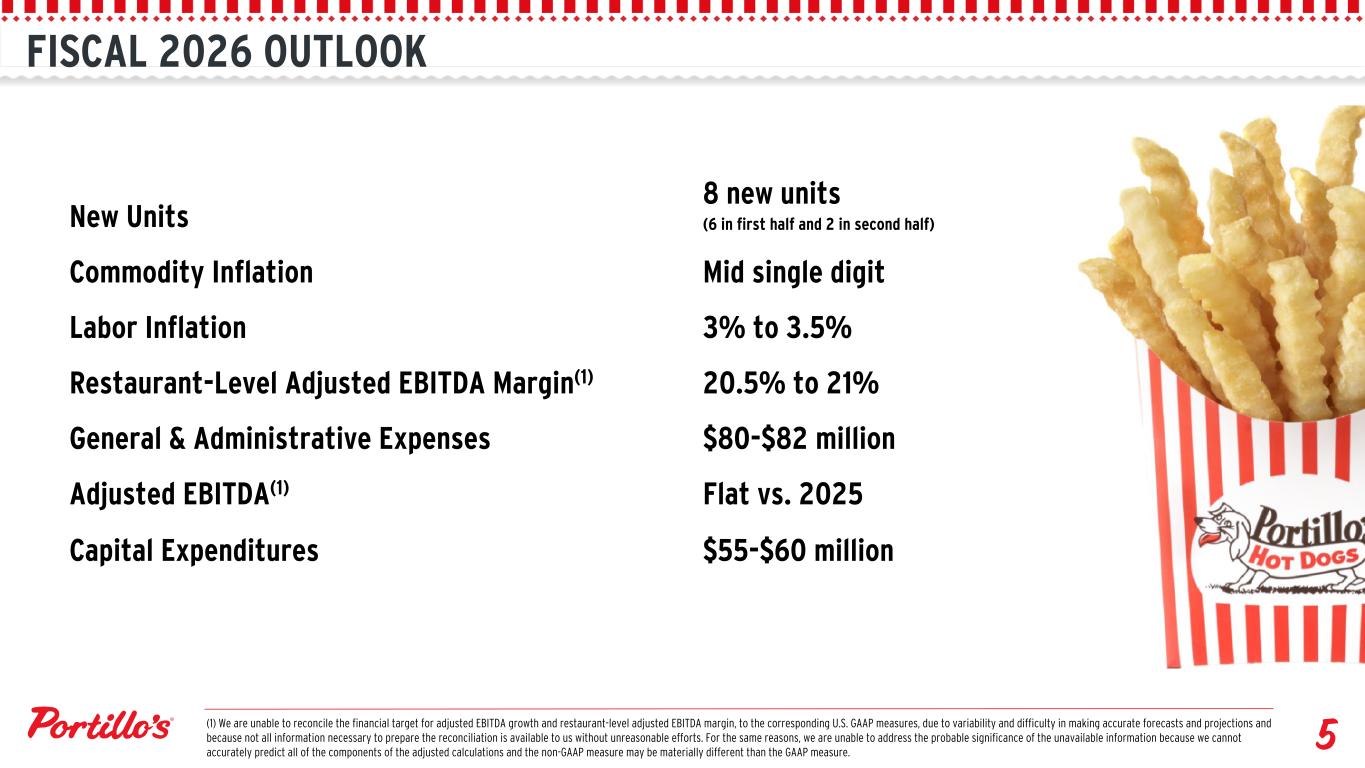
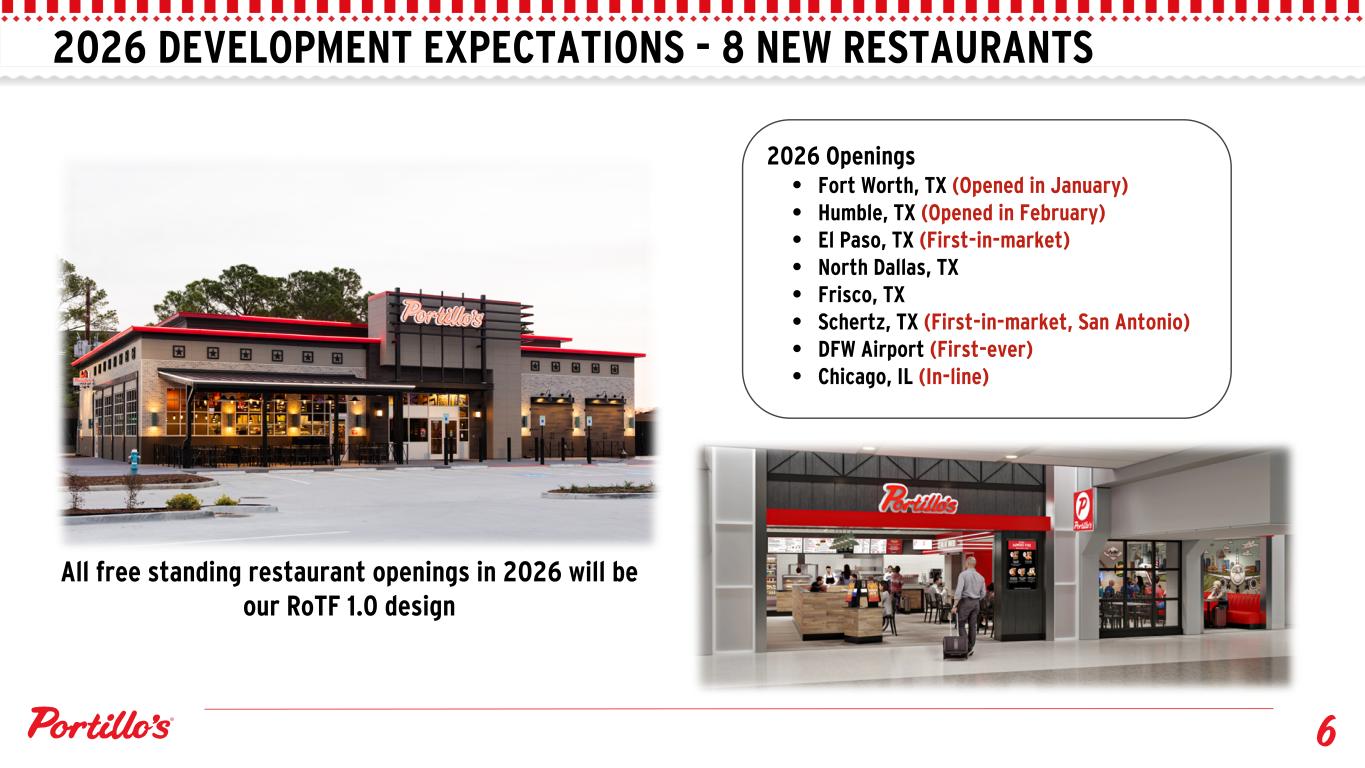
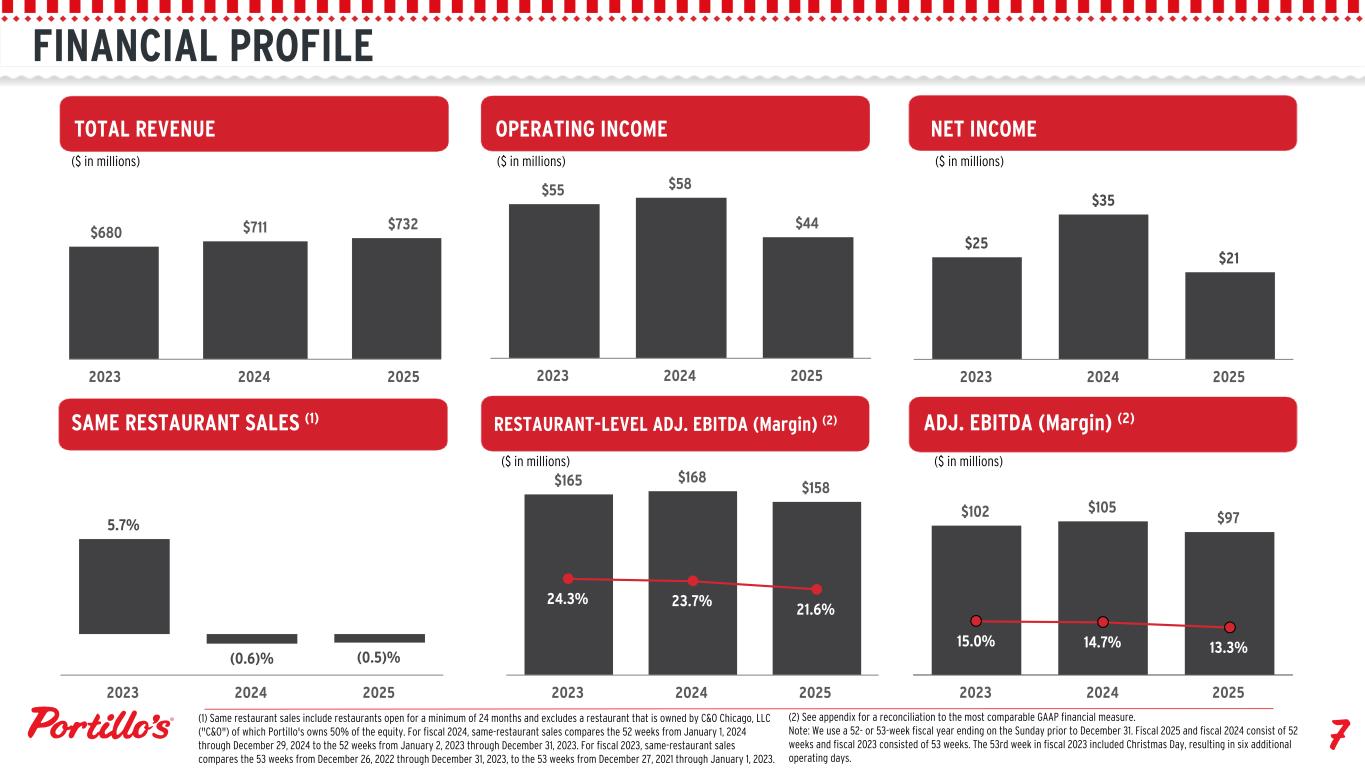
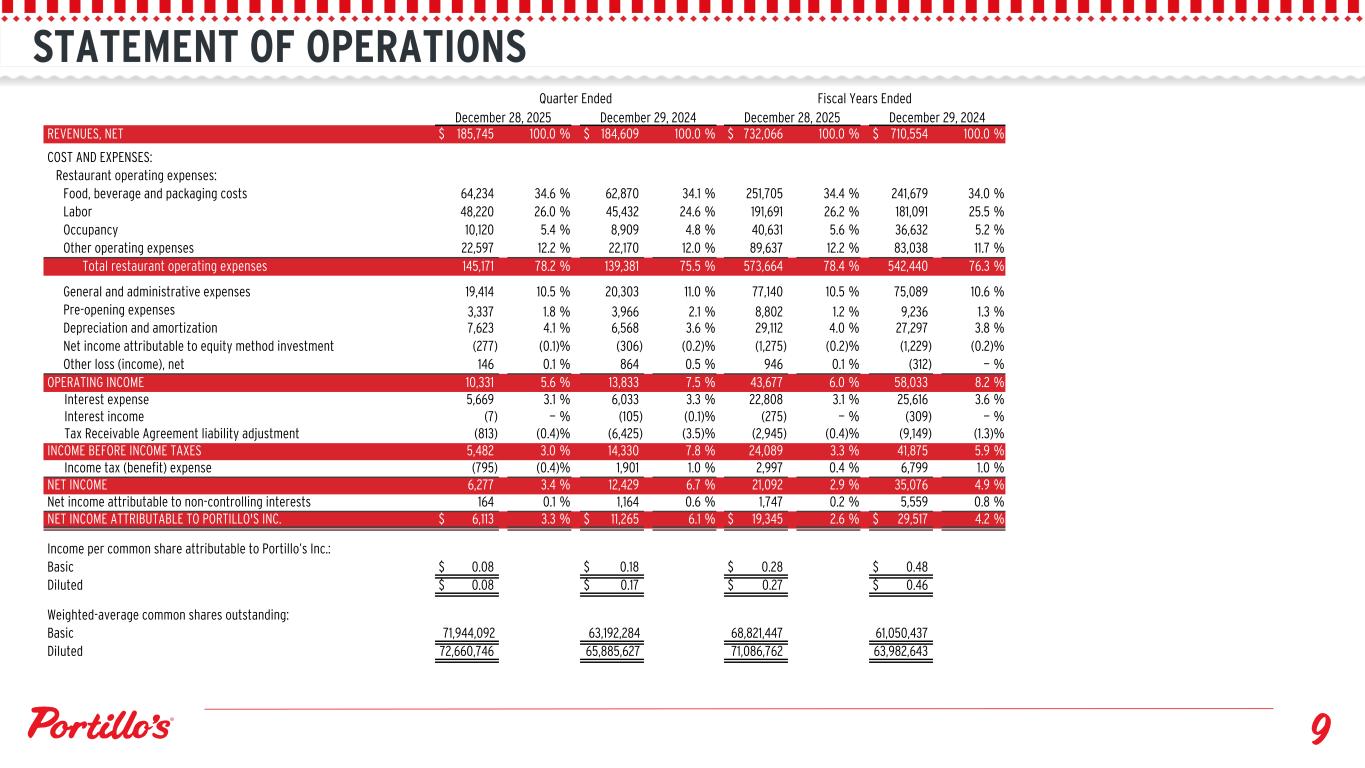
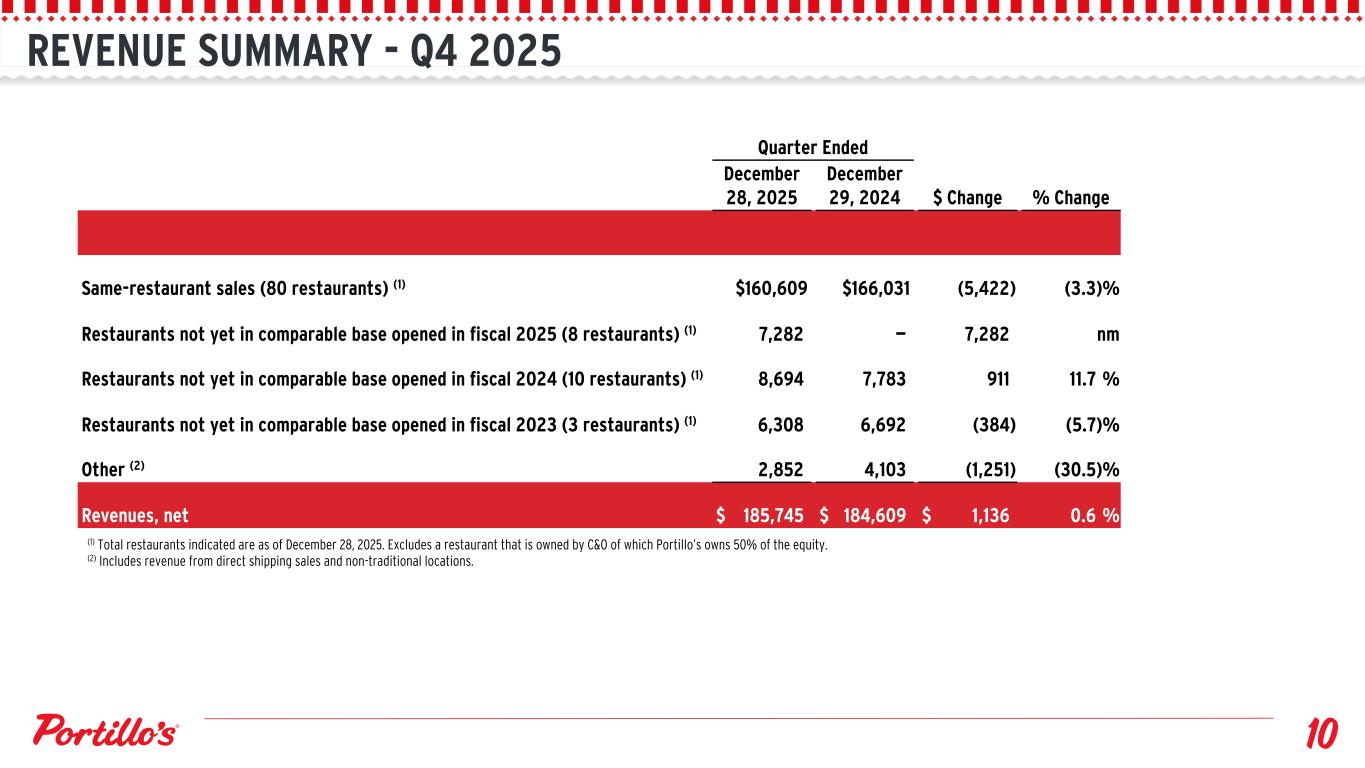
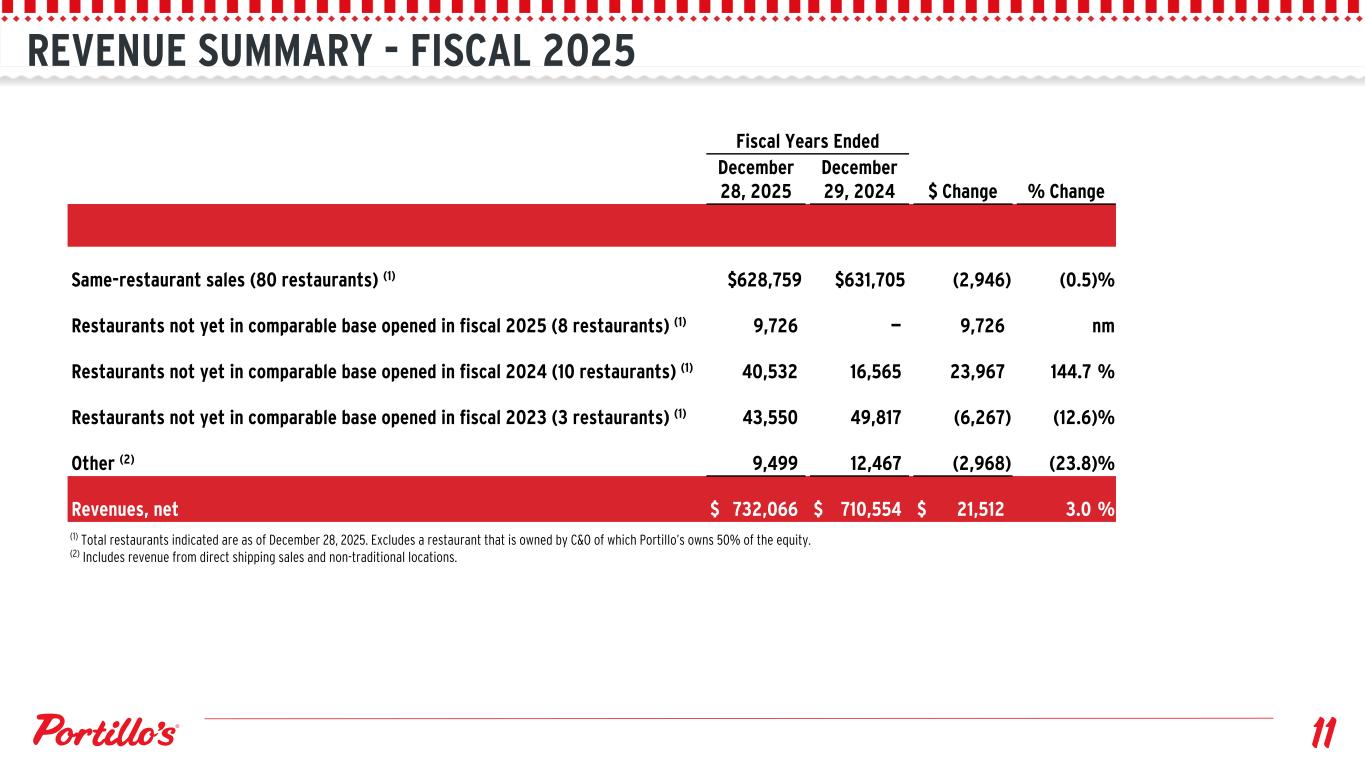
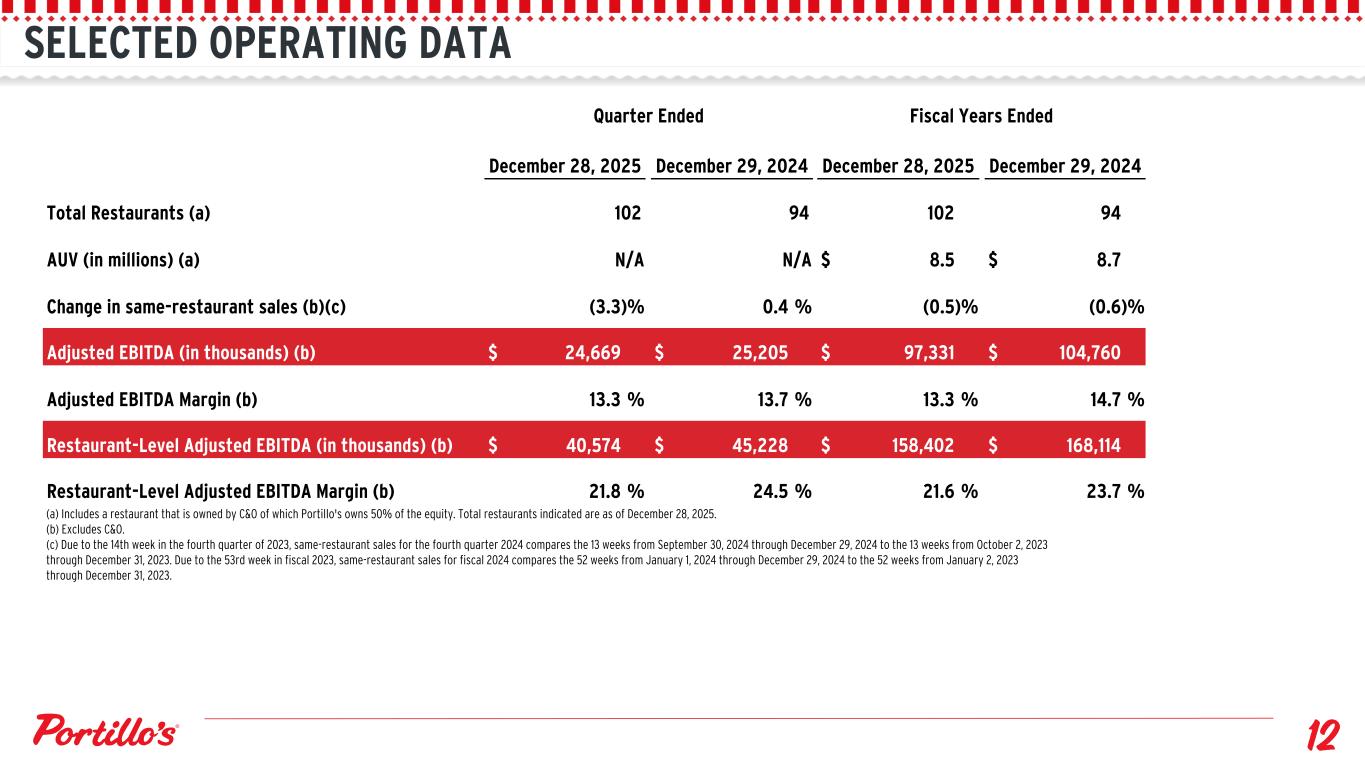
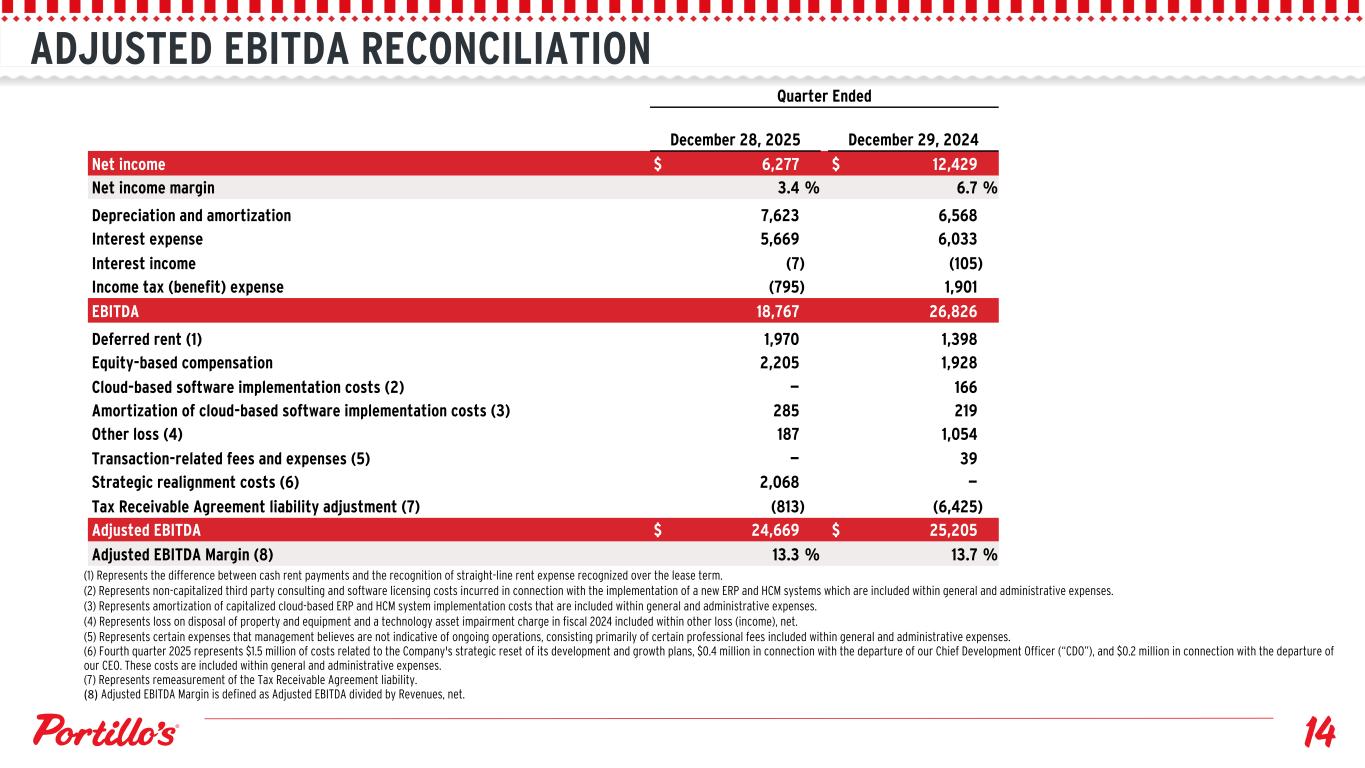
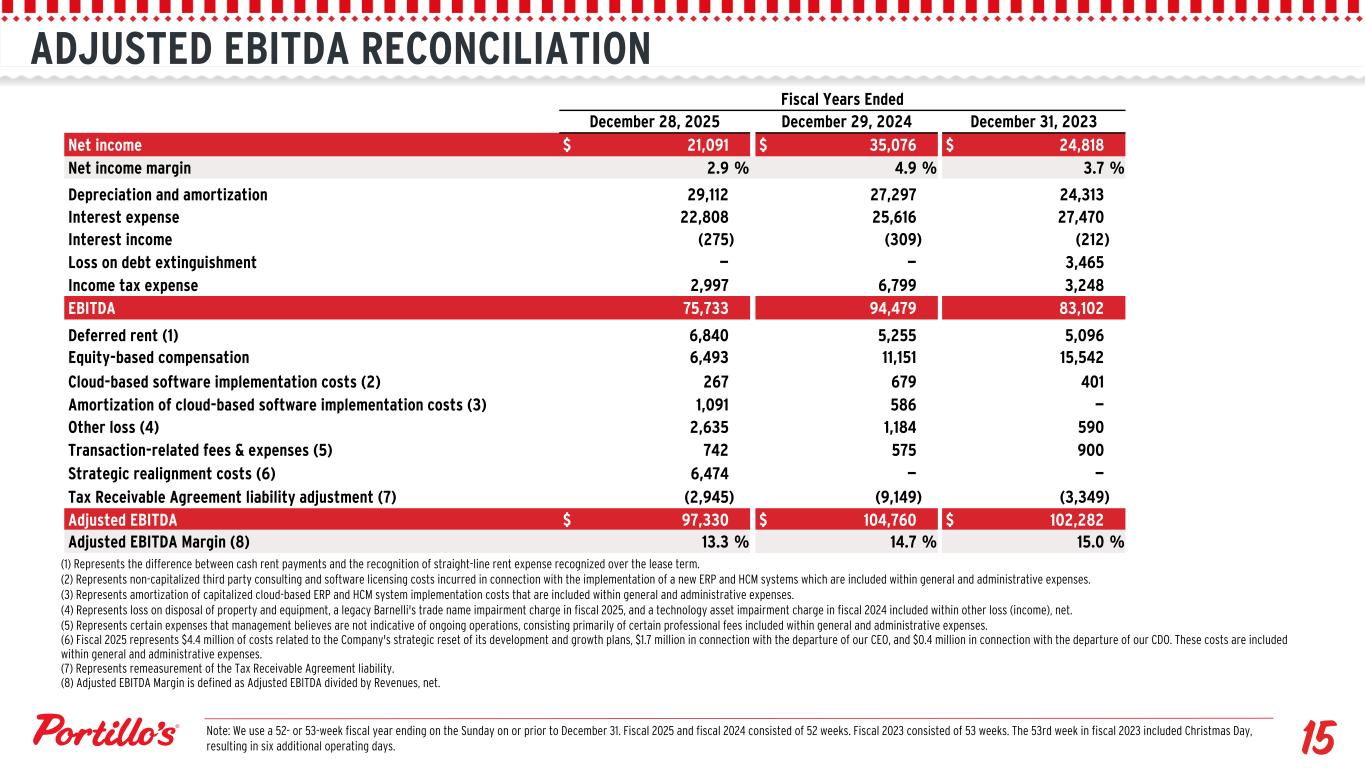
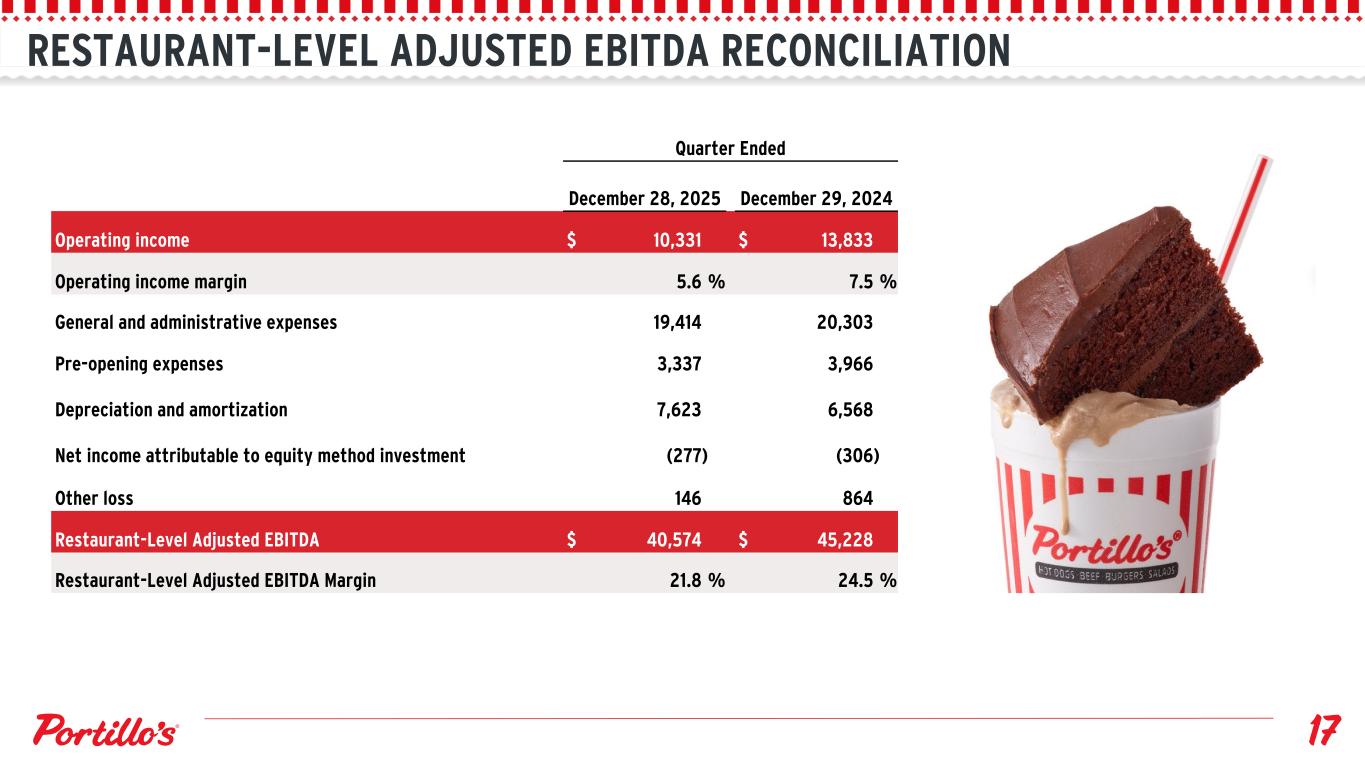
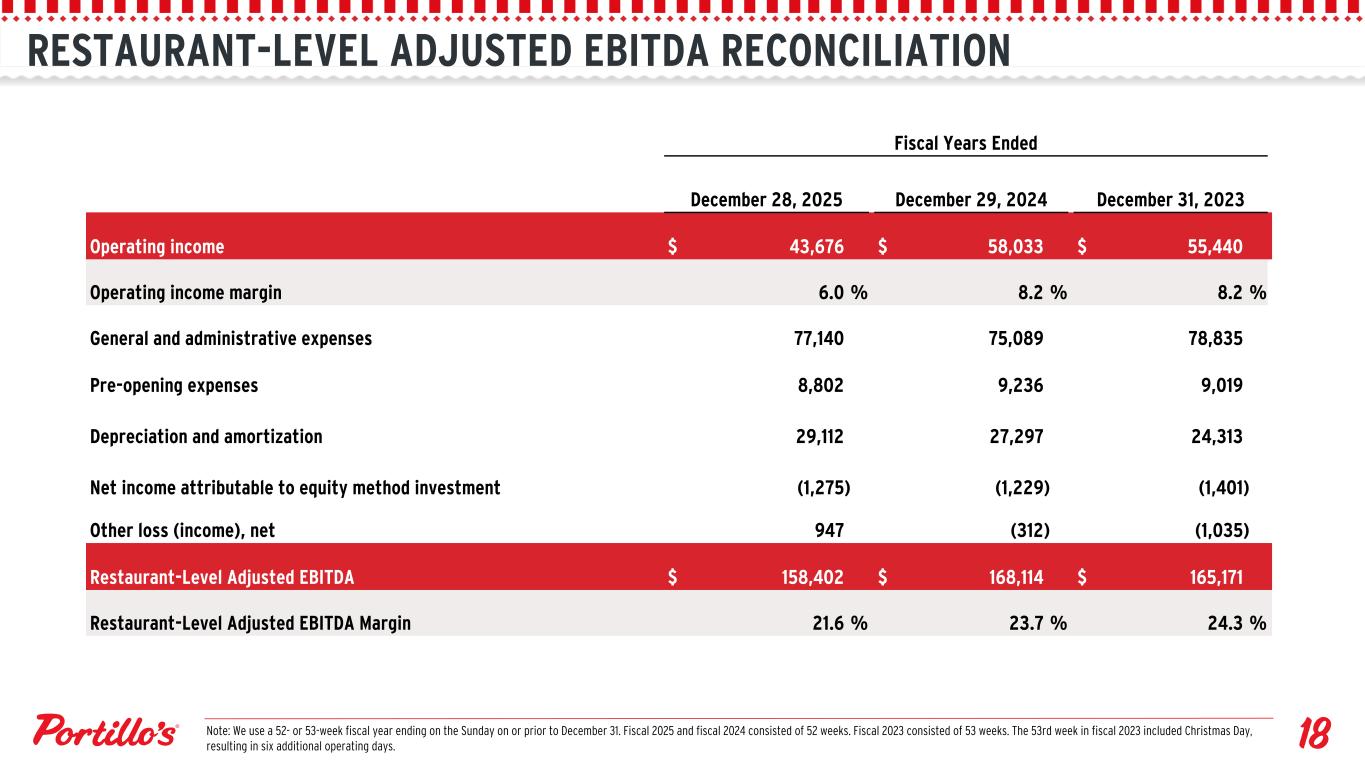
Thanks, Mike, and good morning, everyone. During the fourth quarter, revenues were $185.7 million, reflecting an increase of $1.1 million or 0.6% compared to last year. Our revenue growth in the quarter was driven by non-comp restaurants. Restaurants not in our comp base contributed $7.8 million of the total year-over-year increase in revenue during the quarter. Same-restaurant sales declined to 3.3%, which decreased revenues approximately $5.4 million in the quarter. The same-restaurant sales decline was attributable to a 3.3% decrease in transactions. Average check in the quarter was flat due to an approximate 2.3% increase in net effective menu prices, offset by a 2.3% decrease in product mix. We did not take any additional pricing actions during the fourth quarter, and our net effective price increase was approximately 3.2% for the full year. We will continue to evaluate pricing options in 2026, but our focus will be on growth via transactions versus pricing. We do anticipate that perks and other offers will continue to pressure our pricing benefit. Moving on to our costs. Food, beverage, and packaging costs as a percentage of revenues increased to 34.6% in the quarter from 34.1% in the prior year. This increase was primarily the result of a 4% increase in our commodity prices, partially offset by an increase in price. In the quarter, we experienced increases in several categories, including our primary proteins of beef and pork. As we stated in January, we are forecasting mid-single-digit commodity inflation with primary pressures coming from the beef category. Labor as a percentage of revenues increased to 26% in the quarter from 24.6% in the prior year. The increase was primarily due to lower transactions, incremental wage increases, and deleverage from our newer restaurant openings, partially offset set by labor efficiencies and an increase in price. Hourly labor rates were up 3% in 2025. In 2026, we are estimating labor inflation of 3 to 3.5%. Other operating expenses increased 0.4 million or 1.9% in the quarter compared to the prior year, which was primarily driven by the opening of new restaurants. As a percentage of revenues, other operating expenses increased to 12.2% from 12% in the prior year. Occupancy expenses increased $1.2 million or 13.6% in the quarter compared to the prior year, primarily driven by the opening of new restaurants. As a percentage of revenues, occupancy expenses increased 0.6% compared to the prior year. Restaurant-level adjusted EBITDA decreased $4.7 million to $40.6 million in the quarter from 45.2 million in the prior year. Restaurant-level adjusted EBITDA margins decreased approximately 270 basis points to 21.8% in the quarter versus 24.5% in the prior year. As Mike noted, our Texas market expansion created a headwind. We incurred losses during the year, and the impact on consolidated restaurant-level margins were 180 basis points in the fourth quarter and 170 basis points for the full fiscal year. We've taken targeted actions to improve performance in this market, and while we still have a long way to go, we delivered slightly positive results in the final period of the quarter. In 2026, we estimate our restaurant level adjusted EBITDA margins to be in the range of 20.5% to 21%. This estimate is inclusive of continued headwinds in our Texas restaurants and $4.5 million of additional bonus expense, assuming targets are met. Our general and administrative expenses decreased by $0.9 million to $19.4 million, or 10.5% of revenue in the quarter, from $20.3 million, or 11% of revenue in the prior year. This decrease was primarily driven by lower variable-based compensation, partially offset by dead site costs of $1.5 million related to our strategic development reset. These costs reflect our deliberate decision to move to a more measured pace of new restaurant growth, re-emphasizing unit economics and return on investment. Dead site costs for the full year were $5.1 million. In 2026, we expect G&A expense to be $80 to $82 million, which includes a $4.5 million headwind from bonus expense, assuming targets are met. Pre-opening expenses decreased by $0.6 million to $3.3 million in the fourth quarter of 2025, compared to $4 million, primarily reflecting a strategic reset of development activities and the deferral of planned openings into 2026. Adjusted EBITDA was $24.7 million in the quarter versus $25.2 million in the prior year, a decrease of 2.1%. For 2026, we anticipate adjusted EBITDA to be flat versus 2025, but I want to emphasize that our 2026 estimate includes an expected $9 million headwind from a fully earned bonus at both the restaurant level and support functions. Below the EBITDA line, interest expense was $5.7 million in the quarter, a decrease of $0.4 million from the prior year. This decrease was driven by a lower effective interest rate of 6.7% versus 7.5% for 2024. At the end of the quarter, we had $90 million drawn on our revolving credit facility. Our total net debt at the end of the quarter was $334 million. We have approximately $56 million of available capacity on the revolver. For 2026, we expect to open eight new restaurants and anticipate total capital expenditures in the range of $55 to $60 million, including investments in our existing restaurants, our commissaries, and other corporate initiatives. Income tax benefit was $0.8 million in the quarter compared to expense of $1.9 million in the prior year. Our effective tax rate for the year was 12.4% versus 16.2% in 2024. This decrease was primarily driven by changes in Class A equity ownership, our valuation allowance, and effective state tax rates. Cash from operations decreased by 26.7% year-over-year to $71.9 million year-to-date. We ended the quarter with $20 million in cash. In 2026, we expect to generate positive free cash flow and intend to use any excess cash to pay down our revolving credit facility. Also in 2026, we will focus on executing strategies that strengthen transaction growth across our restaurants while optimizing returns on our new restaurants. We will leverage our PERCS platform along with other marketing efforts to drive trial and frequency. We will prioritize operational excellence and invest in our team members. These priorities support our commitment to positive free cash flow and delivering long-term value. Thanks for your time today, and Operator, please open the line for questions.
Operator
Thank you. We will now be conducting a question and answer session. If you would like to ask a question, please press star 1 on your telephone keypad. A confirmation tone will indicate that your line is in the question queue. You may press star, too, if you would like to remove your question from the queue. For participants using speaker equipment, it may be necessary to pick up your handset before pressing the star keys. We ask that analysts limit themselves to one question and a follow-up so that others may have the opportunity to do so as well. One moment, please, while we poll for questions. Our first question comes from Sarah Senator with Bank of America. Please proceed with your question.
Thank you. So maybe I do have a question, a quick clarification. The question is on, you mentioned the Kennesaw restaurant and it opened, you know, impressive $2 million in sales, I think, through the first eight weeks. That's, I think, kind of an annualized run rate of maybe close to $13 million, which isn't that different from, I think, some of what you've seen in some of your Texas stores, for example. So I guess I know on, you know, in one case you have lowered the footprint. So, you know, it can accommodate lower AUVs. But as you think through the maturity curve, you know, next year, would you expect less of a fall off than perhaps you've seen, you know, just because to your point, you're not opening another Atlanta restaurant until 2027 and it'll be farther away or just, you know, that's been something that I think we've struggled to kind of forecast is year two. So any thoughts you have on what that looks like? And then, like I said, just a quick clarification, Michelle, on one of your comments.
Good morning, Sarah. Thanks for your question, and I think you answered it pretty well, too. Kennesaw, yeah, Kennesaw, through its first 100 days, did $3.8 million in sales, so we're pretty happy with it, but you're right. We don't expect it to be a $14 million restaurant. I think, you know, and it's kind of settling in around $200,000 a week right now, and, you know, over time, will probably level off, you know, somewhere below that. But that's, I think the main difference is between that and what we saw in Dallas, for instance, is that we're not planning on opening a bunch of more restaurants in the, you know, immediate vicinity of Kennesaw. The colony, which, you know, got a lot of attention on this call over the years, was surrounded by other restaurants within the first three years of it being open we won't open our next restaurant in Atlanta until the spring of 27 and you know we have plans to separate the other restaurants that we open in Atlanta with a lot more time and distance than what you saw in Dallas okay and so so kind of TBD on maybe what the curve looks like, but less cannibalization.
And then just, Michelle, you mentioned that you had EBITDA, I guess, final period of the quarter, slightly positive results. I guess, was that margin expansion or EBITDA growth? Or maybe you could just clarify that comment that you made. Thank you.
Yes, Sarah, no problem. So we saw both. We saw margin expansion when you compile all the Texas restaurants. And when you compiled them all, we saw profitability amongst all the restaurants that we had. So it was both. And it primarily comes back to the work we're doing around labor and labor deployment within that market as we're adjusting to the lower volumes.
Operator
Our next question comes from Gregory Frankfurt with Guggenheim Partners. Please proceed with your question.
Hey, I had two questions. The first is just the new growth strategy. Can you just talk about what it means from a manager and employee hiring perspective, I guess, with things a little bit more spread out? Do you pull from restaurants in other regions more? Does it have any impact on pre-opening or G&A? Just any thought on that? It would be great.
Yeah, Greg, I think, you know, the price that we will pay for having more new markets with single stores in it for longer is around new openings, which will be a little less efficient. And it's also a little more difficult from a distribution and oversight standpoint. But, you know, those are probably tens of basis points in the scheme of things as opposed to, you know, having to deal with restaurants that are doing, you know, sub $5 million AUVs for a period of time. So that's the tradeoff that we're willing to make. We haven't fully quantified it yet, but it certainly is something that we'll have to work through.
Thanks for that. And my second question is just maybe within the comps, anything stand out regionally or by income cohort as kind of places of strength or weakness? Thanks.
Yeah, Greg, when you decompose the comp, it's pretty consistent when you look at Chicagoland versus the outer markets. I think I've mentioned, you know, we've seen a little bit more pressure recently in a market like Arizona, but we did open a restaurant there in 2025 that did have some cannibalization. So you do get some of that impact in that market in particular, but largely speaking, it's not something where we see a wide gap between Chicagoland versus our outer markets.
Thank you. I appreciate it.
Operator
Our next question comes from Brian Mullen with Piper Sandler. Please proceed with your question.
Thank you. Just sticking with Chicagoland, can you give an assessment of the consumer value proposition or the value scores and what has happened with those versus maybe where those were historically and just talk about a path to recovery to where you want to be there for Portillo's. And I know some of it's dependent on the environment, which is tough, but I'm sure you don't want to wait around for the environment to get better. So just your perspective on that would be great.
Yeah, Brian, we've seen improvement in 2025 in our value perception scores. And when you look at some of the catalysts behind that, I think it goes back to when we launched our PERCS program in March and the offers that we've run over the course of 25. One of the more aggressive ones being our May Bogo beef offer. We also ran a hot dog offer in July, and then we did a cheeseburger offer in September. So when you look at all of those combined and you look at the sort of peaks within the value scores, that's where you see that coming up as well. So we continue to see good movement on that, and that's based on and driven by things that we're being, in my opinion, front-footed on to make sure that we're giving that value to our guests, not just in the form of price points, but also operationally. And we've talked about Tony and the ops team's focus on hospitality and giving a good guest experience and focusing on accuracy, speed of service. We can bring them in with those offers, but I think the key is giving them a good experience to also their perception of value. So those are the things that we saw in 25, and we feel good about the upward movement and the perception scores.
And Greg, just to give you a little historical perspective on Chicago, or sorry, Brian, you know, I went back at having, you know, been here 10 years ago and now coming back. I went back and looked at what the Chicago market looked like when Dick Portillo sold the business back in 2014 and compared it to today. And back in 2014, there were 34 restaurants in the Chicago market for Portillo's. Since then, and going into the end of 25, the number of restaurants have grown by 30% in Chicago. The revenue in Chicago has grown by 60%, and the restaurant level margin in Chicago has grown by 80%. So it's a very healthy business here and continues to absolutely deliver for us.
Okay, thank you. And then as a follow-up, I just want to come back to Texas. Maybe in the context of at ICR, you shared an Arizona example. It was very interesting. So you've acknowledged going too fast in Texas. You've got the stores open now. It sounds like you've just made some tweaks to labor. Maybe can you just talk about the order of priorities from here, how marketing can play a role, and maybe what you can or can't take from Arizona just to make sure you grow Texas from here the way you want?
Yeah, that's a great question. And for sure, building sales is the number one job to getting the Texas market to where it ultimately needs to be. The labor efforts are the thing that we were able to execute on first. And, you know, we've got restaurants in Chicago that do $4 and $5 million and have for a long time and make money. And I think we need to get that mentality into the market in Texas as well. But ultimately, it's about building sales. We're pulling a lot of short-term levers that are available, whether it's perks offers or third-party affinity offers. We've had a bundled meal deal going there since the fourth quarter, and we've ultimately got to find a way to better explain Portillo's to consumers who aren't yet familiar with People who know Portillo's love it, and people who don't know Portillo's have no idea what it is, and we're still trying to crack the code for how to market to the group of folks who haven't yet figured it out. And our new CMO, Denise Lauer, has got that on her priority list for 2026. Thank you.
Operator
Our next question comes from Andy Barish with Jeffries. Please proceed with your question.
Speaker 8
Hey, guys. Yeah, I wanted to just double-click on kind of, I guess, Denise's priorities given, you know, there's different strategies in Chicagoland versus the outer markets. Um, and then, um, yeah, on the, on the perks as you approach a year, any, any kind of info you're willing to share on, you know, sort of frequency or usage patterns or anything like that. But, um, yeah, just, um, some broader questions around, um, you know, kind of Denise's plans for 26.
Yeah. Denise has got a lot on her plate, uh, and she's about to have a new boss. So she's going to get undoubtedly some additional direction there. I would say her priorities are to drive traffic, obviously, first and foremost. And the PERCS program does feel like our near-in best weapon for doing that outside of, obviously, great operations, which has always been our number one traffic driver. I don't we've we've shared some data on perks in terms of the number of people in the program and the activation. We've got a couple million people in the perks program at this little over that now at this point. And I think the engagement level has been terrific with the offers that we've made through perks. But equally, I think Denise is focused on the Texas turnaround that we talked about just a moment ago. and finding additional levers to pull to drive trial in Texas because we've seen in Phoenix for sure and I think we're seeing in Texas that when we do get people in the door, our conversion to long-term customers is pretty high. Great.
Speaker 8
And do you expect at this point kind of the marketing pulses in some of those outer markets that you've done over the past year or two?
So when we look at the marketing spend, Andy, I think, you know, that's one of the things that Denise has been determining. And, you know, there is a theory of pulsing and then versus always on type marketing. And so I think in the newer markets, where we're at right now is we need to be always talking about the brand. And whether that's in the form of traditional advertising with, as Mike mentioned, we have a bundled meal right now, which is probably on more traditional advertising across all of our markets versus digital marketing and those things versus field marketing. And so regardless of what marketing tactic we use, we need to always be front and center and relevant, particularly in these newer markets, Dallas, Houston, where our awareness is fairly low. And so that's how we're thinking about it today versus, hey, we're going to pulse, come out, pulse back in a couple quarters is, you know, we have to be front and center right now on a fairly regular basis.
Speaker 8
Okay. Makes sense. Thank you.
Operator
Our next question comes from Jim Solero with Steven Zink. Please proceed with your question.
Hey, all. Good morning. Thanks for taking our question. Michelle, you had some commentary around favoring transaction growth versus leaning on price. Are you able to give us some color on carryover pricing into 26, assuming no incremental price?
Yeah, absolutely, Jim. So the pricing actions that are going to start to roll off, we had a point and a half roughly of pricing that rolled off in January of this year. We'll have another point that rolls off in April, so beginning of Q2. And then we'll have another, call it half a point or 70 basis points that rolls off in June. And so that's the pricing cadence that rolls off from 2025. But as I mentioned in the commentary, we are seeing impacts from perks and other offers to that pricing through the discounts that we're offering through that platform. And so even when you look at the fourth quarter, Jim, you'll see that our pricing impact was 2.3%. It was 3.2% for the full year. So as we sit here in the first quarter, we're definitely sub-2% pricing. But depending on the offers that we run in Q1, that could go below even a point of pricing in the first quarter, depending on those impacts. But that's the cadence that rolls off in 2025.
Great. And then as a follow-up, could you offer any thoughts on attachment in mix as it pertains particularly to some of the PERX program? I know industry-wide it sounds like kind of down low single-digit transactions, so maybe mix can be kind of a swing factor to the positive or the negative depending on how things progress. Any commentary there would be helpful.
Yeah, and for the perks offers that we've run, Jim, we're not seeing significant ticket degradation. When you look at our average ticket today, it's about $23.60 for the total company. And so, you know, as we've run those offers, they haven't been, again, significant degradation to the ticket. So we like what we're seeing with those that we're running, and we continue to measure those impacts, not just on that, but obviously on the profitability in total for the offer. but that's generally what we've been seeing. Great.
Operator
Our next question comes from Sharon Zacchia with William Blair. Please proceed with your question.
Hi. Thanks for taking the question. You know, kind of going back to PERCS and it being kind of a more of a surprise and delight program, is there any thought of maybe needing to convert that to more of a typical points accrual program?
It's certainly a question that gets asked of us a lot and that we've asked ourselves. I think to this point, we're really pleased with the way the PERCS program has performed so far. And so, you know, turning it into a punch card program with all of the attendant, you know, costs that go along with the rewards in that kind of a format is not something that we're planning on proceeding with right this instant, but obviously it would always be an option. But I have to say that relative to, you saw Subway the other day had to pull back on its four for four foot long thing. We're not looking to get into a situation where we're doing that kind of a punch card deal at this point.
And Sharon, the one thing I'd add on that is the difference between, and I know you understand this between us and others, is we are an experiential brand. And part of this Surprise and Delight program is we can give experiences, whether it's tastings for new menu items, whether it's merchandise. You know, we don't view it as, to Mike's point, a traditional punch card program where if you buy X, you're going to get X, because the nature and the DNA of Portillo's is we are an experiential brand. So I think that goes with who we are and aligns with that thought process as well.
Okay. And then on the restaurant-level margin guidance, Michelle, does that actually assume you have no price in the back half of the year? And, you know, with that kind of mid-single-digit COGS inflation, is that more first-half weighted because you'll lap some of the decent inflation in the back half?
Yeah. No problem. So the margin does not assume zero price. As we move towards the year, we do expect the mid-single-digit commodity inflation, but we don't expect that we're going to be able to pull the pricing lever, Sharon, to fully offset that. Having said that, though, we continue to do our pricing analytics to see where we have opportunities to take price. And we do expect that in the front half of the year in particular, we are going to see heavier inflation. So the first two quarters of the year, right now we're projecting higher commodity inflation versus the back half of the year. But at the same time, we haven't made any decisions on pricing. And we need to be mindful of, again, growing the business through transactions versus price taking.
Speaker 10
But the guide assumes a little bit of price actions over the course of 2026. okay thank you no problem our next question comes from dennis geiger with ubs please proceed with your question great thanks guys uh first i wanted to ask a little bit more on the operational side of things and maybe where you are with sort of drive-through speed overall ops and overall speed slash customer experience if there's any latest updates on that front yeah sure uh i think we're feeling good about where we are operationally.
Staffing is terrific. Hourly turnover is down under 80% for the year, so a really great cultural story. GM turnover at sort of historic lows for us. And we had as a priority last year to get better in the drive-through, And those of you who are old enough to remember Joe Pesci's line about what happens to you at the drive-thru know it's hard to get both speed and accuracy better at the same time. We were able to do that last year with nearly 40-second improvement in our speed of service and a significant improvement in the accuracy measures as well. So I think that sets us up for a good year in 26. As I said earlier, marketing is important, but the most important driver for Portillo's of traffic and frequency is great operations and great experiences.
Speaker 10
Terrific. And then sort of following up on that, just kind of looking at performance by channel or sort of anything to highlight around customer behavior changes, whether it's day part, day of the week, off-premise, on-premise delivery? Any call-outs, observations on pattern behavior changes that you're seeing across channels and day parts, et cetera?
Yeah, Dennis, I'll take that one. So we are seeing more of an uptick in our off-premise channels, particularly our pickup channel has been our fastest-growing channel in 2025, and our delivery channel did see some growth as well. And so that's where we've seen a little bit more of our growth coming from. And so we have to obviously make sure that, you know, those channels are equally as important to our guests and their satisfaction. And so that continues to remain a focus of ours because we know those channels are ones that continue to grow for us.
Speaker 10
Great. Thanks, Michelle. Appreciate it.
Operator
Our next question comes from David Tarantino with Baird. Please proceed with your question.
Hi. Good morning, Michelle. I was going to ask a question about the guidance and specifically, what type of comp framework are you assuming in the guidance outlook for EBITDA? And I guess the second part of the question is, how are you running in Q1 so far relative to that plan?
Yeah, David, we're not giving any top line guidance purposefully. And I think I mentioned this at ICR in terms of the visibility around that is not as clear to us in terms of not just where the macro is. Obviously, our new restaurants play a role in the non-comp performance. And so we're purposefully not guiding anything on the top line. We do feel we have more visibility to that middle of the P&L and feel comfortable with where we're sitting from an adjusted EBITDA guide standpoint and then all the categories that make that up in between. So that's why we're not guiding to the top line. In terms of Q1, we've had some puts and takes on weather that has been well documented and talked about, specifically in January. So those are known headwinds for everyone in the industry. But what I would say is weather aside, our sales fundamentals are solid and we feel good about them as we sit here today.
Great. Thank you for that. And then I guess the follow-up to the guidance question, I guess, are there ways to deliver the EBITDA guidance with a wide range of revenue outcomes? I guess I'm not clear on that point given the lack of guidance. There must be an underlying assumption on the revenue growth. I appreciate you not wanting to give it, but I guess the question is, do you have the ability to pull levers throughout the P&L to deliver it at a wide range of revenue outcomes?
Yeah, absolutely, David. And so we talked about pricing. We don't want growth to come through pricing, but that is a lever. There's obviously cost headwinds that we're facing. So we have to think about that as a lever. We've talked about the Texas turnaround. We've talked about that we need to be able to grow the top line in those markets in particular. That's a lever to continue to see growth in the top line. Now that's mostly going to come in the form of non comp versus comp, but obviously still top line growth. And then continuing to talk to our guests in our core market as well is another opportunity. We've talked about the value perception scores going up, the use of perks as a lever, other menu innovation items could be a lever. We've recently launched new sauces as part of our portfolio. So there are other things absolutely that we can do and levers we can pull to drive that top line up.
Speaker 6
Great. Thank you.
Operator
Our next question comes from Brian Harper with Morgan Stanley. Please proceed with your question.
Speaker 6
Yeah, thanks. Good morning, guys. Michelle, do you expect marketing spending up substantially this year within that guidance, or is it largely similar? And I guess you kind of talk about more of an always-on approach. How efficient is that right now, or how do you think about the efficiency of that?
Yeah, Brian, we do expect to see a slight uptick and marketing spend this year, but nothing material. It's within the guide that you see specifically within the G&A guide is where you would see that incremental marketing spend. And so in terms of the approach of always on, as I mentioned, there's multiple approaches you can take, whether it's traditional is going to be more expensive being on TV and doing commercials and things of that nature. And we frankly don't have a lot of scale in those markets to view that as an extremely efficient use of our advertising dollars. And so we have to make sure that we're investing in other areas, digital, social. I mentioned field marketing as well. So all those things are going to play a role in the quote-unquote always-on approach versus the prior approach of pulsing more involved traditional forms of marketing and advertising spend.
Speaker 6
Okay, understood. And the mix component of same-store sales, can you, I know that's been a, you know, sort of a drag for a while, but how are you thinking about that as you go into this year?
Yeah, I think, you know, to your point, we've seen mixed headwinds over the course of the past several years. Now, we've seen that moderate. We even saw that for this year. Our mix was only down 1.2 percent for the full year, which I think was the lowest it's been in several years. And kiosks played a big role in that. And so it's helping to mitigate some of those natural headwinds that we see in mix, which is lower items per transaction and then trade downs. So those are the two things that are negatively impacting mix. And we are seeing that today. We see continued lower items per transaction, whether it's across all channels, and then some trade downs going on. So we have to be able to mitigate against that. We continue to look at kiosks. How can we increase adoption there? How can we continue to lean into those digital channels, which we know comes with a higher ticket? So I continue to see that, Brian, to answer your question as a headwind in 2026. But there are things that we need to do to continue to moderate those headwinds within mix, like I mentioned.
Operator
We've reached the end of our question and answer session, which now concludes today's teleconference. You may disconnect your lines at this time. Thank you for your participation.