Operator
Welcome to Seacoast Banking Corporation's first quarter 2026 earnings conference call. My name is Kate, and I will be your operator. Before we begin, I have been asked to direct your attention to the statement at the end of the company's press release regarding forward-looking statements. Seacoast will be discussing issues that constitute forward-looking statements within the meaning of the Securities and Exchange Act, and its comments today are intended to be covered within the meaning of that act. Please note that this conference is being recorded. I will now turn the call over to Chuck Schaefer, Chairman and CEO of Seacoast Bank. Mr. Schaefer, you may begin.
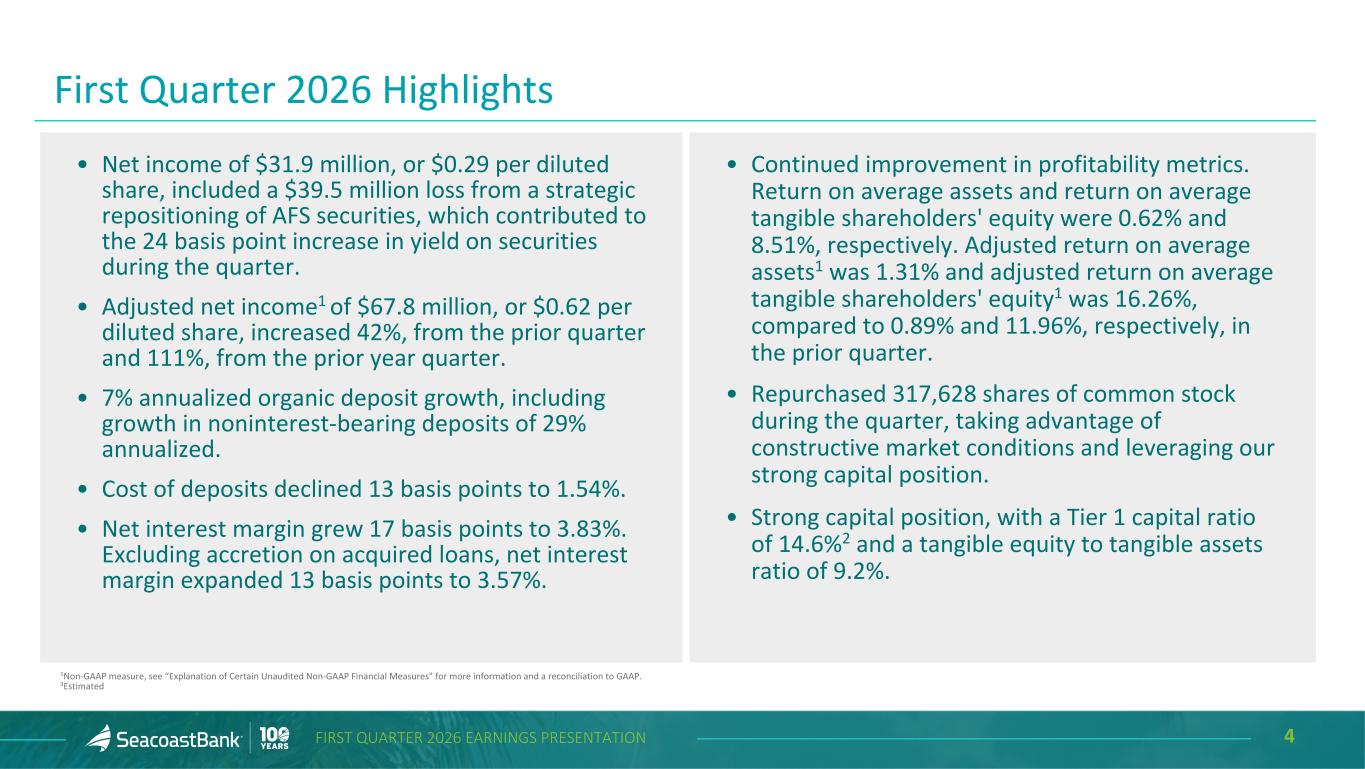
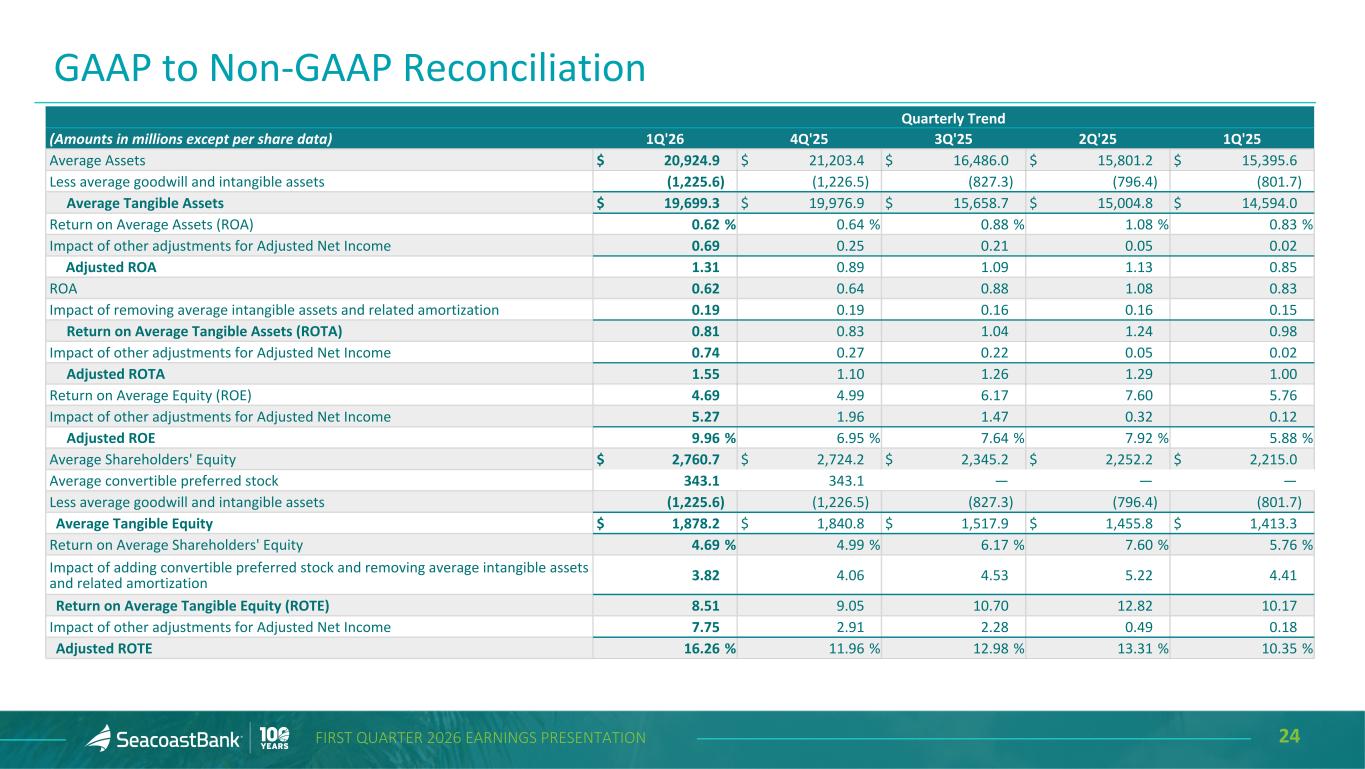
Okay, thank you, Kate, and good morning, everyone, and thank you for joining us. As we move through today's presentation, we'll reference our first quarter 2026 earnings slide deck, which is available on our website, seacoastbanking.com. Joining me today is Tracy Dexter, our Chief Financial Officer, Michael Young, our Chief Strategy Officer, and James Stallings, our Chief Credit Officer. The Seacoast team delivered another great quarter, highlighted by robust deposit growth, particularly in non-interest-faring deposits, meaningful expansion in the net interest margin, and solid progress towards the financial guidance we introduced last quarter. Commercial loan production momentum remained strong, up 35% year over year, and as expected, the first quarter loan growth was seasonally softer and further impacted by elevated payoffs. Importantly, our loan pipeline remains strong, and we expect payoffs to moderate in the coming quarters, supporting a return to stronger loan growth as the year progresses. Asset quality remains exceptional with limited charge-offs, no change in criticized and classified assets from the prior quarter, and a modest uptick in non-accroal loans. Non-insured income continue to perform well, driven by strength across wealth management, insurance, treasury, and our mortgage businesses, and our expansion in the villages is already delivering results with solid mortgage production and growing demand for wealth management services. Expense discipline remained excellent this quarter. Overhead was well controlled. The adjusted efficiency ratio was 55%, and the ratio of adjusted non-expense to tangible assets remained at near 2.1%, even as we continue to invest deliberately in growth. Our strategy to drive improved shareholder returns remains firmly on track. Excluding merger-related costs associated with the Villages Bank Corporation, our return profile continues to strengthen. For the quarter, adjusted return on assets was 1.31%, and the adjusted return on tangible equity was 16.3%. These results underscore the strong earnings power of the combined franchise. And looking ahead, we remain confident in our 2026 outlook. As outlined in the slide deck, we continue to expect full-year earnings per share in a range of 248 to 252, despite two less rate cuts. And finally, capital and liquidity remain exceptionally strong. We continue to operate with Fortress Balance Sheet and remain one of the strongest banks in the industry. With that, I'll turn it over to Tracy to walk through our financial results.
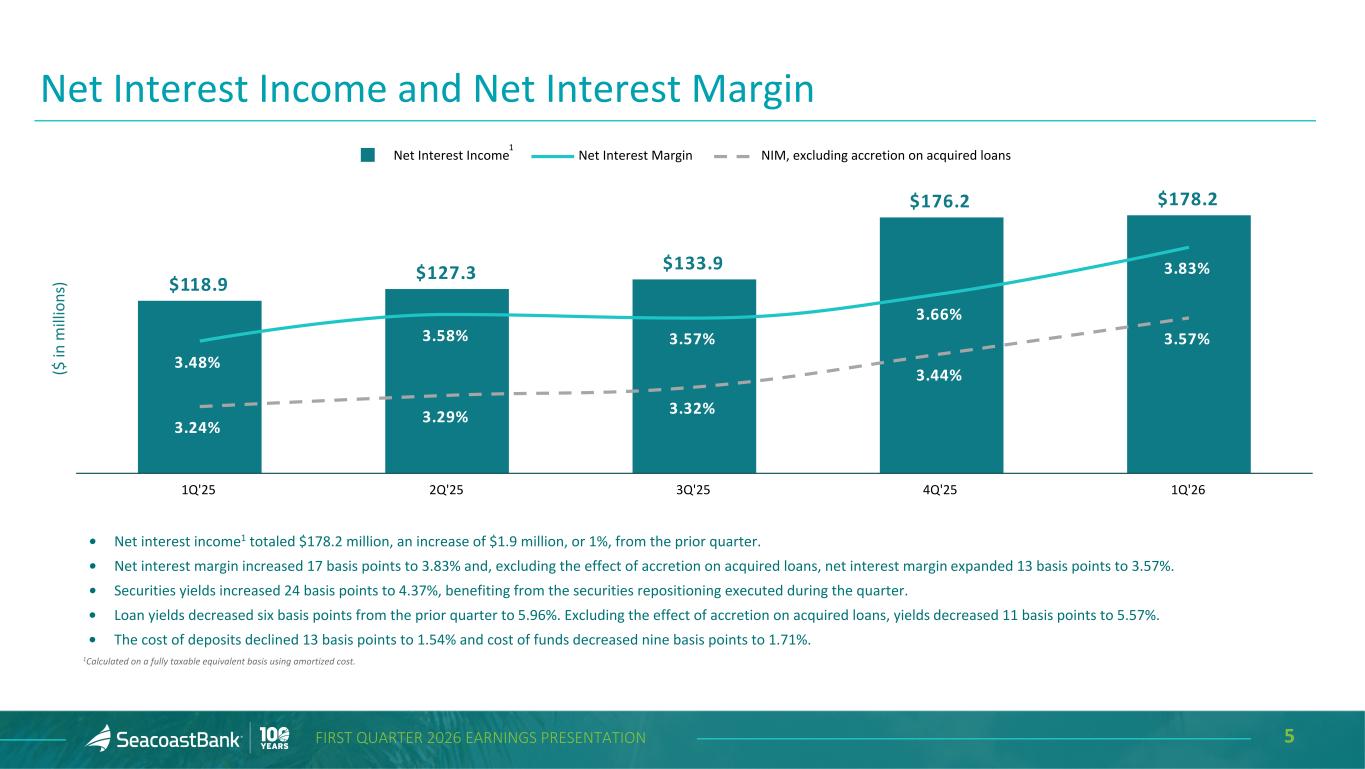
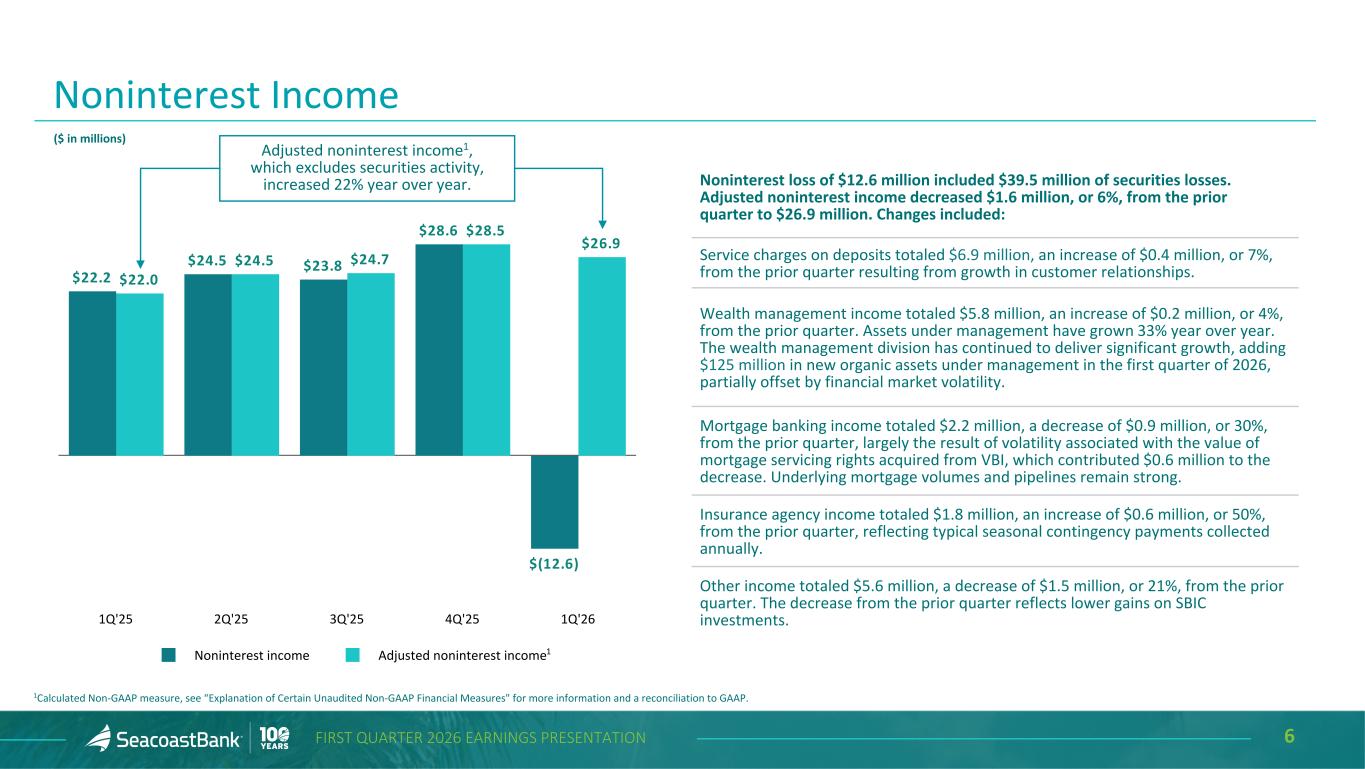
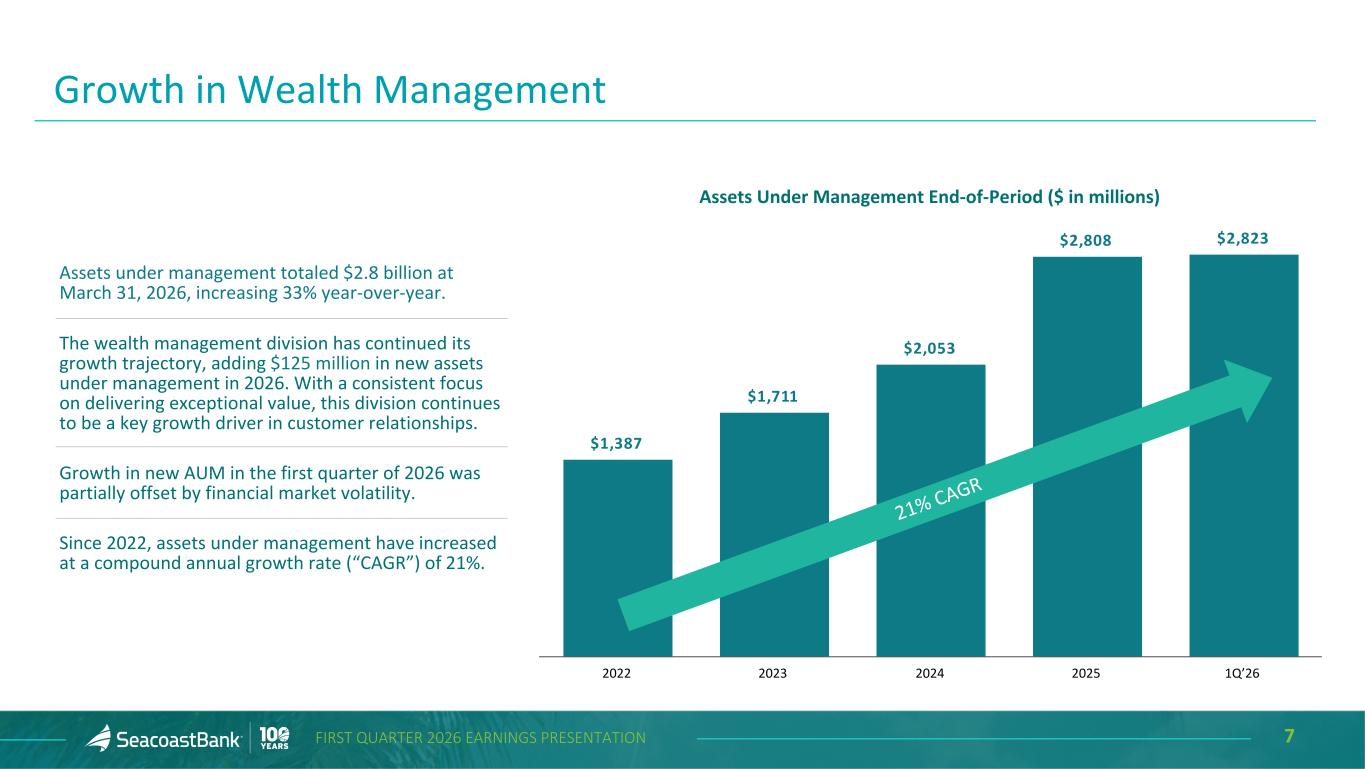
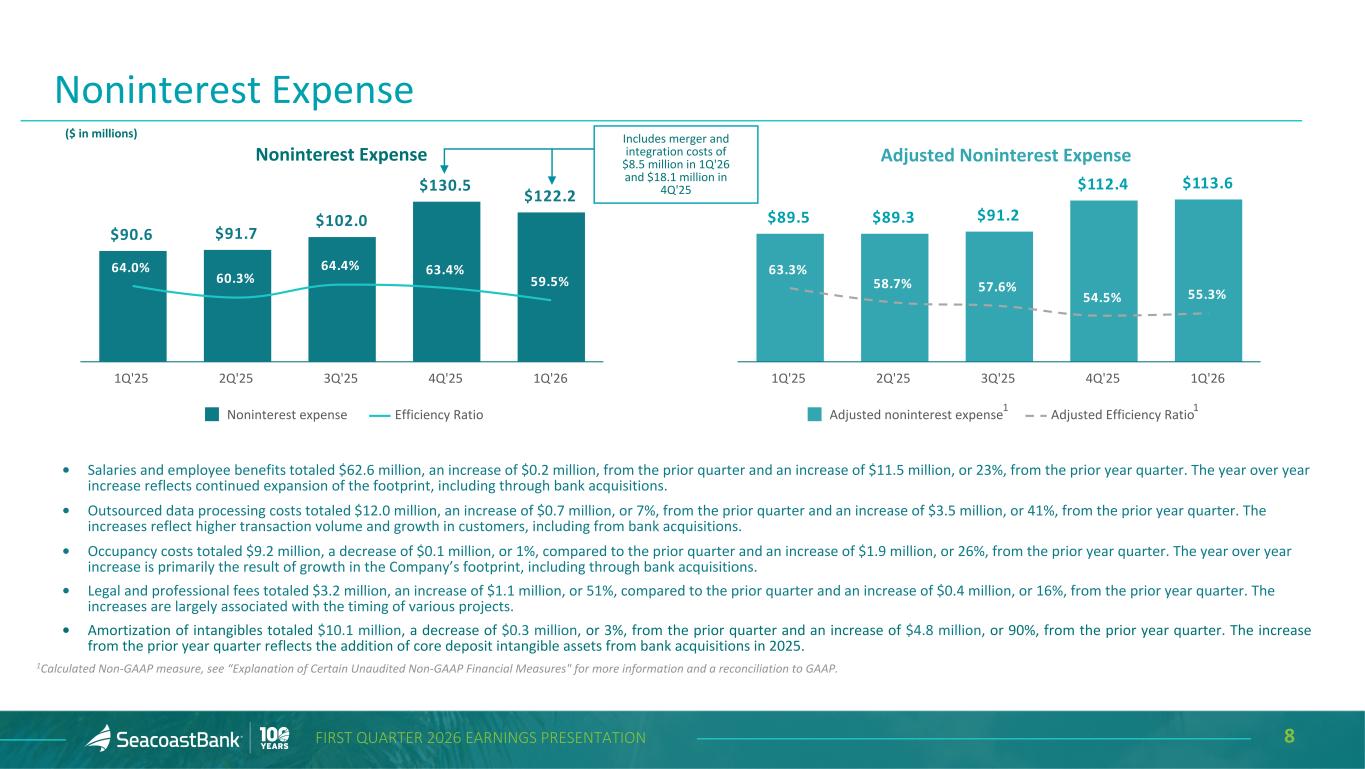
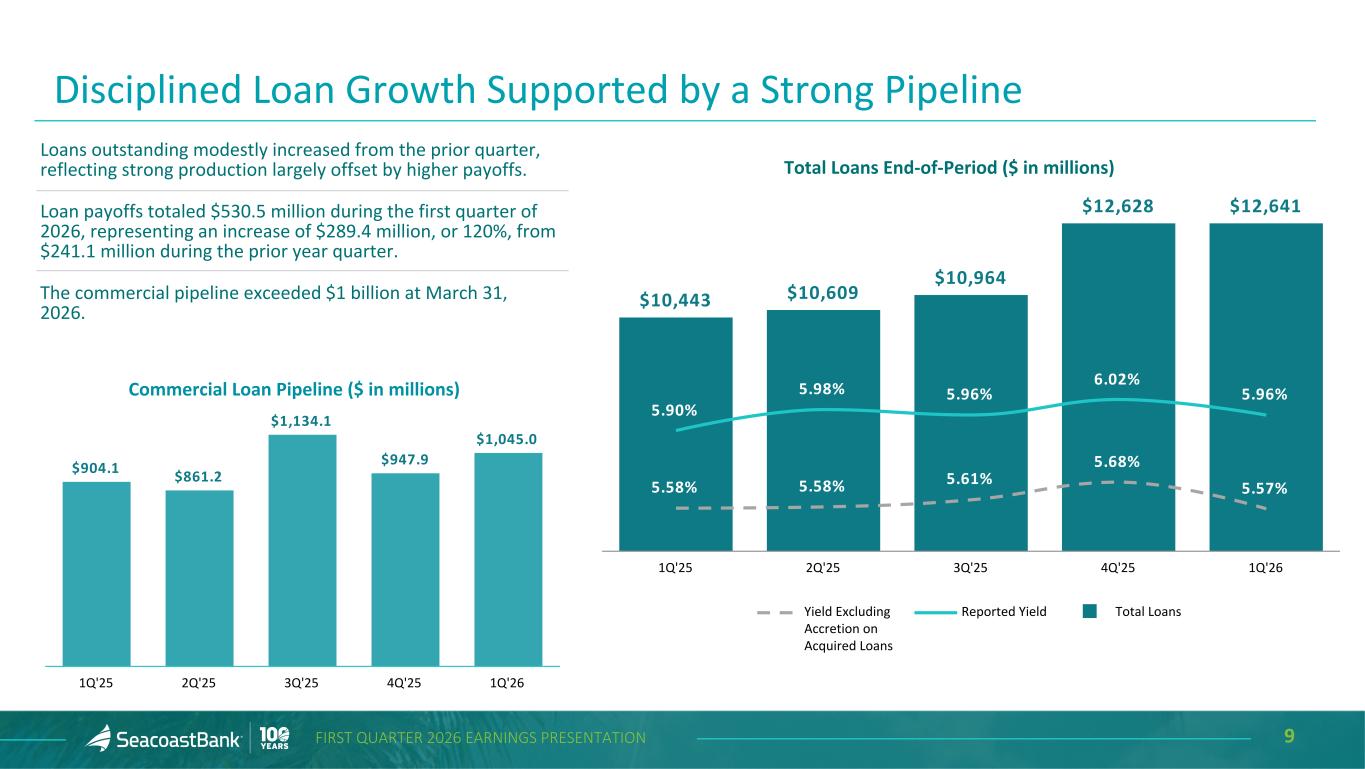
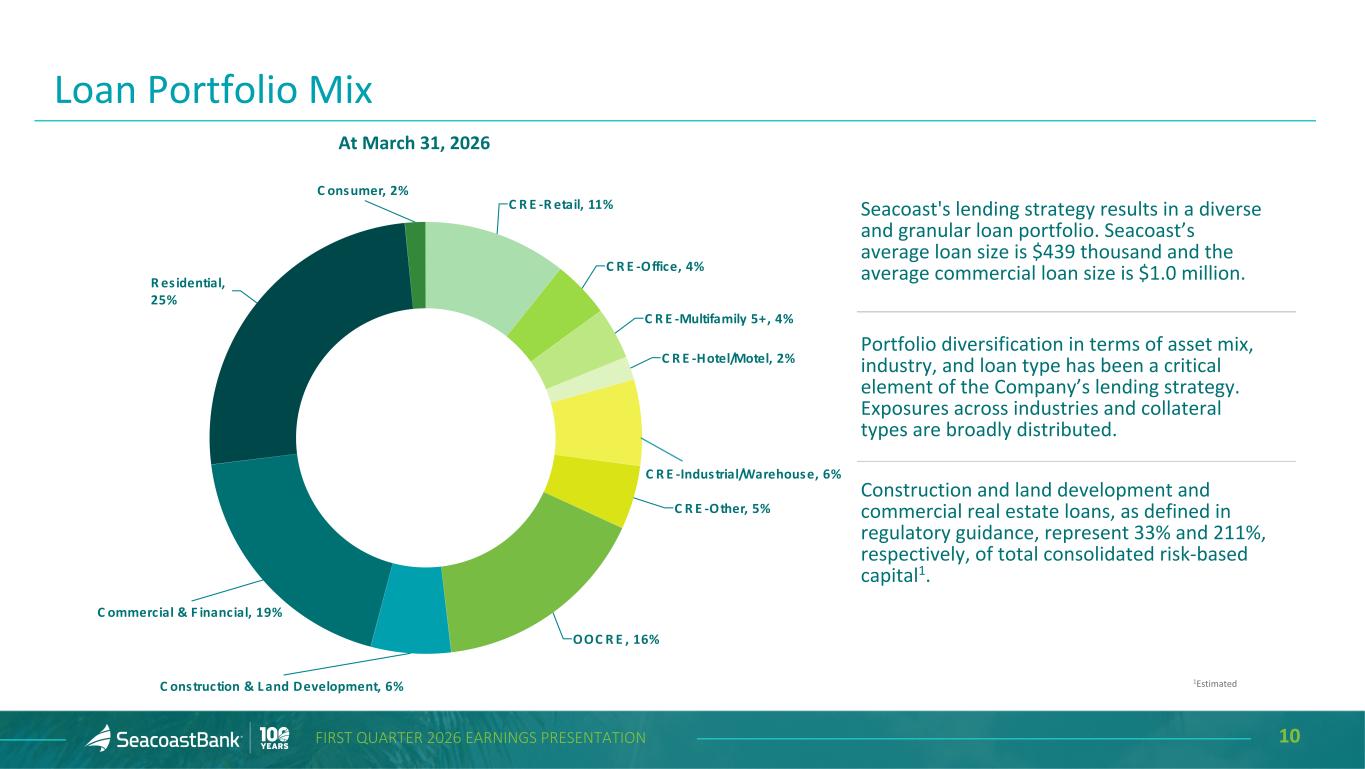
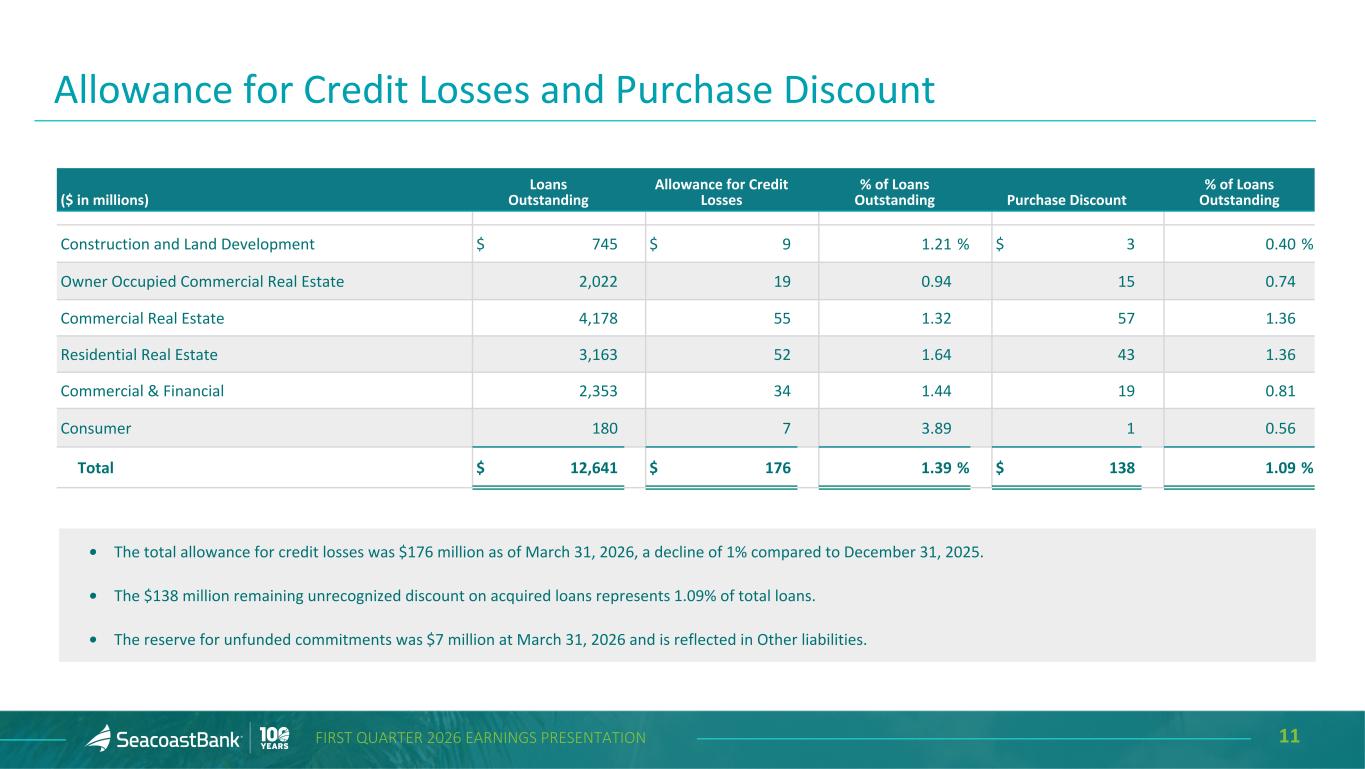
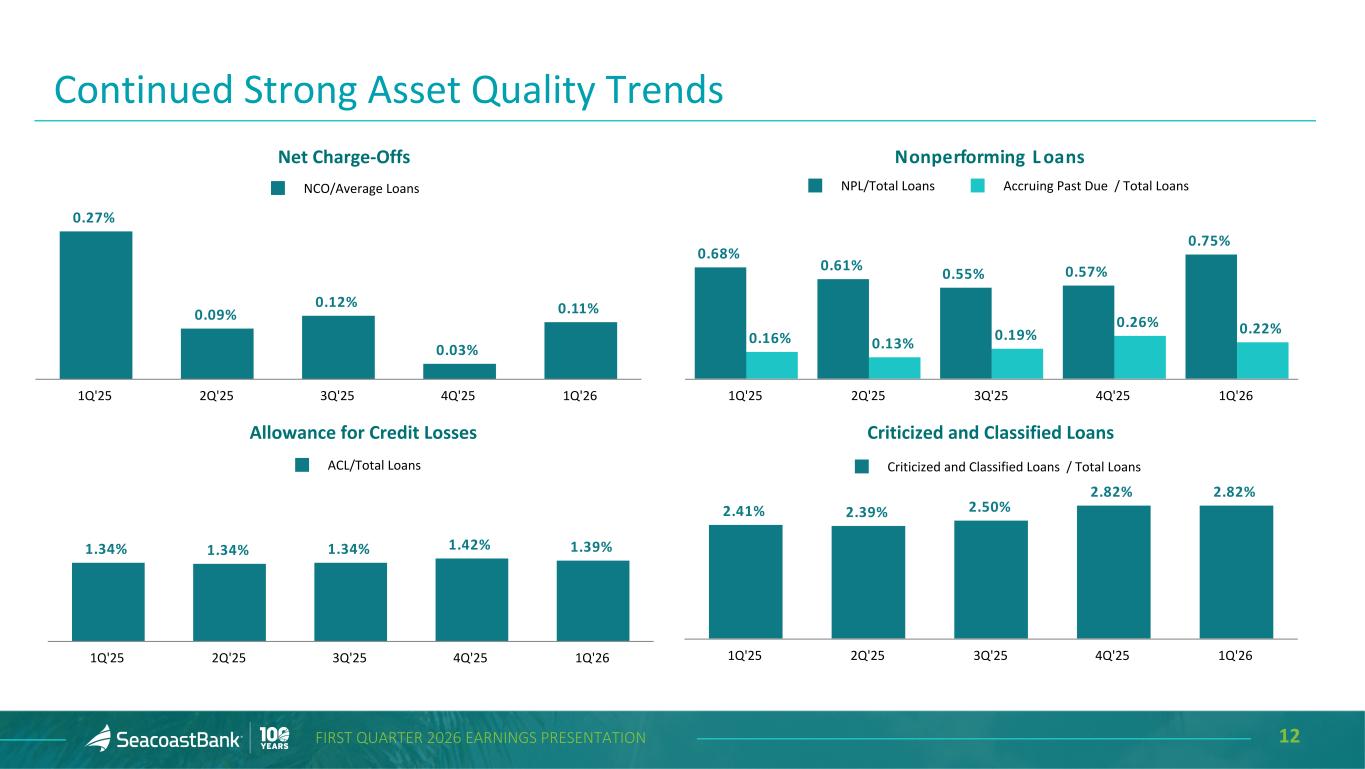
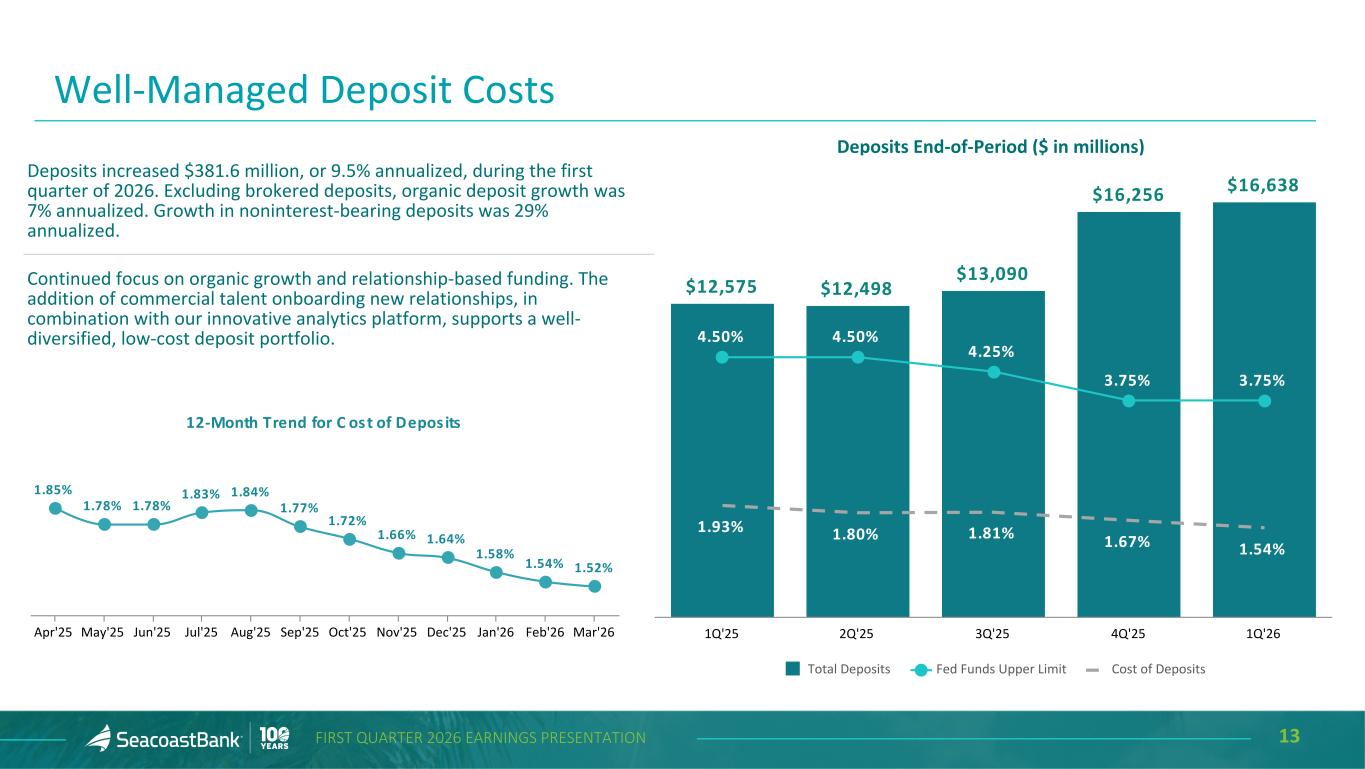
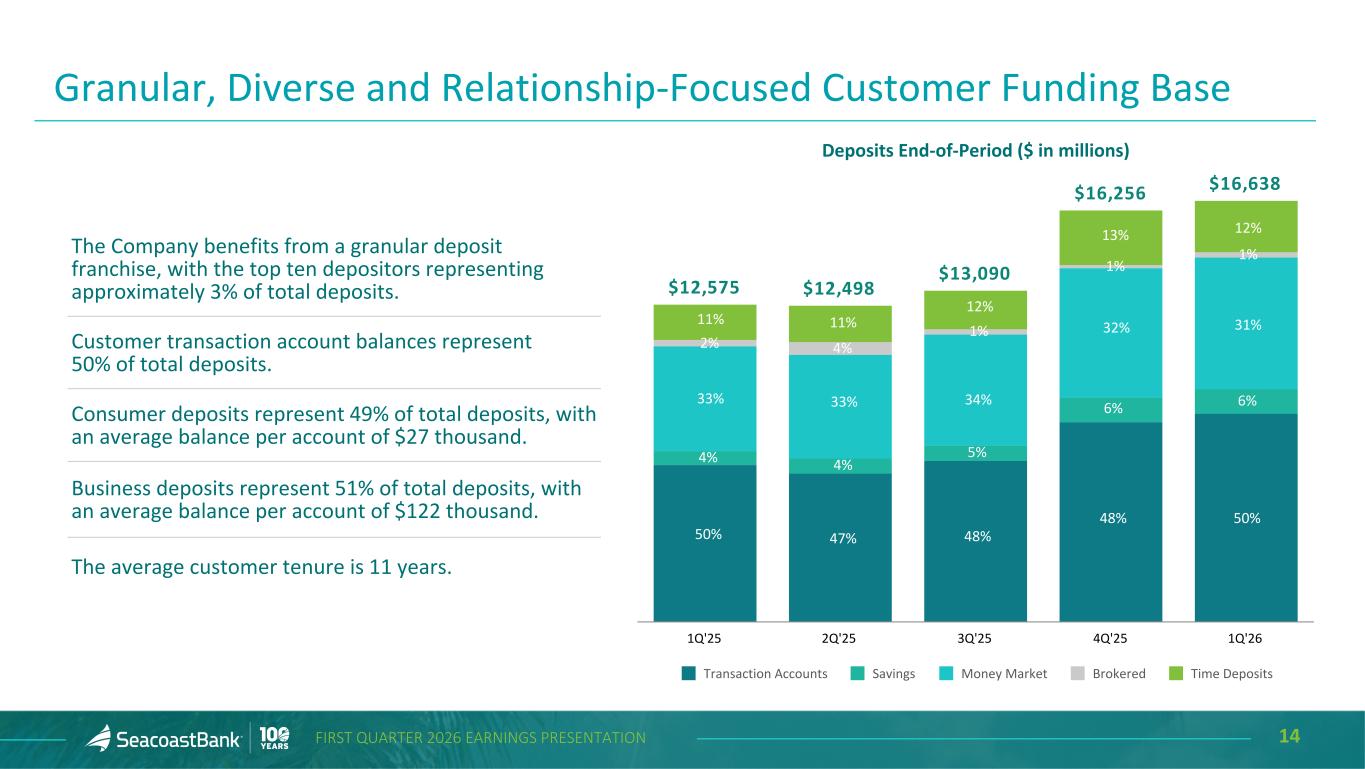
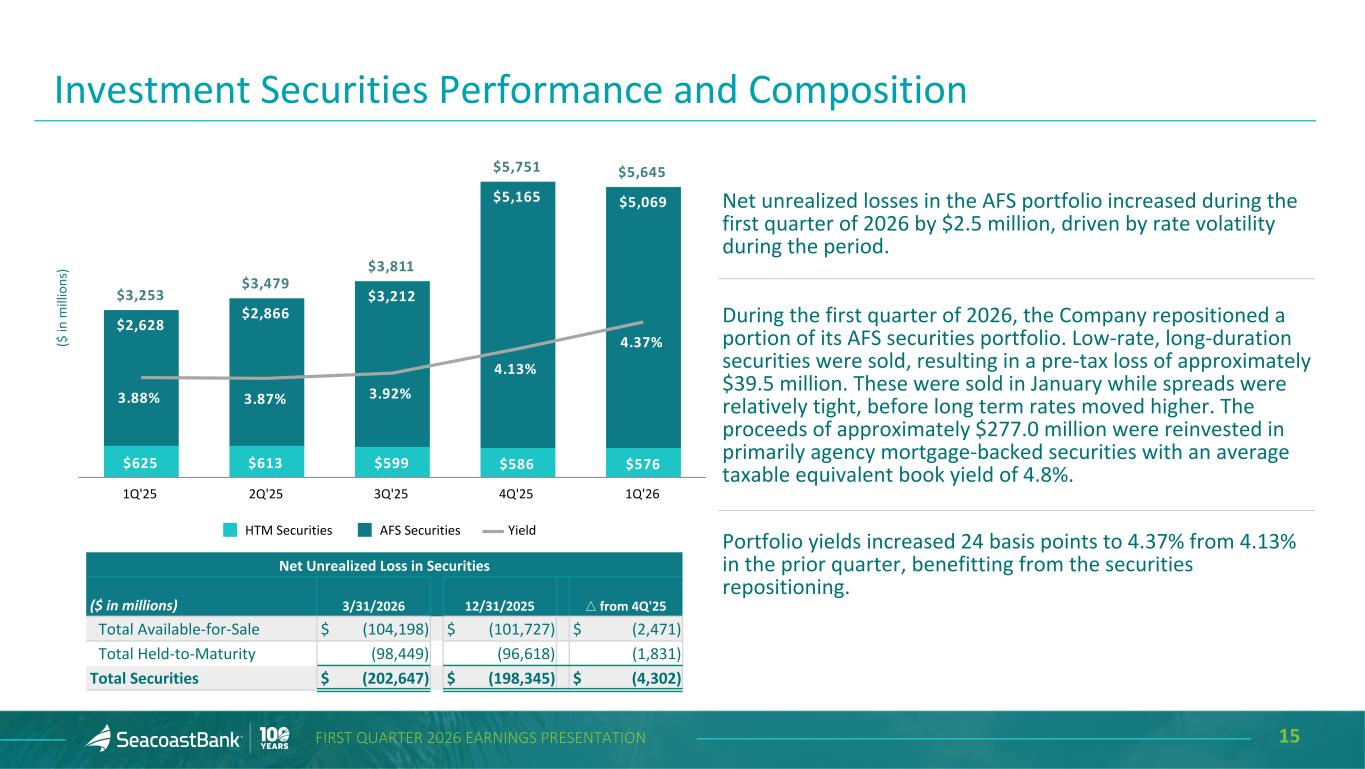
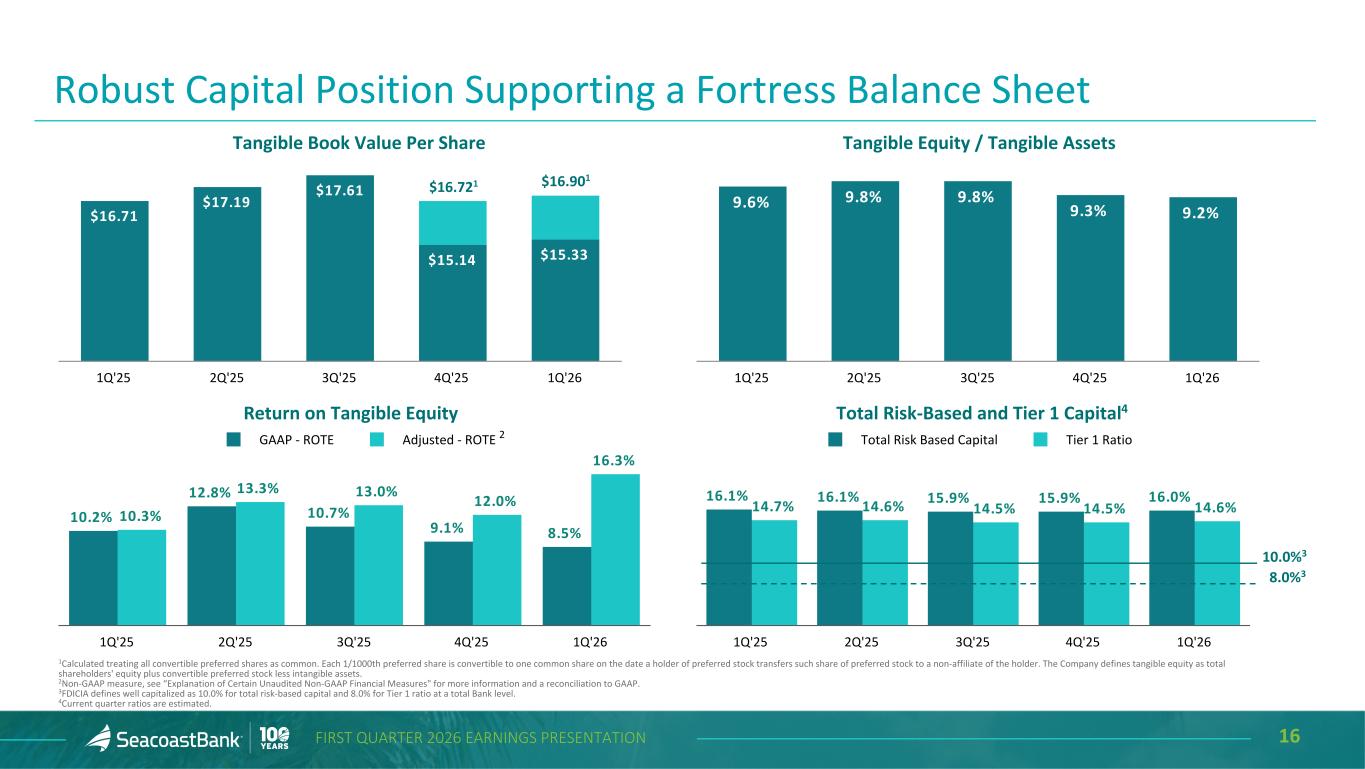
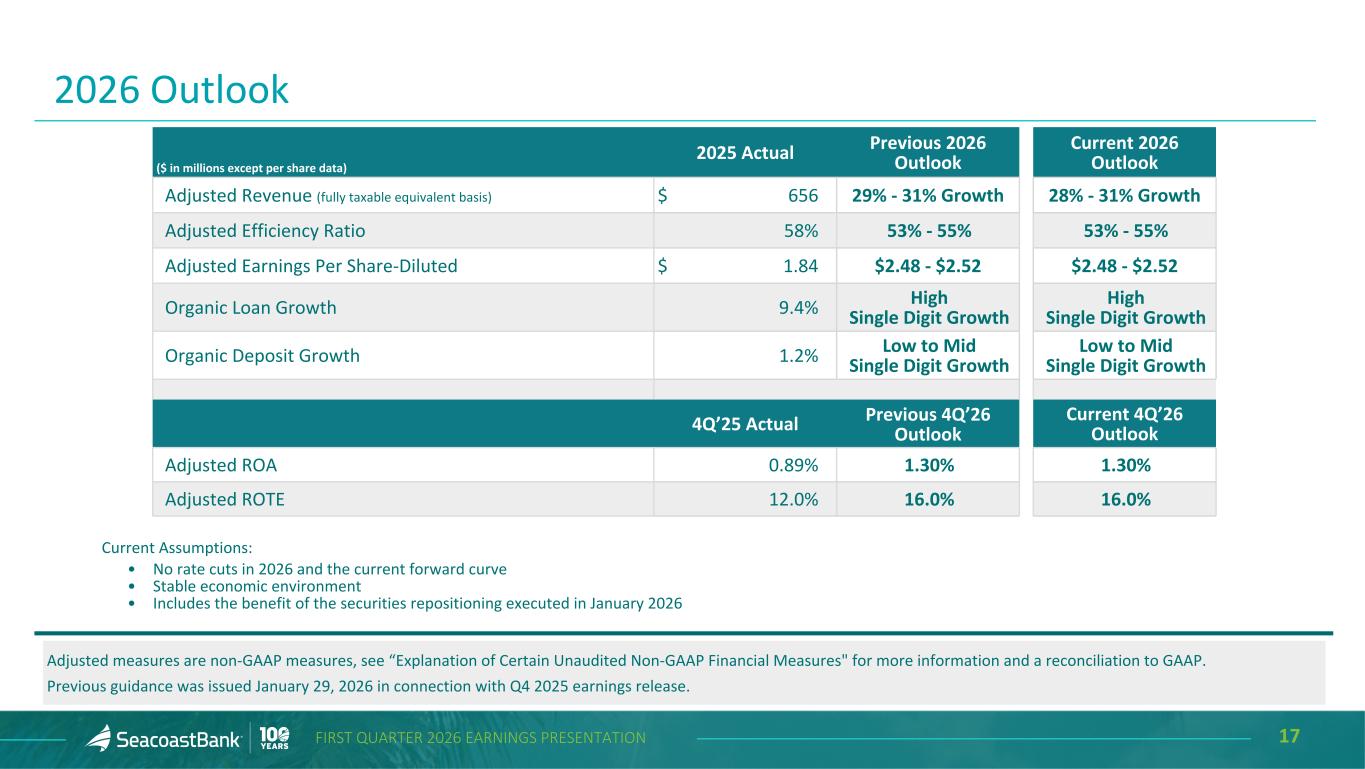
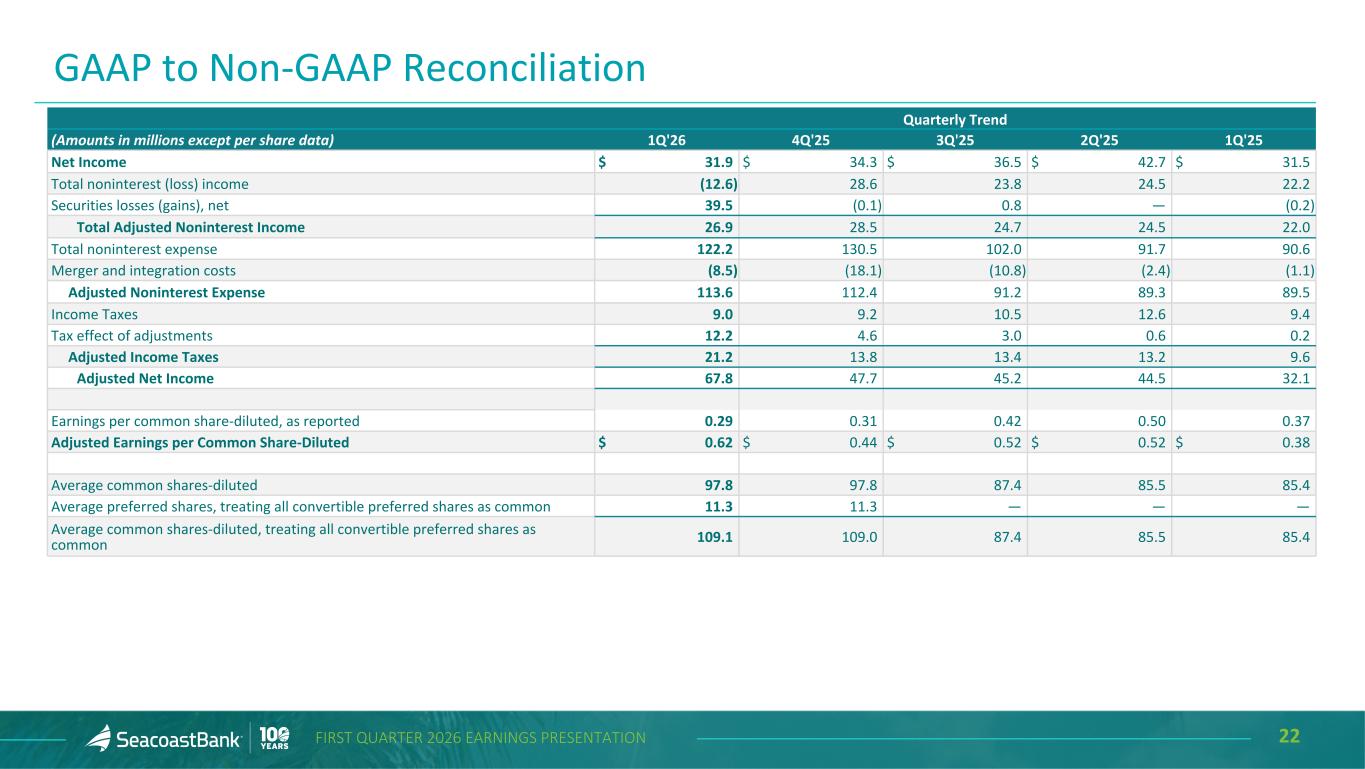
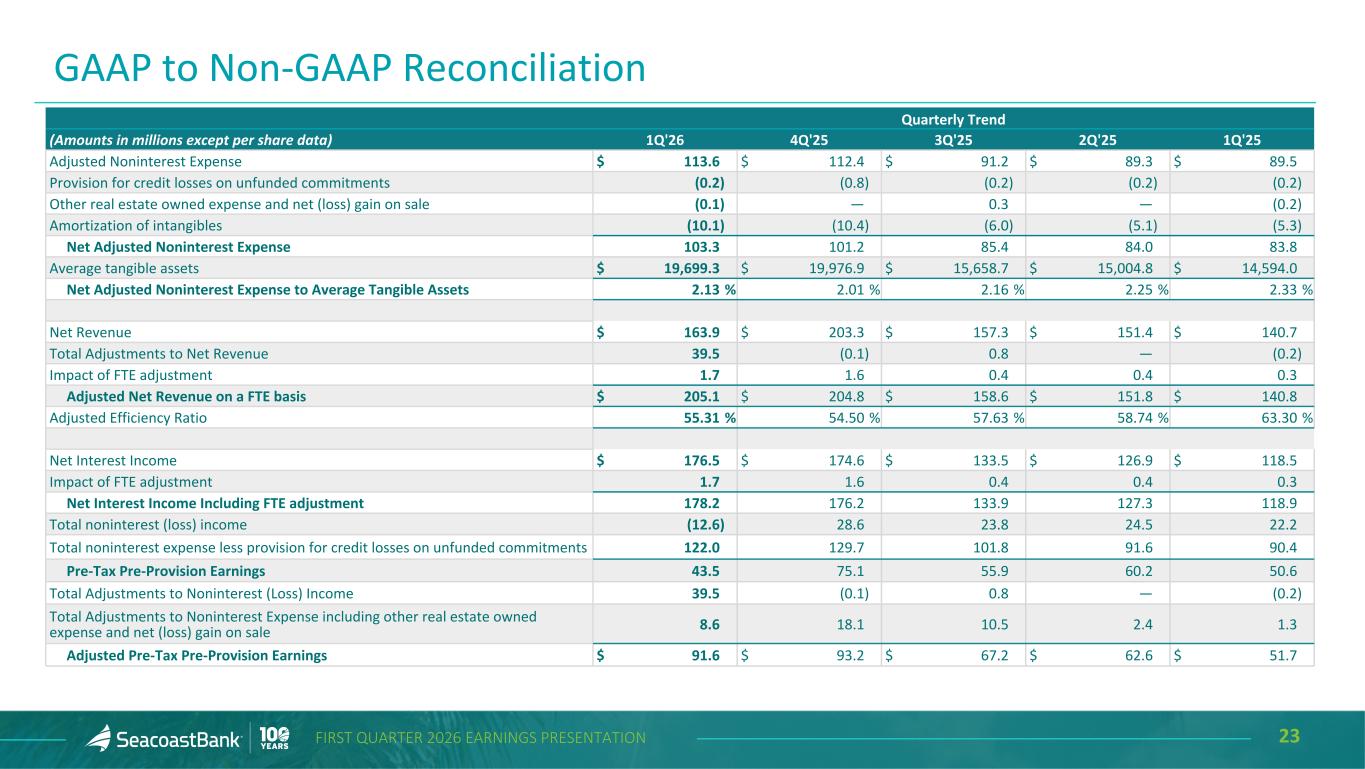
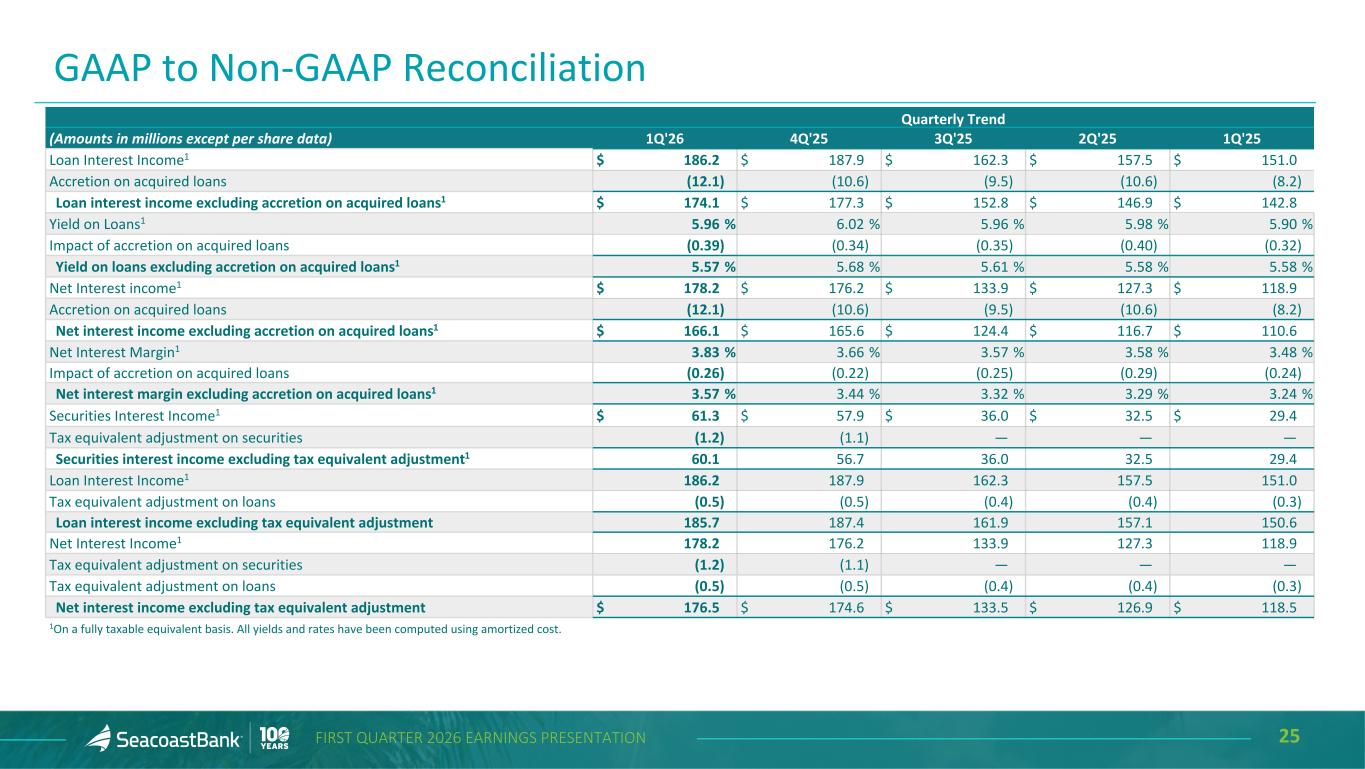
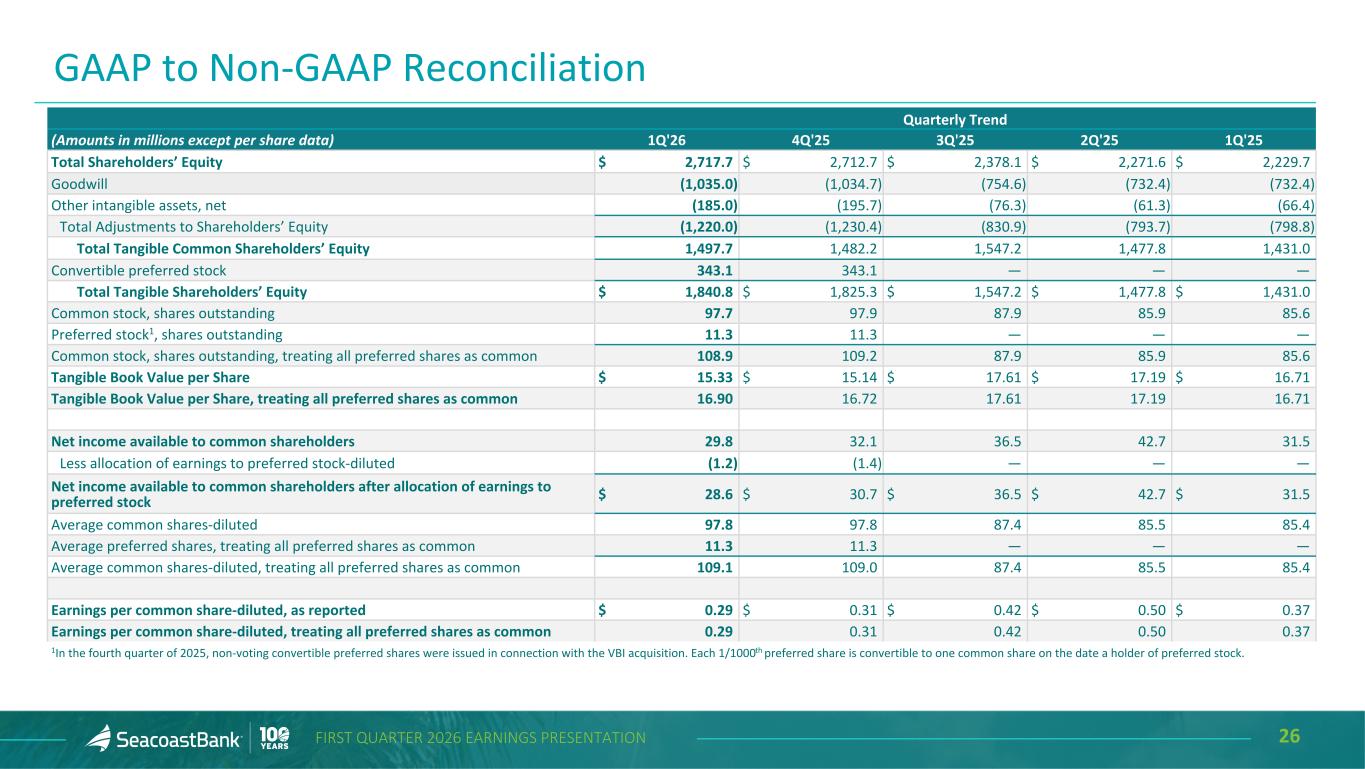
Thank you, Chuck. Good morning, everyone. Beginning with slide four and first quarter performance highlights. CECOS reported net income of $31.9 million, or $0.29 per share, in the first quarter. Reported results include a $39.5 million pre-tax loss related to the strategic repositioning of a portion of our available-for-sale securities portfolio, which we executed in January. On an adjusted basis, net income was $67.8 million, or $0.62 per share, increasing 42% from the prior quarter and 111% year-over-year. These results reflect meaningful improvement in our core earnings power, driven by expanding net interest income, disciplined balance sheet management, and continued execution on organic growth initiatives. During the quarter, we delivered 7% annualized organic deposit growth, including 29% annualized growth in non-interest-bearing demand deposits. We also delivered a 13 basis point decline in the cost of deposits to 1.54% and a 9 basis point decline in overall cost of funds to 1.71%. Expansion in the net interest margin was a highlight this quarter, driven largely by lower deposit costs and the bond portfolio restructure. On an adjusted basis, return on average assets was 1.31% and return on average tangible equity was 16.26%. Our capital position remains very strong. We also were more active in share repurchases, buying back over 317,000 shares. Turning to net interest income and margin on slide 5, net interest income totaled $178.2 million, up $1.9 million from the prior quarter. The net interest margin expanded 17 basis points to 3.83 percent, and excluding the impact of accretion on acquired loans, margin expanded 13 basis points to 3.57 percent. This improvement was driven by lower deposit costs combined with higher securities yields. Moving to non-interest income on slide six, reported non-interest income was a net loss of 12.6 million. Adjusted non-interest income, which excludes the securities repositioning, totaled $26.9 million, down 6% from the prior quarter and up 22% year-over-year, reflecting continued growth in fee-based businesses with the growth of the franchise. Wealth management remains a key contributor, with revenue up 36% year-over-year and assets under management increasing 33% year-over-year, including $125 million of new organic assets under management added during the quarter. Mortgage banking income declined from the the fourth quarter primarily due to volatility and mortgage servicing rights acquired in the villages transaction underlying loan volumes and pipelines remain strong in the business insurance agency income benefited from a seasonal contingent Commission payment increasing 0.2 million year-over-year moving to slide 7 our wealth management team delivered another quarter of strong results with income growing 36 percent year-over-year and AUM balances growing 33 percent year-over-year with a 21 percent annual CAGR in the past five years. We expect to continue to see strong volumes throughout 2026. Moving to slide eight, non-interest expense totaled 122.2 million in the first quarter, which includes 8.5 million of merger and integration costs. On an adjusted basis, non-interest expense was 113.6 million just slightly higher than the prior quarter importantly we saw continued improvement in operating leverage with the efficiency ratio improving to 59.5% and the adjusted efficiency ratio at 55.3% reflecting disciplined expense control alongside core revenue growth moving to loan growth and portfolio composition on slides 9 and 10 loans ended the period at $12.6 billion, up modestly from year end. Production remains strong, with growth largely offset by elevated payoffs during the first quarter. The commercial pipeline increased to over $1 billion at quarter end, supporting continued organic growth as we move through the year. Our loan portfolio remains well diversified by asset class, industry, and loan type, with average loan sizes that reflect the granular nature of our franchise and exposure levels that remain well within regulatory guidance and that provides significant flexibility for forward growth. On credit quality, shown on slides 11 and 12, asset quality metrics remain solid. The allowance for credit losses totaled 176 million, or 1.39% of loans, three basis points lower than the prior quarter. Combined with the remaining 138 million of unrecognized purchase discount on acquired loans we continue to maintain meaningful loss absorption capacity. We saw a modest increase in non-performing loans compared to the prior quarter to 0.75 percent of total loans though still well within the range of low historical levels. The increase in non-accrual loans during the first quarter reflects the movement of two commercial credits to non-accrual status each having collateral values well in excess of balances outstanding and therefore no credit loss is expected. Accruing past due loans declined, net charge-offs remained low at 11 basis points annualized, and criticized and classified loans were stable sequentially. Turning to deposits on Slides 13 and 14, total deposits increased $382 million during the quarter, or 9.5% annualized. Excluding brokered balances, growth remained solid and relationship-driven, with organic growth of 7% annualized. Deposit costs are lower by 13 basis points. Transaction accounts represented 50% of total deposits, and the deposit base continues to be highly granular, with the top 10 depositors representing only 3% of total balances. Moving to slide 15 in the investment securities portfolio. As I mentioned, we took advantage of constructive market conditions and repositioned a portion of the available-for-sale portfolio in late January, which will enhance forward earnings while maintaining balance sheet flexibility. We sold securities with proceeds of approximately $277 million, resulting in a pre-tax loss of $39.5 million, impacting first quarter results. The proceeds were reinvested in primarily agency mortgage-backed securities with a tax-equivalent book yield of approximately 4.8%. Turning to capital and liquidity on slide 16, CCOS continues to operate with a Fortress balance sheet. Tangible equity to tangible assets was 9.2%, and capital ratios remain very strong, providing significant flexibility to support organic growth, disciplined capital deployment, and opportunistic actions such as the approximately 317,000 in share repurchases completed during the quarter. On slide 17, we reiterate the guidance we provided last quarter. The adjusted earnings per share outlook remains unchanged at $2.48 to $2.52, with the potential for slightly lower revenue resulting from the change in previously expected rate cuts, but with no change to bottom line results. In summary, our results demonstrate meaningful improvement in core profitability, strong funding trends, and continued execution against our strategic priorities. We remain focused on disciplined growth and long-term shareholder value creation. With that, Chuck, I'll turn the call back to you.
All right. Thank you, Tracy. And Kate, I think we're ready for Q&A.
Operator
At this time, I would like to remind everyone in order to ask a question, please press star, then the number one on your telephone keypad. We will pause for just a moment to compile the Q&A roster. Your first question comes from the line of Woody Lay with KBW. Your line is open.
Hey, good morning, guys. Good morning, Woody. I just wanted to start on loan growth and, you know, higher payoffs impacted the growth in the quarter. But I just wanted to get a sense of how the pipeline was shaping up in 2Q26, especially given some of the macro uncertainty that's out there.
Thanks, Woody. And just to kind of go back to the quarter itself, payoffs were very elevated. We notated in the release and in the slides, you can see what it was year over year. And in particular, in the first quarter, we did have three larger credits pay off, an aggregate $150 million amongst the three. And it was multiple loans, so a couple borrowers in there. But so it was good news is they paid off. They're great borrowers. The bad news is we got paid off, but that's kind of the way the business operates. And so when we look forward into the remainder of the year, the pipeline remains strong. We expect we return to high single digits here in the coming quarters and remain very confident throughout the remainder of the year. You know, the impacts of the geopolitical concerns are unknown, I would describe at this point. It's still probably too early to tell. And so we'll have to see how that all plays out here over the back half of the year. But for now, we remain confident in the guidance and expect a return to high single digits.
Hey, Woody, this is Michael. Just adding on one thing at the end, you know, we had 15% annualized growth in the fourth quarter. Our average loan growth in the first quarter was still high single digits, kind of 9% plus. We just had a lot of pull through the pipeline late in the quarter. And so, you know, we still feel like we remain on track and consistent. And it's just our normal kind of seasonal trends here with, you know, strong fourth quarter production and growth. And then first quarter, you know, generally as expected, being a bit softer, particularly impacted by the payoffs. And then, you know, just maybe one call headed into the second quarter, we have a stronger kind of first quarter seasonal deposit growth. And then second quarter, we do see that kind of come back a bit before we have seasonal trends return to tailwinds in the back half of the year.
Got it. That's helpful. And then maybe on deposits, you know, I believe the first quarter is typically a seasonally stronger quarter. But, I mean, the non-interest-bearing deposit growth you saw in the quarter was really strong. Just trying to get a sense of how much you think that's seasonal versus, you know, actual core deposit growth.
Yeah, it's a good question. You know, we typically see outflows related to tax payments at the, you know, kind of end of first quarter, early second quarter. So we did see that normal kind of seasonal trend, but it's not that all of that came from DDA or non-interest-bearing deposits. Certainly some did, but, you know, I think we'll expect to hold higher levels of non-interest-bearing deposits as we move forward, given just kind of growth in aggregate across, you know, the franchise and growth in customer count. So, you know, we certainly see some tax-related outflows here in April, but not, you know, enough to backslide us on non-interest-bearing deposits.
Got it. And then maybe just last for me, so you have the villages conversion coming up here this summer. Can you just remind me how much cost days are still set to come out of the run rate?
Yeah, so we, you know, we articulated a 26, 27% cost out kind of at announcement. As we talked about, I think on the last call, we have an earning step, or I'm sorry, an expense step up here in the second quarter with our normal annual pay cycle and increase. You know, we'll expect maybe a little take up in the efficiency ratio headed into conversion as well in the second quarter. and then we'll see the cost-outs come in the back half of the year as our efficiency ratio begins to step back down into the fourth quarter. So that's kind of a way to think about it. We are, as we talked about, hiring and growing as well, and so that will offset some of the expense saves that are just discrete from the deal.
And I'd just remind you to push back to the guidance we laid out last quarter that's reiterated in the slide. We think a full-year efficiency ratio is somewhere between 53% and 55%. So as you're modeling, that's kind of the ballpark where we expect to be full here.
Perfect. Well, thanks for taking my questions. Congrats on a good quarter. Thanks, Woody.
Operator
Your next question comes from the line of Roslyn Garthor with Stevens. Your line is open.
Hey. Good morning, guys. Hey, Roslyn. Hey, Chuck. Maybe to start on the core margin would be helpful to get a sense for how you are expecting that to trend going forward, maybe touching on incremental commercial loan yields versus deposit costs. And then on that last front, as it relates to the cost of deposits from here, do you think you have the ability to continue to lower or is there perhaps with a fed on pause and upward bias to deposit costs embedded in the revenue guide?
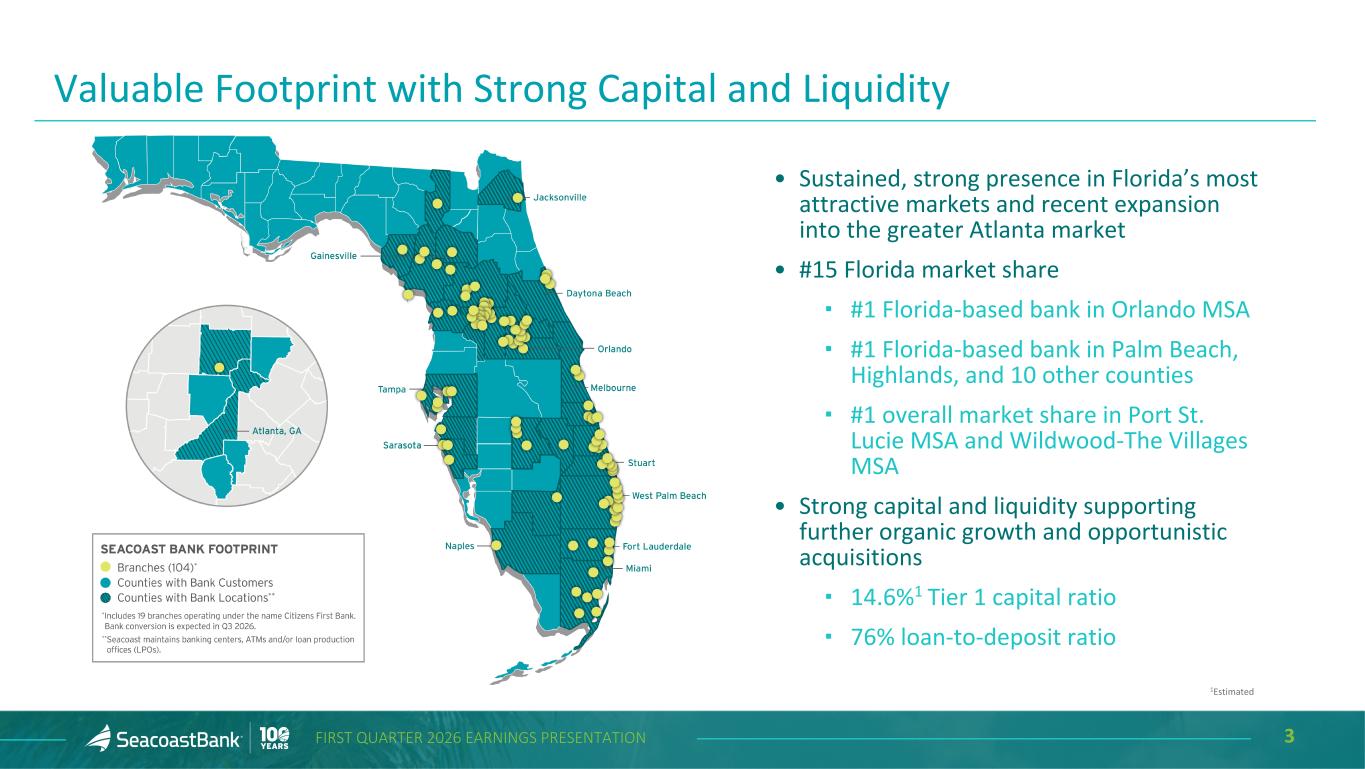
Hey, Russell, this is Michael. I'll try to hit each one. First, on the margin progression, we do expect continued margin expansion here in the second and third quarter. You saw we exited the quarter with lower deposit costs. Then we kind of started the quarter as we continued to blend the rate volume mix down. We're still at a 75% loan-to-deposit ratio, so we're in a really strong balance sheet position there. But I think as we've approached kind of this 130 ROA and 16% ROTE that we've been targeting, we do want to be on the offensive and grow. And so I think we'll continue to try to do that throughout the year while maintaining the profitability levels and the guidance that we talked about. But we do expect continued, you know, pretty nice margin progression here in the second quarter, third quarter. That will, you know, on the deposit cost side, without Fed cuts, as you saw, we revised the revenue guidance low end down by one percentage point. That's basically our rate sensitivity to two cuts is really all that is. And so, we could see some stabilizing to increasing deposit costs potentially later this year without Fed rate cuts as we grow the deposit balances from here. On the loan yields side, the other part of your question, we still saw kind of add-on yields in the low sixes this quarter. We are seeing a little more mix of residential mortgage retention, as we've talked about before, which with the long end of the curve at higher levels is pretty attractive rates and good risk-adjusted return. So we've seen that coming through as a benefit. On the commercial side, there's obviously been competitive forces at play, but we still are being disciplined there and really holding around kind of the 6% level.
Thank you, Michael. Thanks for tackling all of those. Maybe switching gears on the expense side, follow-up to the discussion already, appreciate the glide path. Maybe just some color or clarification in terms of your efficiency targets and how tethered that is to revenue. So if we're at the high end of revenue, should we be at the low end of efficiency or is there some flex there? And then kind of post-conversion, how do you think about a normalized growth rate for Seacoast given the franchise investment you kind of see ahead of you, at least on the lending hiring front.
Yeah, I would think about it this way. We put the guide out there, the 53 to 55, to give you a sense of where we think we'll land full year. You know, if revenue is higher, I think that does fall to the bottom line and push us to the lower end of that range. where, you know, given the fact that, as Michael laid out, we won't potentially have two Fed cuts that's going to probably not drive as low deposit costs as we thought we'd see on the back half of the year. And as such, that's going to require us to probably tighten a little bit on the expense side to navigate through that. But we're confident in our ability to deliver on the overall EPS range. You know, we'll sort of feather that depending on what the back half of the year it looks like, but we've given ourselves enough room to be 100% confident delivering the EPS range. So, you know, that'd be the way I think about it. Long term, you know, we'd like to run the company in that same range, kind of that 53% to 55% range is probably where we land. The way we're thinking about the business is running with a return on tangible equity north of 16, ROA north of 130, in high single-digit growth rates kind of with a 53% to 55% efficiency ratio delivers a really strong shareholder return compounding over time. And so that's kind of where I think the optimal run rate is for the company and what we're working to deliver to shareholders. Very helpful.
Thank you, Jeff. Thanks, guys, for taking my questions. Thanks, Russell.
Operator
Your next question comes from the line of Liam Cooheel with Raymond James. Your line is open.
Hey, good morning, guys. This is Liam on for David Feaster.
So, I appreciate all the color on loan and deposit growth. And I'm curious, where in your footprint have you been seeing the most success? And where do you expect the most opportunity to be moving forward? Is a lot of that deposit growth coming from the villages, or is it more of the poor markets?
It's broad-based. I mean, I would say that we're seeing good, solid growth in the villages. Some of the new offices that have opened in the Villages 2 development are growing nicely. We've been very pleased with that. Some of the expansionary markets up into North Florida, up towards Gainesville, Ocala, have seen really, really solid growth as we continue to expand what was the legacy Drummond franchise. And then we layered on a really strong banking team up in that market. And then Atlanta is also off to a really nice start. And so it's fairly broad based with most of the growth coming from probably the villages and the expansionary markets, some of the new markets we've opened up.
Great. Thanks. And then on deposit costs, do you expect non-interest balance growth to be the larger driver of total deposit cost reductions in the back half of the year, especially if we're assuming kind of more of a stable rate environment?
Yeah, it's a good question. I think, you know, we've been optimizing, particularly on the CD rate side, you know, letting some of the higher rate CDs roll down, which has been a driver along with some non-interest bearing growth and just repricing of money markets as the Fed cut rates. You know, I think as we move forward, some of it will be mixed driven, certainly that will improve cost of funds or maybe keep cost of funds from going up as much, you know, over the medium term. But then, you know, over time, it's really about the pace of growth. So if we need to grow at higher paces of growth, then we'll see a little more pricing pressure. So I think it's more geared to overall balance sheet growth and how quickly we're growing the deposit portfolio.
So that makes sense. And last thing for me to touch on was, it was really impressive to see the wealth management balance growth in a quarter where the market was down almost 5%. And with new asset growth continuing and the market rebounding in April, would it be unreasonable to expect some nice balanced growth into 2Q?
We do expect that to continue to grow. And some of what we're really excited about in the first quarter is we saw almost 17 million of new AUM coming out of the villages and 15-plus million coming out of what was the legacy Heartland market. So it's really great to see new opportunities coming out of those two new acquisitions from last year. And the business is operating exceptionally well, and we expect it to continue to grow throughout the year. I'm going to continue to remain very bullish on that business inside of Seacoast, and it continues to drive really solid returns on capital. And so ideally, as we move through time, we'll continue to get opportunities in the Villages' footprint and the remainder of the franchise. So, so far, everything's going right according to plan. Appreciate all the color. Thanks, guys. Thanks, Liam.
Operator
Your next question comes from the line of Kyle Gehrman with Hodei Group. Your line is open.
Hi, this is Kyle. I'm for Dave Bishop. Good morning. Good morning. In your guidance, you referenced plans for a meaningful banker. That count goes into 2026. I believe it was around 15%. I was wondering if you could update us on the progress so far this year, your target for, like, net new producers for 2026, and how that hiring pace factors into your efficiency and revenue guidance.
Yeah, I'll take that. We're about halfway there. That would be the way to describe it. We, through the first quarter, got about half of what we wanted to get done. Through the remainder of the year, we'll see what opportunities emerge. We're going to be thoughtful about making sure we manage efficiency and manage the EPS guide we've given, but we'll see what opportunities emerge for us. But so far, so good. We continue to focus on that, and particularly, as I mentioned earlier, some of the expansionary markets continue to add on bankers and remain excited about what's out there for us.
And maybe I was wondering how your M&A appetite kind of evolved heading into the back half of 2026, especially with the villages conversion approaching. I was wondering if you are actively evaluating in-market our adjacent opportunities in your Florida and Georgia markets is near-term focused squarely on integration and organic growth.
Yeah, great question. At the moment, it's heads down focused on integration. Obviously, the impacts of this transaction are substantial on the earnings profile of the company. We want to get this absolutely 100% right, and we're going to deliver a flawless conversion. The team is heads down, very focused on it, and I'm confident we'll get that done. As we come out of that, you know, we'd obviously be available to do M&A. We remain kind of focused only on Florida from an M&A perspective. There's only about a handful of banks left that are big enough and in the right markets to be impactful. And if one of those were to emerge, we would certainly look at it. But there is a limited opportunity set as we move through time under that structure. in. So it could be there. It might not be there. But right now, it's focused on the Villages.
You're taking my questions. Awesome. Thank you.
Operator
I'll now turn to call back over to Chuck Schaefer for closing remarks.
All right. Well, thank you all for joining us this morning. And just for the Seacoast team, really proud of the team this quarter. They continue to do an excellent job growing the franchise amongst working exceptionally hard to deliver an upcoming conversion. And a lot of hard work is going on on that as well with building around other new tools, AI, products. And we're going to come out of 26 much stronger than we came into it. So couldn't be more excited about the year ahead. And thank you all for being on the call. And we're available for follow-up calls if anybody has them. So that will conclude our call. Thank you, Kate.
Operator
Ladies and gentlemen, that concludes today's call. Thank you for joining. You may know disconnect.