Operator
Good morning. My name is Daniel and I will be your conference facilitator today. Welcome to T. Rowe Price’s First Quarter 2025 Earnings Conference Call. All participants will be in listen-only mode until the question-and-answer period. I will give you instructions on how to ask questions at that time. As a reminder, this call is being recorded and will be available for replay on T. Rowe Price’s website shortly after the call concludes. I will now turn the call over to Linsley Carruth, T. Rowe Price’s Director of Investor Relations.
Hello, and thank you for joining us today for our first quarter earnings call. The press release and the supplemental materials document can be found on our IR website at investors.troweprice.com. Today's call will last approximately 45 minutes. Our Chair, CEO, and President, Rob Sharps; and CFO, Jen Dardis, will discuss the company's results for about 15 minutes. Then we'll open it up for your questions, at which time we'll be joined by Head of Global Investments, Eric Veiel. We ask that you limit it to one question per participant. I'd like to remind you that during the course of this call, we may make a number of forward-looking statements and reference certain non-GAAP financial measures. Please refer to the forward-looking statement language and the reconciliations to GAAP in the supplemental materials as well as in our press release and 10-Q. Discussion related to the funds is intended to demonstrate their contribution to the organization's results and are not recommendations. All investment performance references to peer groups on today's call are using Morningstar peer groups for the quarter that ended March 31, 2025. Now I'll turn it over to Rob.
Speaker 2
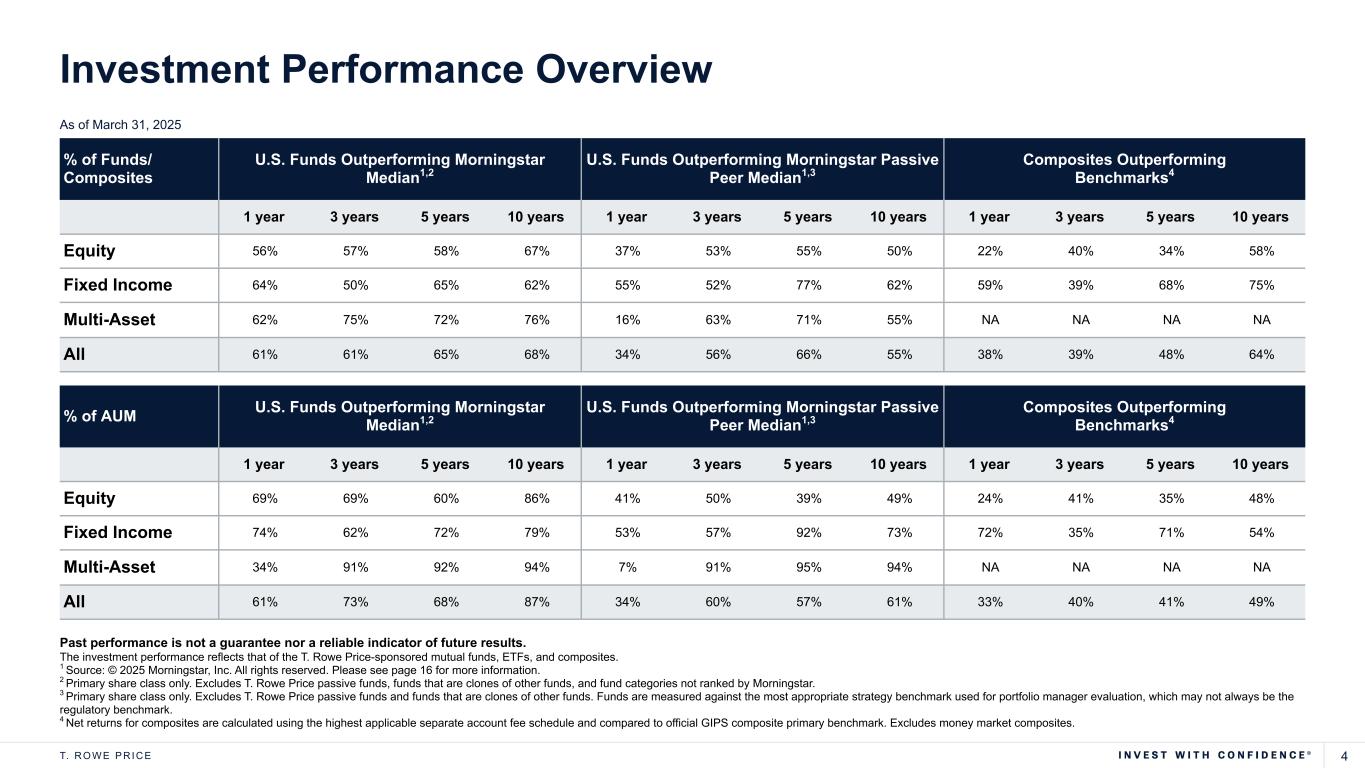
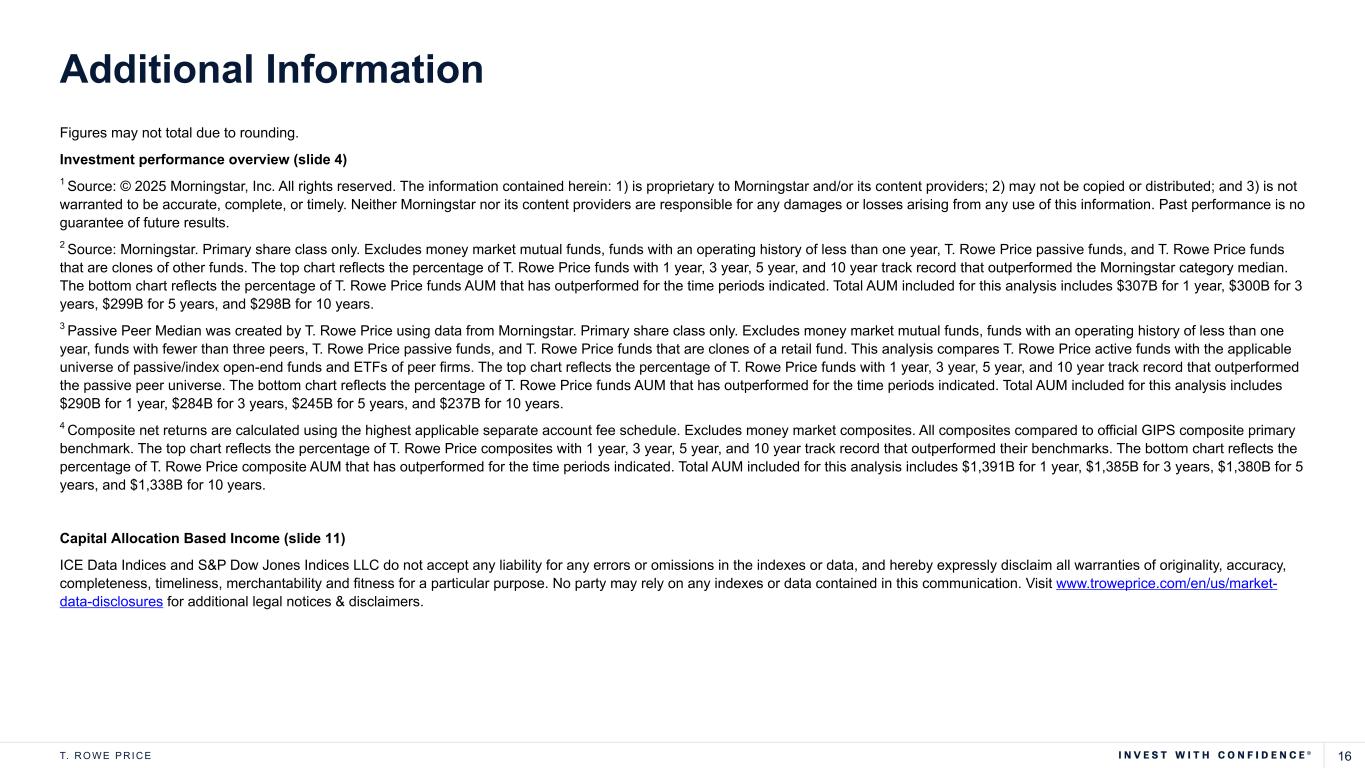
Thank you, Linsley. And thank you all for joining our first quarter update. Despite policy-driven market volatility pressuring our assets under management and revenues, we are making important progress. Our world-class investment platform, powered by broad and deep active research, makes us uniquely well-positioned to navigate periods of uncertainty and to help our clients do the same. We are extending our reach by leveraging our leadership position in retirement and the strength of our brand. I'd like to start with investment performance, which versus peers improved meaningfully from the fourth quarter with gains across asset classes. Over 60% of our funds beat their peer groups for the one, three, five, and ten-year time periods. Results were even stronger on an asset weighted basis, where 61% beat for the one-year time period, 73% for the three-year, 68% for the five-year, and 87% for the ten-year. In equity, value outperformed growth in the quarter, amid a shift in sentiment driven by tariff concerns and a sell-off in the technology sector. Against this backdrop, most of our value products delivered with strong performers across the franchise, including the equity income, large cap value, and value funds. Each moved from the bottom quartile in the prior quarter to the top quartile in the first quarter, boosting their one, three, five, and ten-year performance track records. International value and small cap value also delivered strong performance in the quarter, improving their long-term track records as well. In contrast, New Horizons, mid-cap value, US Equity Research, and a few of our sector funds had more challenging quarters. Target date performance was strong. 99% of our target date assets beat their peer groups for the three, five, and ten-year time periods. Our retirement strategies benefited from an overweight to and strong outperformance within value, as well as a tactical overweight to international and real assets and strong security selection. However, the glide path's overall level of equity exposure detracted across vintages. Fixed income performance was solid, with 64% of funds beating their peer group median on a one-year basis and 65% on a five-year basis. We had more mixed results for the three-year time period with 50% of funds beating their medians. The best performing fixed income segment in the quarter was U.S. taxable bonds. Alternative portfolios produced mixed results in the first quarter. Private lending strategies generated the strongest gains, followed by structured strategies that benefited from timely monetizations. Performance of opportunistic and liquid strategies was mixed, driven by negative developments in certain positions. Deployment of capital and private lending funds was muted due to the generally slow M&A environment. In addition to improved investment performance, we also strengthened our leadership position in retirement in the first quarter, including expanding our reach beyond the United States. We launched the Retirement Date Fund Series in partnership with a Japanese asset manager, marking the first time we've offered our customized glide path design expertise in this market. We were selected as one of four external asset managers to partner with a leading global banking institution to develop a series of custom retirement-related funds to be distributed in Asia, the UK, and the Middle East. We are growing our longstanding custom target date relationship in Korea with increased net flows in the quarter. Outside of Asia Pacific, we were notified of our first client commitment for the newly launched T. Rowe Price Retirement Date Series in Canada. In the US, we launched Social Security Analyzer, a tool designed to help financial advisors optimize their clients' benefits by building custom strategies, conducting in-depth analysis, and providing side-by-side comparisons among various Social Security claiming strategies. And we are examining how allocations to private market alternative investments could add to our target date franchise, so we are ready if or when plan-sponsored demand materializes. We remain the largest provider of active target date products and continue our work to adapt the target date franchise and to bring this capability to new clients and new markets. Beyond our strengths in global retirement, we built momentum with our ETF and SMA offerings. We launched two transparent equity ETFs, hedged equity and capital appreciation premium income, our latest addition to the capital appreciation suite. Both ETFs integrate our strong equity research platforms with hedging strategies. These additions bring our roster to 19 ETFs with over $12.5 billion in assets under management as of March 31, including allocations from our multi-asset products. Nine of our ETFs have surpassed $500 million, with three reaching over $1 billion. We also broadened our lineup of SMA offerings with the launch of integrated US small cap growth and integrated US small mid core, which combine our fundamental and quantitative processes in this tailored vehicle structure. In the first quarter, we continue to be recognized for our people, products, services, and workplace. The T. Rowe Price OHA Select Private Credit Fund, referred to as OCREDIT, was named 2024 BDC of the Year Americas by a private debt investor. For the 15th consecutive year, we were named one of Fortune Magazine's World's Most Admired Companies. And for the third year in a row, our firm placed in the top 10 in Extel's 2024 ranking of America's top asset management firms. T. Rowe Price associates maintained its number two position among the over 350 asset managers nominated. This was the first year that T. Rowe Price Investment Management was recognized in the corporate survey at seventh place. We also officially opened our global headquarters at Harbor Point in Baltimore, designed to support our culture of collaboration and enhance the associate experience. Despite this important investment, we are being thoughtful about controllable expenses to preserve our ability to invest in our strategic initiatives and strengthen our right to win. Finally, our balance sheet remains strong with $3.3 billion of cash and discretionary investments. We continue to prioritize returning capital to our stockholders and recently announced a quarterly dividend of $1.27, which increased for the 39th consecutive year. We will be opportunistic in our approach to stock repurchases, strategically leveraging market downturns for selective buying opportunities. Before I turn to Jen, I want to thank our associates for their resilience and steadfast commitment to clients. For nearly 90 years, our associates have been trusted to help people navigate the ups and downs of markets, and they continue to build on that legacy today. Now, Jen will share a view of our first quarter financial results.
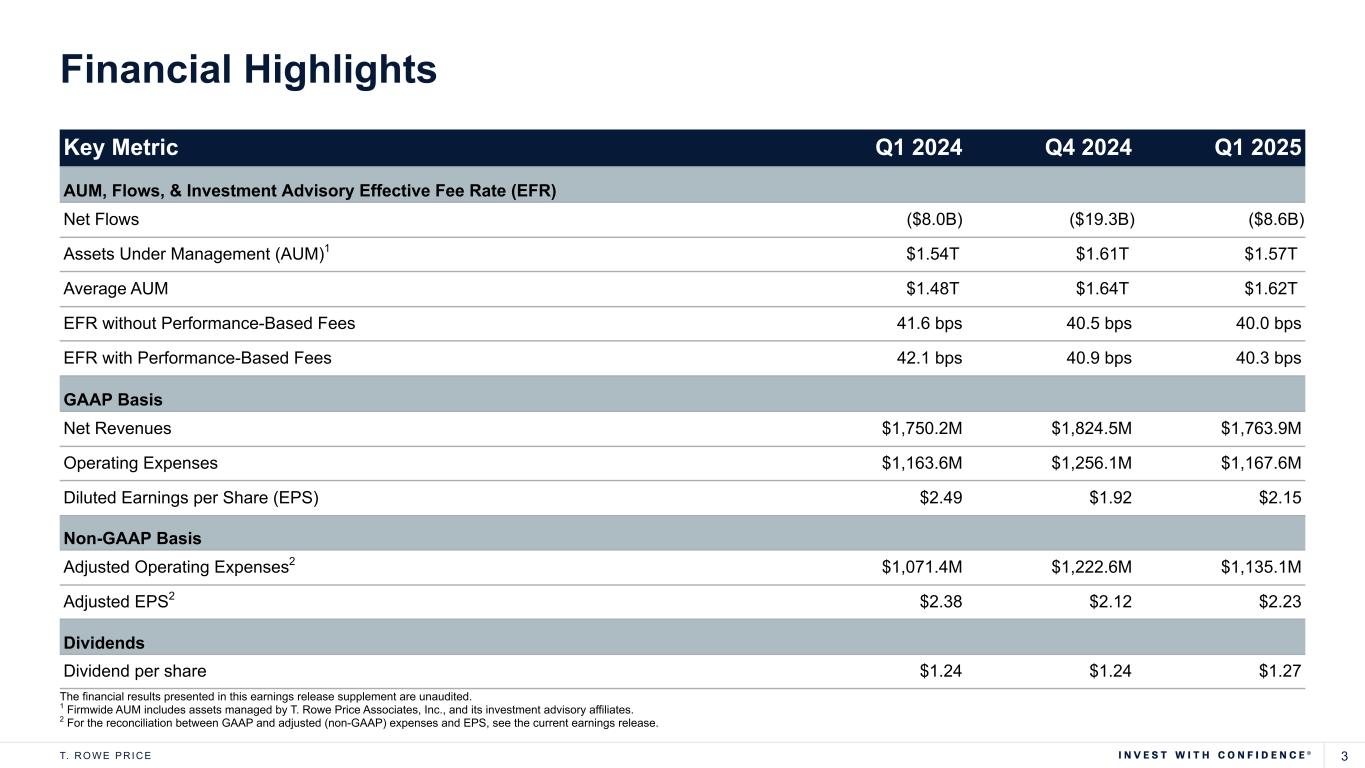
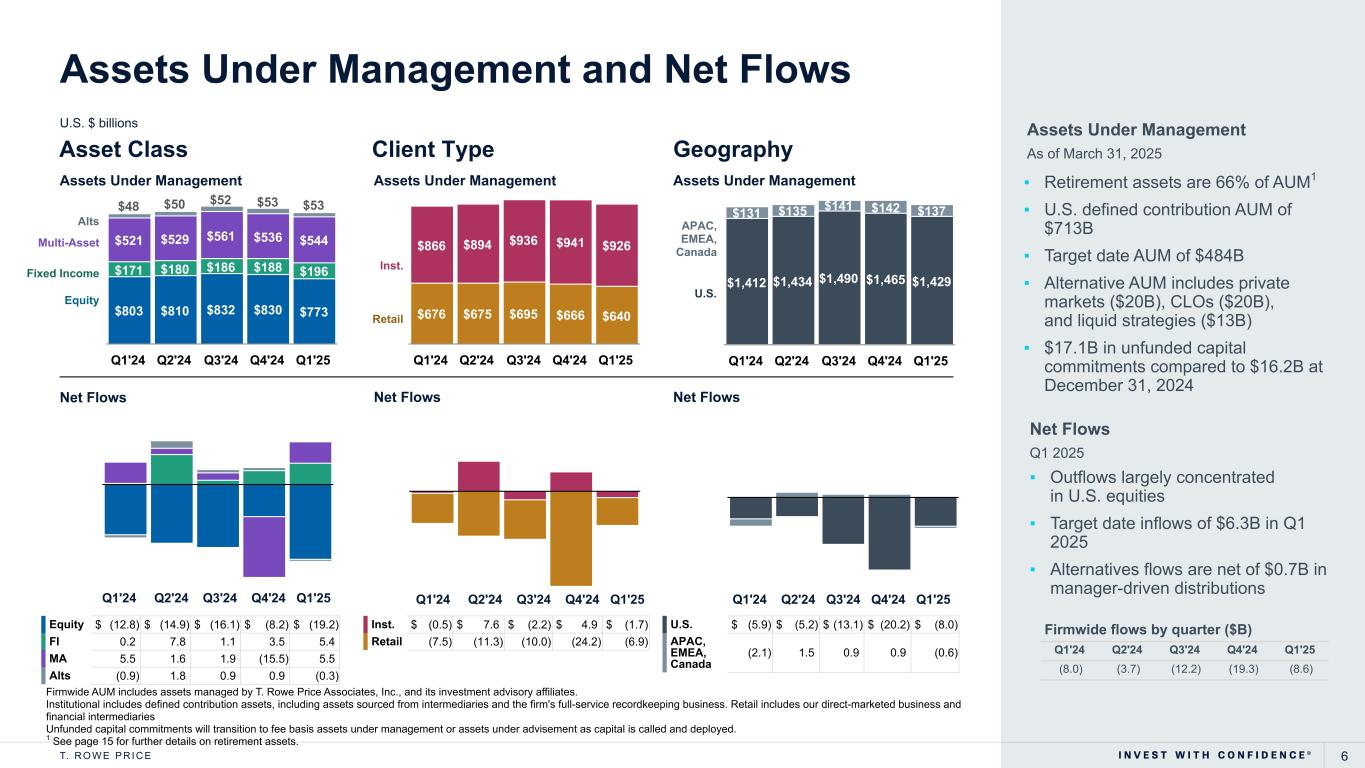
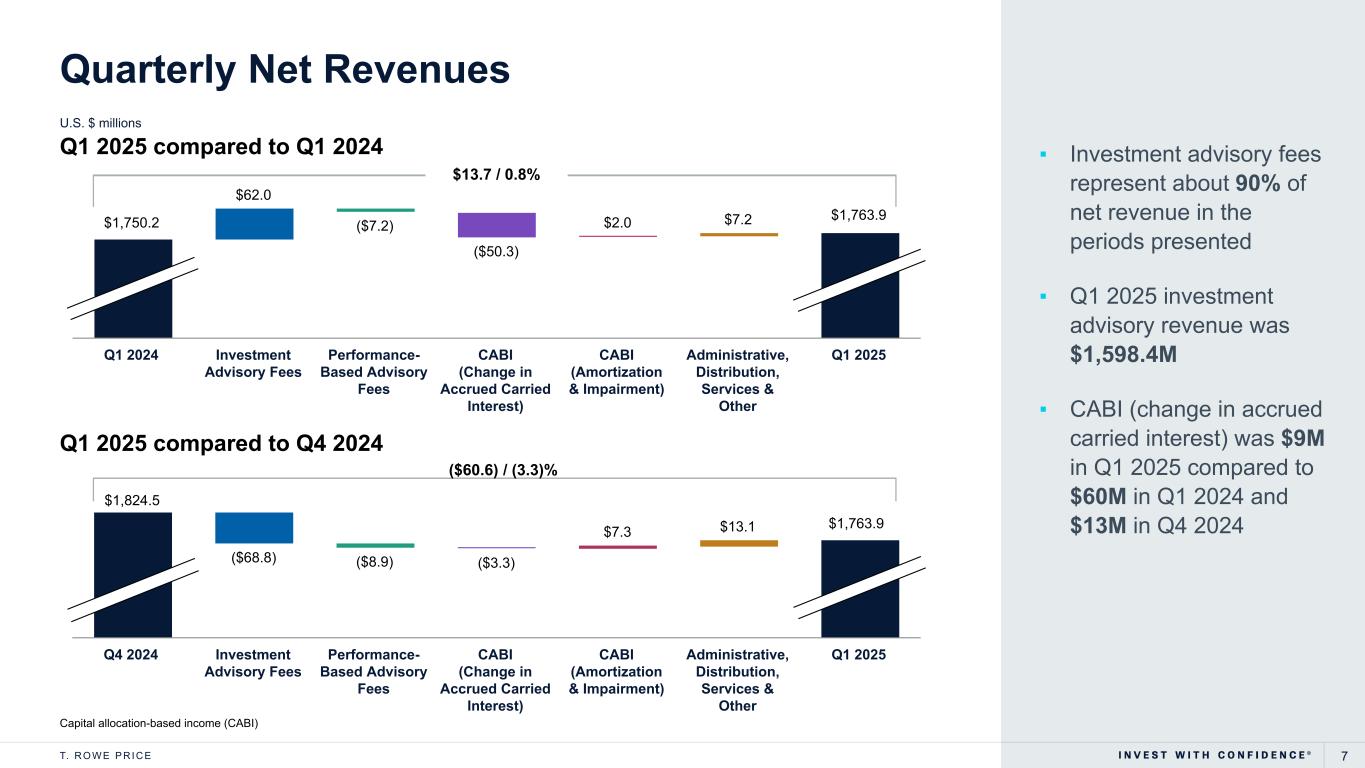
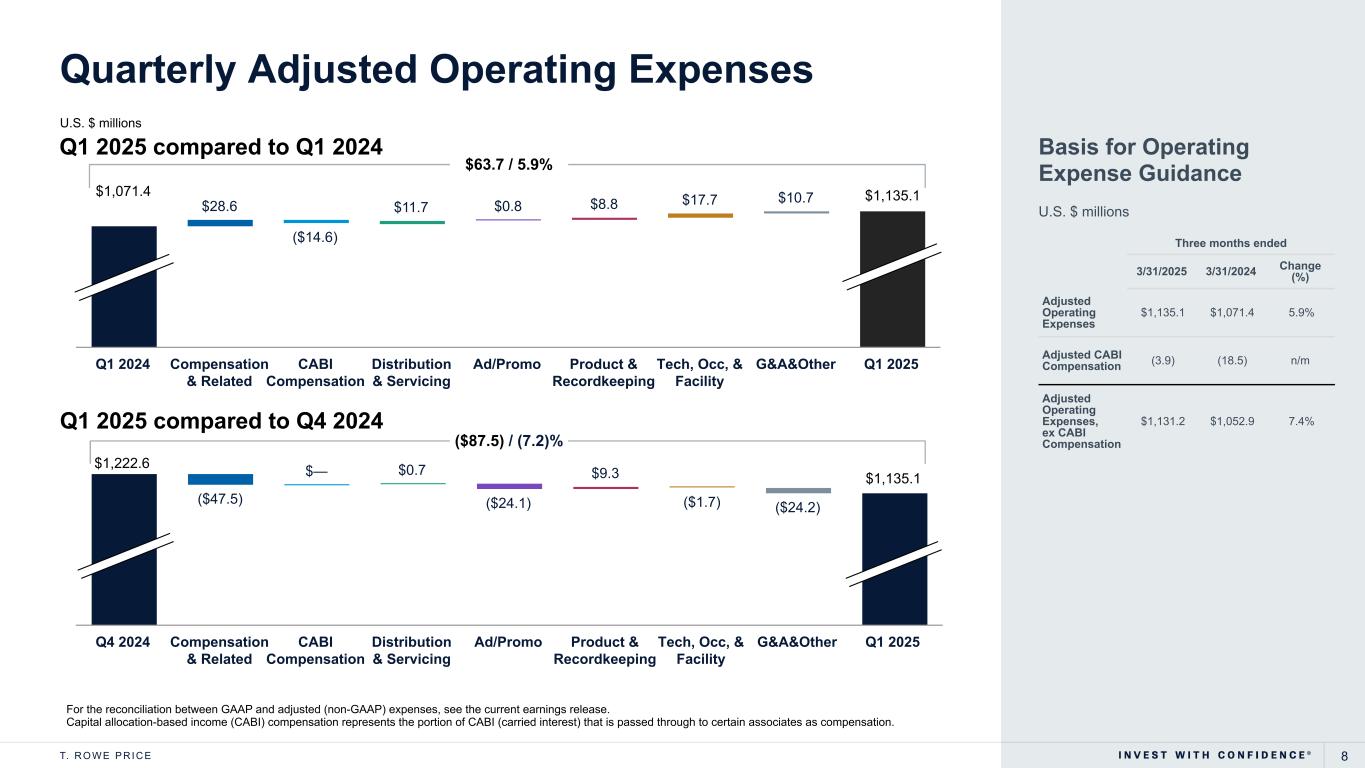
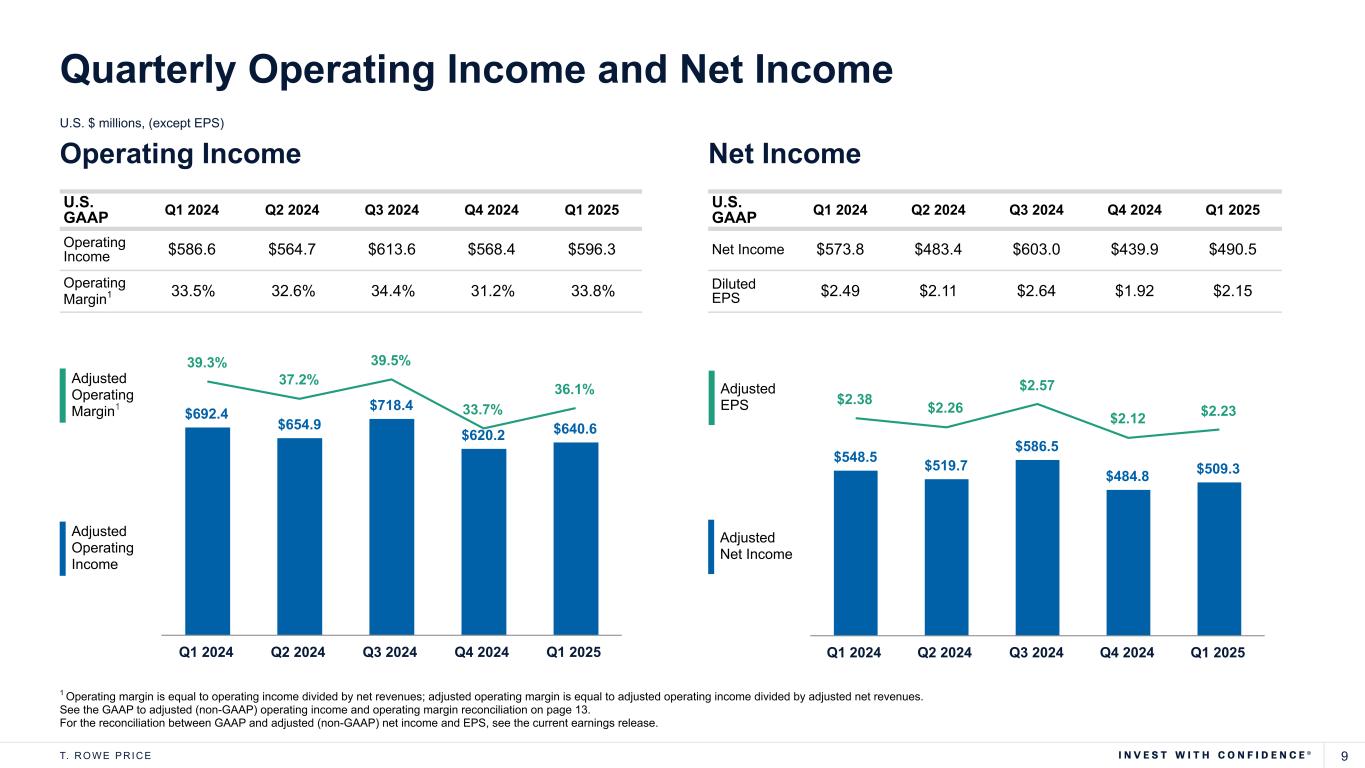
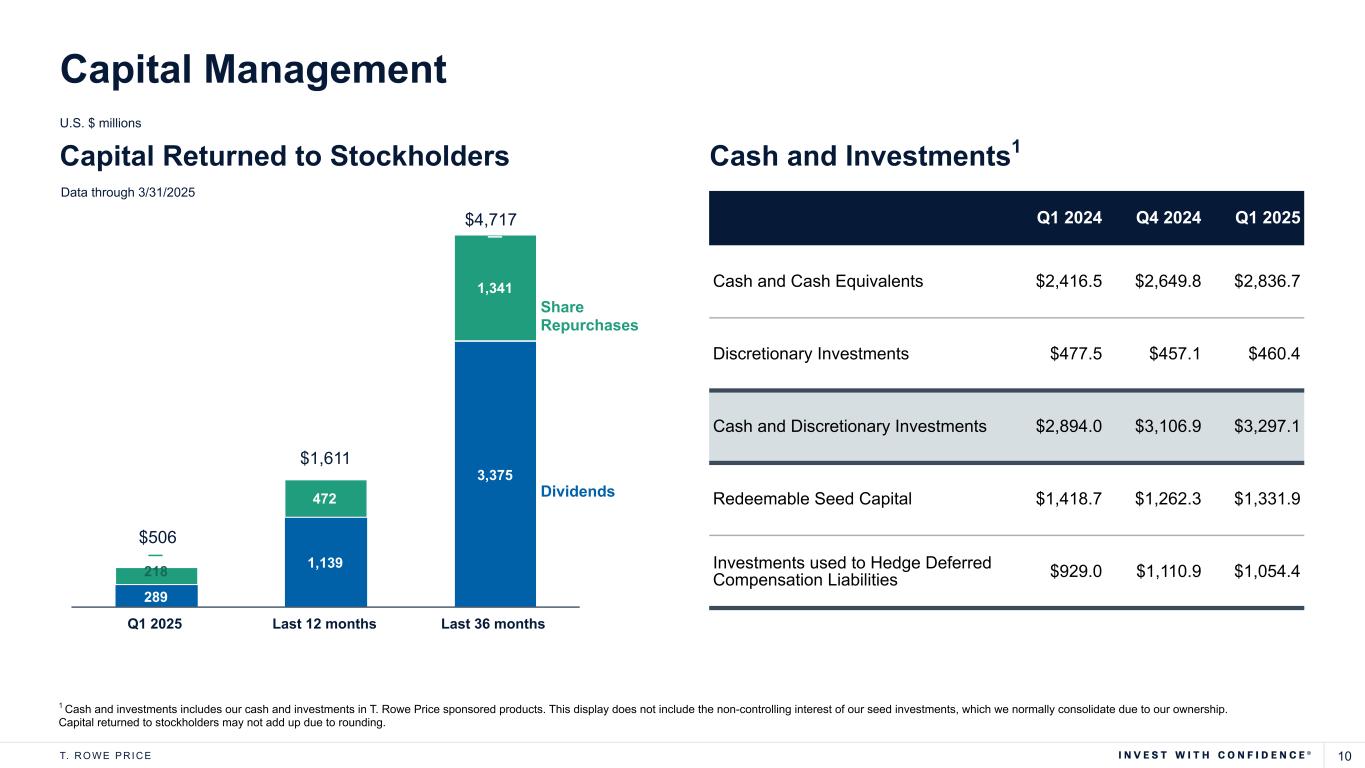
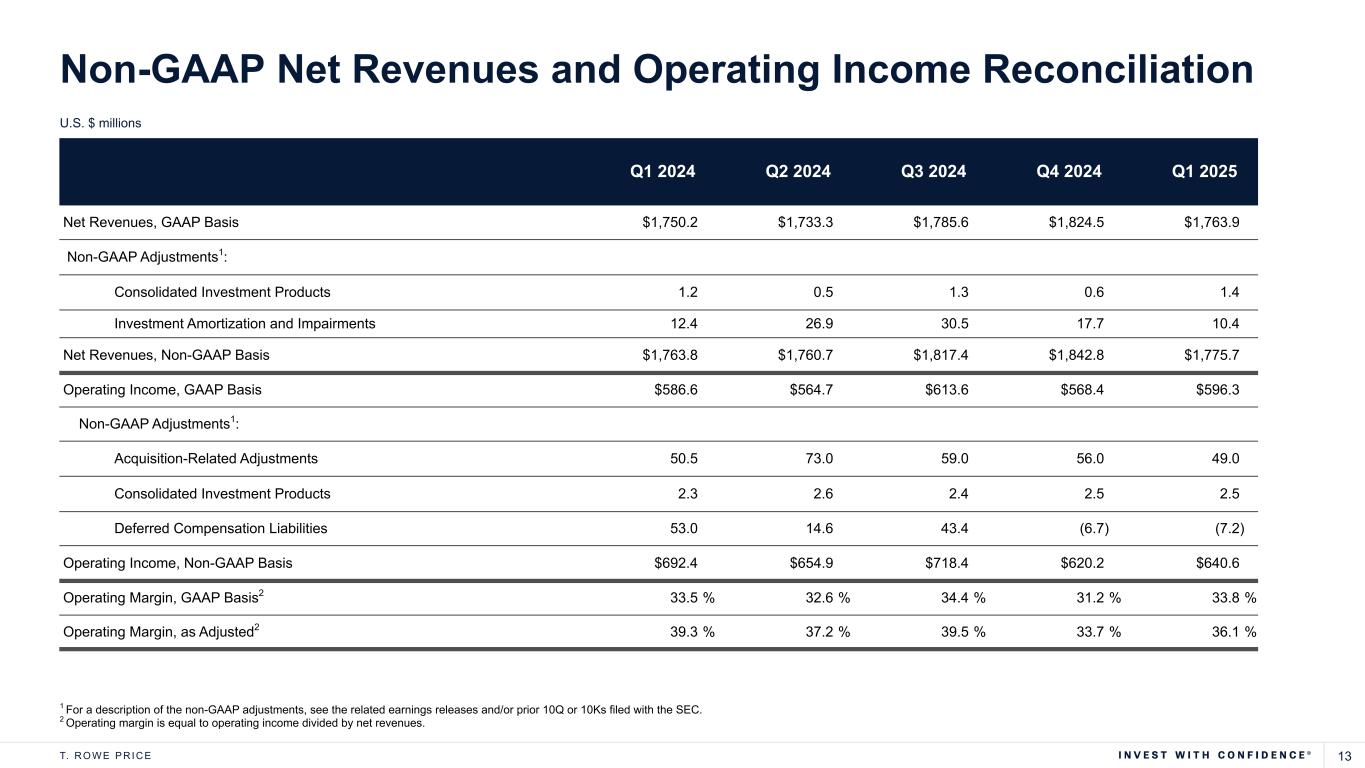
Thank you, Rob. And hello, everyone. I'll review our first quarter results before turning to Q&A. Our adjusted earnings per share of $2.23 for Q1 2025 is down from $2.38 in Q1 2024, but up from $2.12 in Q4 2024. This quarter's $8.6 billion in net outflows were largely driven by U.S. equities and rebalancing activity later in the quarter. However, we saw a few positive areas. Our target date franchise had $6.3 billion of net inflows, led by the continued success of our blend products. In fixed income, we had strong net inflows of $5.4 billion, primarily from institutional clients. Global multi-sector, floating rate bank loan, and global government bond high quality each had over $1 billion of net inflows. Our ETF business had another successful quarter with net inflows of $3.26 billion. Notably, eight of our ETFs each had inflows of over $100 million and capital appreciation equity had almost $1 billion of inflows. We will report April assets inflows on May 12th, but it's worth highlighting that the rebalancing we saw in late March accelerated in the first two weeks of April with equity market declines and volatility. This increased our retail outflows from recent trends, but that pattern normalized in the second half of April. Turning our attention to the income statement, our Q1 adjusted net revenue of $1.8 billion increased marginally from Q1 2024 and is down 3.6% from Q4 2024. This quarter's investment advisory revenue of $1.6 billion increased 4% compared to the first quarter of last year due to higher average AUM. The impact of higher AUM was offset in part by a lower effective fee rate. Performance-based fees from certain equity and alternative strategies for the quarter were $10 million. The increase in investment advisory revenues was offset by a lower change in accrued carried interest. The Q1 annualized effective fee rate, excluding performance-based fees, was 40 basis points, which declined from the prior quarter and Q1 2024. This decrease continues to be driven by a mixed shift in assets, both for market and flow impacts. Regarding the flow impact, gross sales are concentrated in strategies and vehicles that have lower than average fee rates, while a large portion of redemptions occur in the equity asset class and the mutual fund vehicle, which have higher than average fee rates. Our Q1 2025 adjusted operating expenses, excluding carried interest expense, totaled $1.1 billion, a 7.4% increase from Q1 2024. This rise was primarily due to higher market-driven expenses resulting from the growth in AUM throughout 2024, as well as increased compensation costs. Additionally, Q1 2024 included a one-time cost benefit related to our firm's UK facility that didn't recur in Q1 2025. Our adjusted operating expenses were down 7.2% from Q4 2024 as a few expense categories run seasonally higher in the fourth quarter. We moved into our new global headquarters in Baltimore at the end of Q1. Given the timing of our move, there was minimal expense impact during the first quarter. Depreciation began in April, and our lease at our former location also ended in April. We now expect 2025 adjusted operating expenses, excluding carried interest expense to be up 1% to 3% over 2024's $4.46 billion, which is down from the 4% to 6% range given in February. The lower range is largely driven by market-driven expenses so we are also taking steps to more closely manage other expense categories. As Rob mentioned, our balance sheet remains strong and we continue to prioritize redistributing capital. We returned over $500 million to stockholders in the first quarter with $289 million supporting the quarterly dividend of $1.27. We also bought back $217.5 million worth of shares in Q1, bringing our weighted average share count to 222.6 million. Under a share repurchase plan in April, we bought back an additional $65.4 million worth of shares, bringing the total buyback through April 30th to $283 million. With recent market volatility, we will continue to focus on execution for our clients and on investing in opportunities to drive growth. At the same time, we will carefully prioritize our expenses to reflect the market environment. And now, I'll ask the operator to open the line for questions.
Operator
Our first question comes from Michael Cyprys with Morgan Stanley. Your line is open.
Speaker 4
Hi, good morning. Thanks for taking the question. Maybe just to kick off on ETFs, it's great to see the expanded flows and reaching $12.5 billion of AUM there. I just hope that you can elaborate a bit on the steps that you're taking to drive this early success, how you see your ETF business progressing over the next 12 to 24 months? And then just more broadly on ETFs, how are you thinking about the opportunity set for an ETF share class on existing strategies given that Vanguard's patent on the ETF share class expired. Maybe just talk about the opportunities that you see for the industry and for T. Rowe, how you might see that playing out? What's the path and timing look like for that? Thank you.
Speaker 2
Yes, Mike, good morning. This is Rob. Thanks for the question. I'm really excited about our opportunity in ETFs. As you noted, we are really building momentum. We've broadened our range of offerings. We've got 19 in the market now, and I think a number of them are compelling and differentiated. We've also got several on the roadmap. As we scale the funds and build track records, I'm excited about the placement that we're getting on a number of wealth platforms. We're investing in specialist sales capabilities to drive sales in the field and to reach more ETF users. With regard to your question regarding the keys to success so far, I'd point out a handful of things. One, strong performance from our investments team. Two, being able to scale the products. A lot of clients require a minimum level of AUM in order to put them on their platform. Driving platform placement, which our USI team is doing a very good job with. I think, again, having a compelling and differentiated offering is obviously helpful. This is an area that is intensely competitive. And I would say, finally, as you bring that all together with more scaled and well-placed ETFs, it will make sense for us to put more marketing muscle and invest more dollars behind our ETF suite. If you look ahead as we round the suite out, one area where I think there's a big opportunity that we haven't largely tapped into yet is third-party asset allocation models. I think adoption of T. Rowe Price asset allocation models using T. Rowe Price ETFs as underlying building blocks is a big opportunity and it's an important offering for many advisors. So again, the more building blocks we have that are scaled with a compelling track record, the more underlying opportunity we have to build attractive models. I would say longer-term, there's also really accelerating demand for ETFs outside of the US, so that can drive another leg of growth. I think for us that'll be more of a 2026 and beyond story. But I think we've got a very, very long way to go in the US. Regarding your question on ETF as a share class, our Washington research folks believe that it is likely. And my perspective is that it will create some opportunity to offer an ETF version of an existing open-ended fund, which is helpful in the sense that you're already scaled and you already have a track record. That said, we'll be really thoughtful about where we choose to do this. Our understanding is that it will only be available for ETFs that are offered in a fully transparent format. So we'll have intellectual property considerations. Since you can't close an ETF, we'll also have capacity considerations. And finally, I would say there are other client-oriented considerations that we'll need to take into account. So it's unlikely that we would utilize ETF as a share class for certain of our funds, but we've identified a number of them where we think it's an attractive opportunity.
Speaker 5
Hey, Mike, this is Eric. I would just add to what Rob said around innovation. The two most recently launched ETFs, the capital appreciation premium income ETF and the hedged equity ETF, we think are really differentiated in the market and fill an important need. We're excited about those. They came with some additional complexity from a process perspective, and the teams internally did an excellent job getting them ready. So we're really excited about those out in the market. We also have a rich pipeline of additional ETFs coming, some of which we've already filed for, including building out our suite of sector ETFs. And then we have more behind that on both the fixed income side as well as additional equity ETFs coming.
Operator
Thank you. Our next question comes from Ben Budish with Barclays. Your line is open.
Speaker 6
Hi, good morning and thanks for taking the question. Rob, you talked a little bit about OCREDIT in your prepared remarks and the sort of private lending environment. Could you perhaps remind us how much of your AUM is sort of related to direct lending? And then for OCREDIT, I was wondering if you could give us an update in terms of what you're seeing in April, any sort of change in investor appetite would be helpful. Thank you.
Speaker 2
Yes. So our private market alternatives is roundly $20 billion and that's largely private credit. OHA has been very successful with raising capital commitments in the senior private lending area over the course of the last couple of years. The deployment has been more limited given the relatively soft LBO and M&A environment. So there's a lot of dry powder there that ultimately can go from committed capital into the fee basis AUM, which is what drives flows for us with OHA. In terms of OCREDIT specifically, it's been slower than we would have liked. It's an intensely competitive area. We had $54 million of flows in the quarter, but it's building. We're adding more placements. We're on eight platforms now. We're in advanced discussions with a few others. We're building out our field sales coverage and our team of regional investment consultants, our wholesalers are at this point up to speed on OCREDIT. So we think there's a very big opportunity over time to deliver OHA's capabilities through a range of different, whether it's evergreen vehicles or more traditional GPLP structures to the wealth area. But it's been intensely competitive and slower than we would have liked. Given the recognition of OHA as BDC of the year, I think that will be helpful. I think some of the placements on a few of the big wealth platforms that came late last year or early this year will also help us to see meaningfully better momentum as we work our way through 2025 and into 2026.
Operator
Thank you. Our next question comes from Craig Seigenthaler with Bank of America. Your line is open.
Speaker 7
Thanks. Good morning, Rob. Our question is on the potential for alternative investments to gain access to the U.S. Retirement channel. So we've all seen several announcements from some of your biggest competitors forming partnerships with private markets firms. So what are your updated thoughts on forming a private market partnership? Do you need to? And also, what are your thoughts on how alternatives can gain share pretty much from zero in Foreign key plans and target date funds. Thank you.
Speaker 2
Yes, Craig, thanks for the question. I think if you zoom out, the defined contribution market and parts of the wealth market at this point have not had broad access to private market alternatives. They're really the only big pools of capital that remain untapped. In my mind, there's no question that eventually it will happen. I think you can debate timing and magnitude, but at some point and to some degree, defined contribution, more traditional high net worth and mass affluent will get access to private market alternatives. These are obviously really important end markets to us. They're big channels and we're close to our clients so we understand their direction of travel and are anticipating their needs. If ultimately we can help them by creating offerings that have compelling risk-reward that are at the right fee point and provide the right amount of liquidity, we will do that. I do think that some of these solutions will combine liquid public and private market alternatives. So if there are crossover portfolios that make sense for our clients, regardless of channel, we're going to evaluate offering them. I would say, depending on the underlying asset class, we're open to partnering and we have had substantial discussions with a number of alternative investment firms. The best partnerships work, or the best partnerships are formed when you have alignment on both sides and both sides bring something compelling to the partnership. As I'd said on an earlier call regarding credit specifically, we have very broad capabilities across public and private markets at OHA and within T. Rowe Price Fixed Income division. That's not to say there aren't things that we don't do or that we might not partner with somebody, but it's really important for me to point out that OHA has a long and distinguished track record of running credit portfolios that incorporate both private credit and liquid non-investment grade. It's an important part of our strategy to bring OHA's capabilities to the wealth channel, to retirement, and to the insurance channel. In other asset classes from an alternative perspective, whether it's private investment grade, infrastructure, real estate, PE, secondaries, we'll certainly consider partnerships. Regarding retirement specifically, T. Rowe Price is a retirement solutions provider. I think it's one of our great strengths as a firm. If you look at how we've evolved our retirement date suite, we're constantly evaluating ways to improve our range of offerings and innovating our product design. We talked in previous quarters about personalized retirement manager, a model account which offers a customized glide path. We talked about managed lifetime income, which allows participants to guarantee a portion of their income. So as a solutions provider, if our market research and our investment research shows that incorporating private market alternatives into DC offerings results in visibly better outcomes for 401(k) plans and participants, we'll offer that. At a very high level, I think it does make sense that 401(k) participants and retirement investors would trade liquidity for return given the very long time horizons that retirement investors have. That said, I think our engagement with plan sponsors would suggest that they're taking a go-slow approach here. I think there's concern about fiduciary risk, liquidity, daily pricing, and fees. I'm confident that we can address those in time, but whatever we do, it will be based on investment research, our conviction that it will result in a better risk-reward profile for the underlying portfolios that we offer, and that we'll be able to solve for these challenges. I do think that it's reasonably likely that if and when we incorporate a broader range of private market alternative offerings that we'll do it with at least one, if not, a number of partners.
Operator
Thank you. Our next question comes from Dan Fannon with Jefferies. Your line is now open.
Speaker 8
Thanks. Good morning. I wanted to talk about flows and really the gross sales versus gross redemption backdrop and clearly a lot of volatility in the market. But as you think about what we saw in the first quarter and then here in April, but then more importantly, discussions and backlog and sales momentum as you think about this year, any color either from a product asset class or channel would be helpful.
Speaker 2
Yes, good morning, Dan. I didn't think we'd get that question. So no, in all seriousness, thank you for the question. Our flow outlook for the year is largely unchanged. There are a lot of puts and takes. If you look at where things stand through the end of April, we're basically in line with last year. Q1 was very slightly behind last year's first quarter. And while April was soft, it was still a meaningful improvement from April 2024. What we saw in April was a meaningful spike in retail-oriented outflows in the first few weeks of the month. But that's normalized. I think it's basically gone back to what I would characterize as run rate levels over the last few weeks. It was partially offset by solid flows on the institutional side. On the more positive side, our net pipeline for large mandates continued to develop favorably during the quarter. So when you net it all out, our base case is still for full year 2025 to improve relative to 2024, which is encouraging given the challenging backdrop. Given the environment, though, I think it's hard to have a lot of conviction on how the rest of the year will play out. But I would point out that while we're fighting some pretty intense headwinds in open-ended mutual fund as a vehicle and active equity as an asset class, we've got a lot to be excited about. Very strong momentum in fixed income, especially our global strategies. Continued strong momentum across retirement solutions. OHA capital commitments, which eventually will come into the fee basis AUM and drive flows there. We talked about ETFs. We're growing our capital appreciation suite. We have a suite of what I would characterize as low fee, low risk budget alternatives to passive that have a very compelling value proposition where our pipeline is robust and where we're really leaning in. So look, I'm confident that we have a path back to positive flows. I think it's unlikely to be in 2025, but I think 2025 will take another step back in that direction.
The only thing I might add, Rob talked about channel. Just from an asset class perspective, we did see some rebalancing, not surprisingly, given the market volatility in the late part of March and the early part of April. So that would have been relatively more outflows in equities, more inflows into fixed income. From a geographic perspective, we saw more strength outside the U.S. than inside.
Speaker 2
Yes, I would say broadly our experience has been consistent with the industry. Earlier in the quarter, there was some rebalancing, given the strength of equity markets in 2023 and 2024. There was just some normal rebalancing from equity to fixed income, and then later in the quarter, you actually saw some de-risking activity from equity to fixed income. So, given our overall equity-heavy mix, I think we've faced some cyclical headwinds in addition to the ongoing headwinds that I outlined earlier. So I'm proud of the work that our team has done to be able to say that at this point our outlook is largely unchanged.
Operator
Thank you. Our next question comes from Bill Katz with TD Cowen. Your line is open.
Speaker 9
Hi, good morning. This is Manu on for Bill. So Craig ran my question on the alts partnership, so maybe I'll ask a question about fee rate dynamics in the quarter. What did the exit fee rate look like coming out of the quarter? What are you seeing in April, and maybe how should we think about those dynamics going into the rest of 2025?
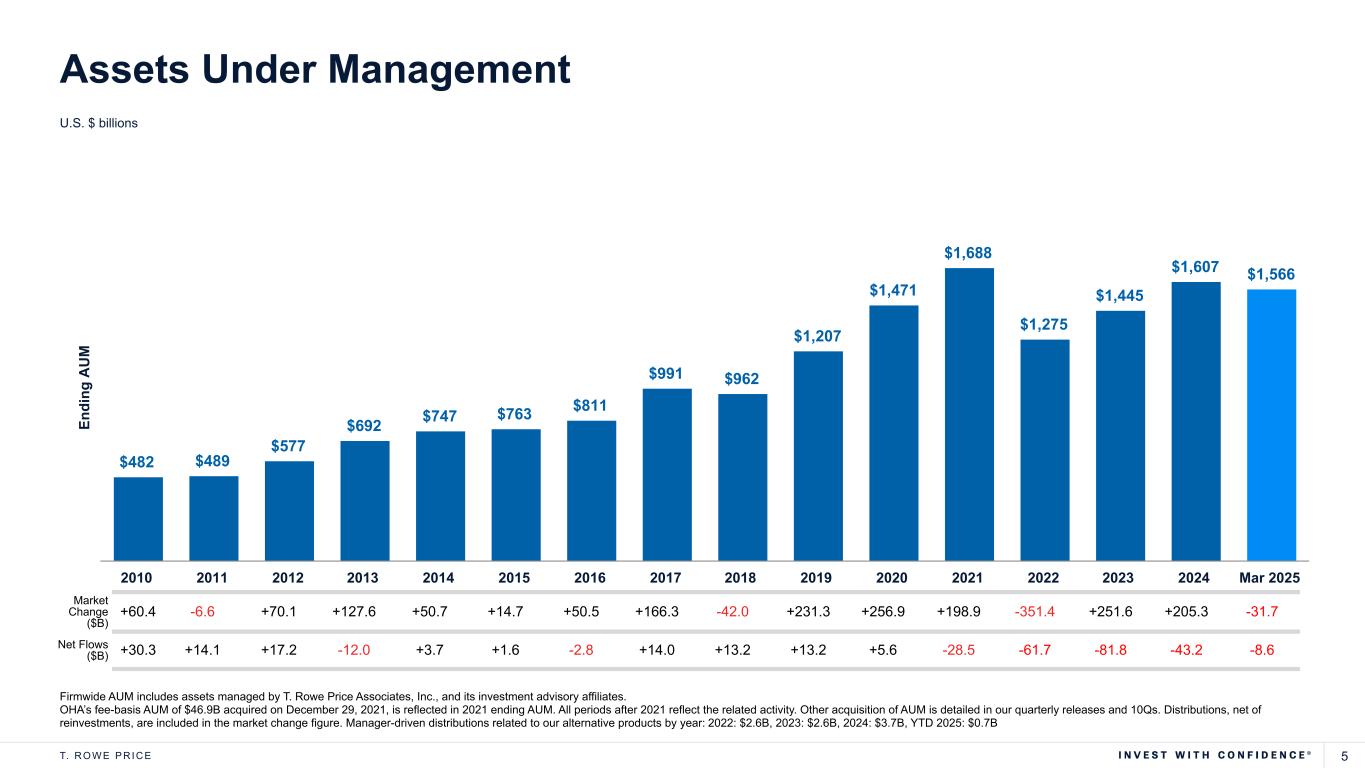
Thanks for the question. If we think about fee rate, given the breadth of our asset classes, strategies, and vehicles that we offer, a lot goes into the effective fee rate, and it can really vary quarter to quarter. So I'll give you some context for what happened this quarter, but I think it's always better to think about it on a multi-quarter basis as opposed to kind of one quarter to the next. In Q1, about 60% of the impact in the decrease in effective fee rate came from more structural shifts in the type of investment strategies and vehicles that we're selling at the margin. We're seeing that persistent trend toward lower cost vehicles such as ETFs, collective investment trusts, and separate accounts. And on the investment strategy side, particularly within our target date franchise, you're actually seeing the impact of both vehicle and investment strategy as we've seen uptake in our blend products and in the collective trust vehicle. That other 40% is more cyclical with the overall mix of AUM, both from market and flow impacts. So as an example, this quarter, you'll see in the release, equity assets under management declined from about 52% to about 49% of AUM in the quarter, while fixed income and multi-asset both increased as a percentage. So you would say that this quarter, the impact was more significant than typical because of the equity market decline. It's hard to predict going forward what that portion will be, but certainly the structural changes will be persistent.
Operator
Thank you. Our next question comes from Glenn Schorr with Evercore. Your line is now open.
Speaker 10
Hey, good morning. Thanks for the question. Sorry, I have to ask a little bit of a boring expense question, but given the volatility of the market, I don't envy your ability to, I guess, budget right now given the swings we've seen. So, Jen, maybe help us understand the drivers between the original guide versus where we are now. And as of what point, I guess, in April did you guys set the guide in terms of, like, what are you assuming for equity market returns that's baked into guidance?
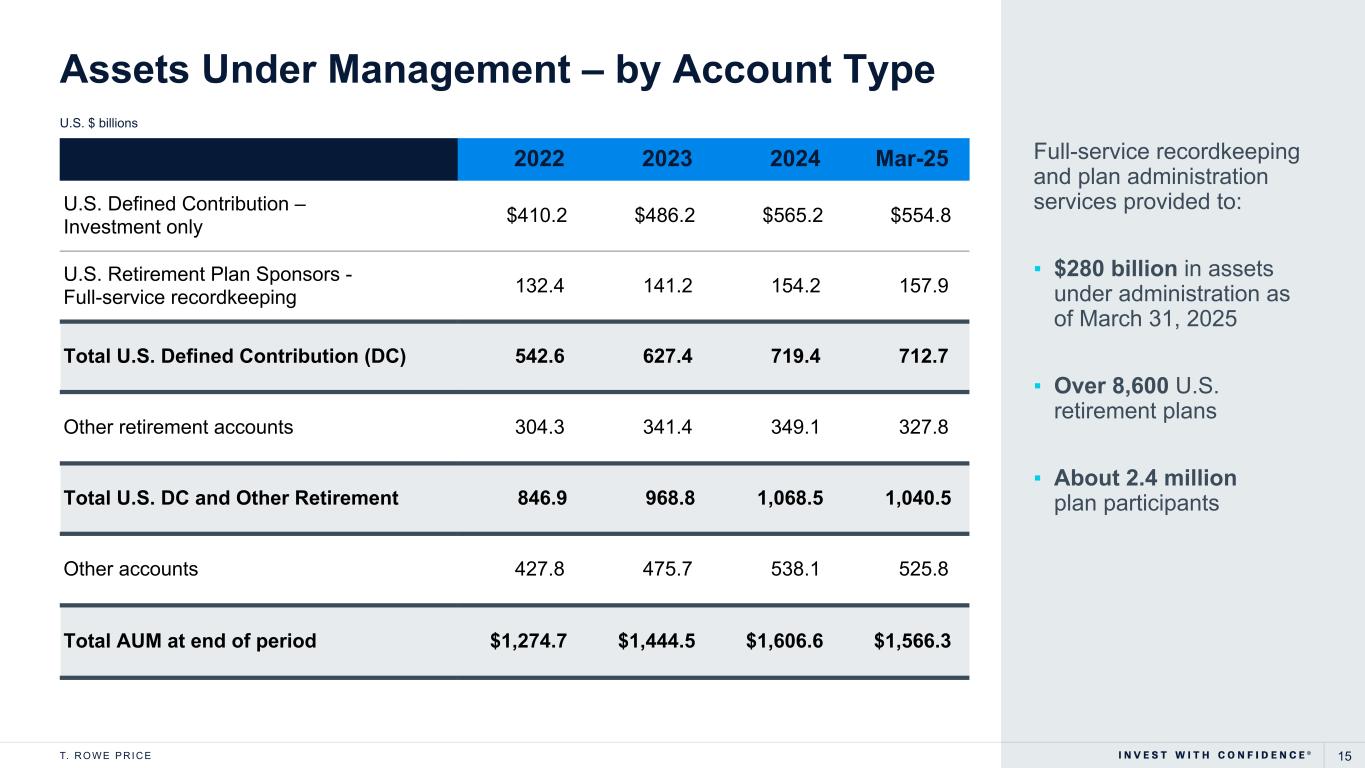
Thanks for the question, and I appreciate the sympathy for having to set budgets in this kind of an environment. So with the back part of your question about what we took into account from a market perspective, we took into account the volatility in April both in markets and in assets under management in setting that 1% to 3% range. Specifically, if assets had been as of March 31st at $1.57 trillion, expense growth would have been toward the higher end of that range. I would say, when we're thinking about the move from 4% to 6% to 1% to 3%, it's two things. It's both a natural adjustment of market-driven expenses and some intentional management of controllable expenses. And that's really things like slowing the pace of hiring and variable expenses like internal travel. All of that said, as we've said in prior quarters, we're continuing to evaluate opportunities for more structural cost savings to limit expense growth in 2026 and beyond.
Operator
Thank you. Our next question comes from Ken Worthington with JPMorgan. Your line is now open.
Speaker 11
Great, thank you. Good morning. Thanks for taking the question. I wanted to dig into the expansion of retirement outside the US that you had mentioned in your prepared remarks. So you mentioned expansion of retirement in a handful of countries in Asia, Canada, I think you even mentioned Europe. You mentioned leveraging the glide path and structural expertise. What exactly are you selling? Are you actually launching, I think it's like Korean, Japanese, Canadian target date funds? Or is what you're doing there more nuanced? I guess the second part is, you leverage record keeping in the US to build out that US retirement business. I know it's more DCIO right now, but I think it started with record keeping. And then lastly, one of the themes in U.S. retirement is customization. Is this happening outside the U.S. as well?
Speaker 2
Yes, Ken, it’s Rob. I'll start on this one. I think it's hard to generalize. Defined contribution schemes in different countries are at very different stages of development, right? I mean, if you look at, for instance, the superannuation scheme in Australia, it's very developed. Obviously, the U.S. is very developed, but in a number of other places, it's evolving rapidly. The U.K., Japan, Canada, and in many instances, those countries are less far along. And in each case, the structure is different. So if I basically went country by country, in Korea we are offering a target date series in partnership with a local investment manager, and we also have a retirement income series, which is really what drove much of the flow there this quarter. So it's two strategies partnered with a local investment manager where they manage the local portion of the allocation and we manage the more global portions of the allocation. In Japan, it is very early in terms of the development and evolution. I think there's going to need to be a lot of market development in education. But we are partnered with a local investment management firm to provide a target date series where, again, we provide the overall glide path in portfolio construction and design. We provide the building blocks for markets outside of Japan, and they manage the Japanese equity and fixed income allocations within that. In Canada, we're largely partnered with local life insurers and are offering a series that's quite similar to the series that we offer in the US. Where we reference other parts of Asia and the UK, we're partnered with a large private bank on retirement offerings that will be distributed across Asia, as well as in the UK and the Middle East. So that is actually not a target date product. It's more of a target allocation product that's designed specifically for retirement-oriented investors and was custom designed based on the proposal that they gave us. We are one of four global asset managers that were chosen to participate in that, and we'll launch with them later this year. So it's really bespoke. It's different in each instance, but these opportunities are opening up. And most of them, I would say it's early days. I think the real impact for us, if we're successful, will build in out years. I mean, I'm talking about three, four, five years. Most of these aren't meaningful drivers right now, perhaps with the exception of Korea and Canada.
Speaker 5
The one thing I would add here, Ken, as well is, increasingly the mind shift is more about capabilities than products. And we've built out capabilities that allow us to partner in different regions, as Rob talked about, on both the strategic asset allocation side, but increasingly on the local tactical asset allocation side or the regional tactical asset allocation side, which is valuable to these partners. It would obviously be different than just a traditional type of product. It could be more of a consulting arrangement or something like that. So we're thinking about this as much from a capabilities perspective as a product perspective.
Operator
Thank you. Our final question comes from Mike Brown with Wells Fargo Securities. Your line is now open.
Speaker 12
Good morning. Thank you for taking my question. I wanted to inquire about the balance sheet. I noticed that cash has increased to approximately $2.8 billion. Could you discuss your thoughts on capital allocation? Are you considering increasing share buybacks given the circumstances? What is your perspective on inorganic growth? When you think about opportunities for inorganic growth, which areas are you focusing on? Are you still interested in expanding capabilities in private markets as part of your inorganic growth strategy? Thank you.
Thanks for the question. I'll start. I would say I think you referenced a $2.8 billion number. We look at a $3.3 billion cash and discretionary investments that we have available. And as we look at that, a portion of that is held in countries outside the US or for regulatory purposes or buffers. So I'd say, when we think about that number, we think about half of that being available for strategic opportunities. So that could be things like, as you mentioned, share buybacks or M&A, or really just general buffer as we think about the market environment. We mentioned the share buybacks that we did in the first part of this year. If we look at 2024, 2024 was higher than 2023, and the first quarter run rate and into April has been higher than the pace that we were on in 2024. So I think all of those things are on the table. We do want to make sure we keep some cash available for potential opportunities on the inorganic side. Maybe I'll open it up to Rob, if you want to talk about those.
Speaker 2
Yes, look, I would just say with regard to the buyback, we've stepped up the pace and we'll continue to be opportunistic to the extent that the market presents an opportunity it's presenting right now, we want to take advantage of it. With regard to M&A, our framework is largely unchanged, right? We've talked a lot about wanting to do acquisitions where we can bring new capabilities, capabilities that we don't otherwise have or would be difficult to build internally that are unique, compelling, differentiated, sustainable, meet emerging and growing client demand, or that allow us to access new clients or to gain market share with our existing clients. That's the framework. They need to be culturally aligned. They need to make financial sense. So the bar is high. Obviously, this is a consolidating industry, so we see and look at a lot of things, but I think our priorities are no different than they've been before, and certainly private market alternatives would fall into the category that I just described. But apropos to the conversation earlier, there are also some things that we could achieve through partnerships. So we don't necessarily have to own everything.
Operator
Thank you. This concludes today's conference call. Thank you for participating. You may now disconnect.