Operator
Greetings, and welcome to the Veris Residential, Inc. Second Quarter 2025 Earnings Conference Call. As a reminder, this conference is being recorded. It is now my pleasure to introduce your host, Taryn Fielder, General Counsel. Thank you. You may begin.
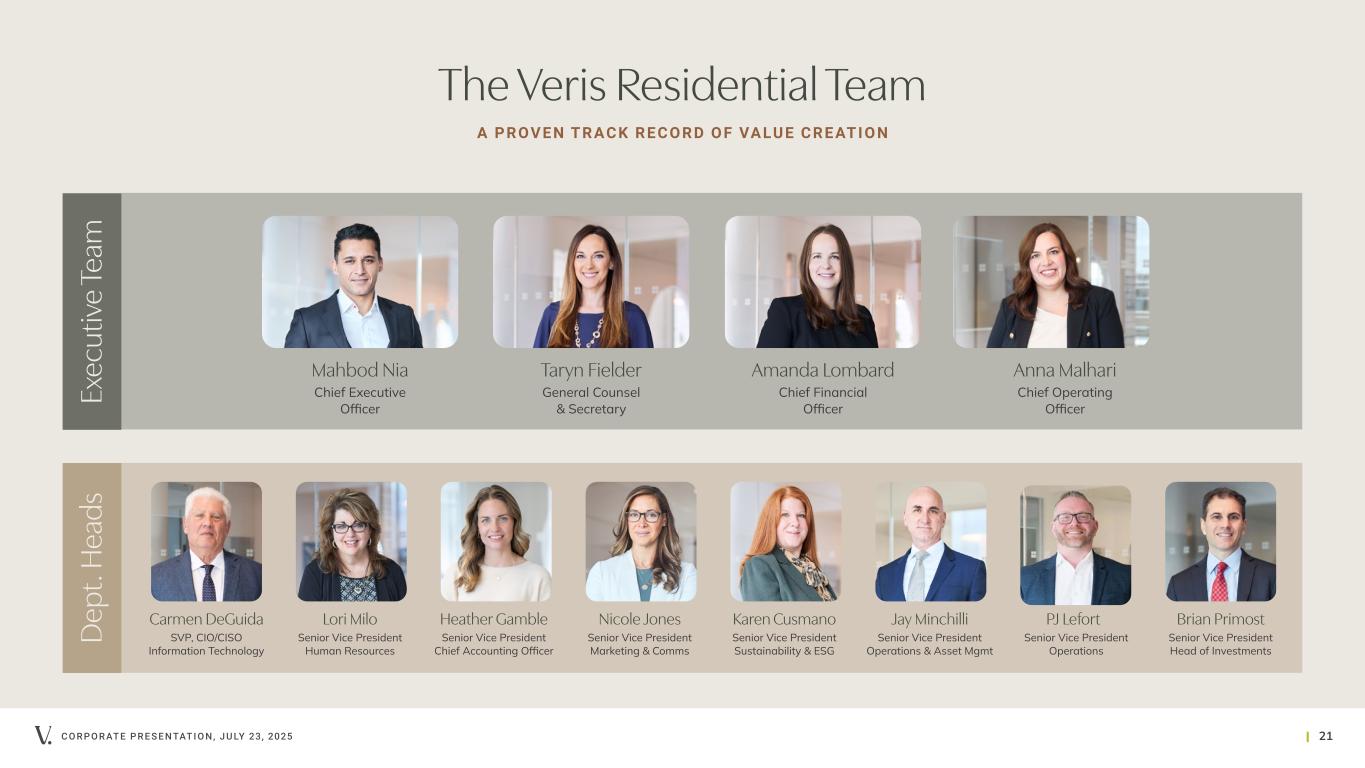
Good morning, everyone, and welcome to Veris Residential's Second Quarter 2025 Earnings Conference Call. I would like to remind everyone that certain information discussed on this call may constitute forward-looking statements within the meaning of the federal securities law. Although we believe the estimates reflected in these statements are based on reasonable assumptions, we cannot give assurance that the anticipated results will be achieved. We refer you to the company's press release and annual and quarterly reports filed with the SEC for risk factors that impact the company. With that, I would like to hand the call over to Mahbod Nia, Veris Residential's Chief Executive Officer, who is joined by Anna Malhari, Chief Operating Officer, and Amanda Lombard, Chief Financial Officer. Mahbod?
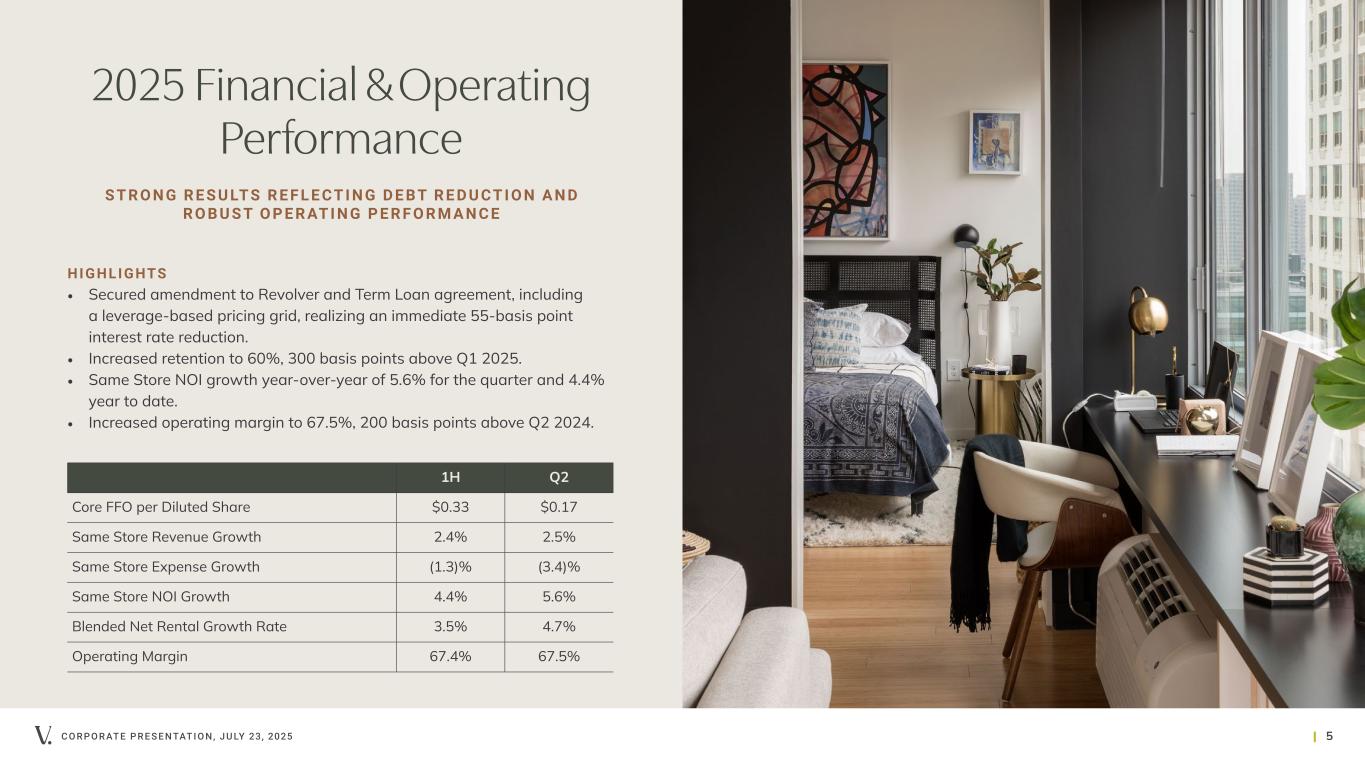
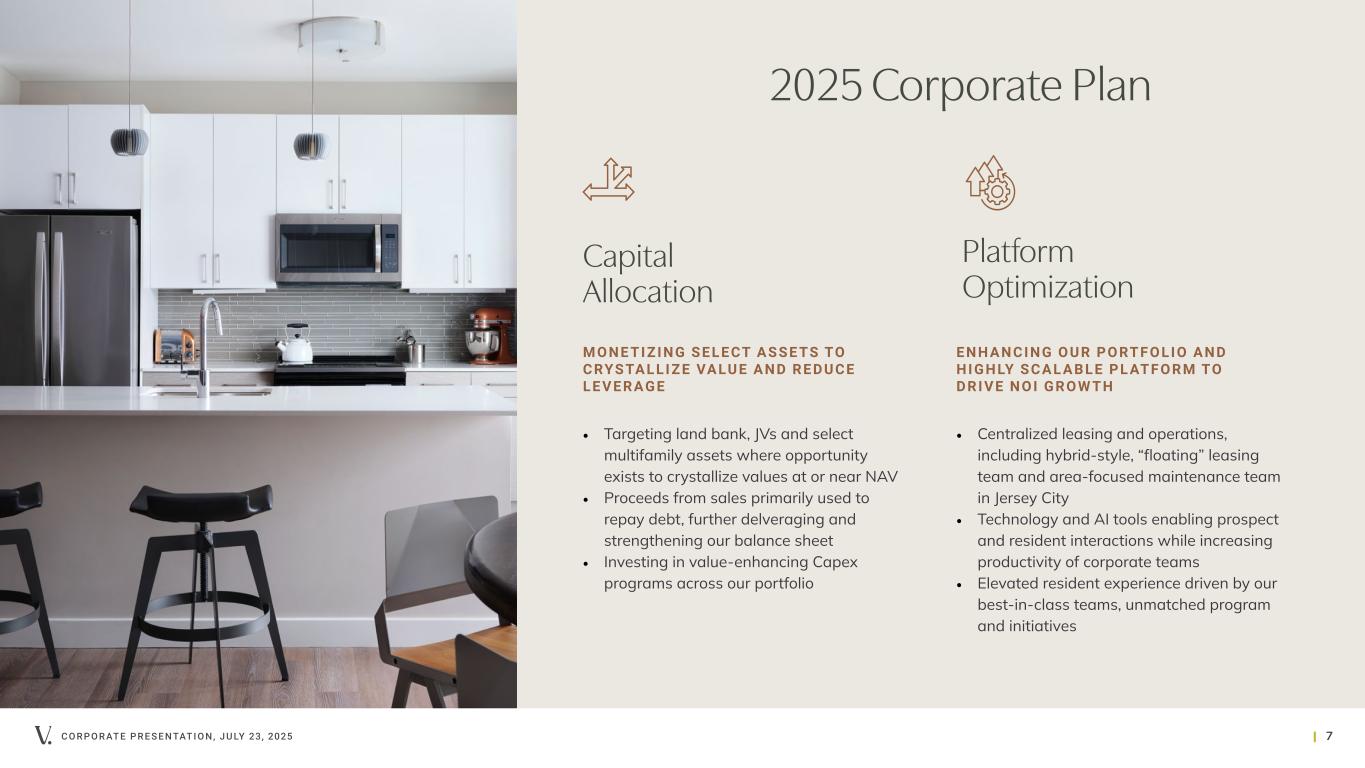
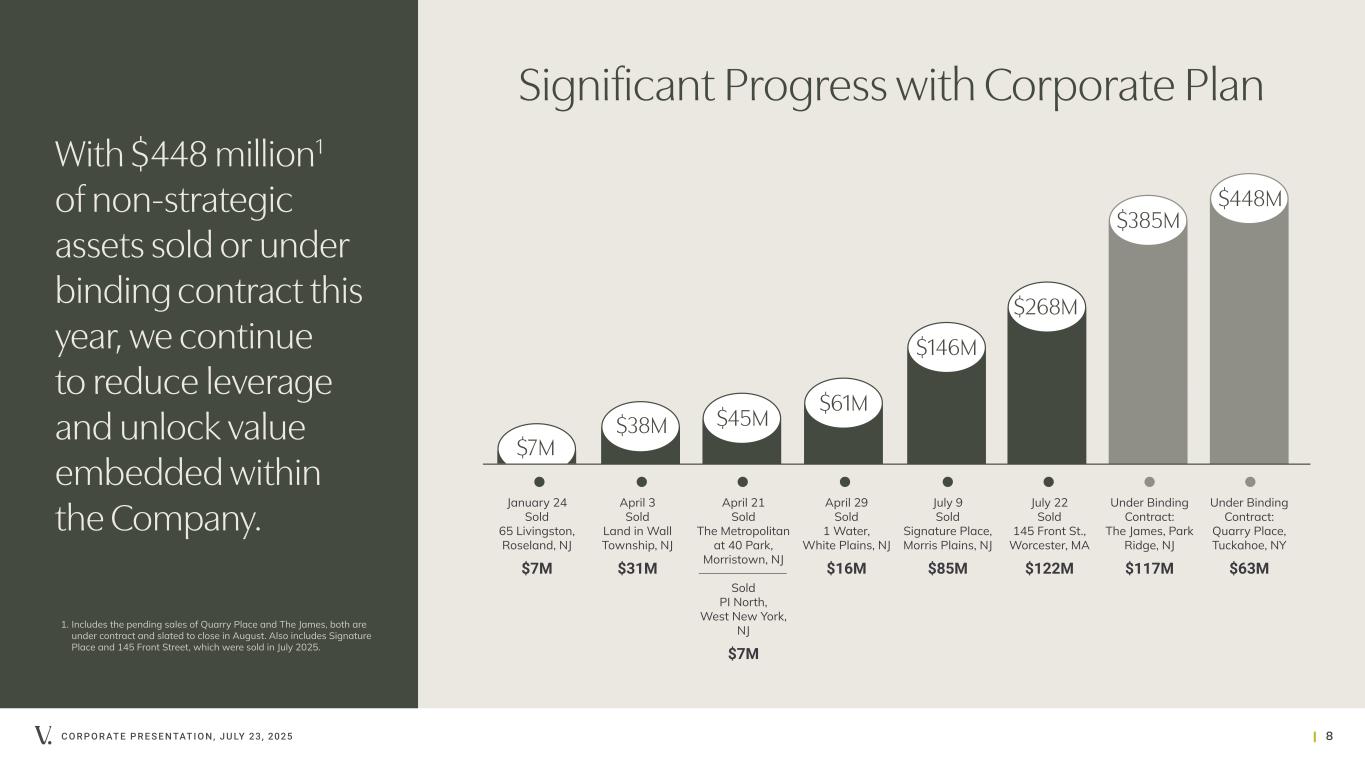
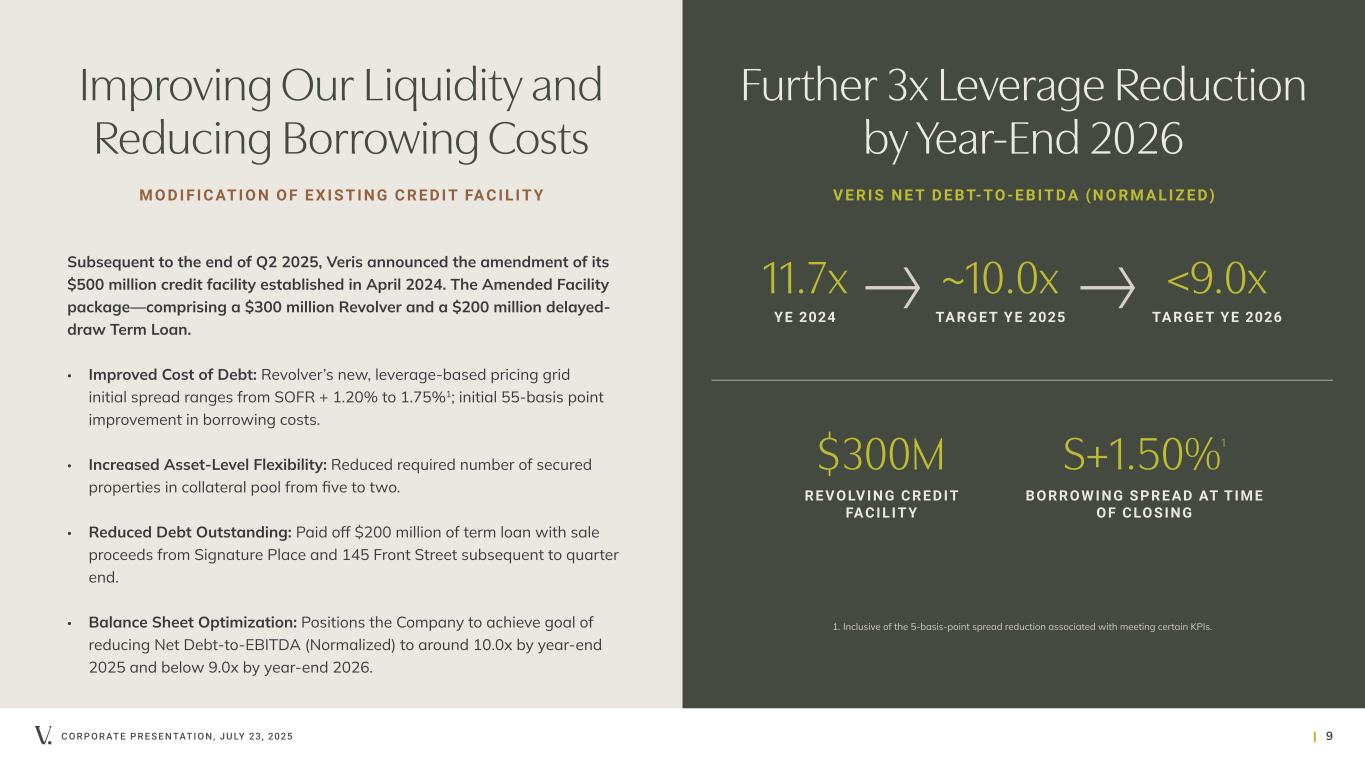
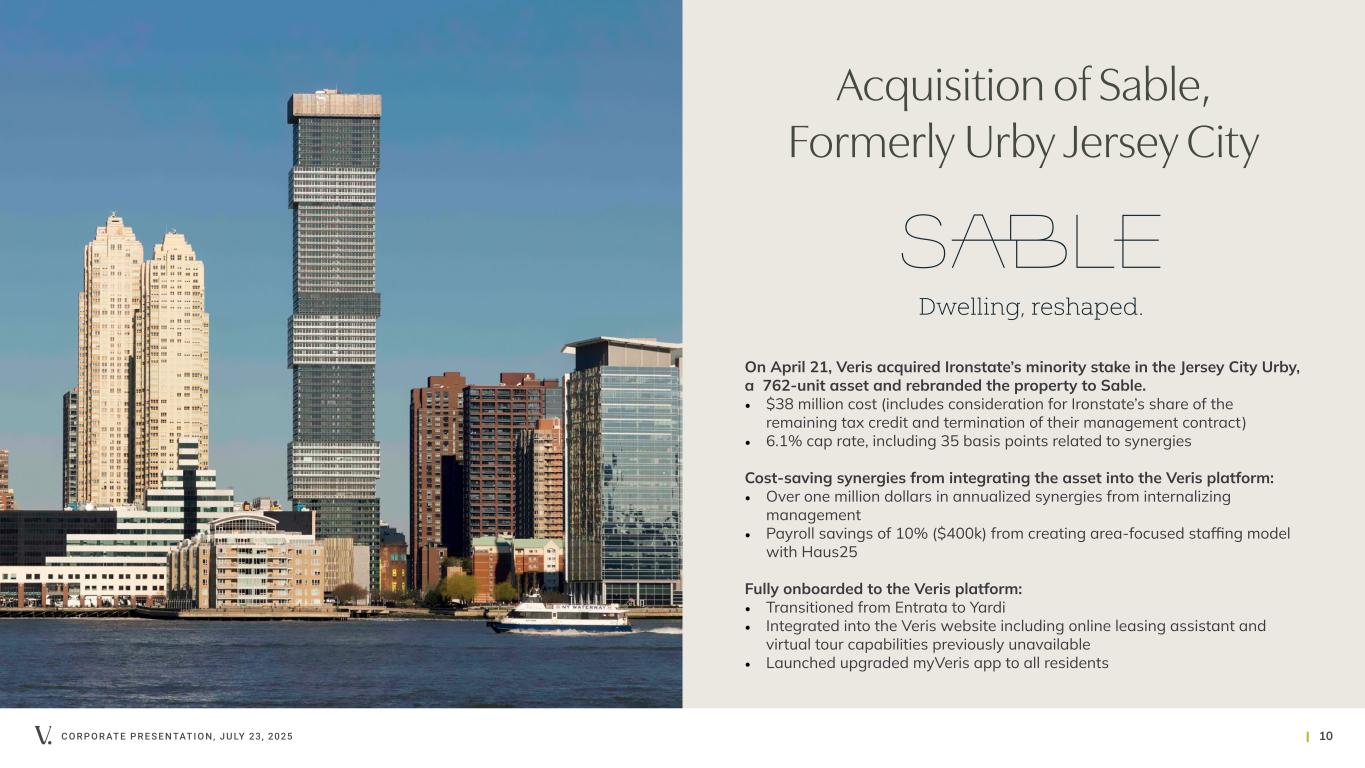
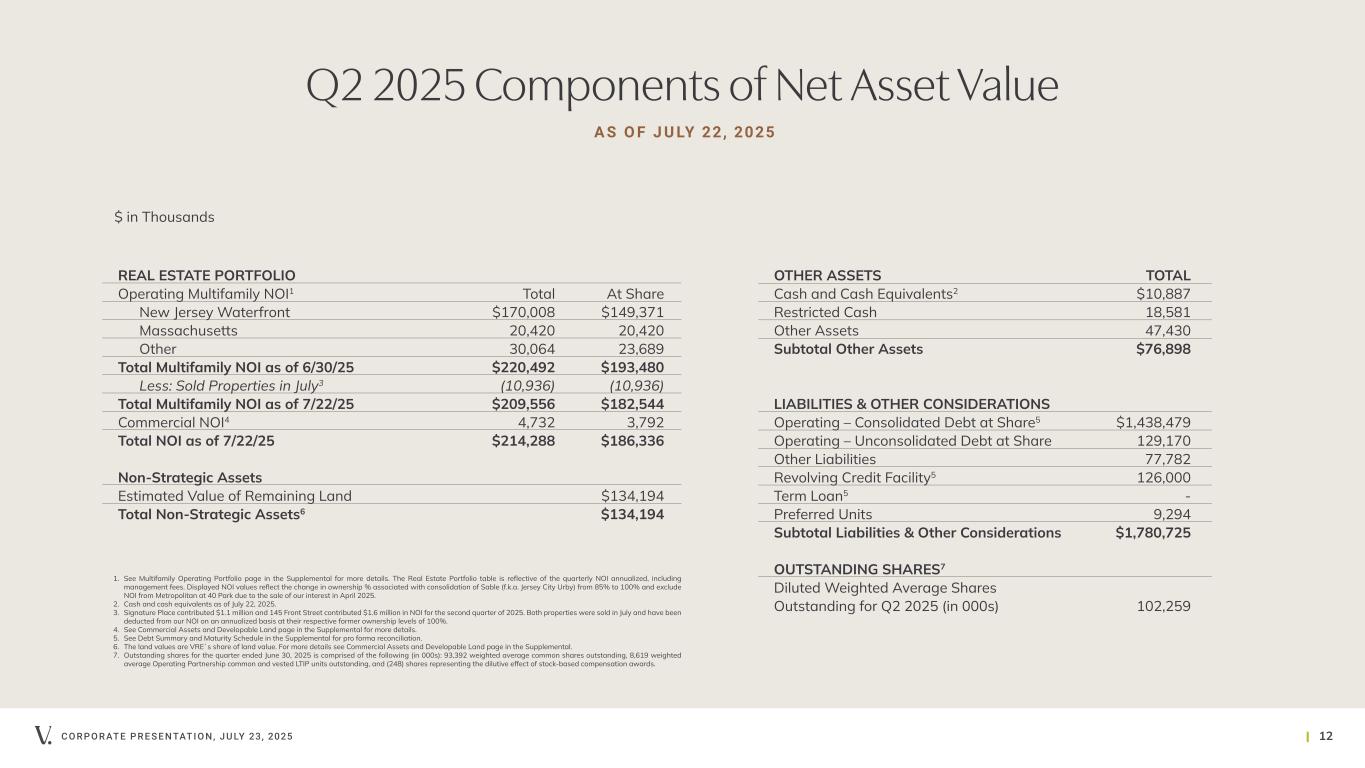
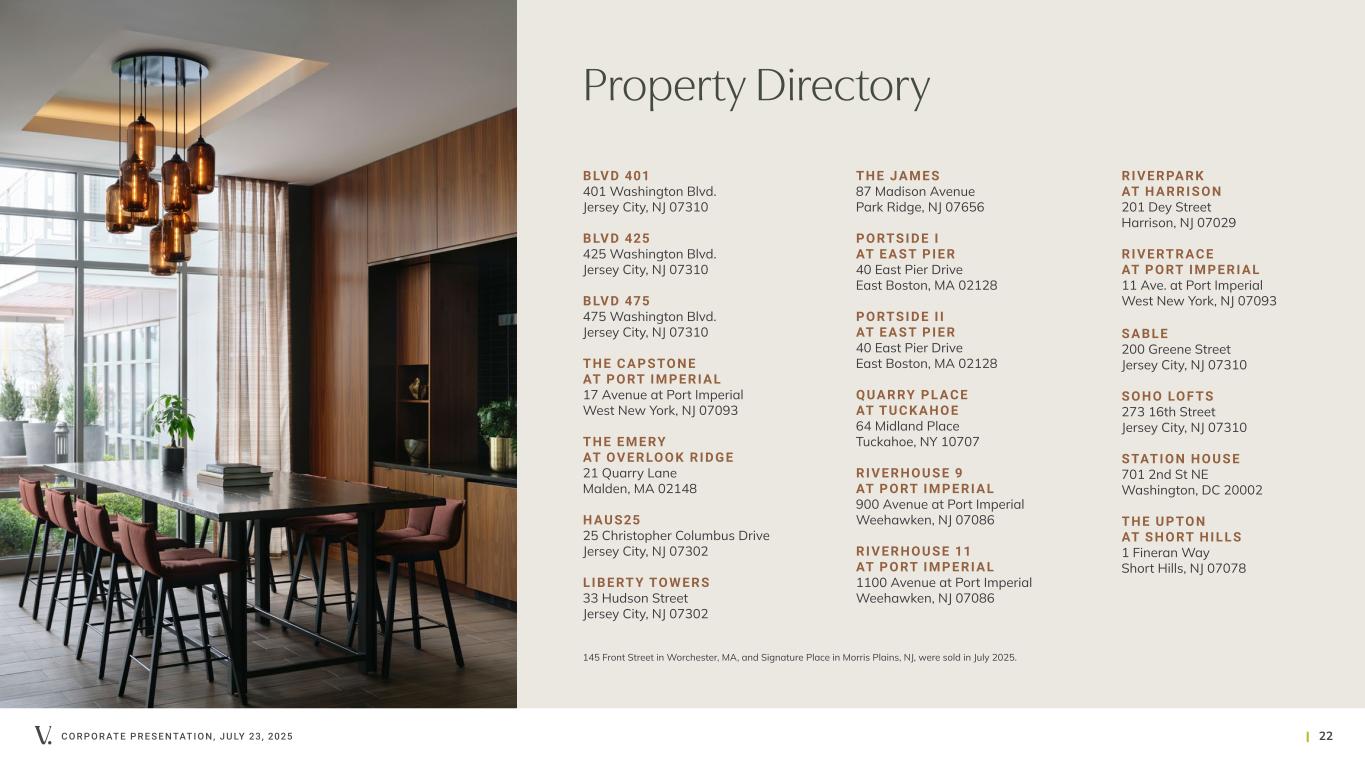
Thank you, Taryn, and good morning, everyone. I'll begin today's call by providing details on our quarterly results, year-to-date performance, and key dynamics of our markets before turning to Anna to update you on our operating performance and Amanda to provide details on our financial performance and outlook. The second quarter marked another period of solid operational and financial results for Veris, including $0.17 of Core FFO and 5.6% Same Store NOI growth. We also made significant progress with the corporate plan that we announced earlier this year, alongside continued enhancements to our operational platform, further optimization of our balance sheet, allowing us to meaningfully reduce our cost of debt. Year-to-date, we've either completed or executed binding contracts for approximately $450 million of nonstrategic asset sales, largely fulfilling our stated target of selling $300 million to $500 million of nonstrategic assets by the end of 2026, well ahead of schedule. We intend to utilize proceeds from these sales primarily to reduce leverage to around 10x by year-end 2025 and are on track to further reduce this to below 9x by year-end 2026. The rapid progress we've made in deleveraging our balance sheet is translating into tangible value creation for our shareholders. As we realized an immediate 55 basis point improvement in our borrowing costs through our amended credit facility with potential for a further improvement in our borrowing costs as we continue to delever. Our robust operational performance, combined with the significant progress we have made executing nonstrategic asset sales, resulting in a reduction of debt has enabled us to raise guidance on key metrics. We've now closed $268 million of the aforementioned $450 million of nonstrategic asset sales, including the recent sales of Signature Place, a 197-unit property located in suburban New Jersey for $85 million and 145 Front Street, a 365-unit property located in Worcester, Massachusetts for $122 million. These assets, generally smaller in size, were sold at an average cap rate of 5.1%, in line with what we believe to be their intrinsic value. We've also entered binding contracts with The James in suburban New Jersey and Quarry Place, our only asset in New York, posting an additional $180 million of sales, which are anticipated to close in the coming months. As previously announced, during the second quarter, we consolidated our partners' 15% stake in Sables, formerly the Jersey City Urby, and have already begun to realize meaningful operational synergies through the integration of this asset into the Veris platform. Before I hand over to Anna to walk through our operational performance, I'd like to say a few words regarding the current dynamics in our markets. The Northeast multifamily landscape continues to perform encouragingly well, driven by favorable supply-demand dynamics and resilient urban migration trends. New York City, to which Jersey City is highly correlated, remains one of the strongest markets nationwide, underpinned by historically low vacancy of below 3% metro-wide despite the delivery of approximately 15,000 new units over the past year. Demand has also remained strong in Boston, where vacancy has edged lower year-over-year and rent growth has remained above national levels. New construction in Jersey City remains concentrated in Journal Square, a less established submarket, which does not compete directly with the Jersey City Waterfront, where our assets are located. The Waterfront submarket maintains clear advantages, lower vacancy, approximately 25% higher asking rents and almost 3x the rental growth of Journal Square this year. The Jersey City Waterfront has successfully absorbed 3,900 units with minimal impact to our occupancy rates over the past 5 years. In the next 4 years, around 3,000 units across 4 projects are currently under construction, only 385 units delivered over the past 3 years, well below historical levels. We expect the market to readily absorb the new supply in line with the historical absorption rate of approximately 630 units annually. These robust supply-demand dynamics leave our Waterfront portfolio well positioned to sustain strong rental growth going forward. With that, I'll hand it over to Anna to discuss our operational performance for the quarter.
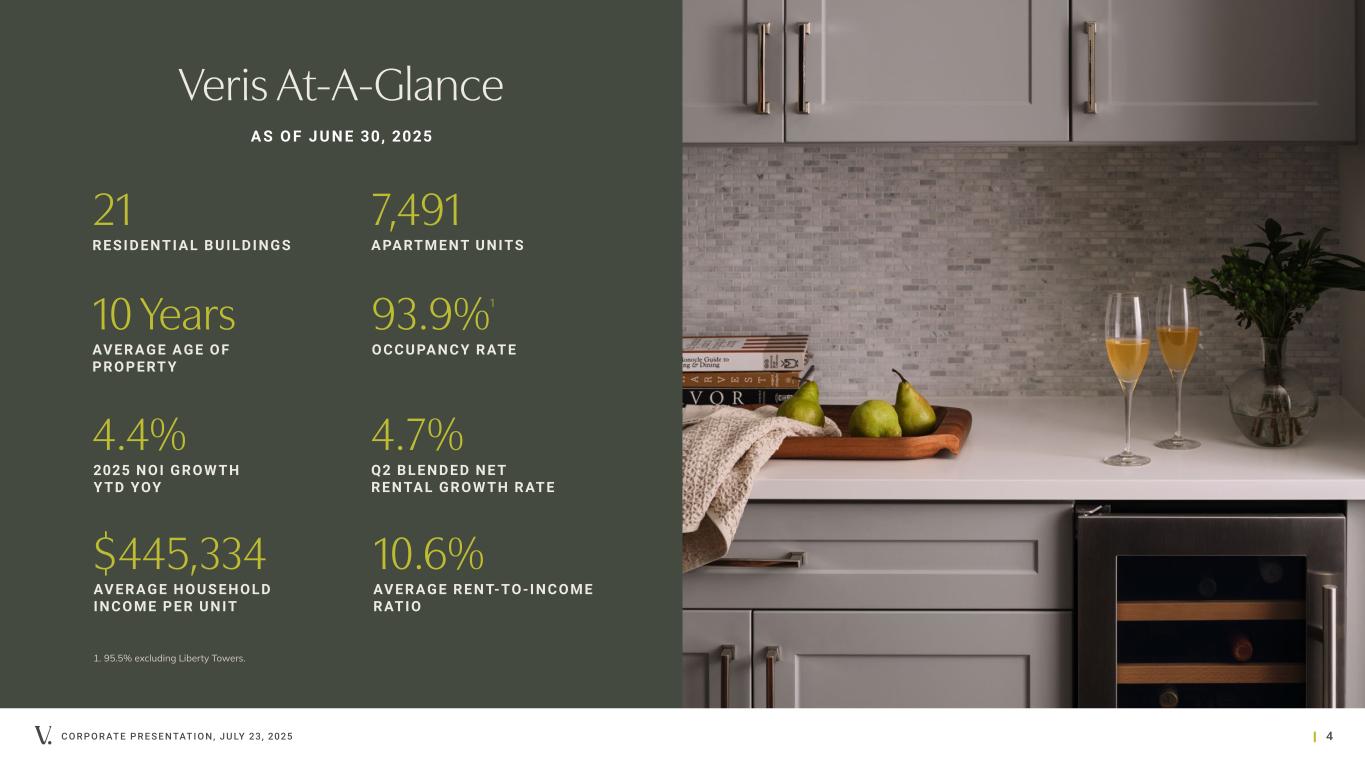
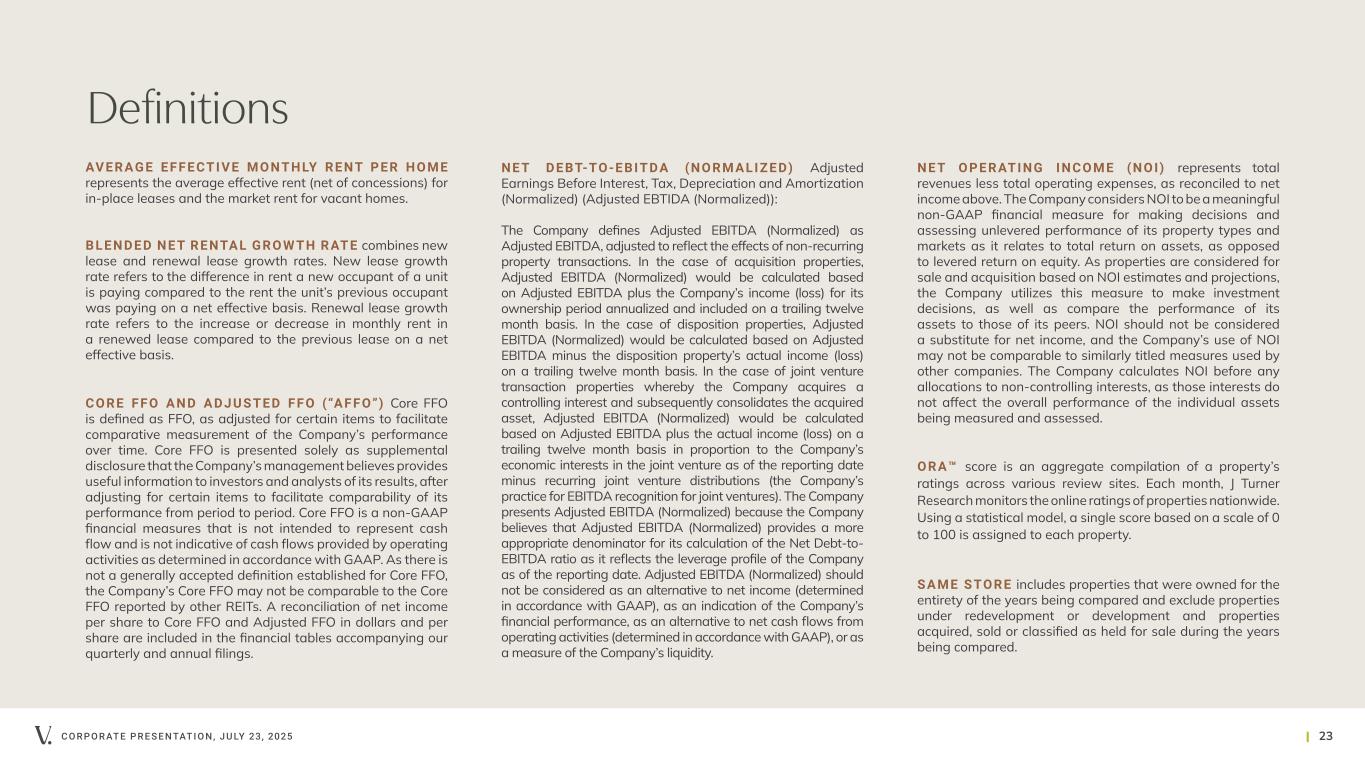
Thank you, Mahbod. Our portfolio continued to deliver strong operating results in the second quarter. Excluding Liberty Towers, where we continue to undergo unit renovations, occupancy was 95.5% as of June 30, up from 94.7% a year ago. Including Liberty Towers, occupancy was 93.9%, while retention improved to approximately 60%. To date, we have renovated and leased 121 units at Liberty Towers, nearly 20% of the property, at a gross rental uplift of around 20%. Occupancy has picked up over the last few weeks with the asset currently 88% leased and over 80% occupied. Rental growth has gradually increased as peak leasing season progresses. Our portfolio achieved a blended net rental growth rate of 4.7% for the quarter, up from 2.3% in the first quarter and well above the national average of 1%. This is driven by renewals of 5.2% and new leases accelerating to 4%. The blended net rental growth rate was 3.5% for the first half of 2025, comprising 2.5% in new leases and 4.3% in renewals. Simultaneously, rent-to-income ratios across our portfolio have remained stable, highlighting the creditworthiness of our high-income resident base. This rental performance, coupled with our ongoing focus on expense management is reflected in our Same Store NOI growing by 5.6% in the quarter and our operating margin improving by approximately 200 basis points year-over-year to 67.5%. Our broader New Jersey portfolio continued to deliver strong results, supported by our strategic locations adjacent to New York City with approximately 25% of new move-ins coming from the area and over 50% from out of state. These residents are attracted to our compelling value proposition of generally newer, more spacious units and a more comprehensive suite of amenities. Our portfolio's continued outperformance is a testament to the quality of our assets, the strength of our markets and platform and the unwavering commitment and hard work of our teams. We continue to focus on further optimization of our operational platform, investing in and implementing innovative technologies balanced by human interaction to create an elevated customer experience. In June, we hosted an investor event showcasing Prism, our approach to technology adoption that further empowers our teams and provides comprehensive support to every resident. During the presentation, which you can find on our website, our technology partners spoke to our outperformance, including our AI assistants achieving a lease conversion rate more than double that of our partners' other clients, and our website generating more than 3x the virtual tours than other multifamily companies using the same tool. During the quarter, we leveraged our existing virtual tours to launch our VR showroom in an incredibly cost-effective manner, allowing residents to tour select units at all of our properties in 3D wearing their own VR glasses, with the plans to expand this immersive experience across all units this year. In addition to our virtual leasing assistant, our website now features an embedded AI chatbot, which is designed to guide every prospect, resident, investor, and job seeker who visits our website. We've also developed our own proprietary revenue management tool, which is performing extremely well across the assets we deployed, eliminating over $250,000 of annualized costs associated with utilizing third-party revenue management tools and potentially more over time. Overall, our strong operational performance reflects the effectiveness of our platform investments, the quality of our assets and the strength of our markets, positioning us well to continue momentum as we move forward. With that, I'm going to hand it over to Amanda, who will discuss our financial performance and provide an update on guidance.
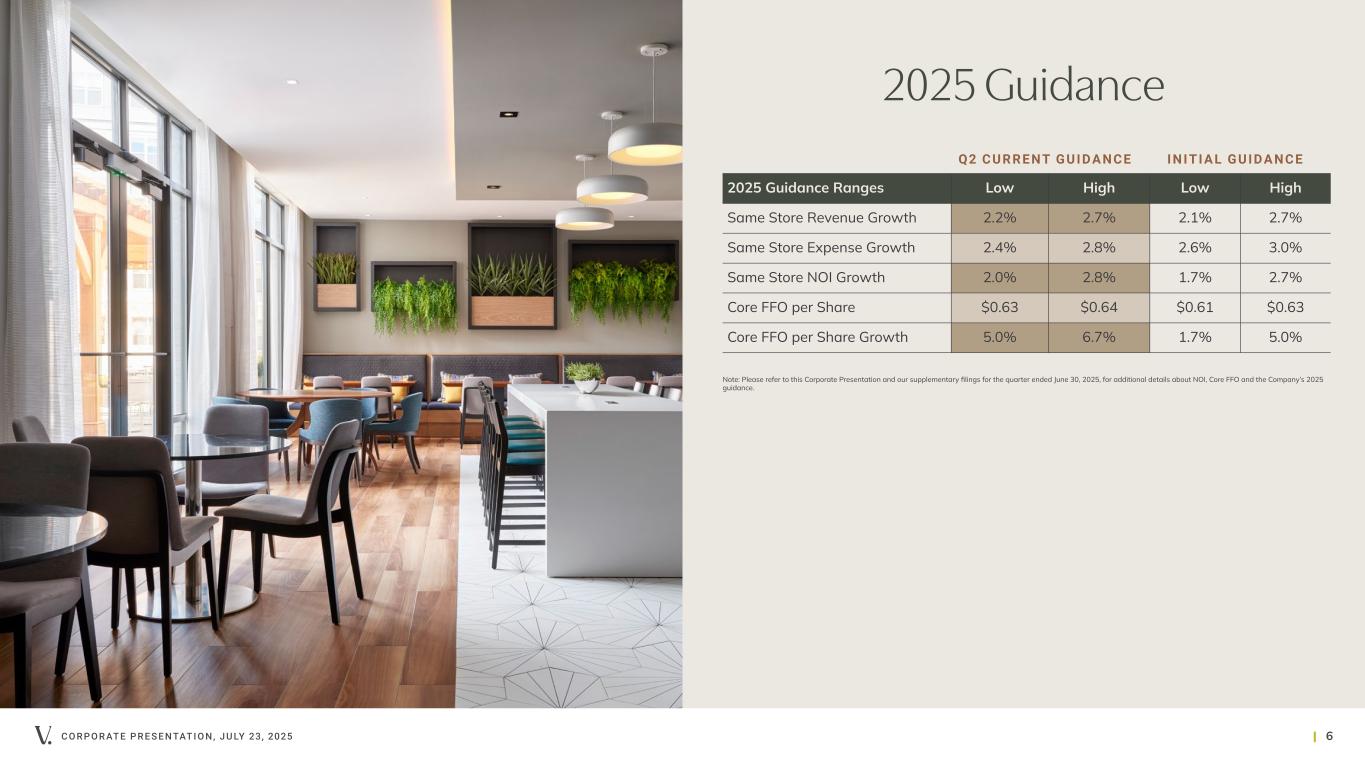
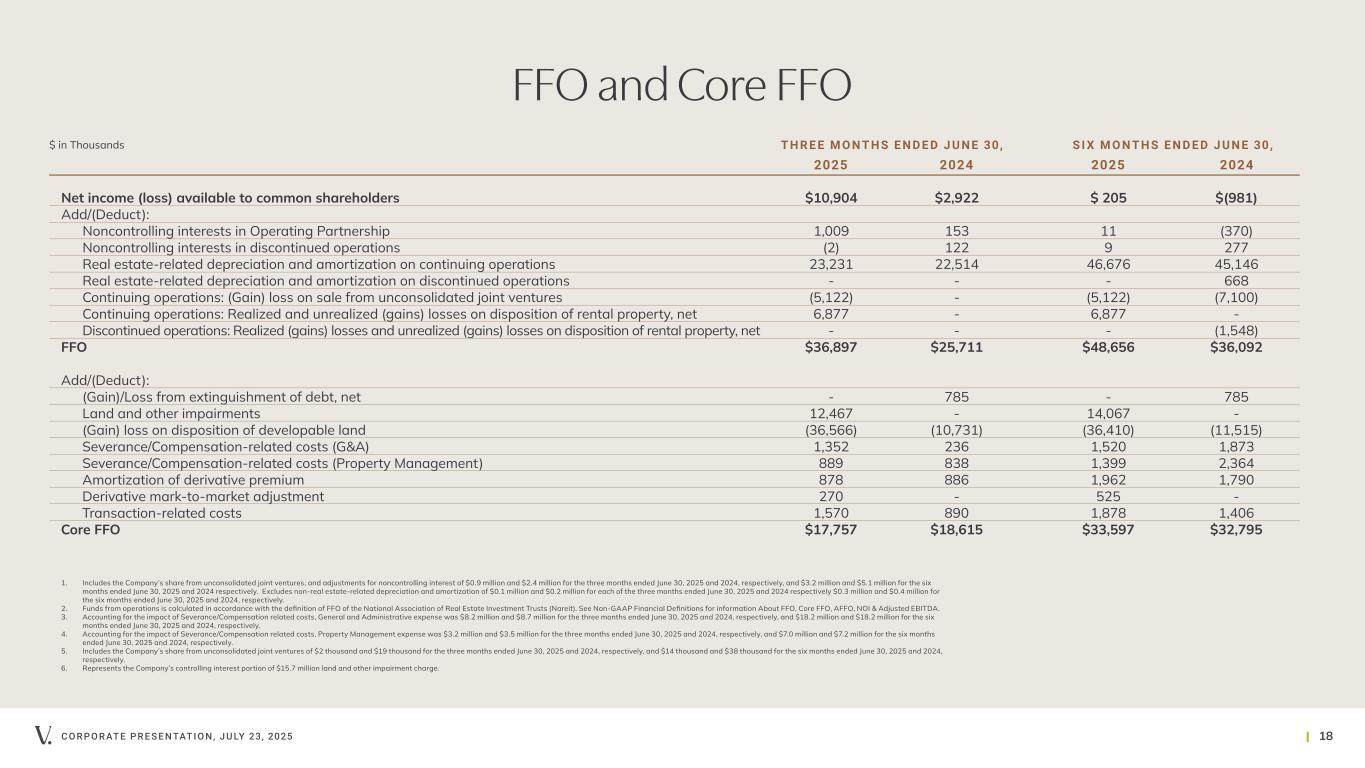
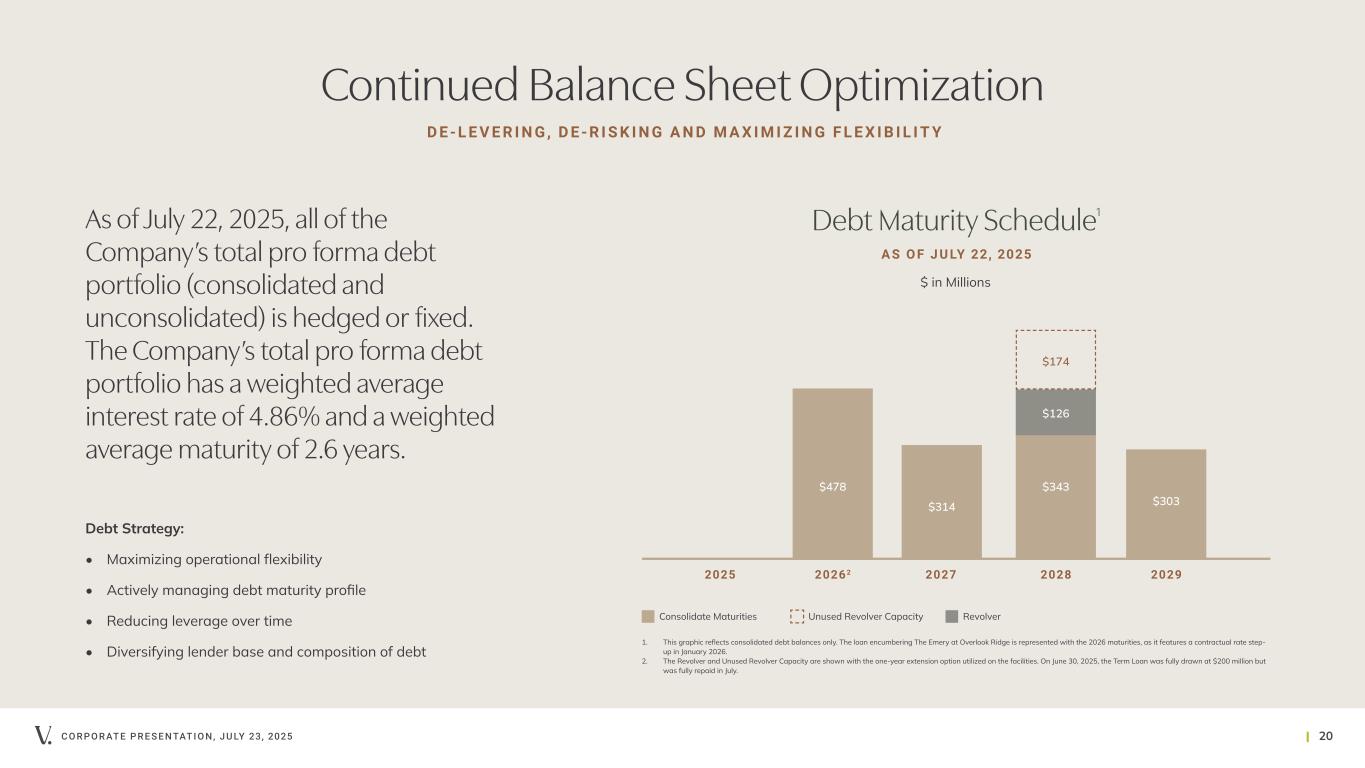
Thank you, Anna. For the second quarter of 2025, net income available to common shareholders was $0.12 per fully diluted share versus $0.03 for the prior year and a net loss of $0.12 in the first quarter. Core FFO per share was $0.17 for the second quarter, up $0.01 from the first quarter due to several factors, including the transactions closed in the period, the timing of the annual stable tax credit and continued strong performance from our portfolio. Core FFO per share for the second quarter also includes approximately $0.01 of nonrecurring other income and property management expense savings. Year-to-date, core FFO was $0.33 per share versus $0.32 last year. As mentioned earlier, Same Store NOI growth for the quarter was 5.6%. On a year-to-date basis, Same Store NOI growth is 4.4%. Same Store rental revenue was up 2.5% for the quarter, driven by an increase in occupancy across the majority of our portfolio and continued rental revenue growth. Excluding Liberty Towers and other income recognized last year, rental revenue growth would have been 3.8%. Year-to-date, rental revenue growth was 2.4%, driven by growth in market rates, occupancy, higher amenity fees and retail lease-up, offset by the same components as the quarter-to-date, the reduction in Liberty Towers occupancy due to renovations and the benefit of other income recognized last year. On the expense side, our technology investments and enhancements and portfolio optimization initiatives continue to drive savings. Both controllable and non-controllable expenses were down from the prior year. Controllable expenses decreased by 3.7% year-over-year and are essentially flat year-to-date. This benefit is driven primarily by lower marketing and administrative costs due to increased demand for our Waterfront assets and a reduction in repairs and maintenance expenses at Liberty Towers, given little to no make-ready costs are incurred while units undergo renovation. Year-to-date, these savings in marketing, administration, and repairs and maintenance were partially offset by higher utility costs due to cold weather in the first quarter. Additionally, payroll costs are virtually flat as technology and centralization initiatives are rolled out across the portfolio. Non-controllable expenses, which will reset in the third quarter, are down 3.2% year-over-year, 2.6% year-to-date due to lower insurance costs and real estate tax expenses. On the overhead front, core G&A after adjustments for severance payments was $8.2 million, a significant improvement from the last quarter as expected due to seasonal increases in noncash stock compensation in the first quarter. We also recognized savings of approximately $500,000 this quarter in property management expenses related to our employee benefits. Turning to our balance sheet, a key focus area of our 2025 strategic initiatives. Given our progress in monetizing low-yielding land and select non-strategic multifamily assets with the aim of improving our leverage and cost of debt capital, in early July, we modified our revolving credit facility and term loan. With this amendment, we reduced our borrowing spread and introduced a leverage grid to allow for continual improvement in our borrowing costs as we further reduce leverage. The initial spread is 150 basis points over SOFR, down from 205 basis points with the ability to step down to 120 basis points should we reduce corporate leverage below 40%. This amendment represents another important step in the company's balance sheet evolution, tangibly improving our cost of capital, flexibility, and optionality and demonstrating continued support from our lenders. Net debt-to-EBITDA on a trailing 12-month basis was 11.3x, which does not reflect the impact of assets closed and under contract after June 30. With these sales, we remain on track to reduce net debt-to-EBITDA to around 10x by year-end 2025. After factoring in the impact of the recent transactions closed in July, we had $126 million outstanding on the revolver. Our $200 million term loan has been fully repaid and liquidity has increased to $181 million, which includes the available balance of the revolver. As a result, all of our debt was fixed or hedged with a weighted average maturity of 2.6 years and a weighted average effective interest rate of 4.86%, a reduction of over 20 basis points prior to the amendment. Importantly, with the recently closed and announced sales and the new facility, the company will have sufficient liquidity to refinance all of its wholly owned 2026 maturities with proceeds from completed sales and/or availability on its revolving credit facility. Turning to guidance. We are raising our Core FFO guidance range to $0.63 to $0.64 from $0.61 to $0.63 per share. This change reflects the robust performance of our portfolio to date, including strong blended leasing spreads of 3.5% year-to-date, recent sales and resulting debt repayments, the acquisition of the controlling interest in Sable, and the amended facility. Our revised range represents Core FFO growth of 5% to 6.7% compared to 2024, not only leading our multifamily peers, but also outperforming most REITs across sectors and asset classes. We are also raising our Same Store NOI guidance to between 2% and 2.8%, reflecting our solid performance year-to-date, visibility into continued market rent growth through the end of the peak leasing season, and realized savings from our technology and operational initiatives. As a reminder, in the third quarter, we will lap significantly positive insurance and tax resolutions from last year, which will impact our Same Store growth rate. We still anticipate G&A will be flat relative to last year, with the third quarter mostly in line with the second quarter and an uptick in the fourth quarter for activities that occur at that time. Our interest expense guidance assumes the sales under binding contracts are completed by the end of the third quarter and utilized to repay debt. This concludes a strong second quarter for Veris Residential, highlighting our sustained momentum in achieving our strategic milestones, including accelerated earnings growth and an earlier-than-projected reduction in corporate leverage. With that, operator, please open the line for questions.
Operator
The first question is from Steve Sakwa from Evercore ISI.
Speaker 5
Mahbod, maybe if you could first talk about kind of the Board change and the departure of the CIO. Maybe just kind of help us think through maybe the CIO and kind of what that means for dispositions moving forward? And then just any comments on sort of the Board change.
Sure. Steve, thank you for the question. With regards to our CIO, the decision that we made to make that change, we'd like to thank Jeff for his contribution that he's made over the last 2, 3 years. We have a team, an investment team headed by Brian Primost who's been with the company for 19, almost 20 years and has actually been very much leading many of the executions on the office, land, and even multifamily side, certainly during my tenure. And so we're in good hands with Brian and the investment team and well positioned to continue executing on our plan. And as you've seen even during this past quarter, it really made some significant strides in moving that forward. As for Ron, I'd also like to thank Ron for his valuable contribution over the past 2 years. He's been a tremendous Board member and supporter of the company, been a shareholder for a long time. I think his decision was based on his recognition of his fiduciary obligations to various shareholders and balancing those with his position at Madison and their need for greater flexibility to trade various shares in accordance with their fiduciary obligations to their investors. But Ron continues to be highly supportive of us and the company's strategy, and we look forward to maintaining a regular dialogue with him and Madison as one of our larger shareholders going forward.
Speaker 5
Okay. And then, Amanda, I know you sort of commented about some of the tough comps that you've got coming up in the back half, I think taxes and insurance were both down last year. But is there anything that you can share with us on kind of what's embedded in guidance for the back half of the year? And when do you sort of get more visibility on, I guess, both of those figures for the back half of the year?
Yes, certainly. As you mentioned, we have our non-controllables renewing in the second quarter. For insurance, we anticipated a mid- to high single-digit renewal. There's increased capacity in the market this year, but we also have our real estate taxes adjusting in the third quarter, particularly in Jersey City, which is a significant part of our portfolio. Real estate taxes in Jersey City have been unpredictable in previous years. To put this in perspective, a 10% change in insurance premiums would be balanced by just a 4% increase in Jersey City taxes. Overall, this is our consideration, and it has been incorporated into our guidance.
Speaker 5
Okay. And for my last question, Mahbod, you've had notable success with the dispositions, possibly quicker than many anticipated. As you approach the upper end of your range with a few pending, how are you considering future sales for the remainder of this year and into 2026?
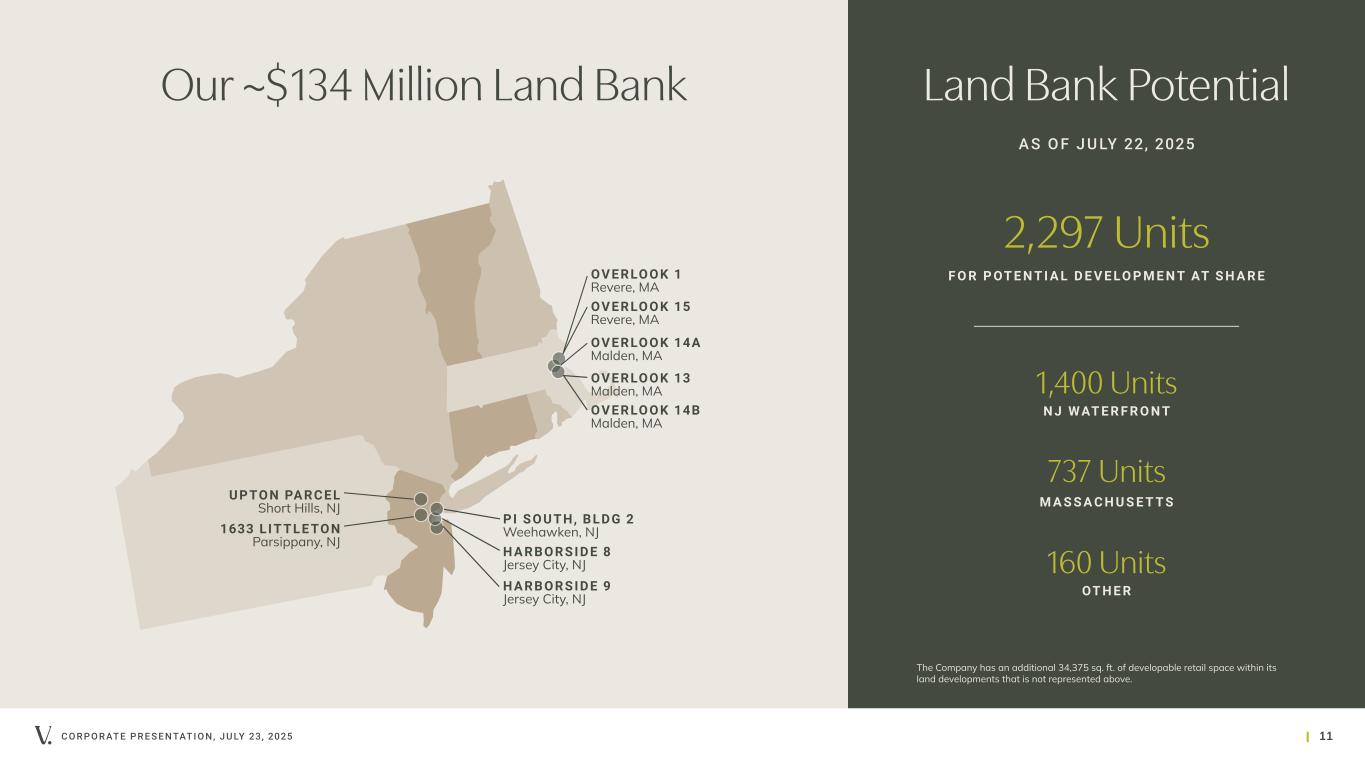
I appreciate the question. First, I want to acknowledge the team's exceptional effort to get us to this point at such a rapid pace and with these valuations. However, the transaction market is quite difficult, and it's hard to forecast. Everything may seem smooth on the surface, but there are challenges behind each transaction. There’s often a chain reaction; if buyers face issues with their transactions or asset sales, it could affect us. This makes it tough to determine how much progress we can make and at what speed. That said, the Board and management clearly want to recognize and realize net asset value where possible, typically with smaller assets, in order to crystallize those values for our shareholders. So far, we still have $134 million in land that we might be able to rationalize further, along with potentially one or two other small assets. If we can realize fair value for these assets, it may allow us to make continued progress. Enhancing our ability to reduce leverage and strengthen our balance sheet is also possible, especially by recapturing earnings from land, reallocating equity, and concentrating on factors within our control to help close the gap to net asset value.
Operator
The next question is from Eric Wolfe from Citi.
Speaker 6
Just wanted to follow-up on your answer there a moment ago. If you look at the properties that you sold, it looks like they're around about $100 million in value on average. Should we take that as an early indication that the market for larger buildings is falling a bit? Or is there a certain size or type of asset where it becomes more difficult to sell them?
Yes, look, there's definitely a discount for size today. That's a given. I wouldn't say that's developed in the last quarter. That's been the case for a while now, but there's definitely a discount for size. And so I wouldn't say there's a firm cutoff, but certainly smaller transactions you do have a greater chance of being able to access a different buyer pool with a different cost of capital or investment horizon or both, that typically would translate into a value that's more consistent with what we think of as intrinsic value. I wouldn't say there's a firm cutoff, but look, anything over large today is not really that large. Anything over a couple of hundred million dollars, the buyer pool starts to really tail off pretty quickly and you can find yourself often with more value-add opportunistic type capital and with that cost of capital, that translates into a different price.
Speaker 6
Makes sense. I guess I was trying to understand the sort of the number of properties, the value of properties that sort of fall into that hard to sell category. Because I guess just looking at yourself, it seems like it's maybe Haus25 or the Liberty Towers that sort of fall into that category of a couple of hundred million. But I don't know if there's anything else that would be falling to that.
Yes, Boulevard could be another possibility. I mentioned earlier that we don't have many assets that could be considered bite-sized in today's market. However, we do have $134 million in land and a few other assets. Between these, there's enough to maintain the momentum we have built through deleveraging and increasing earnings.
Speaker 6
I have one last question. You mentioned some difficulties in the background. While I understand you can't discuss the transactions that haven't closed, could you elaborate on the challenges faced with the two properties that did close? What hurdles needed to be overcome for those transactions? Additionally, do you have any insight on how those properties were sold in relation to replacement cost? Are buyers currently seeking discounts due to higher debt costs and return expectations, or is there a chance to sell at or near replacement cost?
Yes, it's a good question. So relative to replacement cost, I would say those represented something of a discount, not a huge discount, but something of a discount to replacement cost. Relative to what we deem to be a sort of near-term strong valuation for those properties in this market, I think we've got very strong prices. And I think you can see that in the cap rate, which is a low 5s cap rate that we achieved for those assets.
Operator
The next question is from Anthony Paolone from JPMorgan.
Speaker 7
First question is on next year's debt maturities. Just wondering what your early thoughts are in terms of how you address those with either disposition proceeds or refinancing and also just balancing the desire to reduce leverage versus maybe the buyback.
Next year, we have approximately $0.5 billion of debt maturing, which I categorize into two groups. About half of that is tied to mortgages on wholly owned assets. We believe that between the sales we've already announced and the capacity on our revolver, we will be able to repay all of those debts. Additionally, there is one mortgage on Portside 1, which is our most expensive mortgage, and we may pay that off sooner than its maturity next year. The other half of the mortgages are on assets held in joint ventures, some consolidated and some unconsolidated. Each of these will need its own financing solution. However, as we've discussed before, there is significant demand for capital and mortgages for our quality assets, and we are confident we will have various options. We'll collaborate with our joint venture partners to determine the best solutions. Overall, we feel assured about our refinancing options.
Yes. I think just to add to that, if you just take the asset class, but then specifically the asset quality that we have, the markets that we're in, and then the progress that we've made operationally and in terms of addressing our balance sheet, I think that's put us in really good stead to be able to manage through those refinancings as we move forward as we have done this year and in prior years. And so I think we're in a good spot. And I think we've created many options for ourselves going forward as a result of the great work the team has done to be able to strengthen the balance sheet. And you can also see that in the terms of the latest amended credit facility, which I think are very different from what they were a few years ago and really reflective of the company today.
Speaker 7
Got it. And just the success you've had in just hitting your disposition goals already. And then you mentioned the land and maybe some smaller assets, like is it still the priority though to reduce debt further? Or would you consider the buyback here?
Yes, it's a good question. We have the buyback. We have an authorized program. It's a tool that's available to us. If you run the math, I'd say that limited potential for accretion from that, but it's still accretion. So it's valuable to have. I think what we've been clear about from the outset is that leverage reduction is the priority. So while the buyback would allow you to take advantage of the discount to NAV that we're trading at and create some accretion, that discount in itself, we believe, is somewhat driven by the leverage profile, which is significantly better than it has been historically. And on a trend now to really get within an expected range for a public company like us. And in addressing that leverage and continuing to delever the balance sheet, we hope and expect that we can close that gap and that would be in the best interest of our shareholders. And so it's absolutely a priority to delever over anything else at this time.
Speaker 7
Okay, I understand. My other question pertains to your rent-to-income ratio. This figure has caught our attention as it is now below 11%, which is significantly lower than the midpoint for the multifamily peer group. Could you discuss where you envision this ratio moving over time or describe the characteristics of your resident base that contribute to such a low figure? It seems like this could give you considerable pricing power compared to markets like New York City.
Yes. It's important to note that about 25% of our move-ins are from Manhattan. A significant portion of our residents work in Manhattan and earn Manhattan salaries, with nearly 10% having seven-figure incomes and an average household income exceeding $400,000. This indicates a strong tenant profile and creditworthiness among our residents, which supports the income of our properties. I interpret this as evidence of resilient cash flow, allowing us to continue increasing rents in a market with limited supply. However, I don’t believe this provides justification for excessive rent increases during renewals. We are operating in a competitive market, and we utilize our own internal pricing model that factors in various elements to determine pricing. This approach is still resulting in healthy rent growth compared to the national average. I see the affordability ratio primarily as a sign of the robustness of our underlying cash flows.
Operator
The next question is from Yana Galan from Bank of America.
Speaker 8
Congrats on a strong second quarter. I was wondering if you could share any thoughts on the mayoral election in New York City and how potentially less development in New York City can increase rents and values in Jersey City?
Thank you for the question. It's an interesting one. I think it's a little too soon to draw any definitive conclusions. However, based on some of the policies that have been mentioned, it is certainly possible that Jersey City, particularly the Waterfront due to its proximity to Manhattan, could benefit from these policies. This includes the possibility of higher taxation on corporations and high earners who are already a significant part of our resident base and may become an even larger part if they face greater taxes across the river. There are already advantages to living here and working across the river, including not paying New York City tax. When considering the high earners in our portfolio, this translates to a meaningful contribution towards rent here, which is about 30% cheaper than prime rents across the river. If those policies are implemented, we could indeed be a beneficiary. But again, I think it's a little too soon to draw any conclusions.
Speaker 8
And I'm sorry if I missed it, but can you share the blended rent spreads for July so far?
For July, we're mid-single digit.
So you mean post quarter, Jana, just to clarify?
Yes. So look, as you've seen, we've seen an acceleration in the second quarter as we've entered the busy leasing season, and the portfolio continues to do really well. But it's really only been 3 weeks. So we don't want to draw any conclusions about where new leases are. But in terms of renewal, we still continue to send out renewals around the mid-single digits, as Mahbod just mentioned.
Apologies. I think your question was where we're sending out renewals.
Operator
The next question is from John Pawlowski from Green Street.
Speaker 9
I want to follow up on your comments about land. Do you still plan to sell most of the remaining $130 million in land soon, or considering the current challenges in the construction and land markets, do you anticipate holding onto it for the foreseeable future?
It's a good question. I go back to my comments about it being a difficult transaction market. It's certainly a difficult transaction market for land as well, as you correctly pointed out. So I think our approach historically has been to be pragmatic about these things, but also measured in our approach. And what I mean by that is we recognize the importance of recycling capital, and you've seen us do this with office, recycling capital and the potential to create entity value through that process. And so we're looking at a wide range of options. We're not going to be fire selling anything, but we would like to make some more progress. I wouldn't say all of that land is it's sellable near term. But if you look at the composition, there's a significant chunk of concentration, and that is very desirable and in any normal market would be very liquid.
Speaker 9
Okay. That helps. My last question is about the occupancy trend for Liberty Towers. It has been fluctuating and has declined more than we anticipated this quarter, but it seems to be improving for the next few months. Can you provide some clarity? Should we expect it to fluctuate, remaining in the high 70% to low 80% range for the next several quarters as you take units offline? Was this the lowest point, and are we now looking at a more consistent upward trend in occupancy from here?
Thank you for the question. I think they can bounce around a bit as we're introducing new units to the asset, but we have seen strong momentum in the summer season, both on the new leases, but have also secured a corporate lease for 18 units that helped drive up the lease percentage, as you've seen in my remarks for July. So there may be some volatility, but we would hope to be in the low 80s going forward.
Speaker 9
Okay. Can you remind me when exactly you expect the project to be fully complete?
It's going to be over 3 years. We've done 120 units year-to-date that are renovated and are leased. That's around 20% of the building. We're actually pre-leasing some units that we know are scheduled to be delivered in the upcoming weeks to the extent the prospects want to move in, in a few weeks or so. But just given the size of the building, it will take around 3 years to complete the full project.
Speaker 9
3 years from today, so mid-2028 stabilized?
Yes, and thereabouts, could be the end of '27, but may well slip into '28. It's too early to say we're still on a 20% through the building.
Operator
There are no further questions at this time. I would like to turn the floor back over to Mahbod Nia for closing comments.
Well, thank you, everyone, for joining us today. We're pleased to report another strong quarter, both strategically and operationally, and look forward to updating you again next quarter.
Operator
This concludes today's teleconference. You may disconnect your lines at this time. Thank you for your participation.