Operator
Good morning, ladies and gentlemen, and welcome to Advantage Drainage Systems' first quarter of fiscal year 2026 results conference call. My name is Tamika, and I am your operator for today's call. At this time, all participants are in a listen-only mode. Later, we will conduct a question-and-answer session. If you'd like to ask a question during that time, press star, followed by the number 1 on your telephone keypad. If your question has been answered and you'd like to remove yourself from the queue, press star 1. I would now like to turn the presentation over to your host for today's call, Mr. Mike Higgins, Vice President of Corporate Strategy and Investor Relations. Sir, you may begin.
Good morning, everyone. With me today, I have Scott Barber, our President and CEO, and Scott Cottrell, our CFO. I would also like to remind you that we will discuss forward-looking statements. Actual results may differ materially from those forward-looking statements because of various factors, including those discussed in our press release and the risk factors identified in our Form 10-K filed with the SEC. While we may update forward-looking statements in the future, we disclaim any obligation to do so. You should not place undue reliance on these forward-looking statements, all of which speak only as of today. Lastly, the press release we issued earlier this morning is posted on the Investor Relations section of our website. A copy of the release has also been included in an AK submitted to the SEC. We will make a replay of this conference call available via webcast on the company website. With all that said, I now will turn the call over to Scott Barber.
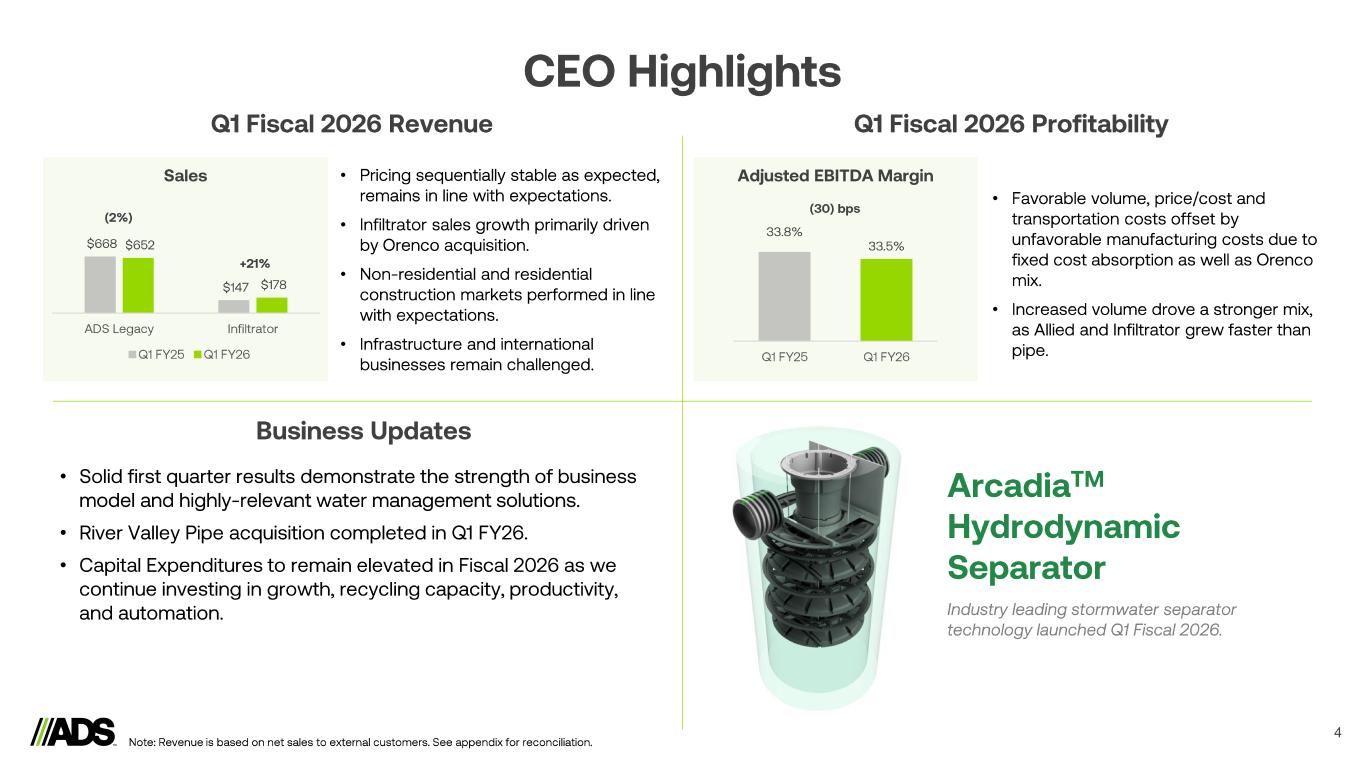
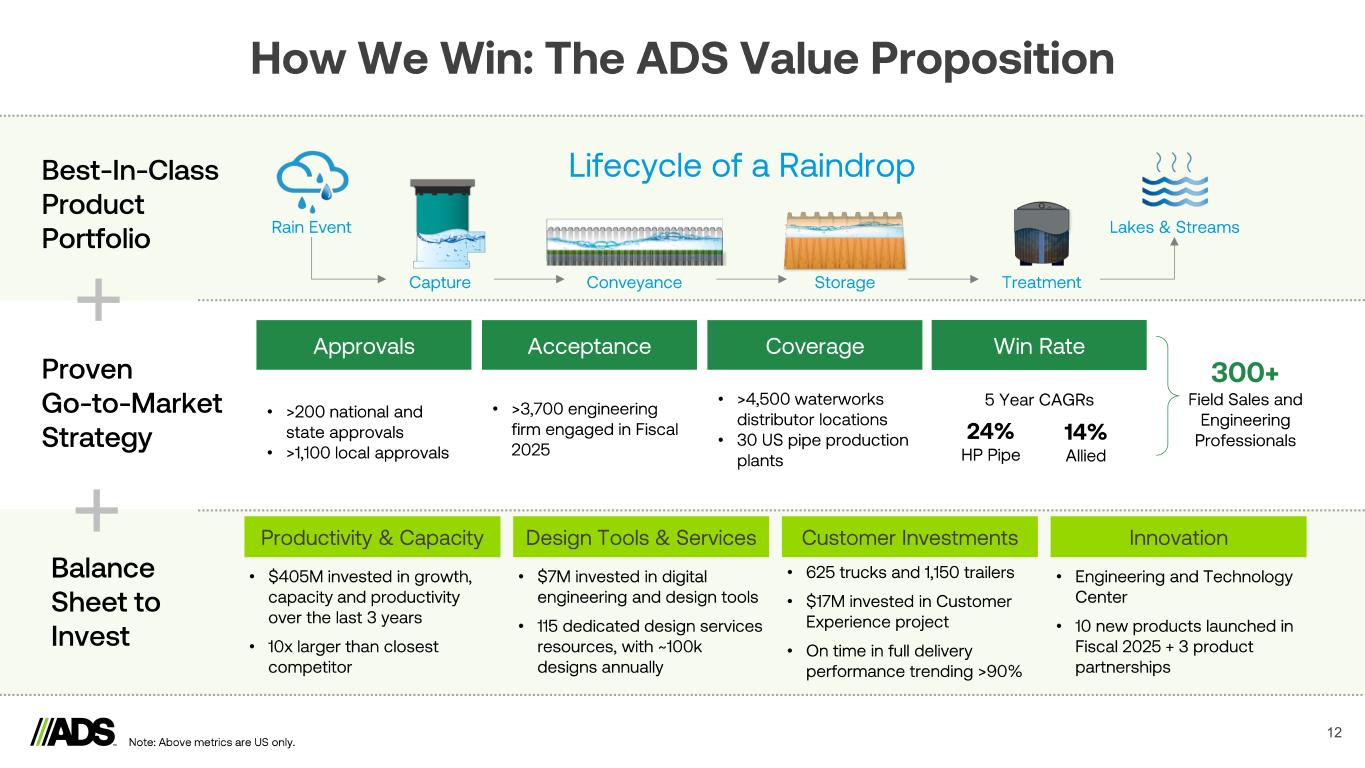
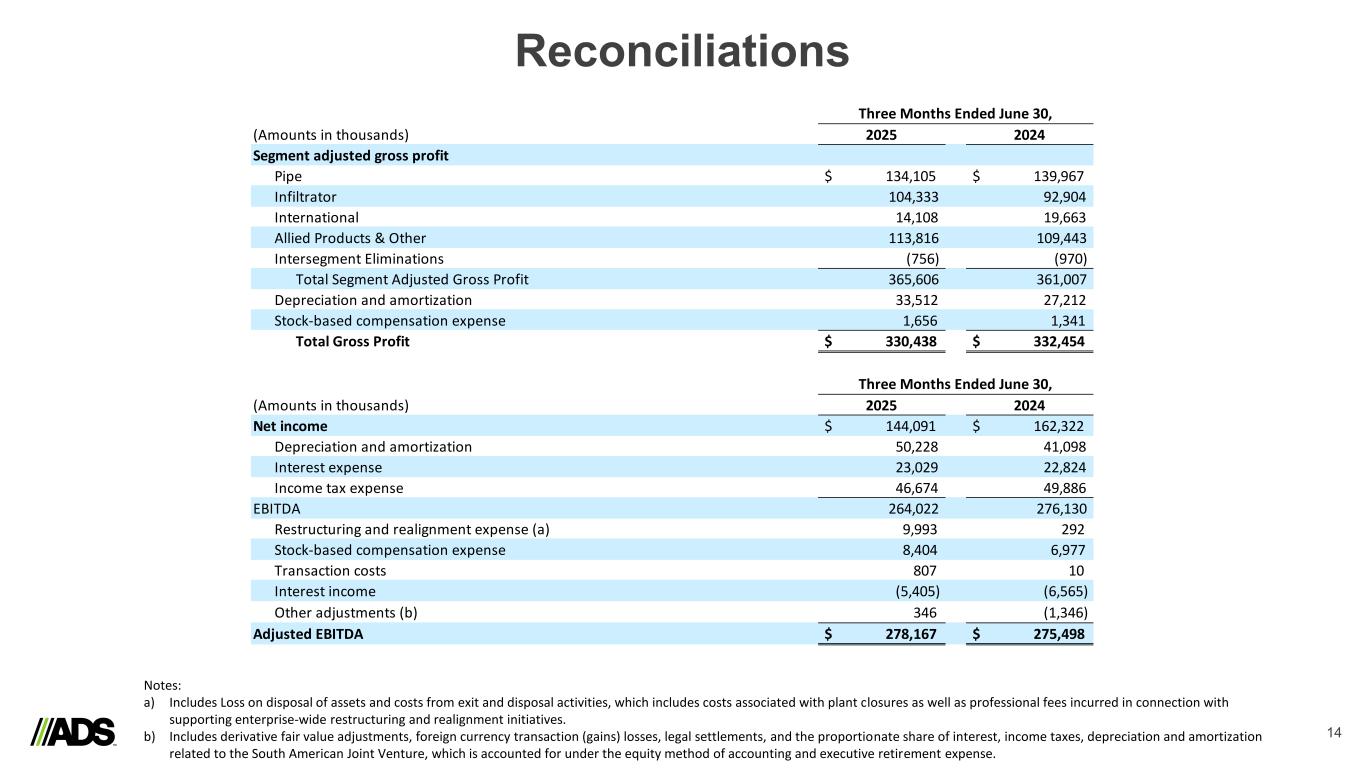
Thank you, Mike, and good morning, everyone. Thank you all for joining us on today's call. We generated strong results in the first quarter, delivering a resilient 33.5% adjusted the EBITDA margin despite a challenging market environment. The ADS and infiltrator teams executed well and remained focused on driving profitable growth and operational excellence by executing our market share model, introducing new products, pursuing acquisitions, and investing capital for long-term growth. Revenue increased 2% overall, primarily driven by the Orenco acquisition. Organic sales were down slightly, though our core non-residential and residential end markets were resilient in the quarter. Importantly, Allied Products and Infiltrator, which are two of our higher margin categories, increased revenue in the quarter. We continue to build on the strong foundation of the ADS story. We operate in highly attractive water segments supported by secular tailwinds from changing climate patterns, as well as the increasing awareness of the societal value of proper stormwater and on-site wastewater management, ultimately driving long-term demand for the company's products. ADS is the only company with solutions that extend throughout the entire stormwater system on a national scale. Through our best-in-class portfolio of water management products, we deliver solutions that are safer faster to install and lower cost through savings on labor and equipment to meet the needs of our customers and communities we continue to bring innovative solutions to the market that expand and evolve our product offering in june ads launched the arcadia hydrodynamic separator a high performance water quality separator product designed to remove suspended solids. With industry-leading performance, this product addresses the need to protect water resources from pollution. This product comes on the heels of the new stormwater treatment solution, the EcoStream biofiltration product, launched in the latter half of physical 2025. Both of these water quality products are designed to remove pollutants such as nitrogen, phosphorus, sediments, metals, and hydrocarbons in different applications. Water quality remains a key growth area for ADS, and this category has grown at high-teens CAGR over the last three years, as regulations requiring stormwater treatment continue to evolve. Our new engineering and technology center, equipped with a 90,000-gallon closed-loop hydraulics lab, allowed us to test and commercialize these products more quickly than was previously possible. For context, that is the amount of water used by the average U.S. household over the course of two and a half years. This lab has the capacity to move water at 2,300 gallons per minute and compare that to the water pressure in your average kitchen sink of two to three gallons per minute, and it will give you an idea of the capability of our new engineering and technology center. Additionally, demand in the advanced treatment market is also a key focus area, and we are pleased with Orenco's strong start to the year with growth in commercial applications as well as controls. Orenco's performance was a significant contributor to driving infiltrators' 21% growth this quarter, complemented by double-digit organic growth in on-site wastewater tanks, where conversion to plastic remains highly relevant. Domestic allied product sales increased 1%, driven by demand in the multifamily residential market, where we experienced double-digit growth of key products like retention detention chambers, water quality products, and our stormwater capture structures. More broadly, residential market demand was highly variable depending on geography and application. While multifamily construction improved, single-family housing continues to be impacted by the interest rate environment and affordability constraints. From a geographic lens, we saw better land development activity in the west and northeast, but the DIY channel we serviced through big-box retailers was challenged. Infiltrator core products, both leach field chambers and septic tanks, significantly outperformed the market. we will continue to drive growth through product introductions and material conversion opportunities while also building on the relationships with the large national and regional home builders to drive above market growth in residential construction in the non-residential market growth was driven by acquisitions and strong execution from our sales team particularly in commercial construction activity in the midwest atlantic coast south and southeastern united States. We continue to see good activity in data centers and large projects and believe that underlying demand in key geographies was impacted by heavy rainfall and high temperatures, particularly in May and June. With respect to infrastructure, despite revenue being down this quarter compared to the prior year, it was actually the third highest revenue quarter in the company's history. As a reminder, this segment is more concentrated in geographies where we have stronger approvals and often large projects like airports can make quarterly performance uneven. That said, over the long term, the demand drivers remain strong. Over 50% of the IIJA's highway and street funds will be spent over the next five years so we continue to feel good about the overall direction of the infrastructure market. Moving to profitability, this quarter's 33.5% adjusted EBITDA margin is among the highest in the company's history, despite a challenging demand environment. Excluding Orenco, the consolidated margin would have been 34.1%. Importantly, overall pricing remains stable sequentially as expected. Price cost was favorable in the quarter, benefiting from favorable material costs as well as product mix. manufacturing costs were unfavorable as expected due to the fixed cost absorption on inventory produced over the winter months. We were able to offset a portion of that with favorable transportation costs driven by the better performance of new assets and implementation of new programs. Also of note, we recently began to wind down operations at a distribution yard and a small pipe manufacturing operation. With the capacity investments in the region and acquisition of River Valley Pipe, we were able to eliminate some inefficient production while also improving our customer service and delivery. Over the last year, we have taken fixed costs out of the ADS network by closing two pipe production operations, a recycling facility, and three distribution yards without compromising any customer service. We can do this because of the investments we have made in new lines, rebuilds, and the planning programs implemented over the last several years to illustrate this point on average ads production per line increased by over 20 compared to pre-covid levels and the strategic capital invested over the last several years has allowed allowed us to remove inefficient equipment from the network i'm very proud of the team for the performance delivered in a challenging quarter Their discipline, execution, and commitment to continuous improvement resulted in our safest quarter ever, achieving a record low total recordable incident rate below 1.5 compared to an industry average of 3.2. These achievements reflect our ongoing focus on operational excellence and safety, which are foundational elements of our sustainable growth strategy. When you stack up our strengths, the scale, the product portfolio, our go-to-market strategy, and the ability to invest in both our businesses, our people, and industry growth, you can see ADS as a powerful value proposition. In summary, we continue to execute effectively in a challenging environment, preserving strong margins and enhancing our mix towards more profitable products and geographies. Our self-help operational initiatives are now bearing fruit. We've increased the capacity of existing production lines and added new ones in strategic areas to meet customer demand. We've also upgraded the service and delivery experience for our customers, leveraging new digital tools across our platform. While we navigate the near-term environment, we do so with an eye towards the future. We remain firmly committed to our long-term vision and will continue investing in the capabilities that will position us for future success. Overall, that long-term outlook for our business remains strong, supported by compelling secular tailwinds driving demand for water management solutions across the U.S.
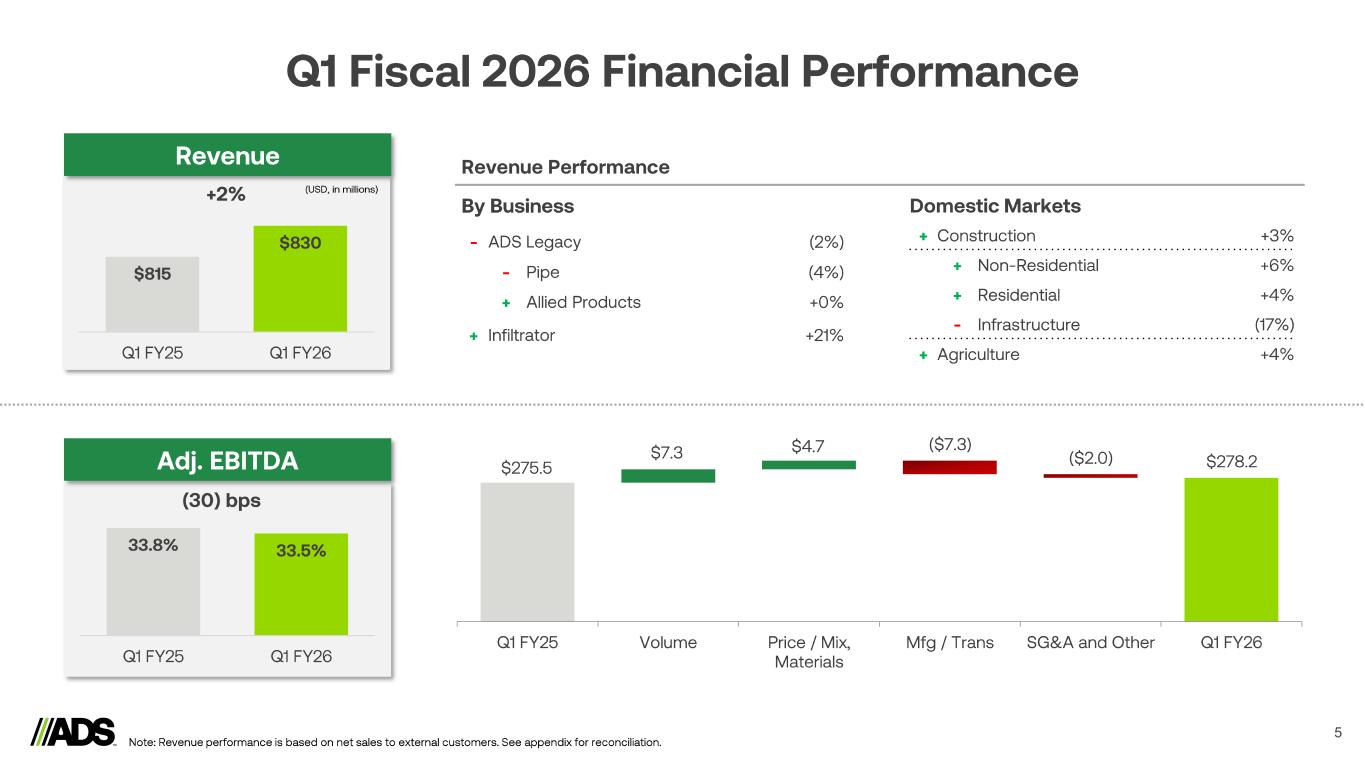
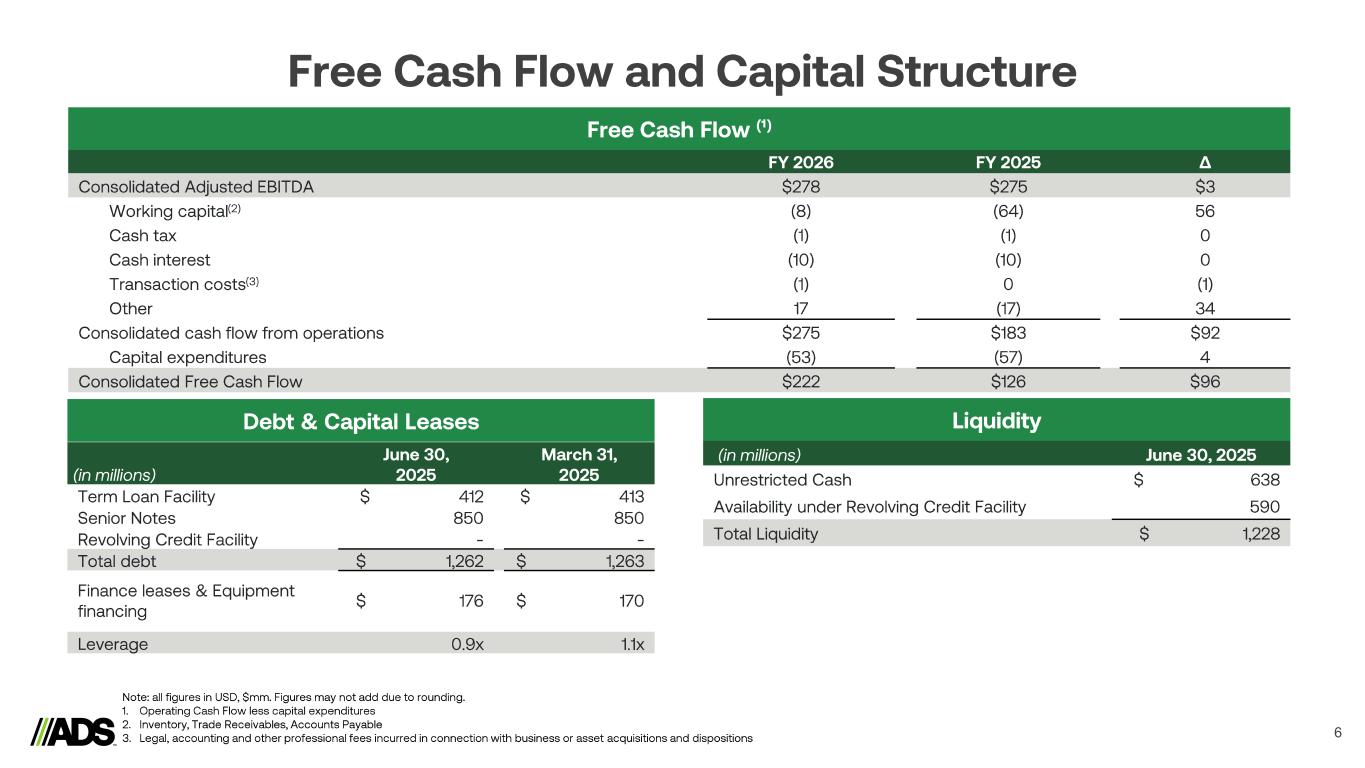
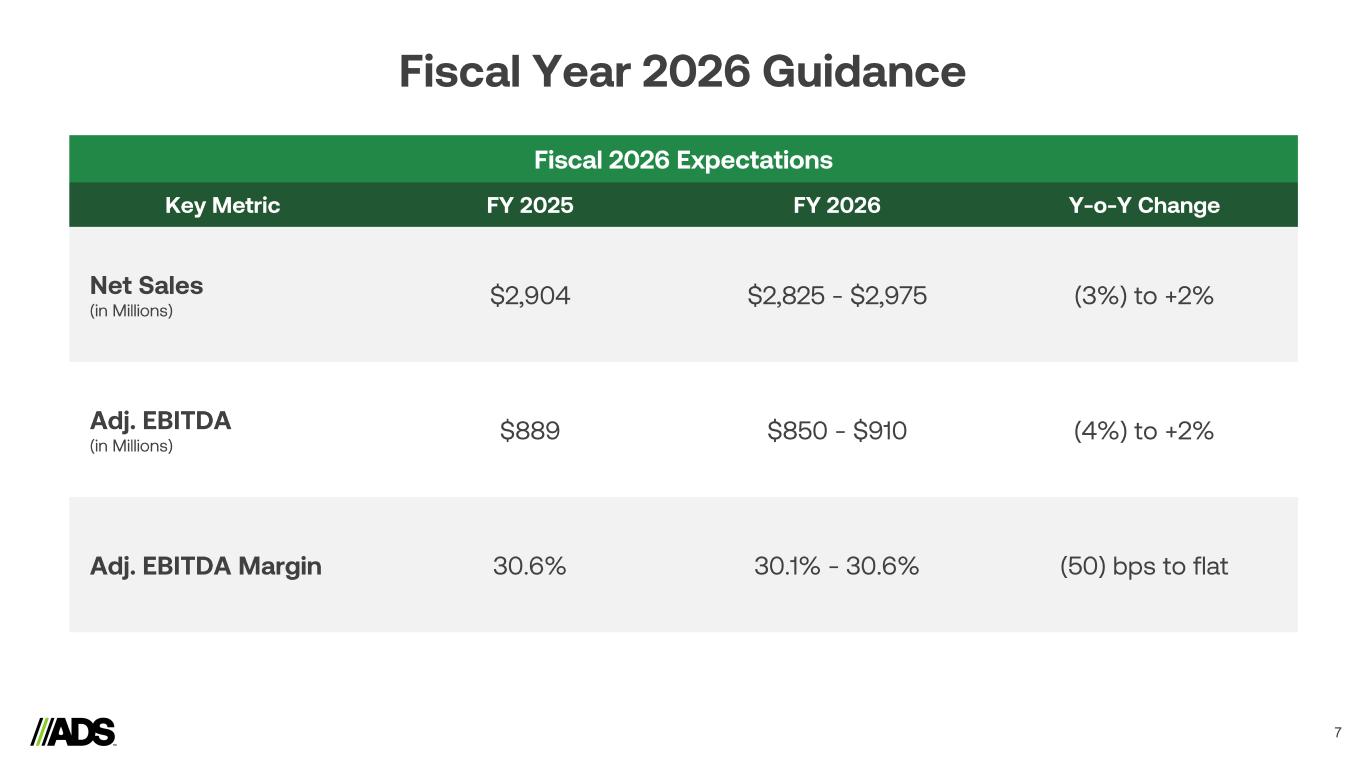
Now, I'll turn the call over to Scott Cattrall. thanks scott on slide five we present our first quarter fiscal 2026 financial performance revenue increased two percent to eight hundred and thirty million dollars despite challenging end market demand importantly we believe our results outpaced our end markets overall demonstrating the resilience of the ads business model as scott noted from a profitability perspective we are very pleased with the 33.5 adjusted EBITDA margin in the first quarter a couple things i feel are worth reiterating first pricing remained stable sequentially as we had indicated and expected second price cost was favorable year over year from a manufacturing perspective while we did experience unfavorable fixed cost absorption during the quarter we were able to partially offset such with favorable transportation as well as favorable variable manufacturing cost performance. Regarding SG&A costs, the year-over-year increase was primarily driven by the acquisition of Arenco, as well as continued investments in areas that drive long-term shareholder value, such as resources and talent at our world-class engineering and technology center. We have worked to offset these increases by containing costs in travel, marketing, and other discretionary expenses. Again, despite choppy end-market demand, It is important to highlight the company's performance and the resulting 33.5 percent EBITDA margin, one of the highest margins in the company's history, despite end market weakness, demonstrated the continued resilience of the ADS business model. On slide six, we present our free cash flow for the quarter. We generated $222 million of free cash flow year-to-date, compared to $126 million in the prior year, primarily driven by better working capital performance. Of note, we expect the OBBBA to result in an incremental $30 to $40 million of free cash flow this fiscal year. Thoughtful capital allocation continues to be a key focus for the management team and our board. Given the strong cash generation of this business, we spent $53 million on capital expenditures in the first quarter, and we now expect to spend approximately $200 million to $225 million for the full year, focusing on innovation and product development at the new world-class engineering and technology center, as well as increasing our recycling capacity in the southeast, continued investment in customer service, productivity, and automation, as well as executing on growth in key geographies. We ended the quarter with less than one turn of net leverage and over $1.2 billion in available liquidity, including $638 million of cash on hand. This level of financial strength gives us exceptional flexibility to invest with conviction and respond quickly to strategic opportunities as they arise. Our capital allocation priorities remain focused on value creation levers such as capital expenditures, innovation, and acquisitions. Moving on to slide seven. While pleased with our performance in Q1, given the continued uncertain demand environment, our guidance ranges remain unchanged. We remain focused on executing our long-term strategic plans to drive consistent long-term growth, margin expansion, and free cash flow generation.
Operator
With that, I will open the call for questions. operator please open the line as a reminder to ask a question press star one on your telephone keypad if your question has been answered and you would like to remove yourself from the queue press star one your first question is from the line of brian blair with oppenheimer thank you uh you know very solid start to the year i guess to to level set on on q1 uh performance can you estimate the impact of weather in terms of project delays and remind us of the easy comp dynamics
from Q125. In the end, I guess I'm just trying to get to the net impact of Q126 deferrals versus prior year project dynamics.
Oh, okay. Morning, Brian. This is Scott B. You know, the unpacking how things are moving because of weather. I mean, that's kind of how I interpret your questions and um i do think that you know early in the first quarter may uh you know april may you know some things were moving around by weeks you know delayed two three four or five weeks so stuff certainly moved around between uh the fourth quarter of last year and this quarter Some stuff moved into this quarter. I'm not sure that it was, you know, hugely detrimental to us because it's just as a delay. You know, this stuff kind of comes back.
And if I recall correctly, you know, last year was there was probably some stuff pulled into the quarter. yeah brian i would say last year you know we it was probably 15 to 20 million dollars when you look at uh you know the kind of favorable impact that happened in q4 that was stolen from q1 so that would kind of be there i would agree with scott you know things kind of moved around in the quarter but kind of evened out kind of evened out right and as we get through july and august you know we think it's kind of a norm a normal run work run rate assuming no other significant weather events that delay things.
And I guess what I'm trying to really always suss out of these situations is, you know, demand overall is just kind of tepid. You know, it's very regional. And as things, as weather moves them back and forth a little bit, we've got to be careful not to get, you know, too excited, you know, when stuff kind of moves around by a couple of weeks or from one month to the next. Our overall view of the demand is it's rather, you know, flattish and tepid. So when we can grow in residential and non-residential, these very core markets across both the infiltrator and the ADS platform, we feel like we're, you know, doing pretty good and more than holding serve in our key markets and geographies.
Absolutely. That seems to be the case. I appreciate the color there. uh price cost always you know came focus and turned positive a little earlier than anticipated i just given you know price stability uh continued sequential stability you know anticipated mix current visibility on input cost what does your team expect for q2 price cost and is there any shift to the you know neutral full year impact that you've baked into that now let's start with the last part of that first.
So, price cost for the year, still expected to be flat. And then, again, a little bit favorable versus our expectation in the first quarter, as you indicated. But again, remember, last year, kind of, you know, we didn't have the pricing impact until our fiscal second quarter. So, again, a little bit of pricing, you know, that we had to deal with on a year-over-year basis in that first quarter. But we lap in the second quarter. So that'll be something as you look at that progression from Q1 to Q2 and then through the remainder of the year. But, again, sequentially, pricing has remained relatively flat, like we've been talking about. So that's very good.
Operator
Your next question is from the line of Matthew Boley with Barclays.
Good morning, everyone. Thank you for taking the questions. I wanted to start on CapEx. I think the guide was reduced from $275 million to that $200 to $225. So I just wanted to check on if anything's changed around the capital projects you're planning to invest in this year, if this is just timing, or if we should kind of read any implications to share repurchase or potentially a little bit more dry powder for M&A.
Yay, Matt. Scott here. It's just timing. Some of the larger projects we had are just moving to the right a little bit. And, again, it doesn't impact our ability to meet our anticipated demand. Scott hit on the efficiencies and productivity and some of the other things that we've done strategically to meet the demand in certain regions. So it's timing.
Okay. Got it. Thanks, Scott. And then, secondly, on Infiltrator, that organic growth of nearly 1%, obviously the residential end market is fairly choppy here in terms of starts. I think I heard you mention that you saw double-digit organic growth in on-site wastewater. So I guess I was wondering if you could expand on that a little bit and how that plays into your outlook. And, you know, could we expect to see that on-site wastewater side of it perhaps offsetting, you know, this residential backdrop here?
So this is Scott B. And Craig's here with us today, too, from Infiltrator. And it's tanks. You know, it's tanks that continue to gain share and grow through new distribution points, new models that we introduced over the last 18 months, tooled and introduced over the last 18 months. And in the poor leach field, I think that we are in the right spot where the types of plate homes or geographies that use our products to have on-site wastewater treatment are a kind of higher mix towards that versus municipal there. So we continue to do really great work there in new products, running our programs through the distribution, and, again, you know, just executing well in Winchester, Kentucky, their very nice facility.
Operator
Your next question is from the line of John Lovlo with EBS.
Morning, guys. Thanks for taking my questions as well. I wanted to ask about, you know, last quarter you talked about the first quarter perhaps being the softest margin given, you know, pricing dynamics and also, you know, the worst fixed cost absorption. So curious if that still stands. I mean, it doesn't seem like the outlook would imply that. But is there any change in the cadence of how you're looking at the margins through the year?
John, this is Scott B. Scott C wants to talk. I can tell also. But, you know, we worked our tail off to try to offset what we saw as really poor absorption through the winter months, flushing out in our first fiscal quarter. So we worked very hard in other areas that were period costs, particularly in transportation and logistics, to make that a better story than we anticipated. um does it inform you know the rest of the year we're not changing our guide it's just the first quarter we're honestly more worried about demand than we are our ability to perform on cost or resin and stuff like that so that that's why we're cautious i mean i i use this word tepid around demand and i really just we just don't want to get ahead of ourselves there so that that's how we're thinking about scott you want to add anything to that No, you nailed it. Perfect. Okay.
No, that makes a lot of sense. And then, you know, it looks like you guys didn't buy back any stock in the quarter. I mean, how should we sort of think about repos going forward? You guys have plenty of cash. You lowered your capex.
You know, how are you thinking about repos as we move forward? yeah it's something we're looking at john uh we continue to look at it so we'll we'll look it's just something we we measure based on our our capital needs right now and what we're investing in there and as you heard me say some of those projects are moving out to the right a little bit so we've got a little bit availability a little bit more cash the uh obbba bill is going to give us a little bit more cash flow than what we had thought as well coming into this year from the bonus depreciation and the R&D piece of that. So, again, a little bit more cash to deploy than what we thought. So, again, I would look to us looking at data here in the next couple quarters. And again, as we look at that based on our working capital needs, our capital expenditures, our innovation, and other investments that we're making, it becomes a key part of that disciplined and balanced capital allocation approach that we want to use.
So, right now, we're comfortable where we are but that doesn't mean that in the next couple quarters we take what i'll put air quotes around excess cash uh and put that to work um so that's how how i talk to it makes sense thank you your next question is from trade realms with stevens hey good morning everyone this is ethan on for tray thanks for taking the question And I wanted to hone in on Allied and Infiltrator and those two segments seeing stronger growth versus pipe and how you guys are seeing a nice mixed benefit there. So any sense on how you guys are expecting that sort of relative performance to trend for the year? Maybe any margin mixed benefits versus what had been baked into guidance? And I think I also heard that there was some geographic mixed benefits as well. So any more color on that would be great. Thanks so much.
So good question. and we will continue to really drive the allied, you know, work on programs to get, you know, higher attach rates of pipe and allied products. And what I mean by that, we are working a lot of programs to sell the full package and to increase our penetration of the allied products at a greater rate than we increase our penetration of plastic pipe. That goes on in every geography. Some are ahead of others. And those geographies that are a little behind in that, we're doing some new things to try to stimulate that. Infiltrator is infiltrator. It's new products. It's the tanks. We continue to invest heavily in that business from a capital and resource perspective and acquisition perspective to drive that at higher growth rates. That's part of our algorithm is to drive allied and infiltrator at higher growth rates than the basic pipe business. That said, I think it's kind of built into our guidance, those relative growth rates. And when we can execute on that, sometimes we get a little bump. I think we probably got some right now. The other thing I would add to that is the really nice program that the infiltrator team is working on the Orenco acquisition. You know, that mixes them down a bit. They kind of take that personally. So they're working really, some really good programs. And a RINCO team is doing a good job executing those programs, as a matter of fact. So that's another big work item for us as a company is to continue to improve the profitability of that acquisition. So those are kind of our major levers. I think we've built it into our guide mostly, but to the extent we can exceed our expectations around growth, that would help the gross margin mix of the company.
Got it. Got it. That's very helpful, and I appreciate the color there. And quickly shifting to the cost of the price-cost equation, you know, materials seem to be a bit of a good guy there. Any color that you can give on what's driving the outperformance there? And, yeah, any more color on that would be helpful. Thank you.
Yeah, anytime you talk about price costs, starting with the price side, obviously, we've got a little bit of that headwind we talked about for the pricing that started coming off a little bit in the second quarter of last year, continuing as we move. You obviously got some mix that goes into there that makes it on that side a little bit better than what we had thought. On the resident side of the house, we have really good visibility of that. We know what's on the balance sheet. We know what's going to release over the next couple months through cost of sales and our gross margin. So, again, not a lot of surprise there, but, again, to your point, a nice tailwind. It's execution.
So it's execution. It's good price cost management through both pipe allied products and infiltrator.
Operator
Your next question is from a line of Garrett Shamoise with Loop Capital.
Oh, hi. Congrats on the quarter. I wanted to ask just first on this cost absorption that you had previously called out and saw in the first quarter. I just want to be clear that that's fully behind you and there's no, you know, lingering impacts that you move into Q2.
Yeah, nothing worth highlighting there. We got most of that behind us, like we talked about.
And then just wanted to follow up, you know, just a light of a type of backdrop that you're seeing on the demand side. You know, I think I can predict the answer to this question, but are you seeing any change in the competitive landscape? You know, I know you're getting a ton of questions. with respect to, you know, new capacity that's come on in some regions over the last several quarters, you know, any, you know, thoughts on the competitive backdrop, given, you know, demand, you know, in your words, remains, you know, pretty tabid.
Yeah. Yeah. Okay. I appreciate that you continue to get those questions. And I, nothing new there. I mean, we continue to execute well. And I think there's a few things to point out here. You know, one is, you know, sequentially, our pricing has been very consistent you know for the last four or five quarters um and we have managed pricing against whatever competitive you know thing we face mainly in pipe um we've done that and kept our pricing consistent for a year now and we continue to grow in residential and non-residential which are our two biggest segments and is where people try to come after us um we continue to work our costs pretty darn well and the profitability of that pipe thing you know is pretty consistent um we've executed a lot of different materials programs engineering programs our logistics and transportation team has done a great job of working new programs and using our new assets. We've completely refreshed our truck and trailer fleet over the last year, year and a half. So we've done all these things to kind of manage price, materials, conversion through the CapEx. We offset a lot of that under-absorption. And our margins are pretty good. I mean, the resiliency of the margins in the face of that competition, you know, over the last year that you guys have been bringing up, it's not like we never had competition. We've always had some. You know, I think we're proving that we have a resilient model. And I don't believe in a tepid environment of demand like this that radical price actions increase demand. They don't. I mean, there's only so many projects that are going to come to the market. And you got to have price discipline around that. So I feel pretty good where we are. And I sometimes feel like I don't know what more I can do to demonstrate that we know how to manage this environment. But we'll keep trying, keep working our programs, keep nailing down 30% plus margins. I guess we'll just keep moving on that path. I know that was a long answer, Gary, but I felt I wanted to really try to put that to bed for you. No, I appreciate that.
Yeah, thanks, and that's a lot moving forward.
Operator
Your next question is from the line of David Tarantino with KeyBake Capital Markets.
Hey, good morning, guys. Morning. Maybe just on infrastructure, it sounds like the sales job is more of a function of tough compare, So maybe could you walk us through the underlying demand trends there and how we should expect this to move forward?
Yeah, there are some tough, constant infrastructure, really driven by a lot of very nice airport projects that occurred a year ago. We're pretty strong in that, particularly in the retention-detention area. And those, I mean, I don't like, hey, non-repeat of big projects, but that's kind of what happens in that segment. Mike, on the pipe side?
Yeah, I think on the pipe side, you know, David, it's been kind of highly variable. And we've talked to you guys previously about this. Scott mentioned it in the prepared comments about, you know, how our participation varies by state depending on the strength of kind of our approvals and acceptance. And it's really a case where we kind of have, you know, half the state's doing pretty well and then, you know, half the state's being a bit slow. So, and, you know, I would say as we look forward, you know, project identification is flat, but, you know, we're not seeing as much at the DOT level, but seeing more at the local public infrastructure level, which those projects tend to be a bit smaller than what you see for the DOT. You know, I think there's some other things you see out there too, right? I know everybody talks about, hey, you know, only 50% of the infrastructure bill money has been outlaid. So there's, you know, there's stuff to come. But, you know, when you look at it, I think, you know, the contract counts nationwide by the various people you track. They're anywhere down from 3% to 11%. But the value of those contracts is up. So, you know, kind of what we're seeing is, hey, it's costing more to do these projects. So kind of more money, more costs, but less projects out there. But again, it's a big focus for us. We continue to work, you know, kind of our go-to-market strategy, our market share model against executing there. And, you know, we'll continue to work that.
And then maybe following up on non-res, could you just give us a little bit more color on what you're seeing in terms of the pipeline of projects and orders relative to the tepid environment you guys outlined? in the guide and do you frame for us how the conversion outgrowth is tracking relative to these trends yeah i would say the kind of the four looking indicators around project identification and quoting and the other kind of uh you know third-party metrics we look at kind of line up with a with a tepid tepid environment um you know we still think even though our share might be more mature and non-residential versus residential or infrastructure, you know, in those key states in the south and the southeast, you know, where we have lots of opportunity for share gain. You know, we're seeing strong sales in the quarter, and, you know, we would attribute some of that to a little bit of, you know, hey, those geographies might be a little stronger from an activity standpoint, but also, too, that, you know, we're taking share. When you look at the state this quarter that were strongest from a volume perspective on non-residential you know we like those states that we see florida texas tennessee california those are all states that you guys have heard us talk about you know they're kind of in that lower half the smile the crescent whatever you want to call it uh and you know we had good volume growth in the quarter there so that shows us that you know hey the markets are like on fire there you know there might be a little better than the national average, but, you know, we're being successful, you know, taking share, like Scott was talking about, you know, markets are tough. So, you know, you're trying to get more share of wallet, acquire new customers, do more conversion. HP has been strong growth in those states as well. So, I think it's, we kind of attributed to, hey, we need to control, we can control, and that's the execution of our go-to-market strategy.
Operator
Your next question is from the line of Mike Holleran with Baird.
Good morning, everyone. Just a couple quick guidance questions, just following up on it. First, on the revenue side, you know, you had that slide last quarter that pretty aggressively or detailed the revenue outlook from an end market perspective moving through the year. Curious if that's changed, if there's been any moving pieces in the thought process to the a pepid market sitting here, and whether you just think normal seasonality is what's embedded in the guidance from where first quarter is, some sort of deterioration, any context around that would be great.
No, I think our look to the end markets mirrors what we went out with guidance-wise as adjusted for seasonality, as you mentioned, Michael.
So, no change to our outlook right now to those end markets, hence why we're leaving our guidance unchanged. okay uh that's what i figured and then similarly on the margin line of things um if i hear all of the commentary around the puts and takes with margins there really wasn't anything unsustainable in the first quarter margin here other than possibly mix um you know i heard scott b's comments on more concern over what demand looks like back half of the year that's partially why there's some caution around on the margin line. But what I would like to confirm here is a couple things. One, just that the sequentials as you're thinking about the margins haven't really changed or the thought process around it hasn't really changed. And then secondarily, are there any moving pieces here that we need to think about other than, again, maybe mixed normalizing that would lead to more compression than normal versus that first quarter number? Because, you know, Essentially, you look at the next three quarters relative to where the first quarter is, there is an implication of something a little bit worse than normal. It doesn't seem that's what you're saying, so any context there would be helpful.
No, that's exactly what we're not saying. So, again, I think when you look at that, kind of how those margins will convey through the year, especially a Q1 to Q2, Q2 usually looks a lot like Q1. Obviously, there's going to be puts and takes there based on our Q1 performance. But, again, it's one quarter, choppy, tepid, and market. So, again, we're comfortable leaving the guidance ranges where they are right now.
And what I would add is my worry, Mike, is the demand side. And if that demand side is weaker than I anticipate in the plan, is that going to cause me some absorption problems? Again, I've got to go work. But as far as pricing and materials and our ability to convert and our ability to transport, the mix of infiltrator and allied versus pipe and all that, I'd say we're kind of per the norm. in terms of these first half, second half, and then relative growth rates of the various segments.
Operator
Your next question is from the line of Ryan Connors with Norcos Research.
North Coast Research. Thank you. So, yeah, good morning. A couple of questions here. Most of mine have been answered, but a couple big picture. First of all, I know there's been some drama among some of the bigger players and distributions and new players coming in. And I'm just curious if there's anything to call out there in terms of any impact on your business from a volume or a margin standpoint. Is there inventory building or drawdowns, any discounting, anything with that volatility in the channel?
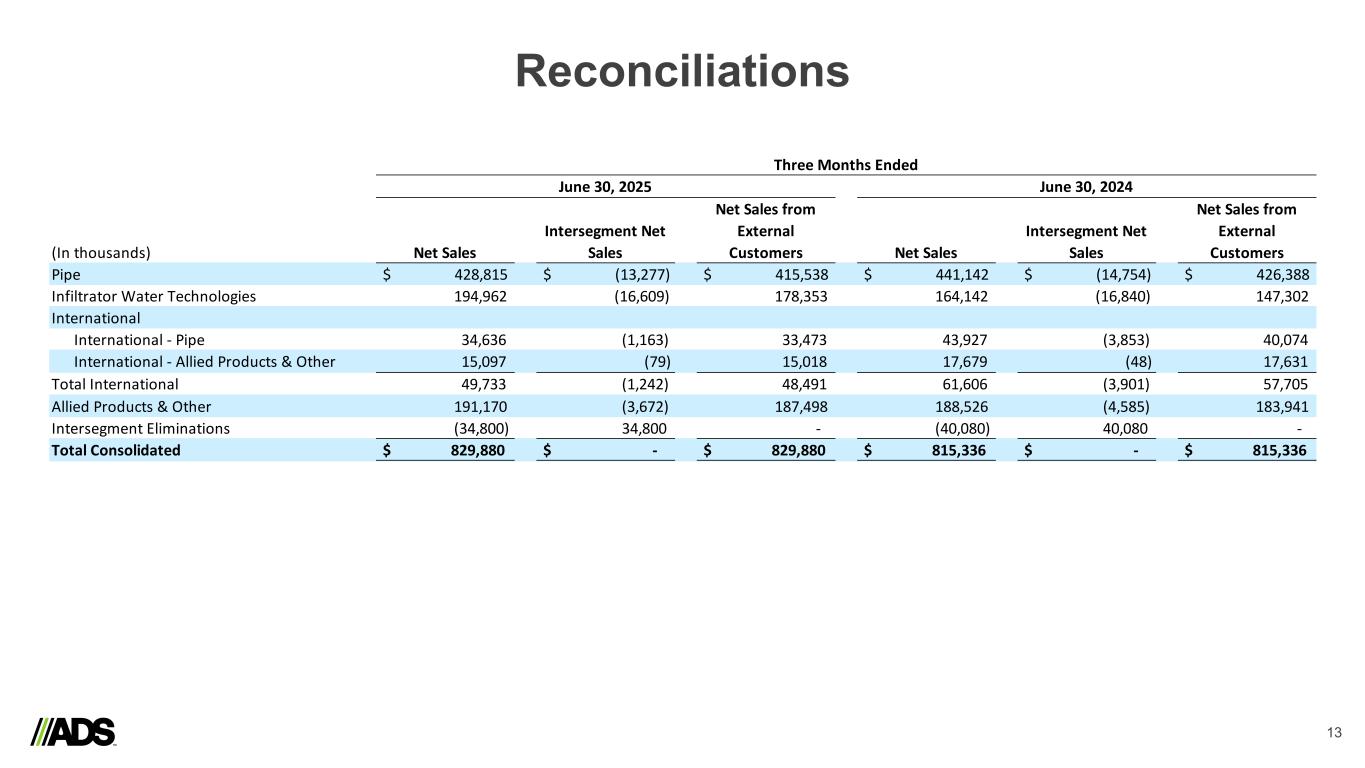
Good question. And drama is a good word, I'd say. And the answer is that we believe that to be largely in the past relative to us. And there would be nothing from an inventory build or mix or different behavior that we would call out on that. I mean, we're always dealing with some level of change and drama, you know, relative to distribution and in-markets and customers. It was a bit heightened there for a while, but I'd say it's calmed down, Ryan. um and we we do though you know always look for opportunities to run programs to do stuff but it's not affecting our business in any spectacular way got it okay that's helpful and then second just big picture you know if my math is correct pipe was barely 50 percent of sales in the quarter 50.1 is what I got.
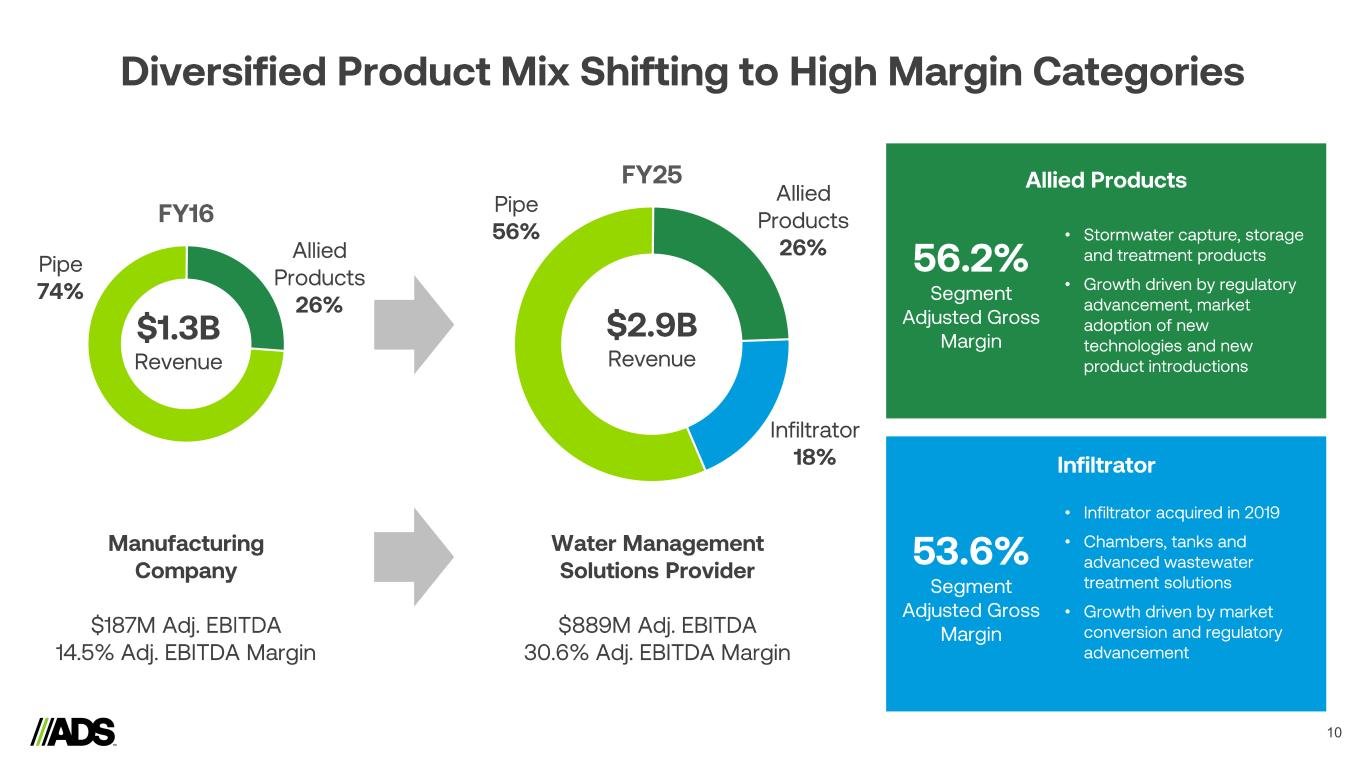
So kind of heading towards this milestone where Pipe actually becomes less than half of the company, which is pretty amazing when we remember the days when it was 90-10 Pipe and Allied Products. So what's the long-term vision? Should we expect Pipe to just continue to be declining in the mix over two, three, four years, and at some point it's a third or a quarter of the company, or do we kind of stabilize and we should think about that 50-50 kind of being where the company wants to be longer term?
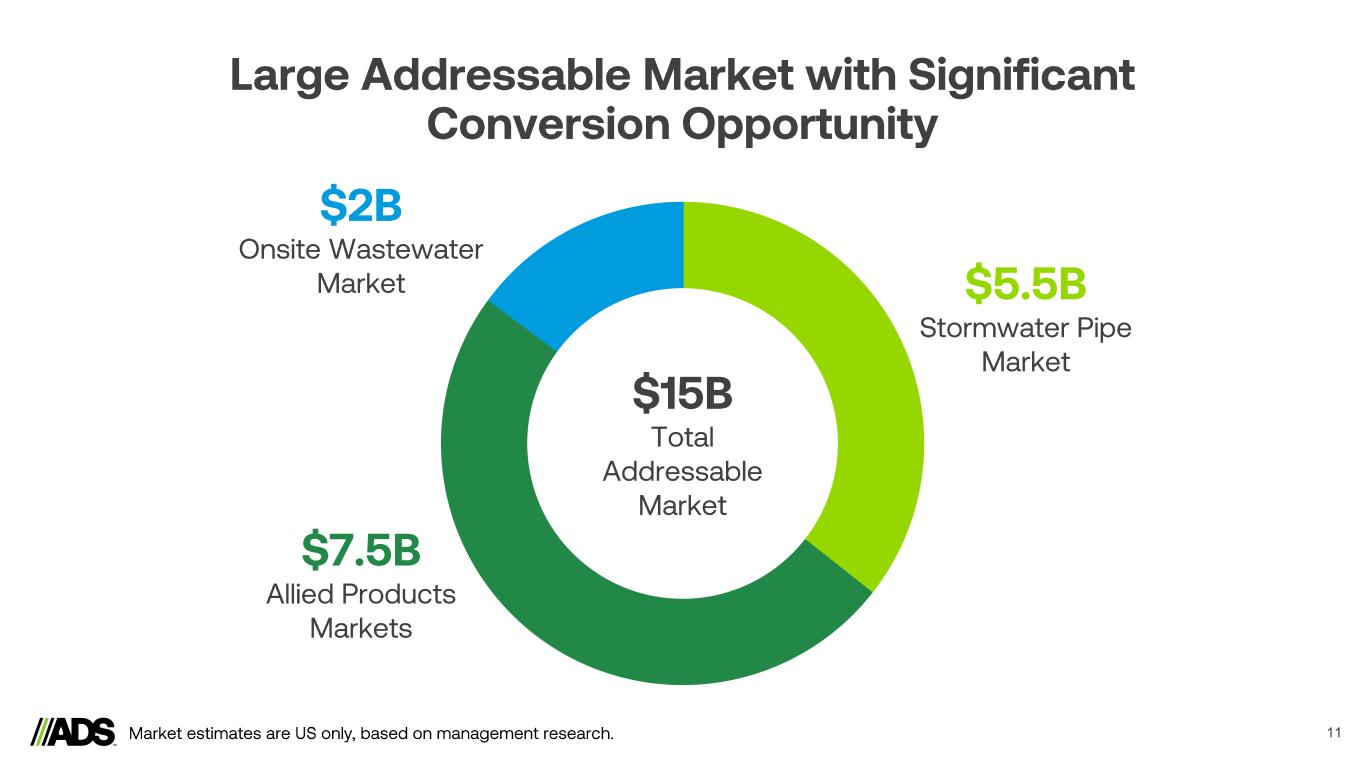
Yeah. So again, another good question. I don't see it being a quarter or a third of the business for sure. I see it kind of bouncing around. It's 50-50. And I always kind of come back to our long-term strategies to grow the infiltrator business and the allied products business faster than the pipe business because we believe we are less penetrated in particularly in the allied products than the pipe so we therefore have more kind of open space and growth opportunities so we will continue to work that whether it goes you know to 40 percent at some point i would see that being the kind of the low the low the low watermark of it but we do we do think it's very important for us as a company to grow our higher margin product lines faster than the company average to create positive mix for the company. So that's kind of core to my strategy for the company.
Got it. Very helpful. Best of luck. Thanks for your time.
Operator
At this time, there are no further questions. I will now hand the call back over to our presenters for any closing remarks.
We appreciate all the questions today and the participation in the call. We feel good about the quarter. We feel good about how we're executing. I'll just reiterate, we're worried about demand, and I don't think it's things that we're doing. I think it's just the environment that we're in. But we also know we have the right, you know, long-term trends and long-term water positioning for our on-site septic business, our wastewater business through Infiltrator, our allied products and pipe business through ADS. So, we like the hand we're dealt. We see good needs from the cashbacks and opportunities of the cash. So, we continue to be very focused on that as a management team and our board. um that said we appreciate it thank you we look forward to to the follow-up calls and seeing you all around this concludes today's call thank you for joining you may now disconnect your lines