8-K
Advantage Solutions Inc. (ADV)
UNITED STATESSECURITIES AND EXCHANGE COMMISSIONWASHINGTON, D.C. 20549
FORM 8-K
CURRENT REPORT
Pursuant to Section 13 or 15(d) of the Securities Exchange Act of 1934
| Date of Report (Date of earliest event reported): November 6, 2025 |
|---|
Advantage Solutions Inc.
(Exact name of Registrant as Specified in Its Charter)
| Delaware | 001-38990 | 83-4629508 |
|---|---|---|
| (State or Other Jurisdiction<br>of Incorporation) | (Commission File Number) | (IRS Employer<br>Identification No.) |
| 7676 Forsyth Boulevard, Fifth Floor | ||
| St. Louis, Missouri | 63105 | |
| (Address of Principal Executive Offices) | (Zip Code) | |
| Registrant’s Telephone Number, Including Area Code: (314) 655-9333 | ||
| --- | ||
| 8001 Forsyth Boulevard, Suite 1025<br><br>Clayton, Missouri | ||
| --- |
(Former Name or Former Address, if Changed Since Last Report)
Check the appropriate box below if the Form 8-K filing is intended to simultaneously satisfy the filing obligation of the registrant under any of the following provisions (see General Instruction A.2. below):
☐ Written communications pursuant to Rule 425 under the Securities Act (17 CFR 230.425)
☐ Soliciting material pursuant to Rule 14a-12 under the Exchange Act (17 CFR 240.14a-12)
☐ Pre-commencement communications pursuant to Rule 14d-2(b) under the Exchange Act (17 CFR 240.14d-2(b))
☐ Pre-commencement communications pursuant to Rule 13e-4(c) under the Exchange Act (17 CFR 240.13e-4(c))
Securities registered pursuant to Section 12(b) of the Act:
| Title of each class | Trading<br>Symbol(s) | Name of each exchange on which registered |
|---|---|---|
| Class A common stock, $0.0001 par value per share | ADV | NASDAQ Global Select Market |
Indicate by check mark whether the registrant is an emerging growth company as defined in Rule 405 of the Securities Act of 1933 (§ 230.405 of this chapter) or Rule 12b-2 of the Securities Exchange Act of 1934 (§ 240.12b-2 of this chapter).
Emerging growth company ☐
If an emerging growth company, indicate by check mark if the registrant has elected not to use the extended transition period for complying with any new or revised financial accounting standards provided pursuant to Section 13(a) of the Exchange Act. ☐
Item 2.02 – Results of Operations and Financial Condition.
On November 6, 2025, Advantage Solutions Inc. (the “Company”) issued a press release announcing its financial results for the three months ended September 30, 2025. A copy of the press release is attached as Exhibit 99.1 to this Current Report on Form 8-K and is incorporated by reference herein.
On November 6, 2025, at 8:30 a.m. ET, the Company will host a conference call announcing its financial results for the three months ended September 30, 2025. A copy of management’s earnings presentation materials is attached as Exhibit 99.2 to this Current Report on Form 8-K and is incorporated by reference herein. The presentation will be accessible on the Investor Relations section of the Company’s website at https://ir.youradv.com/.
The Company makes reference to non-GAAP financial information in the press release and earnings presentation materials. The Company’s non-GAAP financial measures should be viewed in addition to and not as a substitute for or superior to the Company’s reported results prepared in accordance with GAAP. Reconciliation of these non-GAAP financial measures to the nearest comparable GAAP financial measures are contained in the data tables at the end of the press release and earnings presentation materials.The information in this Item 2.02, including Exhibits 99.1 and 99.2 furnished under Item 9.01, shall not be deemed to be “filed” for purposes of Section 18 of the Securities Exchange Act of 1934 (the “Exchange Act”) or otherwise subject to the liabilities of that section. Furthermore, the information in this Item 2.02, including Exhibit 99.1 and 99.2 furnished under Item 9.01, shall not be deemed incorporated by reference into the filings of the Company under the Securities Act of 1933 or the Exchange Act.
Item 9.01 Financial Statements and Exhibits.
(d) Exhibits
| Exhibit No. | Description |
|---|---|
| 99.1 | Press Release issued by Advantage Solutions Inc., dated November 6, 2025 regarding results for the third quarter ended September 30, 2025. |
| 99.2 | Management’s Earnings Presentation for Advantage Solutions Inc., dated November 6, 2025. |
| 104 | Cover Page Interactive Data File (embedded within the Inline XBRL document). |
SIGNATURES
Pursuant to the requirements of the Securities Exchange Act of 1934, the registrant has duly caused this report to be signed on its behalf by the undersigned thereunto duly authorized.
| Date: | November 6, 2025 | ADVANTAGE SOLUTIONS INC. | |
|---|---|---|---|
| By: | /s/ Christopher Growe | ||
| Christopher Growe <br>Chief Financial Officer |
EX-99.1
Financial Results
3rd Quarter 2025

Advantage Solutions Reports Third Quarter 2025 Results
Strong Revenues and Adjusted EBITDA growth in Experiential Services partially offsetting softness in Branded Services
Generated $98 million in adjusted unlevered free cash flow and ended the quarter with strong cash position of $201 million
Rapidly responded to robust demand in high-volume labor businesses generating strong incremental margin
Reaffirm Revenue and modestly lower Adjusted EBITDA outlook due to impact of divestiture and macro environment
ST. LOUIS, November 6, 2025 – Advantage Solutions Inc. (NASDAQ: ADV) (“Advantage,” “Advantage Solutions,” the “Company,” “we,” or “our”), a leading business solutions provider to consumer goods manufacturers and retailers, today reported financial results for the three months ended September 30, 2025.
Unless otherwise noted, results presented in this release are from continuing operations, and comparisons are on a prior year basis. Revenues for the three months ended September 30, 2025 were $915 million compared with $939 million, and net income was $21 million compared with a net loss of $37 million.
| Q3'25 Financial Highlights | |
|---|---|
| Revenues declined 2.6% to $915 million. Adjusted EBITDA declined 1.4% to $100 million. EBITDA margin expanded 20bps in the quarter. | |
| Experiential Services delivered a very strong quarter with accelerating demand and >90% execution, while Branded Services faced ongoing macro headwinds and Retailer Services was impacted mainly by project timing. | |
| Cash increased $98 million sequentially, due to working capital improvements, lower restructuring/reorganization costs, and the benefit from the monetization of our 7.5% stake in Acxion Foodservice. |
“Our third-quarter performance reflects the team’s continued focus and ability to pull levers in our high-volume labor businesses despite the volatile macro environment,” said Advantage CEO Dave Peacock. “We’re pleased with this quarter’s progress, highlighted by strong Experiential performance driven by solid demand and execution. Phase one of our IT transformation is already improving efficiency in our business, while early Instacart pilot success shows the power of integrating in-store audits with our retail execution network. As we close the year, we are reaffirming our revenue guidance and modestly lowering our Adjusted EBITDA outlook to reflect the impact of the Acxion divestiture and the challenging macro environment.”
| Consolidated Financial Summary from Continuing Operations | ||||||
|---|---|---|---|---|---|---|
| (amounts in thousands) | Three Months Ended September 30, | Change (Reported) | ||||
| 2025 | 2024 | % | ||||
| Total Revenues | $ | 915,012 | $ | 939,270 | (2.6%) | |
| Total Net Income (Loss) | $ | 20,565 | $ | (37,320) | NMF | |
| Total Adjusted EBITDA | $ | 99,554 | $ | 100,920 | (1.4%) | |
| Adjusted EBITDA Margin | 10.9% | 10.7% | ||||
| Nine Months Ended September 30, | Change (Reported) | |||||
| 2025 | 2024 | % | ||||
| Total Revenues | $ | 2,610,511 | $ | 2,674,039 | (2.4%) | |
| Total Net Loss | $ | (66,005) | $ | (200,469) | (67.1%) | |
| Total Adjusted EBITDA | $ | 244,142 | $ | 261,458 | (6.6%) | |
| Adjusted EBITDA Margin | 9.4% | 9.8% |
All values are in US Dollars.
Advantage Solutions Inc. | Page 1
Financial Results
3rd Quarter 2025

| Segment Financial Summary from Continuing Operations | ||||||||||
|---|---|---|---|---|---|---|---|---|---|---|
| Revenues | ||||||||||
| Segment | Three Months Ended September 30, | Nine Months Ended September 30, | ||||||||
| (amounts in thousands) | 2025 | 2024 | YoY (Reported) | 2025 | 2024 | YoY (Reported) | ||||
| Branded Services | $ | 288,804 | $ | 331,357 | (12.8%) | $ | 873,866 | $ | 982,752 | (11.1%) |
| Experiential Services | $ | 377,707 | $ | 342,731 | 10.2% | $ | 1,039,433 | $ | 969,590 | 7.2% |
| Retailer Services | $ | 248,501 | $ | 265,182 | (6.3%) | $ | 697,212 | $ | 721,697 | (3.4%) |
| Total | $ | 915,012 | $ | 939,270 | (2.6%) | $ | 2,610,511 | $ | 2,674,039 | (2.4%) |
| Operating (Loss) Income | ||||||||||
| Three Months Ended September 30, | Nine Months Ended September 30, | |||||||||
| Segment | 2025 | 2024 | YoY (Reported) | 2025 | 2024 | YoY (Reported) | ||||
| Branded Services | $ | 8,196 | $ | (12,210) | 167.1% | $ | (17,666) | $ | (141,608) | 87.5% |
| Experiential Services | $ | 20,912 | $ | 587 | 3462.5% | $ | 28,267 | $ | 3,398 | 731.9% |
| Retailer Services | $ | 11,052 | $ | 8,446 | 30.9% | $ | 24,949 | $ | 13,824 | 80.5% |
| Total | $ | 40,160 | $ | (3,177) | 1364.1% | $ | 35,550 | $ | (124,386) | NMF |
| Adjusted EBITDA | ||||||||||
| Three Months Ended September 30, | Nine Months Ended September 30, | |||||||||
| Segment | 2025 | 2024 | YoY (Reported) | 2025 | 2024 | YoY (Reported) | ||||
| Branded Services | $ | 41,657 | $ | 48,796 | (14.6%) | $ | 103,638 | $ | 125,986 | (17.7%) |
| Experiential Services | $ | 35,320 | $ | 23,299 | 51.6% | $ | 73,276 | $ | 62,603 | 17.0% |
| Retailer Services | $ | 22,577 | $ | 28,825 | (21.7%) | $ | 67,228 | $ | 72,869 | (7.7%) |
| Total | $ | 99,554 | $ | 100,920 | (1.4%) | $ | 244,142 | $ | 261,458 | (6.6%) |
Q3'25 Segment Highlights
| Branded Services | Experiential Services | Retailer Services | |||
|---|---|---|---|---|---|
![]() |
Macro pressure resulted in continued softness for commission-based and omni-commerce revenues | ![]() |
Strong performance driven by healthy event demand, up 7% on an underlying basis, improved retention, and >90% execution rates | ![]() |
A tough comparison and project timing weighed on results versus the prior year quarter |
![]() |
Investing to strengthen value proposition, advance key relationships, and drive better consistency in execution | ![]() |
Higher staffing supported a 7% sequential increase in events, resulting in solid revenue growth and strong incremental margins versus the prior year quarter | ![]() |
Staffing and execution improved through the period, strengthening coverage |
![]() |
Expect continued pressure near term; entering Q4 with larger pipeline of new business opportunities | ![]() |
Expect a stronger Q4 with increased event frequency at key customers | ![]() |
Stronger staffing levels should support incremental project work in Q4 supporting revenue growth |
Advantage Solutions Inc. | Page 2
Financial Results
3rd Quarter 2025

Cash Flow and Balance Sheet Highlights
(Amounts in Millions)
| Period Ended<br><br>September 30, 2025 | |
|---|---|
| Adjusted Unlevered Free Cash Flow and as % of Adjusted EBITDA | $98 / 99% |
| Capex | ~$11 |
| Gross Debt | ~$1,691 |
| Cash and Cash Equivalents | ~$201 |
| Net Leverage Ratio(1) | 4.4x |
Fiscal Year 2025 Outlook (Amounts in Millions)
| Revenues | Down Low-Single Digits to Flat |
|---|---|
| Adjusted EBITDA | Down Mid-Single Digits |
| Adjusted Unlevered Free Cash Flow Conversion(1) | >50% of Adjusted EBITDA |
| Net Interest Expense | $140 to $150 |
| Capex | $45 to $55 |
2025 revenue outlook excludes reimbursable expenses. 2025 guidance compares to 2024 on a continuing operations basis.
| Conference Call Details | |
|---|---|
| Date/Time | November 6, 2025, 8:30 am EDT |
| Dial-in<br><br>(10 minutes before the call) | 800-715-9871 within the United States or +1-646-307-1963 outside the United States<br><br>Conference ID: 5720569 |
| Webcast | Available at: ADV 3Q 2025 Earnings Webcast |
| Replay | 800-770-2030 within the United States or +1-609-800-9909 outside the United States<br><br>Playback ID: 5720569# |
Investor Contact: investorrelations@youradv.com
Media Contact: press@youradv.com
NMF = Not Meaningful (1) Trailing twelve months on a continuing and discontinued operations basis
Advantage Solutions Inc. | Page 3
Financial Results
3rd Quarter 2025

About Advantage Solutions
Advantage Solutions is the leading omnichannel retail solutions agency in North America, uniquely positioned at the intersection of consumer-packaged goods (CPG) brands and retailers. With its data- and technology-powered services, Advantage leverages its unparalleled insights, expertise and scale to help brands and retailers of all sizes generate demand and get products into the hands of consumers, wherever they shop. Whether it’s creating meaningful moments and experiences in-store and online, optimizing assortment and merchandising, or accelerating e-commerce and digital capabilities, Advantage is the trusted partner that keeps commerce and life moving. Advantage has offices throughout North America and strategic investments and owned operations in select international markets. For more information, please visit YourADV.com.
Included with this press release are the Company’s consolidated and condensed financial statements as of and for the three and nine months ended September 30, 2025. These financial statements should be read in conjunction with the information contained in the Company’s Annual Report on Form 10-K filed with the Securities and Exchange Commission (the "SEC") on March 7, 2025.
Forward-Looking Statements
Certain statements in this press release may be considered forward-looking statements within the meaning of the federal securities laws, including statements regarding the expected future performance of Advantage's business and projected financial results. Forward-looking statements generally relate to future events or Advantage’s future financial or operating performance. These forward-looking statements generally are identified by the words “may”, “should”, “expect”, “intend”, “will”, “would”, “could”, “estimate”, “anticipate”, “believe”, “predict”, “confident”, “potential” or “continue”, or the negatives of these terms or variations of them or similar terminology. Such forward-looking statements are predictions, projections and other statements about future events that are based on current expectations and assumptions and, as a result, are subject to risks, uncertainties and other factors which could cause actual results to differ materially from those expressed or implied by such forward looking statements.
These forward-looking statements are based upon estimates and assumptions that, while considered reasonable by Advantage and its management at the time of such statements, are inherently uncertain. Factors that may cause actual results to differ materially from current expectations include, but are not limited to, market-driven wage changes or changes to labor laws or wage or job classification regulations, including minimum wage; future potential pandemics or health epidemics; Advantage’s ability to continue to generate significant operating cash flow; client procurement strategies and consolidation of Advantage’s clients’ industries creating pressure on the nature and pricing of its services; consumer goods manufacturers and retailers reviewing and changing their sales, retail, marketing and technology programs and relationships; Advantage’s ability to successfully develop and maintain relevant omni-channel services for our clients in an evolving industry and to otherwise adapt to significant technological change; Advantage’s ability to maintain proper and effective internal control over financial reporting in the future; Advantage’s substantial indebtedness and our ability to refinance at favorable rates; and other risks and uncertainties set forth in the section titled “Risk Factors” in the Annual Report on Form 10-K filed by the Company with the SEC on March 7, 2025, and in its other filings made from time to time with the SEC. These filings identify and address other important risks and uncertainties that could cause actual events and results to differ materially from those contained in the forward-looking statements. Forward-looking statements speak only as of the date they are made. Readers are cautioned not to put undue reliance on forward-looking statements, and Advantage assumes no obligation and does not intend to update or revise these forward-looking statements, whether as a result of new information, future events or otherwise, except as required by law.
Advantage Solutions Inc. | Page 4
Financial Results
3rd Quarter 2025

Non-GAAP Financial Measures and Related Information
This press release includes certain financial measures not presented in accordance with generally accepted accounting principles (“GAAP”), including Adjusted EBITDA from Continuing Operations, Adjusted EBITDA from Discontinued Operations, Adjusted EBITDA by Segment, Adjusted Unlevered Free Cash Flow and Net Debt. These are not measures of financial performance calculated in accordance with GAAP and may exclude items that are significant in understanding and assessing Advantage’s financial results. Therefore, the measures are in addition to, and not a substitute for or superior to, measures of financial performance prepared in accordance with GAAP, and should not be considered in isolation or as an alternative to net income, cash flows from operations or other measures of profitability, liquidity or performance under GAAP. You should be aware that Advantage’s presentation of these measures may not be comparable to similarly titled measures used by other companies. Reconciliations of historical non-GAAP measures to their most directly comparable GAAP counterparts are included below.
Advantage believes these non-GAAP measures provide useful information to management and investors regarding certain financial and business trends relating to Advantage’s financial condition and results of operations. Advantage believes that the use of Adjusted EBITDA from Continuing Operations, Adjusted EBITDA from Discontinued Operations, Adjusted EBITDA by Segment, Adjusted Unlevered Free Cash Flow, and Net Debt provide an additional tool for investors to use in evaluating ongoing operating results and trends and in comparing Advantage’s financial measures with other similar companies, many of which present similar non-GAAP financial measures to investors. Non-GAAP financial measures are subject to inherent limitations as they reflect the exercise of judgments by management about which expense and income are excluded or included in determining these non-GAAP financial measures. Additionally, other companies may calculate non-GAAP measures differently, or may use other measures to calculate their financial performance, and therefore Advantage’s non-GAAP measures may not be directly comparable to similarly titled measures of other companies.
Adjusted EBITDA from Continuing Operations, Adjusted EBITDA from Discontinued Operations and Adjusted EBITDA by Segment are supplemental non-GAAP financial measures of our operating performance. Adjusted EBITDA from Continuing Operations and Adjusted EBITDA from Discontinued Operations mean net (loss) income before (i) interest expense (net), (ii) provision for (benefit from) income taxes, (iii) depreciation, (iv) amortization of intangible assets, (v) impairment of goodwill, (vi) changes in fair value of warrant liability, (vii) stock based compensation expense, (viii) equity-based compensation of Karman Topco L.P., (ix) fair value adjustments of contingent consideration related to acquisitions, (x) acquisition and divestiture related expenses, (xi) (gain) loss on divestitures, (xii) restructuring expenses, (xiii) reorganization expenses, (xiv) litigation expenses (recovery), (xv) COVID-19 benefits received, (xvi) costs associated with (recovery from) the Take 5 Matter, (xvii) EBITDA for economic interests in investments and (xviii) other adjustments that management believes are helpful in evaluating our operating performance.
Adjusted EBITDA by Segment means, with respect to each segment, operating income (loss) from continuing operations before (i) depreciation, (ii) amortization of intangible assets, (iii) impairment of goodwill, (iv) stock based compensation expense, (v) equity-based compensation of Karman Topco L.P., (vi) fair value adjustments of contingent consideration related to acquisitions, (vii) acquisition and divestiture related expenses, (viii) restructuring expenses, (ix) reorganization expenses, (x) litigation expenses (recovery), (xi) COVID-19 benefits received, (xii) costs associated with (recovery from) the Take 5 Matter, (xiii) EBITDA for economic interests in investments and (xiv) other adjustments that management believes are helpful in evaluating our operating performance, in each case, attributable to such segment.
Adjusted EBITDA Margin means Adjusted EBITDA from Continuing Operations divided by total revenues.
Adjusted Unlevered Free Cash Flow represents net cash provided by (used in) operating activities from continuing and discontinued operations less purchase of property and equipment as disclosed in the Statements of Cash Flows further adjusted by (i) cash payments for interest, (ii) cash received from interest rate derivatives, (iii) cash paid for income taxes; (iv) cash paid for acquisition and divestiture related expenses, (v) cash paid for restructuring expenses, (vi) cash paid for reorganization expenses, (vii) cash paid for contingent earnout payments included in operating cash flow, (viii) COVID-19 benefits received, (ix) cash paid for costs associated with (recovery from) the Take 5 Matter, (x) net effect of foreign currency fluctuations on cash, and (xi) other adjustments that management believes are helpful in evaluating our operating performance. Adjusted Unlevered Free Cash Flow as a percentage of Adjusted EBITDA means Adjusted Unlevered Free Cash Flow divided by Adjusted EBITDA from Continuing Operations and Adjusted EBITDA from Discontinued Operations.
Advantage Solutions Inc. | Page 5
Financial Results
3rd Quarter 2025

Net Debt represents the sum of current portion of long-term debt and long-term debt, less cash and cash equivalents and debt issuance costs. With respect to Net Debt, cash and cash equivalents are subtracted from the GAAP measure, total debt, because they could be used to reduce the debt obligations. We present Net Debt because we believe this non-GAAP measure provides useful information to management and investors regarding certain financial and business trends relating to the Company’s financial condition and to evaluate changes to the Company's capital structure and credit quality assessment.
Advantage Solutions Inc.
Condensed Consolidated Statements of Operations
(Unaudited)
| Three Months Ended September 30, | Nine Months Ended September 30, | |||||||||||
|---|---|---|---|---|---|---|---|---|---|---|---|---|
| (in thousands, except share and per share data) | 2025 | 2024 | 2025 | 2024 | ||||||||
| Revenues | $ | 915,012 | $ | 939,270 | $ | 2,610,511 | $ | 2,674,039 | ||||
| Cost of revenues (exclusive of depreciation and amortization shown separately below) | 776,421 | 794,958 | 2,246,107 | 2,298,139 | ||||||||
| Selling, general, and administrative expenses | 57,568 | 98,438 | 191,090 | 250,377 | ||||||||
| Impairment of goodwill | — | — | — | 99,670 | ||||||||
| Depreciation and amortization | 50,743 | 51,866 | 151,802 | 152,931 | ||||||||
| Income from equity method investments | (1,408 | ) | (2,815 | ) | (5,566 | ) | (2,692 | ) | ||||
| Gain on divestiture | (8,472 | ) | — | (8,472 | ) | — | ||||||
| Total operating expenses | 874,852 | 942,447 | 2,574,961 | 2,798,425 | ||||||||
| Operating income (loss) from continuing operations | 40,160 | (3,177 | ) | 35,550 | (124,386 | ) | ||||||
| Other expenses (income): | ||||||||||||
| Change in fair value of warrant liabilities | (109 | ) | 40 | (83 | ) | (359 | ) | |||||
| Interest expense, net | 34,954 | 38,969 | 105,128 | 114,484 | ||||||||
| Total other expenses, net | 34,845 | 39,009 | 105,045 | 114,125 | ||||||||
| Income (loss) from continuing operations before benefit from income taxes | 5,315 | (42,186 | ) | (69,495 | ) | (238,511 | ) | |||||
| Benefit from income taxes from continuing operations | (15,250 | ) | (4,866 | ) | (3,490 | ) | (38,042 | ) | ||||
| Net income (loss) from continuing operations | 20,565 | (37,320 | ) | (66,005 | ) | (200,469 | ) | |||||
| Net (loss) income from discontinued operations, net of tax | — | (5,456 | ) | — | 53,743 | |||||||
| Net income (loss) | $ | 20,565 | $ | (42,776 | ) | $ | (66,005 | ) | $ | (146,726 | ) | |
| Less: net income from discontinued operations attributable to noncontrolling interest, net of tax | — | — | — | 2,192 | ||||||||
| Net income (loss) attributable to stockholders of Advantage Solutions Inc. | $ | 20,565 | $ | (42,776 | ) | $ | (66,005 | ) | $ | (148,918 | ) | |
| Net income (loss) per common share: | ||||||||||||
| Basic income (loss) per common share from continuing operations attributable to stockholders of Advantage Solutions Inc. | $ | 0.06 | $ | (0.12 | ) | $ | (0.20 | ) | $ | (0.62 | ) | |
| Basic (loss) income per common share from discontinued operations attributable to stockholders of Advantage Solutions Inc. | $ | — | $ | (0.02 | ) | $ | — | $ | 0.17 | |||
| Diluted net income (loss) per share: | ||||||||||||
| Diluted income (loss) per common share from continuing operations attributable to stockholders of Advantage Solutions Inc. | $ | 0.06 | $ | (0.12 | ) | $ | (0.20 | ) | $ | (0.62 | ) | |
| Diluted (loss) income per common share from discontinued operations attributable to stockholders of Advantage Solutions Inc. | $ | — | $ | (0.02 | ) | $ | — | $ | 0.17 | |||
| Weighted-average number of common shares: | ||||||||||||
| Basic | 325,921,176 | 321,080,571 | 323,988,621 | 321,774,115 | ||||||||
| Diluted | 339,847,197 | 321,080,571 | 323,988,621 | 321,774,115 |
Advantage Solutions Inc. | Page 6
Financial Results
3rd Quarter 2025

Advantage Solutions Inc.
Condensed Consolidated Balance Sheet
(Unaudited)
| (in thousands, except share data) | December 31, 2024 | ||||
|---|---|---|---|---|---|
| ASSETS | |||||
| Current assets | |||||
| Cash and cash equivalents | 201,137 | $ | 205,233 | ||
| Restricted cash | 12,111 | 15,518 | |||
| Accounts receivable, net of allowance for expected credit losses of 16,811 and 13,047, respectively | 635,353 | 603,069 | |||
| Prepaid expenses and other current assets | 95,279 | 86,918 | |||
| Total current assets | 943,880 | 910,738 | |||
| Property and equipment, net | 100,809 | 97,763 | |||
| Goodwill | 477,021 | 477,021 | |||
| Other intangible assets, net | 1,203,881 | 1,332,578 | |||
| Investments in unconsolidated affiliates | 232,382 | 226,510 | |||
| Other assets | 35,549 | 61,907 | |||
| Total assets | 2,993,522 | $ | 3,106,517 | ||
| LIABILITIES AND STOCKHOLDERS' EQUITY | |||||
| Current liabilities | |||||
| Current portion of long-term debt | 13,250 | $ | 13,250 | ||
| Accounts payable | 167,222 | 158,485 | |||
| Accrued compensation and benefits | 98,785 | 129,486 | |||
| Other accrued expenses | 119,798 | 134,677 | |||
| Deferred revenues | 29,828 | 24,164 | |||
| Total current liabilities | 428,883 | 460,062 | |||
| Long-term debt, net of current portion | 1,662,158 | 1,686,690 | |||
| Deferred income tax liabilities | 137,287 | 146,889 | |||
| Other long-term liabilities | 56,695 | 64,141 | |||
| Total liabilities | 2,285,023 | 2,357,782 | |||
| Commitments and contingencies (Note 9) | |||||
| Equity attributable to stockholders of Advantage Solutions Inc. | |||||
| Common stock, 0.0001 par value, 3,290,000,000 shares authorized; 325,964,565 and 320,773,096 shares issued and outstanding as of September 30, 2025 and December 31, 2024, respectively | 33 | 32 | |||
| Additional paid in capital | 3,482,842 | 3,466,221 | |||
| Accumulated deficit | (2,707,617 | ) | (2,641,612 | ) | |
| Loans to Karman Topco L.P. | (7,512 | ) | (7,029 | ) | |
| Accumulated other comprehensive loss | (5,362 | ) | (15,861 | ) | |
| Treasury stock, at cost; 12,894,517 and 12,400,075 shares as of September 30, 2025 and December 31, 2024, respectively | (53,885 | ) | (53,016 | ) | |
| Total stockholders' equity | 708,499 | 748,735 | |||
| Total liabilities and stockholders' equity | 2,993,522 | $ | 3,106,517 |
All values are in US Dollars.
Advantage Solutions Inc. | Page 7
Financial Results
3rd Quarter 2025

Advantage Solutions Inc.
Condensed Consolidated Statements of Cash Flows
(Unaudited)
| Nine Months Ended September 30, | ||||||
|---|---|---|---|---|---|---|
| (in thousands) | 2025 | 2024 | ||||
| CASH FLOWS FROM OPERATING ACTIVITIES | ||||||
| Net loss from continuing operations | $ | (66,005 | ) | $ | (200,469 | ) |
| Adjustments to reconcile net loss to net cash provided by operating activities | ||||||
| Non-cash mark-to-market adjustments on derivatives and non-cash interest expense | (2,131 | ) | 1,664 | |||
| Deferred financing fees related to repricing of long-term debt | — | 1,079 | ||||
| Amortization of deferred financing fees | 5,272 | 5,137 | ||||
| Impairment of goodwill | — | 99,670 | ||||
| Depreciation and amortization | 151,802 | 152,931 | ||||
| Change in fair value of warrant liability | (83 | ) | (359 | ) | ||
| Fair value adjustments related to contingent consideration | — | 1,678 | ||||
| Deferred income taxes | (9,757 | ) | (16,241 | ) | ||
| Equity-based compensation of Karman Topco L.P. | (1,524 | ) | (658 | ) | ||
| Stock-based compensation | 20,483 | 24,224 | ||||
| Income from equity method investments | (5,566 | ) | (2,692 | ) | ||
| Distribution received from equity method investments | — | 3,289 | ||||
| Gain on divestiture | (8,472 | ) | — | |||
| Gain on repurchases of Senior Secured Notes and Term Loan Facility debt | (1,624 | ) | (9,141 | ) | ||
| Loss on disposal of property and equipment | 325 | 775 | ||||
| Changes in operating assets and liabilities, net of effects from divestitures: | ||||||
| Accounts receivable, net | (30,077 | ) | (9,550 | ) | ||
| Prepaid expenses and other assets | (1,901 | ) | 30,567 | |||
| Accounts payable | 10,160 | 25,435 | ||||
| Accrued compensation and benefits | (32,860 | ) | (43,849 | ) | ||
| Deferred revenues | 6,239 | 2,992 | ||||
| Other accrued expenses and other liabilities | (18,379 | ) | 11,527 | |||
| Net cash provided by operating activities | 15,902 | 78,009 | ||||
| CASH FLOWS FROM INVESTING ACTIVITIES | ||||||
| Purchase of investments in unconsolidated affiliates | (3,623 | ) | (13,932 | ) | ||
| Purchase of property and equipment | (28,662 | ) | (50,358 | ) | ||
| Proceeds from divestitures, net of cash received | 18,612 | 275,717 | ||||
| Net cash (used in) provided by investing activities | (13,673 | ) | 211,427 | |||
| CASH FLOWS FROM FINANCING ACTIVITIES | ||||||
| Borrowings under lines of credit | 90,000 | — | ||||
| Payments on lines of credit | (90,000 | ) | — | |||
| Principal payments on long-term debt | (9,938 | ) | (9,938 | ) | ||
| Repurchases of Senior Secured Notes and Term Loan Facility debt | (18,243 | ) | (147,122 | ) | ||
| Debt issuance costs | — | (971 | ) | |||
| Deferred consideration paid for purchases in unconsolidated affiliates | (1,500 | ) | — | |||
| Deferred proceeds received from sale of Jun Group and contingent consideration payments | 22,500 | (5,655 | ) | |||
| Proceeds from issuance of common stock | 1,838 | 2,294 | ||||
| Payments for taxes related to net share settlement under 2020 Incentive Award Plan | (3,698 | ) | (11,663 | ) | ||
| Purchase of treasury stock | (869 | ) | (34,067 | ) | ||
| Net cash used in financing activities | (9,910 | ) | (207,122 | ) | ||
| Net effect of foreign currency changes on cash, cash equivalents and restricted cash | 178 | (1,405 | ) | |||
| Net change in cash, cash equivalents and restricted cash | (7,503 | ) | 80,909 | |||
| Cash, cash equivalents and restricted cash, beginning of period | 220,751 | 131,560 | ||||
| Cash, cash equivalents and restricted cash, end of period | $ | 213,248 | $ | 212,469 |
Advantage Solutions Inc. | Page 8
Financial Results
3rd Quarter 2025

Advantage Solutions Inc.
Reconciliation of Net Loss from Continuing Operations to Adjusted EBITDA
(Unaudited)
| Continuing Operations | Three Months Ended September 30, | Nine Months Ended September 30, | ||||||||||
|---|---|---|---|---|---|---|---|---|---|---|---|---|
| (in thousands) | 2025 | 2024 | 2025 | 2024 | ||||||||
| Net income (loss) from continuing operations | $ | 20,565 | $ | (37,320 | ) | $ | (66,005 | ) | $ | (200,469 | ) | |
| Add: | ||||||||||||
| Interest expense, net | 34,954 | 38,969 | 105,128 | 114,484 | ||||||||
| Benefit from income taxes from continuing operations | (15,250 | ) | (4,866 | ) | (3,490 | ) | (38,042 | ) | ||||
| Depreciation and amortization | 50,743 | 51,866 | 151,802 | 152,931 | ||||||||
| Impairment of goodwill | — | — | — | 99,670 | ||||||||
| Gain on divestiture | (8,472 | ) | — | (8,472 | ) | — | ||||||
| Changes in fair value of warrant liability | (109 | ) | 40 | (83 | ) | (359 | ) | |||||
| Stock-based compensation expense (a) | 7,415 | 8,143 | 20,483 | 24,224 | ||||||||
| Equity-based compensation of Karman Topco L.P. (b) | — | (178 | ) | (1,524 | ) | (658 | ) | |||||
| Fair value adjustments related to contingent consideration (c) | — | — | — | 1,678 | ||||||||
| Acquisition and divestiture related expenses (d) | 251 | 127 | 731 | (1,207 | ) | |||||||
| Restructuring expenses (e) | — | 24,118 | 931 | 24,118 | ||||||||
| Reorganization expenses (f) | 9,775 | 18,637 | 38,445 | 73,980 | ||||||||
| Litigation expenses (recovery) (g) | 50 | (1,713 | ) | 963 | (2,422 | ) | ||||||
| COVID-19 benefits received (h) | (5,008 | ) | — | (5,723 | ) | — | ||||||
| Costs associated with the Take 5 Matter (i) | 421 | 385 | 985 | 1,081 | ||||||||
| EBITDA for economic interests in investments (j) | 4,219 | 2,712 | 9,971 | 12,449 | ||||||||
| Adjusted EBITDA from Continuing Operations | $ | 99,554 | $ | 100,920 | $ | 244,142 | $ | 261,458 | ||||
| Discontinued Operations | ||||||||||||
| --- | --- | --- | --- | --- | --- | --- | ||||||
| (in thousands) | Three Months Ended September 30, 2024 | Nine Months Ended September 30, 2024 | ||||||||||
| Net income from discontinued operations, net of tax | $ | (5,456 | ) | $ | 53,743 | |||||||
| Add: | ||||||||||||
| Interest expense, net | — | 48 | ||||||||||
| Provision for income taxes from discontinued operations | 29,511 | 41,371 | ||||||||||
| Depreciation and amortization | 204 | 4,695 | ||||||||||
| Gain on divestitures (k) | (25,065 | ) | (95,261 | ) | ||||||||
| Stock-based compensation expense (a) | (1,576 | ) | (2,808 | ) | ||||||||
| Fair value adjustments related to contingent consideration (c) | — | 1,883 | ||||||||||
| Divestiture related expenses (d) | 2,434 | 5,537 | ||||||||||
| Reorganization expenses (f) | 2,250 | 9,535 | ||||||||||
| EBITDA for economic interests in investments (j) | — | (384 | ) | |||||||||
| Adjusted EBITDA from Discontinued Operations | $ | 2,302 | $ | 18,359 |
Advantage Solutions Inc. | Page 9
Financial Results
3rd Quarter 2025

Advantage Solutions Inc.
Reconciliation of Operating Income (Loss) to Adjusted EBITDA by Segment
(Unaudited)
| Branded Services segment | Three Months Ended September 30, | Nine Months Ended September 30, | ||||||||||
|---|---|---|---|---|---|---|---|---|---|---|---|---|
| (in thousands) | 2025 | 2024 | 2025 | 2024 | ||||||||
| Operating income (loss) | $ | 8,196 | $ | (12,210 | ) | $ | (17,666 | ) | $ | (141,608 | ) | |
| Add: | ||||||||||||
| Depreciation and amortization | 31,487 | 33,087 | 94,511 | 97,401 | ||||||||
| Impairment of goodwill | — | — | — | 99,670 | ||||||||
| Gain on divestiture | (8,472 | ) | — | (8,472 | ) | — | ||||||
| Stock-based compensation expense (a) | 3,066 | 1,829 | 7,607 | 8,551 | ||||||||
| Equity-based compensation of Karman Topco L.P. (b) | — | 402 | 375 | 924 | ||||||||
| Fair value adjustments related to contingent consideration (c) | — | — | — | 1,678 | ||||||||
| Acquisition and divestiture related expenses (d) | 73 | 49 | 457 | 153 | ||||||||
| Restructuring expenses (e) | — | 15,392 | 358 | 15,392 | ||||||||
| Reorganization expenses (f) | 4,410 | 6,959 | 17,130 | 29,863 | ||||||||
| Litigation (recovery) expenses (g) | (97 | ) | 191 | 273 | 432 | |||||||
| COVID-19 benefits received (h) | (1,646 | ) | — | (1,891 | ) | — | ||||||
| Costs associated with the Take 5 Matter (i) | 421 | 385 | 985 | 1,081 | ||||||||
| EBITDA for economic interests in investments (j) | 4,219 | 2,712 | 9,971 | 12,449 | ||||||||
| Branded Services segment Adjusted EBITDA | $ | 41,657 | $ | 48,796 | $ | 103,638 | $ | 125,986 | ||||
| Experiential Services segment | Three Months Ended September 30, | Nine Months Ended September 30, | ||||||||||
| --- | --- | --- | --- | --- | --- | --- | --- | --- | --- | --- | --- | --- |
| (in thousands) | 2025 | 2024 | 2025 | 2024 | ||||||||
| Operating income | $ | 20,912 | $ | 587 | $ | 28,267 | $ | 3,398 | ||||
| Add: | ||||||||||||
| Depreciation and amortization | 10,744 | 10,289 | 31,965 | 31,224 | ||||||||
| Stock-based compensation expense (a) | 1,991 | 3,371 | 5,630 | 7,469 | ||||||||
| Equity-based compensation of Karman Topco L.P. (b) | — | (281 | ) | (976 | ) | (783 | ) | |||||
| Acquisition and divestiture related expenses (d) | 86 | 32 | 160 | 37 | ||||||||
| Restructuring expenses (e) | — | 3,430 | 186 | 3,430 | ||||||||
| Reorganization expenses (f) | 3,285 | 5,670 | 9,662 | 17,394 | ||||||||
| Litigation expenses (g) | 123 | 201 | 451 | 434 | ||||||||
| COVID-19 benefits received (h) | (1,821 | ) | — | (2,069 | ) | — | ||||||
| Experiential Services segment Adjusted EBITDA | $ | 35,320 | $ | 23,299 | $ | 73,276 | $ | 62,603 | ||||
| Retailer Services segment | Three Months Ended September 30, | Nine Months Ended September 30, | ||||||||||
| --- | --- | --- | --- | --- | --- | --- | --- | --- | --- | --- | --- | --- |
| (in thousands) | 2025 | 2024 | 2025 | 2024 | ||||||||
| Operating income | $ | 11,052 | $ | 8,446 | $ | 24,949 | $ | 13,824 | ||||
| Add: | ||||||||||||
| Depreciation and amortization | 8,512 | 8,490 | 25,326 | 24,306 | ||||||||
| Stock-based compensation expense (a) | 2,358 | 2,943 | 7,246 | 8,204 | ||||||||
| Equity-based compensation of Karman Topco L.P. (b) | — | (299 | ) | (923 | ) | (799 | ) | |||||
| Acquisition and divestiture related expenses (d) | 92 | 46 | 114 | (1,397 | ) | |||||||
| Restructuring expenses (e) | — | 5,296 | 387 | 5,296 | ||||||||
| Reorganization expenses (f) | 2,080 | 6,008 | 11,653 | 26,723 | ||||||||
| Litigation expenses (recovery) (g) | 24 | (2,105 | ) | 239 | (3,288 | ) | ||||||
| COVID-19 benefits received (h) | (1,541 | ) | — | (1,763 | ) | — | ||||||
| Retailer Services segment Adjusted EBITDA | $ | 22,577 | $ | 28,825 | $ | 67,228 | $ | 72,869 |
Advantage Solutions Inc. | Page 10
Financial Results
3rd Quarter 2025

Advantage Solutions Inc.
Net Debt and Adjusted Unlevered Free Cash Flow Reconciliation
(Unaudited)
| (amounts in thousands) | September 30, 2025 | ||
|---|---|---|---|
| Current portion of long-term debt | $ | 13,250 | |
| Long-term debt, net of current portion | 1,677,895 | ||
| Less: Debt issuance costs | 15,737 | ||
| Total debt | 1,675,408 | ||
| Less: Cash and cash equivalents | 201,137 | ||
| Total Net Debt | $ | 1,474,271 | |
| LTM Adjusted EBITDA from Continuing and Discontinued Operations | $ | 338,698 | |
| Net Debt / LTM Adjusted EBITDA ratio | 4.4x | ||
| (amounts in thousands) | Three Months Ended<br>September 30, 2025 | ||
| --- | --- | --- | --- |
| Net cash provided by operating activities from continuing operations | $ | 63,631 | |
| Less: | |||
| Purchase of property and equipment | (11,443 | ) | |
| Add: | |||
| Cash payments for interest | 26,185 | ||
| Cash payments for income taxes | 2,750 | ||
| Cash paid for acquisition and divestiture related expenses (k) | 120 | ||
| Cash paid for restructuring expenses (l) | 5,482 | ||
| Cash paid for reorganization expenses (m) | 6,970 | ||
| Cash paid for costs associated with the Take 5 Matter (n) | 421 | ||
| Net effect of foreign currency fluctuations on cash | 3,952 | ||
| Adjusted Unlevered Free Cash Flow | $ | 98,068 | |
| Numerator - Adjusted Unlevered Free Cash Flow | $ | 98,068 | |
| Denominator - Adjusted EBITDA from Continuing Operations | $ | 99,554 | |
| Adjusted Unlevered Free Cash Flow as a percentage of Adjusted EBITDA | 98.5 | % |
Advantage Solutions Inc. | Page 11
Financial Results
3rd Quarter 2025

Advantage Solutions Inc.
Reconciliation Net Income (Loss) to Adjusted EBITDA
(Unaudited)
| Continuing and Discontinued Operations | Twelve Months Ended <br>September 30, 2025 | ||
|---|---|---|---|
| (in thousands) | |||
| Net loss | $ | (244,049 | ) |
| Add: | |||
| Interest expense, net | 137,436 | ||
| Provision for income taxes | (28,288 | ) | |
| Depreciation and amortization | 203,424 | ||
| Impairment of goodwill and indefinite-lived asset | 175,500 | ||
| Gain on divestiture | (8,472 | ) | |
| Gain on divestitures(o) | 162 | ||
| Changes in fair value of warrant liability | (308 | ) | |
| Stock-based compensation expense (a) | 27,278 | ||
| Equity-based compensation of Karman Topco L.P. (b) | (143 | ) | |
| Fair value adjustments related to contingent consideration related to acquisitions (c) | — | ||
| Acquisition and divestiture related expenses (d) | 770 | ||
| Restructuring expenses (e) | 6,864 | ||
| Reorganization expenses (f) | 53,265 | ||
| Litigation recoveries (g) | 1,445 | ||
| Costs associated with COVID-19, net of benefits received (h) | (5,723 | ) | |
| Costs associated with the Take 5 Matter (i) | 1,749 | ||
| EBITDA for economic interests in investments (j) | 17,788 | ||
| LTM Adjusted EBITDA from Continuing and Discontinued Operations | $ | 338,698 | |
| (a) | Represents non-cash compensation expense related to performance stock units, restricted stock units, and stock options under the 2020 Advantage Solutions Incentive Award Plan and the Advantage Solutions 2020 Employee Stock Purchase Plan. | ||
| --- | --- | ||
| (b) | Represents expenses related to equity-based compensation expense associated with grants of Common Series D Units of Karman Topco L.P. made to one of our equity sponsors. | ||
| (c) | Represents adjustments to the estimated fair value of our contingent consideration liabilities related to our acquisitions, for the applicable periods. | ||
| (d) | Represents fees and costs associated with activities related to our acquisitions, divestitures, and related activities, including professional fees, due diligence, and integration activities. | ||
| (e) | Restructuring charges including programs designed to integrate and reduce costs intended to further improve efficiencies in operational activities and align cost structures consistent with revenue levels associated with business changes. Restructuring expenses include costs associated with the VERP and employee termination benefits associated with the 2024 RIF and other optimization initiatives. | ||
| (f) | Represents fees and costs associated with various internal reorganization activities, including professional fees, lease exit costs, severance, and nonrecurring compensation costs. | ||
| (g) | Represents legal settlements, reserves, and expenses that are unusual or infrequent costs associated with our operating activities. | ||
| (h) | Represents benefits received from government grants for COVID-19 relief. | ||
| (i) | Represents costs associated with collection activities related to the Take 5 Matter, primarily professional fees and other related costs. | ||
| (j) | Represents additions to reflect our proportional share of Adjusted EBITDA related to our equity method investments and reductions to remove the Adjusted EBITDA related to the minority ownership percentage of the entities that we fully consolidate in our financial statements. | ||
| (k) | Represents gains and losses on disposal of assets related to divestitures and losses on sale of businesses and assets held for sale, less cost to sell. | ||
| (l) | Represents cash paid for restructuring charges including programs designed to integrate and reduce costs intended to further improve efficiencies in operational activities and align cost structures consistent with revenue levels associated with business changes. Restructuring expenses include costs associated with the VERP and employee termination benefits associated with the 2024 RIF and other optimization initiatives. | ||
| (m) | Represents cash paid for fees and costs associated with various reorganization activities, including professional fees, lease exit costs, severance, and nonrecurring compensation costs. | ||
| (n) | Represents cash paid for costs associated with the Take 5 Matter, primarily, professional fees and other related costs. | ||
| (o) | Represents gains and losses on disposal of assets related to divestitures and losses on sale of businesses and assets held for sale, less cost to sell. |
Advantage Solutions Inc. | Page 12

Q3’25Earnings November 6, 2025

Disclaimer Forward-Looking Statements Certain statements in this presentation may be considered forward-looking statements within the meaning of the federal securities laws, including statements regarding the expected future performance of Advantage's business and projected financial results. Forward-looking statements generally relate to future events or Advantage’s future financial or operating performance. These forward-looking statements generally are identified by the words “may”, “should”, “expect”, “intend”, “will”, “would”, “could”, “estimate”, “anticipate”, “believe”, “predict”, “confident”, “potential”, “guidance”, or “continue”, or the negatives of these terms or variations of them or similar terminology. Such forward-looking statements are predictions, projections, and other statements about future events that are based on current expectations and assumptions and, as a result, are subject to risks, uncertainties, and other factors which could cause actual results to differ materially from those expressed or implied by such forward looking statements. These forward-looking statements are based upon estimates and assumptions that, while considered reasonable by Advantage and its management at the time of such statements, are inherently uncertain. Factors that may cause actual results to differ materially from current expectations include, but are not limited to, market-driven wage changes or changes to labor laws or wage or job classification regulations, including minimum wage; a future pandemic or health epidemic; the impact from tariffs; Advantage’s ability to continue to generate significant operating cash flow; client procurement strategies and consolidation of Advantage’s clients’ industries creating pressure on the nature and pricing of its services; consumer goods manufacturers and retailers reviewing and changing their sales, retail, marketing, and technology programs and relationships; Advantage’s ability to successfully develop and maintain relevant omni-channel services for our clients in an evolving industry and to otherwise adapt to significant technological change; Advantage’s ability to maintain proper and effective internal control over financial reporting in the future; potential and actual harms to Advantage’s business arising from the Take 5 Matter; Advantage’s substantial indebtedness and our ability to refinance at favorable rates; and other risks and uncertainties set forth in the section titled “Risk Factors” in the Annual Report on Form 10-K filed by the company with the Securities and Exchange Commission (the “SEC”) on March 7, 2025, and in its other filings made from time to time with the SEC. These filings identify and address other important risks and uncertainties that could cause actual events and results to differ materially from those contained in the forward-looking statements. Forward-looking statements speak only as of the date they are made. Readers are cautioned not to put undue reliance on forward-looking statements, and Advantage assumes no obligation and does not intend to update or revise these forward-looking statements, whether as a result of new information, future events or otherwise, except as required by law. Non-GAAP Financial Measures and Related Information This presentation includes certain financial measures not presented in accordance with generally accepted accounting principles (“GAAP”), Adjusted EBITDA from Continuing Operations, Adjusted EBITDA by Segment, Adjusted EBITDA margin, Revenues net of reimbursable expenses, Net Debt, Adjusted Unlevered Free Cash Flow, and Adjusted Unlevered Free Cash Flow and net debt as a percentage of LTM Adjusted EBITDA from Continuing and Discontinued Operations. These are not measures of financial performance calculated in accordance with GAAP and may exclude items that are significant in understanding and assessing Advantage’s financial results. Therefore, the measures are in addition to, and not a substitute for or superior to, measures of financial performance prepared in accordance with GAAP, and should not be considered in isolation or as an alternative to net income, cash flows from operations or other measures of profitability, liquidity or performance under GAAP. You should be aware that Advantage’s presentation of these measures may not be comparable to similarly-titled measures used by other companies. Reconciliations of historical non-GAAP measures to their most directly comparable GAAP counterparts are included in this document. Advantage believes these non-GAAP measures provide useful information to management and investors regarding certain financial and business trends relating to Advantage’s financial condition and results of operations. Advantage believes that the use of Adjusted EBITDA from Continuing Operations, Adjusted EBITDA by Segment, Adjusted EBITDA margin, Revenues net of reimbursable expenses, Net Debt, Adjusted Unlevered Free Cash Flow and Adjusted Unlevered Free Cash Flow, and net debt as a percentage of LTM Adjusted EBITDA from Continuing Operations provides an additional tool for investors to use in evaluating ongoing operating results, trends, and in comparing Advantage’s financial measures with other similar companies, many of which present similar non-GAAP financial measures to investors. Non-GAAP financial measures are subject to inherent limitations as they reflect the exercise of judgments by management about which expense and income are excluded or included in determining these non-GAAP financial measures. Additionally, other companies may calculate non-GAAP measures differently or may use other measures to calculate their financial performance, and therefore Advantage’s non-GAAP measures may not be directly comparable to similarly titled measures of other companies. Adjusted EBITDA from Continuing Operations mean net (loss) income before (i) interest expense (net), (ii) provision for (benefit from) income taxes, (iii) depreciation, (iv) amortization of intangible assets, (v) impairment of goodwill, (vi) changes in fair value of warrant liability, (vii) stock-based compensation expense, (viii) equity-based compensation of Karman Topco L.P., (ix) fair value adjustments of contingent consideration related to acquisitions, (x) acquisition and divestiture related expenses, (xi) (gain) loss on divestitures, (xii) restructuring expenses, (xiii) reorganization expenses, (xiv) litigation expenses (recovery), (xv) COVID-19 benefits received, (xvi) costs associated with (recovery from) the Take 5 Matter, (xvii) EBITDA for economic interests in investments, and (xviii) other adjustments that management believes are helpful in evaluating our operating performance. Adjusted EBITDA Margin means Adjusted EBITDA divided by total Revenues and Revenues net of reimbursable expenses. Adjusted EBITDA by Segment means, with respect to each segment, operating income (loss) from continuing operations before (i) depreciation, (ii) amortization of intangible assets, (iii) impairment of goodwill, (iv) stock-based compensation expense, (v) equity-based compensation of Karman Topco L.P., (vi) fair value adjustments of contingent consideration related to acquisitions, (vii) acquisition and divestiture related expenses, (viii) restructuring expenses, (ix) reorganization expenses, (x) litigation expenses (recovery), (xi) COVID-19 benefits received, (xii) costs associated with (recovery from) the Take 5 Matter, (xiii) EBITDA for economic interests in investments, and (xiii) other adjustments that management believes are helpful in evaluating our operating performance, in each case, attributable to such segment. Adjusted EBITDA Margin with respect to the applicable segment means Adjusted EBITDA by Segment divided by total Segment Revenues and Revenues net of reimbursable expenses. Revenues net of reimbursable expenses and Revenues net of reimbursable expenses by segment means revenues less reimbursable expenses that are paid by Advantage's clients, including media, product samples, retailer fees, and other marketing and production costs. Net Debt represents the sum of current portion of long-term debt and long-term debt, less cash, cash equivalents, and debt issuance costs. With respect to Net Debt, cash and cash equivalents are subtracted from the GAAP measure, total debt, because they could be used to reduce the debt obligations. We present Net Debt because we believe this non-GAAP measure provides useful information to management and investors regarding certain financial and business trends relating to the Company’s financial condition and to evaluate changes to the Company's capital structure and credit quality assessment. Adjusted Unlevered Free Cash Flow represents net cash provided by (used in) operating activities from continuing and discontinued operations less purchase of property, equipment, and software as disclosed in the Statements of Cash Flows further adjusted by (i) cash payments for interest, (ii) cash received from interest rate derivatives, (iii) cash paid for income taxes; (iv) cash paid for acquisition and divestiture related expenses, (v) cash paid for restructuring expenses, (vi) cash paid for reorganization expenses, (vii) cash paid for contingent earnout payments included in operating cash flow, (viii) COVID-19 benefits received, (ix) costs associated with (recovery from) the Take 5 Matter, (x) net effect of foreign currency fluctuations on cash, and (xi) other adjustments that management believes are helpful in evaluating our operating performance. Adjusted Unlevered Free Cash Flow as a percentage of Adjusted EBITDA means Adjusted Unlevered Free Cash Flow divided by Adjusted EBITDA from Continuing Operations and Adjusted EBITDA from Discontinued Operations. Due to rounding, numbers presented throughout this document may not add up precisely to the totals provided and percentages may not precisely reflect the absolute figures. 2
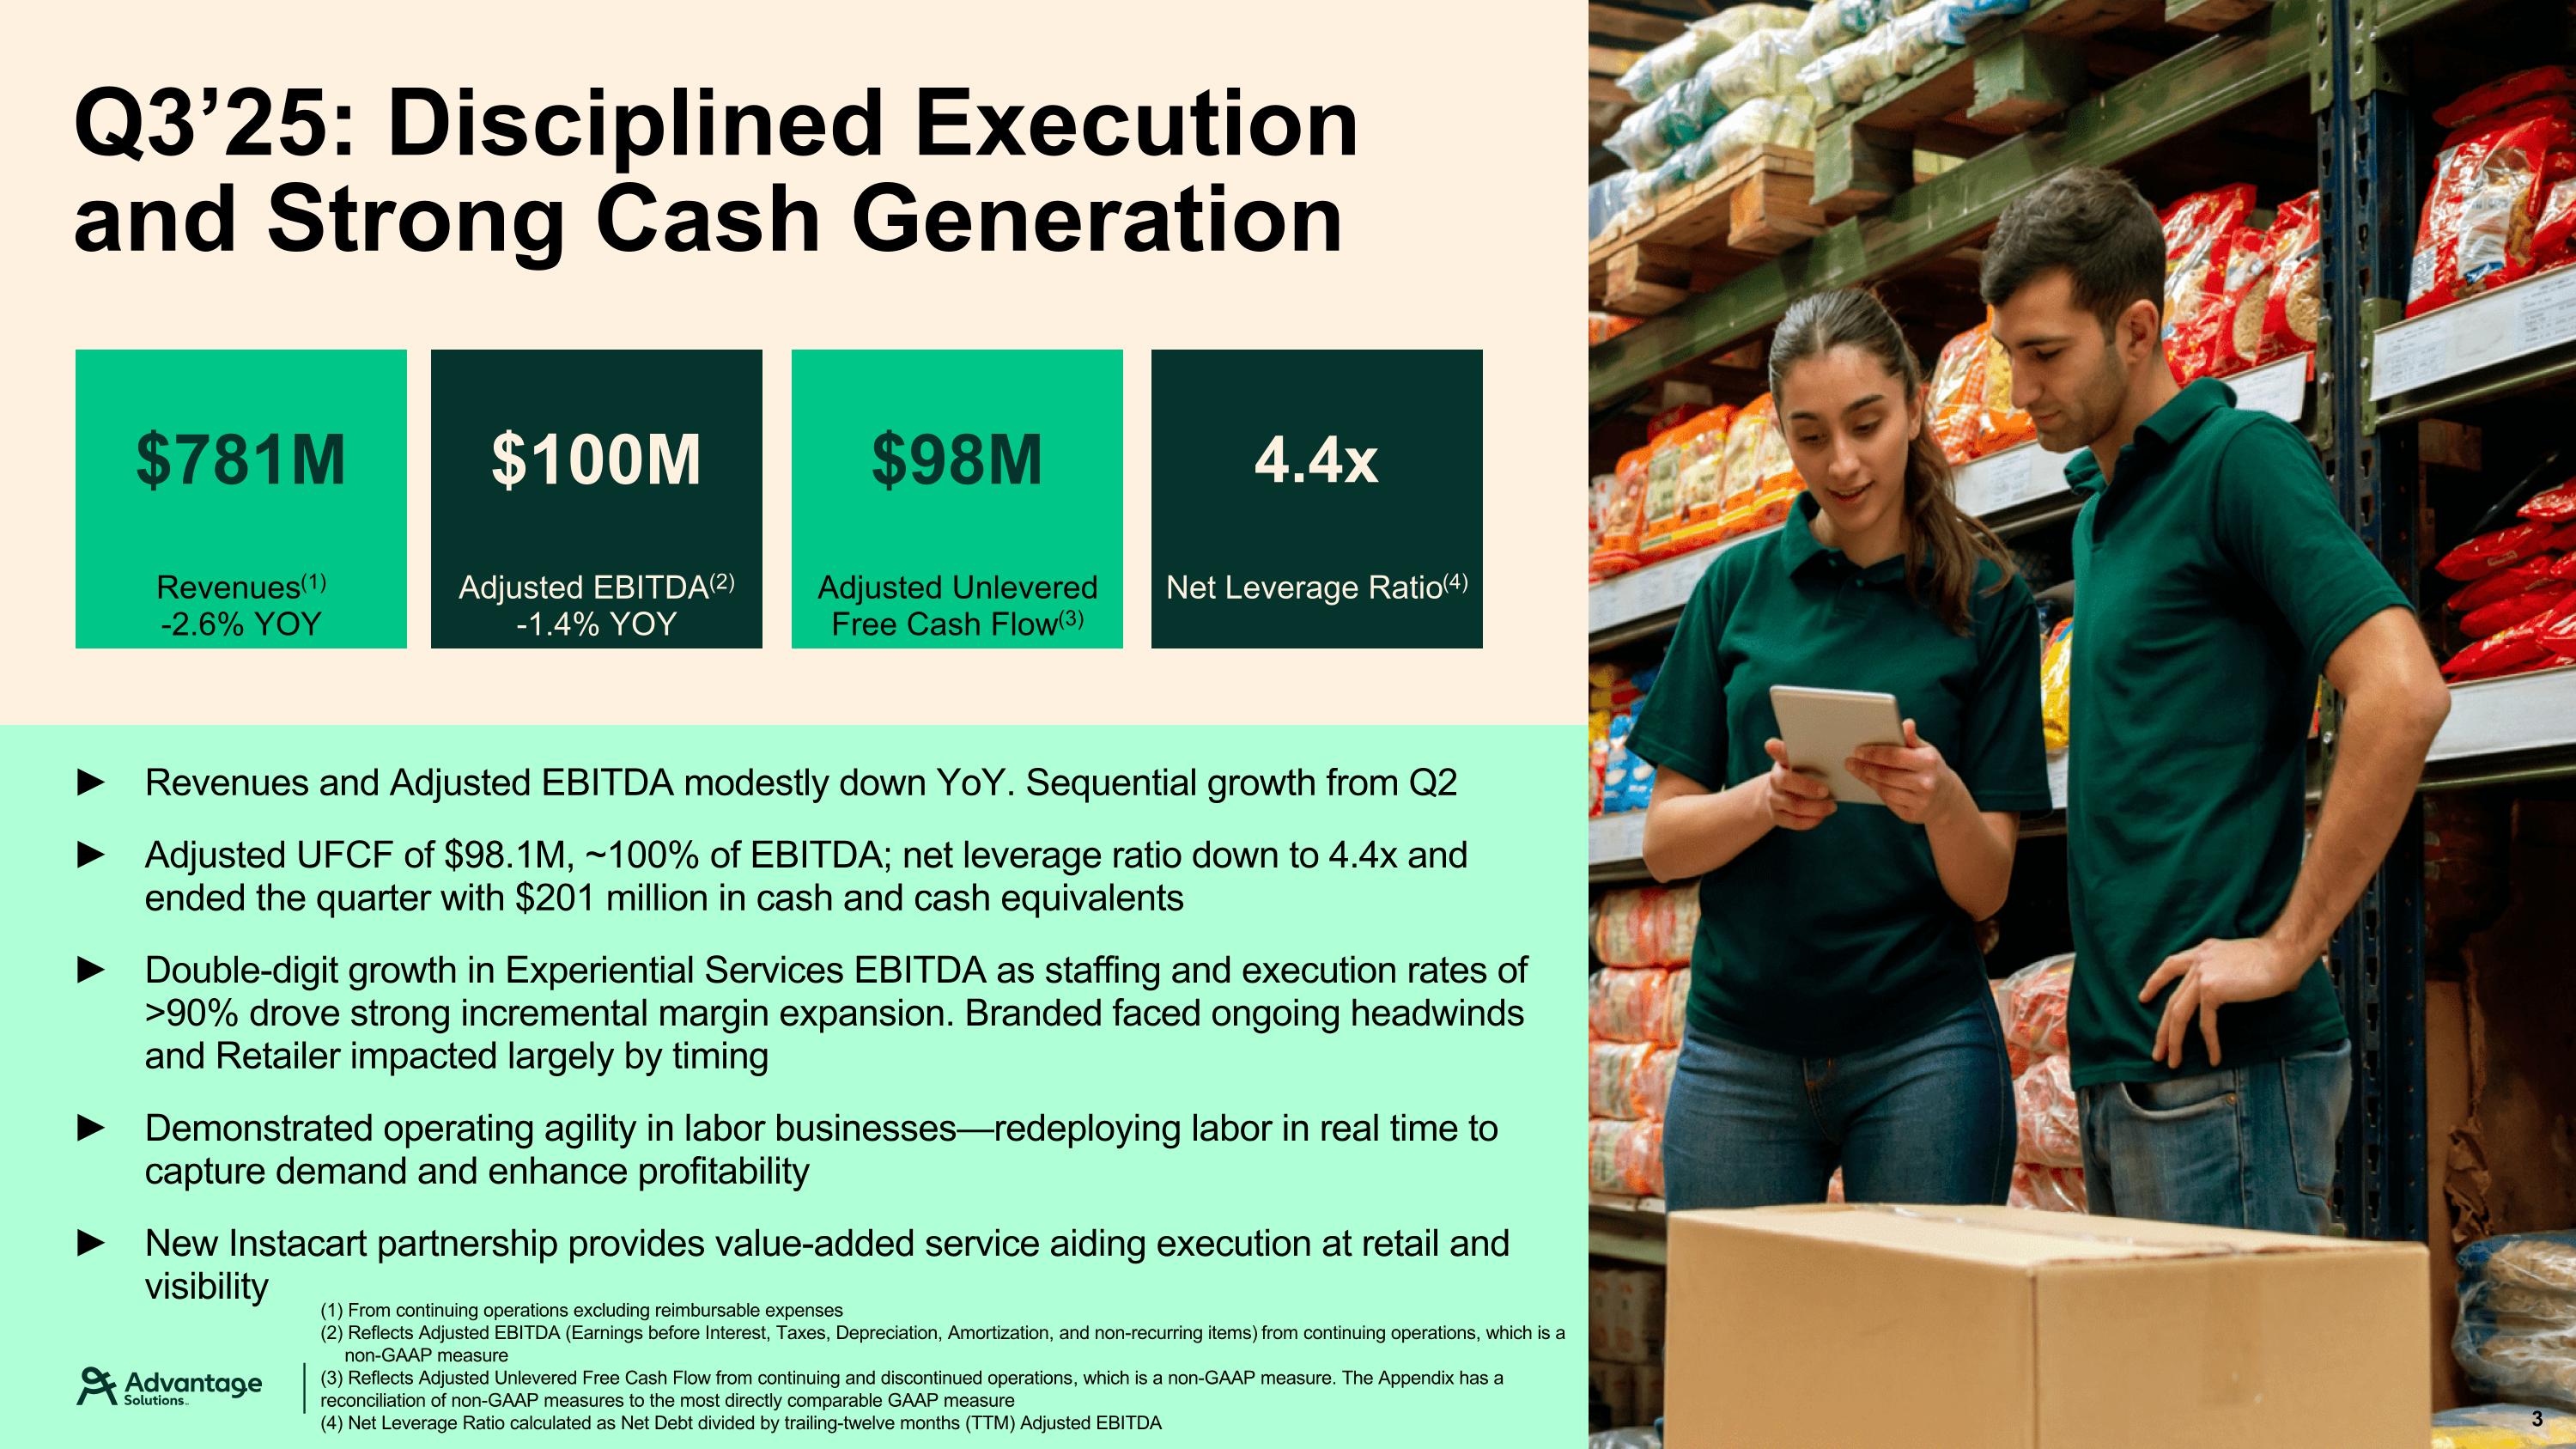
Q3’25: Disciplined Execution and Strong Cash Generation Revenues and Adjusted EBITDA modestly down YoY. Sequential growth from Q2 Adjusted UFCF of $98.1M, ~100% of EBITDA; net leverage ratio down to 4.4x and ended the quarter with $201 million in cash and cash equivalents Double-digit growth in Experiential Services EBITDA as staffing and execution rates of >90% drove strong incremental margin expansion. Branded faced ongoing headwinds and Retailer impacted largely by timing Demonstrated operating agility in labor businesses—redeploying labor in real time to capture demand and enhance profitability New Instacart partnership provides value-added service aiding execution at retail and visibility Revenues(1) -2.6% YOY $781M Adjusted EBITDA(2) -1.4% YOY $100M Adjusted Unlevered Free Cash Flow(3) $98M Net Leverage Ratio(4) 4.4x (1) From continuing operations excluding reimbursable expenses (2) Reflects Adjusted EBITDA (Earnings before Interest, Taxes, Depreciation, Amortization, and non-recurring items) from continuing operations, which is a non-GAAP measure (3) Reflects Adjusted Unlevered Free Cash Flow from continuing and discontinued operations, which is a non-GAAP measure. The Appendix has a reconciliation of non-GAAP measures to the most directly comparable GAAP measure (4) Net Leverage Ratio calculated as Net Debt divided by trailing-twelve months (TTM) Adjusted EBITDA 3
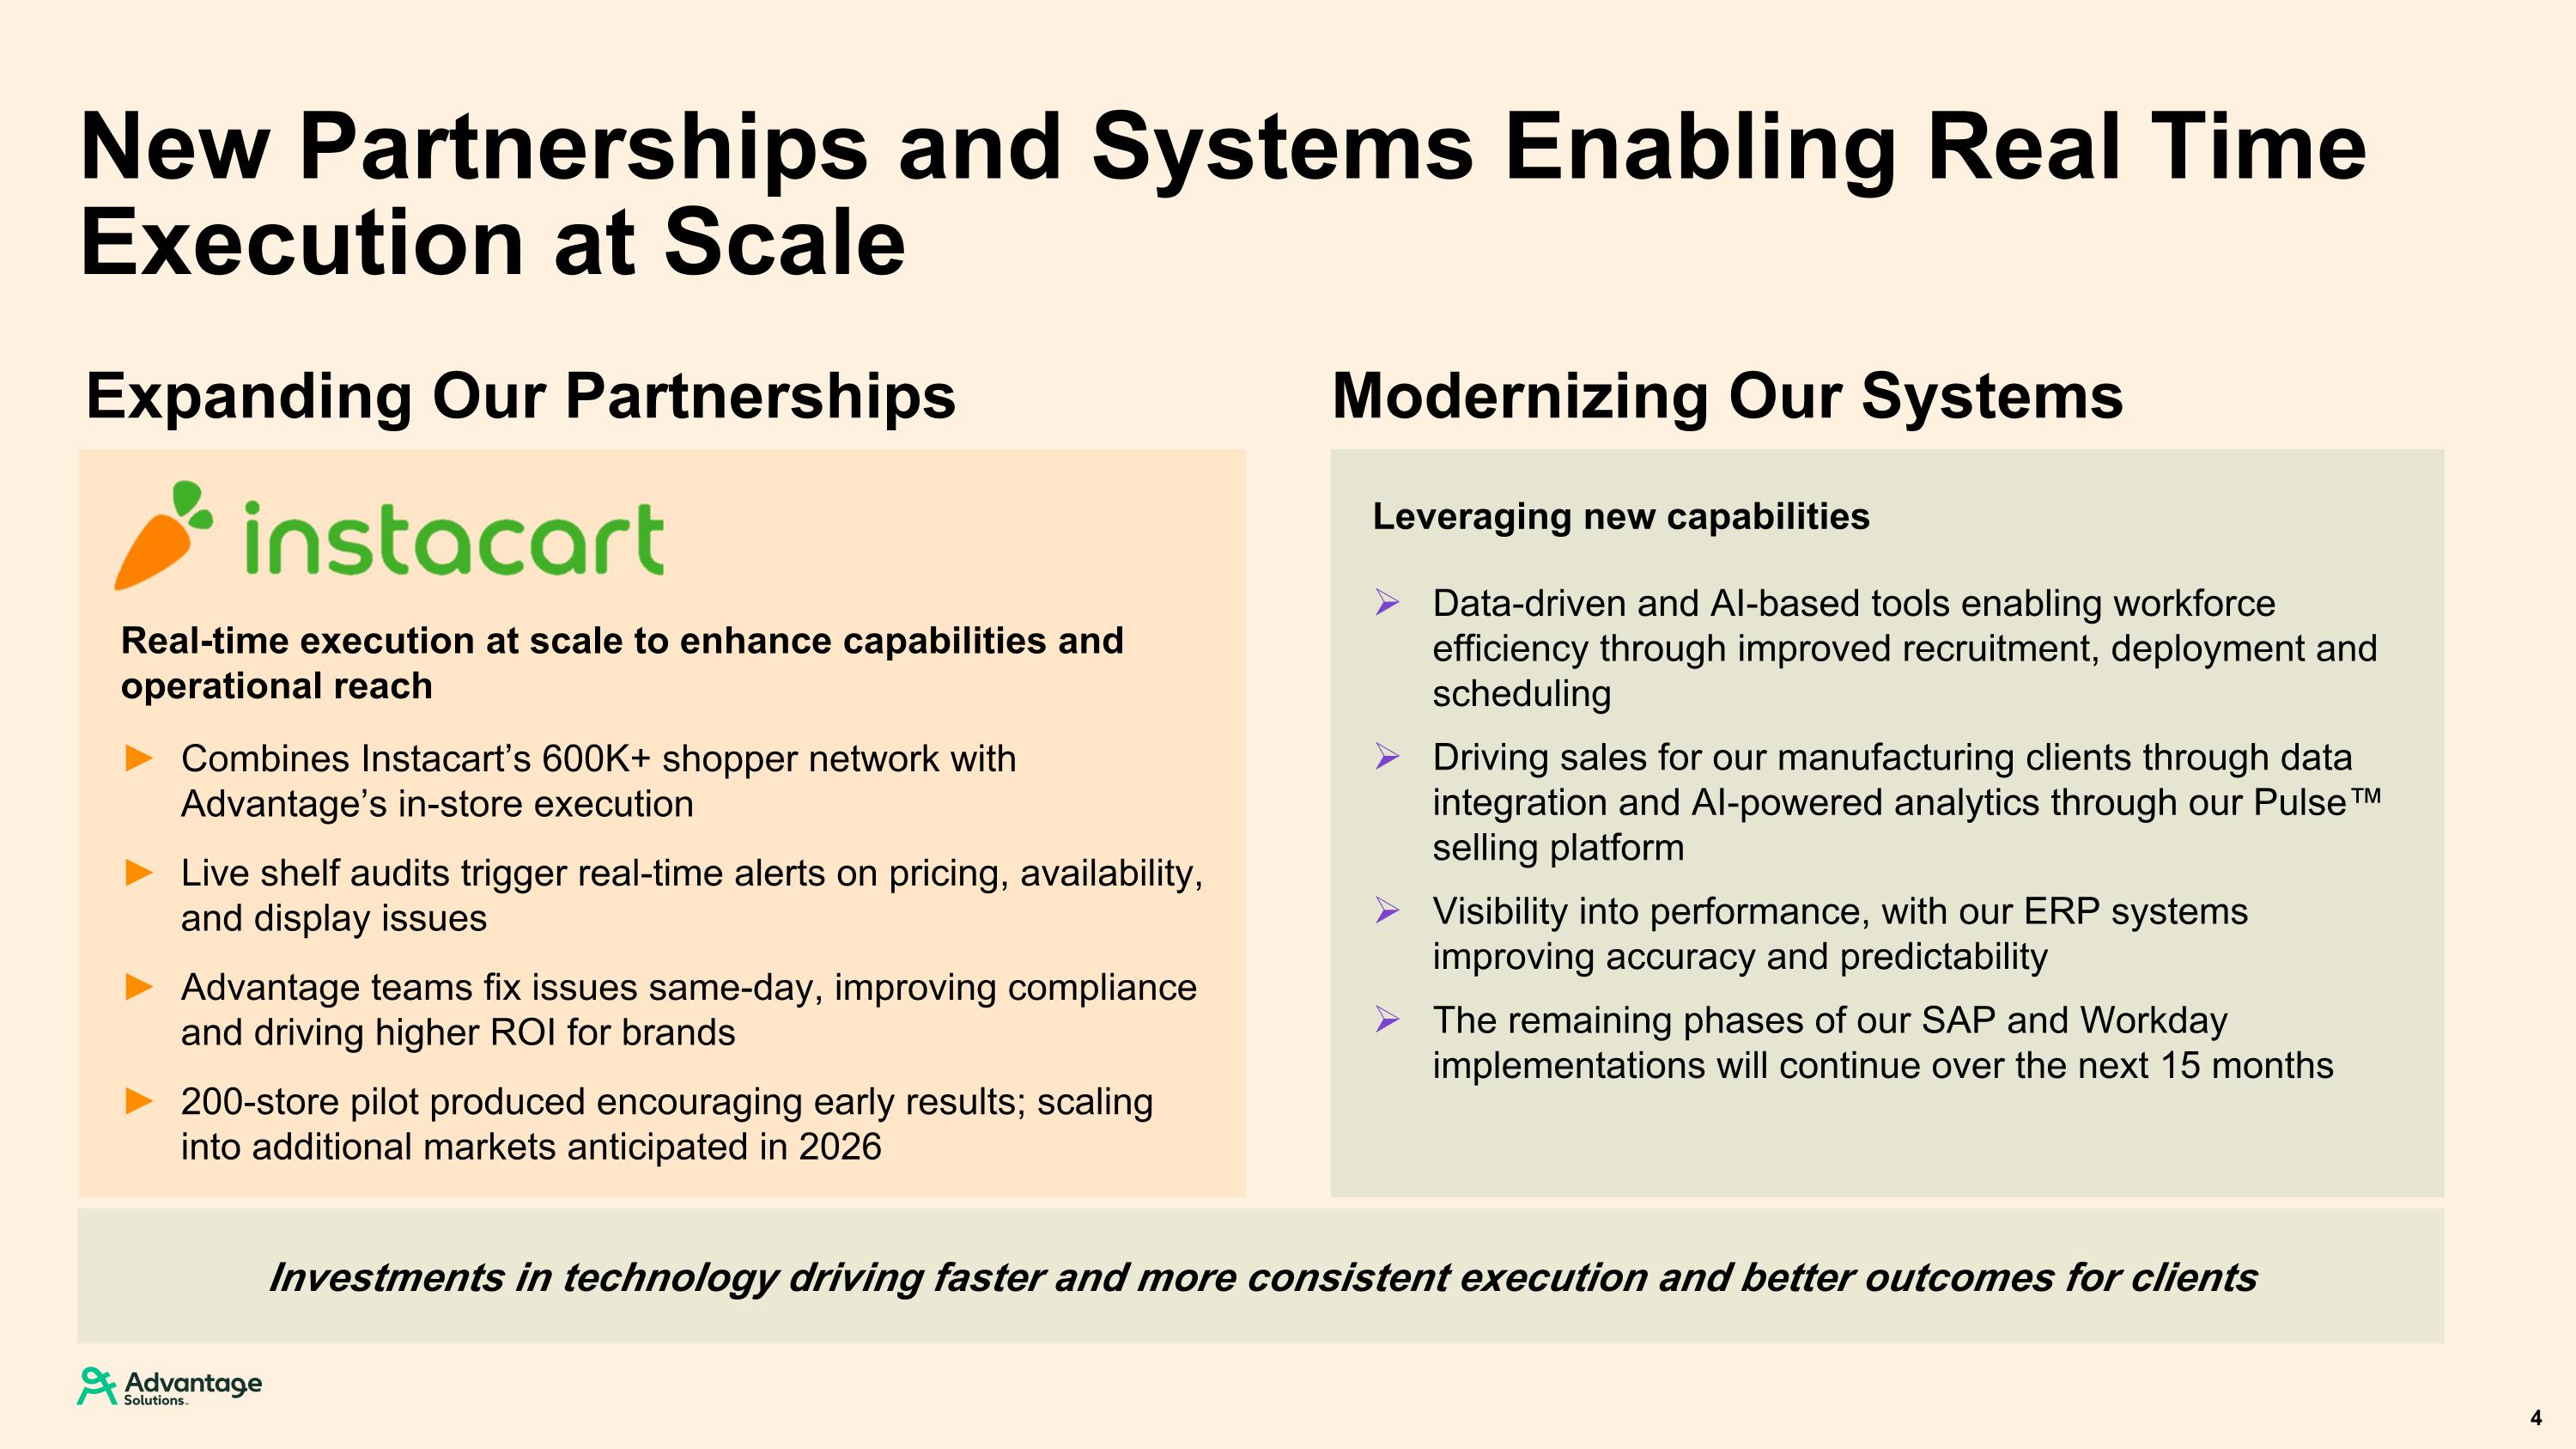
New Partnerships and Systems Enabling Real Time Execution at Scale Expanding Our Partnerships Modernizing Our Systems Combines Instacart’s 600K+ shopper network with Advantage’s in-store execution Live shelf audits trigger real-time alerts on pricing, availability, and display issues Advantage teams fix issues same-day, improving compliance and driving higher ROI for brands 200-store pilot produced encouraging early results; scaling into additional markets anticipated in 2026 Leveraging new capabilities Data-driven and AI-based tools enabling workforce efficiency through improved recruitment, deployment and scheduling Driving sales for our manufacturing clients through data integration and AI-powered analytics through our Pulse™ selling platform Visibility into performance, with our ERP systems improving accuracy and predictability The remaining phases of our SAP and Workday implementations will continue over the next 15 months 4 Real-time execution at scale to enhance capabilities and operational reach Investments in technology driving faster and more consistent execution and better outcomes for clients
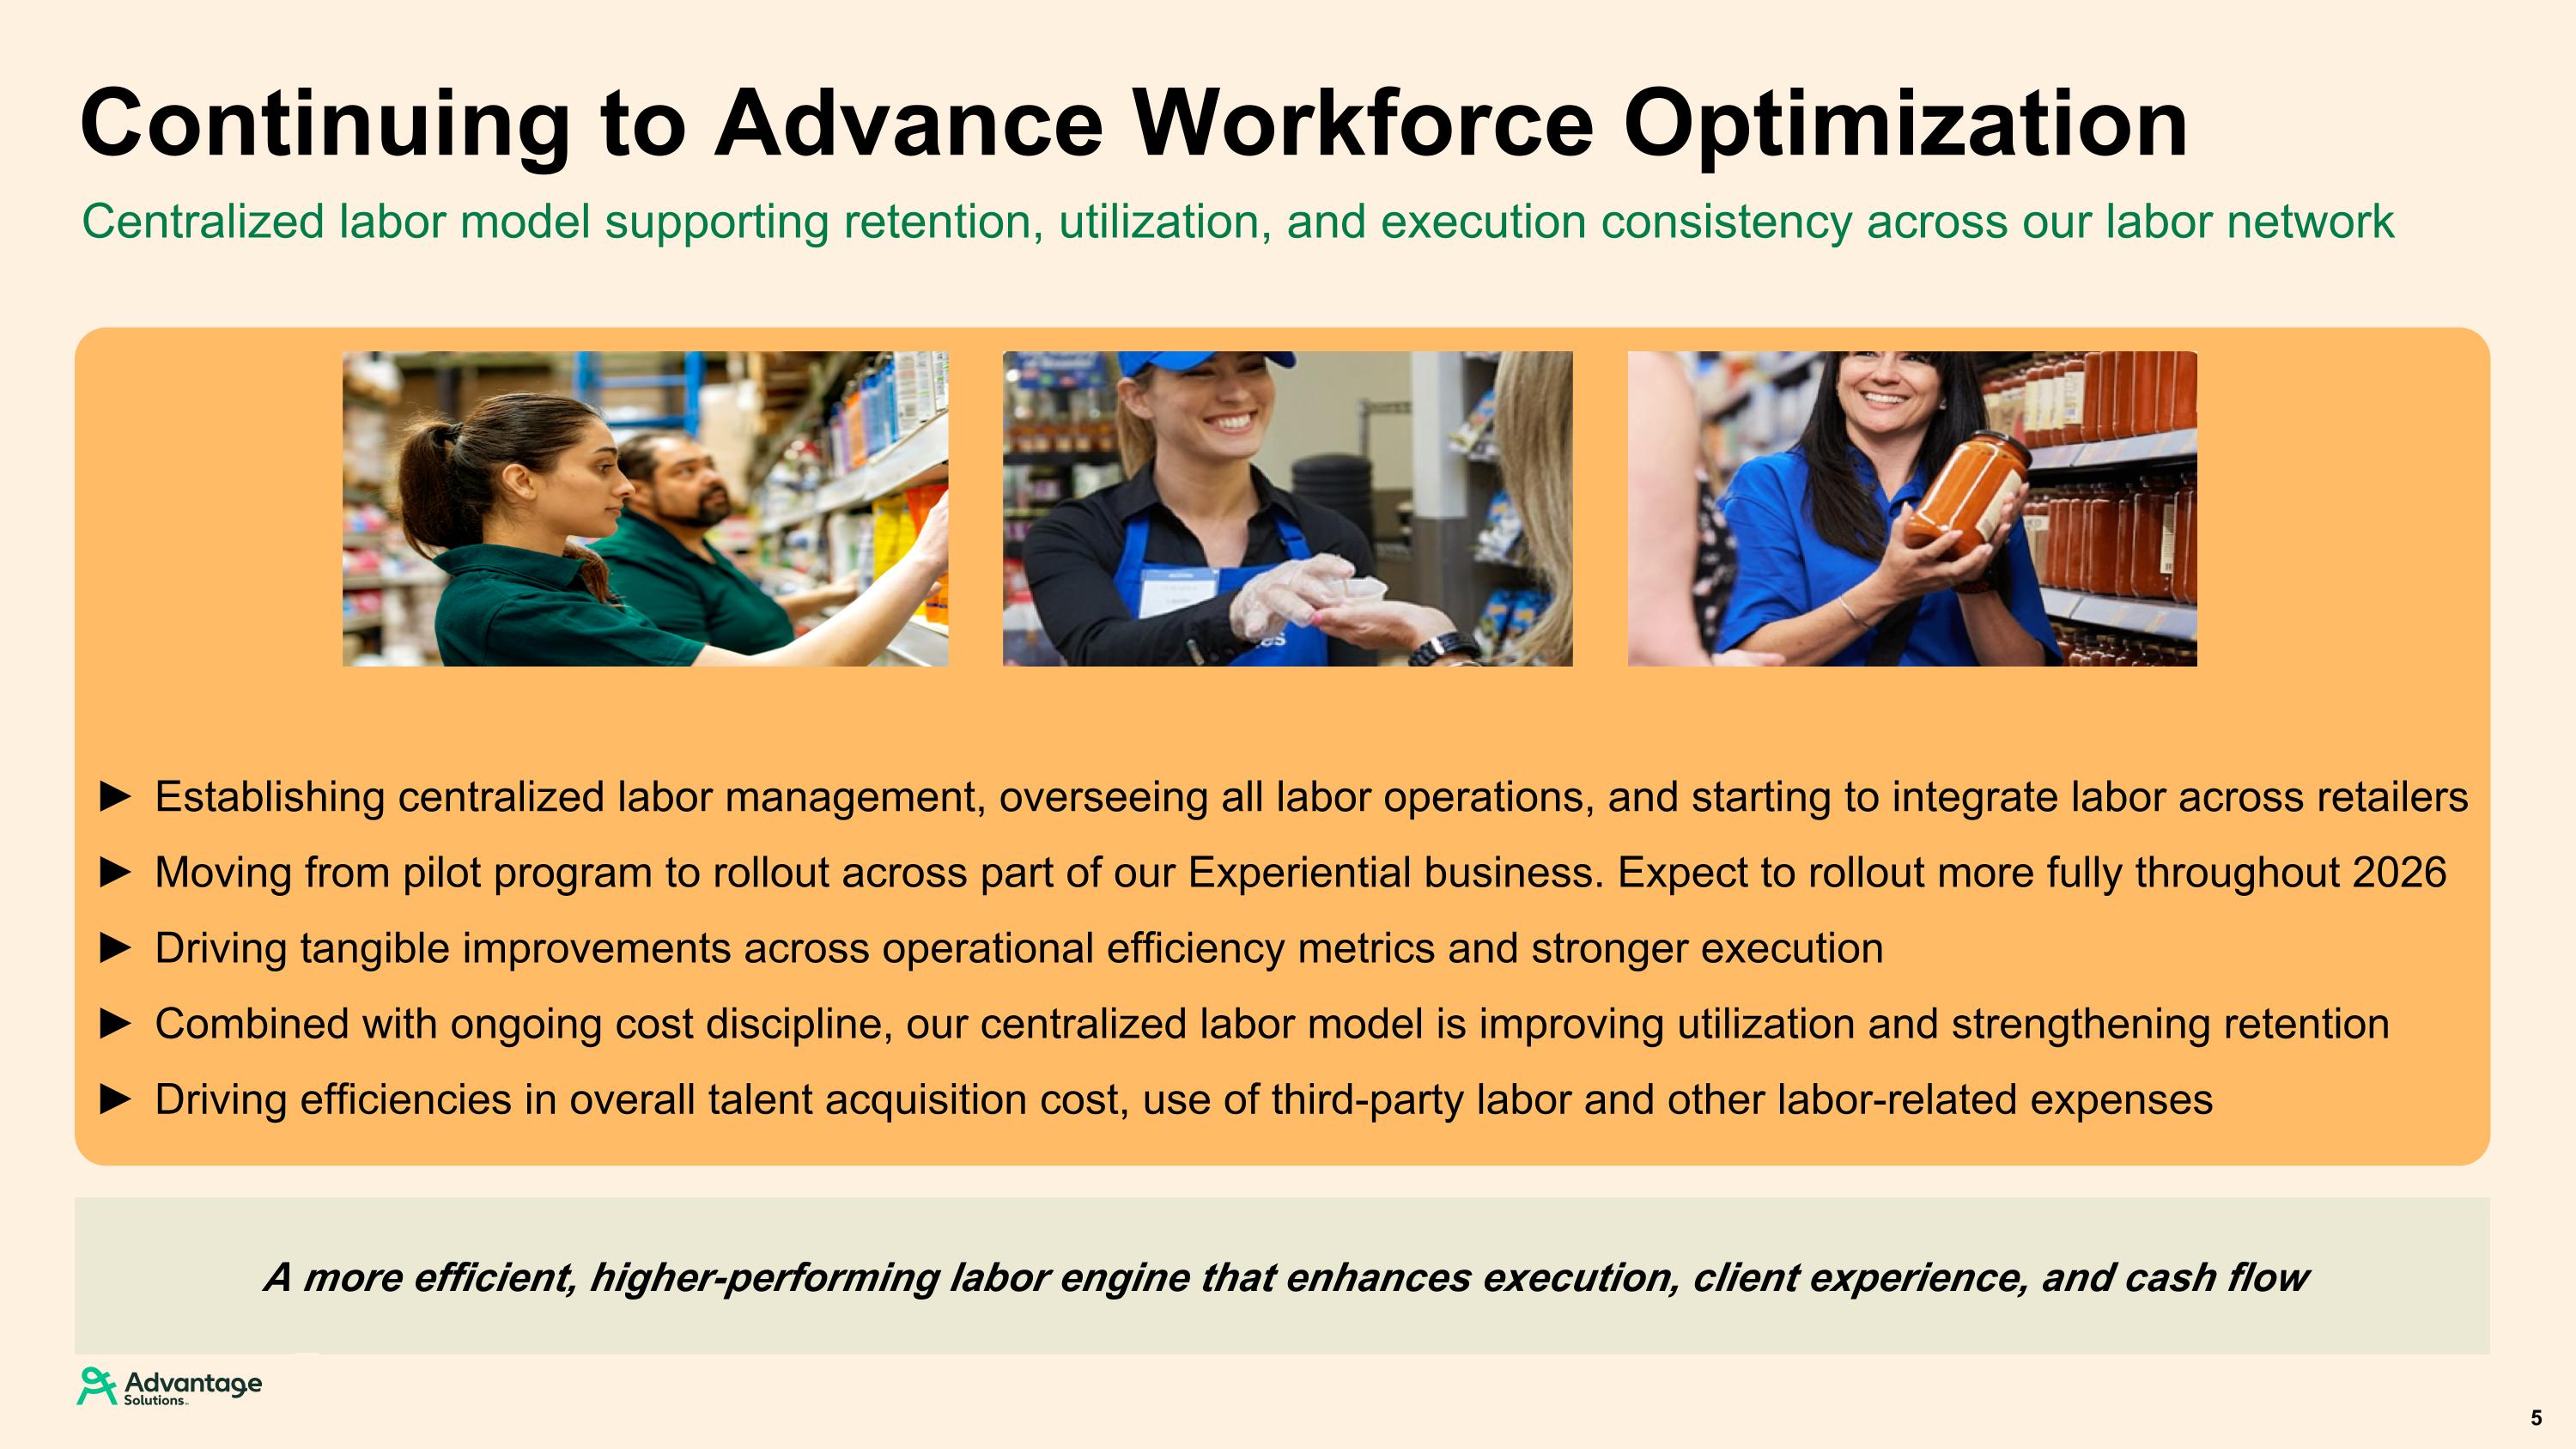
Centralized labor model supporting retention, utilization, and execution consistency across our labor network A more efficient, higher-performing labor engine that enhances execution, client experience, and cash flow Continuing to Advance Workforce Optimization Establishing centralized labor management, overseeing all labor operations, and starting to integrate labor across retailers Moving from pilot program to rollout across part of our Experiential business. Expect to rollout more fully throughout 2026 Driving tangible improvements across operational efficiency metrics and stronger execution Combined with ongoing cost discipline, our centralized labor model is improving utilization and strengthening retention Driving efficiencies in overall talent acquisition cost, use of third-party labor and other labor-related expenses 5
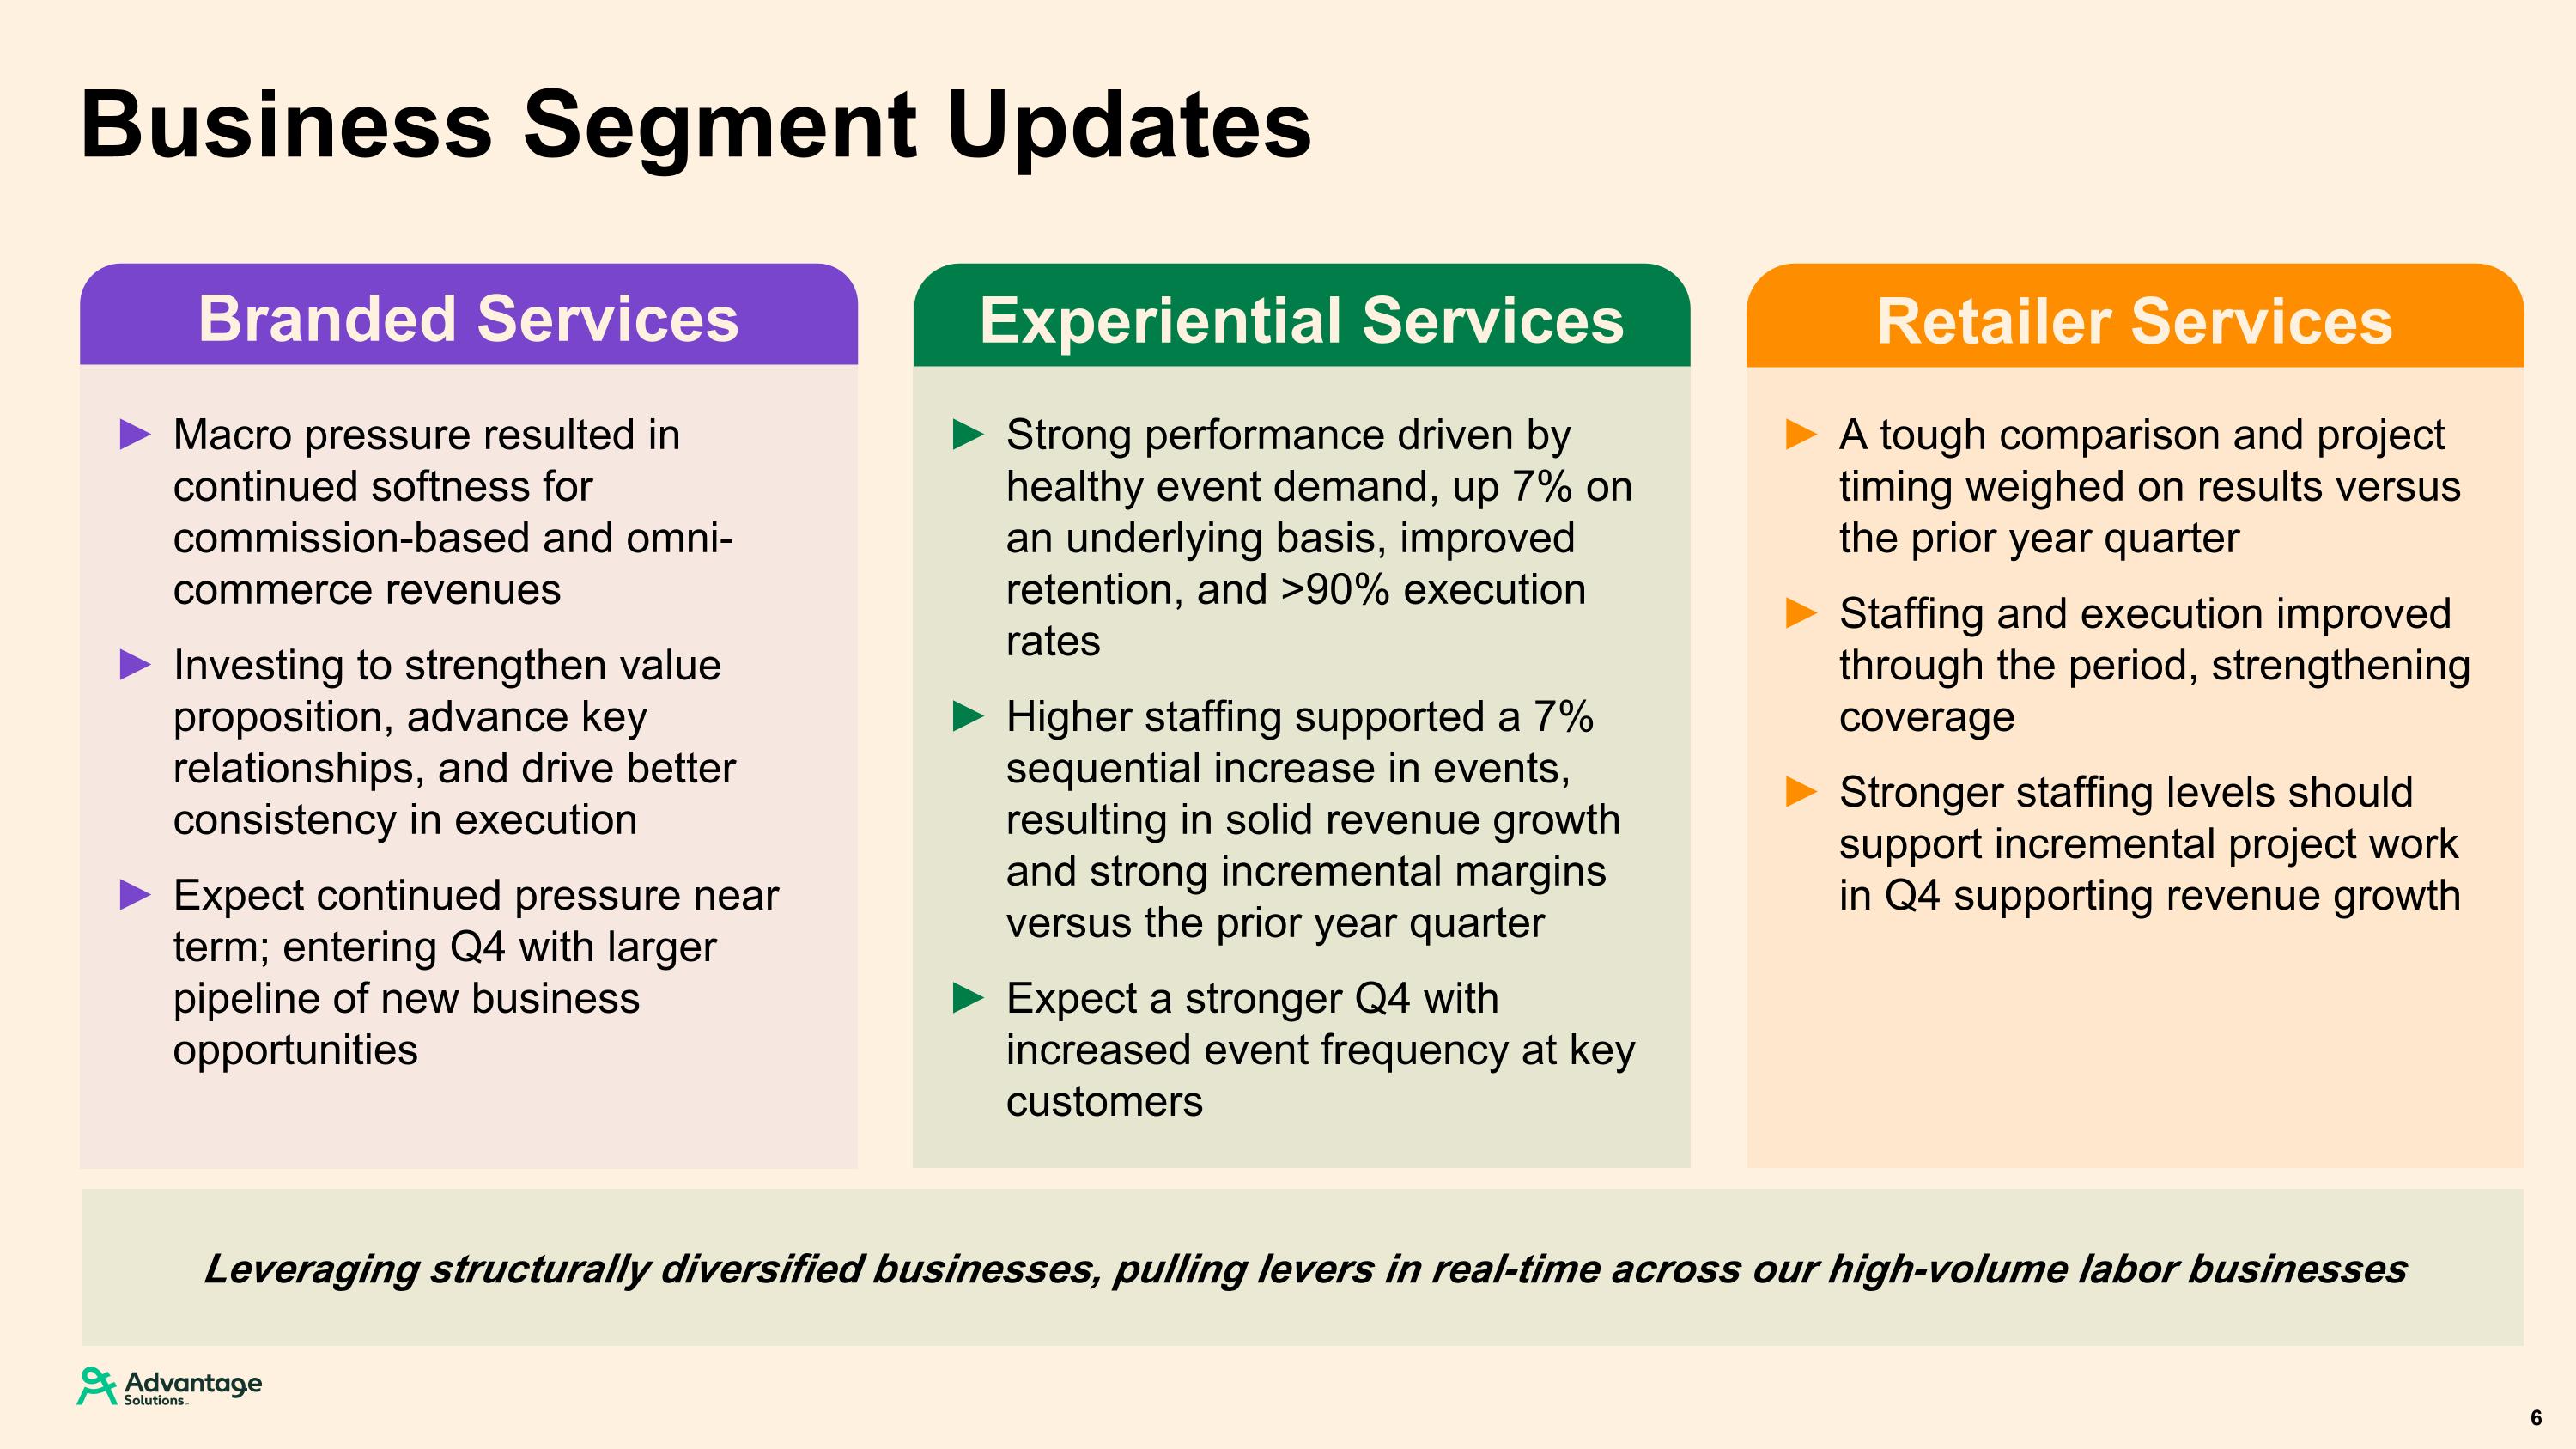
Business Segment Updates Retailer Services Branded Services Experiential Services Macro pressure resulted in continued softness for commission-based and omni-commerce revenues Investing to strengthen value proposition, advance key relationships, and drive better consistency in execution Expect continued pressure near term; entering Q4 with larger pipeline of new business opportunities Strong performance driven by healthy event demand, up 7% on an underlying basis, improved retention, and >90% execution rates Higher staffing supported a 7% sequential increase in events, resulting in solid revenue growth and strong incremental margins versus the prior year quarter Expect a stronger Q4 with increased event frequency at key customers A tough comparison and project timing weighed on results versus the prior year quarter Staffing and execution improved through the period, strengthening coverage Stronger staffing levels should support incremental project work in Q4 supporting revenue growth 6 Leveraging structurally diversified businesses, pulling levers in real-time across our high-volume labor businesses
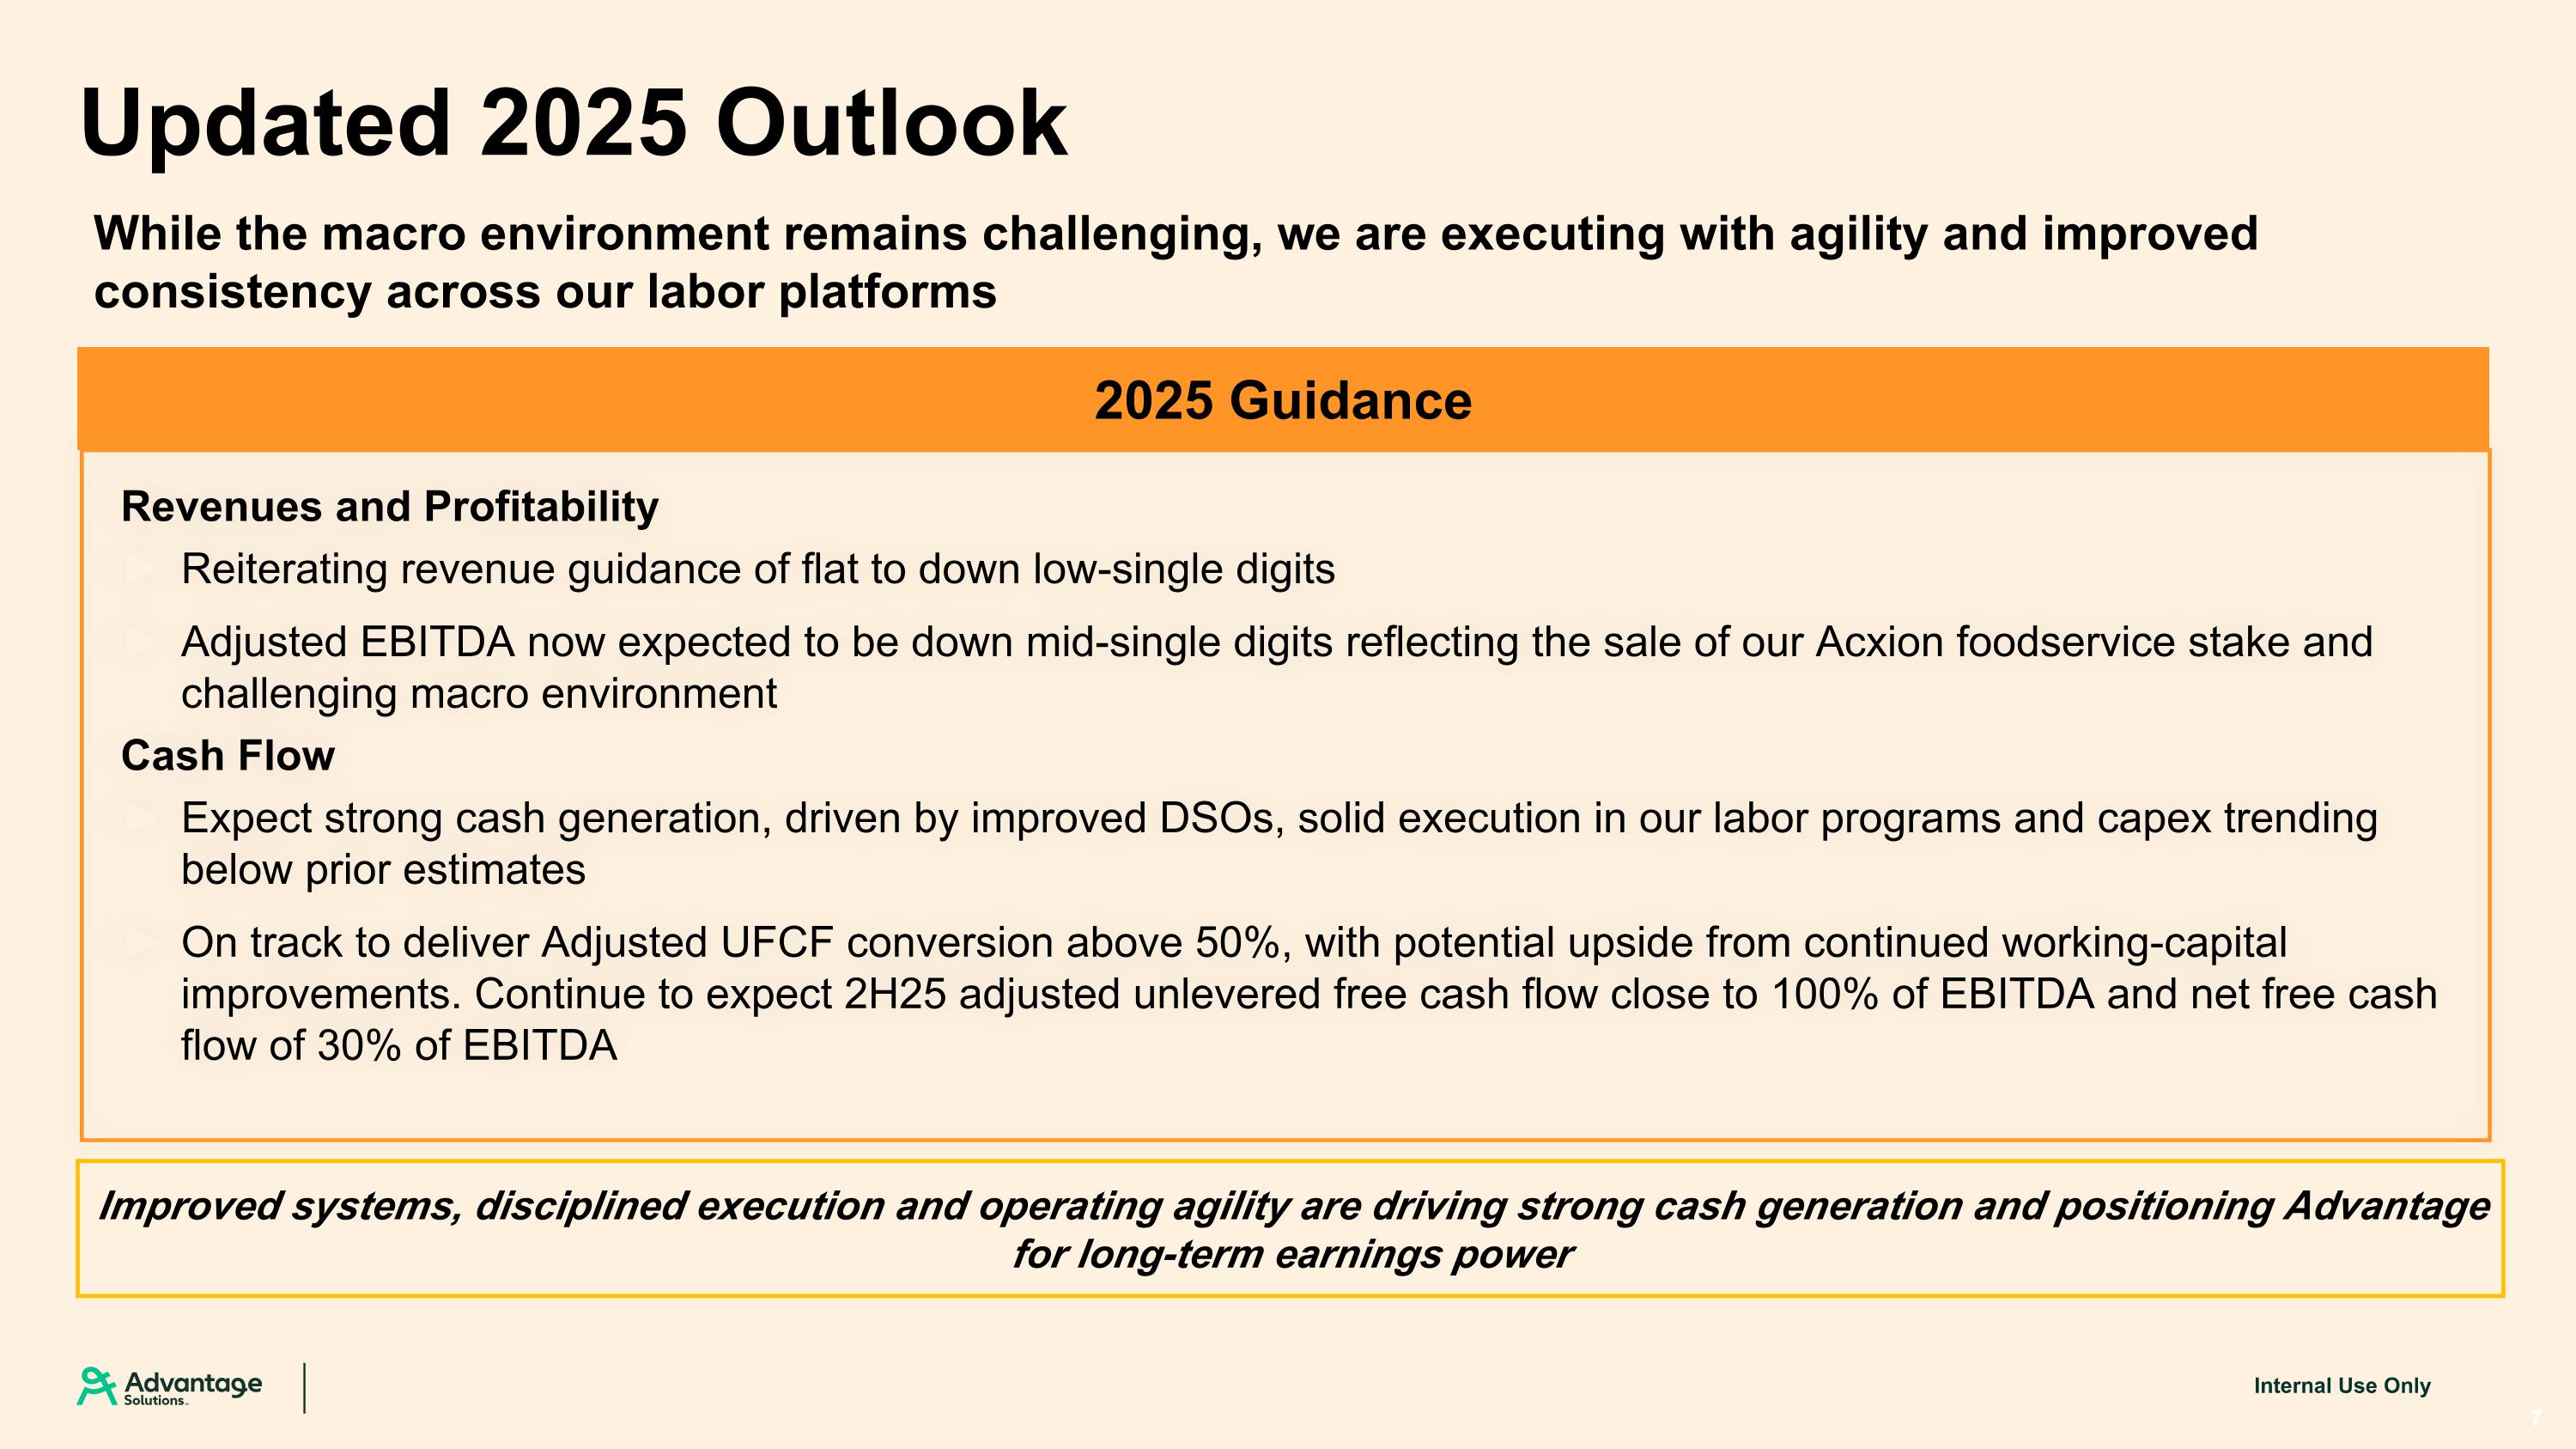
Revenues and Profitability Reiterating revenue guidance of flat to down low-single digits Adjusted EBITDA now expected to be down mid-single digits reflecting the sale of our Acxion foodservice stake and challenging macro environment Cash Flow Expect strong cash generation, driven by improved DSOs, solid execution in our labor programs and capex trending below prior estimates On track to deliver Adjusted UFCF conversion above 50%, with potential upside from continued working-capital improvements. Continue to expect 2H25 adjusted unlevered free cash flow close to 100% of EBITDA and net free cash flow of 30% of EBITDA 2025 Guidance 7 Updated 2025 Outlook Improved systems, disciplined execution and operating agility are driving strong cash generation and positioning Advantage for long-term earnings power While the macro environment remains challenging, we are executing with agility and improved consistency across our labor platforms
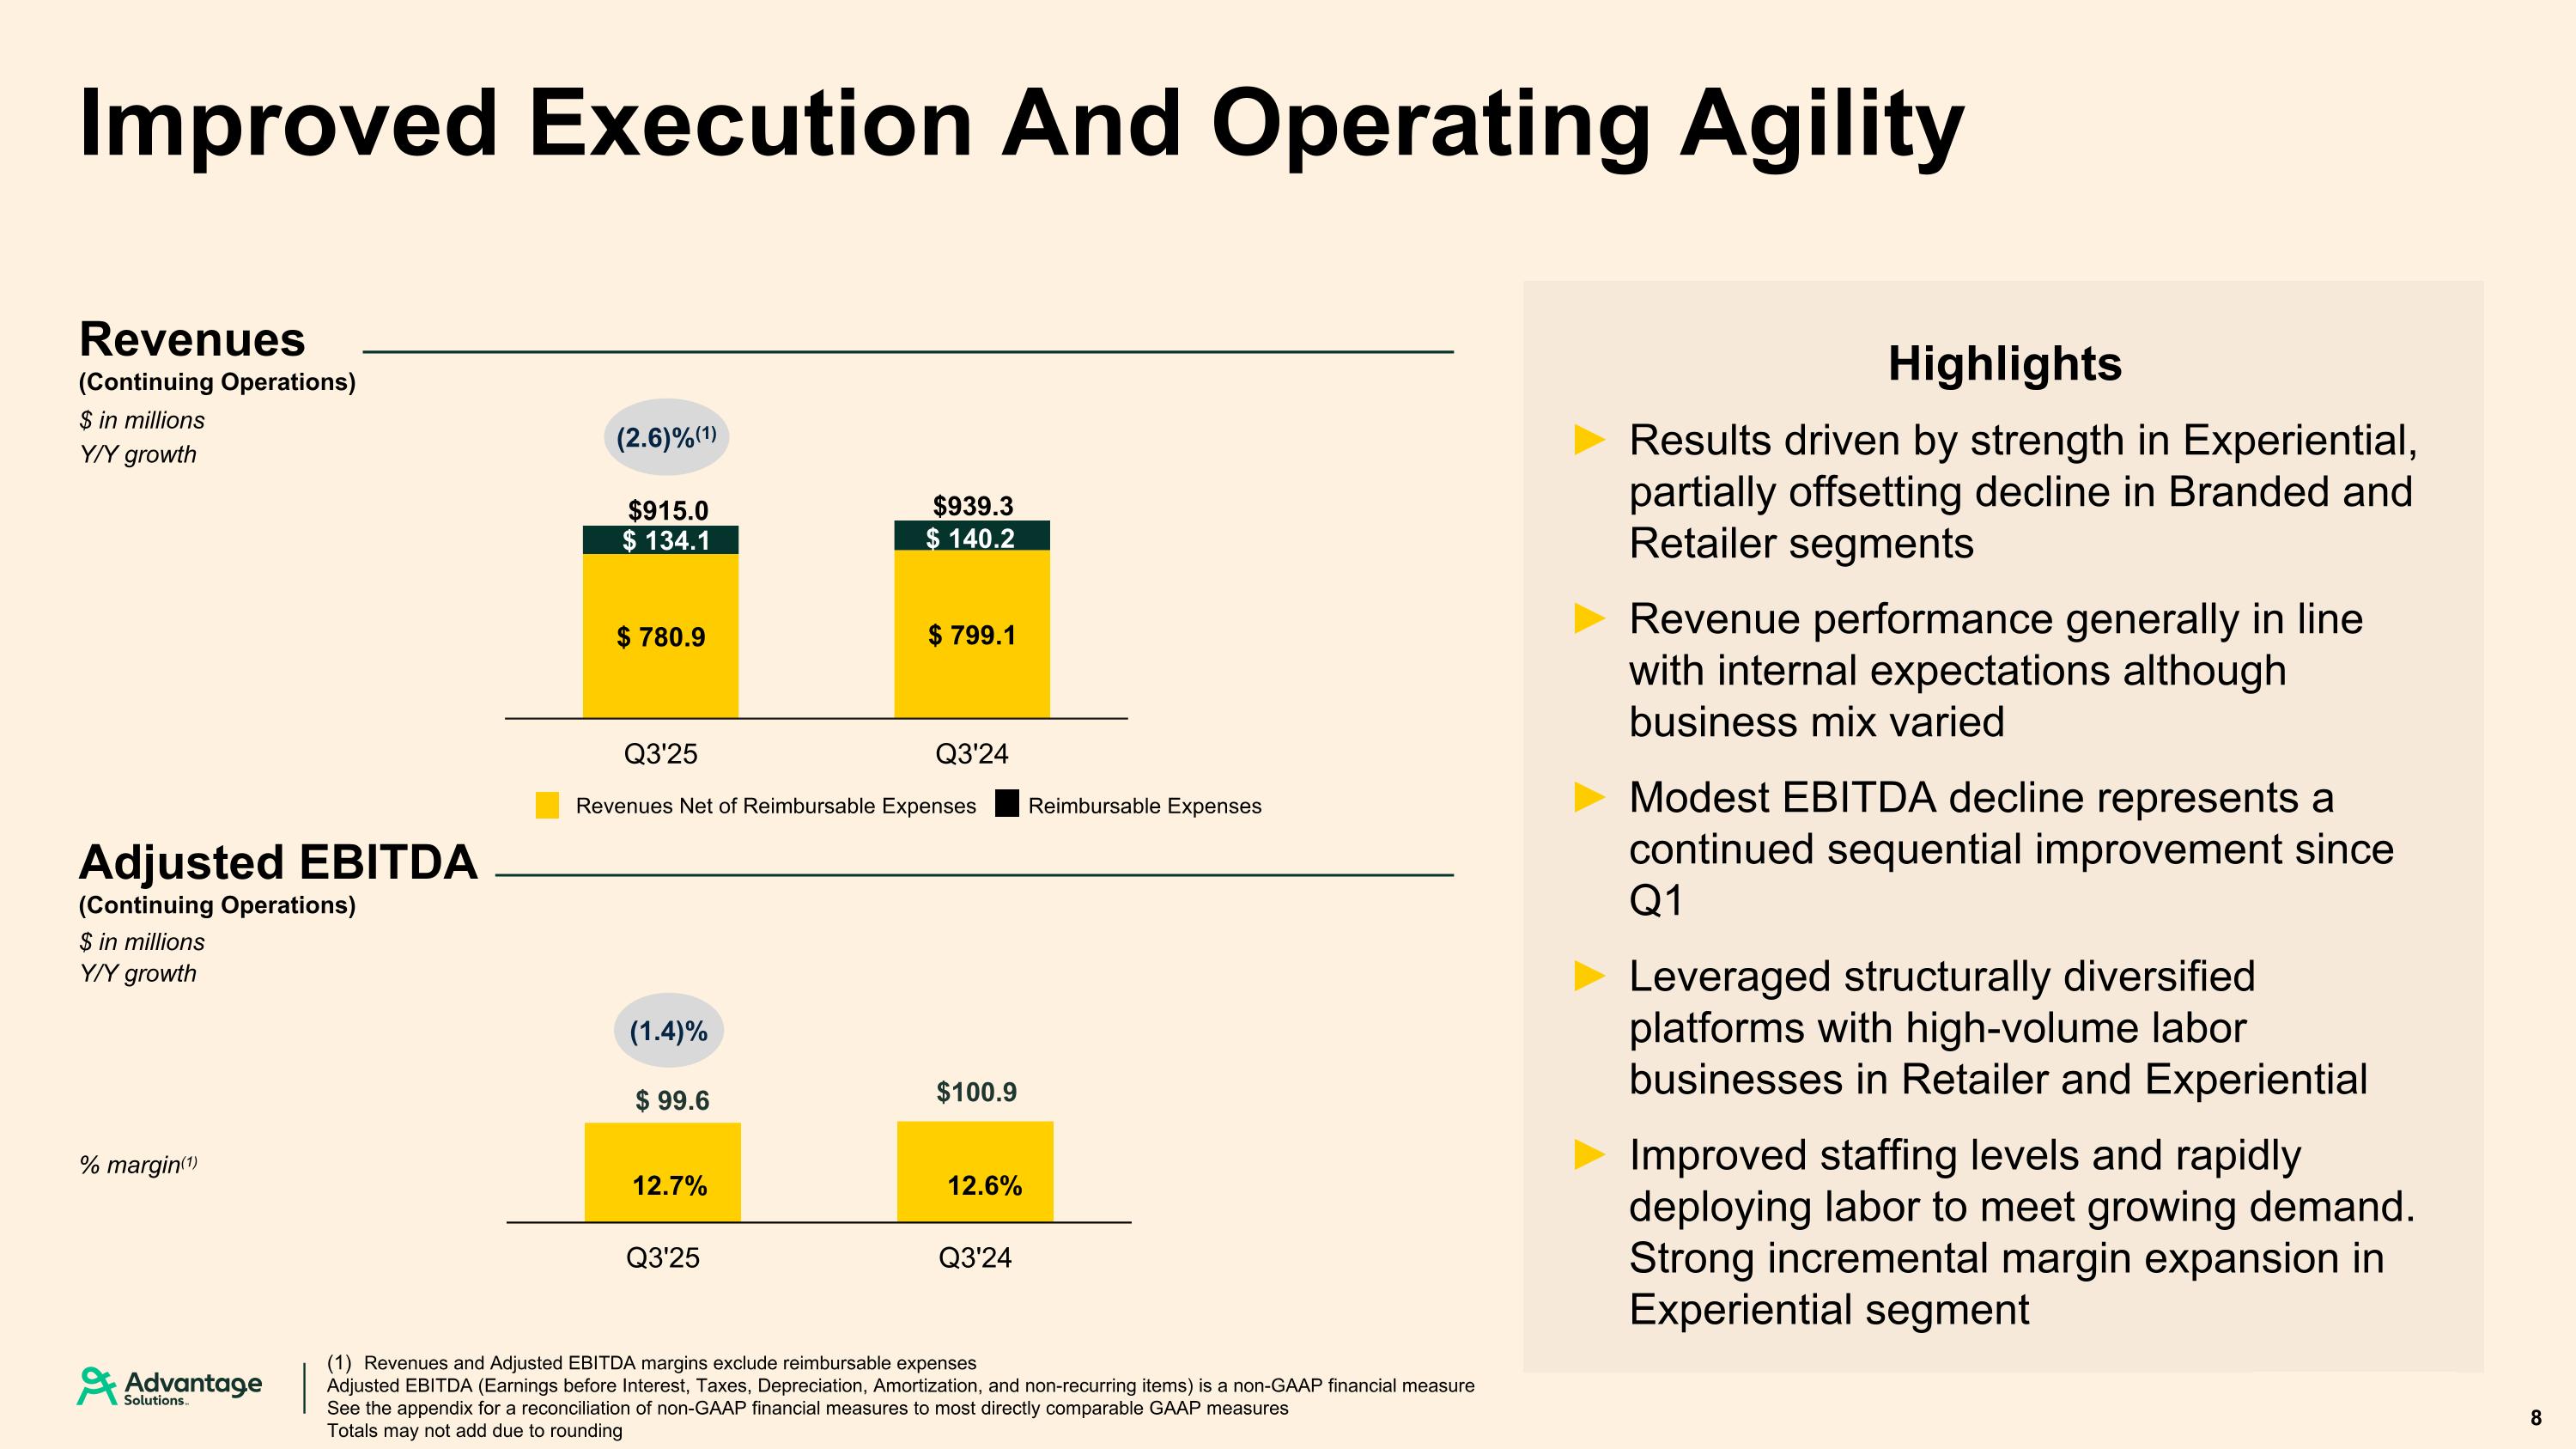
Results driven by strength in Experiential, partially offsetting decline in Branded and Retailer segments Revenue performance generally in line with internal expectations although business mix varied Modest EBITDA decline represents a continued sequential improvement since Q1 Leveraged structurally diversified platforms with high-volume labor businesses in Retailer and Experiential Improved staffing levels and rapidly deploying labor to meet growing demand. Strong incremental margin expansion in Experiential segment Improved Execution And Operating Agility Revenues and Adjusted EBITDA margins exclude reimbursable expenses Adjusted EBITDA (Earnings before Interest, Taxes, Depreciation, Amortization, and non-recurring items) is a non-GAAP financial measure See the appendix for a reconciliation of non-GAAP financial measures to most directly comparable GAAP measures Totals may not add due to rounding $915.0 $939.3 (1.4)% Revenues Net of Reimbursable Expenses Reimbursable Expenses Highlights 8 (2.6)%(1) Revenues (Continuing Operations) $ in millions Y/Y growth % margin(1) $ in millions Y/Y growth Adjusted EBITDA (Continuing Operations)
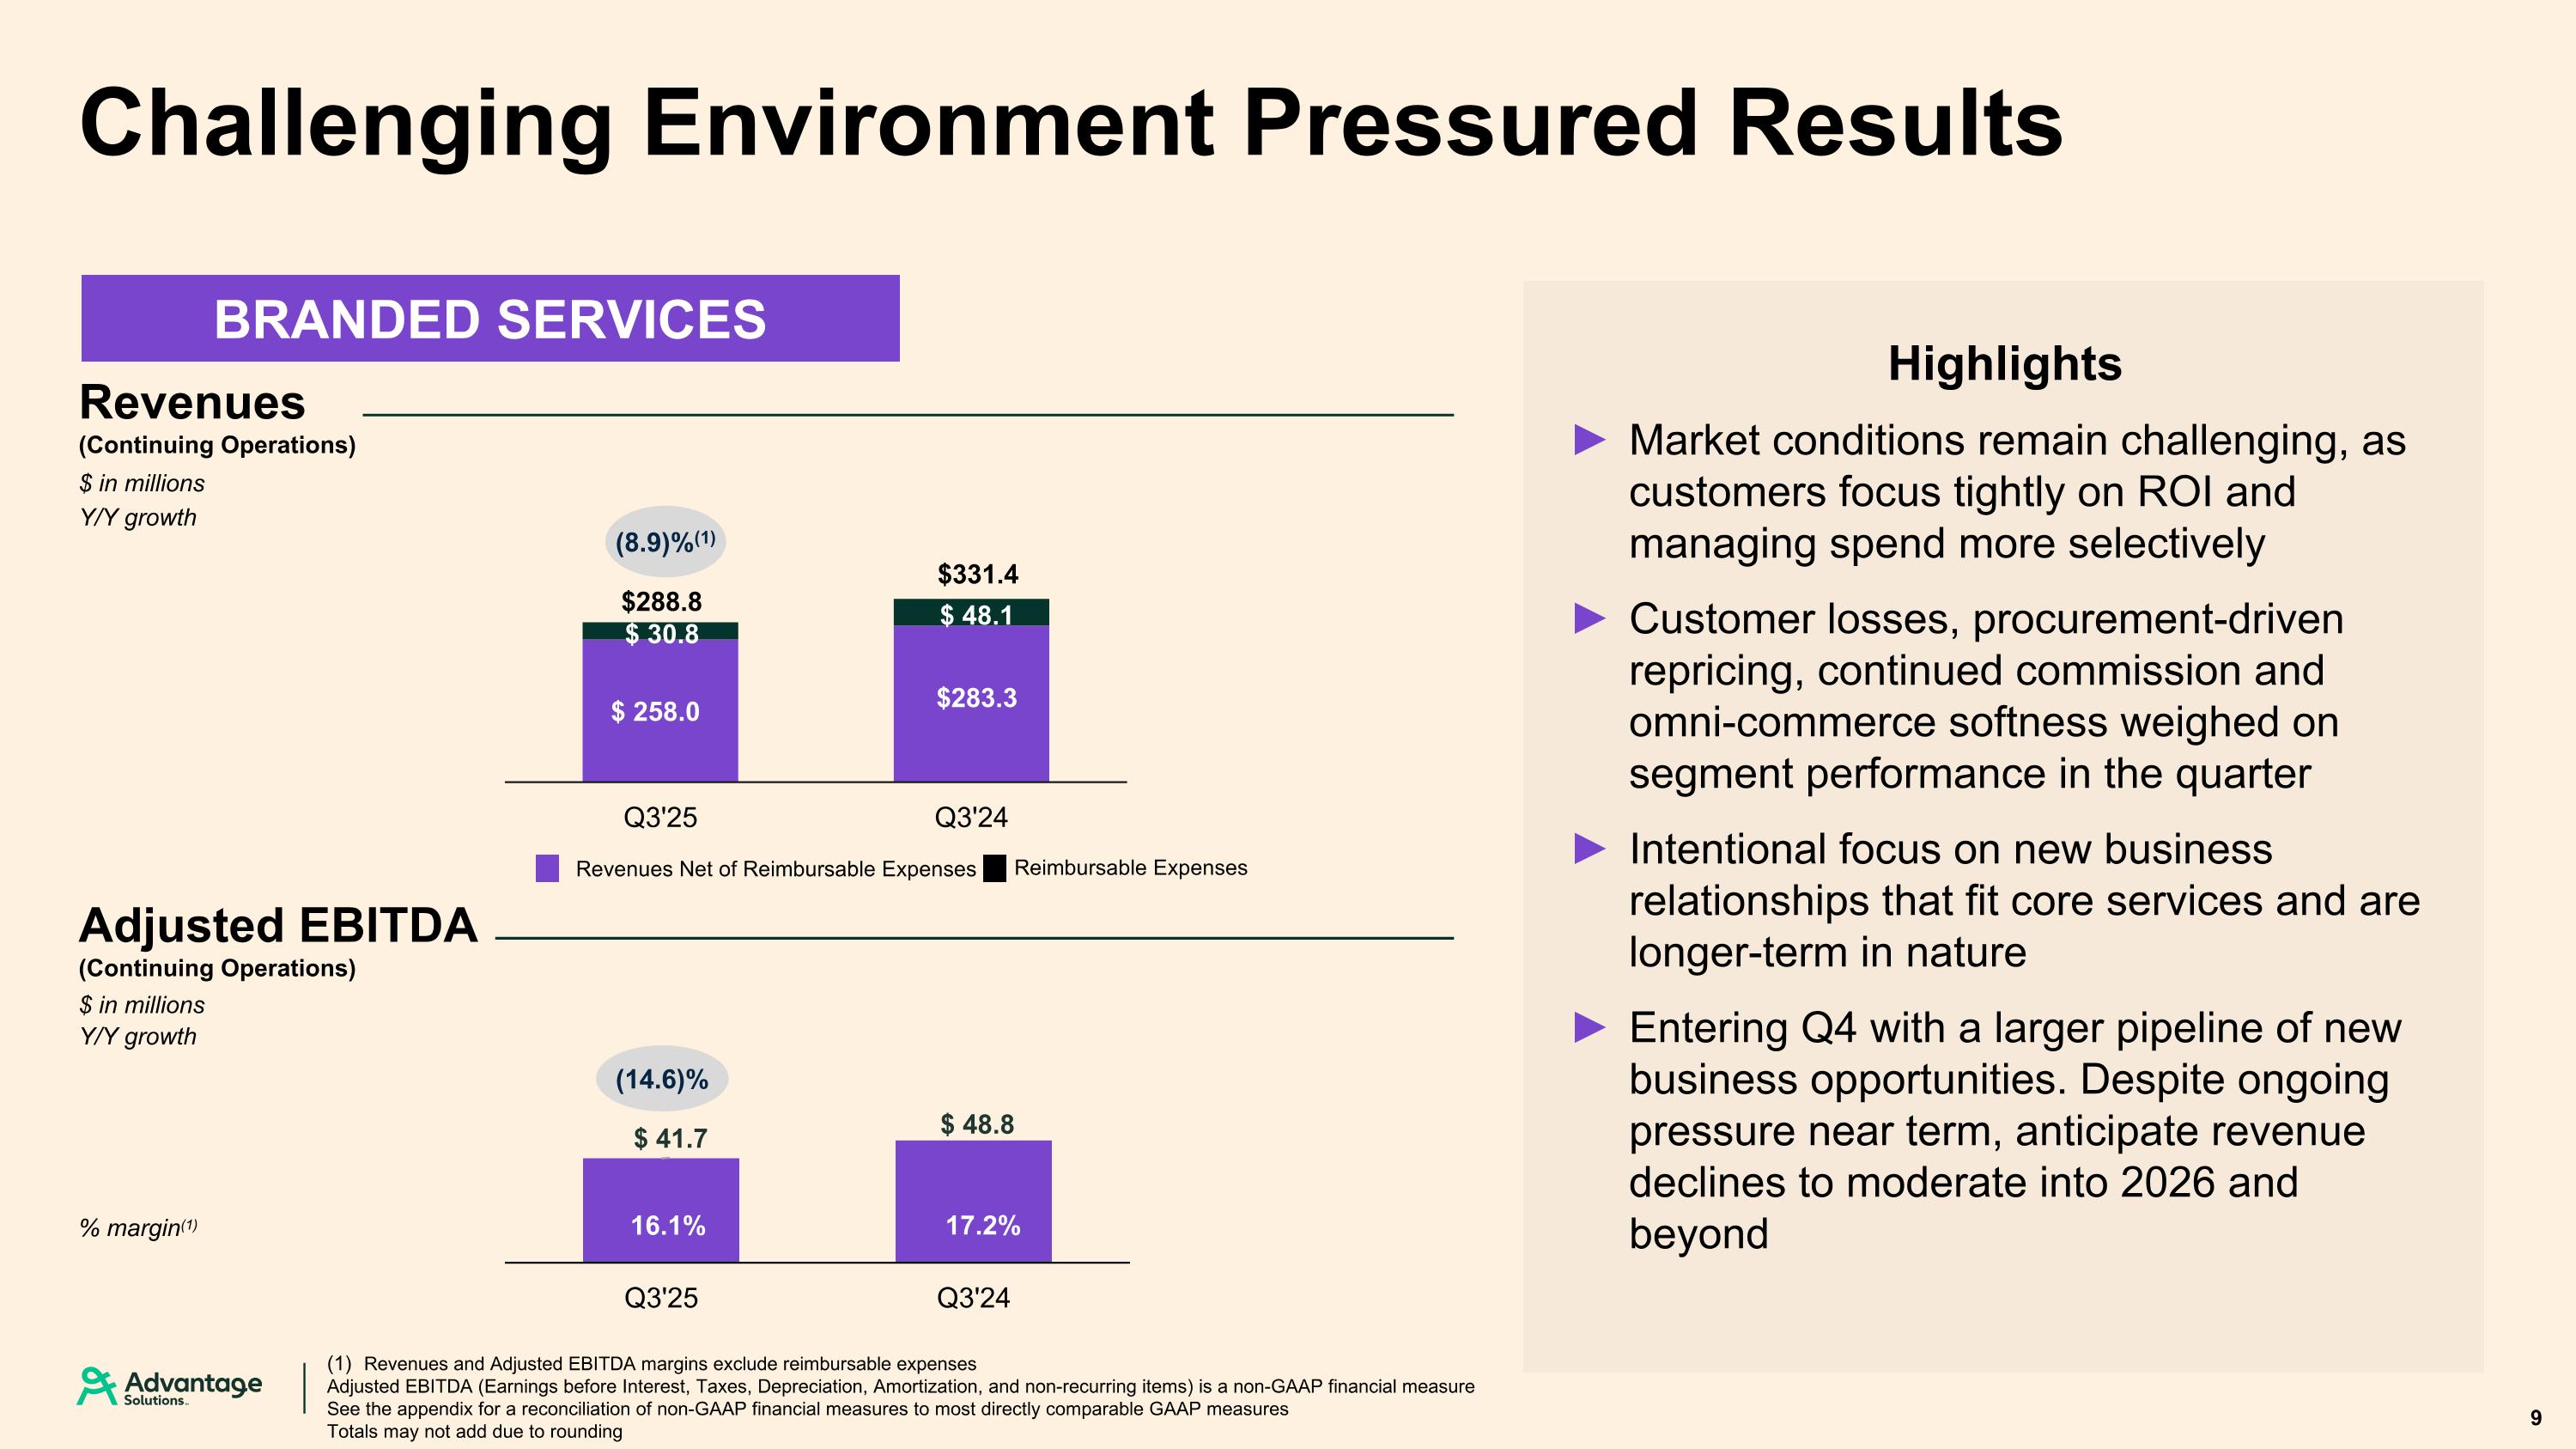
Revenues and Adjusted EBITDA margins exclude reimbursable expenses Adjusted EBITDA (Earnings before Interest, Taxes, Depreciation, Amortization, and non-recurring items) is a non-GAAP financial measure See the appendix for a reconciliation of non-GAAP financial measures to most directly comparable GAAP measures Totals may not add due to rounding (14.6)% % margin(1) Challenging Environment Pressured Results Highlights $ in millions Y/Y growth Adjusted EBITDA (Continuing Operations) BRANDED SERVICES $288.8 $331.4 $ in millions Y/Y growth 9 Revenues (Continuing Operations) Market conditions remain challenging, as customers focus tightly on ROI and managing spend more selectively Customer losses, procurement-driven repricing, continued commission and omni-commerce softness weighed on segment performance in the quarter Intentional focus on new business relationships that fit core services and are longer-term in nature Entering Q4 with a larger pipeline of new business opportunities. Despite ongoing pressure near term, anticipate revenue declines to moderate into 2026 and beyond Revenues Net of Reimbursable Expenses Reimbursable Expenses (8.9)%(1)
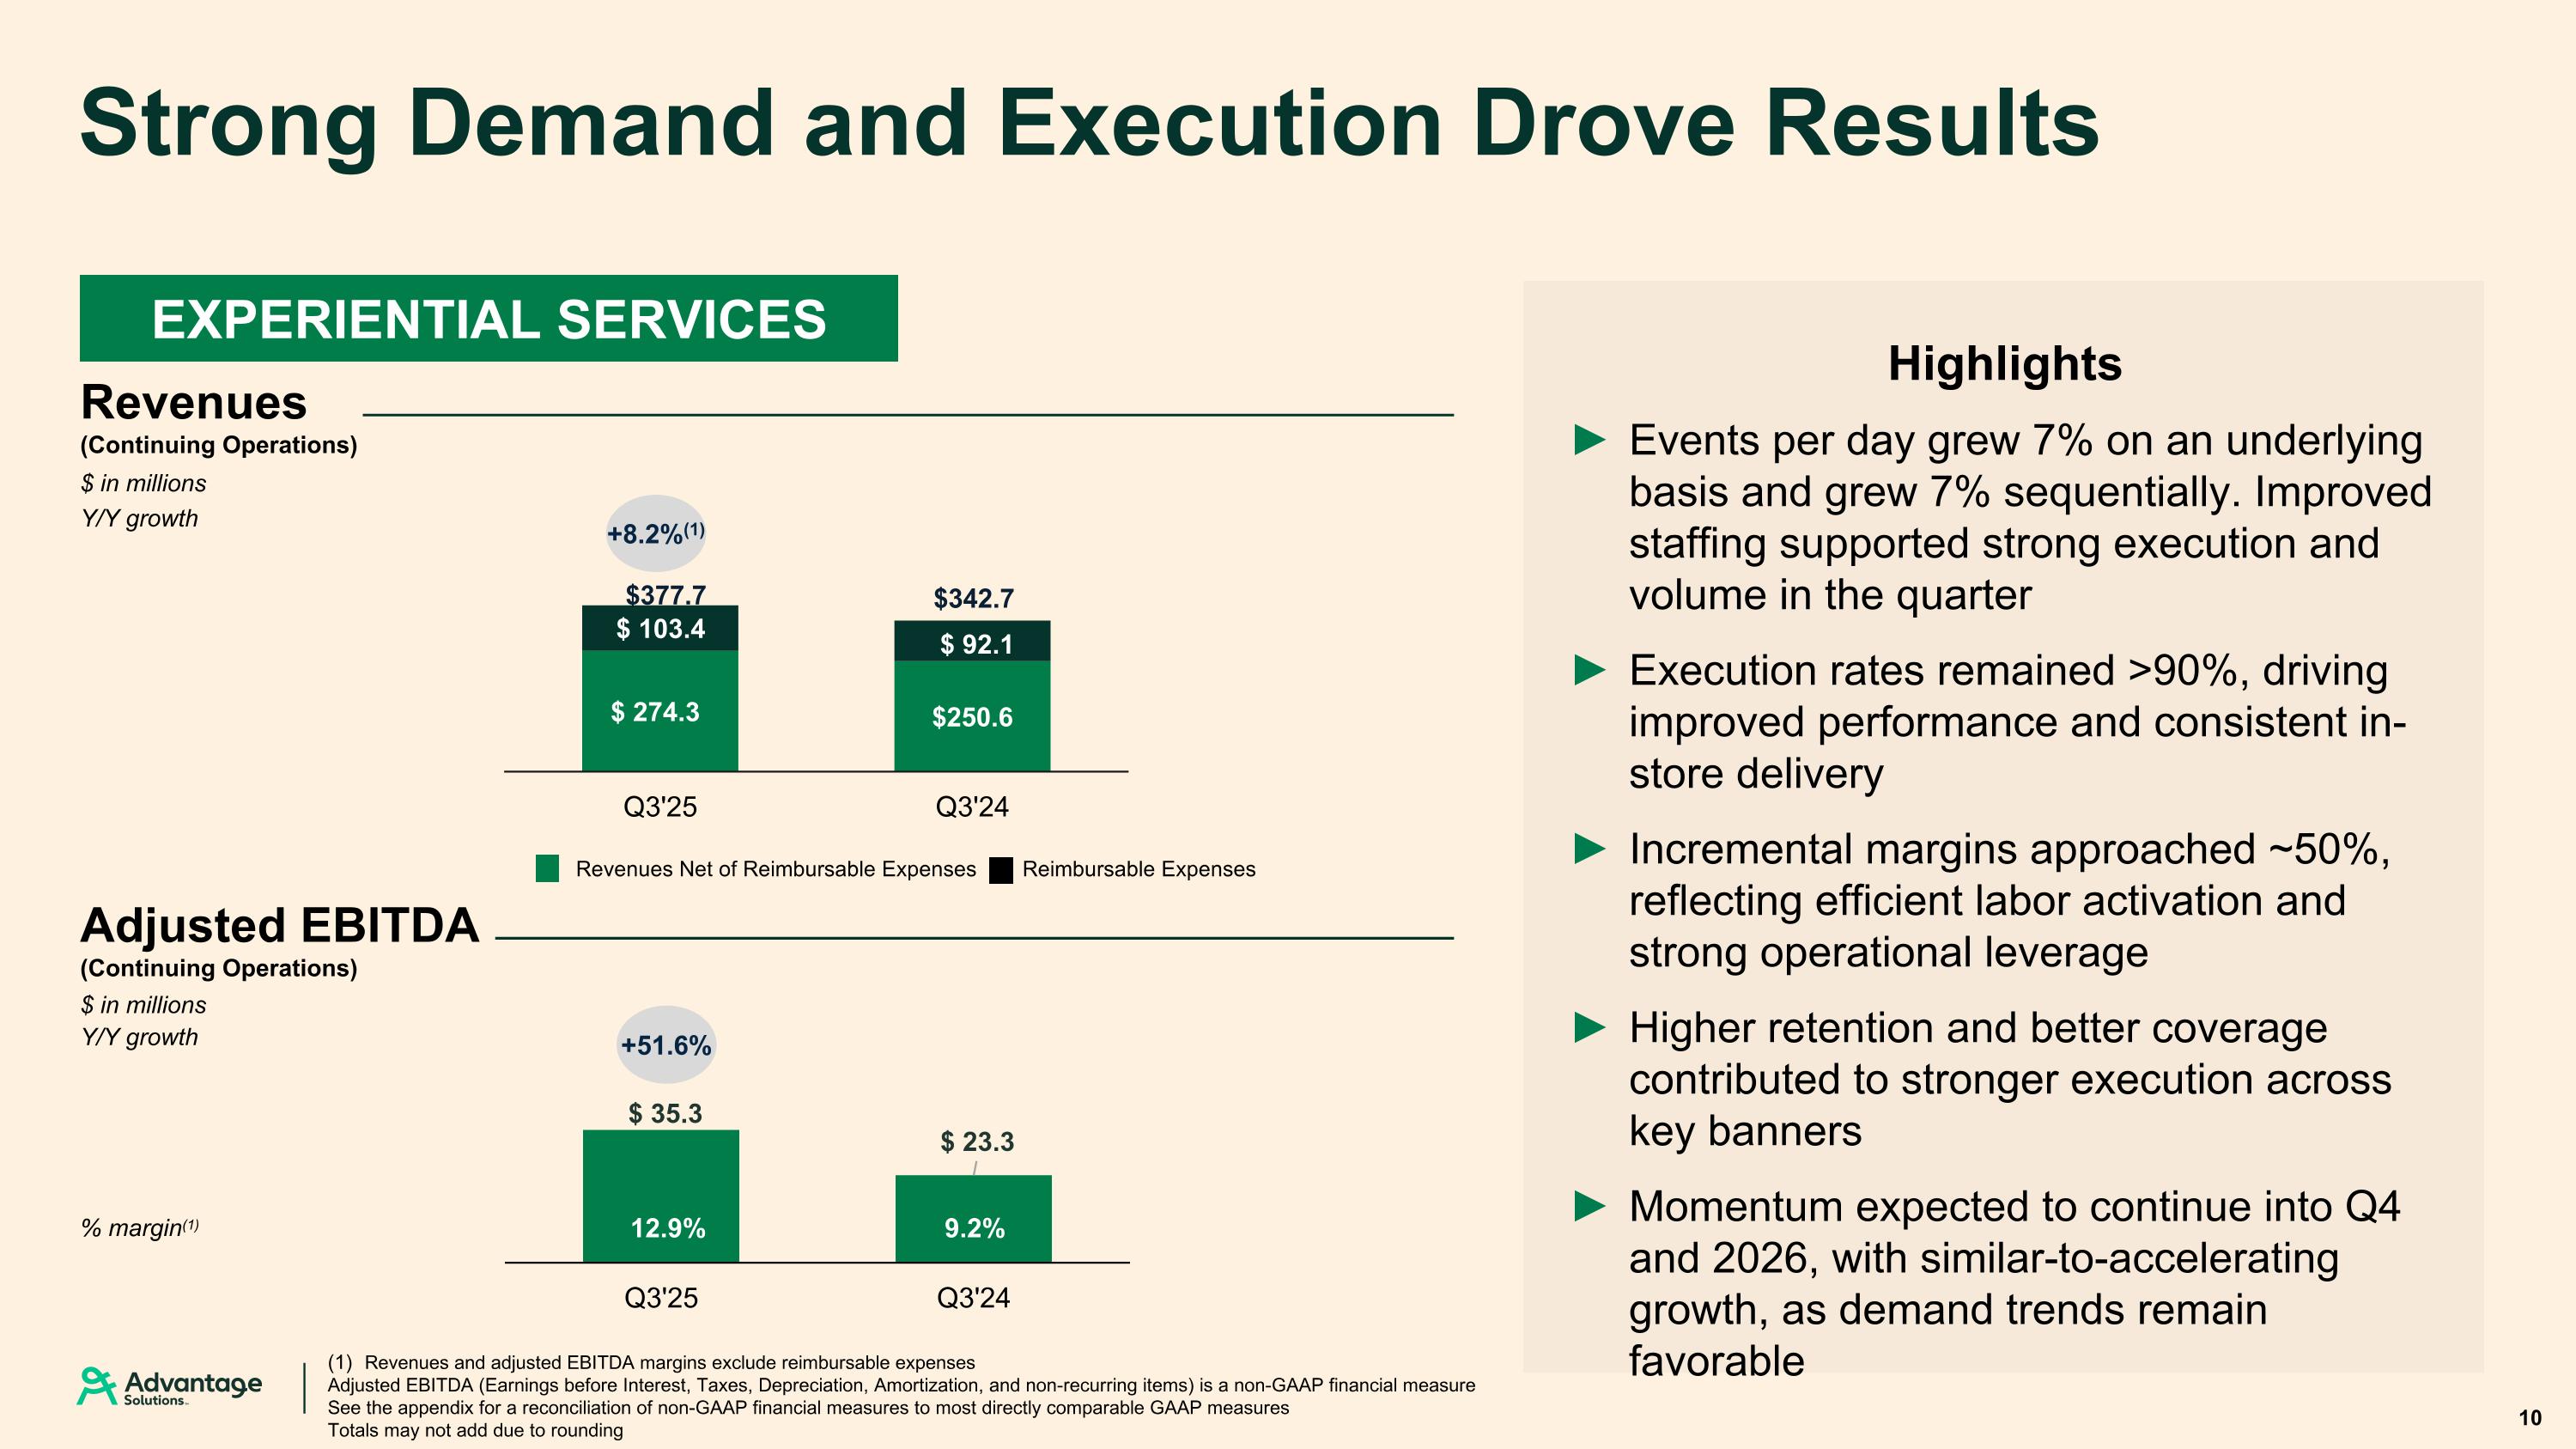
Revenues and adjusted EBITDA margins exclude reimbursable expenses Adjusted EBITDA (Earnings before Interest, Taxes, Depreciation, Amortization, and non-recurring items) is a non-GAAP financial measure See the appendix for a reconciliation of non-GAAP financial measures to most directly comparable GAAP measures Totals may not add due to rounding +8.2%(1) +51.6% % margin(1) Strong Demand and Execution Drove Results Adjusted EBITDA (Continuing Operations) $377.7 $342.7 $ in millions Y/Y growth $ in millions Y/Y growth 10 EXPERIENTIAL SERVICES Highlights Revenues (Continuing Operations) Events per day grew 7% on an underlying basis and grew 7% sequentially. Improved staffing supported strong execution and volume in the quarter Execution rates remained >90%, driving improved performance and consistent in-store delivery Incremental margins approached ~50%, reflecting efficient labor activation and strong operational leverage Higher retention and better coverage contributed to stronger execution across key banners Momentum expected to continue into Q4 and 2026, with similar-to-accelerating growth, as demand trends remain favorable Revenues Net of Reimbursable Expenses Reimbursable Expenses
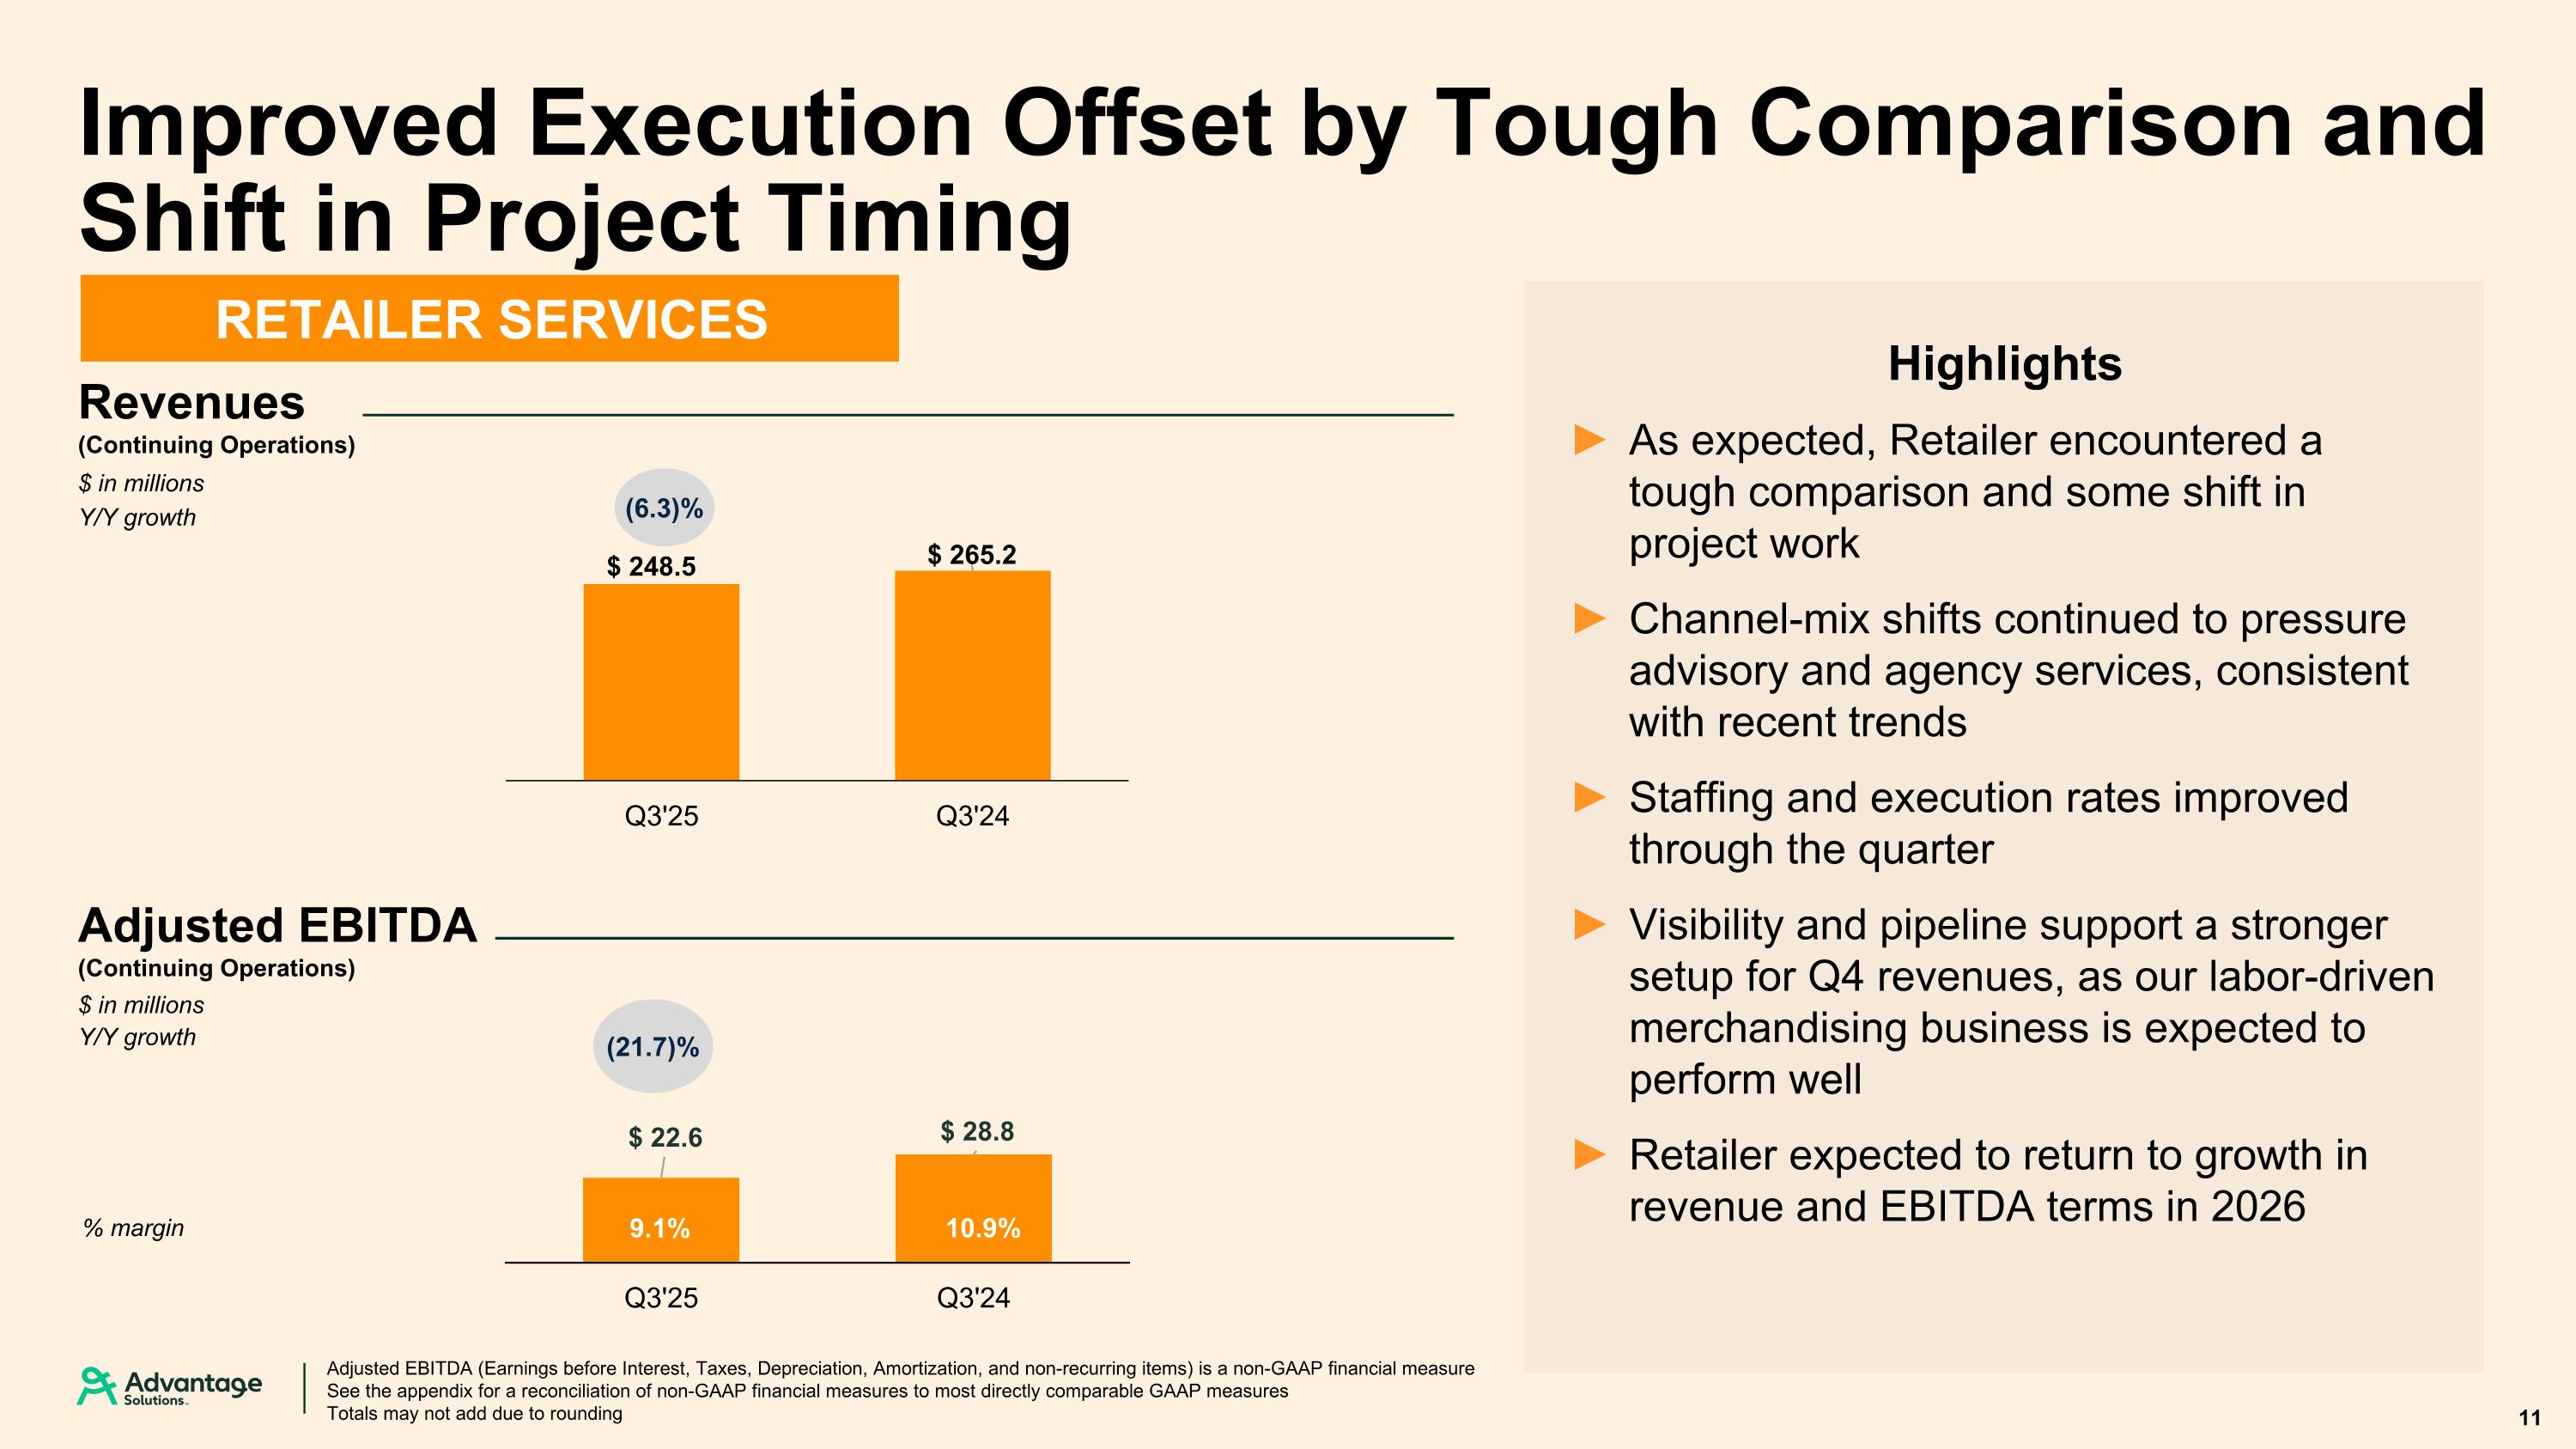
Adjusted EBITDA (Earnings before Interest, Taxes, Depreciation, Amortization, and non-recurring items) is a non-GAAP financial measure See the appendix for a reconciliation of non-GAAP financial measures to most directly comparable GAAP measures Totals may not add due to rounding (21.7)% (6.3)% % margin Improved Execution Offset by Tough Comparison and Shift in Project Timing Adjusted EBITDA (Continuing Operations) 11 $ in millions Y/Y growth $ in millions Y/Y growth RETAILER SERVICES Highlights Revenues (Continuing Operations) As expected, Retailer encountered a tough comparison and some shift in project work Channel-mix shifts continued to pressure advisory and agency services, consistent with recent trends Staffing and execution rates improved through the quarter Visibility and pipeline support a stronger setup for Q4 revenues, as our labor-driven merchandising business is expected to perform well Retailer expected to return to growth in revenue and EBITDA terms in 2026
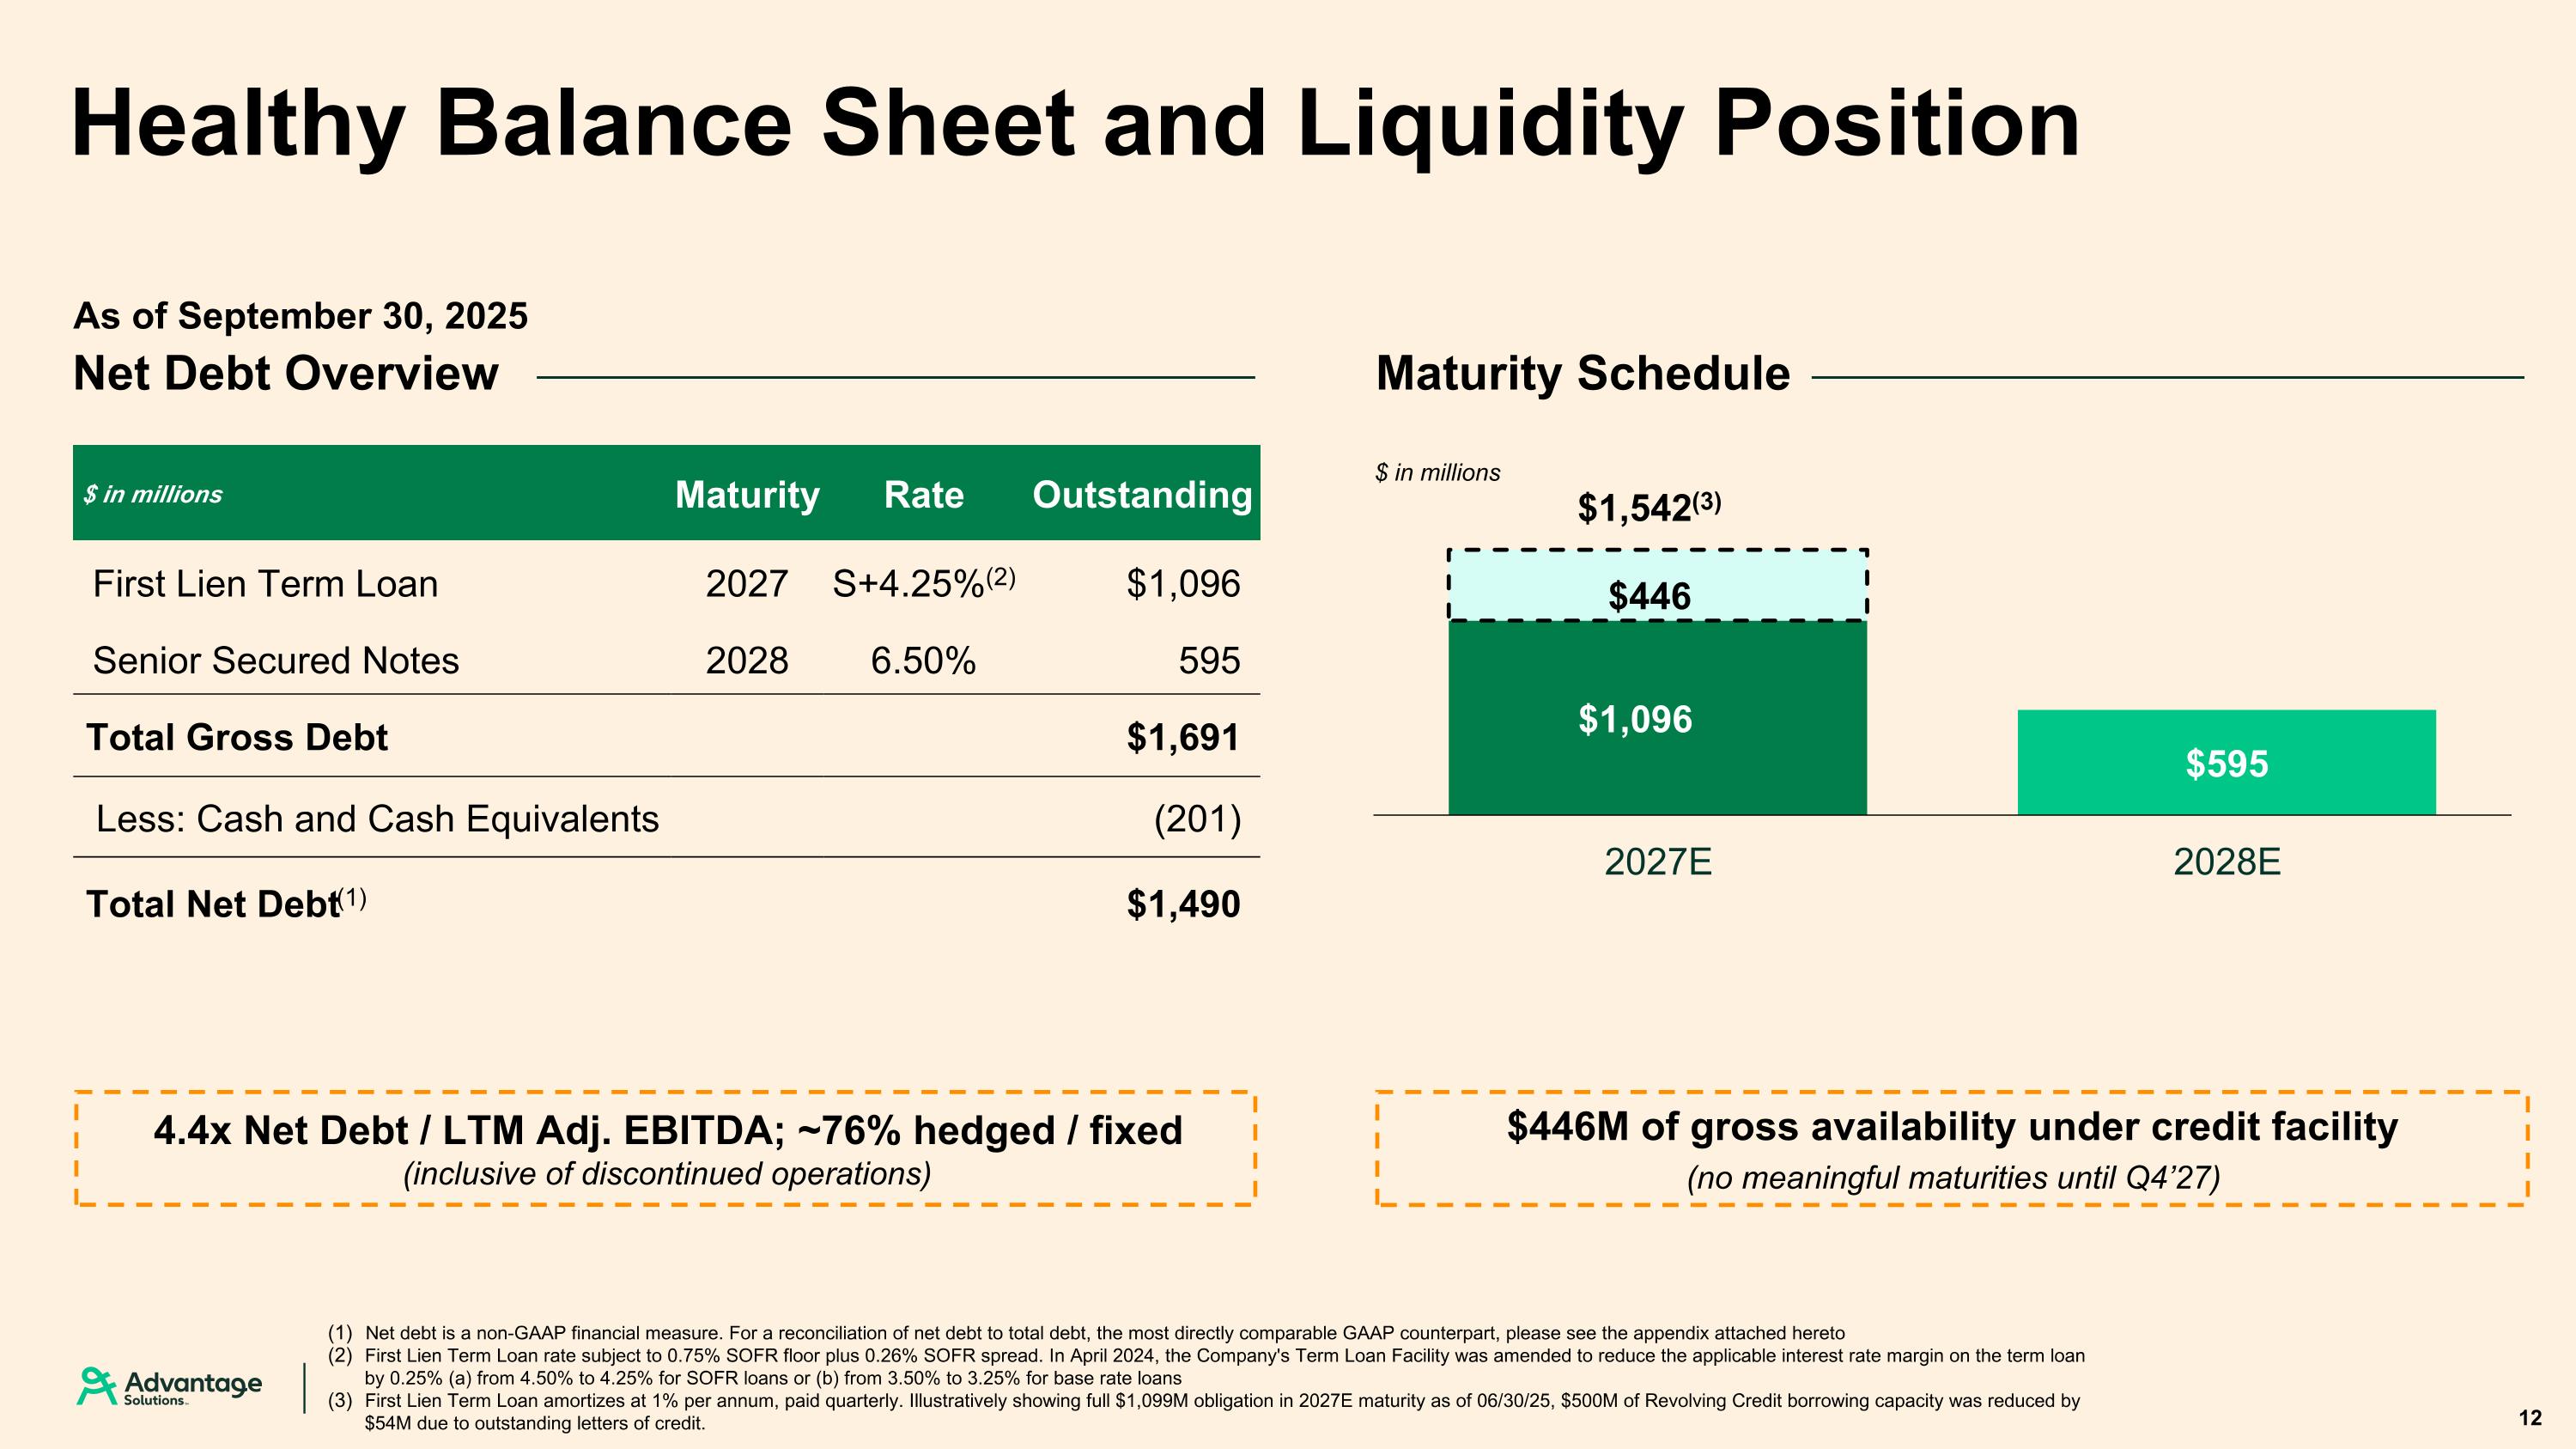
1L Term Loan Sr. Secured Notes $ in millions $1,542(3) Healthy Balance Sheet and Liquidity Position As of September 30, 2025 $ in millions Maturity Rate Outstanding First Lien Term Loan 2027 S+4.25%(2) $1,096 Senior Secured Notes 2028 6.50% 595 Total Gross Debt $1,691 Less: Cash and Cash Equivalents (201) Total Net Debt(1) $1,490 Net Debt Overview Maturity Schedule Net debt is a non-GAAP financial measure. For a reconciliation of net debt to total debt, the most directly comparable GAAP counterpart, please see the appendix attached hereto First Lien Term Loan rate subject to 0.75% SOFR floor plus 0.26% SOFR spread. In April 2024, the Company's Term Loan Facility was amended to reduce the applicable interest rate margin on the term loan by 0.25% (a) from 4.50% to 4.25% for SOFR loans or (b) from 3.50% to 3.25% for base rate loans First Lien Term Loan amortizes at 1% per annum, paid quarterly. Illustratively showing full $1,099M obligation in 2027E maturity as of 06/30/25, $500M of Revolving Credit borrowing capacity was reduced by $54M due to outstanding letters of credit. 12 $446M of gross availability under credit facility (no meaningful maturities until Q4’27) 4.4x Net Debt / LTM Adj. EBITDA; ~76% hedged / fixed (inclusive of discontinued operations) $446
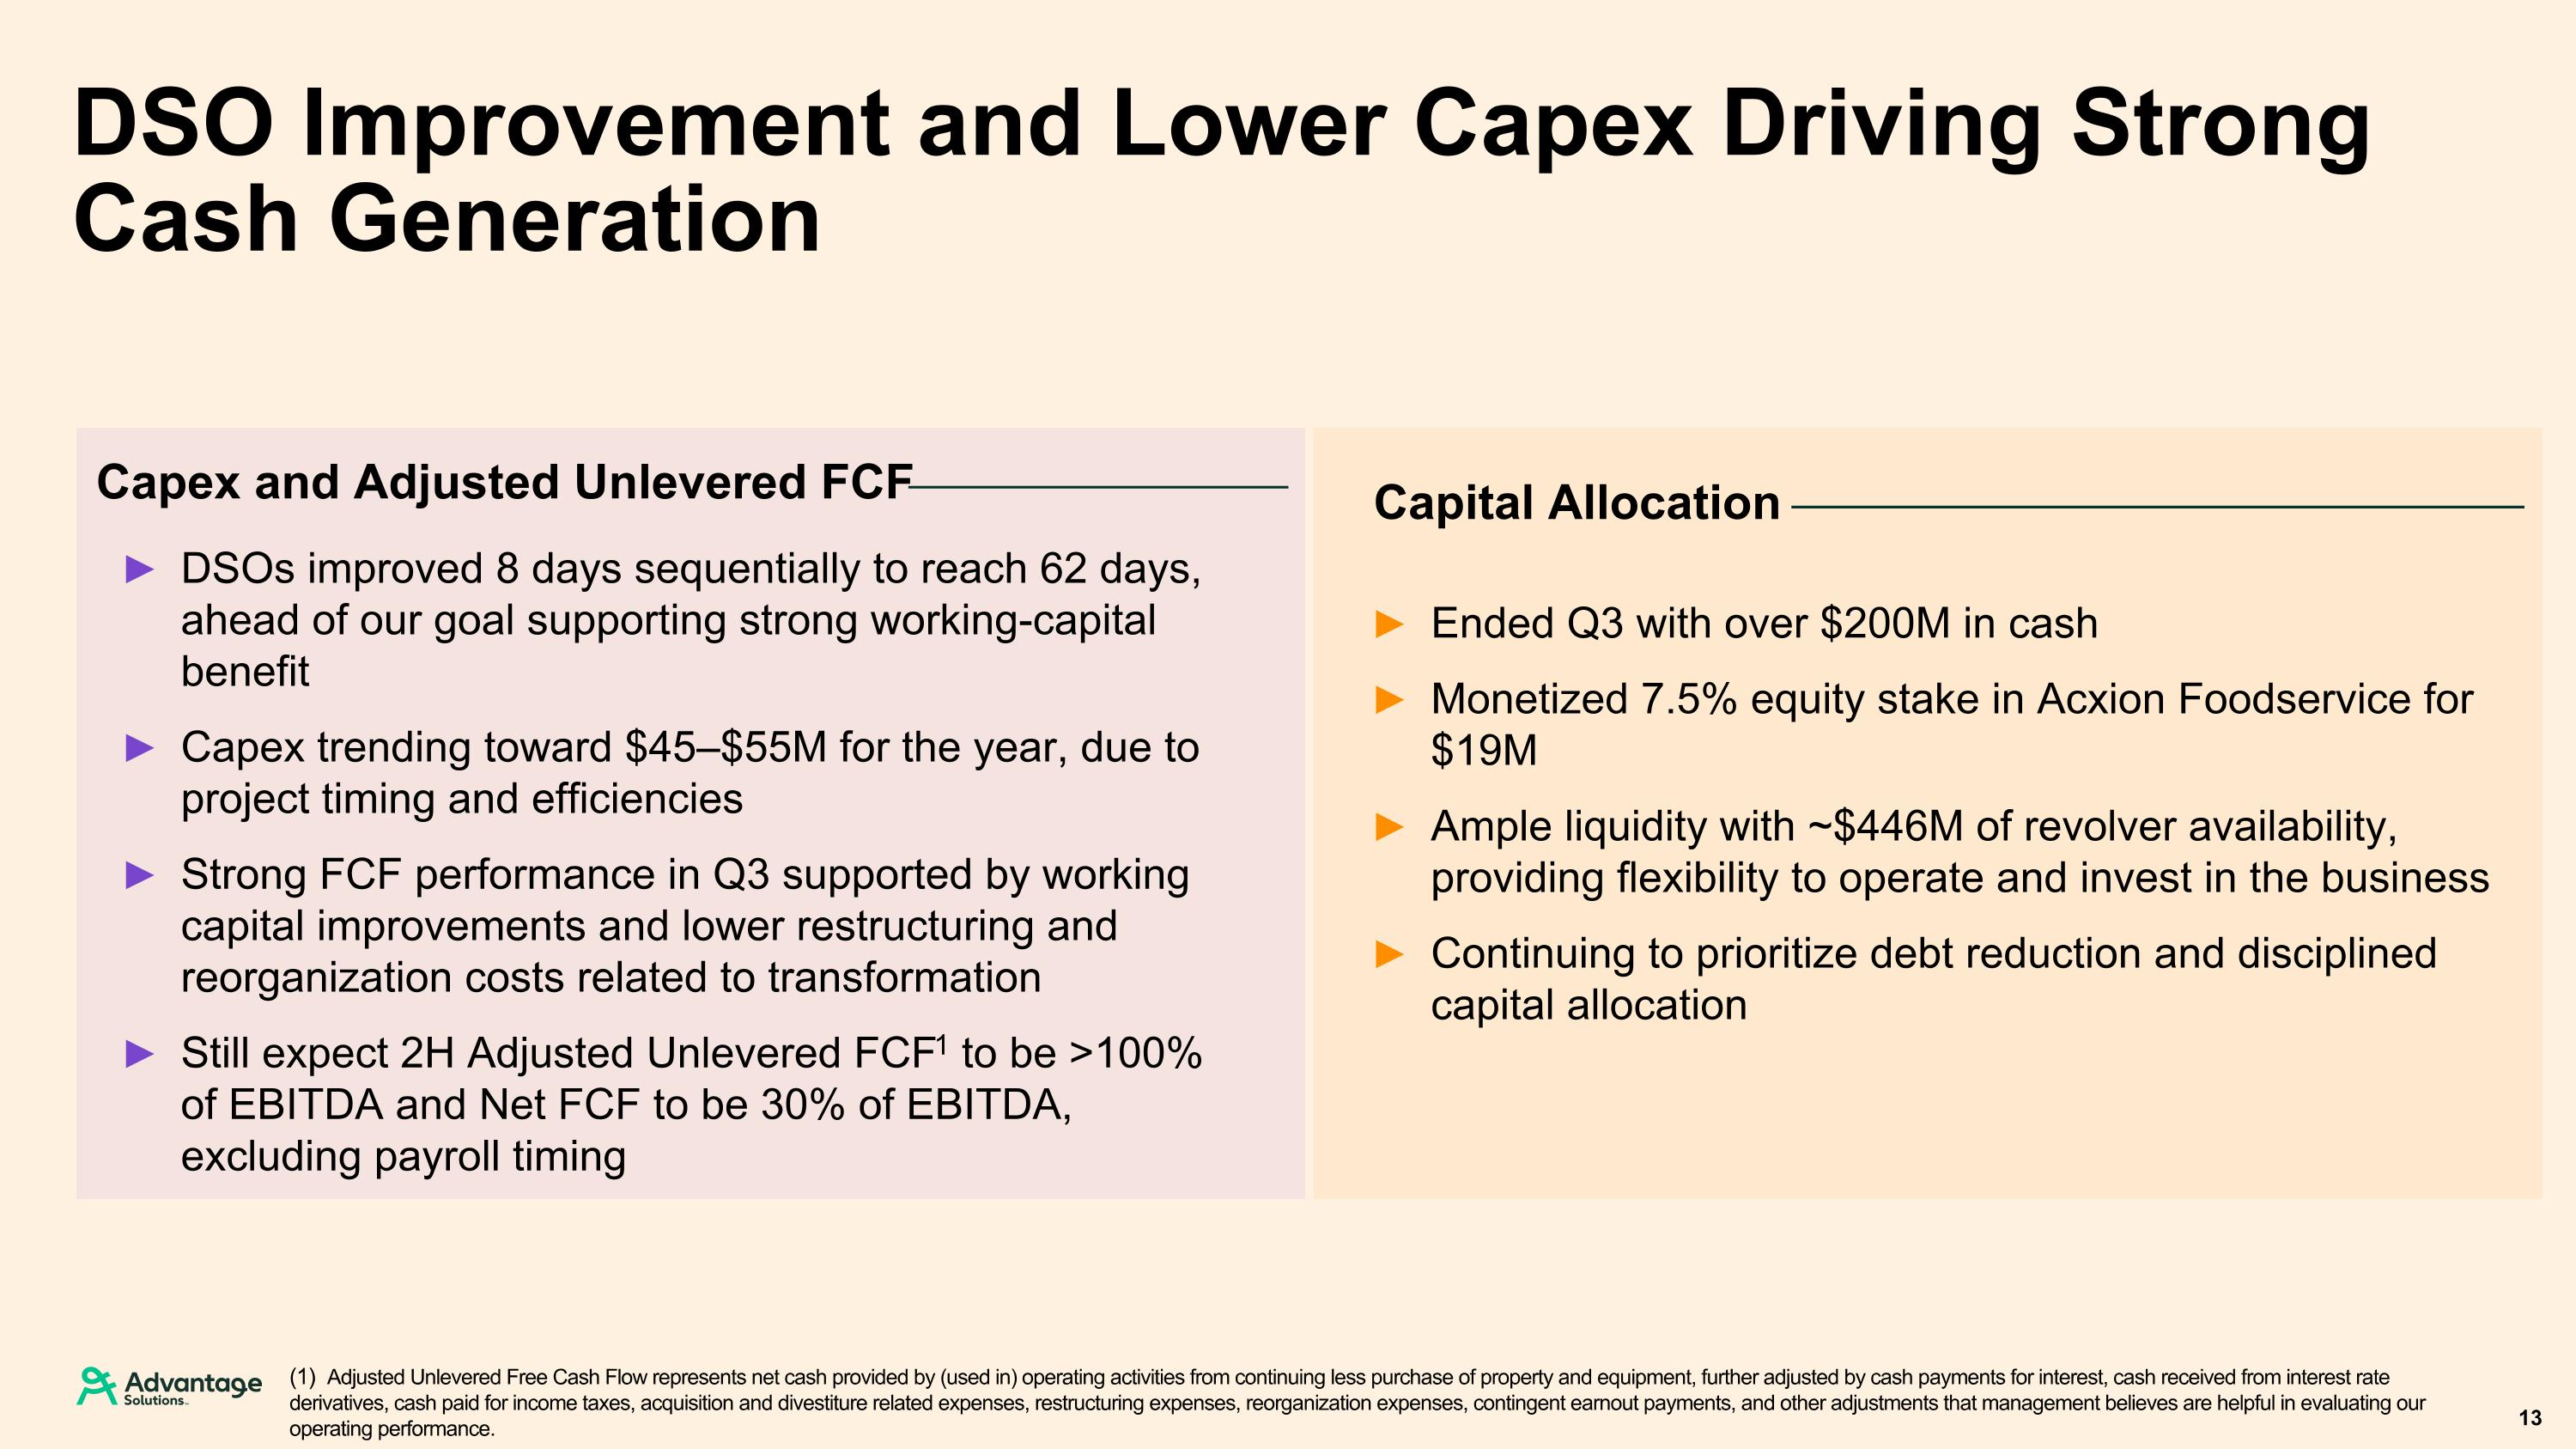
DSO Improvement and Lower Capex Driving Strong Cash Generation Capital Allocation Ended Q3 with over $200M in cash Monetized 7.5% equity stake in Acxion Foodservice for $19M Ample liquidity with ~$446M of revolver availability, providing flexibility to operate and invest in the business Continuing to prioritize debt reduction and disciplined capital allocation Capex and Adjusted Unlevered FCF DSOs improved 8 days sequentially to reach 62 days, ahead of our goal supporting strong working-capital benefit Capex trending toward $45–$55M for the year, due to project timing and efficiencies Strong FCF performance in Q3 supported by working capital improvements and lower restructuring and reorganization costs related to transformation Still expect 2H Adjusted Unlevered FCF1 to be >100% of EBITDA and Net FCF to be 30% of EBITDA, excluding payroll timing 13 Adjusted Unlevered Free Cash Flow represents net cash provided by (used in) operating activities from continuing less purchase of property and equipment, further adjusted by cash payments for interest, cash received from interest rate derivatives, cash paid for income taxes, acquisition and divestiture related expenses, restructuring expenses, reorganization expenses, contingent earnout payments, and other adjustments that management believes are helpful in evaluating our operating performance.
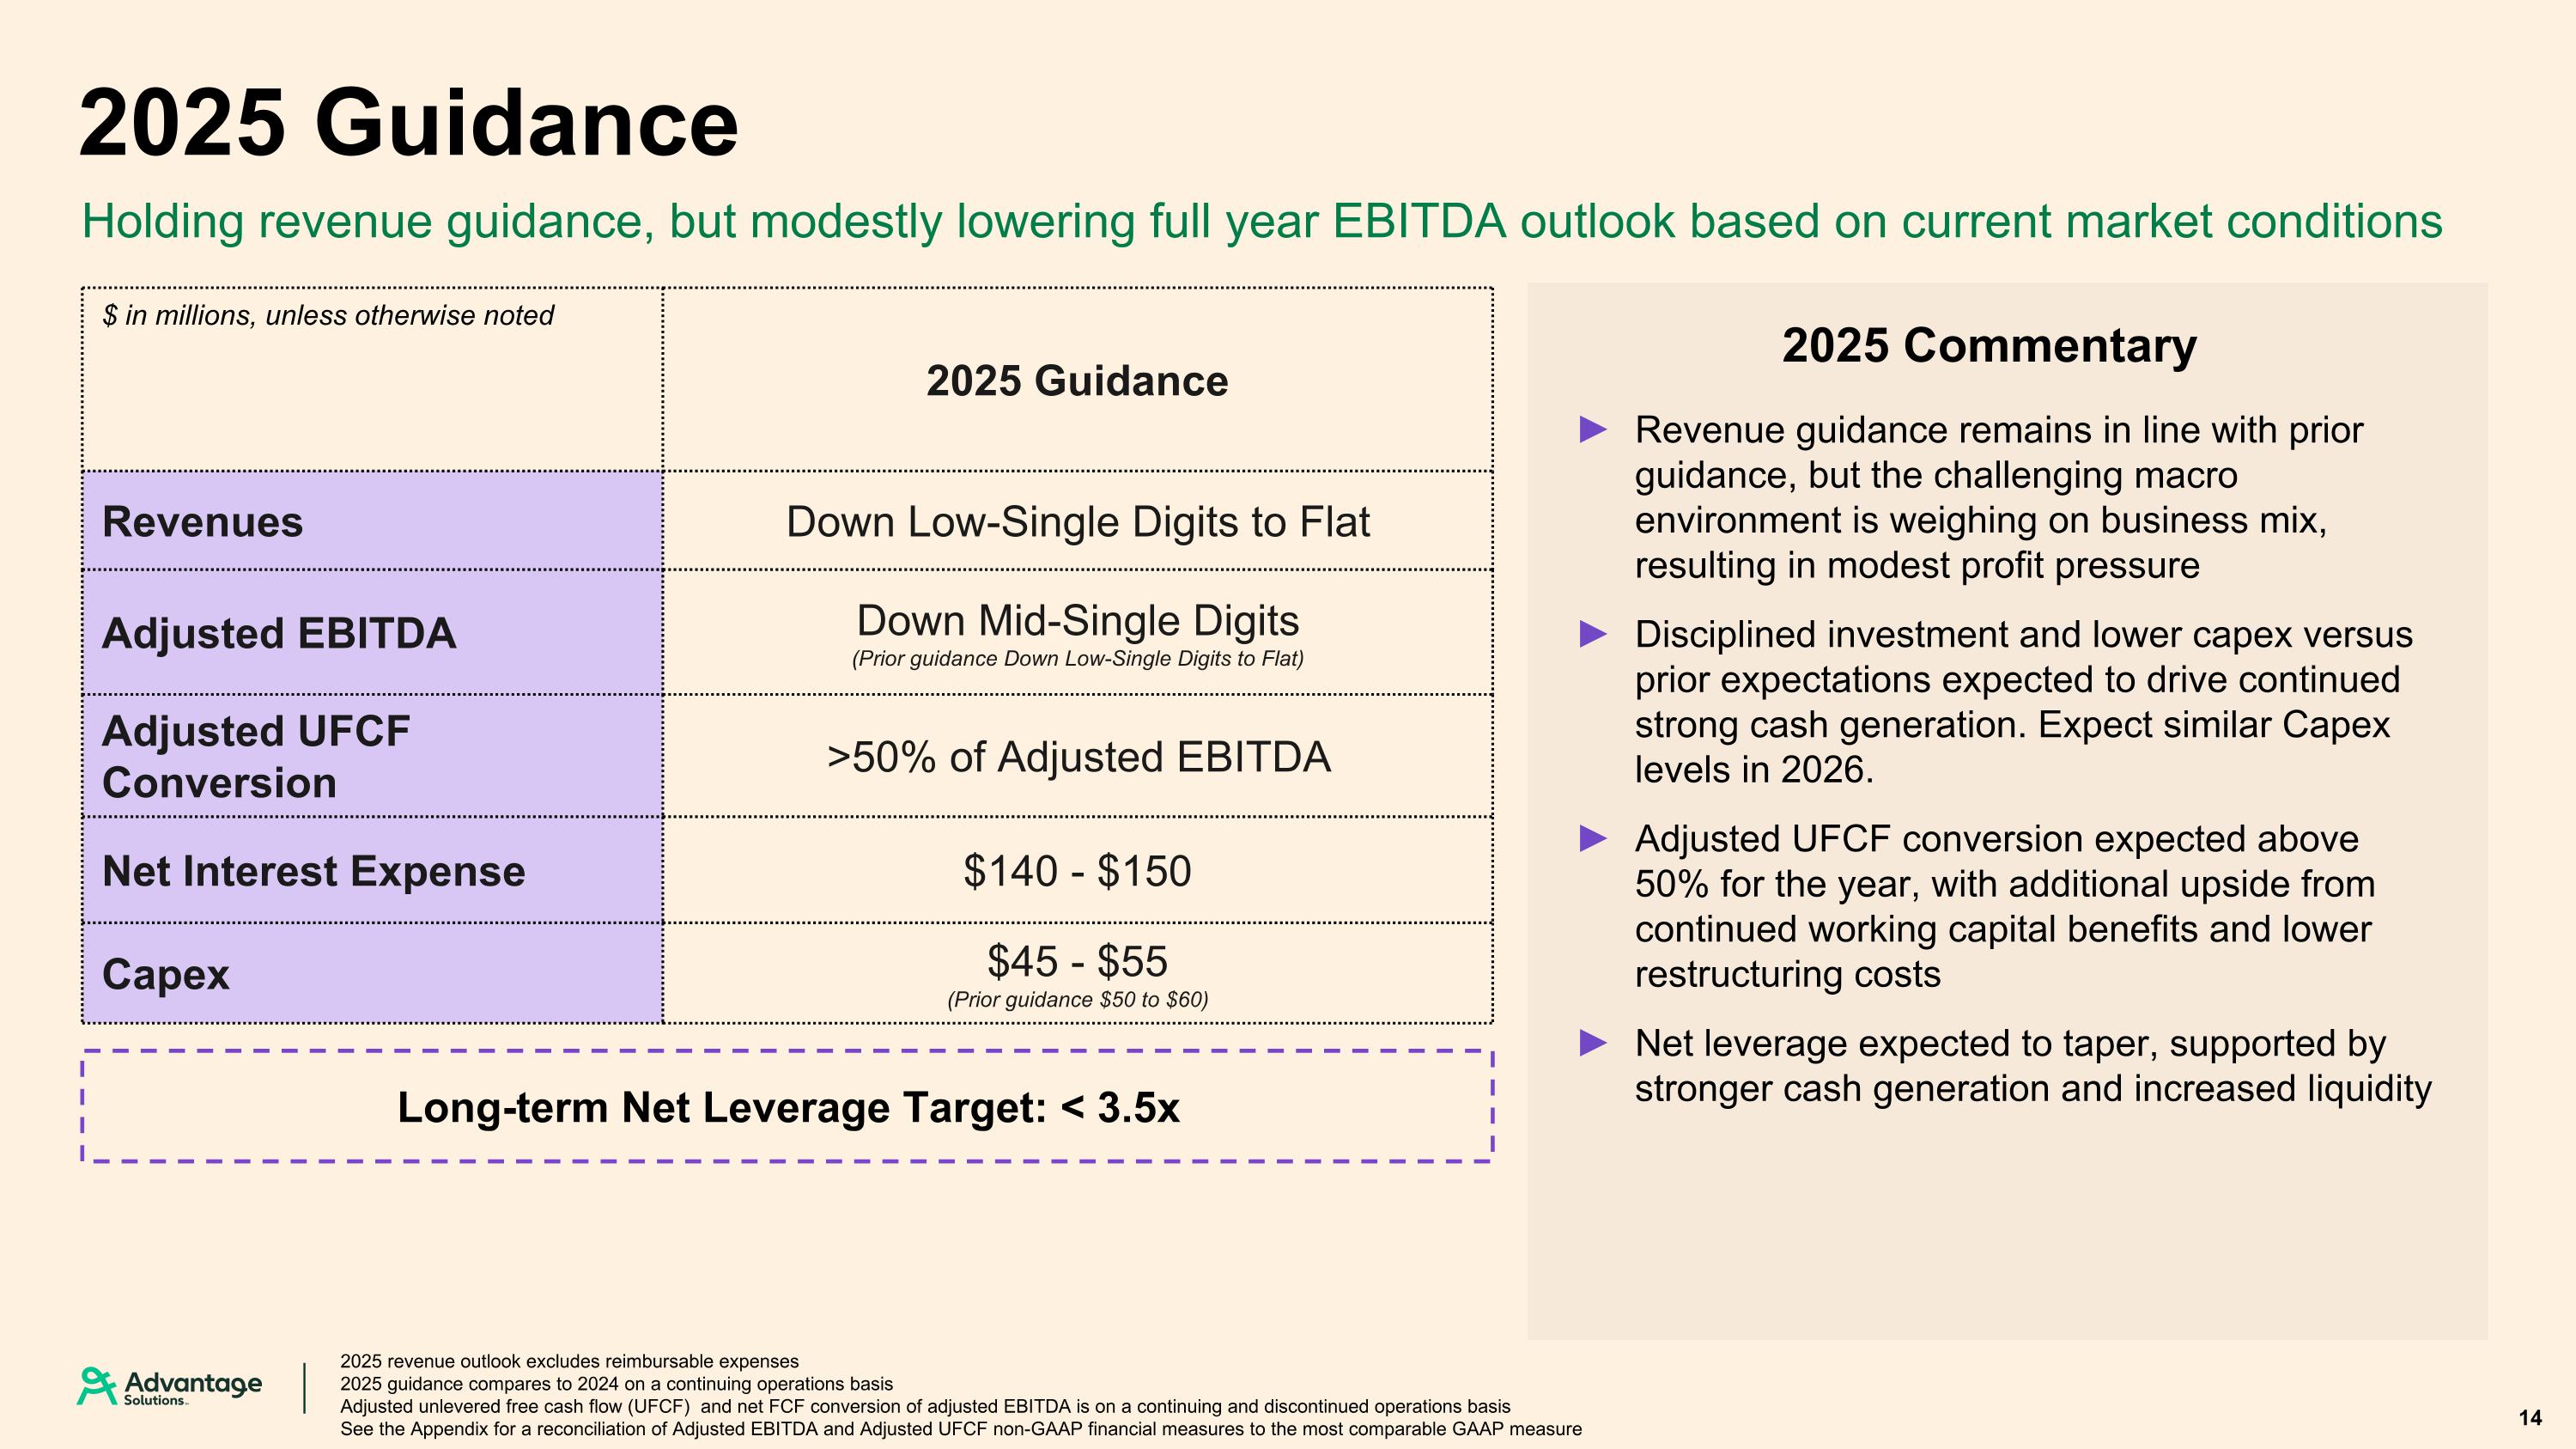
2025 Guidance Holding revenue guidance, but modestly lowering full year EBITDA outlook based on current market conditions $ in millions, unless otherwise noted 2025 Guidance Revenues Down Low-Single Digits to Flat Adjusted EBITDA Down Mid-Single Digits (Prior guidance Down Low-Single Digits to Flat) Adjusted UFCF Conversion >50% of Adjusted EBITDA Net Interest Expense $140 - $150 Capex $45 - $55 (Prior guidance $50 to $60) 2025 revenue outlook excludes reimbursable expenses 2025 guidance compares to 2024 on a continuing operations basis Adjusted unlevered free cash flow (UFCF) and net FCF conversion of adjusted EBITDA is on a continuing and discontinued operations basis See the Appendix for a reconciliation of Adjusted EBITDA and Adjusted UFCF non-GAAP financial measures to the most comparable GAAP measure 14 Long-term Net Leverage Target: < 3.5x 2025 Commentary Revenue guidance remains in line with prior guidance, but the challenging macro environment is weighing on business mix, resulting in modest profit pressure Disciplined investment and lower capex versus prior expectations expected to drive continued strong cash generation. Expect similar Capex levels in 2026. Adjusted UFCF conversion expected above 50% for the year, with additional upside from continued working capital benefits and lower restructuring costs Net leverage expected to taper, supported by stronger cash generation and increased liquidity
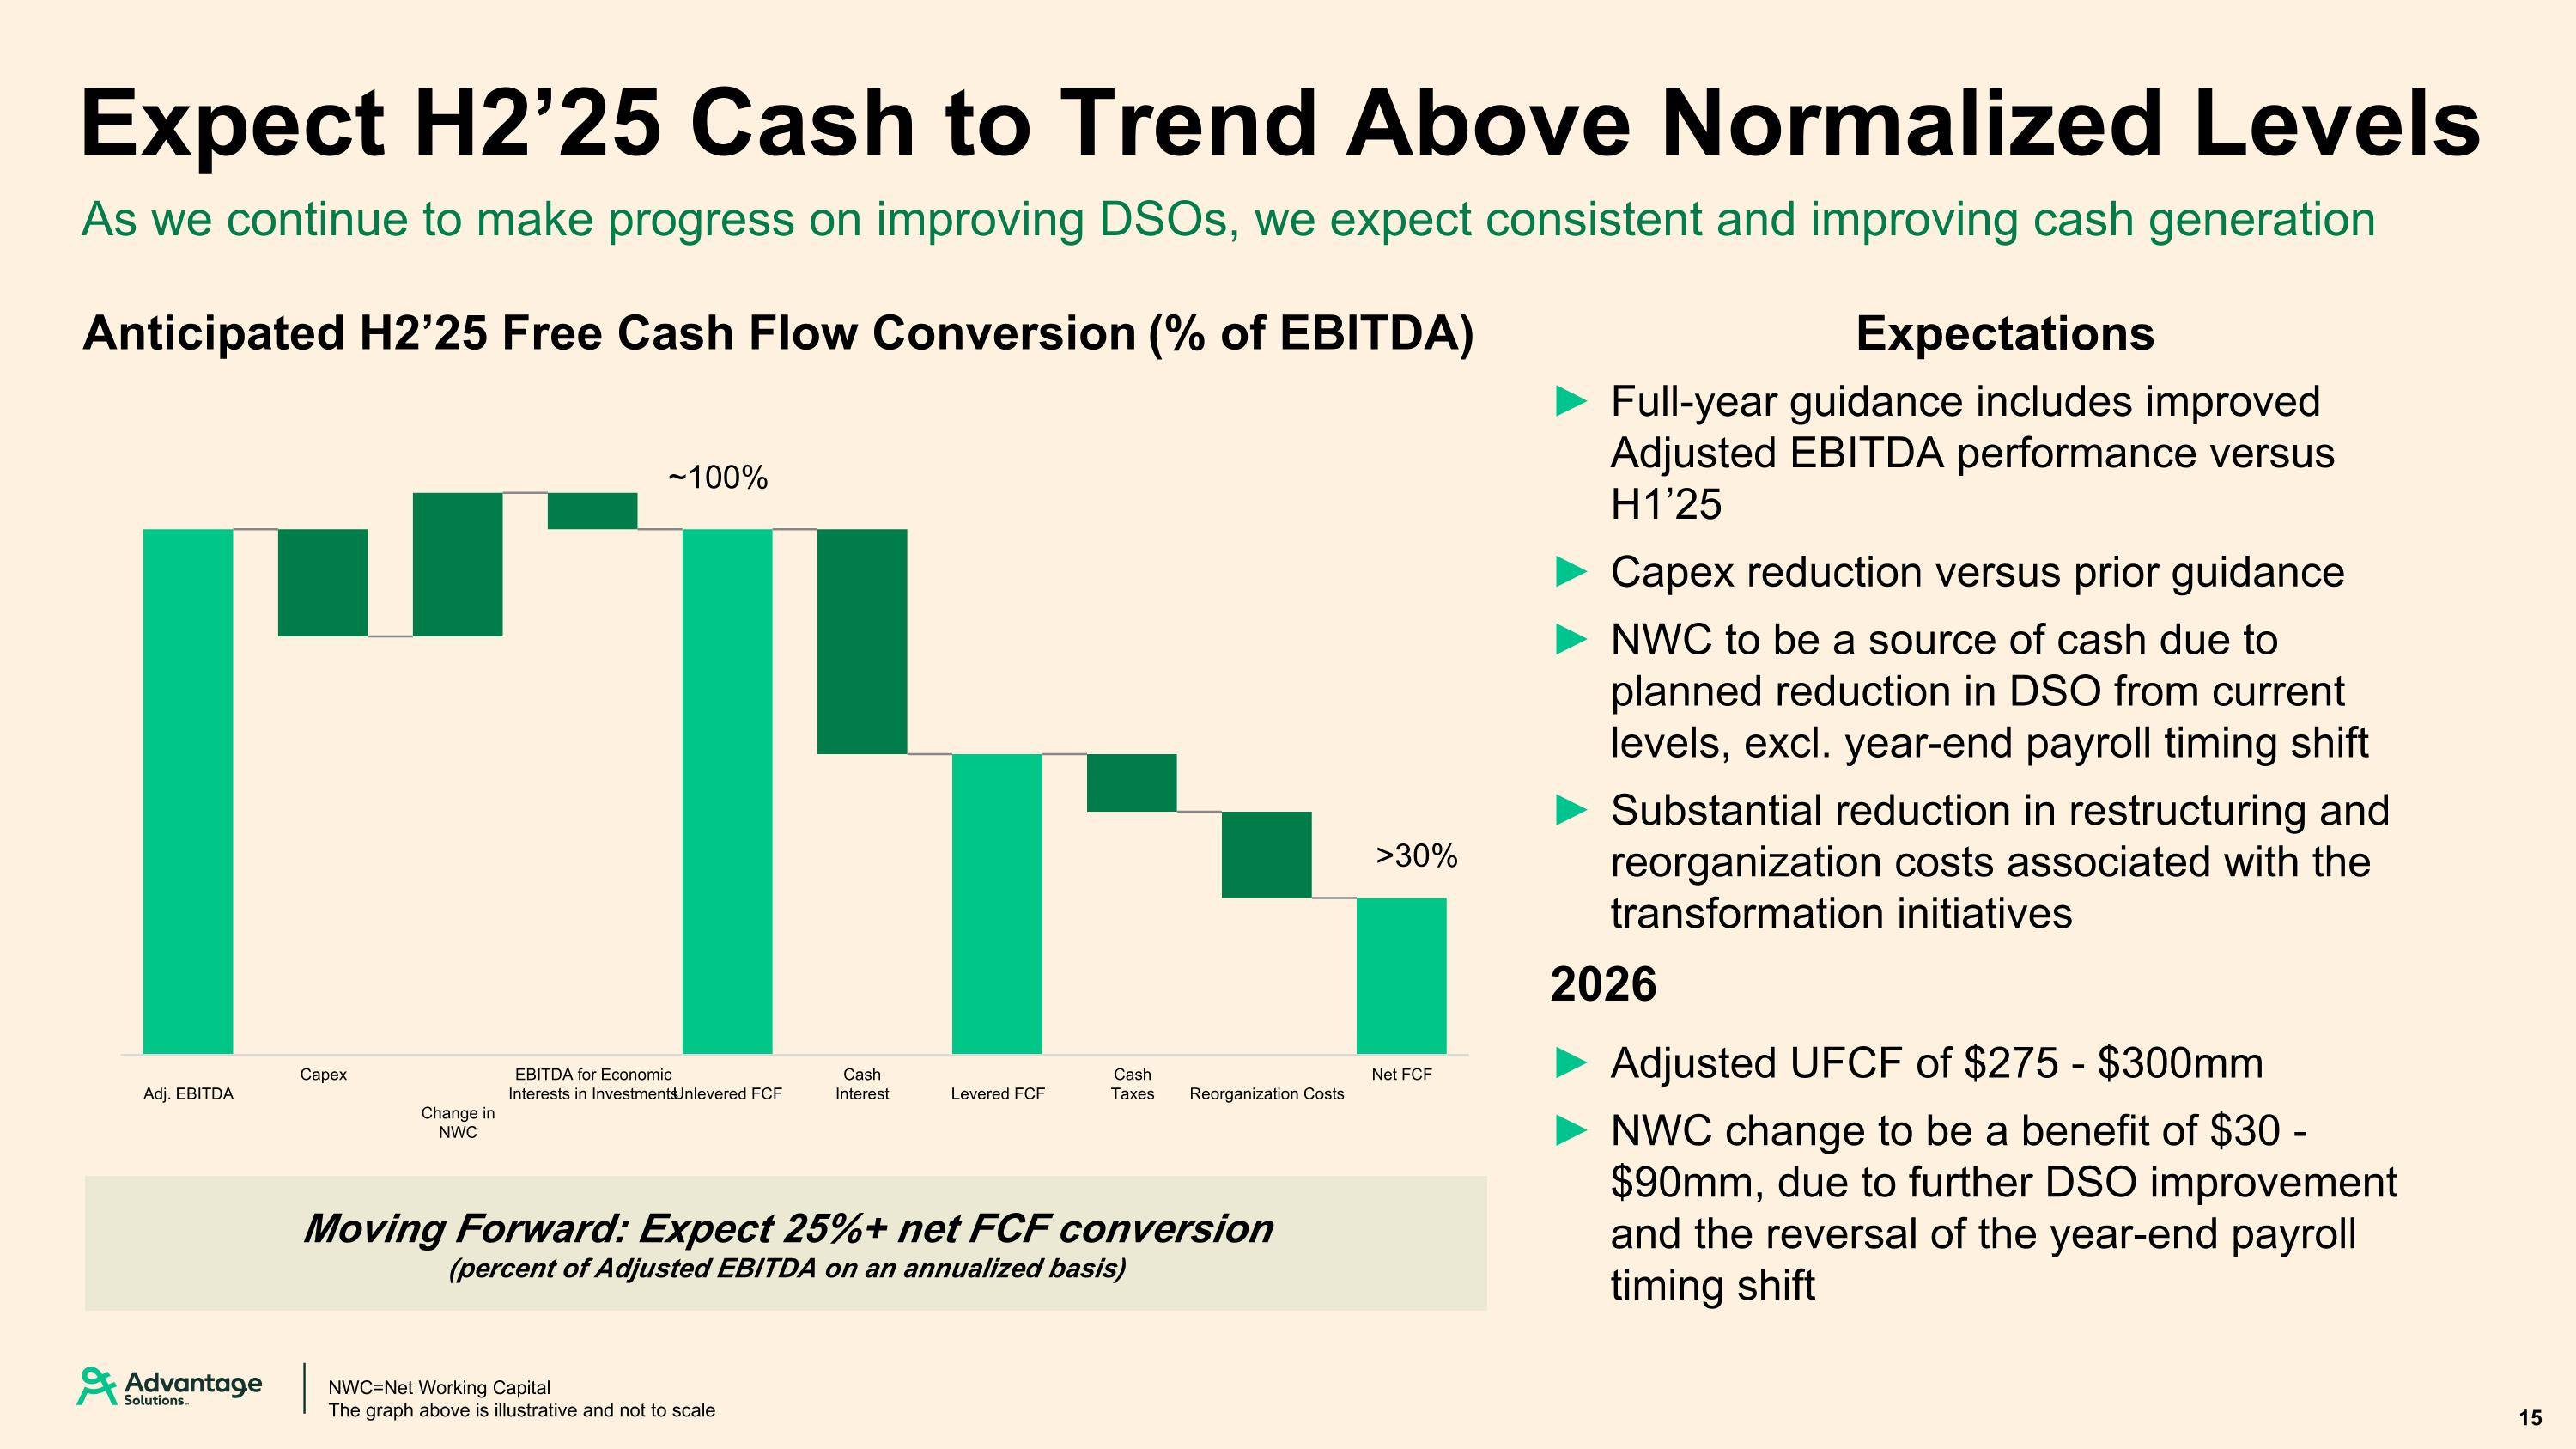
Anticipated H2’25 Free Cash Flow Conversion (% of EBITDA) Expect H2’25 Cash to Trend Above Normalized Levels ~100% >30% As we continue to make progress on improving DSOs, we expect consistent and improving cash generation Moving Forward: Expect 25%+ net FCF conversion (percent of Adjusted EBITDA on an annualized basis) 15 NWC=Net Working Capital The graph above is illustrative and not to scale Full-year guidance includes improved Adjusted EBITDA performance versus H1’25 Capex reduction versus prior guidance NWC to be a source of cash due to planned reduction in DSO from current levels, excl. year-end payroll timing shift Substantial reduction in restructuring and reorganization costs associated with the transformation initiatives 2026 Adjusted UFCF of $275 - $300mm NWC change to be a benefit of $30 - $90mm, due to further DSO improvement and the reversal of the year-end payroll timing shift Expectations

Appendix 16
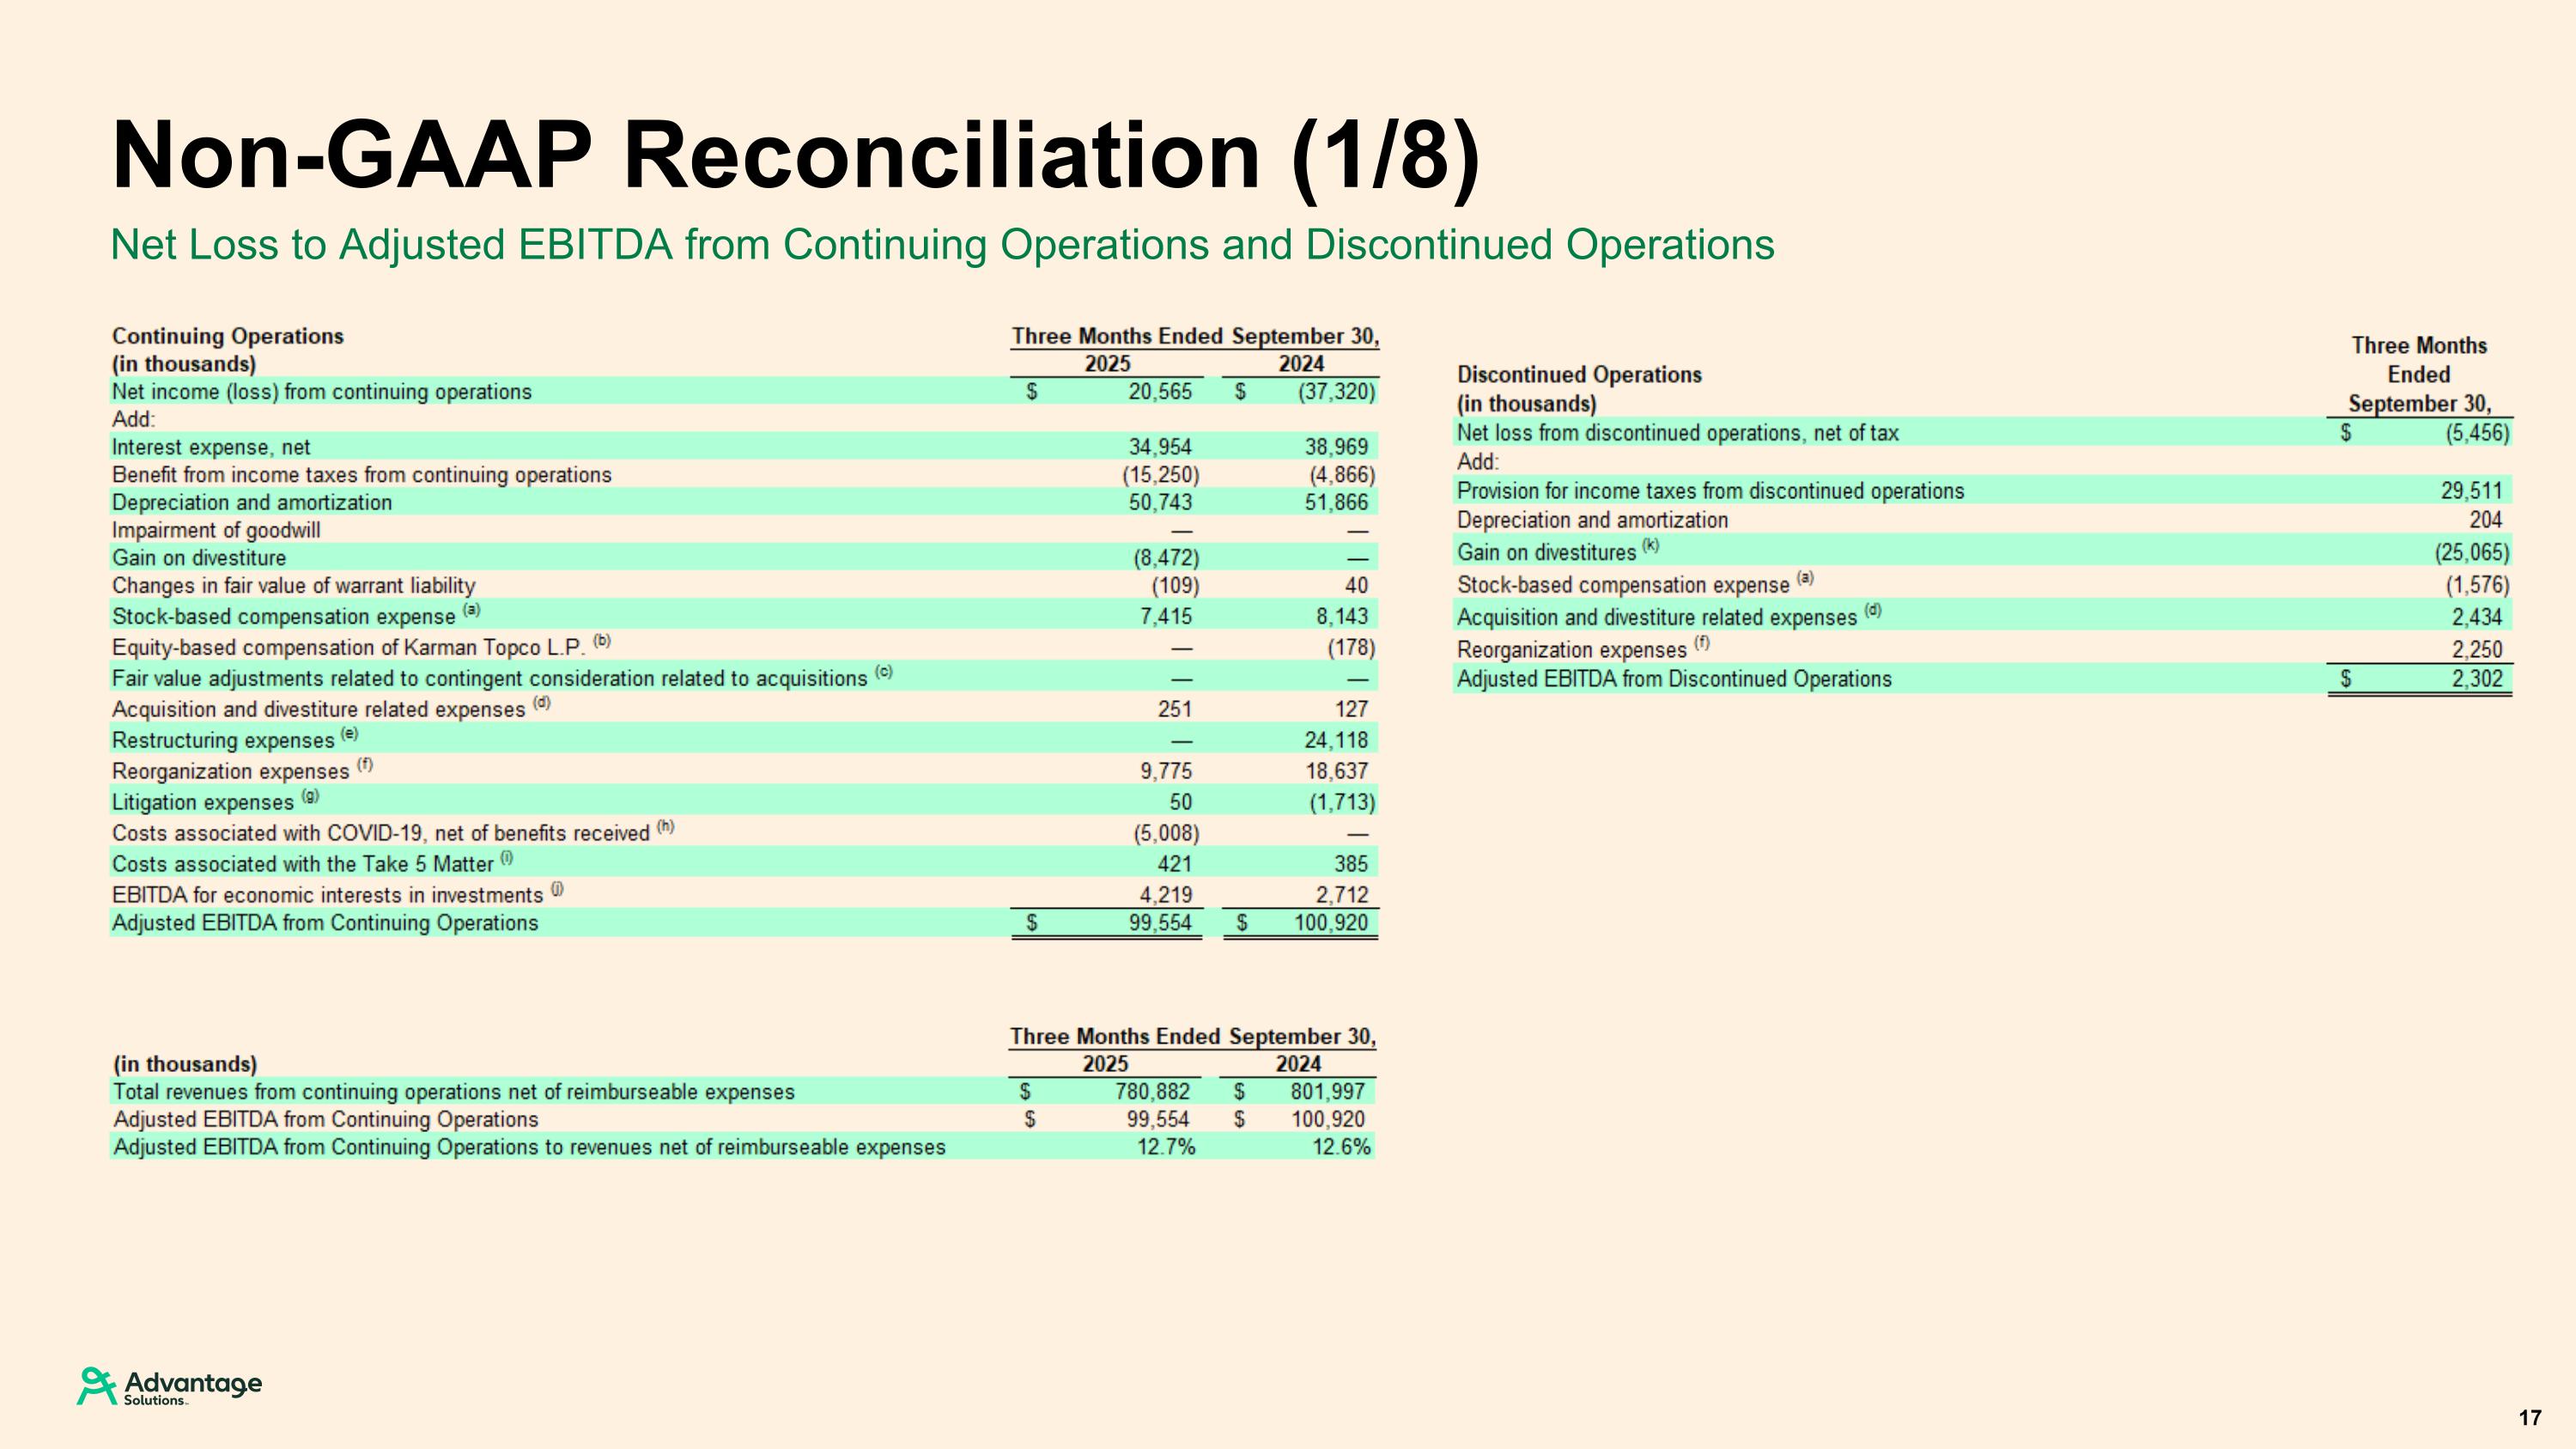
Net Loss to Adjusted EBITDA from Continuing Operations and Discontinued Operations Non-GAAP Reconciliation (1/8) 17
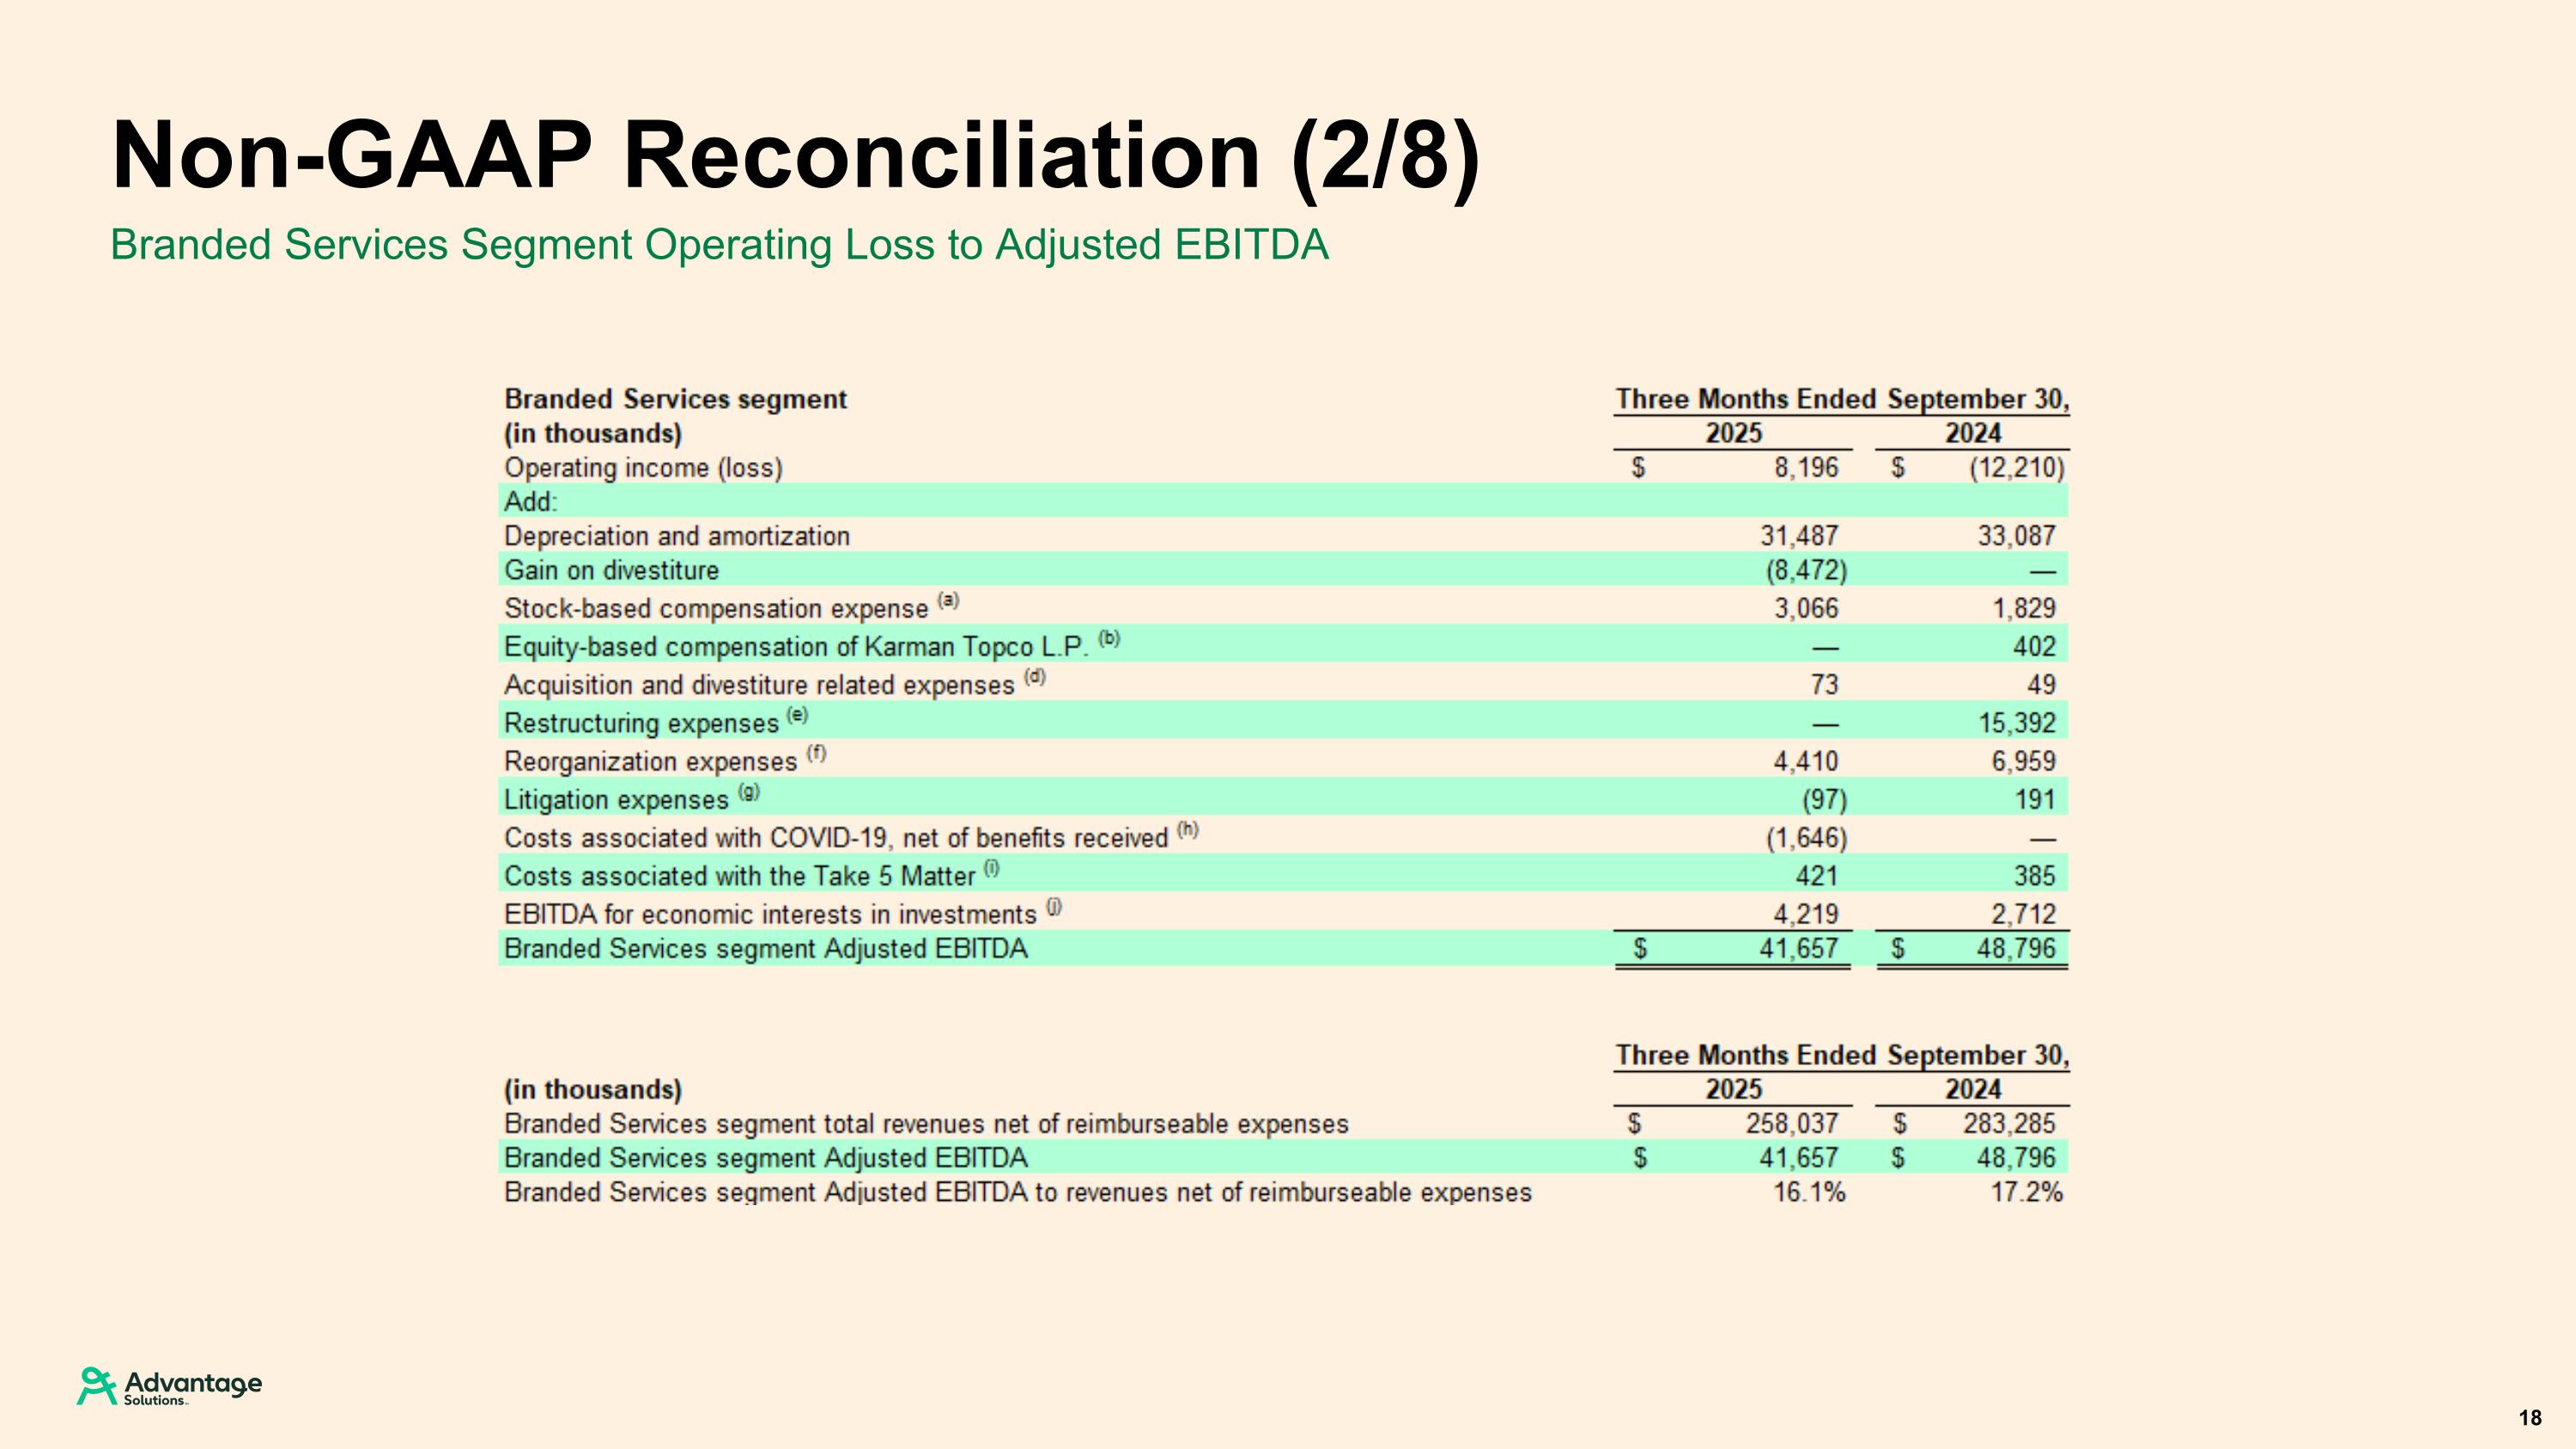
Branded Services Segment Operating Loss to Adjusted EBITDA Non-GAAP Reconciliation (2/8) 18
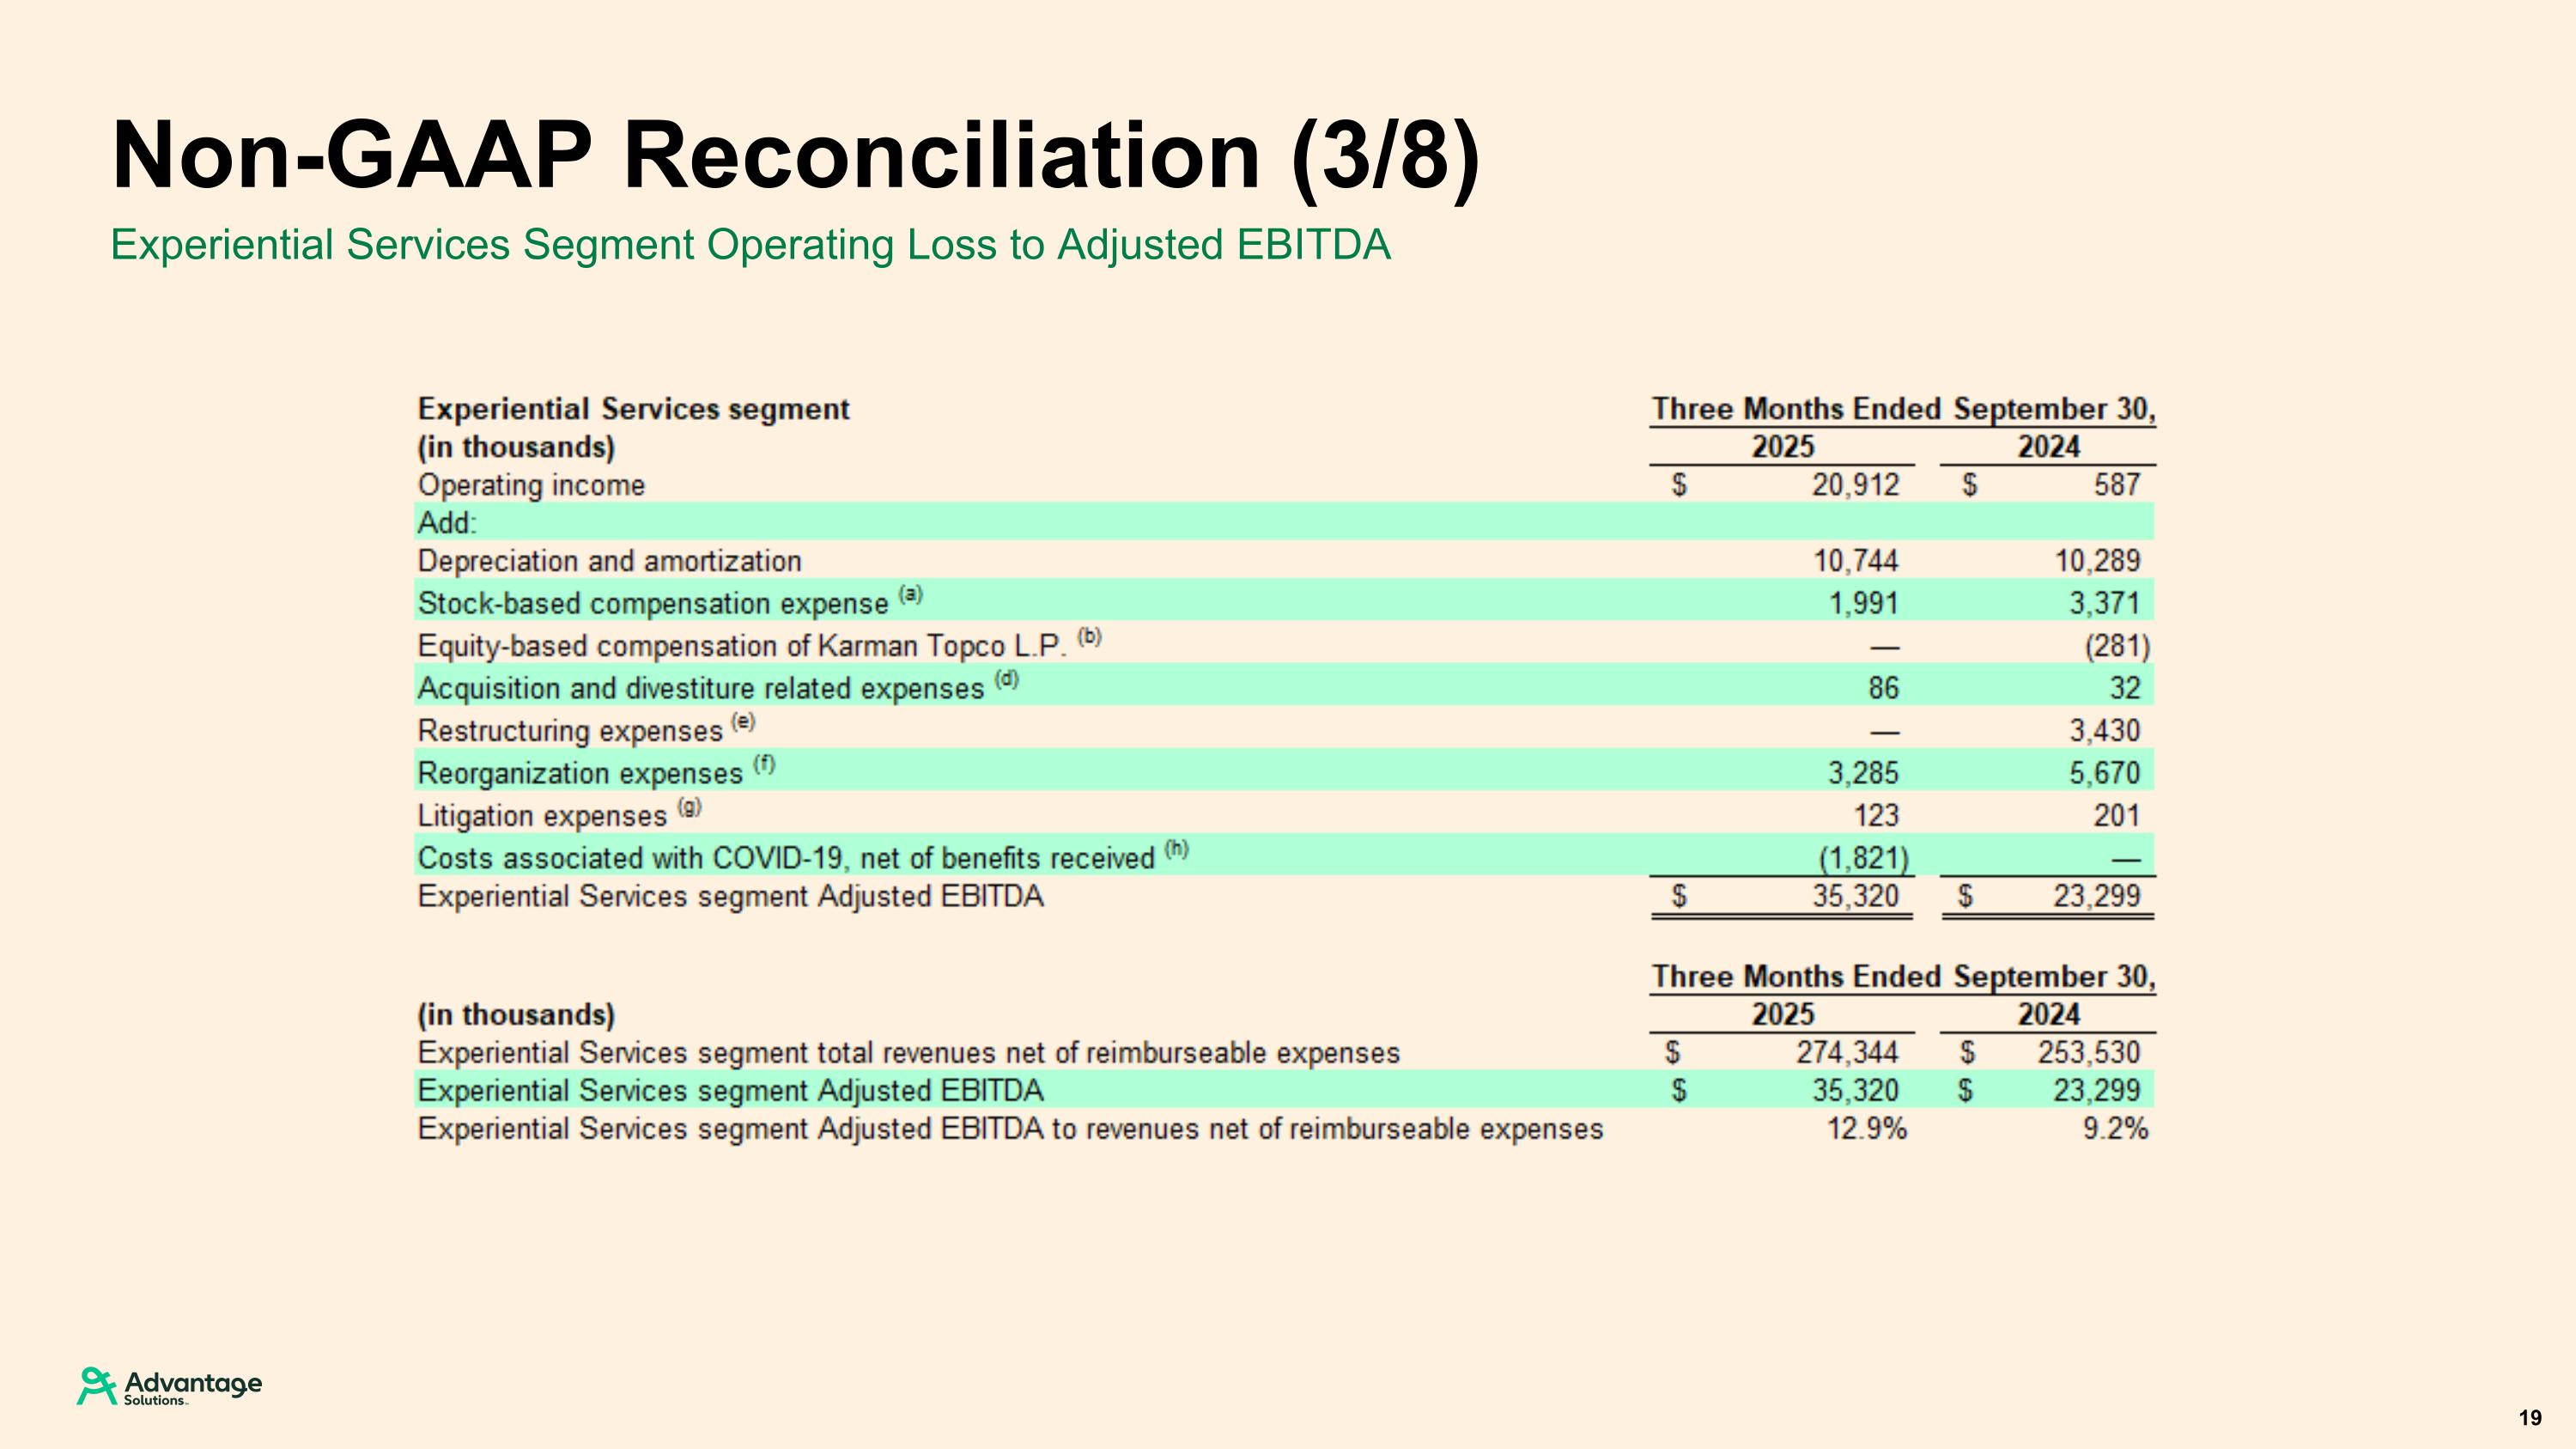
Experiential Services Segment Operating Loss to Adjusted EBITDA Non-GAAP Reconciliation (3/8) 19
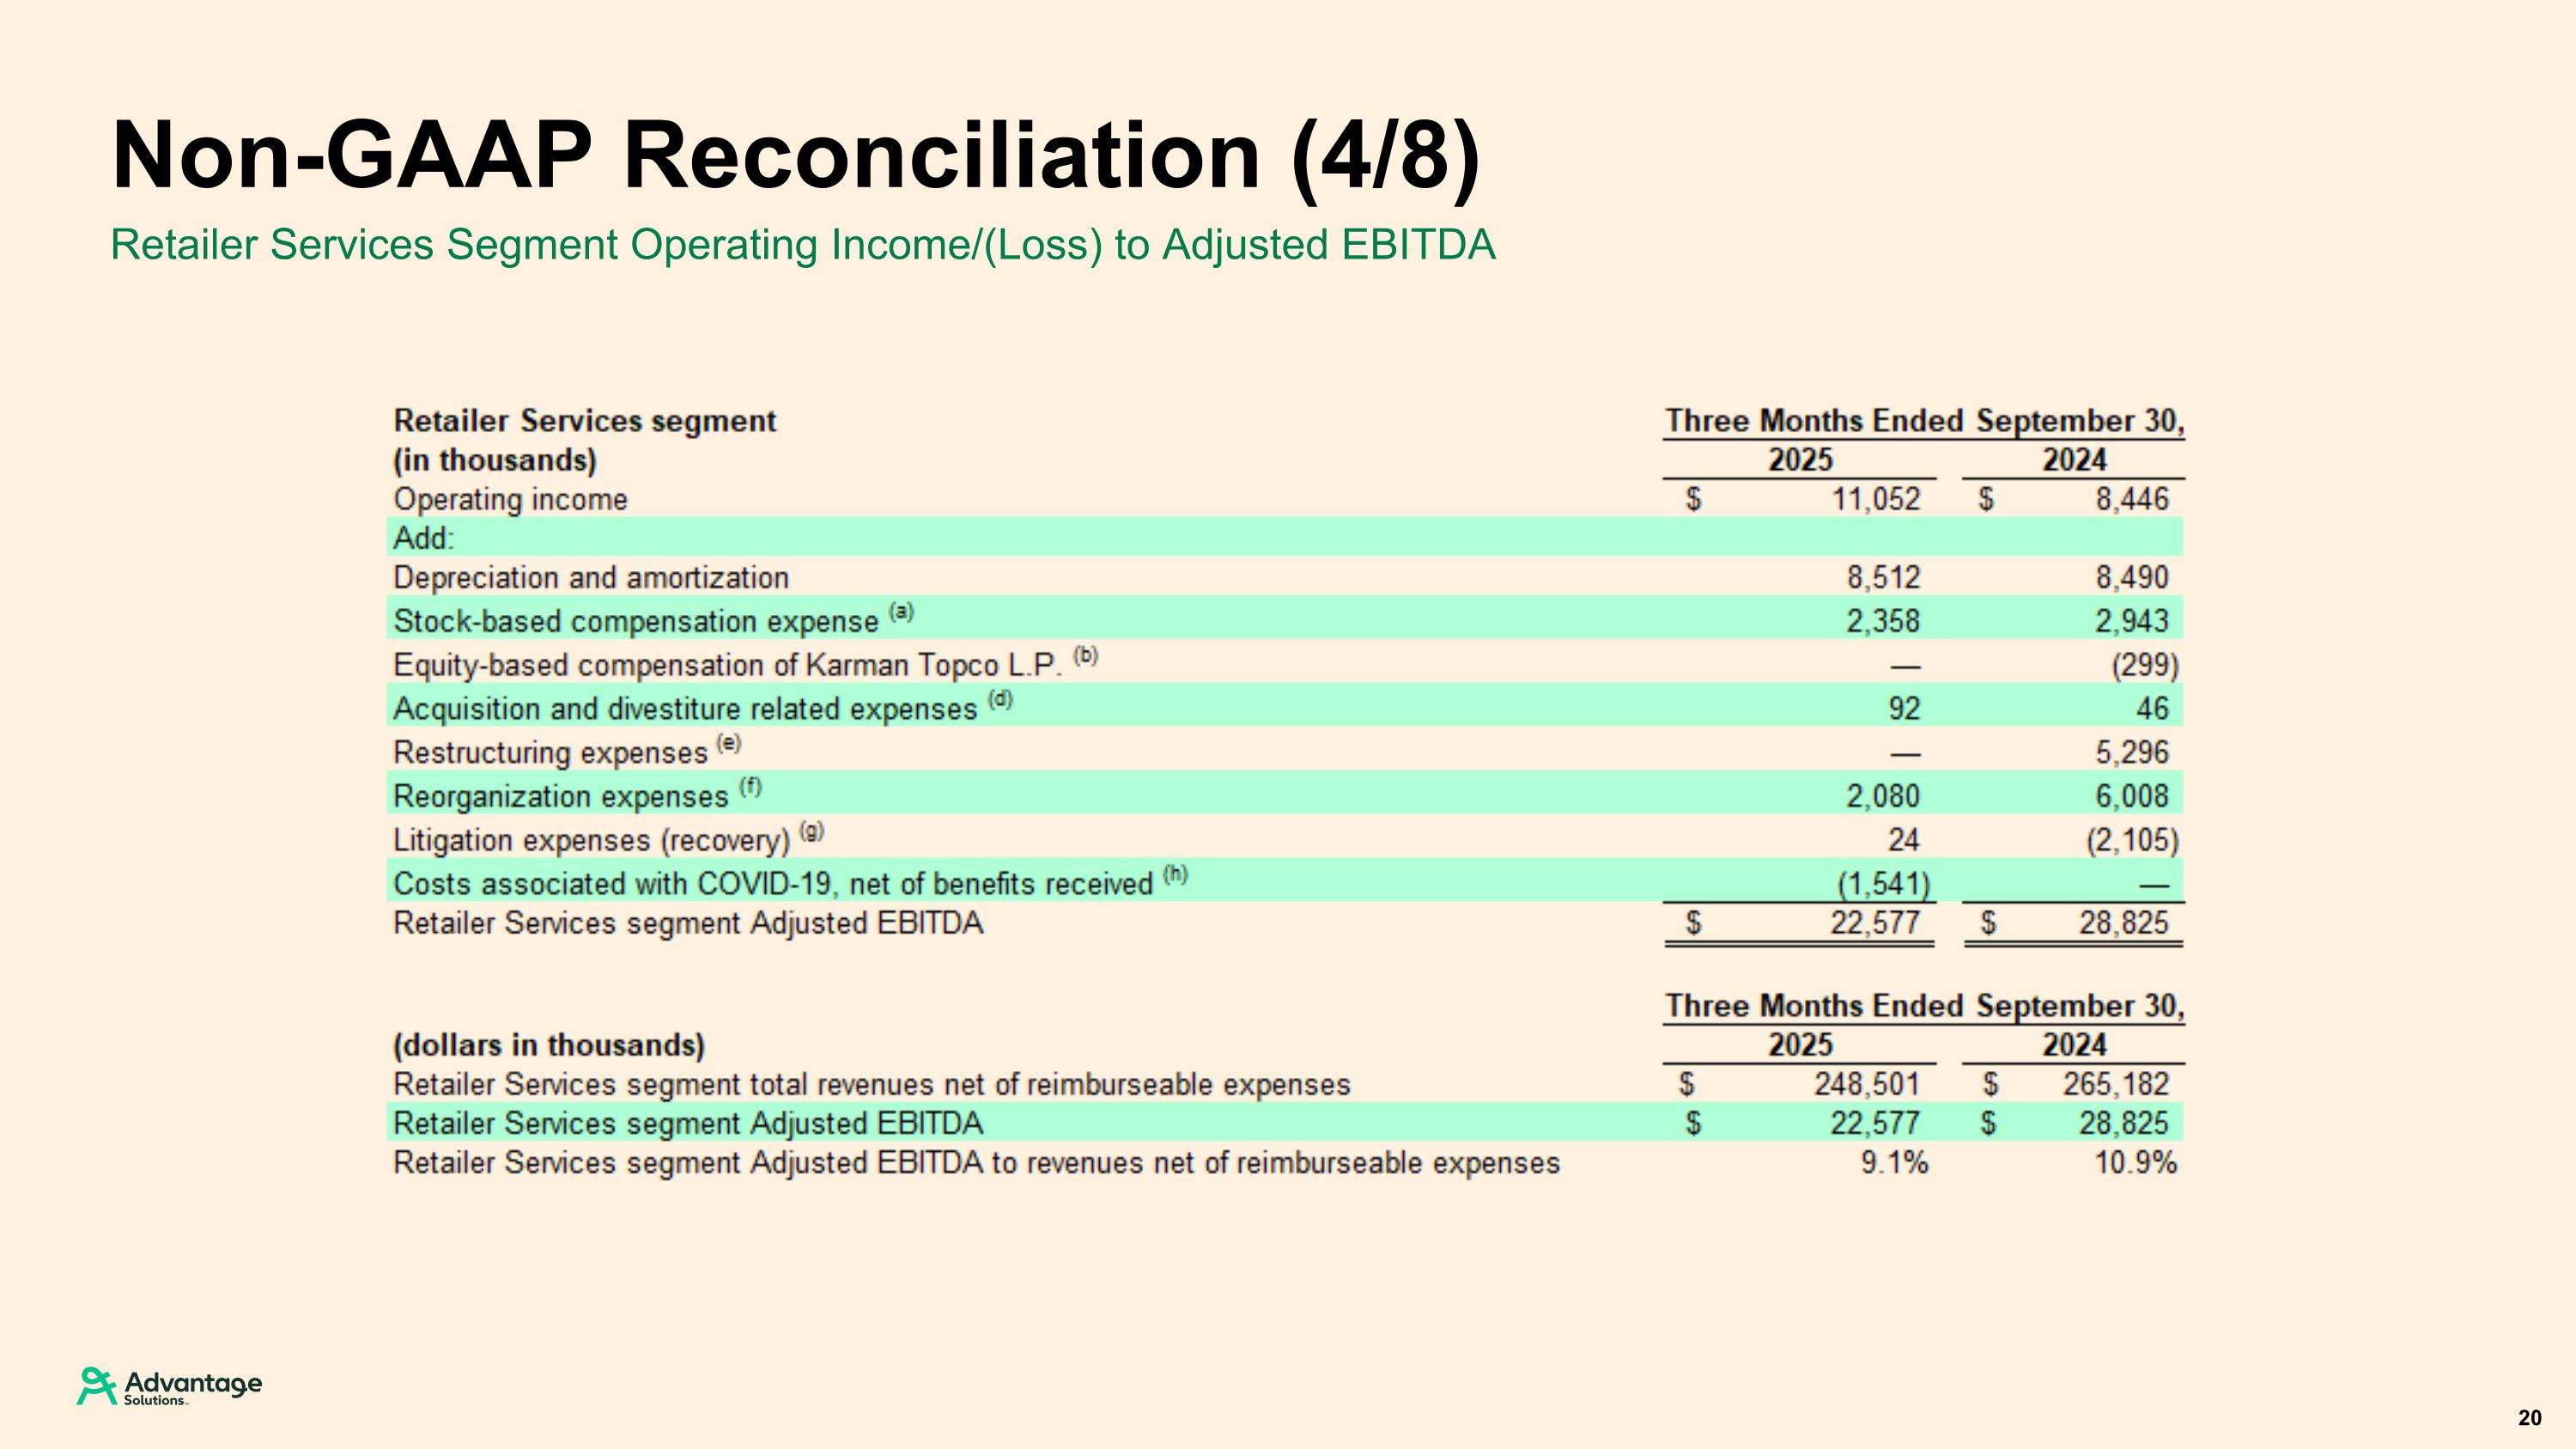
Retailer Services Segment Operating Income/(Loss) to Adjusted EBITDA Non-GAAP Reconciliation (4/8) 20
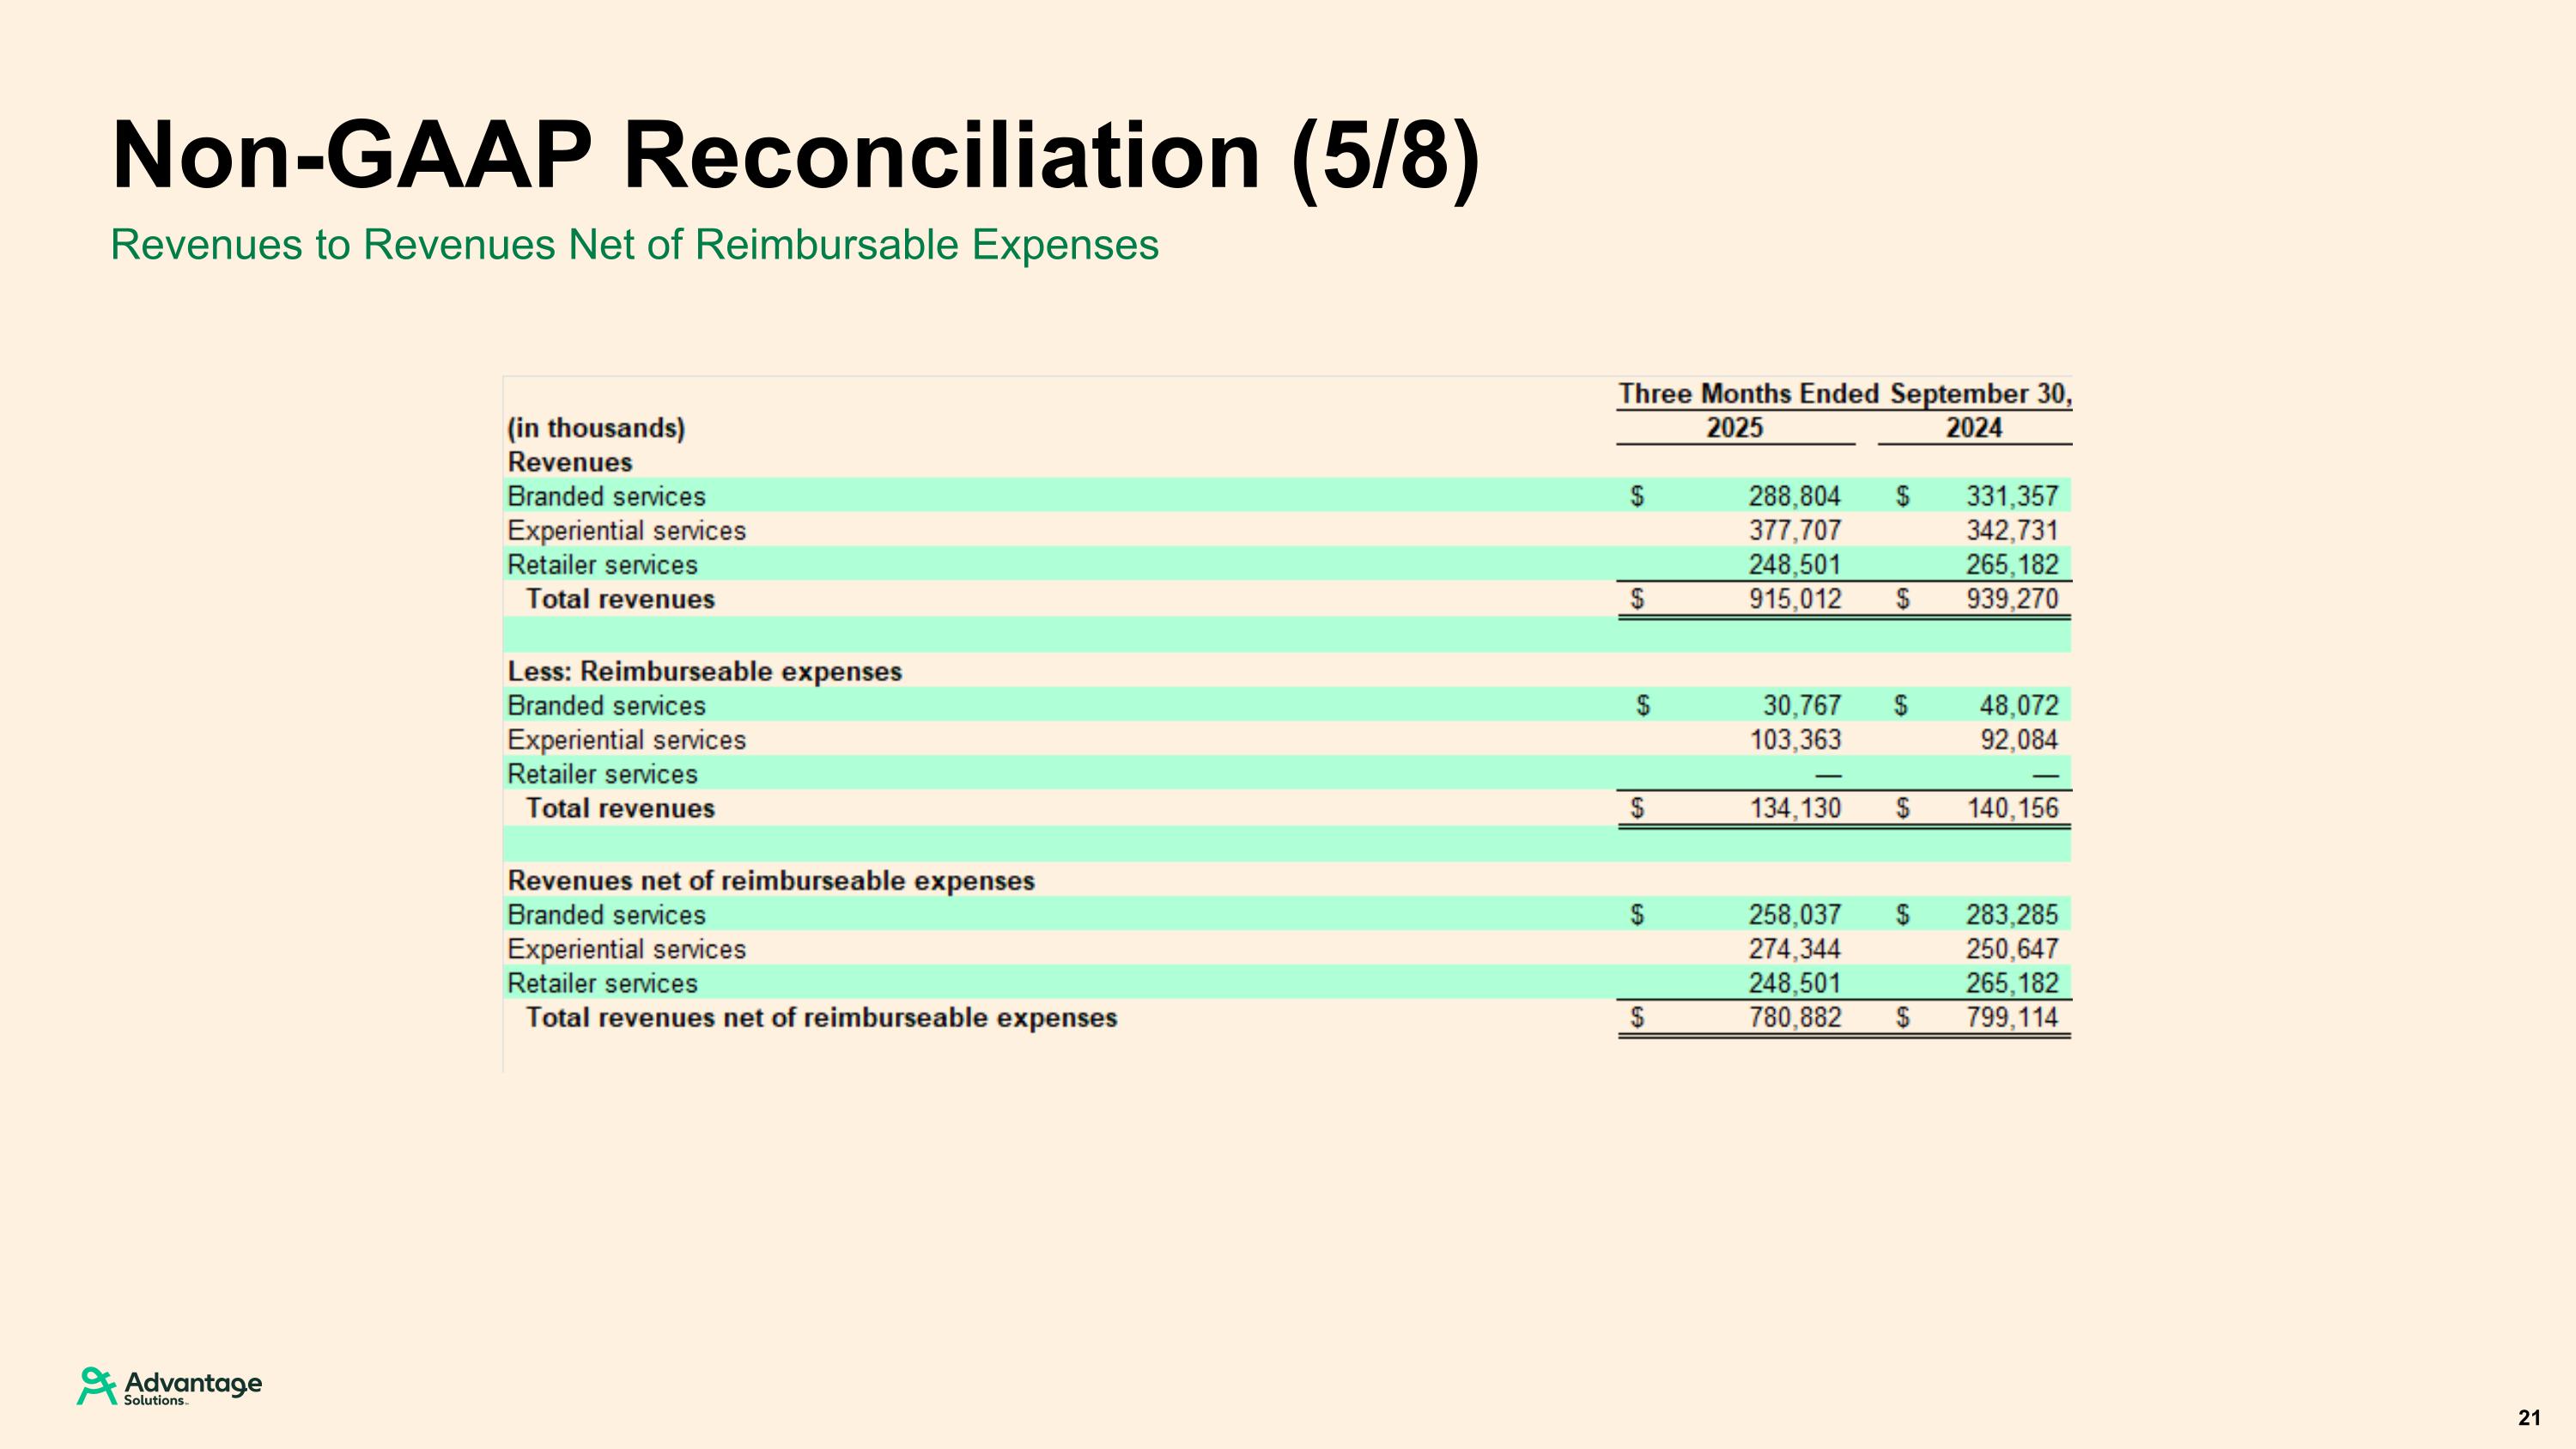
Revenues to Revenues Net of Reimbursable Expenses Non-GAAP Reconciliation (5/8) 21
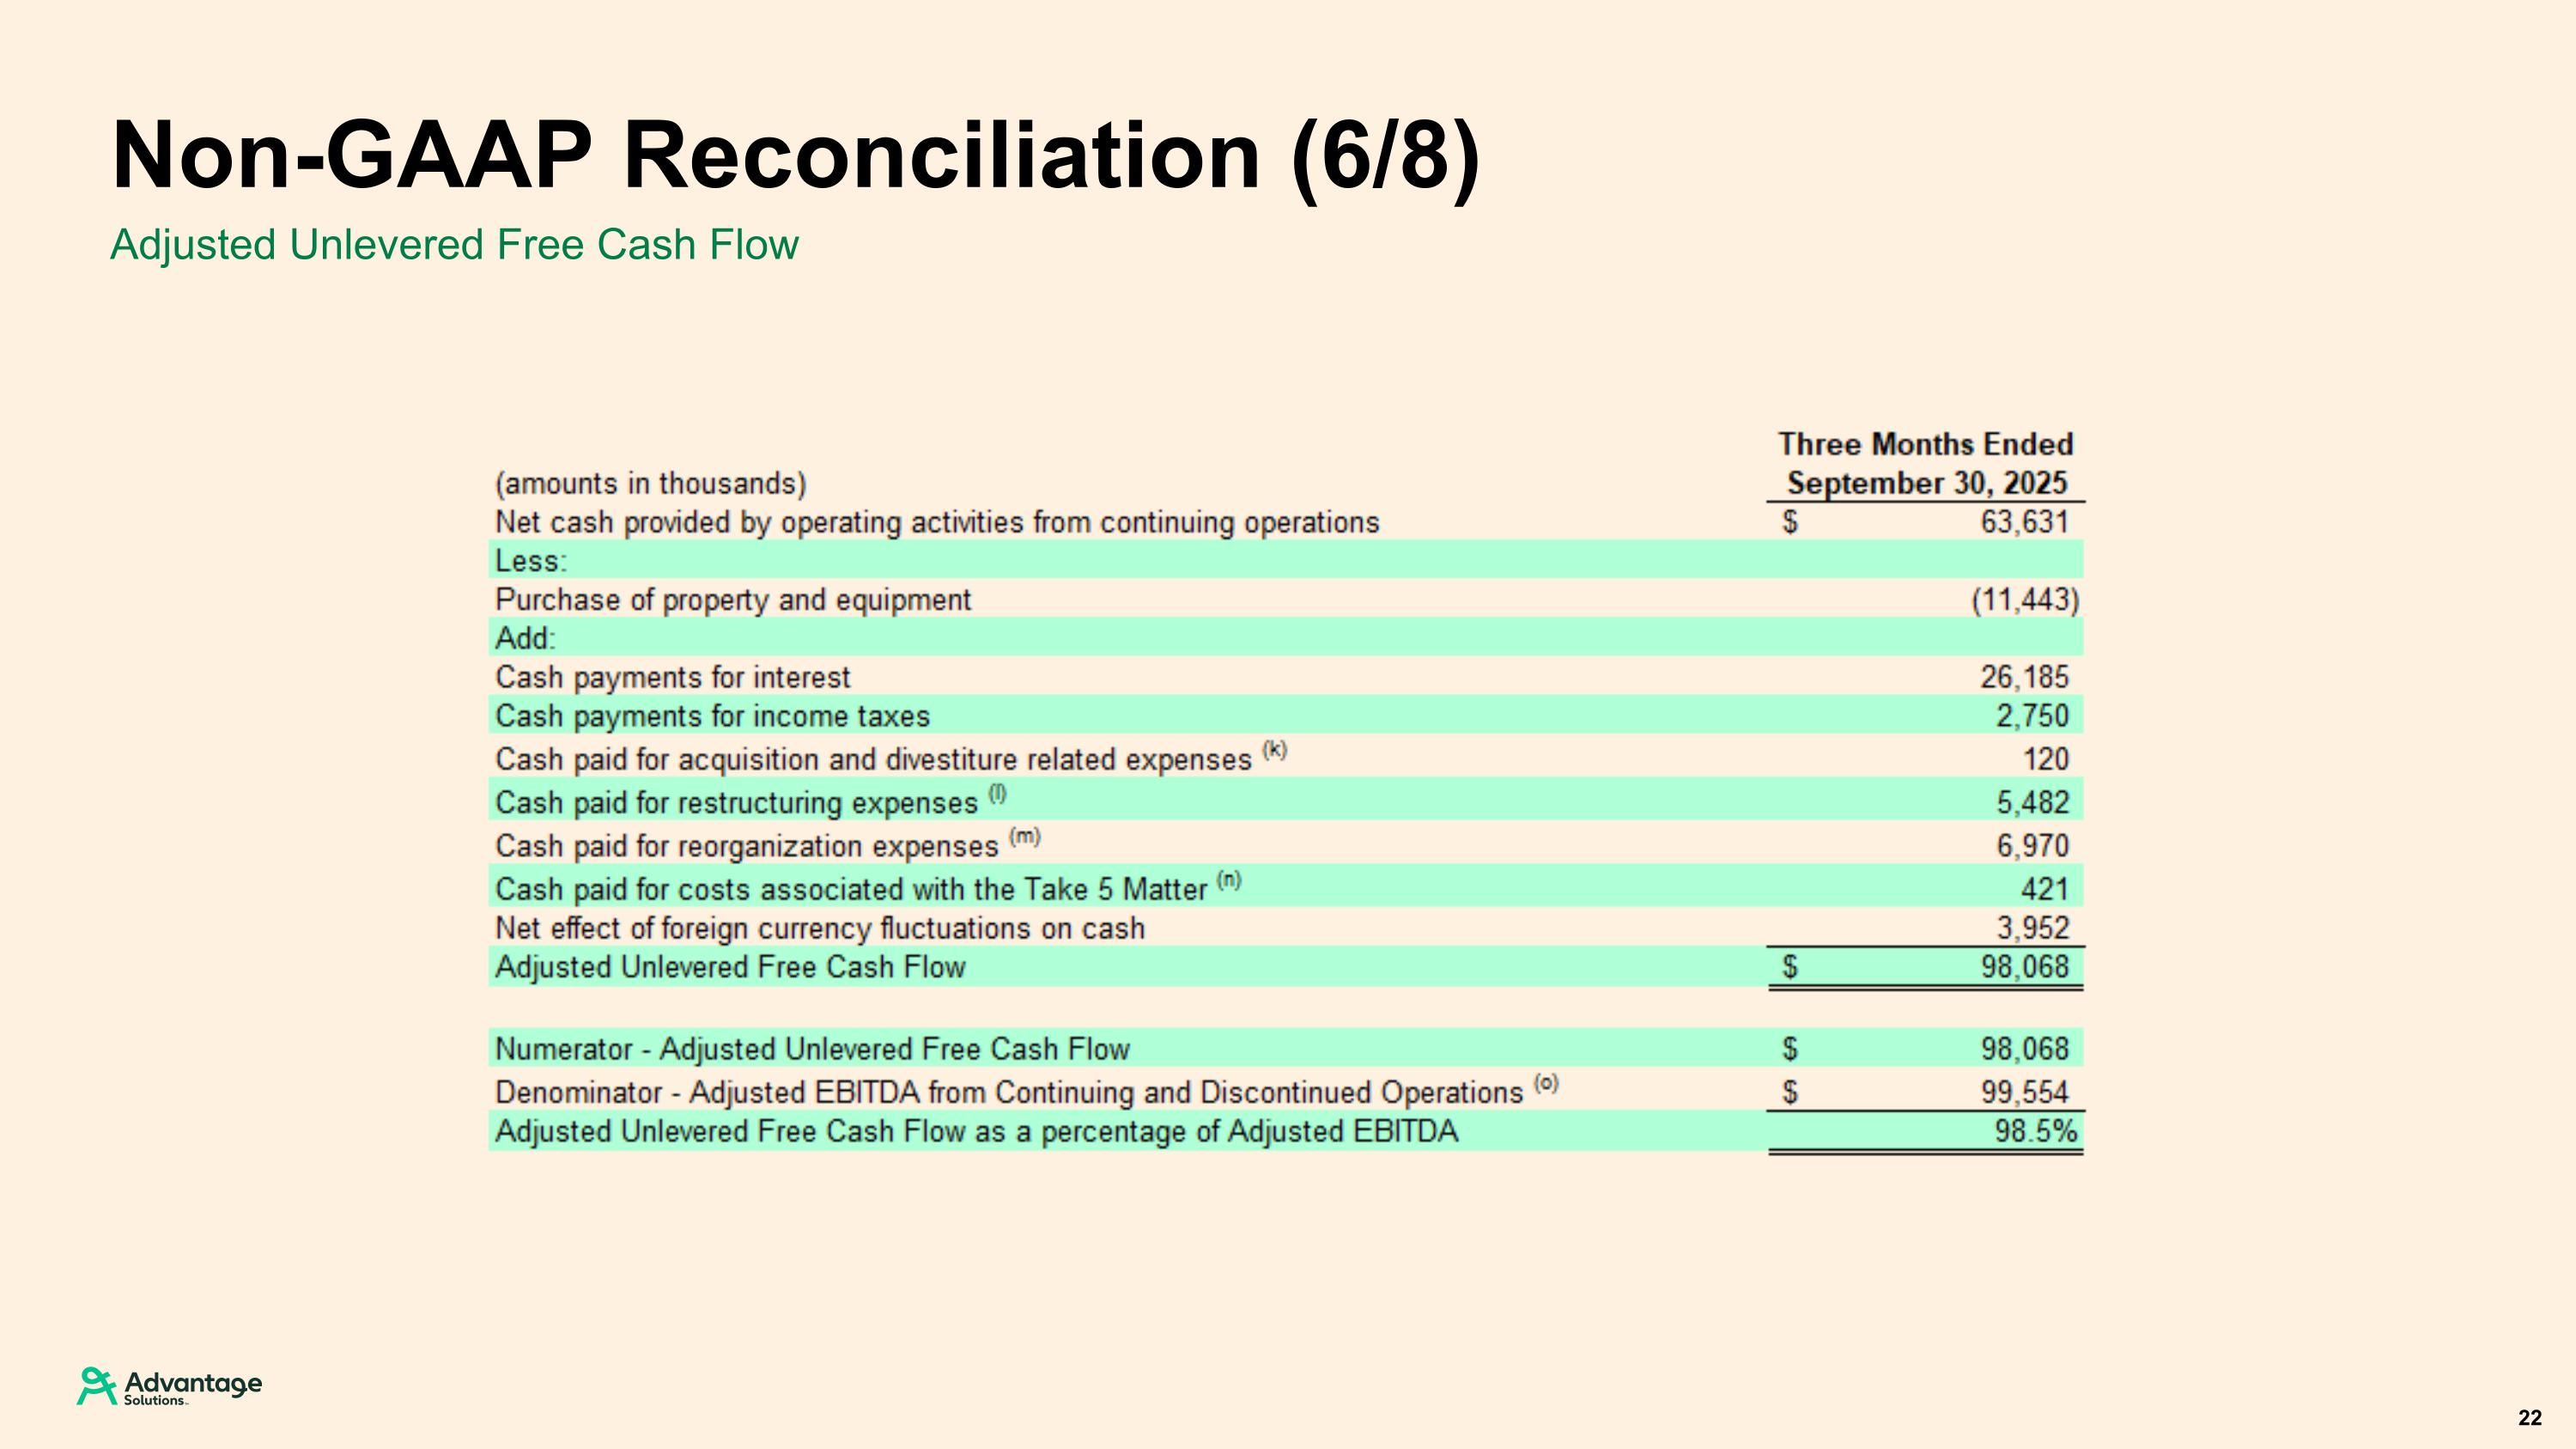
Adjusted Unlevered Free Cash Flow Non-GAAP Reconciliation (6/8) 22
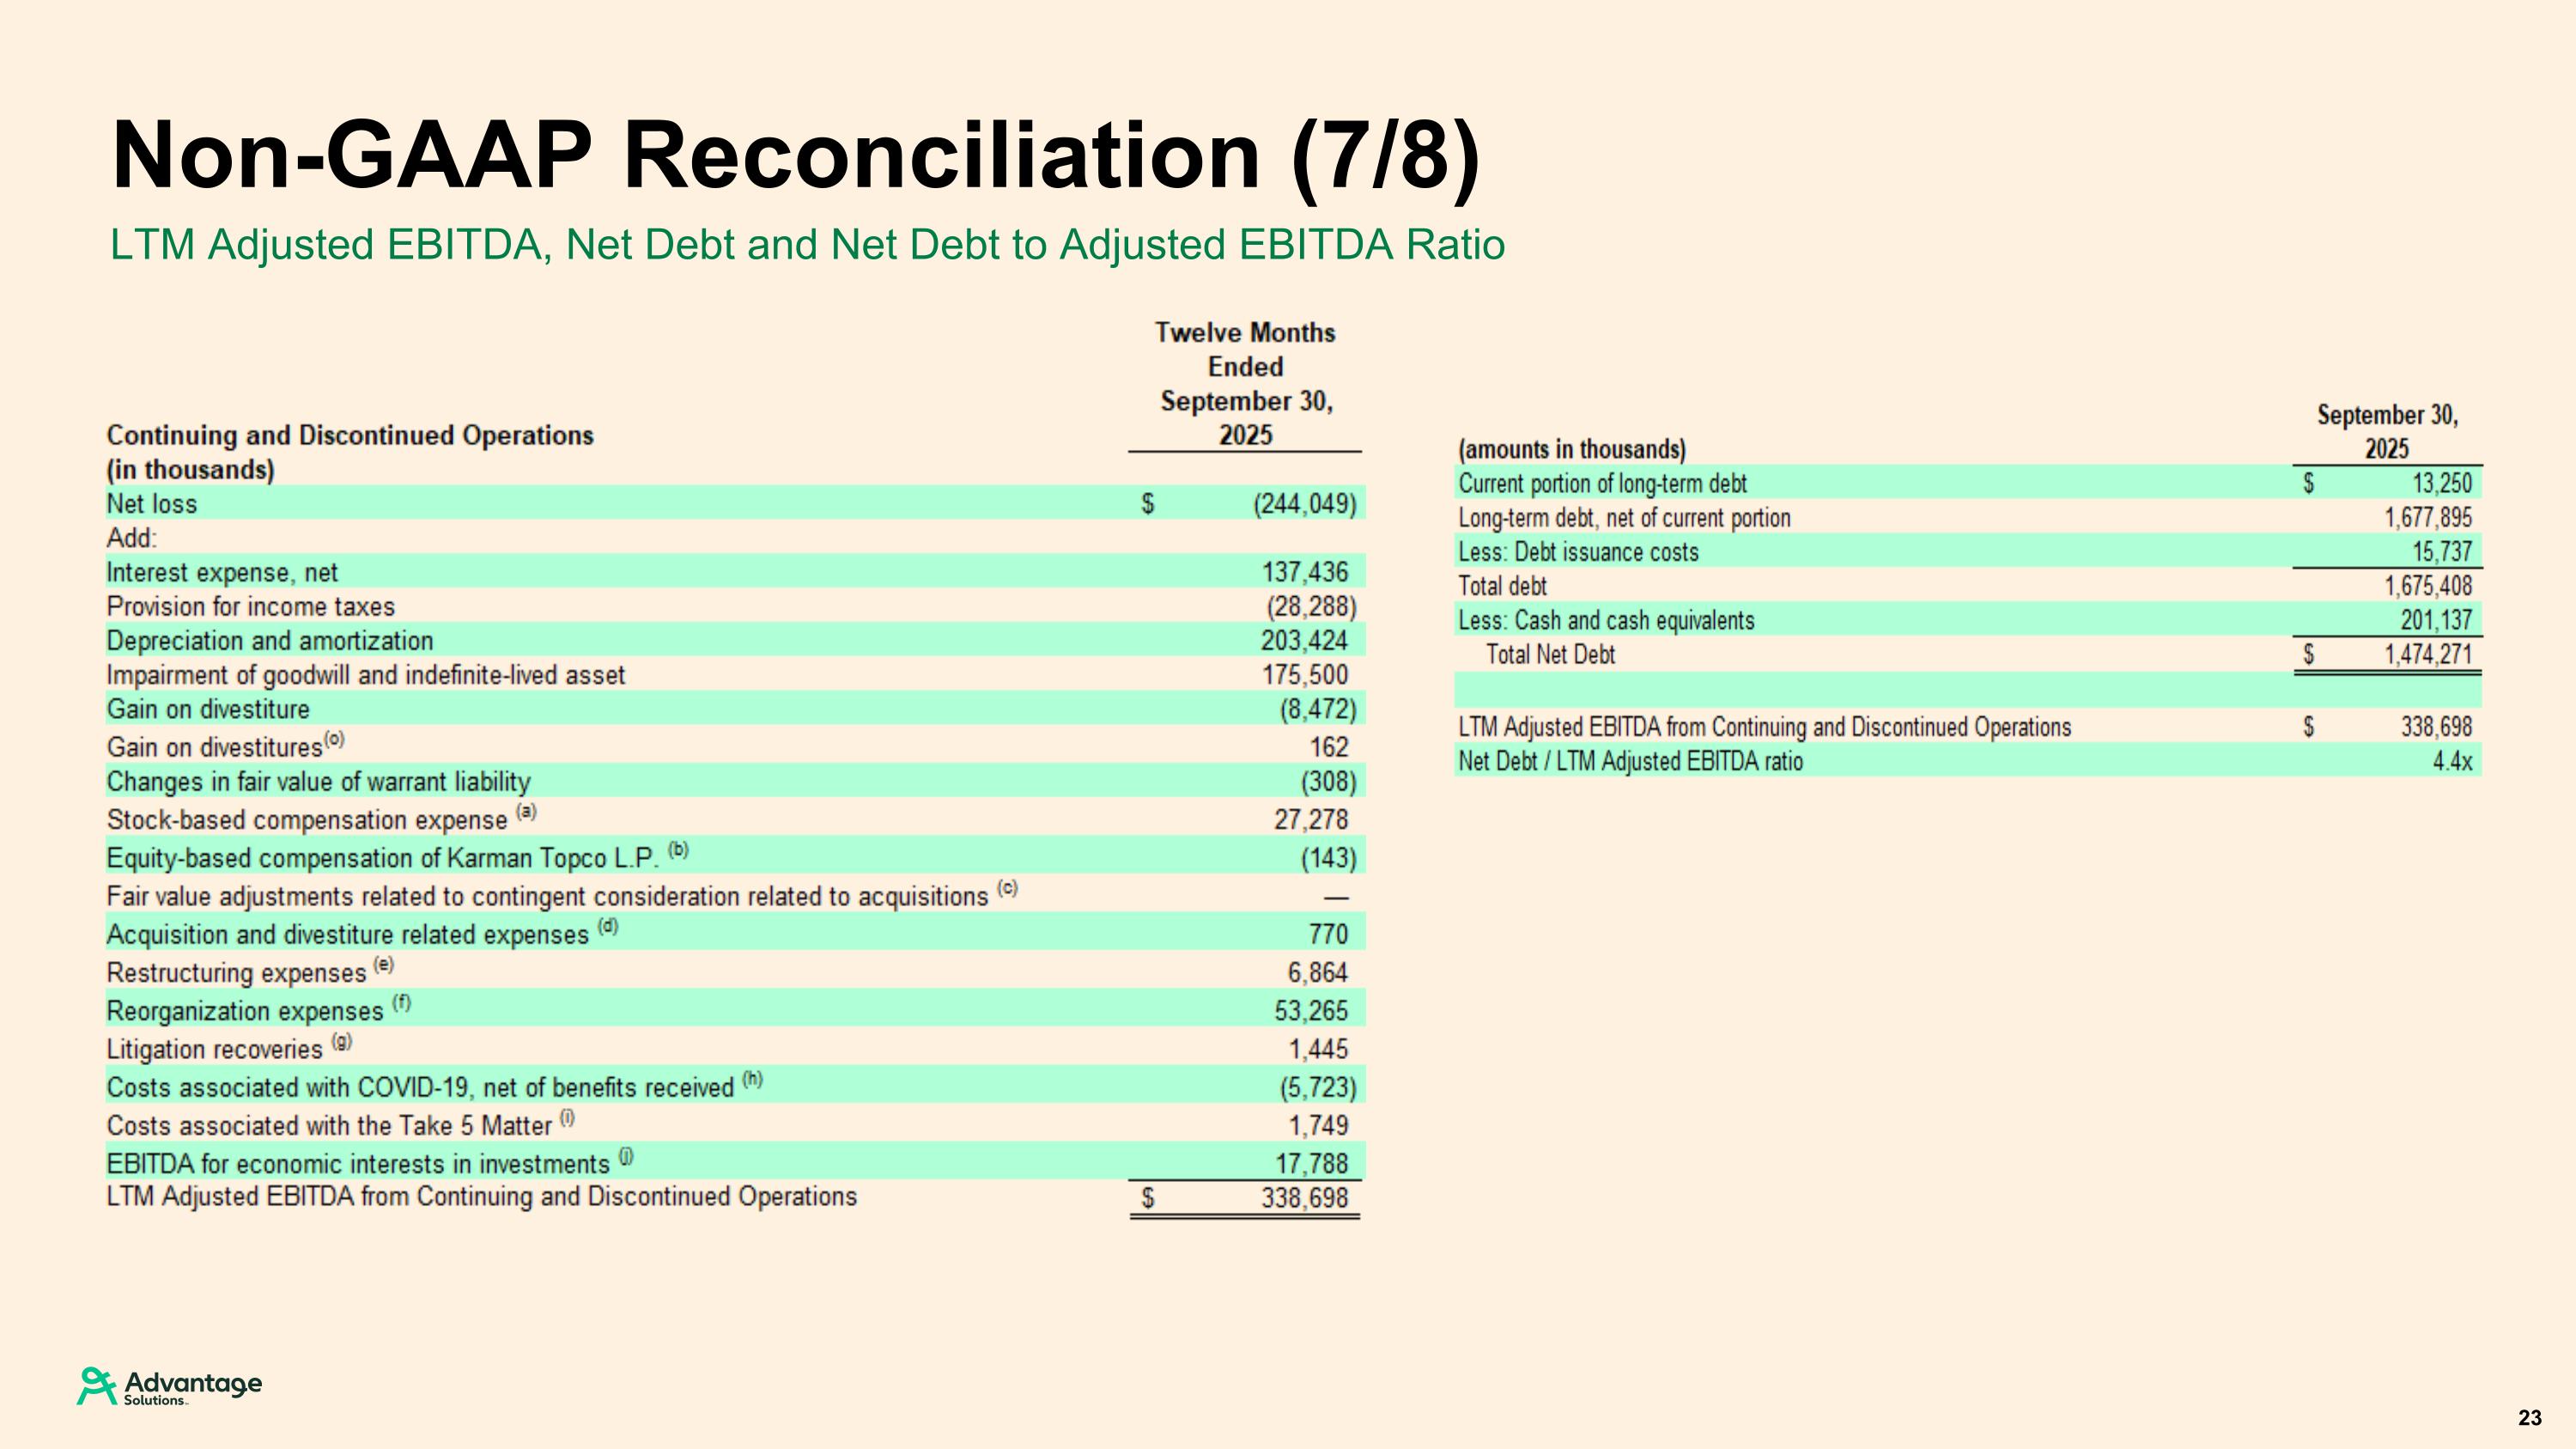
LTM Adjusted EBITDA, Net Debt and Net Debt to Adjusted EBITDA Ratio Non-GAAP Reconciliation (7/8) 23
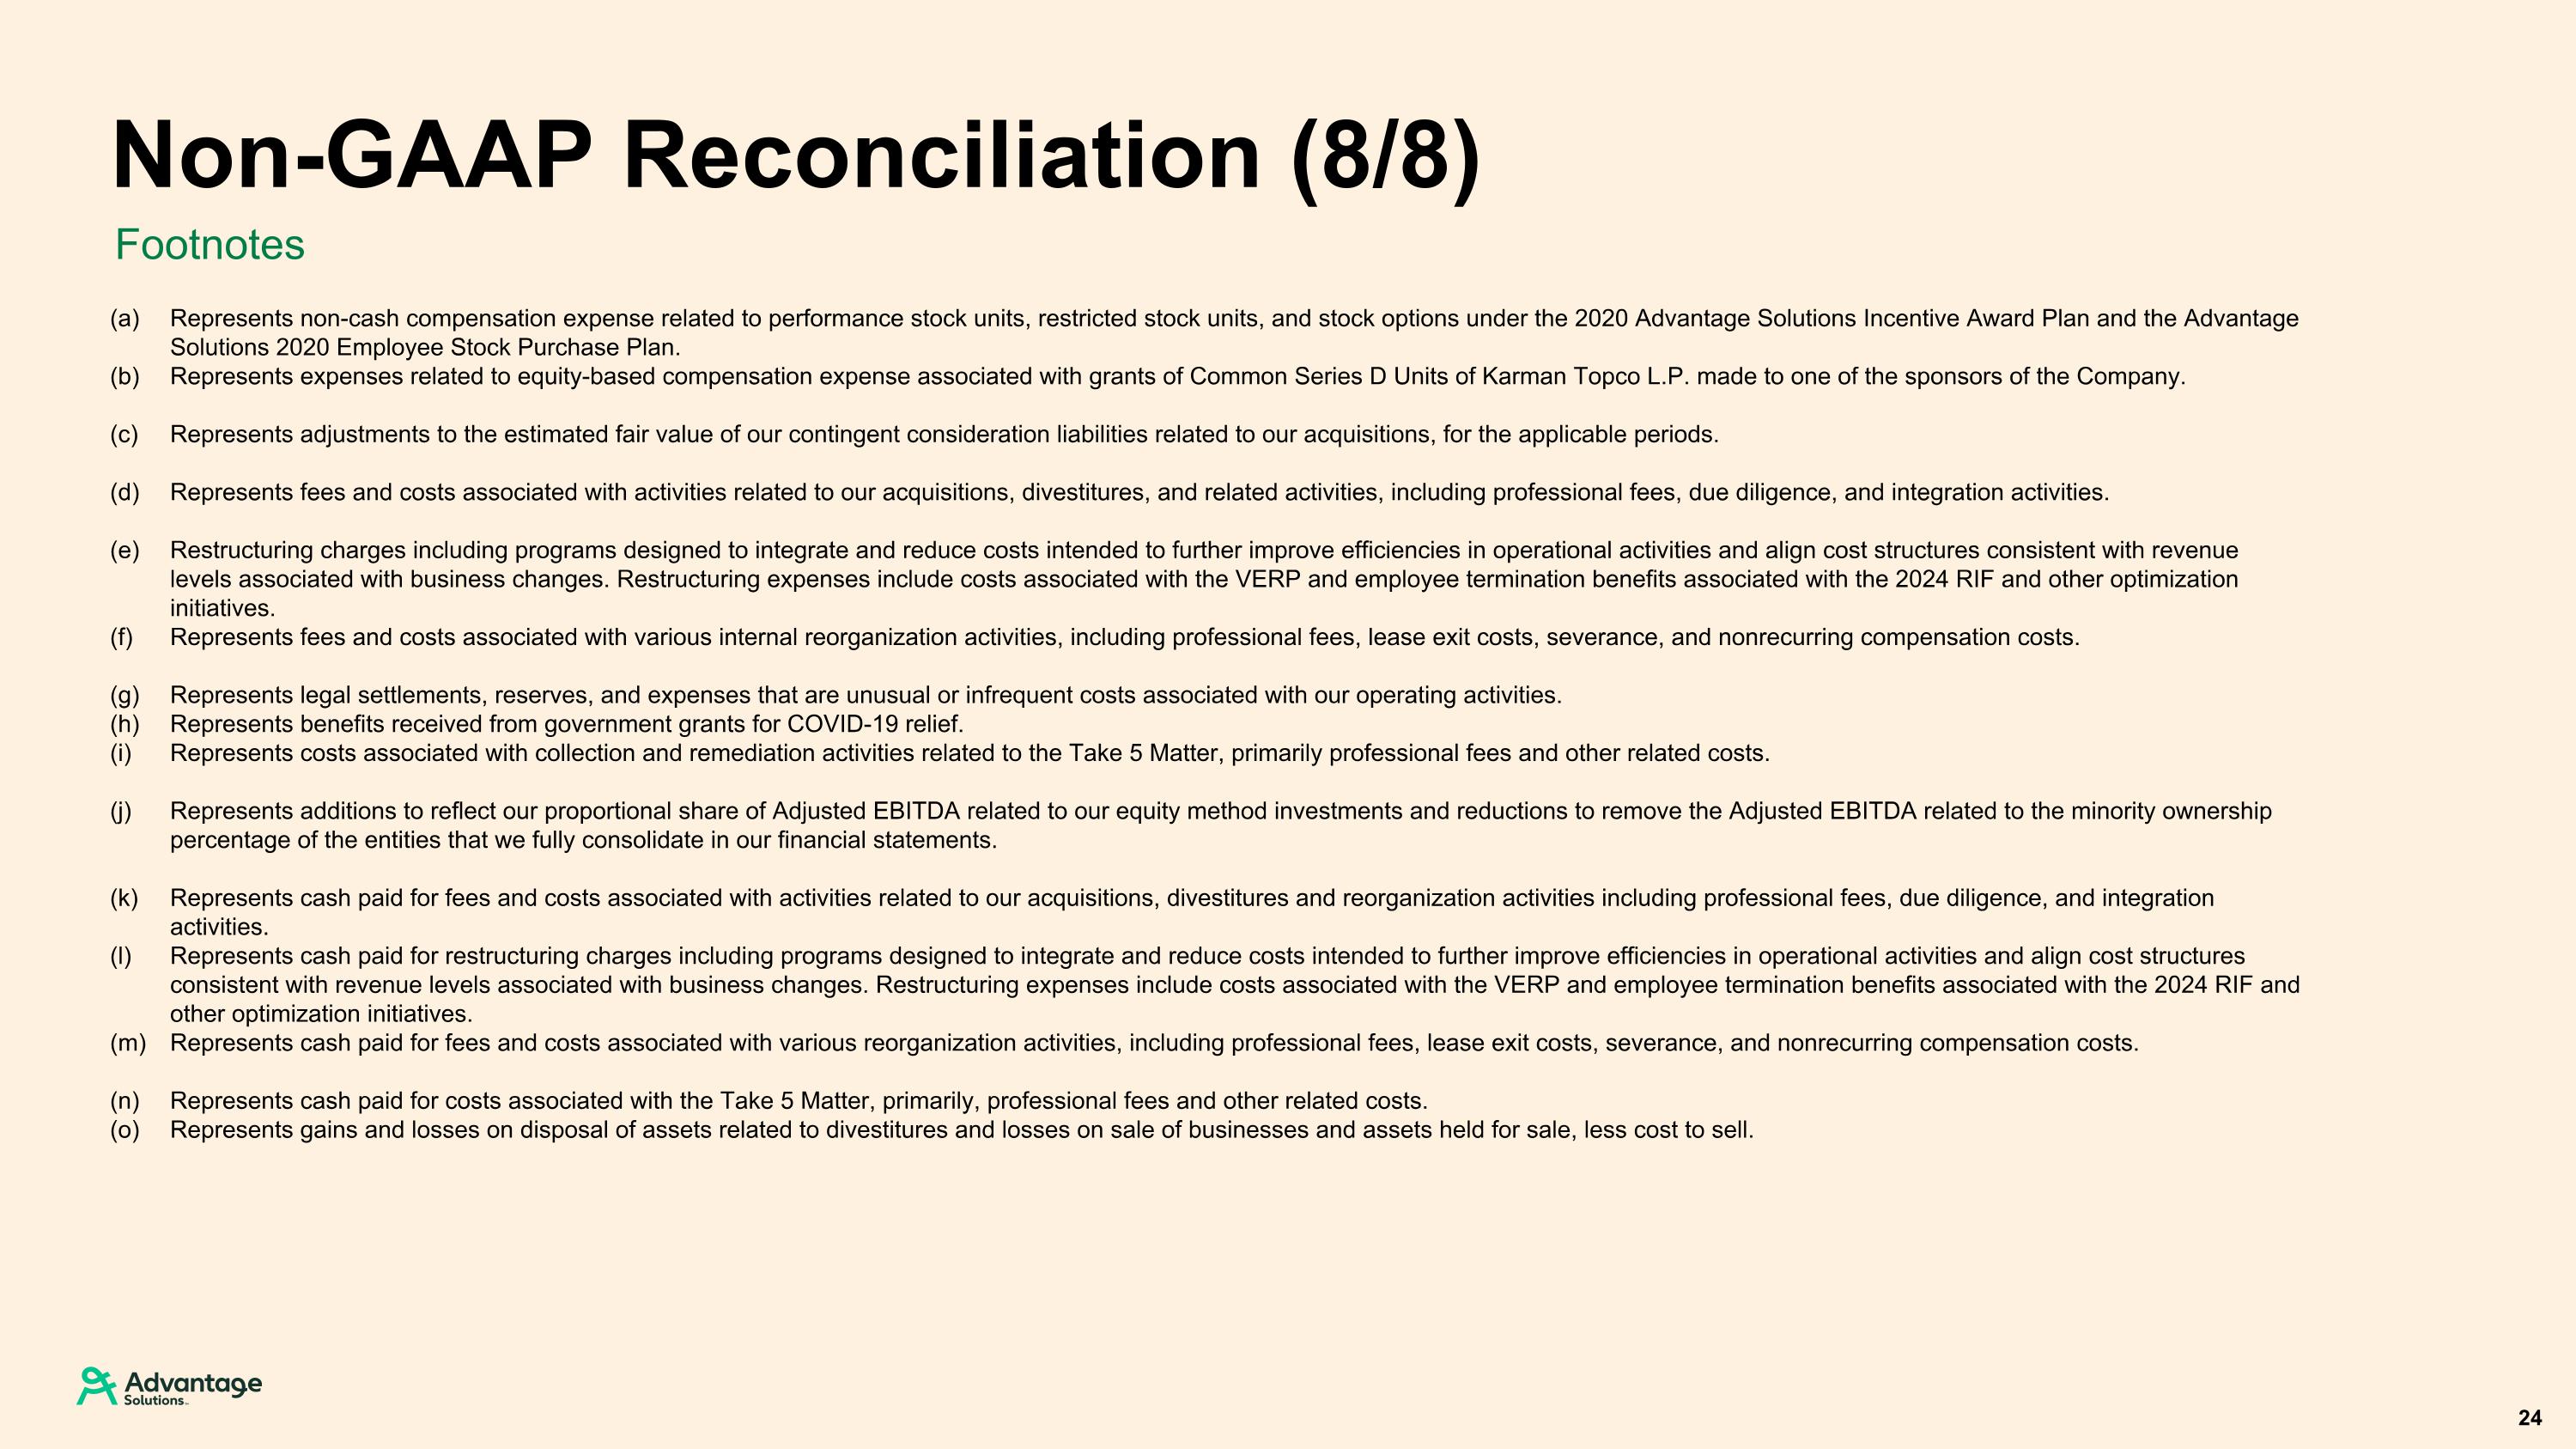
Footnotes Non-GAAP Reconciliation (8/8) 24 (a) Represents non-cash compensation expense related to performance stock units, restricted stock units, and stock options under the 2020 Advantage Solutions Incentive Award Plan and the Advantage Solutions 2020 Employee Stock Purchase Plan. (b) Represents expenses related to equity-based compensation expense associated with grants of Common Series D Units of Karman Topco L.P. made to one of the sponsors of the Company. (c) Represents adjustments to the estimated fair value of our contingent consideration liabilities related to our acquisitions, for the applicable periods. (d) Represents fees and costs associated with activities related to our acquisitions, divestitures, and related activities, including professional fees, due diligence, and integration activities. (e) Restructuring charges including programs designed to integrate and reduce costs intended to further improve efficiencies in operational activities and align cost structures consistent with revenue levels associated with business changes. Restructuring expenses include costs associated with the VERP and employee termination benefits associated with the 2024 RIF and other optimization initiatives. (f) Represents fees and costs associated with various internal reorganization activities, including professional fees, lease exit costs, severance, and nonrecurring compensation costs. (g) Represents legal settlements, reserves, and expenses that are unusual or infrequent costs associated with our operating activities. (h) Represents benefits received from government grants for COVID-19 relief. (i) Represents costs associated with collection and remediation activities related to the Take 5 Matter, primarily professional fees and other related costs. (j) Represents additions to reflect our proportional share of Adjusted EBITDA related to our equity method investments and reductions to remove the Adjusted EBITDA related to the minority ownership percentage of the entities that we fully consolidate in our financial statements. (k) Represents cash paid for fees and costs associated with activities related to our acquisitions, divestitures and reorganization activities including professional fees, due diligence, and integration activities. (l) Represents cash paid for restructuring charges including programs designed to integrate and reduce costs intended to further improve efficiencies in operational activities and align cost structures consistent with revenue levels associated with business changes. Restructuring expenses include costs associated with the VERP and employee termination benefits associated with the 2024 RIF and other optimization initiatives. (m) Represents cash paid for fees and costs associated with various reorganization activities, including professional fees, lease exit costs, severance, and nonrecurring compensation costs. (n) Represents cash paid for costs associated with the Take 5 Matter, primarily, professional fees and other related costs. (o) Represents gains and losses on disposal of assets related to divestitures and losses on sale of businesses and assets held for sale, less cost to sell.