Operator
Good morning, ladies and gentlemen, and welcome to the Alaska Air Group 2026 First Quarter Earnings Call. At this time, all participants have been placed on mute to prevent background noise. Today's call is being recorded and will be accessible for future playback at alaskaair.com. After our speaker's remarks, we will conduct a question and answer session for analysts. I would now like to turn the call over to Alaska Air Group's Vice President of Finance, Planning, and Investor Relations, Ryan St. John.
Thank you, Operator, and good morning. Thanks for joining us today to discuss our first quarter 2026 earnings results. Yesterday, we issued our earnings release along with several accompanying slides detailing our results, which are available at investor.alaskaair.com. On today's call, you'll hear updates from Ben, Andrew, and Shane. Several others of our management team are also on the line to answer your questions during the Q&A portion of the call. Air Group reported a first quarter gap net loss of $193 million. Excluding special items, Air Group reported an adjusted net loss of $192 million. As a reminder, forward-looking statements about future performance may differ materially from our actual results. Information on risk factors that could affect our business can be found within our SEC filings. We will also refer to certain non-gap financial measures such as adjusted earnings and unit costs excluding fuel. And as usual, we have provided a reconciliation between the most directly comparable GAAP and non-GAAP measures in today's earnings release. Over to you, Ben.
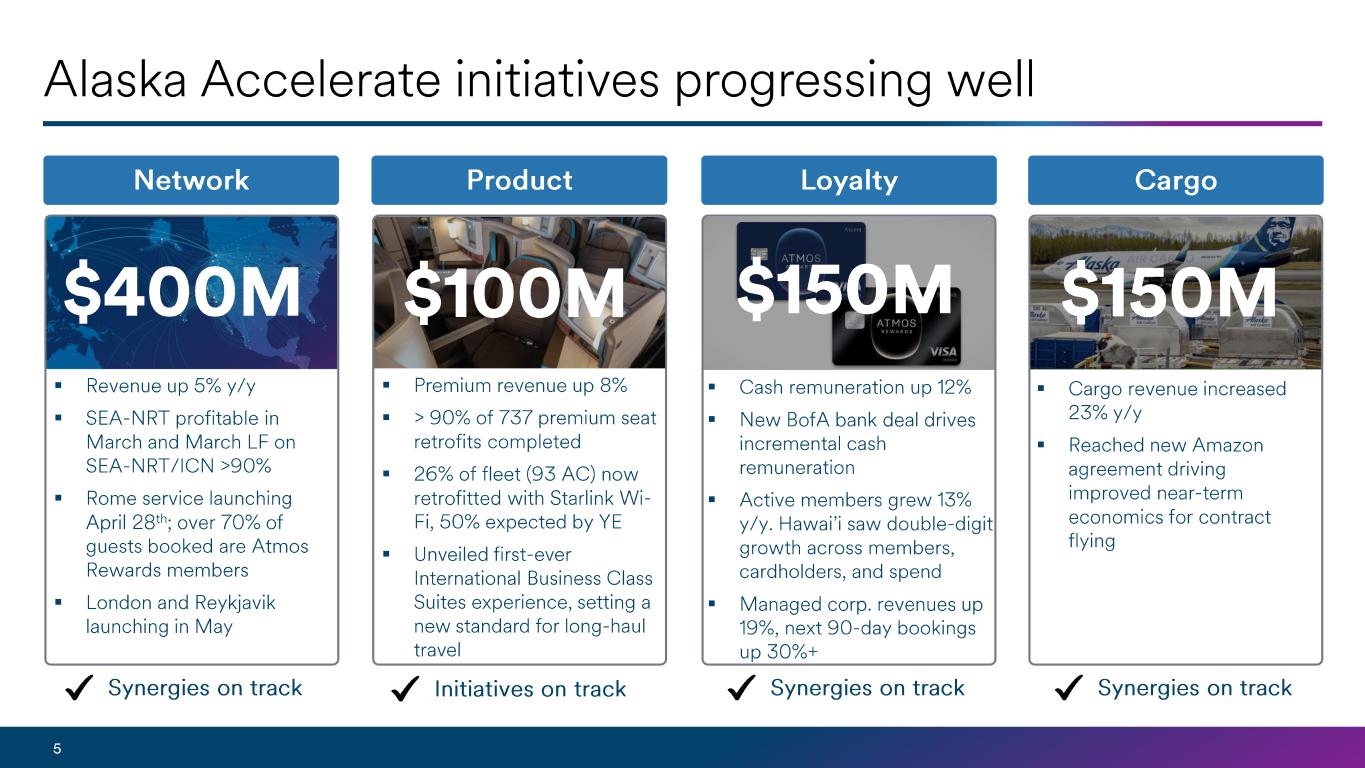
Thanks, Ryan, and good morning, everyone. To start, I want to thank our more than 30,000 employees across Alaska, Hawaiian, and Horizon for their continued focus, professionalism, and commitment to taking care of our guests through another unpredictable start to the year. The operating backdrop shifted rapidly this quarter. Sharply higher fuel prices driven by geopolitical events created uncertainty across global markets and meaningful pressure on the airline industry. At the same time, our network faced more disruption than normal, from once-in-a-generation rainstorms in Hawaii to civil unrest in Puerto Vallarta. Through it all, our teams have demonstrated remarkable resilience. Their response, day in and day out, remains the foundation of our performance and a long-term success. While these events created close-in challenges, we remain convicted and excited about our strategy in the future we're building at Air Group as we continue to unlock the initiatives we laid out under Alaska Accelerate. Throughout our history, we have leaned into periods of disruption to strengthen the company. After the 2001 downturn, we built a transcontinental network. Coming out of the 2008 financial crisis, we established our Hawaii franchise. And most recently, following the COVID pandemic, we acquired Hawaiian Airlines, secured more than 50% market share in Hawaii, and launched long-haul international travel out of Seattle. Each of these moments shaped who we are today. The near-term pressure facing the industry today is real. Fuel costs were more than $100 million higher in the first quarter, and we expect incremental fuel costs of $600 million or more in the second quarter. That represents approximately a 70-cent impact to earnings per share in Q1 and over $3 in Q2. Offsetting some of that pressure is a strong demand backdrop with fair increases holding. Andrew will share more in his comments. Importantly, our position of strength allows us to manage through environments like this while continuing to build long-term earnings power. Today's backdrop reinforces why we designed Alaska Accelerate the way we did, to create a structurally stronger, more diversified, and more resilient airline capable of delivering value across cycles for our owners, employees, and guests. Scale, relevance, and loyalty, with an emphasis on premium experiences and international travel, remains central to that foundation. And while fuel volatility may dominate near-term headlines, the initiatives most critical to our trajectory remain firmly within our control, and we will continue to execute on them because it is the right strategy. Now, turning to the business, we continue to make meaningful progress on Alaska Accelerate, advancing our priorities and not standing still, even in a challenging environment. From an integration standpoint, we've completed preparations for our single passenger service system cutover, our final major guest-facing milestone. Beginning tomorrow, our systems will operate on a single platform, eliminating the friction of a dual environment. This is a significant moment for Air Group. We're moving forward with our combined and globally expanding network, an award-winning loyalty program, and premium offerings across our entire fleet. Along with the PSS cutover, Hawaiian Airlines has officially joined One World, expanding benefits for our loyal guests in Hawaii, attracting new One World guests onto the Hawaiian brand, and extending our global reach to meet the full range of business and leisure travel needs. Our network continues to grow as we connect our guests to the world. We launch Rome next week and London and Reykjavik later this spring, all tracking toward full flights. I could not be more excited to see the Alaska brand set foot in Europe for the first time in our 94-year history, marking a major milestone in becoming the fourth global carrier in the United States. At the same time, our premium and guest experience continues to improve. Premium retrofits on our 737 fleet are now more than 90% complete, increasing our share of premium seats across the network and driving higher premium revenue. Our entire regional fleet is now retrofitted with free Starlink Wi-Fi and Boeing 737 installations are underway, further enhancing our end-to-end guest experience. Guest satisfaction has already improved 15 points across all Starlink-equipped aircraft and nearly 30 points on regional jets. Another core pillar of Alaska Accelerate, our loyalty platform continues to gain momentum. We recently agreed to a multi-year extension with enhanced economics and a deeper partnership with Bank of America, supporting continued growth in our loyalty ecosystem and reinforcing loyalty as one of the most powerful earnings drivers in our business. We're also pleased to have reached an agreement with Amazon that eliminates losses under the legacy Hawaiian terms and creates mutual value as the relationship evolves, with still more to do. And finally, despite winter weather and severe rainstorms in Hawaii, we delivered the industry's number one on-time performance in the first quarter, along with very high net promoter scores, another indicator that integration friction is in the rearview mirror for Air Group. Collectively, these initiatives are reshaping the composition of our revenues and making our business more durable. Today, more than half of our revenues come from outside the main cabin, driven by premium products, loyalty, cargo, and ancillary streams, and we expect that share to keep growing. To close, Alaska is operating from a position of strength. We have a healthy balance sheet, strong liquidity, and a fleet and network that provide flexibility as conditions evolve. I want to reiterate my confidence in our people, our strategy, and our future. We are navigating this environment with discipline, clarity, and purpose. The challenges we're navigating today do not change our longer-term trajectory, our ability to achieve a $10 EPS target, or remain a top-margin-producing airline. While the path is rarely linear, the direction is clear, and our conviction in where we're headed has not wavered. Airlines with caring and committed people, strong brands, loyal guests, disciplined cost structures and financial flexibility are best positioned to emerge stronger. And I firmly believe Air Group fits that profile. And with that, I'll turn it over to Andrew.
Thanks, Ben, and good morning, everyone. Today, I'll walk through our first quarter financial performance, our perspective on the near-term demand and revenue environment, and the significant progress we're realizing on the core initiatives that underpin Alaska Accelerate. Total Q1 revenues reached $3.3 billion, up 5% year-over-year on capacity growth of just 1.7%. Our unit revenues were up 3.5%, in line with our initial expectations for the quarter and building on a strong prior year comparison. From a demand and revenue perspective, performance in the first quarter was resilient despite the volatile, macro backdrop and material demand headwinds uniquely impacting our spring break revenue given our network. Specifically, we experienced significant headwinds in Hawaii and Puerto Vallarta, which together represent approximately 30% of our system capacity. In Hawaii, unprecedented storms, with rainfall reaching as much as 3,000% of normal historical levels during March, disrupted travel plans and drove a spike in cancellations and near-term book away. In Puerto Vallarta, where Air Group is the largest U.S. carrier, civil unrest leading up to the spring break travel period had a meaningful impact on demand as well. Together, these impacts reduced first quarter unit revenues by nearly one point, with effects continuing into April and May. In response, we've reduced Puerto Vallarta flying by approximately 30% in the second quarter to better align capacity with demand. In Hawaii, we have maintained near-term capacity as the severe weather was transitory. We are busy taking great care of local travellers and welcoming visitors with the Hawaiian experience they know and love, and this past week saw bookings return to last year's level on strong fare increases. Setting aside these regions, we saw broad-based strength across our network. Premium demand continued to outperform the system and was up 8% year over year. With over 90% of our premium fleet retrofits complete, we're on track to sell all 1.3 million incremental premium seats across the network ahead of the peak summer travel season. Encouragingly, first-class revenue continues to produce positive unit revenues even as capacity increases 5%. Internationally, the relevance of our network continues to drive strong results as guests are choosing to fly with us in more ways than ever before. Seattle-Tokyo reached profitability in March, less than a year after its launch, and load factors for both Seattle to Tokyo and Seoul exceeded 90%. We're extending this momentum with the launch of Rome next week, followed by London and Reykjavik next month. Early booking trends are tracking in line with expectations. with demand building nicely and premium cabins performing particularly well. Notably, more than 70% of guests booked on our new Roam service are at most members, materially higher than the rest of our network. Managed corporate travel was exceptionally strong, up 19% in the first quarter. Our international expansion has meaningfully increased Alaska's relevance with corporate customers. As a result, we are competing for, and in some cases exceeding, our fair market share in business travel on these long-haul routes, particularly in the US point of sale. We're also seeing improved domestic corporate relevance as global connectivity strengthens our value proposition for corporate travellers. Managed corporate demand remains robust in the Q2, with held revenue over the next 90 days up almost 30%. We are seeing broad-based strength across all industries, in particular manufacturing, financial services, and technology, and are beginning to see traction through greater sign-ups for small and medium businesses in our Atmos for Business platform. Turning to loyalty. Growth remains a priority for Alaska. Every major initiative we're executing on is driving relevance and growth for our members. These large-scale enablers, such as the Hawaiian acquisition and resulting domestic and international network expansion, the launch of our Atmos Rewards platform, issuance of a premium co-brand card, and free Starlink Wi-Fi on board for Atmos members, are all designed to accelerate growth across our portfolio and deepen engagement with our most valuable guests. And it's working. In the first quarter, we generated $615 million in cash remuneration from our co-brand cards. That's up 12% year-over-year, while active membership in the Atmos program grew by 13% year-over-year. Importantly, we're seeing particular strength in our Hawaii loyalty metrics, with double-digit year-over-year growth across members, new cardholders, and card spend. Over 70% of the Hawaii adult resident population is now enrolled in Atmos Rewards, reflecting the strong value proposition of our combined network and loyalty program, with two beloved airline brands and one world's expansive global connectivity. Spend from our Hawaii-based cardholders increased 19% year-over-year and now accounts for nearly 6% of the state's GDP. Our top-rated Atmos Rewards program is clearly resonating, attracting more guests, keeping them within our ecosystem, and reinforcing the strength of our loyalty flywheel. As we look to further accelerate the growth and relevance of our Atmos Rewards program, yesterday we announced a long-term extension of our multi-decade relationship with Bank of America. This newly expanded agreement delivers improved economics, all new capabilities, and a significant step up in marketing investment as we move to a single issuer of Atmos branded co-brand products. Through 2030, the agreement secures an additional $1 billion of total cash remuneration, while offering what we believe will be a step change in portfolio growth. These economics are incremental to what we shared as part of the Alaska Accelerate vision and go meaningfully beyond the $150 million of loyalty profit we targeted by 2027. We're grateful to the team at Bank of America for their longstanding and continued partnership. Turning to our outlook, we ended the year with one of the most prudent growth plans in the industry. The vast majority of our 2026 growth is concentrated in long-haul flying out of Seattle as we continue to build our new global hub and generate new revenue streams. At the same time, in response to current fuel environment, we've proactively trimmed nearly a point of capacity in May and June, including reductions in Mexico and select late-night departures in high-frequency markets. We now expect second-quarter capacity to be up approximately 1% year-over-year, again among the lowest growth rates in the industry, comprised entirely of our long-haul international service out of Seattle, while our North America capacity is down slightly year over year. The overwhelming majority of our capacity remains deployed in core hubs where we have scale, relevance, and strong loyalty. As conditions evolve, we will continue to prioritize margins consistent with the disciplined actions we took last year when we were the first large airline to reduce capacity in response to a challenging macro environment. Demand has shown resilience in the face of higher fares. Incoming yields for continental US markets have sustained an increase of 20% plus year over year in recent weeks, pushing held unit revenues in these regions to up double digits for the back half of the quarter. Given that we still have 35% of revenue to book in the quarter, and provided this demand continues, We would expect to see the system achieve high single-digit unit revenue gains with a path to 10% in Q2, despite an overall two-point drag from Hawaii-specific impacts in the quarter. To wrap up, while the near-term environment remains volatile, we continue to make strong strides on the initiatives that matter most to the long-term value of this business. and importantly we are not standing still as evidenced by our new co-brand agreement with Bank of America and the transition to a single passenger service system this week which will unlock the depth and breadth of our guest products and services seamlessly across our global network we're executing against Alaska Accelerate improving the durability and quality of our revenue maintaining prudent capacity discipline and investing in areas that strengthen our earnings power over time. I remain confident that the actions we're taking today position Alaska Air Group to emerge stronger as conditions evolve. And with that, I'll pass it over to Shane. Thanks, Andrew, and good morning, everyone.
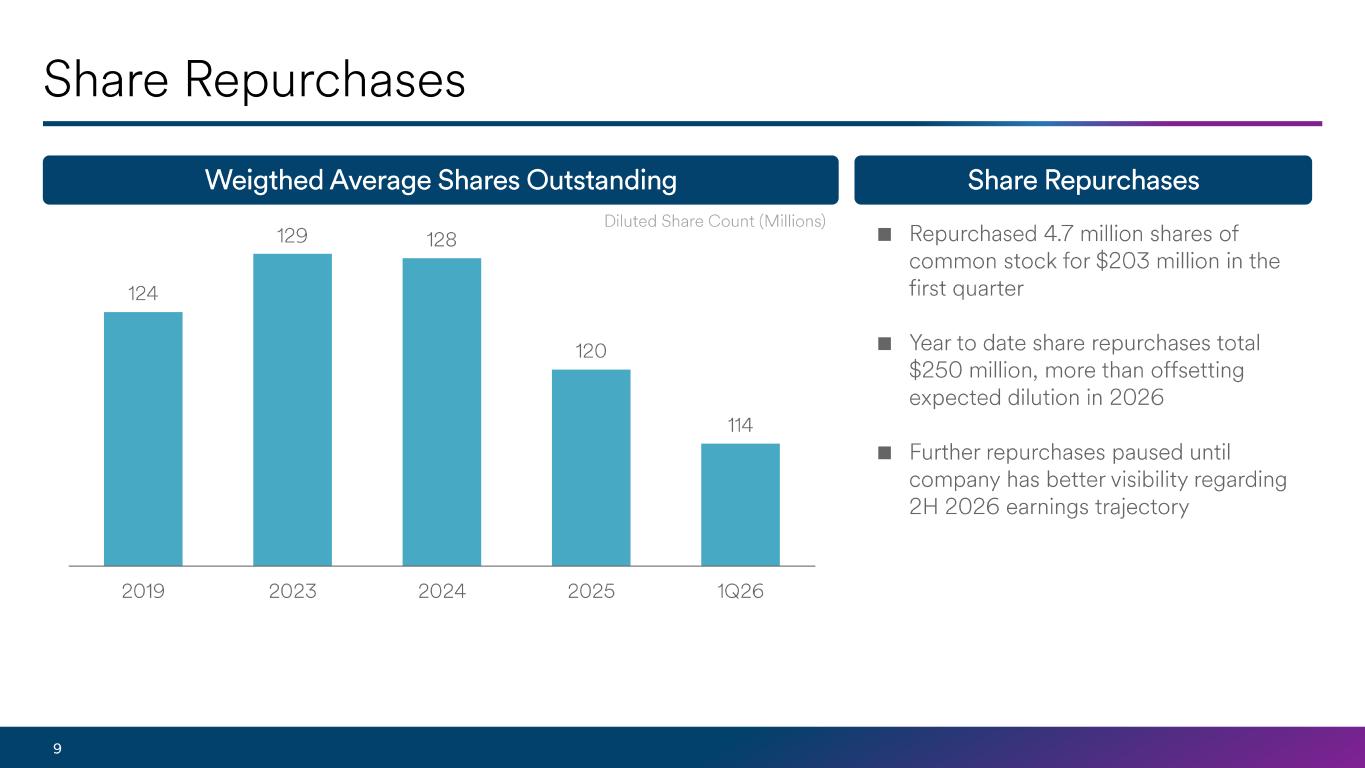
While we entered 2026 with strong momentum, geopolitical events have quickly disrupted that trajectory, driving an acute run-up in fuel prices that has put pressure on the entire industry. In moments like this, it's important to separate what has changed from what has not. Fuel has moved sharply higher and remains volatile. Demand for air travel has remained both resilient and strong. And we have continued to execute on both our integration and the Alaska Accelerate Plan, which is focused on building strength into the business for the long term. While we are once again navigating an unexpected and challenging backdrop, we know that successful airlines will be those with scale, relevance, and loyalty. The Alaska Accelerate plan delivers in each of those areas and also broadens our commercial model as we expand internationally and in our premium offerings, two areas of the industry where demand continues to grow rapidly. As we navigate the near term, we will double down on our core business model, operational excellence, high productivity, and providing award-winning service to our guests, while also delivering on continued investment in the initiatives that will grow our earnings over time. Against that backdrop, our first quarter adjusted loss per share of $1.68 came in better than the midpoint of our revised guidance, reflecting both the resilience of demand and the discipline with which we're managing the business. Absent fuel, which alone accounted for approximately $0.70 of incremental EPS pressure versus our original plan, and the impactful though transitory events in Puerto Vallarta and Hawaii that Andrew mentioned, we would have been well above the midpoint of our original guide. Our financial position also remains strong. We have approximately $2.9 billion of total liquidity, including cash on hand and our undrawn line of credit, and $20 billion in unencumbered assets. Net leverage was 3.3 times, and our debt-to-capital ratio finished the quarter at 61%. During the quarter, we repaid $340 million of debt, and we expect to repay $65 million in the second quarter. Given the dislocation in our share price in March and April, our share repurchases accelerated, bringing our year-to-date total to $250 million, which should more than offset dilution this year. We have $180 million remaining under our $1 billion authorization, but we'll pause further repurchases to evaluate the outlook for the remainder of the year. Turning to first quarter results and the second quarter outlook, first quarter unit costs were up 6.3% year over year, in line with our expectations as we lapped the final quarter of our new flight attendant CBA and experienced some pressure from winter weather and storms in Hawaii. Unit costs for the second quarter, given a close-in reduction of one point of capacity, will be modestly higher than our first quarter result. There are three areas driving this that are transitory in nature. These include the crew training costs for ramp-in of our 787 international flying, a headwind year-over-year given gains on the sale of our 737-900 fleet last year, and a planned employee recognition expense tied to achieving a single PSS system, the last major customer-facing milestone of the integration. There were several positive trends in our core costs in the first quarter as well, including strong improvements in both aircraft utilization and in productivity across our operation, which were achieved while moving back into the position of the industry's best operation. We also had strong performance in our maintenance division and positive trends in selling-related expenses, where we will continue to realize incremental synergies as we drive revenue growth. Our first quarter fuel price averaged just $2.98 per gallon, reflecting the initial increase in fuel costs that began in late February. We have seen refining margins more than double, and in Singapore, refining margins spiked more than 400% during the quarter. As a result, fuel sourced from Singapore, which historically has been consistently the lowest cost portion of our supply, became the most expensive, impacting roughly 20% of our total consumption. Given how dynamic the current fuel price and demand backdrop are, we are suspending our full-year guide until conditions stabilize and we have better line of sight to earnings beyond the current quarter. For the second quarter, the range of potential financial outcomes remains wide and difficult to predict. In just the past seven days, fuel prices have moved to as high as $5.15 per gallon and as low as $4.45. Given this, we are providing more detailed information on close-in unit revenues and unit costs than last quarter, where we focused our guide on an EPS range and capacity only. In the future, we plan to revert to EPS-focused guides as the long-term health and earnings capability of our business remains our top financial priority. For the second quarter, we expect unit costs to be about one and a half points above our first quarter result given we have reduced one point of capacity close in. Unit costs will inflect down in Q3 and Q4 to low single digits. Assuming continued strength and demand were the balance of bookings that come during the quarter are at currently observed yields, we expect a path to unit revenues of 10%. And for fuel, in April, we will pay approximately $4.75 all in, and given the current forward curve, we would put the quarter average at $4.50 per gallon. As of today, we are recovering approximately one-third of incremental fuel costs. We are also assuming a 32% tax rate, though this could change meaningfully depending on both in-quarter performance and also our full-year outlook as we exit the quarter. Any tax accrual changes are not expected to have cash flow impacts, as we expect to not be exposed to cash taxes in the near term. These assumptions result in an EPS estimate of a loss of approximately $1 per share. It is important to step back from the immediate challenges of fuel price, as fuel alone is driving the change in our expected immediate financial performance, and we believe that will normalize over time. Fuel price assumptions are adding $600 million of expense versus expectation for the second quarter, which is a $3.60 impact to EPS alone. The underlying business model is strong, and we see it getting stronger with all of the work we are doing on the commercial side of the business. Absent the fuel price spike, we would have expected to be guiding to a solidly profitable quarter. And absent the transitory Hawaii headwind to RASM, we believe our unit revenue trends are as strong as others who have reported. While this is not how we envision starting the year, the underlying demand environment gives us confidence and the work ahead of us is clear. We are now on the eve of our single passenger service system cutover, a peak integration milestone that, once complete, puts much of the integration friction firmly in the rearview mirror. That unlocks a simpler, faster-moving airline and allows us to fully turn our energy toward the opportunities in front of us. We remain fully committed to deepening the structural advantages that drive long-term success in this industry, scale, relevance, and loyalty. Over time, we expect our revenue profile to increasingly reflect that shift with a growing share of premium loyalty and ancillary streams that provide greater earnings durability across cycles. We are building the right business model, making real progress on the areas within our control, and don't anticipate slowing down in that pursuit. With that, let's go to your questions.
Operator
At this time, I would like to invite analysts who would like to ask a question to please press star, then the number one on your telephone keypad. We'll pause for just a moment to compile the Q&A roster. And our first question today will come from Jamie Baker with JP Morgan.
Oh, hey, good morning. Good morning, everybody. So when thinking about the RASM commentary that you just gave, so let's just stick with that 10% round number. Obviously, year on year, there are a lot of initiatives that are impacting that, plus some headwinds in Hawaii, which you laid out. I guess the question is, if we looked at same-store RASM in the second quarter, what do you think that number would look like relative to the 10% path that you've cited?
Sorry, Jamie, if I'm quite understanding your question, when you say same-store, which is year over year, which is sort of what we gave you. Capacity, I think, was marginally consistent year over year. I'm just trying to understand specifically, you're asking about synergies and initiatives impact?
Well, yeah. So basically, it's what that 10% RASM number would look like without the synergies in the initiatives. Just, you know, get down to sort of the core. So yeah, yeah, that's the question. What would the core RASM be without the synergies and initiatives that you've cited? It's a RASM question, not capacity.
Sure, sure. It's probably, you know, a couple of points. But again, some of these things like loyalty are just embedded in the core of our, you know, revenue now. But I would say a couple of points just to give you an answer on that.
Okay. And then second, it's a quick question on the PSS cutover. I know you were, you know, drawing down reservations on the outgoing system. Is the number of PNRs that you have to port over, I guess, by hand, you know, consistent with what your expectations were?
Yeah, actually, it was a very small number. I think 10,000, I might be give or take on that. But essentially, we drained down the vast majority of the system. And at 6.30 Eastern time this morning, our Inchon, Seattle, our Honeida, Honolulu, and now our JFK Honolulu check-ins have already started and passengers are already booking in and things are going fantastically.
Thank you for the color. Appreciate it.
Operator
And our next question will come from Connor Cunningham with Milius Research.
Hi, everyone. Thank you. Shane, maybe I could jump to you. I was hoping you could unpack the puts and takes on the second half cost trajectory. I mean, I realize you called out a fair bit of near-term headwinds i'm just trying to understand how those potentially roll off and then maybe just directionally how you see each quarter it's the only reason why i bring that up is that comps are all over the place so just any help there i think would be would be good thank you yeah hey connor thanks appreciate the the question um happy to to unpack this a little bit uh i just i want to reiterate and we said much of this in the script but just to frame uh in the second quarter, we're a bit up from the first quarter.
I think there's three to four points in the second quarter that are not really structural to the business. We cut one point of capacity close in. That's always tough to remove the costs when we do that, but it was totally the right thing to do. We've got a point of buildup of crew for our 787 Seattle International flying. That's going to normalize in the business as we begin this flying in earnest out of Seattle, which obviously starts here in a couple of weeks into Rome and then throughout the summer. We do have some planned recognition for employees, given all that they've been through over the past year and a half or so with integration, and we're lapping some asset sales from last year. So, you know, I think like structurally the core business is not at sort of closer to the 8%, but probably more like 4% to 5% on a really low growth rate. In the second half, what you're going to start to see and I do think a lot of this is enabled by getting through this last PSS integration milestone. We really are at peak friction over the last couple of quarters with integration and now we can go to like peak focus on optimizing the airline. Like unit wages will exit the year at a rate that's equivalent to or lower than our Q4 2025 results. So we're starting to see productivity really tick up. There's more to come. We've got a lot of fleets. We've got a lot of opportunity over time to continue to right size the network, the banking in our airports, and ultimately rationalize the fleets over the next several years and accrue some more productivity gains through those efforts. Our third party costs for the operation where we use partners to manage ramp and manage airports those are down on a unit basis and will continue to to reduce on a unit basis through the second half of the year we're absorbing all of the inflation core inflation in those contracts through just getting more productive with those partners aircraft maintenance per block hour you'll see continue to perform well throughout the second half of the year aircraft maintenance is always a little bit spiky they'll go up and down quarter over quarter with volumes, but we expect 2026 in total to be less on a per block hour basis than it was last year. We mentioned in the script we have structurally lower cost of revenue to selling expenses, and even though selling expenses likely rise with much higher revenues and fares, on a structural basis they're lower costs than they were pre-integration. Those are a few of the areas. The places where we have challenges that are more structural, we've talked about. There's nothing new. Airport costs. We have generational investments in the West Coast, very similar to the rest of the industry. Those are still normalizing into the cost base, will be for the next couple of years. And then we have these buildup costs that are really related to transforming the airline into an international player in Seattle. Obviously, I mentioned crew, and then we have some guest facing costs as well. The last thing that we have in front of us is joint CBAs. We need to bring the Hawaiian employees up to Alaska rates. There's no real timing on that. I think the backdrop, you know, makes some of those discussions probably spread out a little bit. But the last thing I'd say, and I know this is a longer answer, so I just wanted to give you guys all of the detail. Nothing that we see in the cost side of the business is a surprise to us. And we actually see most of the areas that we're really focused on forming better in overtime really starting to gain traction. And I think you'll see that in the third and fourth quarter of the year, and we'll have a lot to say about it when we get to those earnings calls.
That was a very detailed answer. Thanks. Just, and then, Ben, the conviction level on the $10 figure still sounds really high. It sounds more like it's floating now rather than a 27 number. And you can correct me if I'm wrong there, but just your words, you talked about it being an unpredictable environment over the past like 15 to 16 months. So what is working that gives you so much conviction? It seems like international is better, loyalty is a lot better, but there is obviously a lot more headwinds associated on the cost side that are kind of just out there in the world. But just what gives you more conviction on this $10 figure long-term?
No, Connor, it's a great question. Thanks for asking it. Look, from where I sit, absent fuel, our company is firing on all cylinders. When I look at Alaska Accelerate, when I look at each and every initiative that we laid out there, this company is executing. You look at PSS, this is a major, major milestone. We're executing it. It's going to be a flawless execution. And so I feel really good. You know, one of the things, and I'm surprised we haven't got the question yet, even with 2027, so a couple things. One, this new Bank of America deal, again, I'm not sure if you caught it in Andrew's script. It's a billion dollars in incremental cash over the next five years, which in 2027 will have a point of margin. You know, we've restructured the Amazon deal from losses to not having losses, and we've got a little more work to do on there as well. And then overall, I think if you believe that fuel prices will moderate, I'm not saying it's going to go back to what it was pre the crisis, but if they moderate and some of these fare increases are sticking, you know, we're getting an average of, you know, in the $25 on an average fare, give or take which market it is, I believe we have a strong chance of coming out into 2027 and hitting that $10 BPS. Now, I can't tell you from where I sit today because the world's unstable, but as we get into the third and fourth quarter, we'll have some pretty good line of sight to tell you where we'll be. But I will tell you, if it's not 27, it's coming. I've never been more convicted. Things are working. Our strategy is working. We're executing, and I feel really good about it.
Operator
And we'll move next to Andrew Dodora with B of A Global Research.
Hi. Good morning, everyone. I guess maybe moving to demand a little bit, one of the bigger questions we get from investors is just around kind of demand elasticity. Just based on your prepared remarks doesn't seem like there's much evidence of that at all. But I guess, one, are there any particular markets where you might be seeing some pushback on this higher pricing, obviously, outside of, say, Hawaii or Mexico? And then second, if not, how do you generally think about demand elasticity in this environment? And are you thinking about positioning your network differently than what is planned today in order to get ready for that?
Hey, thanks, Andrew. I'll just say on a personal note that, of course, there is elasticity in demand in my personal view. In fact, we've seen it here personally. We've had all these fare increases that have been great. and then the RM folks had to go in and manage some of the buckets down and we found a really good sweet spot. So there is absolutely elasticity, but I think in the current environment that it's well able to absorb the double-digit increases in the fare environment. People want to fly. The aeroplanes are full. So I think that's all good stuff. I think as it relates to the network, Andrew, you know, we're only really growing three areas, really. We're growing San Diego at around 20%. We're growing Portland in the high teens, and we're growing an international gateway. And I think those are all areas of opportunity and strength, loyalty, revenue, seat share. So we feel really good. And as I shared in my prepared remarks, the reality is that the only real absolute growth, because the Portland and San Diego is moving seats around domestically, is really international. And we're just very excited, and we're seeing loyalty, fares, front cabin. And, you know, we have a long way to go to get really proficient here, so it's really good. So as we sit here today and as long as demand holds up, we feel really good about our network shape.
And, Andrew, it's Ben. The other thing I'll add with what Andrew said, and I think you asked it, look, we have a fantastic fleet now. What's different between before Hawaiian and post-Hawaiian is we have a much more diverse fleet that we can be more creative in exploring new markets where we see higher revenue potentials. You know, we've got 30 whitebodies now, and that's a lot of dry powder for us to do some pretty novel things. So there's a lot of things that we can do that we're going to do to make sure that we get the most revenue coming in at this company.
Thank you for all that. And then just my second question, obviously, industry consolidation has been in the headlines recently. You've been one of the very few acquirers over the last decade or so in the space. Do you think further consolidation is something Alaska would want to continue?
You know, look, I think consolidation can only happen having had the experience doing it. It's got a big hurdle, Andrew. I mean, it's got to be pro-consumer and pro-competitive. Those are two hurdles that you have to get over with the DOJ, with the DOT, and a lot of other stakeholders out there. So we know how hard it is to get past, you know, those two, you know, big hurdles. We have the experience. We know how to do it. But like I said, I am super excited about our organic growth plan. I am still focused on a $10 VPS, and that's where we think a lot of value is going to come with our plan. Now, look, I believe with our plan is always to look at what's good for our company and the stakeholders, the people who care about Alaska. So what do our employees, customers, and our communities, as well as our shareholders, looking for Alaska? And we will always make the right choice given that.
Operator
And we'll move next to Sabi Saif with Raymond James.
Hey, good afternoon. Just curious on the – you mentioned kind of long-haul operations and how Seattle's progressing. I was curious how the kind of the Hawaiian long-haul operation is progressing.
Hi, Savi. As you may recall, we made some adjustments to the Hawaii. We discontinued Fukuoka. We discontinued Narita, moved that to Seattle. So, you know, it's on a year-over-year basis, it's improving. We're mostly left with Japan and Australia, and we continue to move unit revenues forward there. Oh, and the other thing I should add, too, is now the Hawaii long haul will welcome one world into the fold, which will give all these elite guests, and whether it's Qantas or Japan Airlines, fantastic benefits.
I appreciate that update. And can I ask, I think you mentioned in the opening remarks improvements to the Amazon contract. Just wondering if you could give an update on just cargo in general.
Yeah, thanks. Thanks, Savi. and maybe I'll hit Amazon very quickly, and I don't know if Jason wants to say just cargo in general because I think it was a bright spot here for us in the first quarter. We've really enjoyed getting to work more closely with the folks at Amazon. We know them because they're neighbors of ours. We have folks who used to work in Alaska over there. So we've worked on deepening the partnership, and I think it's going well. The partnership is getting better. It's getting healthier. We're continuing to talk about how we can deepen it further in a way that's mutually beneficial to each other. And so we had a nice sort of update to the agreement that's enforced today that helps us on the economic side, and we're hopeful that we can expand that through more partnership over time. Maybe just very quickly, Jason, because we're going to try to move through questions. Hi, Savvy. This is Jason.
Just on the high level on the cargo piece, at the start of the year, we did get to our own single cargo system at the start of the year, which really allowed us to unlock that connectivity which we've been talking about. And we're just really beginning to start to harvest from that.
Operator
Our next question will come from Scott Group with Wolf Research.
Speaker 2
Hey, thanks. So historically, whenever we see fuel go up, RASM goes up a lot. We're seeing that right now. And then when fuel goes back down, usually RASM goes back down with it. Do you think it's different this time?
Maybe I'll sort of try to take a shot at answering that, Scott. I think we believe that there's a lot of reasons that it could be different this time. I do think, you know, 15 years ago we had different reasons, but a similar sort of spike in fuel, tough economy, structural changes in the industry, And then, you know, fares that were modestly higher coming out of it and actually did great from an earnings profile perspective for several years. I think the rapidity with which some of the fares have gone up and the stability with which bookings that we've seen over the last several weeks, you know, suggest, like Andrew said, people really want to travel. And when they have discretionary income, one of the priorities that they have, it would appear, is to go out and experience the world. And I think some of these fare increases, $10, $15, $20 on the total cost of vacation is pretty modest. So that's on the sort of consumer side. It's really important that people that are on our airplanes feel like they have a lot of value for the fare that they're paying. And we're focused on investing in all of the experiences that we have throughout the entire aircraft and on the ground and also digitally. And so we're super conscientious about the incremental price being paid. and we need to deliver good value for that. I think on the other side, the industry structurally has to get healthier. You've got multiple airlines, you know, at near failure before $4, $4.50 fuel, and that just doesn't work structurally long-term. And so I just think there's a lot of factors that suggest this could be stickier, but we don't know. I think it's really dependent on how the economy unfolds over the next several quarters.
Speaker 2
And then just one quick follow-up. I think, Andrew, in an earlier question you were, I think you were sort of implying that, you know, of the 10 points of RASM, like two points or so, that is, you know, a couple points is like more company specific or synergy, whatever you want to call it. Like, do you think that couple points continues at that pace? Does it, can it accelerate from here with credit card deal? Does it naturally at some point start to just slow? How do you think about that two points going forward?
Yeah, I think I'm just looking at my CFO and CEO here. That's an imperative that it will continue. But jokes aside, we have, you know, dynamic pricing about to hit. We've got O&D coming. As I shared, the economics of the bank relationship, that billion dollars over the original term, which is sort of going to happen, it doesn't include actual incremental growth from our historic growth wage, which started to flatten out. So I think overall, we absolutely still have the view that we can close the RASM gap to the industry and that we will continue a unique momentum on the revenue side.
Yeah, and Scott, I just remind, like, a lot of the synergy – sorry, a lot of the initiatives value were to come. So we're just completing the 800 remodels. We haven't begun selling the full fleet of those. We have other things that we need to do in the wide bodies, which are beyond 27, but will be, you know, further initiatives that we control that aren't really subject to the rest of the industry. So, there's a lot of initiatives that are still to come for us to keep driving something like two points into the P&L for a while yet.
Thank you, guys. Thanks, Scott.
Operator
Our next question comes from Thomas Fitzgerald with TD Cowan.
Speaker 2
Hi, thanks very much for the time.
Maybe just sticking with the bank deal again, I think you talked about being a step change in portfolio growth. Could you maybe elaborate that a little more and then just maybe put a finer point on the cadence and any benefit this year and then in between the point of margin in 27 and as you get to that billion by 2030?
Yeah, thanks, Tom. And maybe Shane wants to get the second part of that. But just to be clear, because it's a really important thing that's going on here is what's happening is, is that with our partner with Bank of America and this really this refreshed agreement with many different elements in it that have changed, going to help us realise the benefits of number one, obviously, the acquisition of Hawaii. Number two, the launch of Atmos Rewards. Number three, the expansion of a long-haul network out of Seattle. And so we're already starting to see, and of course, the marketing investment, there's a big step change there. So I think what I'm trying to say is that at the end of the day, the changes in Air Group's business and fundamentals and the changes in the agreement, I think we're going to have and create for ourselves a much longer-term, wider pathway for growth in loyalty and especially in credit card, which, as you know, are very important to our economics.
And quickly on the margin, it's roughly a half point of margin this year and a full point of margin next year. And that is before what Andrew was just sort of alluding to, which is portfolio growth that could be stronger than we're seeing today. And that's our expectation, but we're not putting any of that into a forecaster guide at this point.
Speaker 2
Okay. That's really helpful. Appreciate that, guys.
And then just thinking about some of the network initiatives, the growth in San Diego, the rebanking of Portland, would you mind maybe just running through your hubs, maybe either by RASM or profitability, but just rank ordering them? Where are you seeing the best performance? Where maybe room for improvement?
Thanks again for the time. thanks tom yeah um that that's those are questions i'm not uh we don't really answer but you know obviously seattle's our largest hub honolulu's our second largest and if you look at what we're doing i think those are 40 50 nearly 65 plus percent of our total capacity we've got two large accelerants in both of those one obviously in seattle re-banking and obviously global long haul and then in honolulu and hawaii in general um with the integration and all the good things that come from that. So we continue to feel really good about the improvement in the economics there. And then again, in places like Portland and San Diego, we just believe our product, our customer service, what we're offering are going to continue to be very valuable.
Operator
Our next question will come from Atul Mahaswari with UBS Securities.
Good afternoon, or rather good morning. Thanks a lot for taking my question. I had a question on cost. So is the back half low single-digit CASMX a good run rate for us to use for 2027 as well, now that the PSS integration is behind us, or are there any puts and takes specifically as it relates to 2027 on the cost side that we need to be aware of?
Yeah, thanks, Atul. No, I think, look, a couple of things I want to say. One, our long-term view on growth is, like, you know, something around 3% to 4%. We haven't grown at those target rates for a couple of years. We think the core cost inflation in the business is 4% to 5%. So we need to ultimately, you know, get into the 3% to 4% range to have an opportunity to fully offset the core inflation. But there should be opportunities to go get at least a point of better unit cost performance through optimization of the business and through productivity. So that's our thinking structurally about the business over the next year or two. We do have, as I mentioned before, joint CBA deals that are in front of us. It's hard to say if those will be in cycle or out of cycle with the rest of the industry as those other deals come up on other properties. But that would be the one outstanding area that we're going to have to ultimately get deals with our employees on and absorb those into the P&L. I don't think they're super material, but they are the one sort of outstanding item that's kind of non-standard.
Got it. That's helpful. And then as my second question, I was reading some energy reports that global refining capacity is basically down 6% to 8% since the war started. The question is, how long can this disruption persist, in your view, before it causes real jet fuel availability problems in markets like Singapore, where you source from? So what are you saying in that market right now, and how are you preparing the business to sort of actually become an issue there?
Yeah, thanks, Atul. I'm going to answer as much as I can. We obviously are not the absolute expert on, you know, global oil supplies or refineries. We do understand our markets really well and our supply chain really well. We don't foresee any disruption any time in the foreseeable future across our network. We are not so sourced out of Asia or Singapore into any of our markets. And if we need to supply Hawaii, as an example, from the domestic market, that is totally within our ability to do so. I do think, you know, our hope is long-term it normalizes. Singapore refineries come back on strong and those costs return to where they were pre-conflict as it was a really nice lower-cost source of fuel for us into the network. And we would like to enjoy that structurally over time. And then, you know, we've talked about this a bit. We won't go deep in it. From an industry perspective, we need to work on the West Coast Jet-A supply issue long-term. There's just increasing desire to fly and demand for Jet-A, and we don't have the pipeline infrastructure or refinery infrastructure that the Gulf Coast or the East Coast has. So, you know, that'll take time, but it's something that we're focused on. and I think other airlines are starting to focus on along with us.
Thank you. And good luck with the rest of the year. Thank you, Atul.
Operator
We'll move next to Catherine O'Brien with Goldman Sachs.
Hey, good morning, everyone. Thanks for the time. Maybe just on some of the route network changes, you know, you know that Seattle to Tokyo route has already reached profitability. Soil load factors are really strong. Can you speak to the profit swing from moving those aircraft from more leisure-focused Japan point-of-sale flights to more, you know, mixed travel-purpose U.S. point-of-sale. How big of a bottom-line impact was that in 1Q or just really any way to think about what that swing could look like, how that's ramping versus your expectations back when you announced the transaction?
Yeah, thanks, Katie. I think just high-level what I will tell you is, and we track this as part of, honestly, our synergies, is the movement from Honolulu to Narita, to Seattle Narita. There has been meaningful increase in the profitability of that route. And of course, it obviously accrues significantly to our loyalty base, corporate base. We're already seeing numbers there. So I think what it's really helped us do is, from a network perspective, invest and continue to grow Seattle. So I think that's been a very good move.
Katie, I don't think we've priced sort of the losses that were associated with the aircraft we're using for these markets, but they were in the tens of millions. So it's a meaningful change to the underlying economics of the company.
That's great. And maybe just a little bit of a follow-up on the corporate angle here. On the 19% managed corporate revenue growth, is it possible for you to break out what the domestic growth was versus the total? I'm just trying to get a sense of how meaningful layering in that international connectivity is. And do you have enough international flying to maybe try to go after additional share in your next round of corporate negotiations?
Yeah, thanks, Katie. Just to really put this in perspective, the vast majority of all of our managed corporate travel is obviously still North America and domestic. And we'll probably give a little bit more visibility over time. What I can tell you, you know, obviously London is going to be huge, but we're already seeing as a percent of our managed corporates, it's a very, you know, low percentage. But I'm already seeing that number move up and revenue multiple points ahead of the actual passenger share as well. So I think more to come. We're in very, very early innings here. And I think as we get these all launched and single passenger service system and loyalty and all the rest of it, I think we'll have a lot more exciting things to share. But it's headed in the right direction.
Operator
Great. Thanks for the time.
Operator
Our next question will come from Brandon Oglinski with Barclays.
Hey, good morning, and thanks for taking my question. Ben, I guess I appreciate the confidence in hitting $10 at some point here. But at the same time, I mean, it's different issues. But the second year that we're talking, you know, about fuel prices and specifically, you know, West Coast challenges, and I think, you know, maybe Shane hit it there that longer term there could be an issue here. So how are you positioning your business, I guess, from a commercial perspective to potentially deal with maybe a higher differential on the West Coast?
You know, it's – Brian, it's a great question. Look, I think if you would have asked me three years ago with the standalone Alaska, it would have been a lot more difficult for us. But now I think we have we're flying to different geographies and we have the airplanes to access any part of the world today. And what gives me confidence to say, look, the world and believe me, I'm not looking at this through rose colored glasses. I know that every year there's something happening in the world where you have to pivot and move the business somewhere else. And I think we're becoming good at it. You know, we're getting through this acquisition. This acquisition is making us a more resilient, bigger, stronger airline. And we will have from, you know, what I believe are strong hubs that we operate from scale, relevance, and loyalty to build on those networks. So I'm confident. I can't predict the future, but I can't predict the way we're executing. I know what we have. We have a phenomenal group of employees who are excited. We have great assets. We have a great balance sheet. And we have a track record of delivering and executing. So that's what gives me confidence. I'm not going to predict the future, but I'm going to bet on Alaska.
Brandon, just on the second part of the question on fuel structure, and I alluded to some of it, I think long-term, one, we do think Singapore is going to be a nice, stable source of much lower-cost fuel than Gulf Coast. We're doing 20 percent of our fuel from there, and we like the idea of moving that up materially, maybe even to 30 or 40 percent over time. The other thing we're doing is building with some partners are working on building infrastructure here in Seattle to be able to take tankard fuel into Seattle, which would be a game changer for us in terms of the supply chain. I think there's a lot of interest in ultimately getting that work done. These are long tail investments, though, and so it's nice to talk about them, but it's probably a ways away before we structurally are able to begin to resolve this. Just one last reminder, we've had a $0.10 to $0.15 fuel disadvantage structurally for our entire life out here on the West Coast, so this isn't new for us. And we've, even with that, been able to outperform most of the industry on margins over time.
Okay, appreciate those responses. And just maybe really quick for Andrew, is the new co-brand deal included in your RASM guide for 2Q, or should we expect those benefits to actually ramp later in the year? Thank you.
Yeah, so the agreement is reflected in the second quarter results as it ramps in, and as Shane mentioned, half a point of margin this year ramping to a point of margin on the structural changes, and I think we can do even better than that.
Operator
And we'll move next to Dwayne Fenegworth with Evercore ISI.
Hey, thanks. Just on pilot training, can you speak to changes across the two segments? You said you're back to growing Alaska, but overall growth is flattish. Maybe just speak to what's growing versus what is shrinking. And then what are the drivers of increased pilot training costs? Is this all aircraft that are coming over from Hawaiian? Is attrition a component, and when do you expect that to normalize?
Thanks, Dwayne. So that was a few questions on pilot training. It is not attrition. So attrition is effectively zero absent retirement. So we have normal retirement patterns. We're not seeing our folks leave for other airlines. That was done a long time ago. The majority of this in Q1 on a year-over-year basis is really building up the Seattle International Flying. We've announced and have opened a pilot base here in Seattle on the 787. And that flying takes more pilots per flight than, you know, Honolulu to the West Coast, even on a wide body would have taken. So we've just got to get that ramp up into the base, get the flying started, and then it will normalize on an annualized basis as we take, you know, one or two 787s per year over the next few years. On the Alaska side, we just coming, you know, out of the last couple of years, we had room in our productivity within the current number of folks we had on the property for Alaska. And we're back to starting to look forward to taking incremental units throughout the back half of the year. And you've got to train early to get ready for summer flying. So we've got some modest incremental costs here every year on the Alaska training side.
Thanks. And then just just a quick follow up on cargo. Can you frame how big of a headwind it was, you know, to your to your recent results? And is the goal to get this to, like, break even or something better than that? And if the goal is break even, then then why do it? Thank you.
Thanks. Maybe I won't share where the specific economics on the freighters were. No, no, no. If we're going to go put time into flying aircraft around, we feel like we need to earn a reasonable margin, not a break-even margin. That's not really our philosophy in terms of investment. So we'll be focused on generating decent returns on this flying. I do think over Over the next year or two, we're excited, regardless of the freighter contract, the opportunities with Belly Cargo on the widebodies, the opportunities to continue to grow our own freight market share up in the state of Alaska and along the West Coast, and we're anxious to get to talk more about that over the next year or two. Appreciate the question, Dwayne.
All right, everybody. Thanks for joining us, and we'll talk to you next quarter.
Operator
This does conclude today's conference call. Thank you for attending. You may now disconnect.