Operator
Thank you for standing by. Welcome to Allstate's first quarter earnings investor call. At this time, all participants are in listen-only mode. After the prepared remarks, there will be a question and answer session. To ask a question during this session, you'll need to press star one one on your telephone. If your question has been answered and you'd like to remove yourself from the queue, simply press star one one again. Please limit your inquiry to one question and one follow-up. As a reminder, please be aware this call is being recorded. And now I'd like to introduce your host for today's call, Alistair Gobin, Head of Investor Relations. Please go ahead, sir.
Good morning, everyone. Welcome to Allstate's first quarter 2026 earnings call. Yesterday, following close of the market, we issued our news release and investor supplement and posted related materials on our website at Allstate Invest Infects. Today our management team will discuss how Allstate is creating shareholder value. Then we will open up the line for your questions. As noted on the first slide of the presentation, our discussion will include non-GAAP measures for which reconciliations are provided in the news release and investor supplements. We will also make forward-looking statements about Allstate's operations. Actual results may differ materially from those statements so please refer to our 2025 10k and other public filings for more information on potential risks.
Let's start with three of our recent advertisements and then Tom will be I'm a 200 year old elf and while I might be holding up on the outside on the inside I'm dead oh man it feels good to just let go If you don't have the right home coverage, well, this could break your bank. Switch to Allstate, and you could save hundreds. Put it on my tab. I'll show myself out.
I checked Allstate first and saved hundreds on my car insurance. Unfortunately, I did not check my outfit before meeting my girlfriend's family. Checking Allstate first was an excellent plan. Not checking which team my girlfriend rooted for?
Not great. So check Allstate first, and you can save hundreds. Next girlfriend.
Protecting what you care about is important to you, so it's important to Allstate. That's why we have a plan to protect just about anything. Like this car. Up, up. And this awesome bike. The stuff in that apartment you're renting, it's protected. This golf cart, it's protected. Hey, don't worry, that phone's protected too. Protection for just about every part of life, no matter what kind of life you have. If it's important to you, it's important to us.
You're in good hands with Allstate. ...reinforces a simple message, check Allstate first.
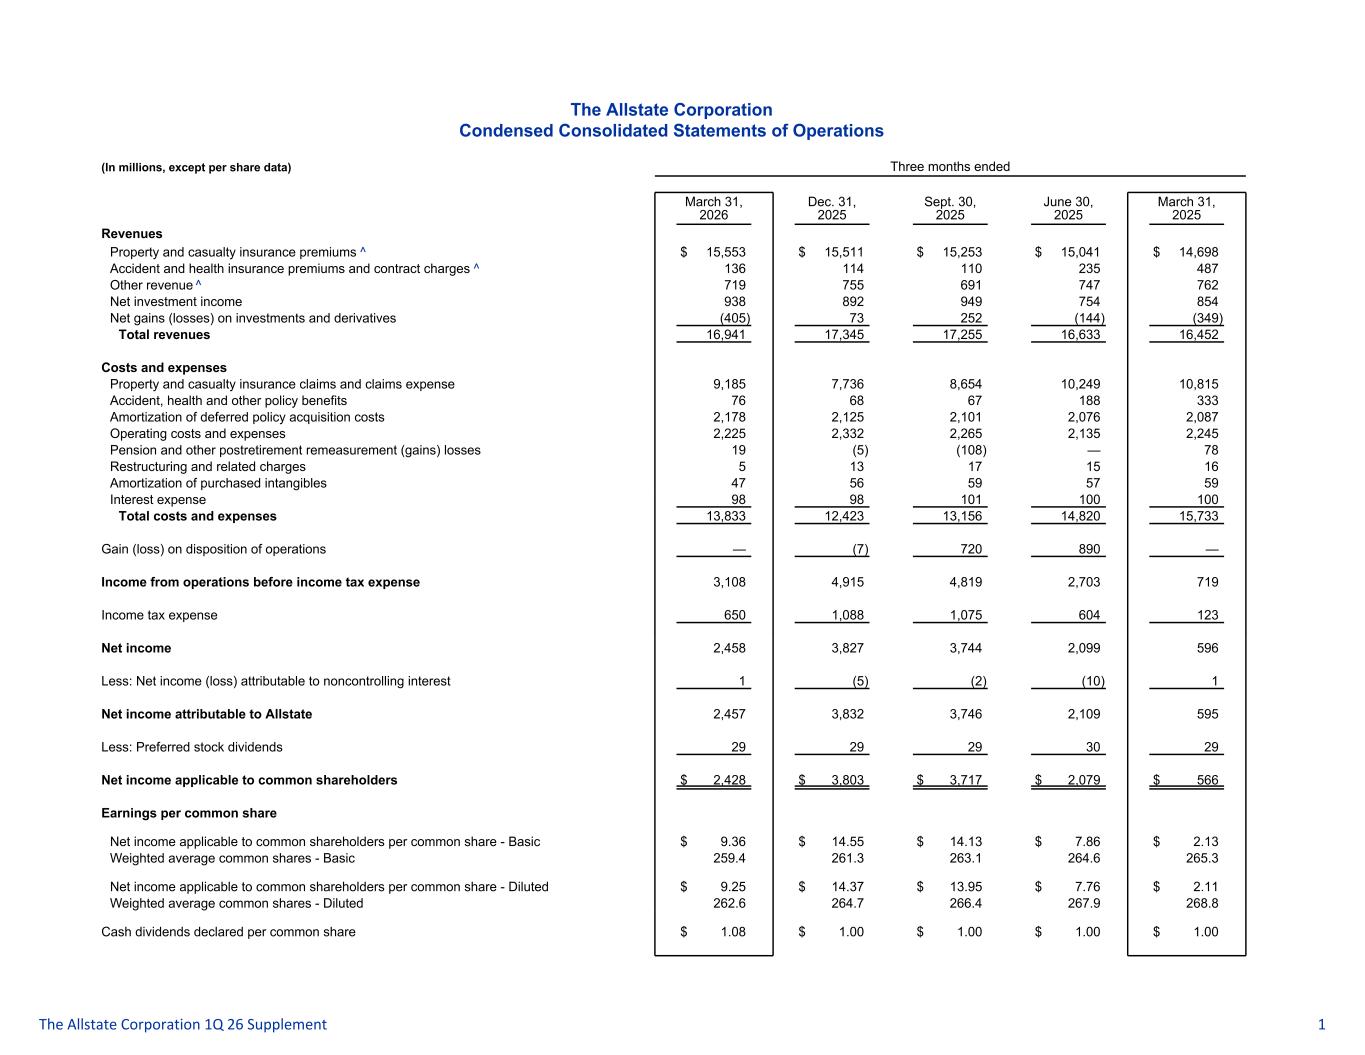
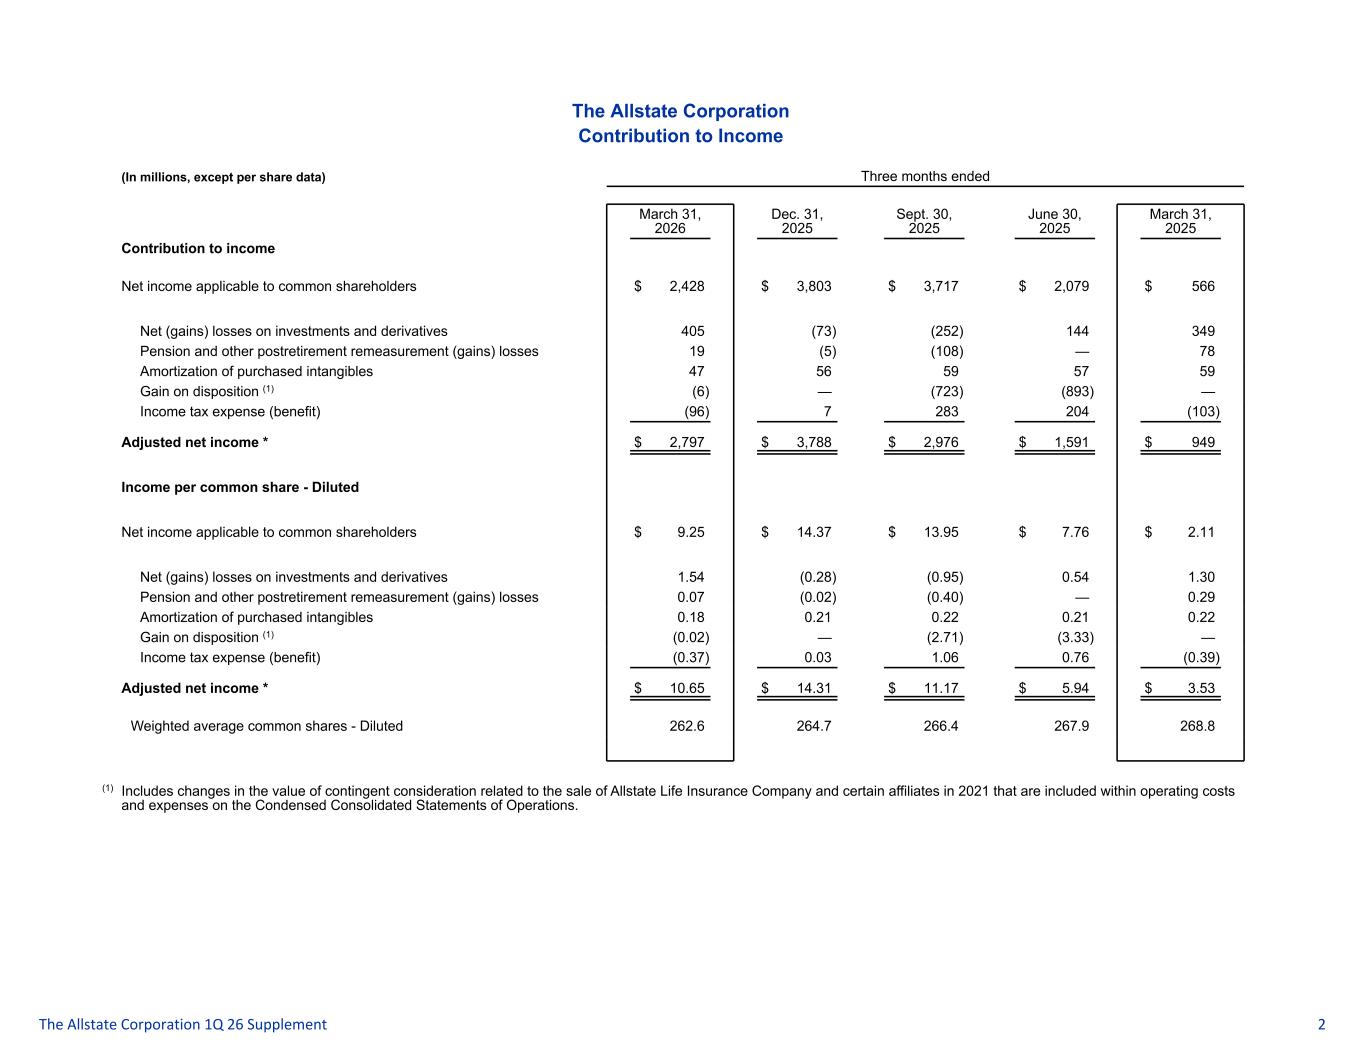
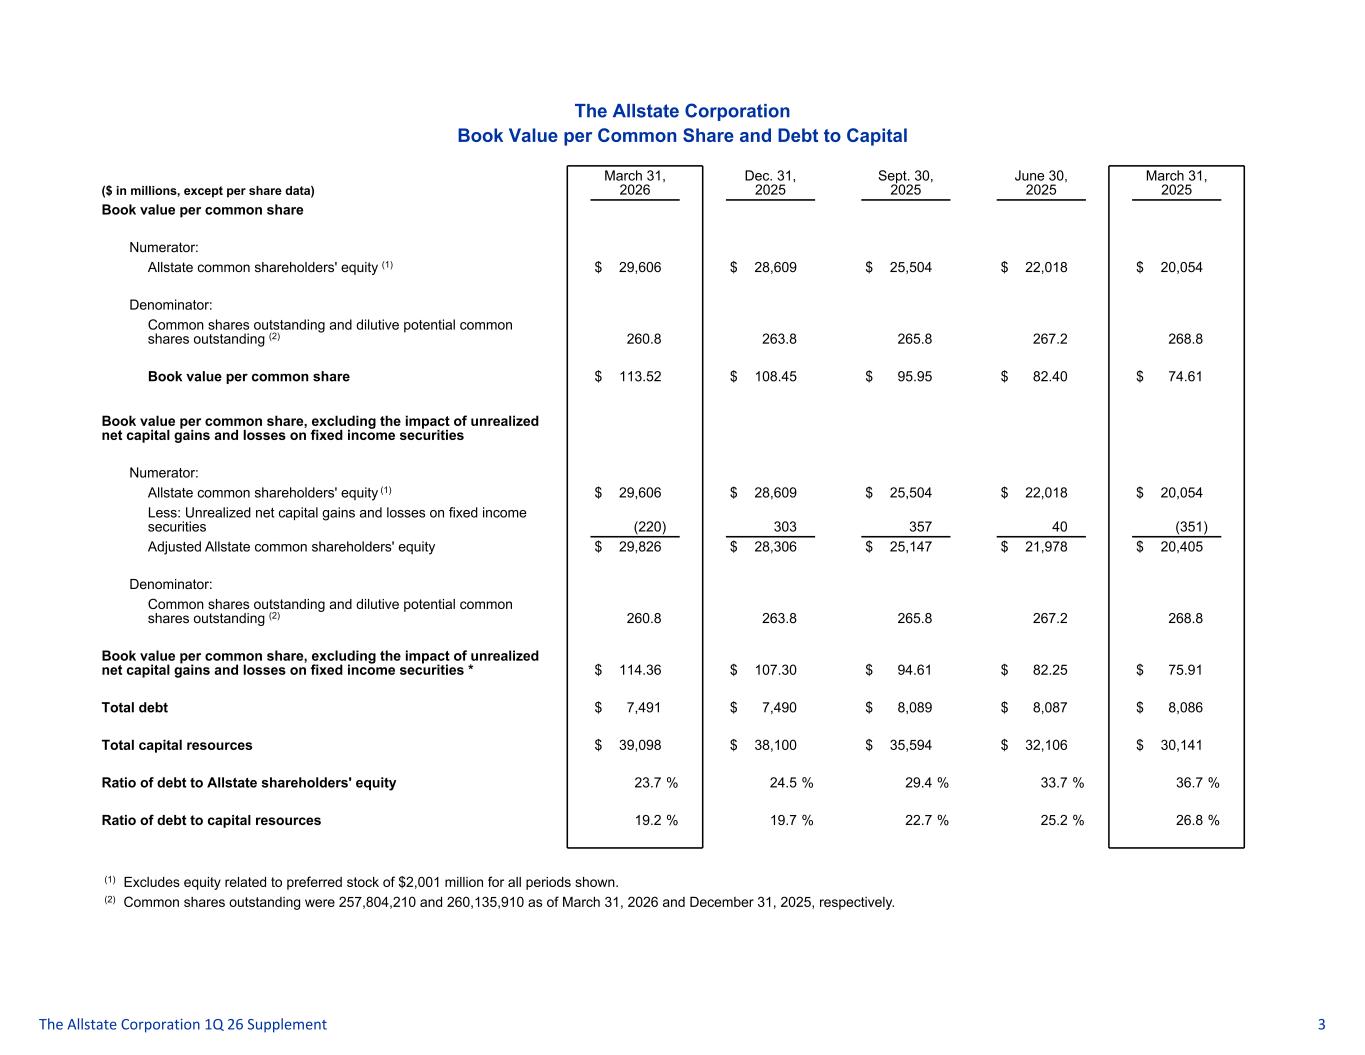
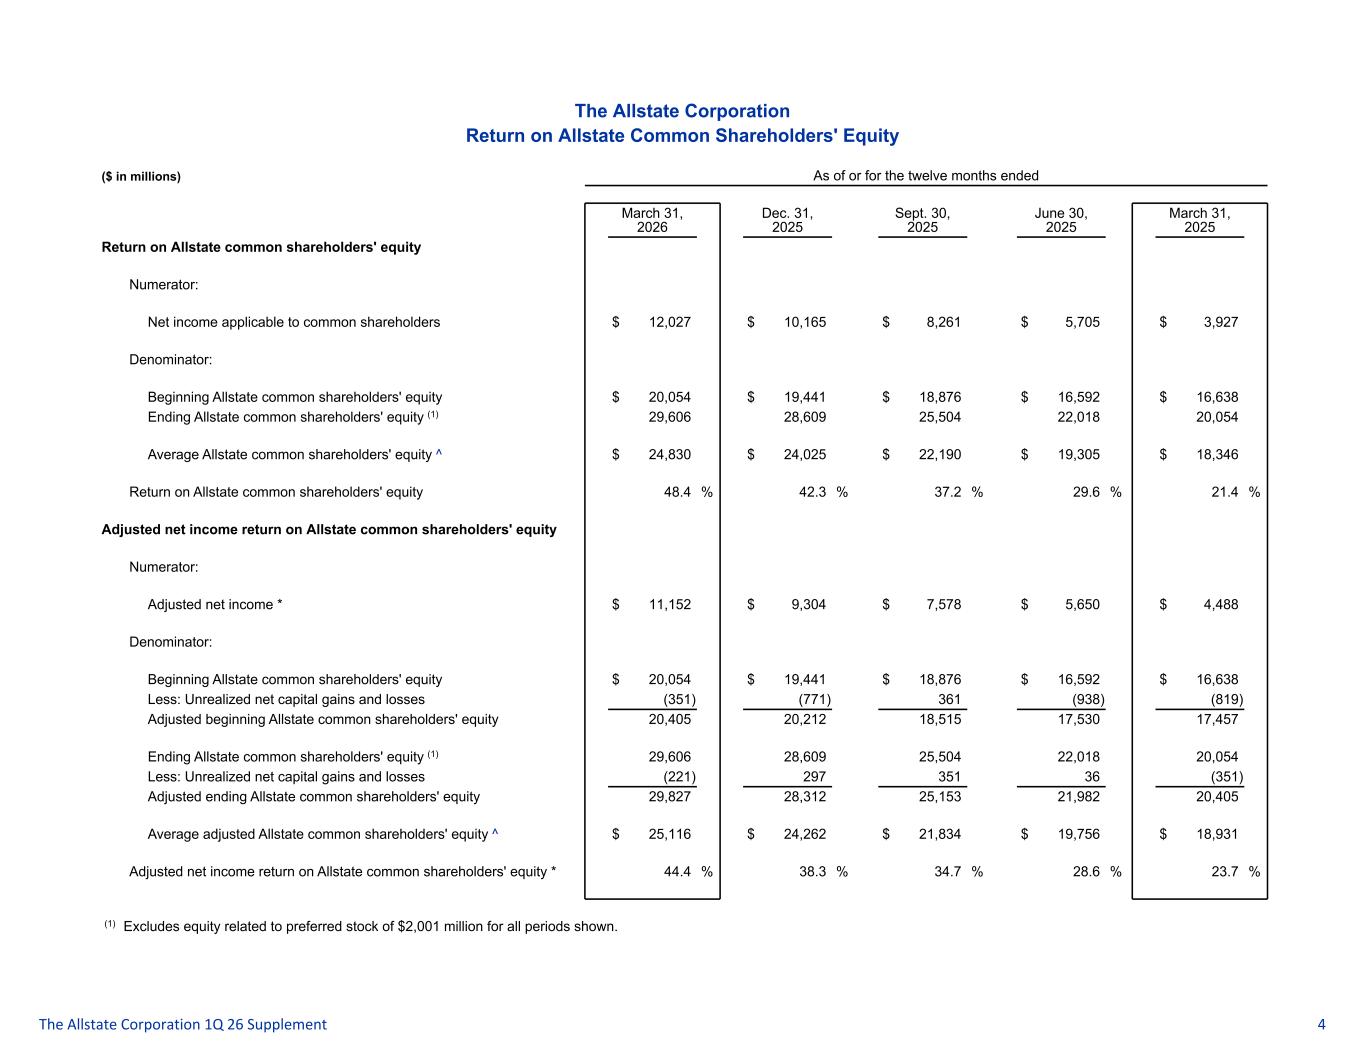
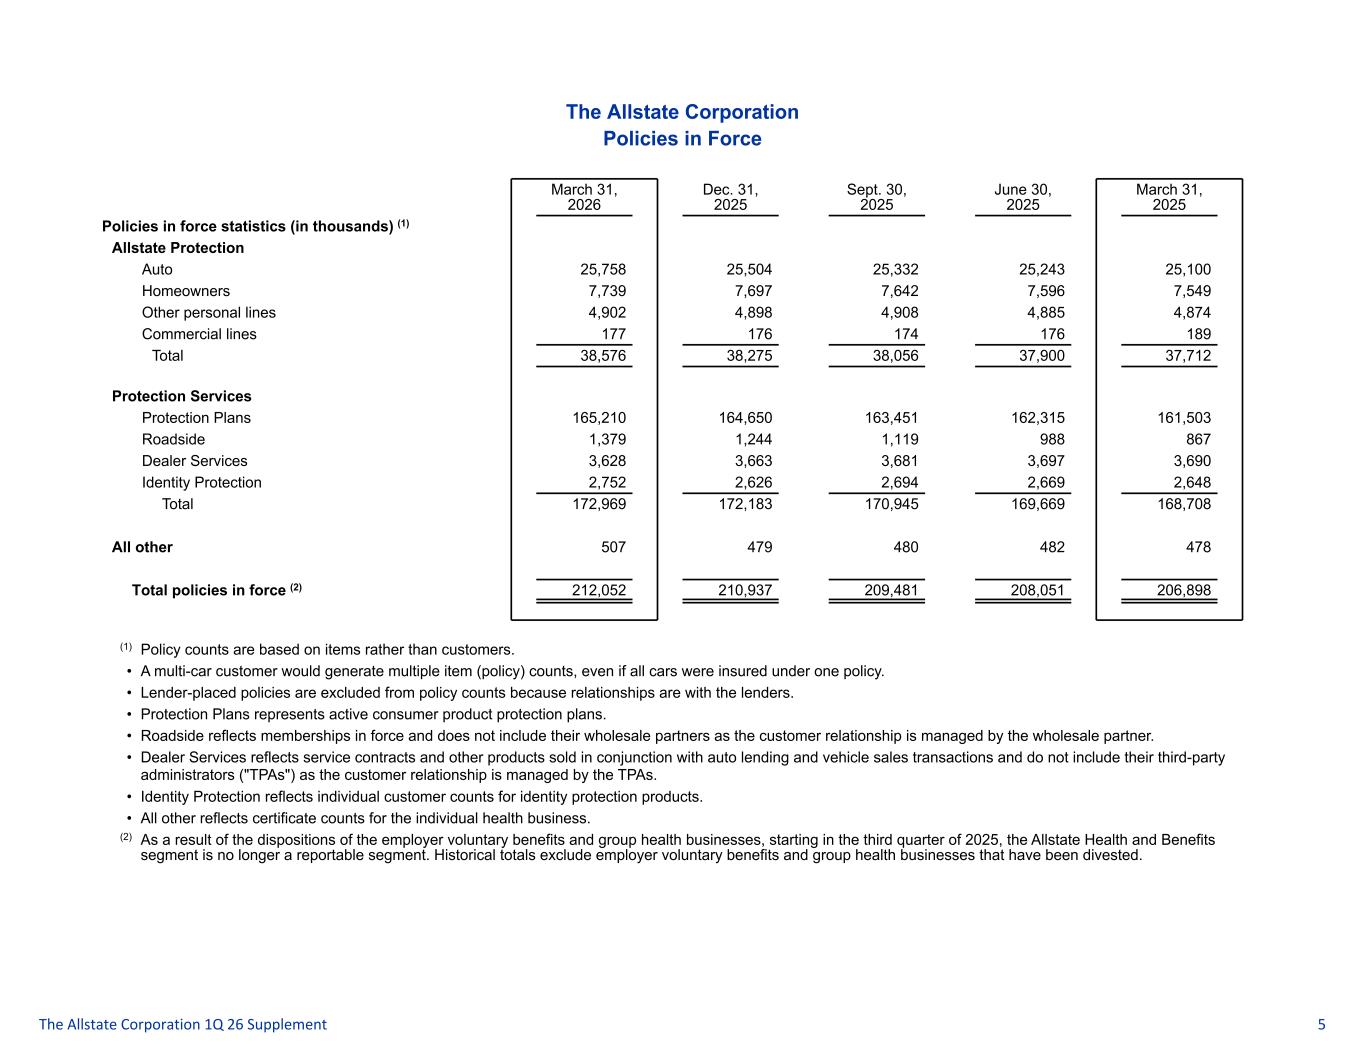
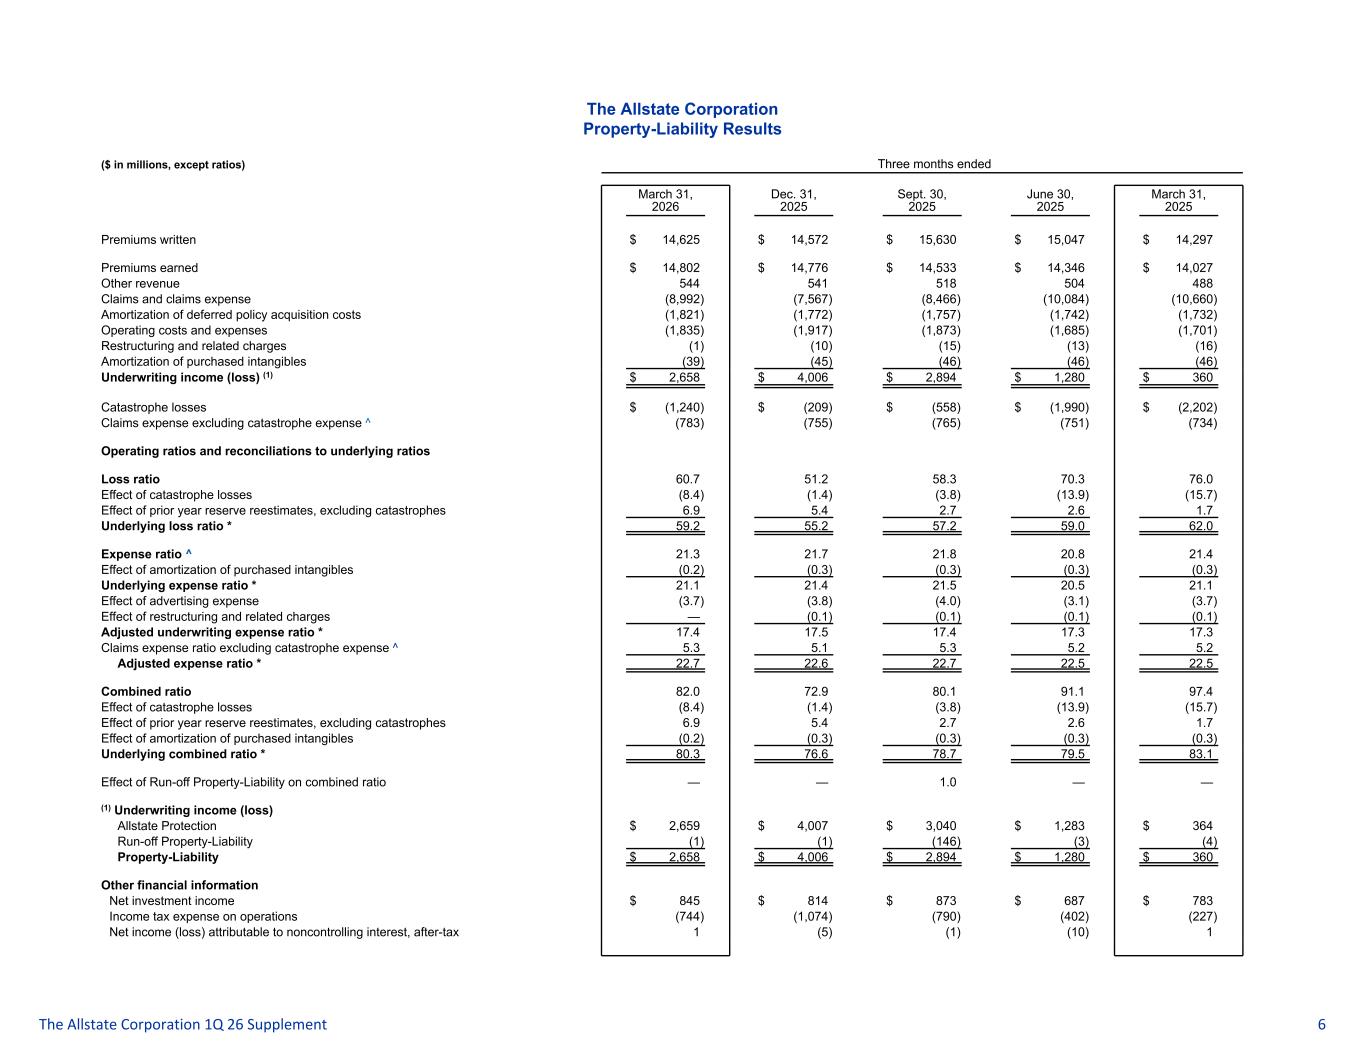
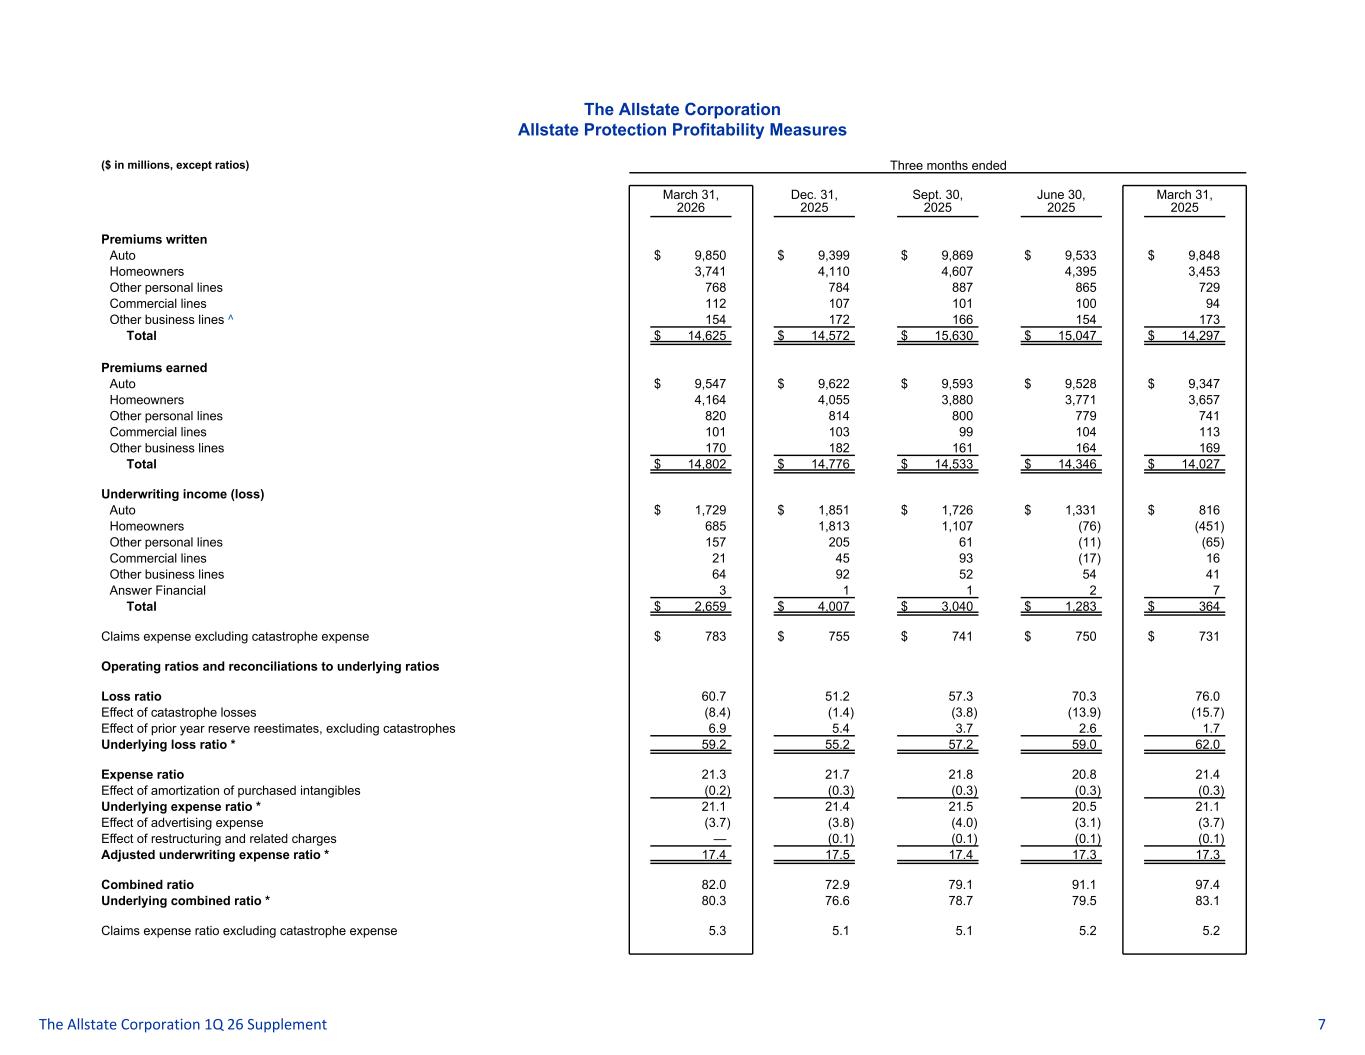
And the third, which debuted this week, is our newest campaign, If It's Important to You, It's Important Allstate, which demonstrates our commitment and our care for customers and the breadth of our offering. These same themes apply to investors. You can avoid mayhem by investing in Allstate, which has a proven ability to generate consistent results. You should call Allstate first if you're investing in protection companies. We are affordable, particularly at this P-E ratio. If it's important to shareholders, it's important to Allstate. We're going to touch on these same themes this morning. So let's review first quarter results starting on slide two. Allstate had excellent operating results in the first quarter. As you know, our strategy has two components that are shown on the left. Increased personal and property liability market share and expand protection provided to customers. On the right, our performance highlights for the first quarter. An important part of today's conversation is that Allstate competes using a broad set of tools, not just lowering prices. This enables us to maintain a tax of margins while accelerating growth. We also broaden protection offerings for customers, investment income increase, and shareholders receive higher dividends and accelerated share rate purchases. The financial results are shown on slide three. Total revenues increased to $16.9 billion, up 3% for the first quarter of 2025, and investment income increased nearly 10% to $938 million. The property liability recorded combined ratio is 82, and the underlying combined ratio is 80.3, a 2.8-point improvement from the prior year. Total policies enforced increased by 2.5% and property liability policies enforced increased by 2.3%. Net income was $2.4 billion and adjusted net income was $2.8 billion or $10.65 per diluted share. Net income return on equity was 48.4% over the last 12 months. Slide four provides a construct to answer the question how will you generate attractive returns by growing if that includes more affordable prices the answer is that while prices are extremely important transformative growth has created a broad set of competitive levels to enable us to grow as you can see on the left more affordable prices are supported by lower expenses and effective claims processes we also use sophisticated analytics new products expanded benefits and bundled offerings to better serve customers. Compelling marketing and broad distribution increase new business, which fuels growth. This flywheel results in market share increases. Some examples are shown on the right. Affordable prices and lower expenses are enhanced with sophisticated pricing plans and better customer experiences. New products and benefits create value for customers. The Allstate brand affordable, simple, and connected products for both auto and home insurance are now available in 45 and 36 states, respectively. The custom 360 auto and homeowners insurance products for independent agents are now available in 40 states. We also routinely expand or improve benefits. For example, we recently added free identity protection, so customers think beyond price, and we execute this strategy of broadening protection. All state agents bundle auto and homeowners insurance at high rates, making it easier for customers, and lowering acquisition costs for policy. Marketing acquisition economics have improved this year. We distribute to Allstate agents, independent agents, company call centers, and over the web, which provides the right level of service for customers at the best value. In the first quarter, all distribution channels had increased in the new business, and the total was a record, which increased growth. Mario will now cover how this translates into market share growth while earning attractive returns. Jeff will then review more specifics on the property liability business, and John's going to cover protection services, investments, and capital.
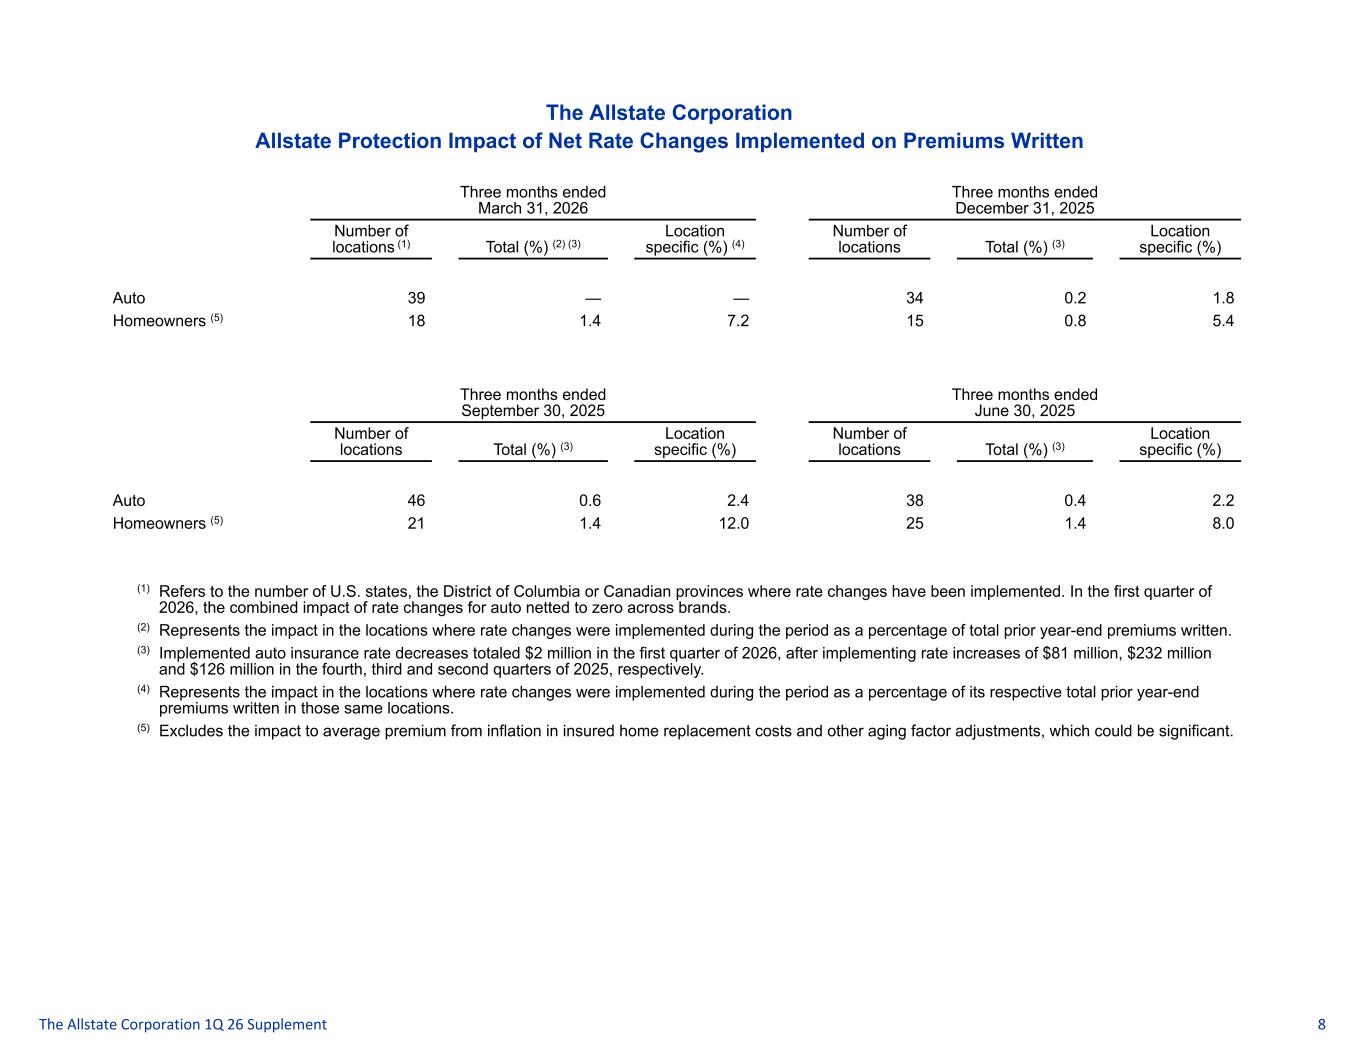
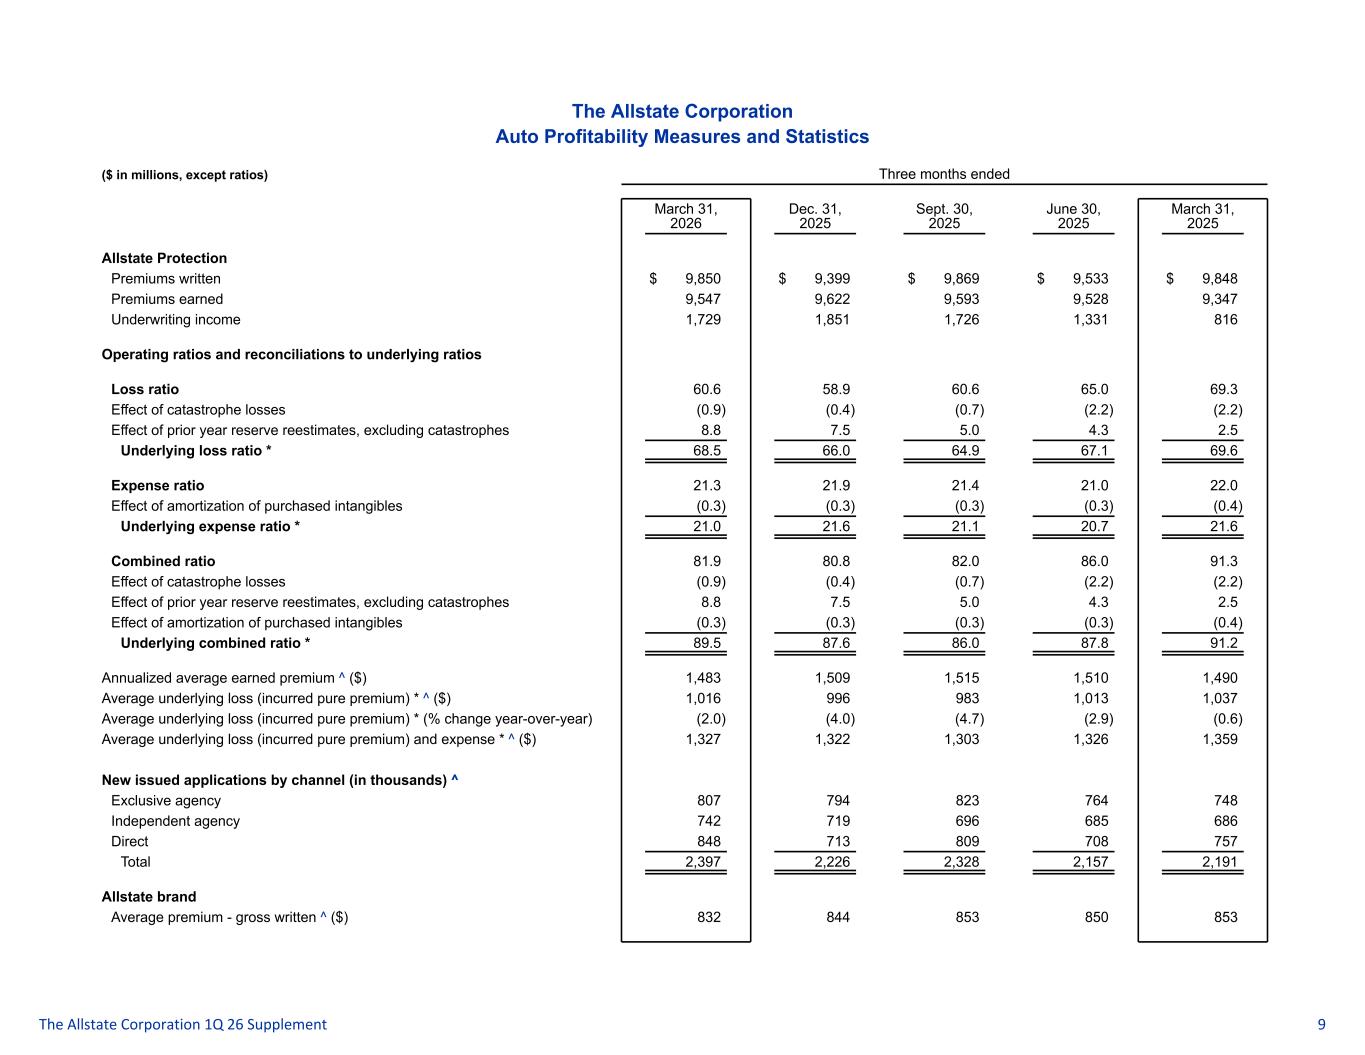
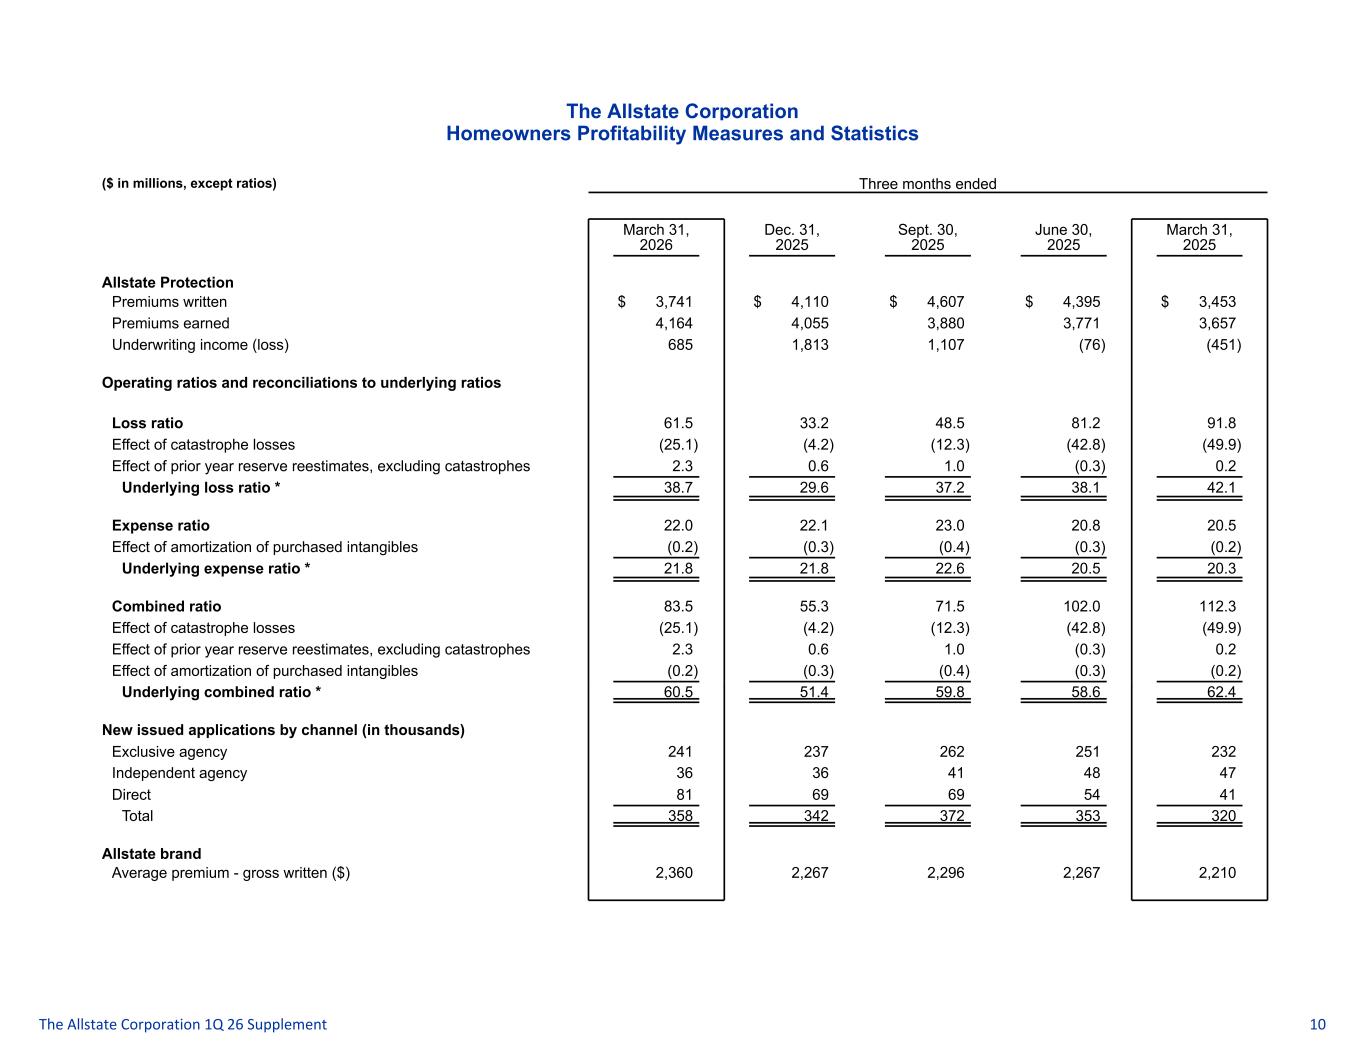
Thanks, Tom. Let's start with the market share growth on slide five. Starting on the left, Hall State increased auto insurance market share in 29 states in 2025 that comprise 57 percent of countrywide premiums. Looking down below, in the 29 states where share increased, policies in force increased by 4.3% over the prior year and outpaced vehicle registration growth in those states. That means we increased our share of insurable vehicles in those states, which we view as a better indicator of sustainable share growth than the traditional premium-based market share metric. In the remainder of the country, policies in force decreased by 0.5% versus an increase in vehicle registration of 0.6%. The decline is heavily impacted by two large states where we have intentionally been reducing share because of profitability challenges. If you look at which companies this growth comes from by dividing the market into the top five market share leaders and the rest of the market, Slightly more comes from the medium-sized and smaller carriers. The broad set of competitive tools that Tom referenced also drives growth in homeowners insurance. Homeowners insurance market share grew in 83% of the U.S. market. This was in 41 stage, which had policy-enforced growth of 4.1% in 2025 over the prior year. We have a broad competitive advantage over the companies we compete with in the homeowner's insurance market, as demonstrated by our ability to profitably gain share. Moving to slide six, Alt-State's business model enables us to consistently generate strong returns. On the chart, the blue bars represent the auto insurance underlying combined ratio, which averaged 95 and 94 over the last 5 and 10 years, consistent with our mid-90s target. There was obviously an increase in the combined ratio in 2022 post-pandemic, which required significant price increases, as shown by the light blue line in the middle of this chart. Since then, we have returned to levels at or below our mid-90s target, with more modest price increases needed to generate and sustain attractive returns. In the first quarter of 2026, rate changes were implemented in 39 states, which included a mix of both rate increases and decreases. These changes had a net overall neutral implemented rate impact across the book. Improving affordability will increase policy-enforced growth and raise shareholder value as long as the combined ratio continues to perform at or better-than-target levels. Let me note that these are underlying combined ratios that were reported for these years, and as Jess will cover in a few minutes, favorable subsequent reserve development shows that results for several of these years are actually better than what is shown on the chart. Moving to slide 7, you can see a similar story in the homeowner's insurance business, which also generates strong returns. Homeowner's insurance over the last 5 and 10 years had a recorded combined ratio of 93.5 and 92, respectively, and has generated underrating income of $3.9 billion and $7.9 billion in those same periods. In the first quarter, the combined ratio was 83.5, and average premiums increased 5.7 percent compared to the prior year quarter, keeping pace with lost costs. As you saw this quarter, we also posted the disclosure related to the placement of our comprehensive nationwide reinsurance program, which enhances the risk and return profile in the homeowner's business by reducing capital requirements associated with catastrophe loss tail risk and dampening earnings volatility. The homeowners insurance business remains a competitive advantage and growth opportunity for Allstate. Now let me turn it over to Jess.
All right, thanks Mario. Let's look at the property liability results in total on slide eight. Auto insurance policy growth of 2.6 percent and homeowners insurance policy growth of 2.5 percent drove an increase of 2.3 percent in total policies in force and written premiums earned premiums increased by 5.5 percent the property liability combined ratio was 82.0 as both auto and homeowners insurance profitability was better than our targeted levels this result was due to strong underlying performance as well as lower catastrophes and favorable prior year reserve releases excluding the benefit of reserve changes and lower catastrophes the auto insurance underlying combined ratio was 89.5 which is 1.7 points better than prior year property liability underwriting income was 2.7 billion dollars in the first quarter now turning to slide nine as mario referenced in his comments auto insurance profitability improved faster than original estimates in 2023 and 2024. the top of the stack bar is the underlying combined ratio as originally reported. The green bars represent the impact of subsequent prior year reserve estimates. The light blue bars represent the adjusted underlying combined ratio including the subsequent changes in our estimates of loss costs. As you can see prior year losses develop more favorably than originally estimated. Reserving is an iterative process with strong governance and oversight. We use consistent practices, multiple analytical methods, and include external reviews by independent actuaries to ensure reserve adequacy. As more claims settle, however, estimates each year are revised to reflect actual loss experience. In recent quarters, actual loss experience has outperformed initial expectations. This results in the release of reserves from prior years. The auto combined ratio in 2023 is now estimated at 95.4 and 2024 is estimated at 90.0. Auto insurance profitability improved faster than originally estimated. Slide 10 highlights how we expect to continually improve our strong performance and enhance competitive position. Transformative growth builds a comprehensive competitive model. This included new software and adapted legacy systems to build a connected technology ecosystem. The system enables the use of artificial intelligence to improve customer experience and lower costs. We're leveraging this technology platform in building Allstate's large language intelligent ecosystem, which we call ALI, to harness the power of agentic AI.
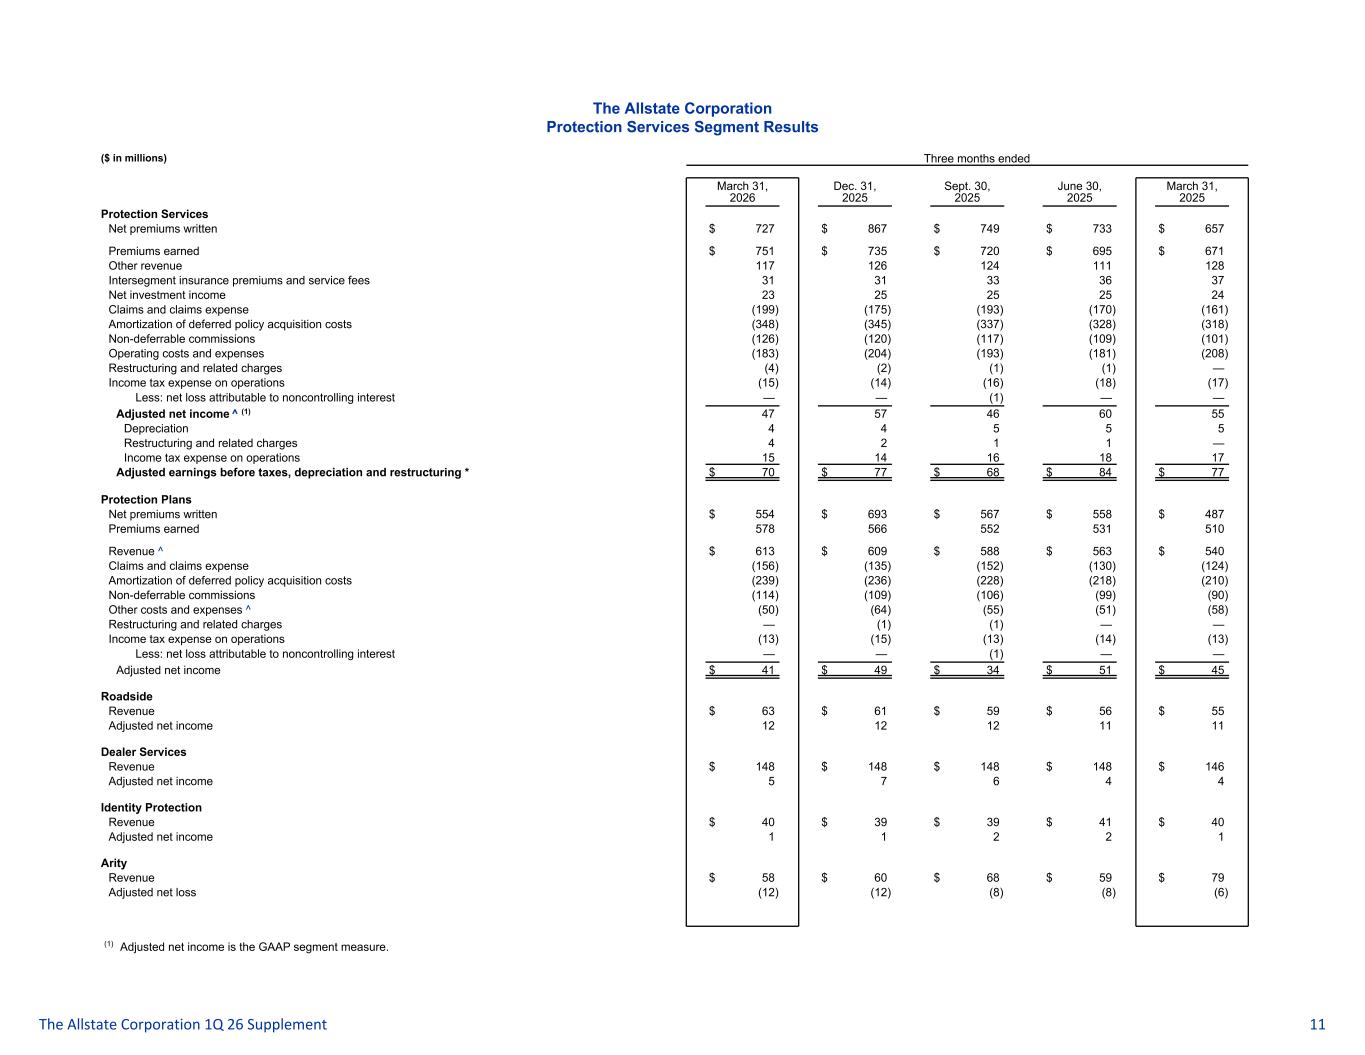
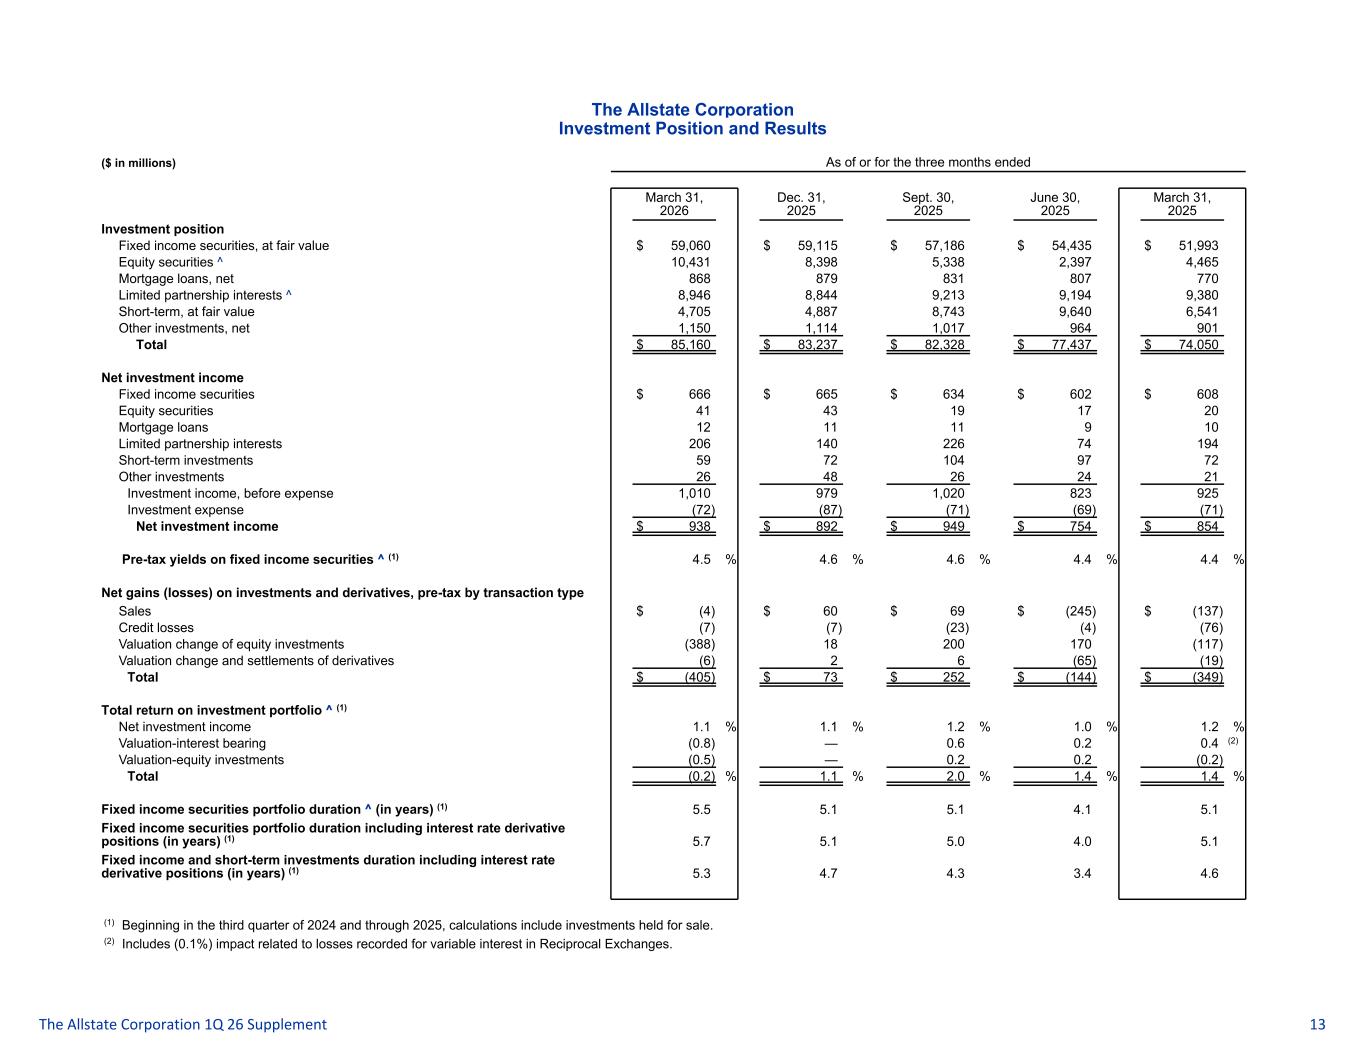
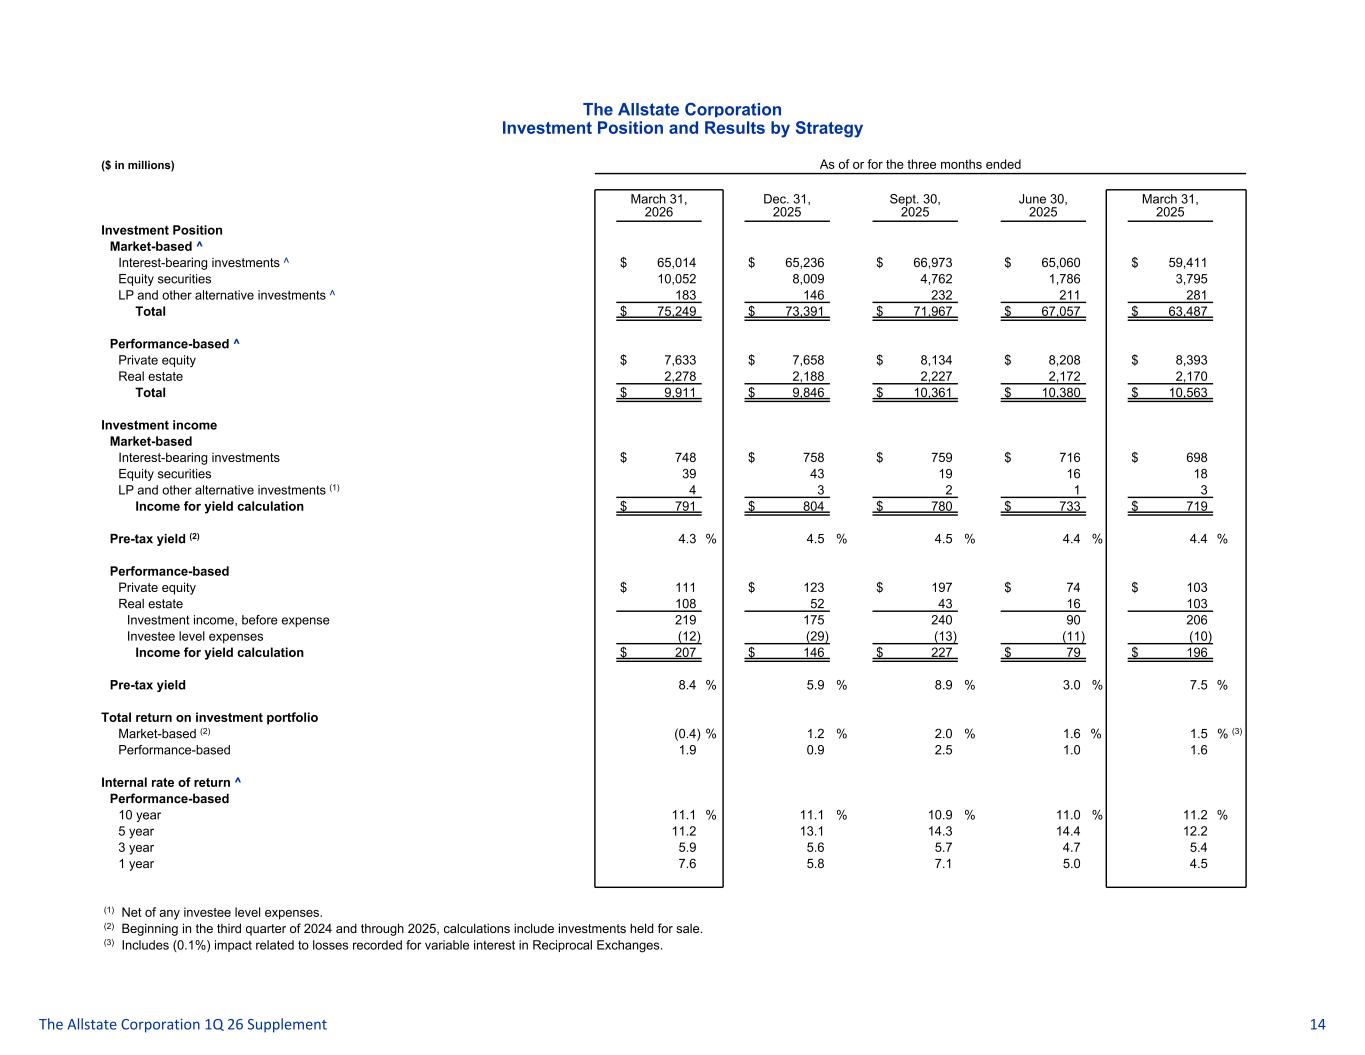
With that, I'll turn it over to John. Thanks, Jess. Good morning, everyone. Moving to slide 11, the protection services business grew to grow, continue to grow profitably. This segment is comprised of five businesses shown on the left. Protection plans, dealer services, roadside, parity, and identity protection. this segment is all state protection plans which grew revenue 13.5 percent versus a prior year quarter this business provides protection for mobile phones consumer electronics major appliances and furniture protection plans generated 41 billion dollars in adjusted net income for the first quarter down slightly due to higher claims costs is our mobile intelligence business the higher loss this quarter reflects restructuring charge related to a reduced employee count In total, protection service businesses increased revenue 7.2% from the first quarter of 2025 and generated $47 million in adjusted net income. Let's turn to slide 12 to discuss the investment portfolio. Investment income of $938 million increased $84 million, or 9.8% compared to the prior year quarter. As shown on the chart on the left, net investment income has grown as the portfolio grew. Since the first quarter of 2024, portfolio book value has increased 24% or approximately $17 billion. The increase reflects higher average investment balances from a 15% increase in earned premiums, strong underwriting income, and improved fixed income yields. The table on the right side highlights the strength and consistencies of returns across asset classes. Over the last 12 months, the portfolio generated a 4.2% return. Fixed income results over the last five years are top quartile. Returns in our performance-based portfolio have been below longer-term historic averages over the last one and three years at 7.6% and 5.9% respectively, but remain above industry benchmarks. These results underscored the effectiveness of our active investment management approach. As a result, we increased the capital allocated to the investment portfolio in the first quarter, some of which is carried at the holding company. Let's move to slide 13 to show that proactive capital management creates shareholder value. All state deploys capital in multiple ways, which are shown on the left axis. Organic growth, enhancing existing businesses, growth acquisitions, and cash providing to shareholders. Using capital for organic growth leverages all states' capabilities and market presence with well-understood and attractive risk and return opportunities. This is why we're focusing on increasing market share in the property liability business. In addition, increasing market share should raise valuation multiples. Over the last three years, $3 billion of economic capital was utilized to support premium growth. As we just discussed, Allstate also deploys capital to support the investment portfolio to generate attractive risk-adjusted returns. Capital is also used to strengthen existing businesses, such as investments we made in our technology ecosystem or enhancing our independent agent business through the acquisition of National General. Square Trade was a growth acquisition that leveraged the Allstate brand and capabilities. It also expanded protection offerings to execute the second part of our strategy and brought strong retail distribution partnerships. Since it was acquired, revenues have increased eightfold and the business generated $175 million of adjusted net income over the last 12 months. Allstate also has a long track record of returning capital to shareholders. In the first quarter, $881 million is returned to shareholders through repurchases and dividends. We completed the former $1.5 billion share repurchase program and launched a new $4 billion share repurchase program, accelerating the pace of repurchases. $3.6 billion remains on the current share repurchase authorization, which represents approximately 40% of holding company assets as of March 31 and 7% of outstanding shares. It's an interesting observation. If you bought all of Allstate 10 years ago, you would have received 99% of the purchase price back in cash and would have a company that generated $12 billion in net income over the last 12 months. Wrapping up on slide 14, in summary, Allstate's broad set of competitive levers delivered strong results in the first quarter. Now let's move to questions.
Operator
And our first question for today comes from the line of Mike Zaremsky from BMO. Your question, please.
Hey, good morning. This is Jack on for Mike. We just first went on the pricing outlook. Given how strong reported loss ratios are across your portfolio, I'm wondering how you're thinking about the opportunity to lean in more aggressively on pricing this year. And does that calculus differ materially across auto, homeowners, and bundled customers?
Back to the slide we talked about, in terms of growing, we have a wide range of ways in which we grow. Price is certainly important, but it's not the only one. And I know there's a question for many of you, so let me maybe spend a minute to, because it's what you described. We do it, obviously, by product. We do it by state. We do it by coverage. It's highly complicated. if we think bundled customers lower acquisition costs we give them a discount if they bundle so yes we do all that but let me go over so price is obviously important and it's a key driver profitability as a result we built this system of operational levers organizational accountability and sophisticated analytics and our goal of course is to earn attractive margins and grow and there's always a plan on prices that looks forward 6 to 12 months we're going to talk about what that plan is here because it's competitive and it changes all the time and it but it's based on what operational levers we think we can pull so Jess will describe the system for you and give you a couple examples of how it works the conclusion however is that the system works it works for auto and it works for homeowners and you can see that on slide six and seven. Our auto combined ratio is 94 to 95 over the last five and 10 years. Homeowner's insurance ratio is 92 to 93 and a half over the last five and 10 years. So the system itself works while price is important at just one component. Jess, why don't you talk about how it works here and then give a couple examples. Got it.
So we think about the system like a cube that has three elements and Tom alluded to the three elements you have operational levers is advanced analytics and then organizational roles and responsibilities and it's a bit like a Rubik's Cube where it gives us multiple ways to both identify and address profit and growth opportunities that we have what I'll do quickly is go through each component and I'll give a couple examples of what's going on a couple of state examples of how the system works so if you start with the operational lever element of our cube we kind of covered this on slide four, Tom went through it. You have new products, broad distribution, marketing. Effectively, we employ these operational levers at the state, individual market, and product level. It's very granular. If I move to the advanced analytics element, you have a highly sophisticated rating plan that has billions of price points per state. We analyze data by sub-market within each state and by product, by coverage, by risk segment. And we link that between the signals that we're seeing in current claims trends to price at a very granular level. So we're bringing again this interconnected system together. We have marketing analytics that are terrific. They enable us to price lead purchases in real time, determine effectiveness of programs by media channel and message, and then the claims team is using a massive amount of data to assess the effectiveness of controlling severity and in executing the claims function. Centralized, we have a centralized reserving team of course, we've talked about that, that's separate from our actuarial pricing team that gives us another set of eyes on lost costs and lost cost trends. The point of all this is that we have a lot of people looking at profitability and growth from a number of different perspectives through the advanced analytic lens. The final element, as Tom mentioned, was organizational roles and accountability. We have a matrix organization structure that enables us to bring all of our expertise to bear to decide how to pull various levers in this system. That includes price changes in total or by territory or by coverage or customer risk segment includes adjusting underwriting guidelines. Another dimension to that would be marketing investment. We can look at the price, number of sales leads to purchase by market, and then determine distribution priorities alongside those other decisions. So the system that's working together, again, like a Rubik's Cube to drive profitable growth. The overall team, as we look at it, includes state managers that are responsible for profitability by product line, territory, and coverage. We have a chief actuary who oversees analytics, pricing trends across the country and by state, and has a research and development function. We have go-to-market teams that are out there each day bringing all of their expertise and all of this expertise together to manage growth and profitability by local market. And then we have distribution leads for all state agents, independent agents, and our direct operations who can assess and evaluate performance on a real-time basis. they can expand or shrink distribution and set priorities and compensation to make sure, again, that we're optimizing across the system. So the three elements work together in a continuous planning cycle is the way that I think of it. We create a forward-looking plan that looks at expected rate changes for the next six to 12 months by state, by line, by company, as Tom referenced. It factors in things like likely regulatory timing and what the response will be, and we build up a countrywide matrix, then, of underlying profitability and growth so that we can evaluate the forward-looking trajectory. It aligns the execution of all of the operational levers with the goal of earning attractive returns and growing in 2027 and 2028. So to make what turning the dimensions of this RUPS cube look like come live with it, I thought I would talk about a couple of examples. So in states where we have share that we would say is below our national average and our underlying combined ratio is better than target, say we're running an 88 underlying combined ratio, state managers will identify an opportunity to lower rates with an eye towards staying within those targeted ranges in coming quarters and in coming years. It's a forward-looking view so that we change rates in a sustainable way. They then work within the system that I referenced to utilize the broad set of tools that we discussed in our prepared remarks to drive profitable growth by market so that's optimizing distribution it's working with the marketing team to make sure that where we have opportunity to grow we're leaning into that on the other hand so the other state example would be a state where underline combined ratios above target or on a trajectory to go above our target and we begin taking modest rate increases to get ahead of the trend and if needed we'll restrict new business through underwriting guidelines and other operational levers again that we have to make sure that we manage profitability in that state in states where we don't have ASC now we do have ASC in 40 plus states at this point um we'll limit new business until that product is available because we want the most contemporary and most accurately priced product in market so we'll wait make sure that ASC gets approved and then reload the growth on a forward-looking basis. So we get the best product in market and, again, look across the system to make sure that we're appropriately adjusting for a state that is not meeting our targeted returns. To make the couple examples come alive, I thought I would just end with the system at You saw in the supplement that we changed auto rates in 39 locations and that netted to effectively no change in rate. If you peel that back, there were 23 states where we lowered rates. there were 16 states where we increased rates. And because of our rating sophistication segmentation, 10 of those states, we did both. So we had an increase and a decrease. So this is more than just a high-level analysis. It shows the depth and the breadth of what we're doing to pull the operational levers and all the levers within the Rubik's Cube to optimize and deliver profitable growth.
Perspective, thank you. And maybe just a follow-up on California, where they recently announced some reforms to the intervener process. I guess I'm wondering, does also do that change along with other recent reforms there as potentially a game changer longer term, especially on the homeowner side where I think historically you've been reluctant to grow market share?
That California still has a significant number of changes to make before the homeowner's market will be both accurately priced with decent availability for consumers.
Operator
Thank you, and our next question comes from the line. Josh Anker from Bank of America. Your question, please.
Yeah, thank you for taking my question. So in the first quarter, you had about $840 million of net favorable prior year development in the auto line. Obviously, I would imagine the majority of that comes from last year, which tells me you made a lot more money in auto last year than the combined ratio indicates. But it also arguably suggests that year over year, the margins are deteriorating. I mean, they will. They're incredible right now. They have to deteriorate at some point. I'm wondering if you can talk about the trajectory of what you think is happening right now to help us better understand that.
Josh, if you go to slide nine, you can see how we spread that. So actually, most of the change, as it relates to the combined ratio, came in 2023 and 2024. Very little in 2025. And that's in part because 2025 hasn't completely developed. Like, we make these changes. We obviously do an estimate. We start settling claims. As we settle claims, we figure out what we're having to pay people, figure out how severe they are. And then we adjust our estimates. So we obviously overshot the mark in 2023 and 2024. We have not concluded that for 2025. We think our reserves are properly stated. I would also point out we really didn't overshoot the mark much in 2023. So it happened to be those really concentrated in those two years. Going forward, we feel good about profitability. We've been able to earn, you know, better than industry average combined ratios and auto insurance for a long time, and we expect to continue to do that. Will we still be at 89? I think when you look at the math on it, the extent we can drive growth and give up some margin that works to improve the shareholders' valuation multiples. That said, we're okay earning what we have right now. We think we're competitive in the market, but we think we can grow faster.
Obviously, 2023 was a very strange year. But is there something in your process that says that you want to be more conservative on the most recent accident years, that the confidence interval on your reserving is more conservative for the most recent year and that programmatically, if you're doing things correctly, you would have this type of reserve release action going forward in 27 as we look back to 25?
No, we apply the same statistical standards to every year. I would say one of the things we're hopeful about is with advanced computing power that we can increasingly get more specific on what's in the reserves. Of course, the reserves are, like, you have a bunch of losses in a year, and then you have to, you say, well, how much do we pay out? And then you're kind of doing it on the residual value basis. What we paid out determines what we have left for all the claims that we still have yet to settle. We think with advanced analytics, we may be able to get another angle on just looking at all the individual cases, which is really complicated. You know, you've got 900-page medical files. You've got, like, lots of stuff to try and figure out what that claim will settle in. But so it's the same process, same standards. And I would say always getting better as we go forward. Of course, what you never really know is what's going to happen with legal trends or anything else.
Thank you for indulging all my questions.
Operator
Thank you. And our next question comes from the line of Alex Scott from Barclays. Your question, please.
Thanks for taking the question. First one, I wanted to ask you about just prioritization of, you know, the Holdco Cash, which has grown to a pretty significant amount at this point. How would you think about prioritizing that? Are there different, you know, verticals within services that you'd look to expand or, you know, other things beyond, you know, obviously the larger buyback that you've been doing?
That's an important question, Alex. Let me try to build up a little, start a little bit above where John went and then talk about some specifics underneath that. John, feel free to jump in here. So, you know, the first thing on capital is you've got to get a great return on what you And, you know, he had a 44% adjusted net income return on capital. So all of our capital, there's no hiring stuff off, no separate closed books or anything like that. We've got a 44%. So that's a good thing. And when you look at the S&P 500, it's probably half of that. I don't know what it is this quarter, but typically it's in the low 20s. And so we feel good about that return, particularly when you're buying it at this kind of PE. Then you say, okay, well, what else can we do? And John went through the order. You know, organic growth, you're just leveraging your existing capabilities, great scale to it. You just pump more volume through the system. Obviously, that's something we're focused on. But you've got to make money. You don't want to end up losing money or give yourself a short-term sugar high of growth and a long-term hangover called low profitability. So we manage that, as Jeff talked about, very aggressively in the property liability business. We also think there's plenty of ways we can expand and leverage our existing capabilities, whether that's John talked about expanding our property liability businesses or our investment using our investment capabilities, which we put a little more money into earlier this year because we think we're good at it and the results show we're good at it and we thought we saw some opportunities in the marketplace. And from an enterprise risk and return perspective, we had room to do that. So we look at it in total, we manage capital. And then there's a variety of other ways we can do it. In general, we look at it and say, we have to be a better owner of a business. Like, why would our ownership make this business better? And that's where you look at your growth stuff. When you look at, you know, when we bought Square Trade, I'm putting our brand on it and that kind of retail distribution. We really ran the table on that business and feel really good about it. Those don't come along that often, but you're always looking for ways in which you can enhance your capabilities. John, anything you would add to that?
I think you covered most of it, Tom. Yeah, maybe just a couple things to point out that it really is a system decision. We're looking both outside of the firm and opportunities, but then also in the firm, what's the best tradeoff, how that mix comes together. I would point out that sometimes it's harder to see some of the investments that we're making, such in technology or even in an investment portfolio. Those can be fairly consumptive in terms of capital. It might be more difficult for you to actually see that versus a transaction. And then I guess I'd end up on the fact that I know some of you picked up on it, and it's in the queue. But we actually accelerated our share repurchase program throughout the quarter. And that wasn't just a one-time thing. We continued to accelerate it. So, you know, one way to look at repurchases is, you know, what the quantum is, but also the pace matters, too.
Got it. All very helpful. Second question, I actually want to circle back on artificial intelligence specifically. And, you know, I know you guys have had a strategy over time to improve the expense ratio so you could get even more competitive in the market and spur some growth. Could you talk about, you know, how AI expands on that, what you're planning to do, and sort of how you see yourself positioned relative to some of your peers, you know, one of which I think has begun to roll it out more aggressively and reduce their workforce more?
Let me start with a competitive position and then come back up to how we're doing it. I'll focus on both expenses, a.k.a. generative AI, and effectiveness called agentic AI. I think it's really hard to tell where everybody is. You know, everybody's out doing something. We don't talk about everything we're doing because we don't want everybody to know what we're doing. And, you know, we'll let them see in the marketplace. But so I think it's hard. So what I can say is that from our standpoint, our capabilities continue to grow exponentially. The opportunities we see continue to get bigger, and we're figuring out how to address and deal with some of the implementation and deployment issues because it's not simple. I can't tell you that it's all in market today. It's complicated, but if you can pull it off, it works really well. The easiest way thing to do is generative AI, which is, I think last time I called it the, you might remember, CAT sneakers. It's the run faster, jump higher strategy. It cuts out expenses. You can cut out call center people. All that's good. We're working on that. We do a bunch. It does millions of emails for us. People are going to spend time doing it. It's all really good. But I think the real benefit from this will come from agentic AI, where agents are talking to agents and making decisions in sub-second, real-time response rate that people then can't compete with you. We're building that. It's really complicated building that ecosystem. You got to get the right governance around it. You got to make sure you set up whatever metrics you give it, it will go get. So you have to make sure measurement science is really important. So we're working hard on that. We're excited about it. We think it offers a potential to really build off of what we did in transformative growth. We don't have the issue that some companies do. I don't know what our competitors' issues are, but I know other companies when I'm out talking to them have some issues in accessing legacy technology. We don't have that for many of our systems. We do for some, but not many of them, which gives us an ability to accelerate the agentic or ALI work.
Operator
Okay, thank you. Thank you. And our next question comes from the line of Yaron Kinnar from Mizzou. Your question, please.
Thank you. Good morning. My first question is on the homeowners book. Why was the expense ratio up year over year, and would you still expect improvement for the full year?
We reallocate expenses from time to time. there's slightly higher commissions related with bundling on that so it while it looks expensive it's good lifetime value so let me put it that way because we've had the same question like hey wait a minute you're like where this point go and so it relates to how we're driving value and we try to do it so it accurately flex what each product gets and not just spread those costs like Commission. We love the homeowner's business. We think it's great. We think it's an underappreciated growth asset, not just given the market share numbers that Mario talked about. But if you just think about severe weather and you're looking for trends, people are going to need more insurance for their homes, the worse the weather it gets. And we're really good at that business, so we like that business a lot. I think it has great potential.
And just to clarify here, so the reallocation of expenses, is that something that's going to flow through throughout the year, or do you still expect to see the over-year improvement?
We don't do forecasts of expenses, but to the extent we're spending the money to increase bundling, we like that, yeah, and so it would be higher. But we're still earning a great return, So, I wouldn't – homeowners is a little less price sensitive than auto insurance would be the other point I would just add to you as you're thinking this one through. Right.
And then my second question, I realize it may still be relatively early, but still we've had the closure in the street of Glymouth for, what, two months now. do you expect gasoline prices and supply chain disruptions related to the closure to impact frequency and or severity in both auto and home?
We don't know, would be the answer. When you look at, I can give you some facts around it. About one third of driving is discretionary. About one third is for like going to work and about one third is for like doing stuff you got to go to the grocery store, some of that. So you're basically talking about one-third of things people can decide they want to go on a shorter vacation or whatever. That obviously takes some time to factor in. You know, if gas prices are $5 or $6, people don't go as far. Maybe they share their car on riding to work. Maybe they don't go to the grocery store as often. So there's various things that higher gas prices do result in fewer miles driven, which then lowers frequency. But it's not a straight line. Like you can't just say, oh, a straight up or moves is here. Gas prices are $110 a barrel for oil. Therefore, we're going to have a half a point change in frequency. You just don't know. And there's a million different variables to that. What we do know is we pay attention to frequency. We keep track of frequency. We do our claims. We do claim counts impact our reserving. And we get claim counts every day. So to the extent they're changing, we're already looking at it. But then you have to decide, well, how long will it be there? And even when you have higher prices, you might get a temporary drip down, drop down, and then it goes back up. And then we track 50 million cars every day, every 15 seconds, so we know who's driving when.
That's on the frequency sign. And what about the severity sign?
Severity, again, in general, higher petroleum prices roll through everything from plastic parts on cars to shingles, and so it has an upward impact on it. What happens to our costs? We don't see anything right now in severity, increasing severity of parts and stuff like that, and then it's a competitive market, so you just see what happens. We're not concerned about the price of oil and its impact right now on our profitability.
Operator
And our next question comes from the line of Paul Newsom from Piper Sandler. Your question, please.
Good morning. Thanks for the call. Maybe a revisit to the competitive environment a little bit and talking about some of the states that have been not as attractive. Any thoughts about those states turning or some of the other, you know, states that were in between turning to a more positive environment or with any color you could get, I think, would be helpful and interesting.
Paul, it's really a question about the regulatory and operating environment, I think, rather than competitive is the way I'm hearing the question, but let me make sure I get it right before I answer.
Well, I guess it's either one, right? If it's regulatory, then that's the thing to focus on. If it's competitive, then that's another thing. But I guess the industry seems to be more the competitive piece than the regulatory piece.
Yeah, I'll go to both of them. Let's start with regulatory. Obviously, there were three large states we called out last year that we struggled to find a way in which we could earn an adequate return for our shareholders, give customers a good price, and grow. and so we didn't. And some of those are getting better. I'm really excited about what might happen in New York with Governor Hochul's doing. It will be a blow for freedom for insurance consumers to take the costs out of unnecessary what I call fender bender litigation. That could be a huge benefit because New Yorkers pay a lot for insurance because there's a lot of these benefits being served on. Certainly when people get hurt, their car gets wrecked, their bodies get bent up and stuff, they should be totally in favor of that. And that's what we do. That's what we'd like to do. Sometimes the system gets a little out of whack and it needs to be course corrected. So we're thrilled about what they're planning to do or hoping to do in New York. And if that happens, that would open a giant growth market for us. We have a big share in New York particularly in the seven boroughs we have been really strong there for a long time we have a great agency force it's got tight media markets so our direct operations work really well there we have good independent agent relationships that would be a great place for us to grow and we hope that they can do that because it'll be good for our customers and consumers in general the if I just go to up to the competitive environment it continues to be highly competitive in auto insurance as Mario talked about you know the top five continue to battle it out you see some of the they're not small but they're not in the top five some of the independent agent carriers have had volumes go down particularly a couple of big independent agent commercially focused companies have lost some share there. So we feel good about our competition in auto insurance against the top five. Where we're really starting to pick up some momentum against competition is in the homeowner's business. Mario talked about that 81% of the country. And some of those top five either don't really sell their own product and have underwriting margin to work on in that space or haven't had as good a results as they would like. And so they're being less aggressive in that space. So we think there's great potential to grow in the homeowner's business, given that competitive Anything, Mario, or anybody you would add to that?
No, I think you nailed it, Tom. The only thing I'd say is when you look at, you know, it's a highly competitive market, as Tom said. And when you look at our results, and we continue to generate new business at historically high levels, it's across distribution channels. We're leveraging all the capabilities Tom talked about early on, and we're competing effectively both in the auto and the homeowner space. And we'd like our chances to be able to continue to do that going forward.
That's great. As a second question, maybe turning to the home business, they cover a lot of little companies that are talking about the business moving on the margin to more excess and surplus lines for home insurance. Any thoughts about that trend, if you think it's just kind of a temporary thing or it's a part of what matters for you? I would imagine, given your very middle-of-the-road product for home insurance, It's not a huge piece, but just curious.
Not a huge piece of excess and surplus lines for us or for our- Yes, I was imagining it's pretty small for you folks. Yeah, we have an excess and surplus lines business. It's north light. It's grown reasonably well. Just to help educate everybody else who's not-is in deep, Paul, Excess and surplus lines are where there's not enough availability in a market, and a customer goes out to like two or three companies, can't get an offer, and so then somebody can offer them an excess and surplus lines company, which is, I'm going to call it lightly regulated as it relates to price, as opposed to tightly regulated in a homeowner. We have that, we have a company that does that. We prefer to do it in the regular lines, and if we can't sell it in the regular lines, we don't necessarily use our excess and surplus lines if it's because we don't, it's because we don't like the market. Like, occasionally, we might use excess and surplus lines for a really well-priced risk. But in general, if we don't like the state for homeowners, we probably don't like it for excess and surplus lines either. We do want it so that we can be available for customers that have it. And then on top of that, you know, we're probably the biggest broker of homeowners insurance in the country because we, to serve our all-state agent customers well. When we can't offer a product in Florida or California or something like that, we have arrangements with other companies that we can sell their product for. And that's a number with a B on it in terms of how much product we sell their product.
Appreciate it. Thank you very much.
Operator
Thank you. And our next question comes from the line of Tracy Benjicci from Wolf Research. Your question, please.
Thank you. Good morning. You started earnings call by giving a demo on your ad campaign. How should we think about ad spend budget this year versus last and any expense ratio impacts and PIF growth prospects as a result?
We're obviously, it's a highly competitive market. We've dialed up advertising significantly over the last four years. We dialed that up with increased sophistication. So there's upper and lower funnel, upper funnel being the stuff you saw, lower funnel being, you know, very specific. You know, we find, you know, Chris is shopping for insurance and we, like, give her an ad at that moment on her addressable TV or on the web or something like that. So there's upper and lower funnel. We've increased our lower funnel advertising this year, which is better. It's easier to do metrics on it. It's like running ahead on the Super Bowl, you know, who's watching it, do they buy anything It's not as easy to find out whether that's economic as well. So we've shifted more to a lower funnel. But we spend, relative to where our economics are, we have economic measures, but we don't spend all the way up, like recently we were looking at, should we spend more? And sometimes you just want to make sure the system works really hard. So you don't want advertising to be the only thing you do to drive growth because you end up in a systems area where we spend more, progressive spends more, so leads go up in costs, so we spend more, so they spend more. So you have to be careful that you don't feed a beast you don't want to feed. So we're highly precise, I guess I would say, and disciplined about it. That said, when we think we can advertise and if we think we could spend more money, grow more, and get a great combined ratio, we will. And right now, we like our economics. Our economics are better this year than they were last year. Some of that's just getting better at executing, isn't it? The market's really changed some. We've just gotten better at our close rates.
Excellent. Shifting gears, can we talk about asset allocation? You doubled your equity holdings in September, so it's about 12% of your total portfolio. What is that relative to your equities asset allocation target?
I'll let John answer that. That's also part of what he does besides our chief financial officer. We try to make sure everybody does at least two and a half jobs. But I would just say, which he probably wouldn't want to say to himself, that we're really good investments. We manage it around. We're proactive. We think about it from an enterprise standpoint. you can see the numbers on the charts and so we have good confidence that we can generate good returns on capital and you see it flow through with our P&L, particularly Discord.
Yeah, thanks for the question, Tracy. You know, the way I think about it is I take a step back and, you know, really go back to the presentation, think about how we think about capital allocation in general. We have a lot of different things we can do. We think about the overall enterprise context as we do it and we also think about what's going on in the market market environment at any part in time you've seen us in our portfolio change our allocation probably more than most of our peers whether that's equity or whether that's fixed income uh you know changing our exposure to rate via duration and and the rest um because we're active i don't know that i could point you to a specific asset allocation target. There's a range that's defined by past behaviors that probably gives you a pretty good idea of what we're likely to operate within. When we do put more money to work, particularly in equities, we try and take a mid to longer range view on it. We are economic investors. We're not just trying to manage to yield target at any point in time. we think by delivering economic value that does accrue to increase net investment over time and it's a it's a more cerebral way of going about it but we're not necessarily trying to measure that quarter by quarter or taking a longer look the amount that we put to work recently has that in mind you know if you look back say six months ago the environment was a little less certain we had you know a number of things going on we have a little bit more clarity and felt good about putting money to work. And we'll see how it turns out in the, you know, coming quarters and years.
Okay. So, it sounds like your approach is more dynamic than static. So, it could be foreseeably be that percentage growing if you like that asset.
I would say that it's dynamic, but it's well-governed. And you could probably gauge most of the range of our future activities by the way that we conducted ourselves in the past.
Yeah, so we're not likely to have an 80% equity allocation.
Operator
Thank you. And our next question comes from the line of Pablo Singshan from JP Morgan. Your question, please.
Hi, thank you for speaking me and just one for me. I wanted to shift to AI again, but this time as it relates to your distribution strategy and how you reach customers. I presume it helps direct distribution, but how How do you think it affects your agents, whether captive or independent? There's an argument that it makes them productive, but do you think AI ultimately shifts the business away from them?
Sorry, what makes the agents more productive?
Oh, just the use of AI. Yep. That's sort of like the argument today.
The two probably most talked about letters these days. so AI can help them in a whole bunch of ways first it can help us have a better product and better pricing and deliver better service for people it that's in general just it'll help us be a better company secondly as it relates to their specific work we think it will remove a lot of service work out of agents offices so things they had to do before they won't have to do anymore so we're actively working to get that work out of their offices secondly it will help them be smarter and in on behalf of agents who provide more advice and do less individual work let's take let's say we were going to do an insurance review a few an agent might have to go pull your records see what you've got see what how old your kids are, with both advanced computing, what do you want to call it, machine-based learning, AI, whatever, we can help them do that work ahead of time so they're really delivering the work and it's like they have an analyst working for them to help them. The other thing that AI can do is really in the moment. And so we have in market today something called customer engagement sidekick that helps you really do a better job of engaging with customers because you know you might have if you're doing 50 calls a day or something like that you know it's always good to have somebody hey this is what I'm kind of hearing maybe you should go here here's the tonality we're talking about so we think it'll help them do a much better job for those people who want somebody in between them their AI can also just sell directly and we're live in the market doing that right now on a particular product it's more of a learning but it's doing it in in three states it's closing policies and so we're just seeing what we learn from that so it all you just have to be there to meet the customers and so I think it will help those agents who have good relationship people improve their relationships it'll help other agents build more relationships and then those people who just don't feel like dealing with it and would just soon deal with a computer will be there for them too maybe thank you is that last question so thank you all for you know we obviously had a great corner we had strong earnings increased growth with transformative growth we think it's showing up we went through the market share gains. So we look forward to your engagement with Allstate, and we'll keep working on creating more shareholder value. Thank you.
Operator
Thank you, ladies and gentlemen, for your participation in today's conference. This does include the program. You may now disconnect. Good day.