Operator
Good morning, and welcome to the Aliris Financial Corporation Earnings Conference Call. All participants are in a snowy mode. Today's call will reference slides that can be found on Aliris Investor Relations website. You can also view the presentation slides directly within the webcast platform. After today's presentation, there will be an opportunity to ask questions for analysts and institutional investors. To ask a question during the session, you'll need to press star 11 on your telephone. You will then hear an automated message advising your hand is raised. To answer your question, please press star 11 again. Please note this event is being recorded. This call may contain forward-looking statements, and the company's actual results may differ materially from those indicated in any forward-looking statement. Important factors that could cause actual results to differ materially from those indicated in the forward-looking statement are listed in the earnings release in company's SEC filings. I would now like to turn the conference over to Alaris Financial Corporation's President and CEO. Katie Larson, please go ahead.
Speaker 4
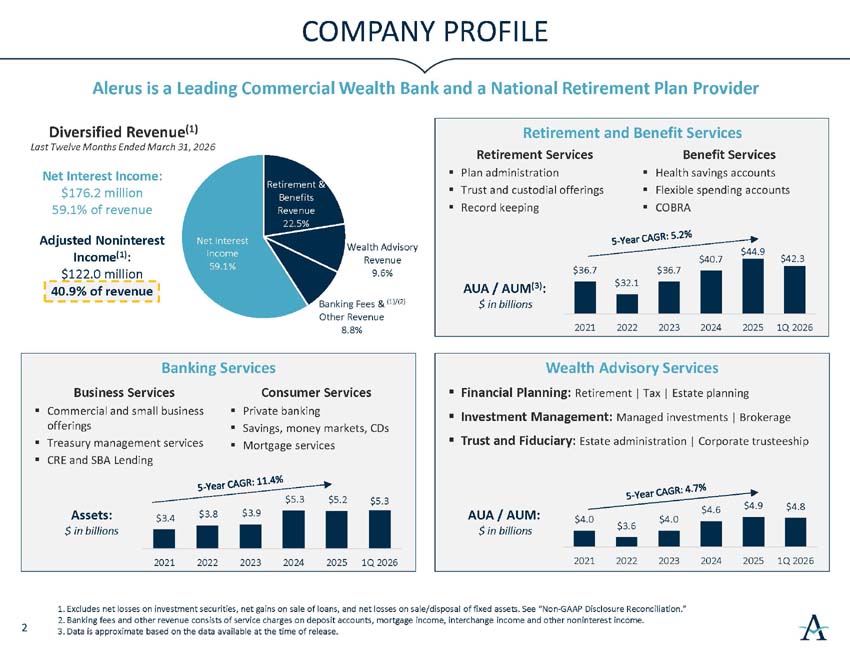
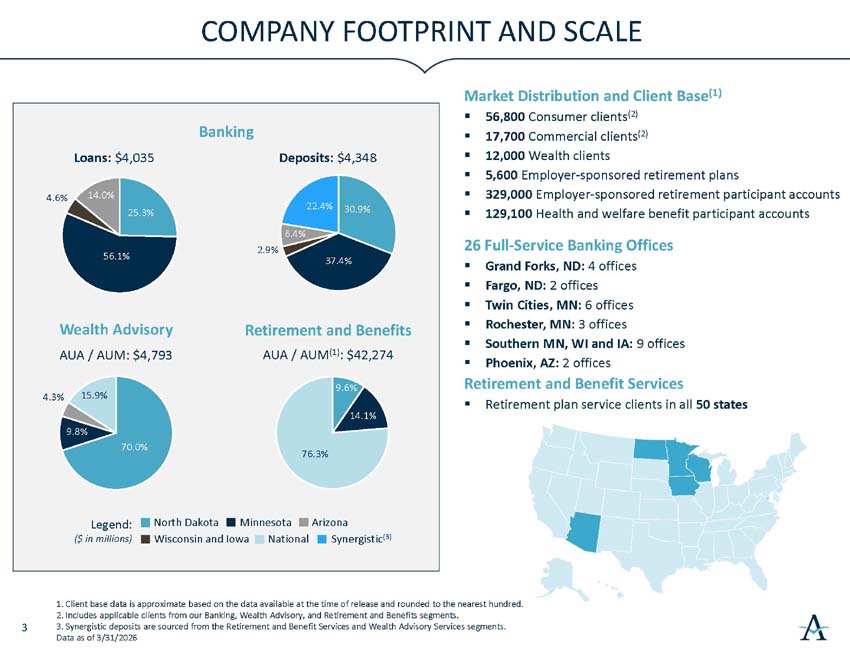
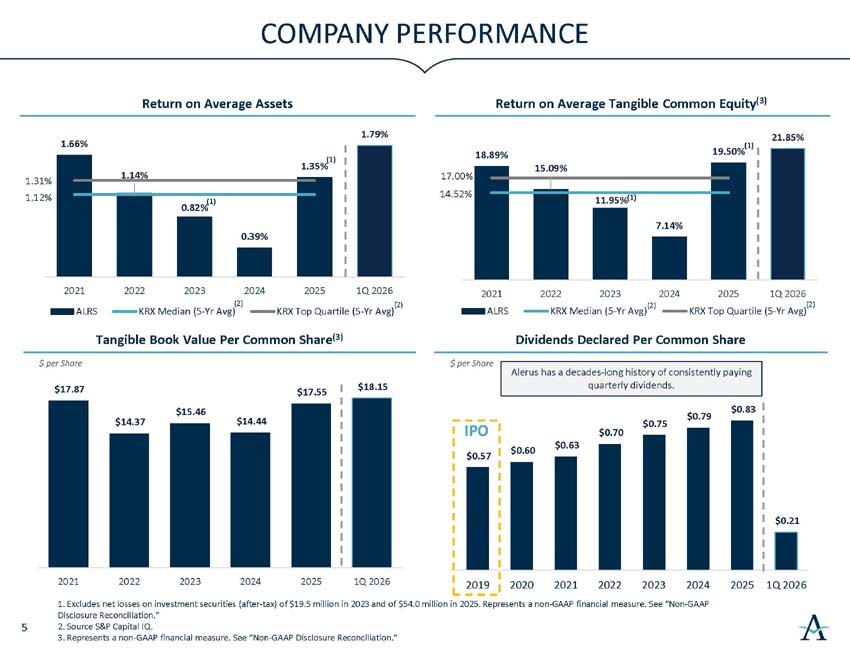
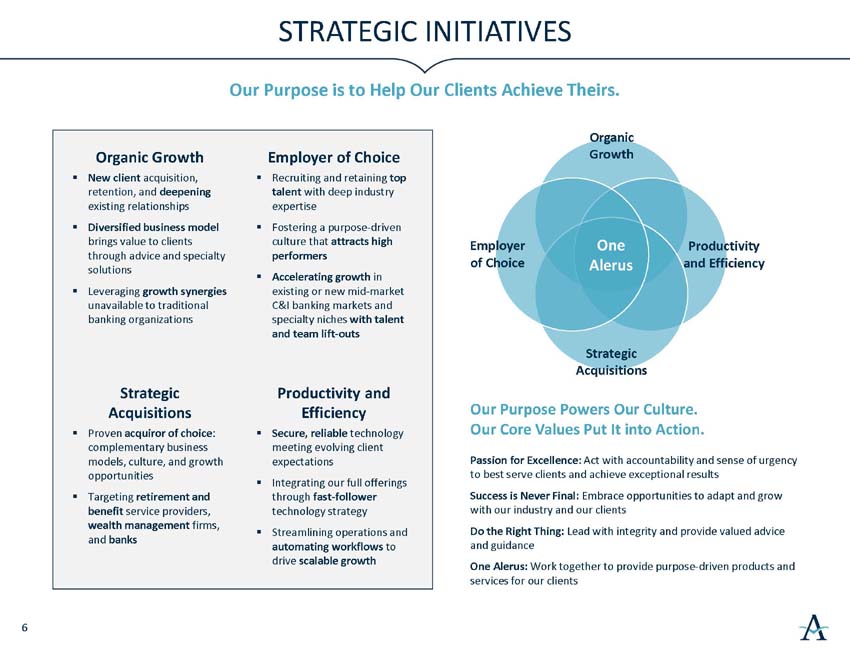
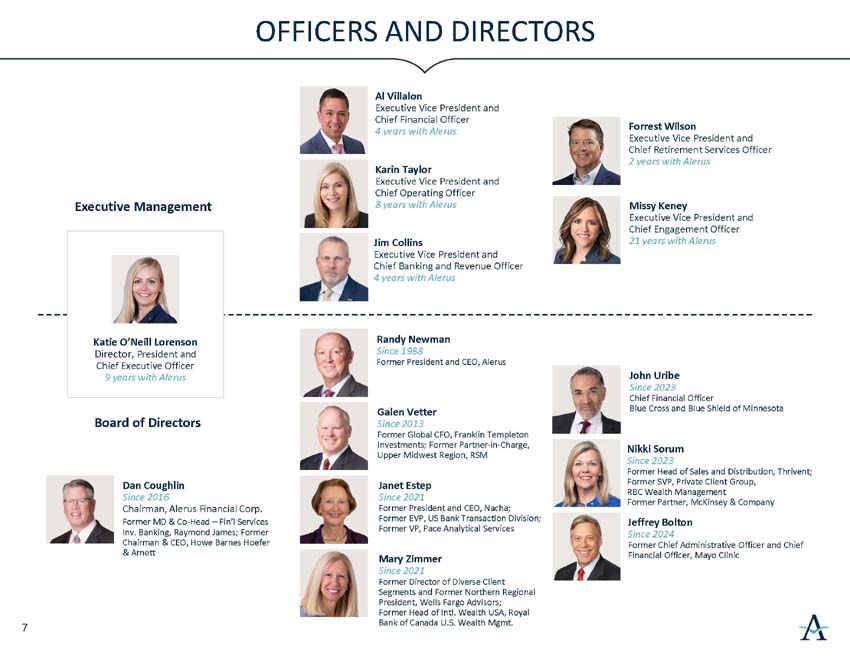
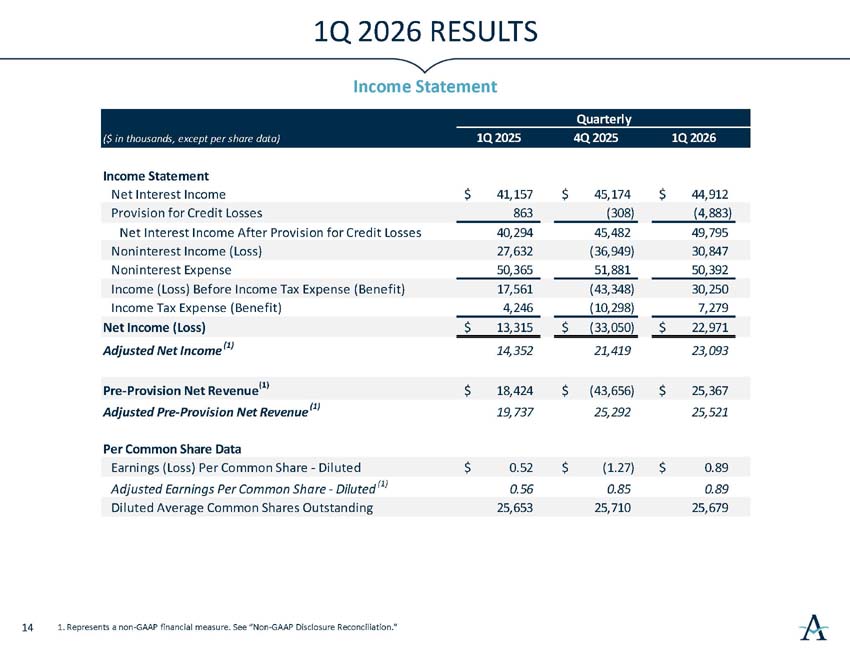
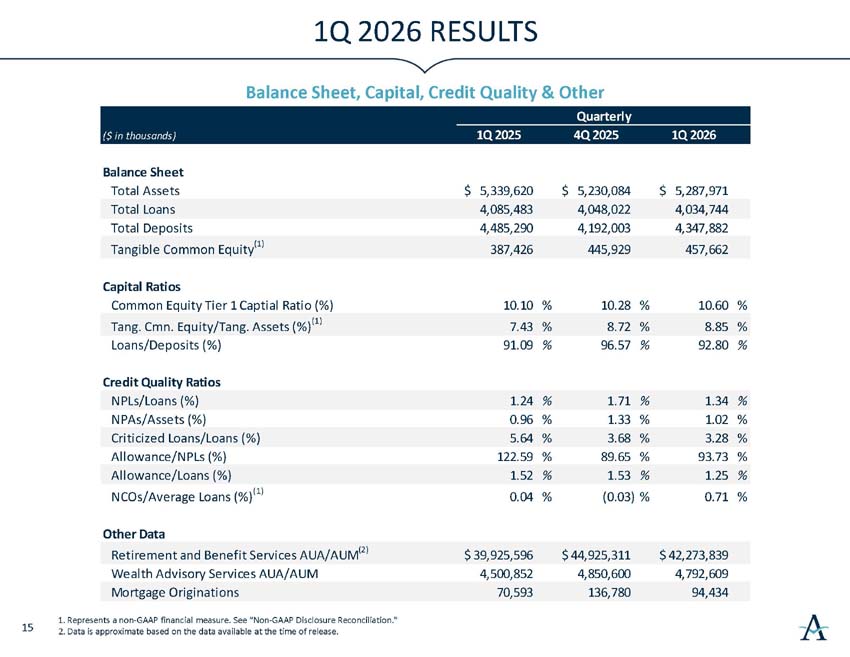
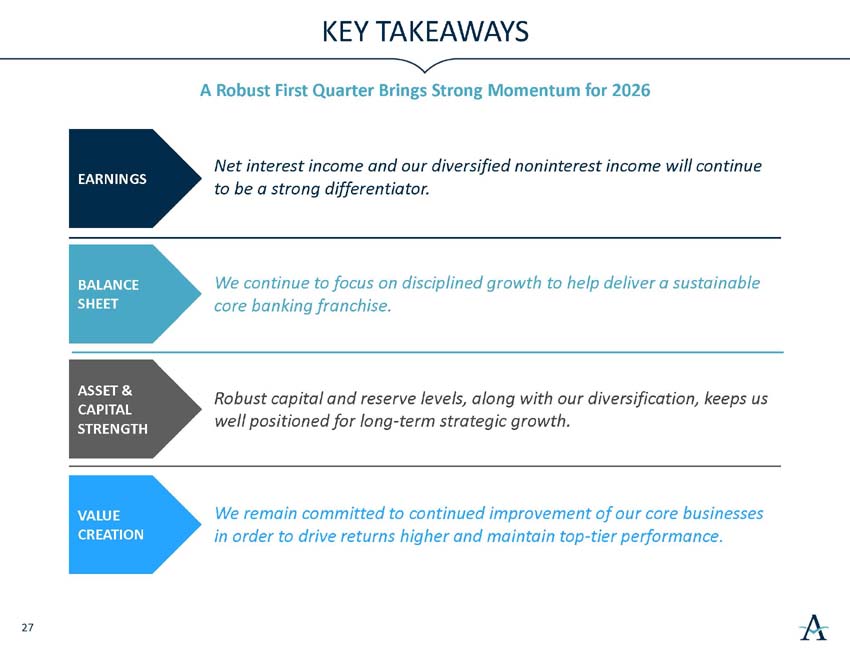
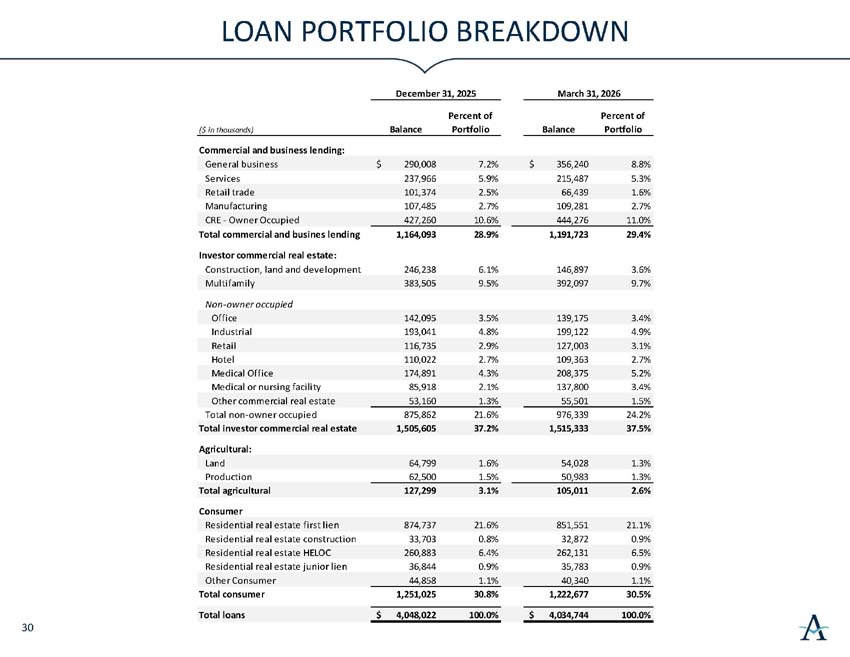
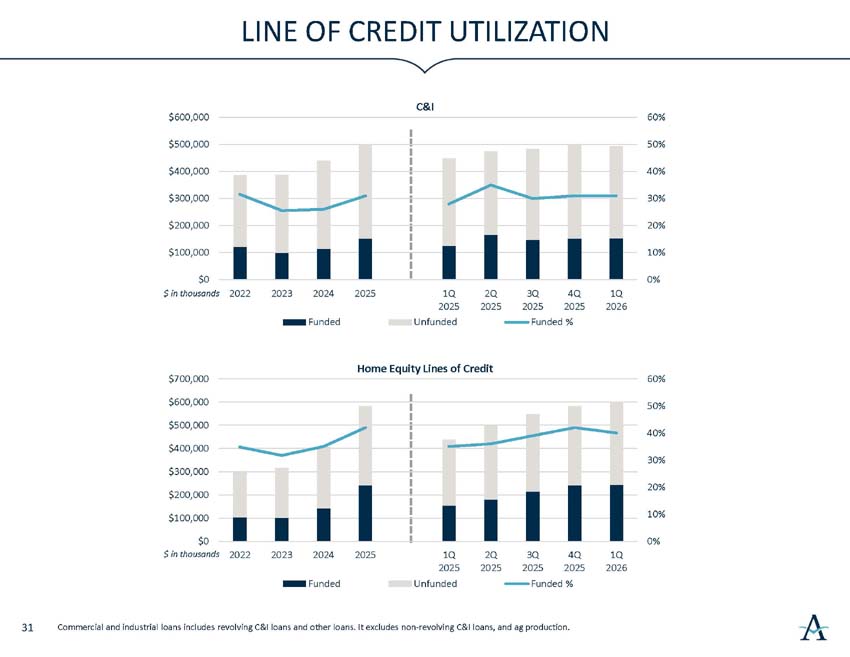
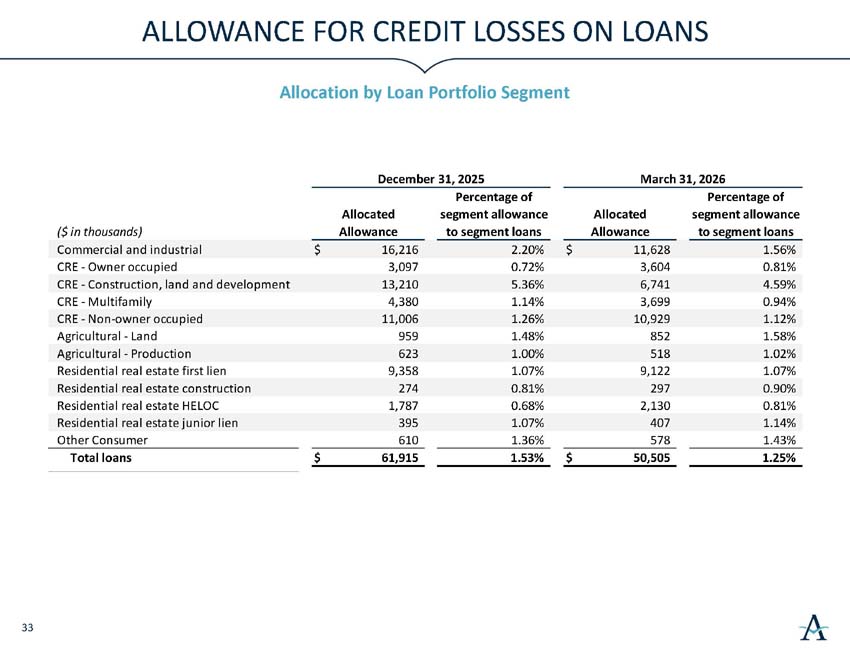
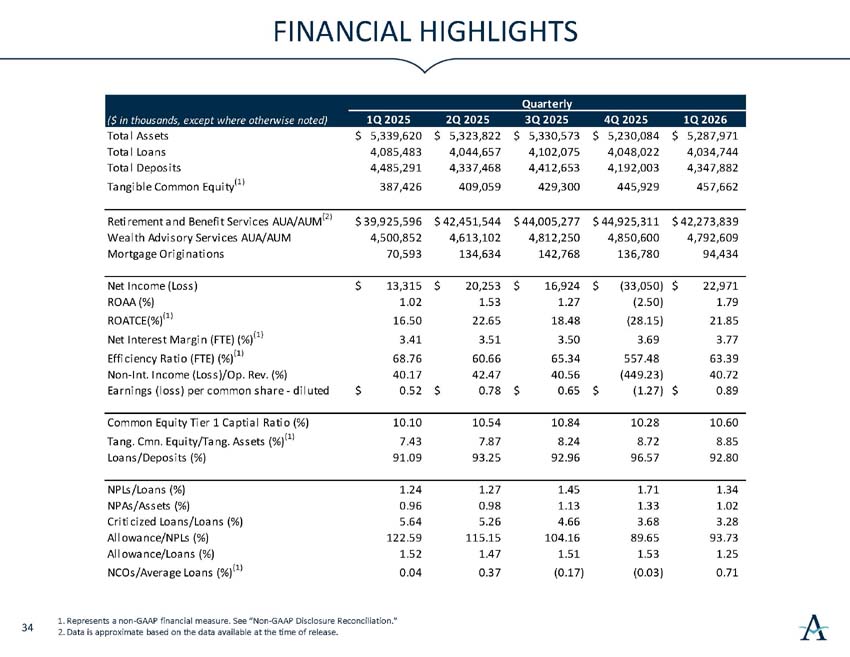
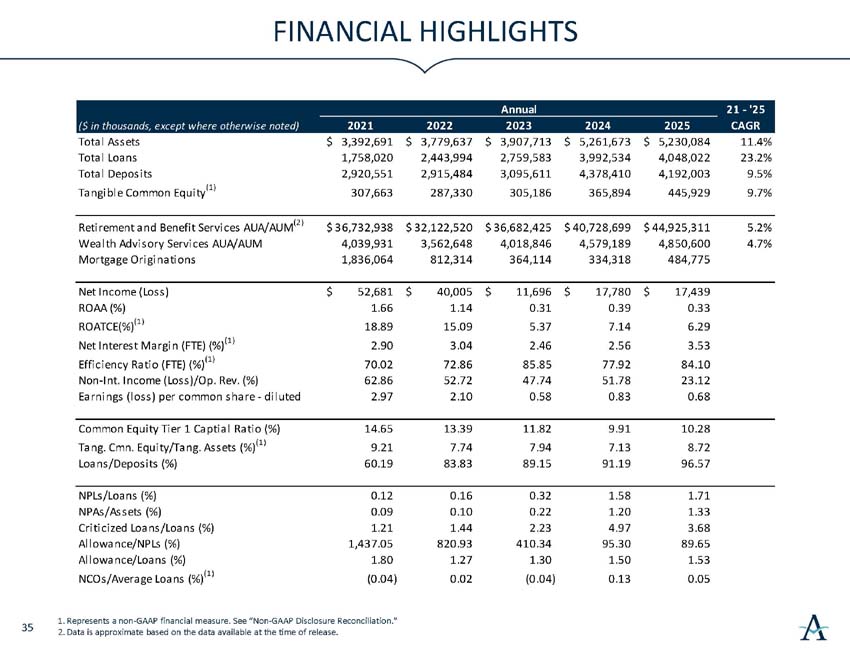
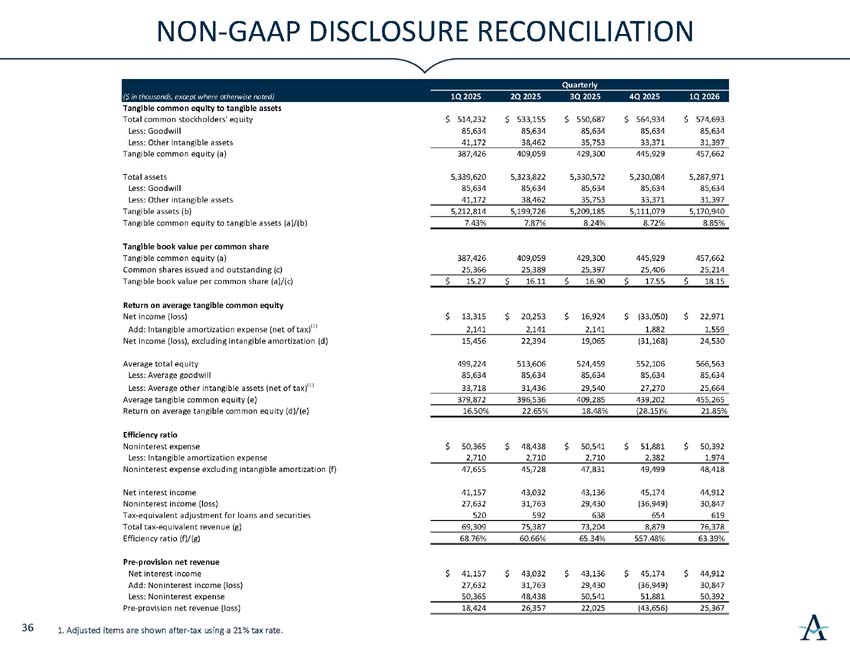
Thank you, and good morning, everyone. Appreciate you joining us today. With me today are Alaris CFOs, Al Villalon, our Chief Operating Officer, Karen Taylor, our Chief Banking and Revenue Officer, Jim Collins, and Alaris' Chief Retirement Services Officer, Forrest Wilson. We deliver a strong first quarter to begin 2026, And more importantly, one that demonstrates the progress we've made repositioning Alaris for higher quality, more durable performance. For the quarter, we reported net income of $23 million, or $0.89 per diluted share. Return on average assets was 1.79%, and return on average tangible common equity was approximately 22%. These results were driven by margin expansion, resilient fee income, disciplined expense management, and continued improvement in asset quality. We view this quarter as a clear validation that the strategic actions we've taken are translating into tangible financial outcomes. Our results reflect three structural strengths shaping the business. First, our balance sheet is fundamentally better positioned. Margin expansion in the quarter reflects disciplined funding management, the benefits of balance sheet actions taken last year, and a funding mix that continues to differentiate our franchise. Growth in highly valuable HSA balances sourced through our benefit services platform highlights the uniqueness of our funding model, with nearly a quarter of the deposit sourced from our integrated and synergistic business line. Second, diversification continues to matter. More than 40% of our revenue are fee-based, capital-light, and recurring. Our retirement and benefit services and wealth advisory fee streams provide stability across interest rate and market cycles. Even as asset levels and market conditions fluctuate, underlying engagement, client activity, and long-term profitability across these businesses remain solid. Third, we continued our success in recruiting high-quality talent, adding team members in key markets in Wisconsin and Arizona, in addition to progressing towards our goal of doubling the number of wealth advisors across the franchise. Impressively, we've maintained discipline on expenses while continuing to make these selective investments in technology and growth initiatives. Our focus remains on scalability, ensuring that as revenue grows, returns improve in a sustainable way. During the quarter, we remain focused on relationship driven growth. Commercial and private banking continues to be an area of focus with year-over-year C&I growth exceeding 10%, supported by healthy pipelines and strong client engagement. At the same time, we've remained intentional in reducing exposure to lower return and higher volatility segments of the balance sheet. The mixed shift is improving risk-adjusted returns and strengthening the overall profile of the loan portfolio. On the funding side, deposit trends reflect the value of our diversified platform. Growth in core deposits, including commercial and private banking relationships, in addition to our synergistic deposits, reinforces the strategic advantage of our integrated business model. As a result, the loan deposit ratio improved to under 93%. Asset quality improved meaningfully during the quarter. Non-performing assets declined and criticized loan balances continued to trend lower and we made significant progress resolving previously identified credit issues. During the quarter we charted down a non-accrual and well-reserved D&I credit related to a long-standing client relationship negatively impacted by changes in government funding. This was a single event and not reflective of broader portfolio trends. We also made substantial progress in moving closer to resolution on our largest remaining non-accrual relationship which represents approximately 65% of total non-accrual loans. As a result of portfolio improvement and credit resolution activity, we recorded a reserve release of $4.9 million during the quarter while maintaining an allowance for credit losses of 1.25% of total loans. Taken together, these actions underscore the strength of our credit discipline and our commitment to proactive risk management. Our capital position remains strong. Tangible book value per share increased to $18.15, and tangible common equity to tangible assets improved to nearly 9%. Capital ratios remain comfortably below regulatory requirements. During the quarter, we also repurchased $6 million of common stock while continuing to return capital through dividends. Our approach to capital allocation remains disciplined and balanced, supporting growth while returning excess capital to shareholders. Most importantly, the company's trajectory remains highly positive. The underlying fundamentals of the business, our talented team, balance sheet positioning, diversified revenue model, credit discipline, and operating focus are stronger than they had at any other time in our nearly 150 years as an institution. We remain focused on disciplined growth, continued execution, and delivering sustainable long-term value for our shareholders. And with that, I will turn the call over to Al to walk through the financial results in more detail.
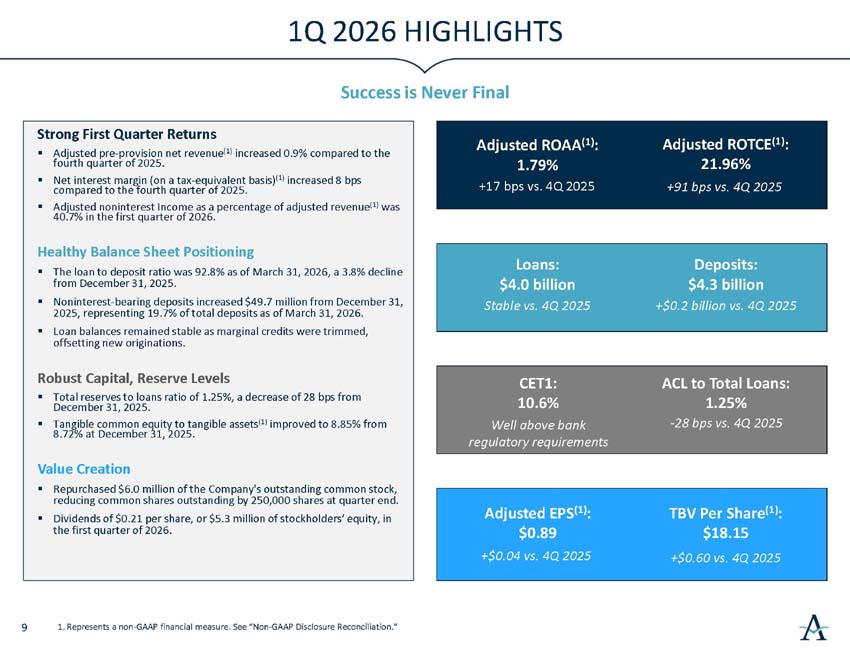
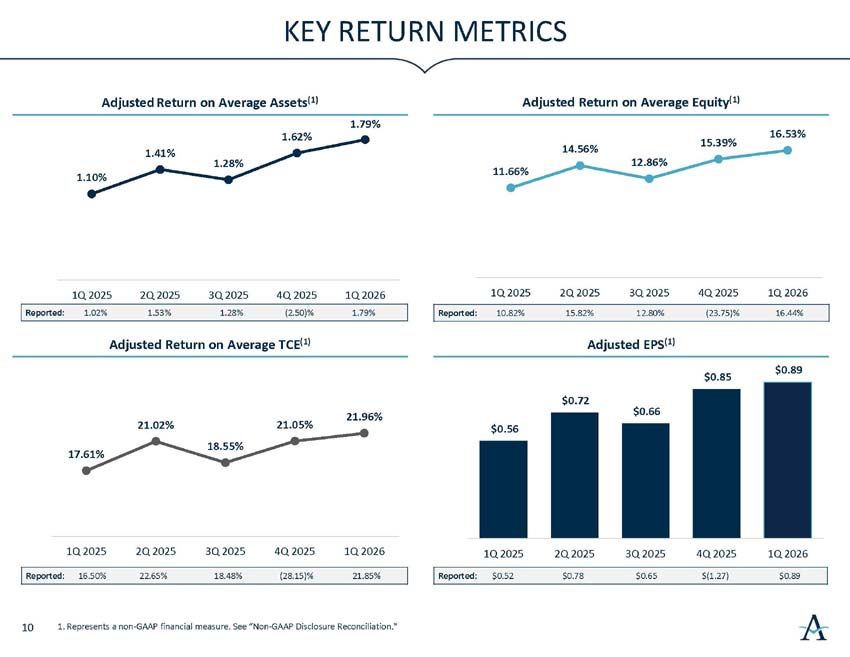
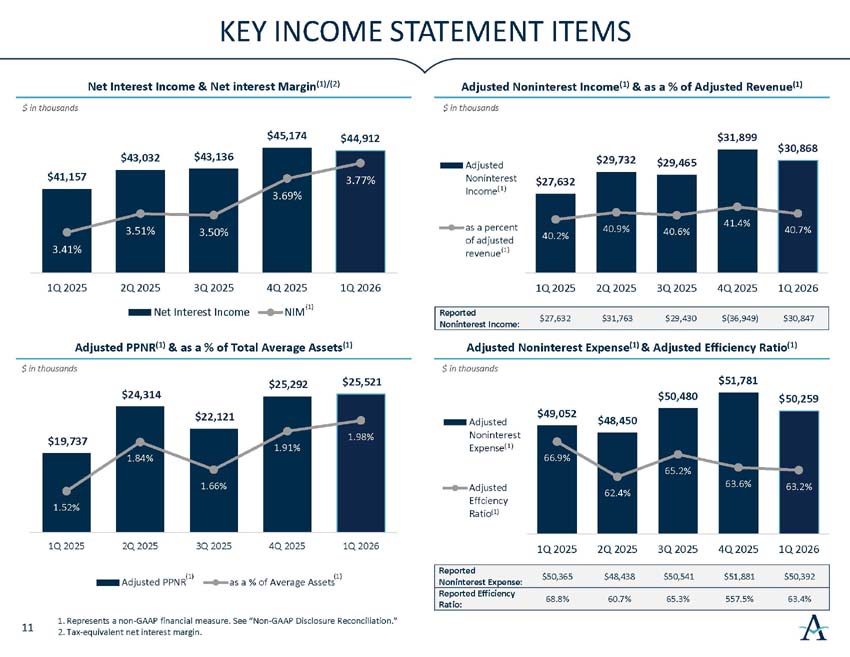
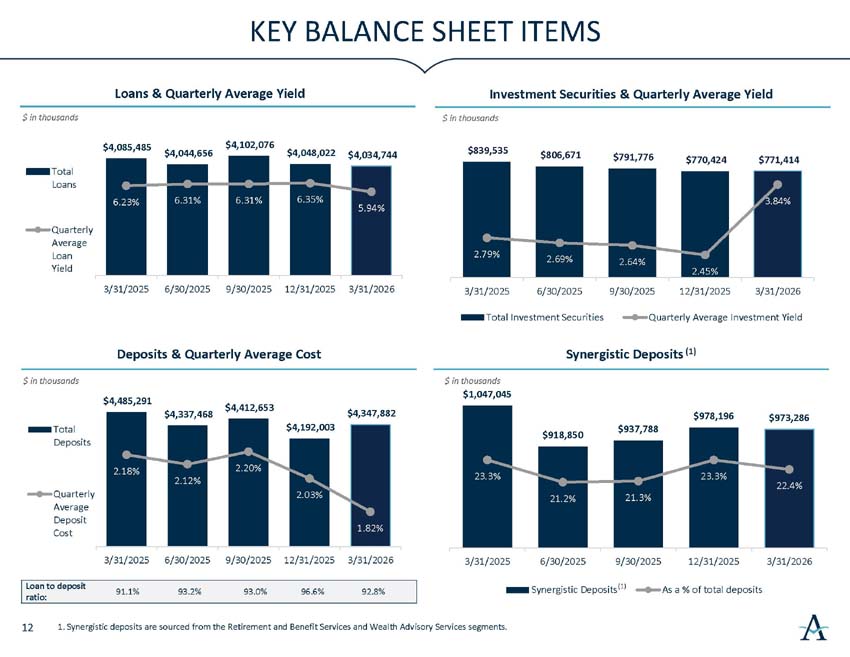
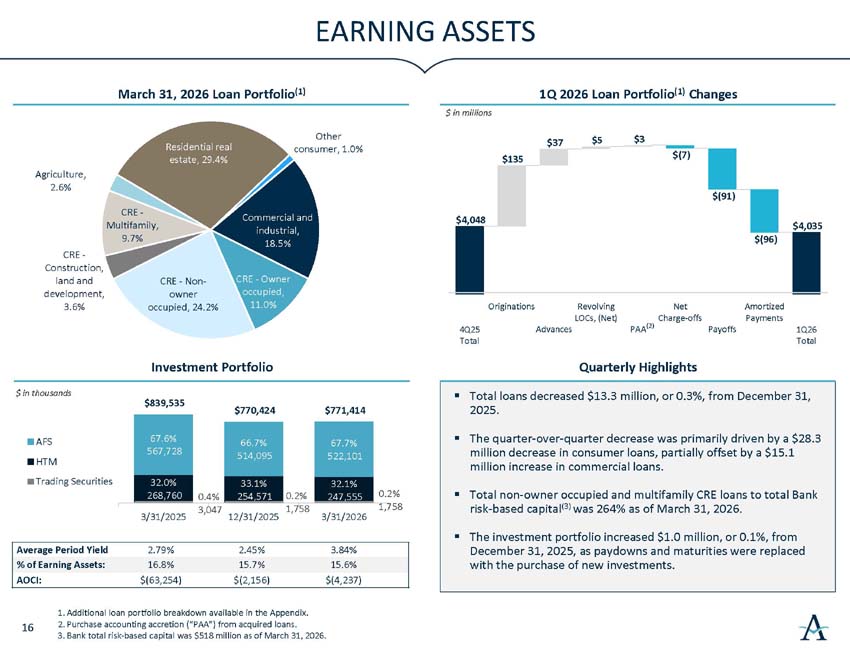
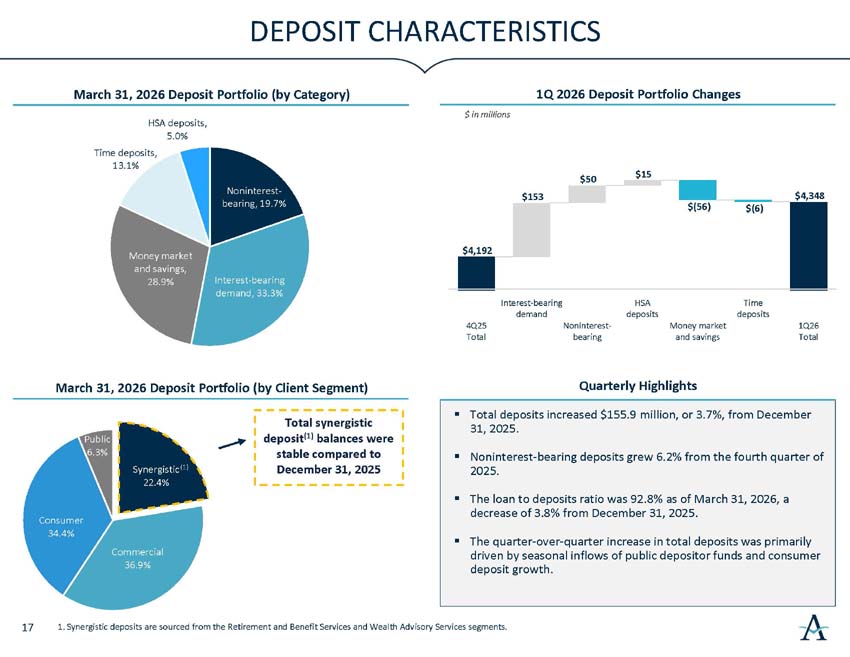
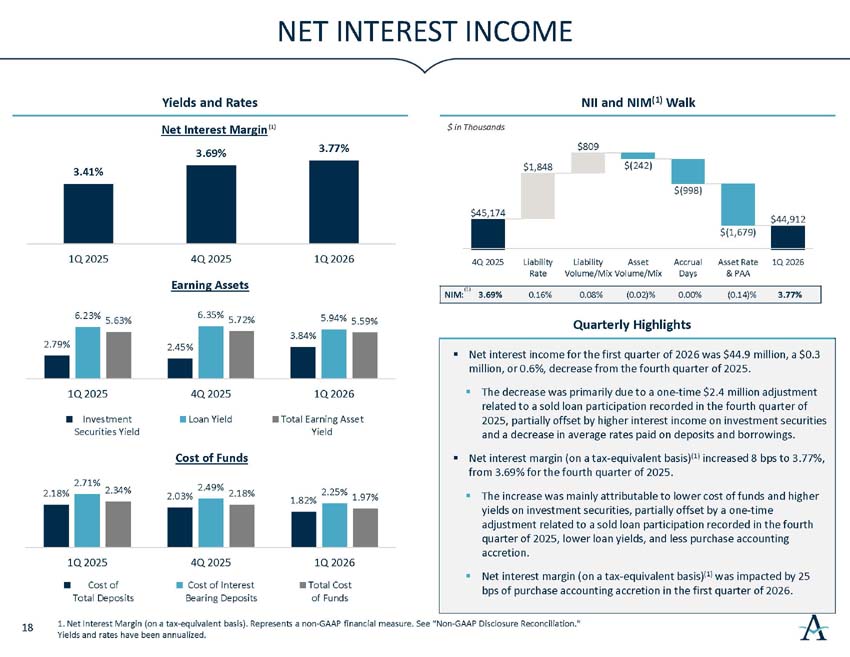
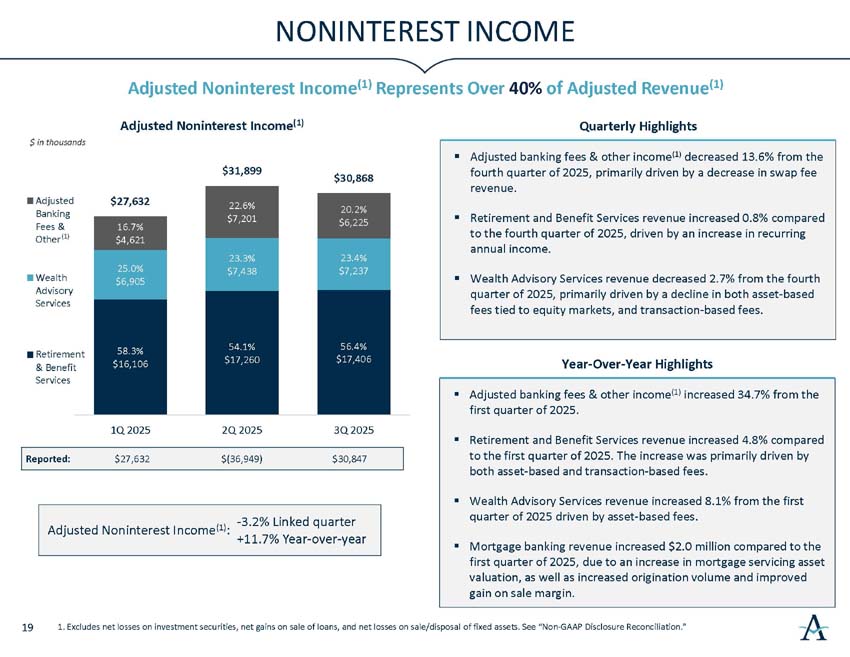
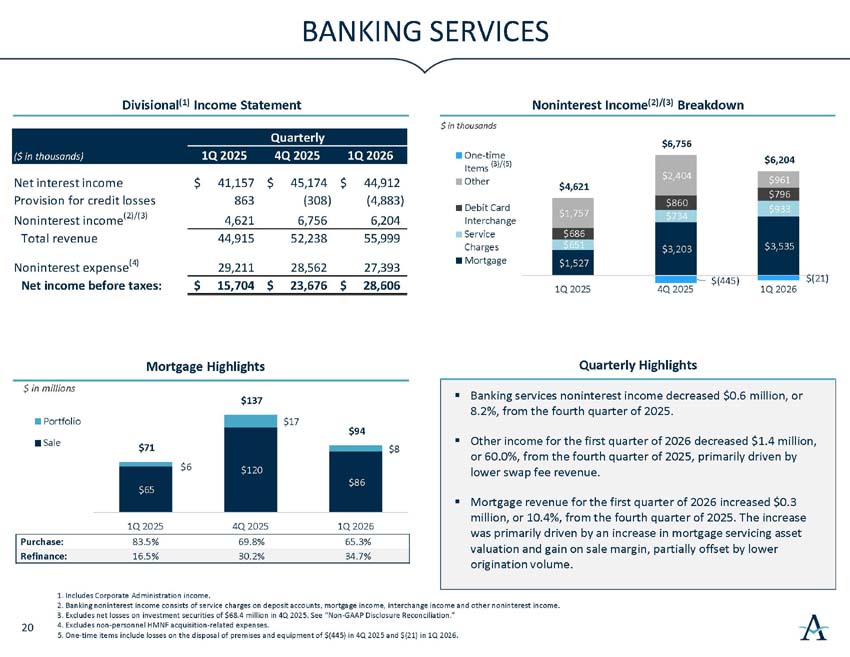
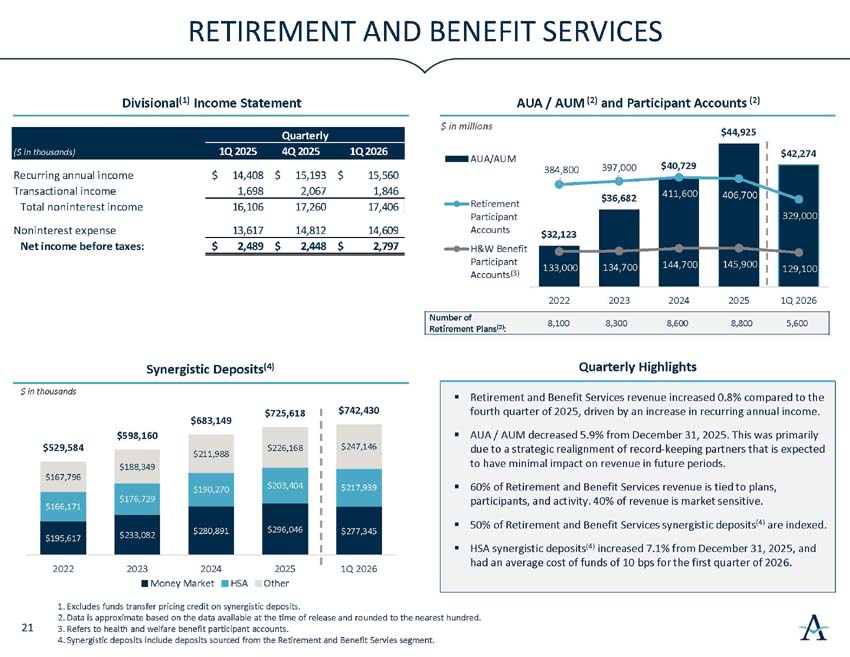
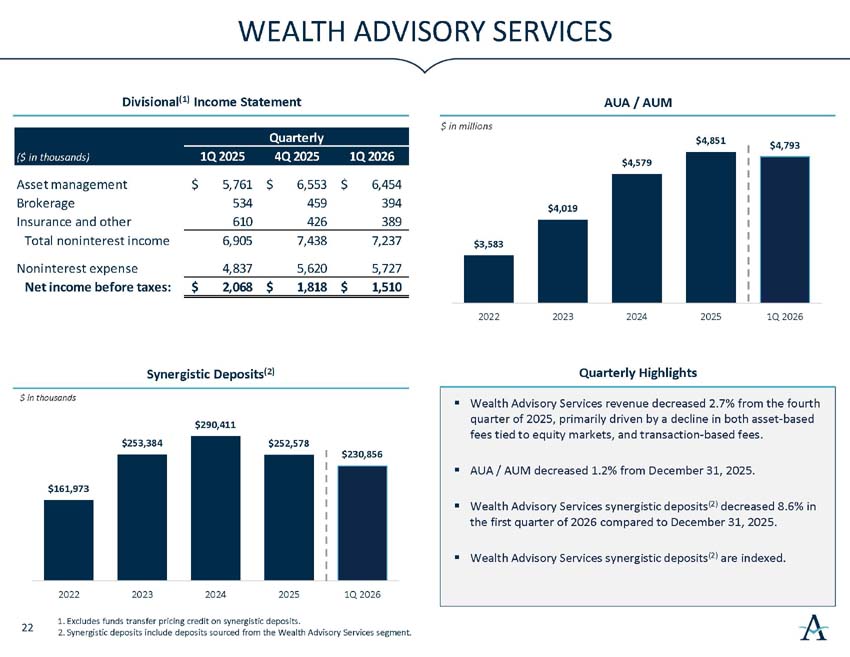
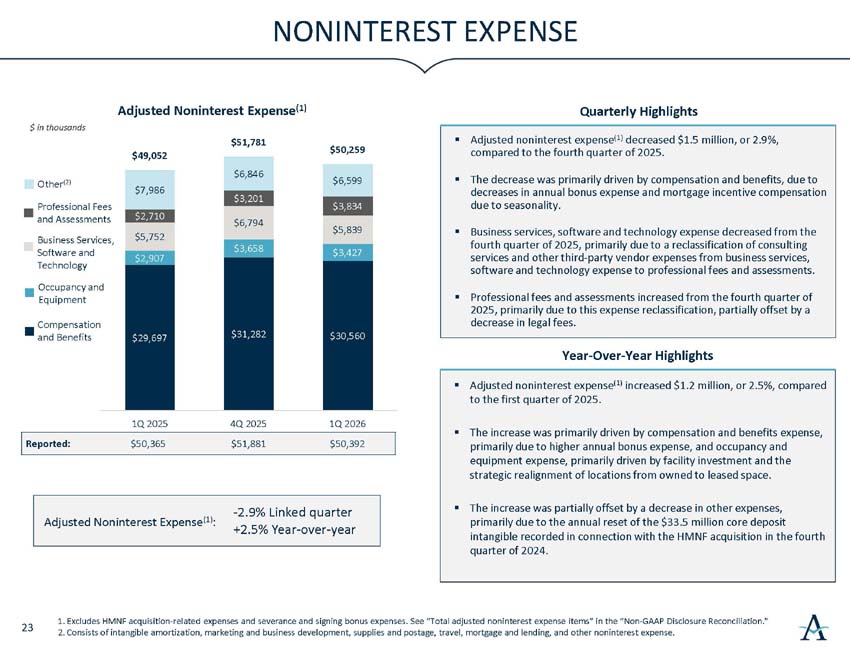
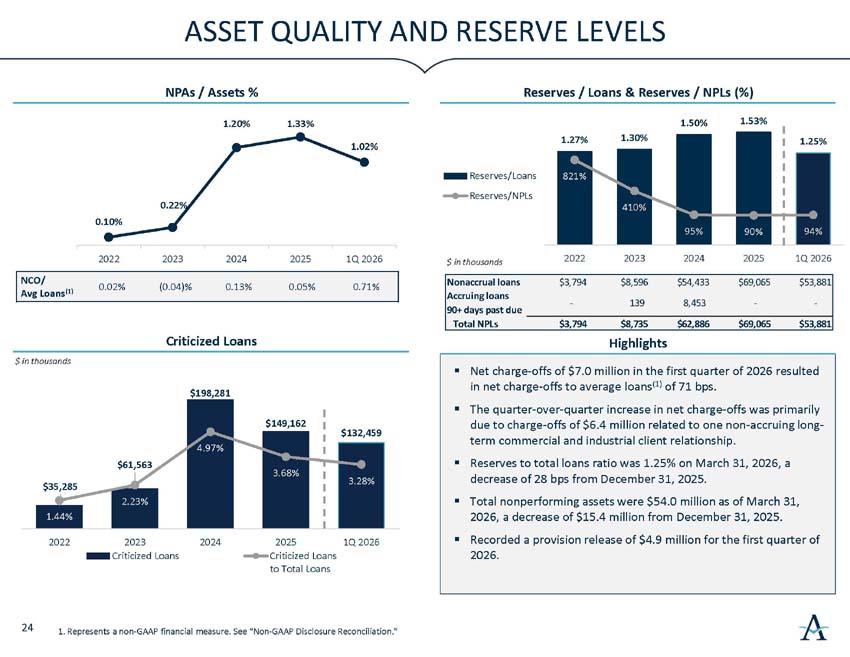
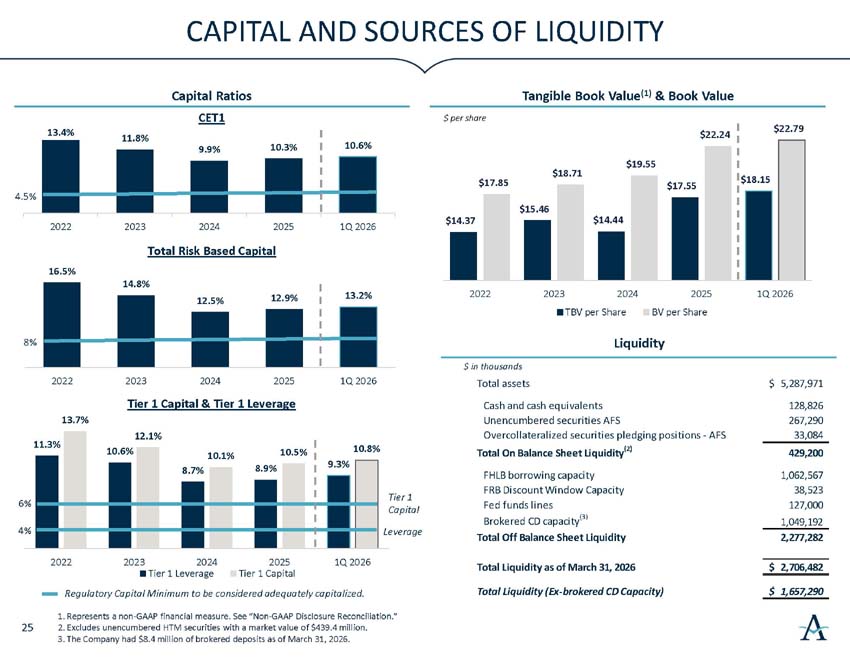
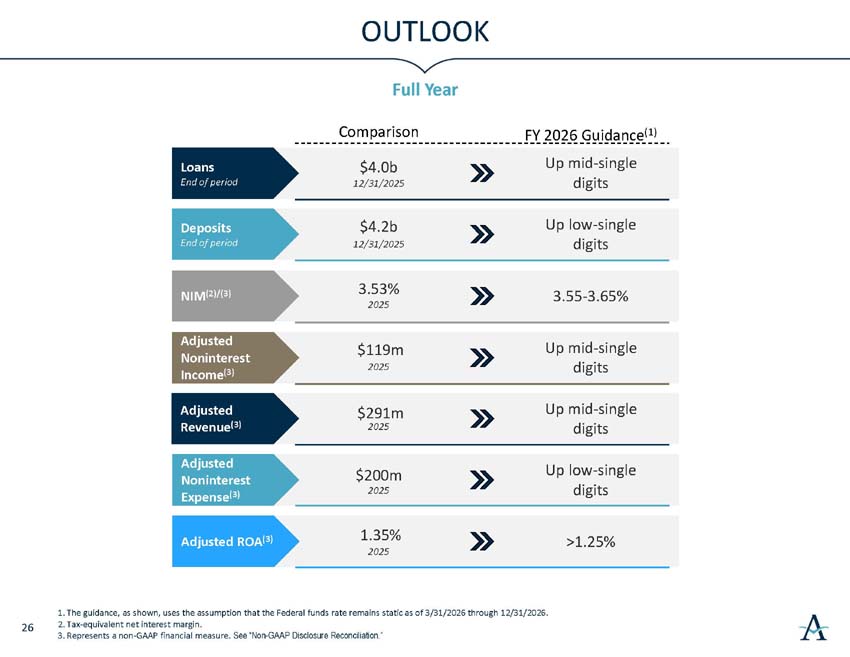
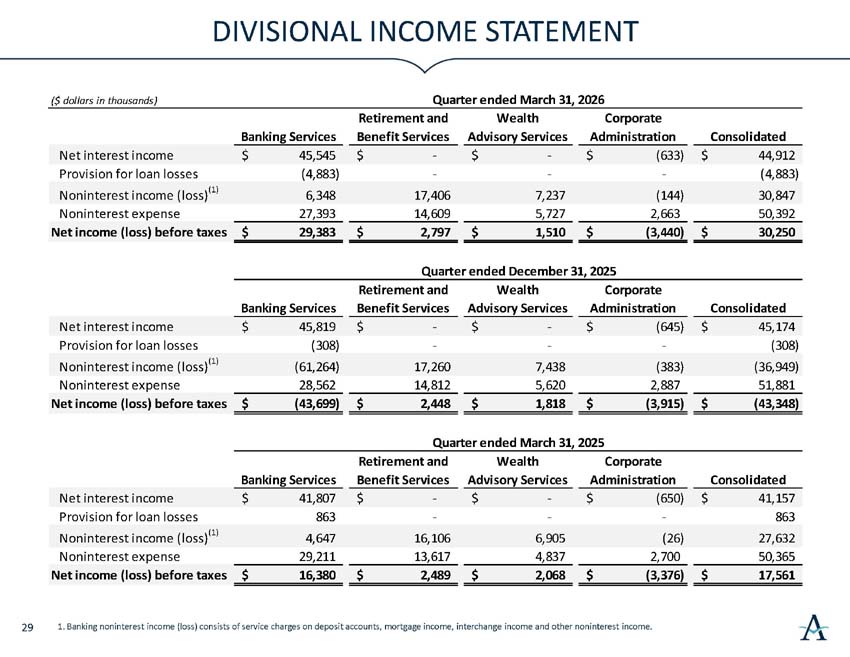
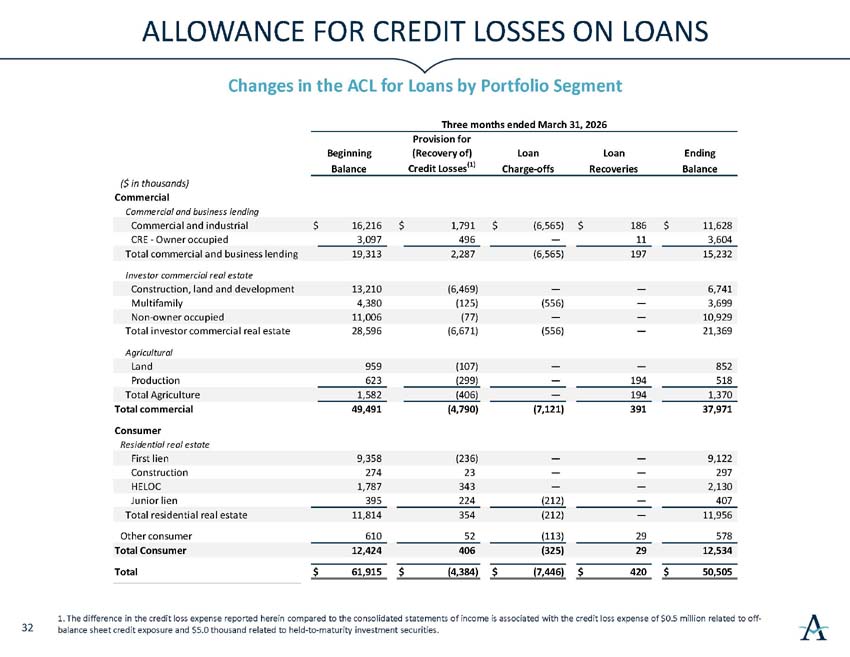
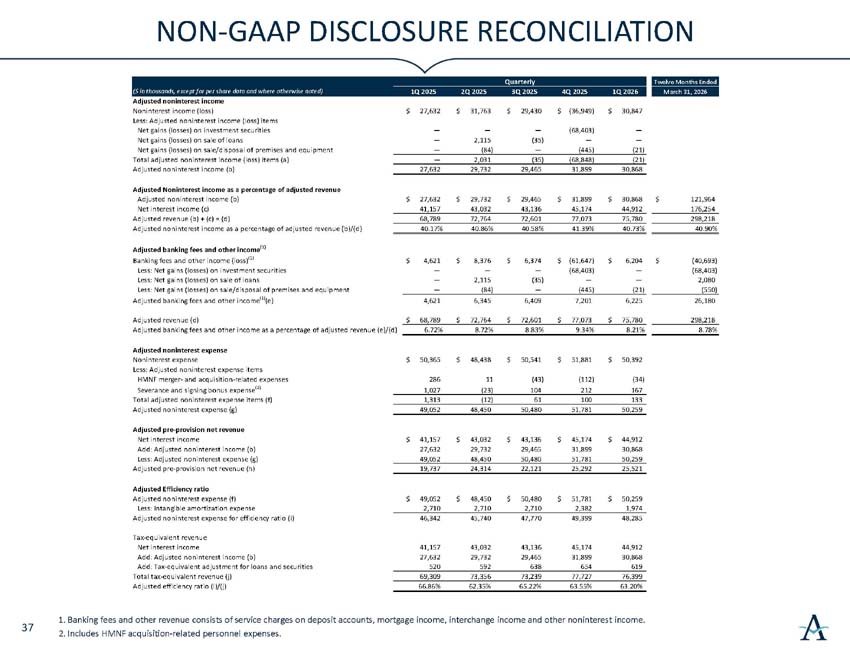
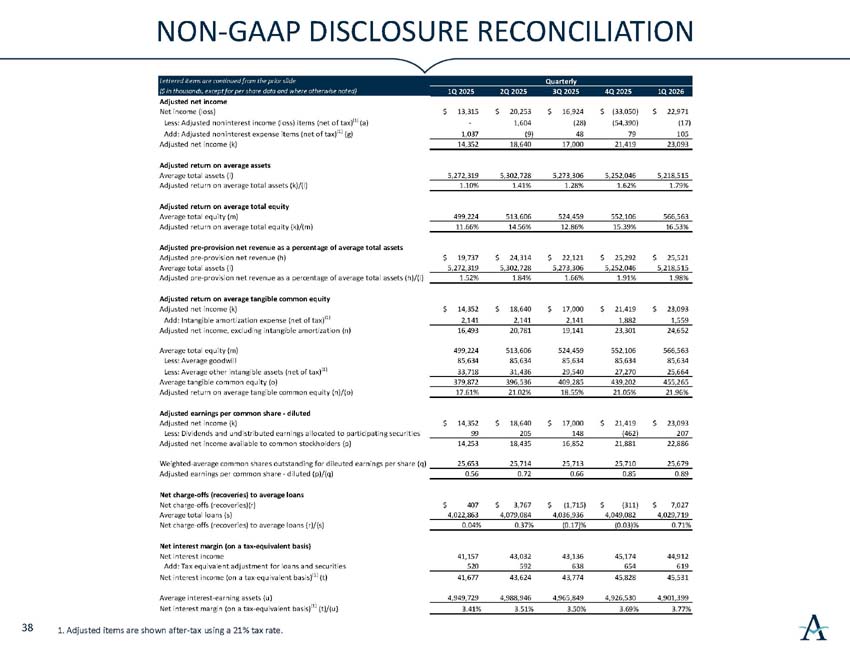
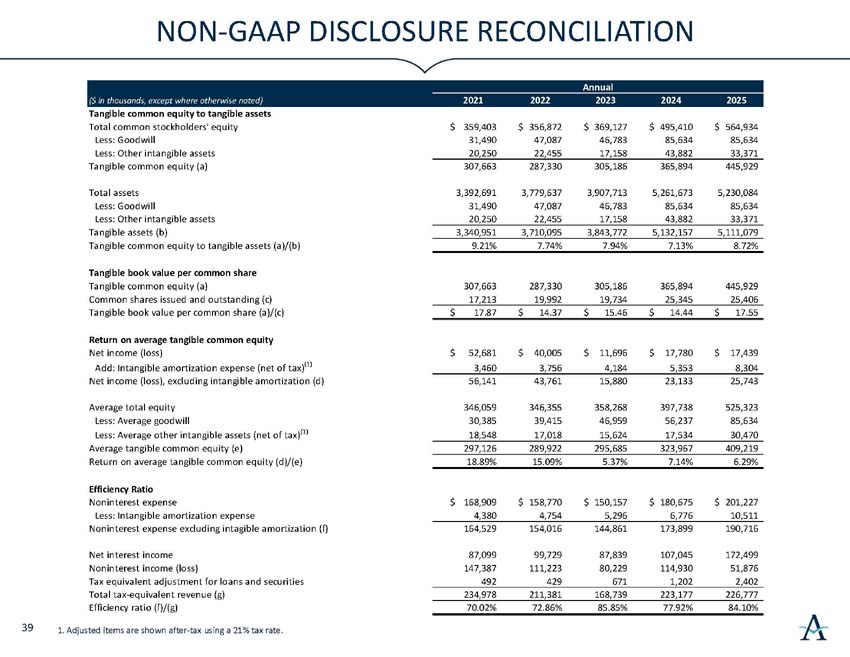
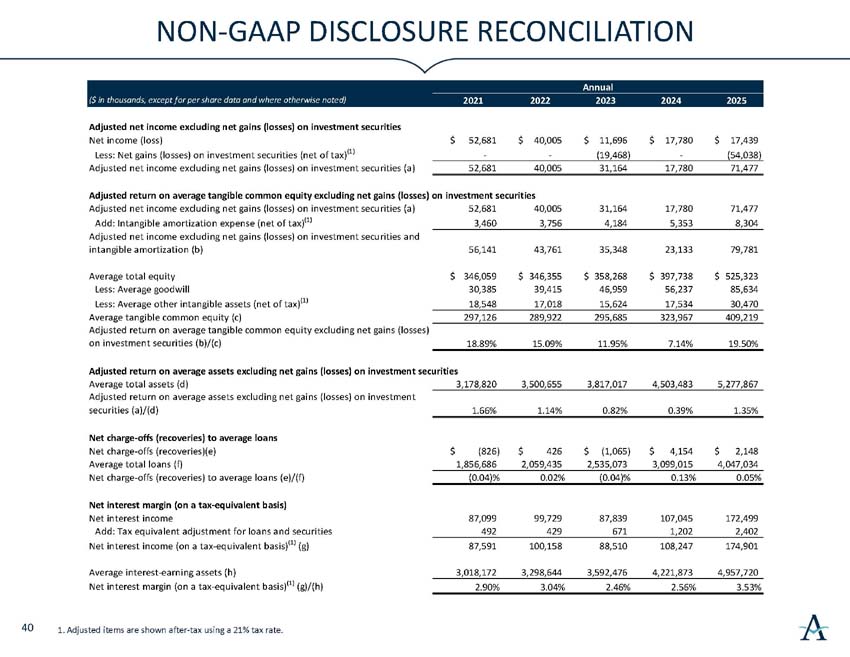
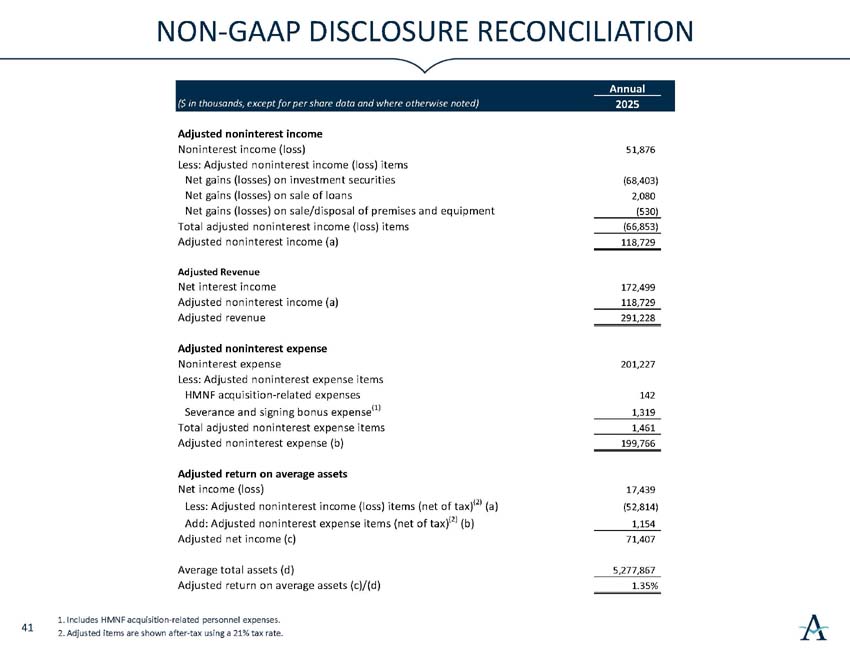
Thanks, Katie. Let's start on page nine of our investor deck, which is posted on the investor relations section of our website. In the first quarter, we delivered a strong start through 2026 and demonstrated the earnings power of the franchise following the balance sheet reposition completely last year. We generated adjusted saluted EPS of 89 cents, inclusive of $6 million of share repurchases during the quarter. Our results reflect continued coordinate interest margin improvement, disciplined expense management, and the benefit of our diversified business model, with non-interest income representing just over 40% of total revenue. Profitability remained strong, with an adjusted return on average tangible common equity of 21.96%, and an adjusted return on average assets of 1.79%, improving 17 basis points from the prior quarter. Tangible book value per share increased 3.4% in the quarter to $18.15, and a tangible common equity ratio improved to 8.85 percent, underscoring continued capital generation. Turning to the balance sheet, we remain well-positioned to support organic growth. Deposits increased 3.7 percent on a period-end basis, and our loan-to-deposit ratio improved to 92.8 percent. In addition, we continue to maintain robust liquidity, approximately $2.7 billion, providing flexibility to fund loan growth, manage through market volatility, and continue returning capital through dividends and share of purchases. Let's turn to page 16 to talk about our earning assets. At quarter end, loans were relatively stable versus the prior quarter. We continued to proactively reallocate capital to full relationships, primarily in C&I and private banking. Excluding this continued rationalization, end-of-period loans would have grown modestly. Overall, our loan mix remains balanced at approximately 50% fixed and 50% floating. On investments, we continue to benefit from the strategic portfolio reposition executed in the fourth quarter. During 4Q, we sold $360 million available for sale securities, representing over two-thirds of total AFS securities at year-end 2025. This restructuring improved the overall average investment portfolio yield by 139 basis points from 4Q25 to 3.84% in the first quarter of 26, and has been meaningful contributor to margin expansion. Currently, our balance sheet remains positioned slightly liability sensitive. On a rate cut, we will see slight margin improvement and vice versa on a hike. Turning to deposits on page 17, our funding profile continues to strengthen and remains a key contributor to margin expansion and balance sheet flexibility. On a period end basis, total deposits increased 3.7% from the prior quarter, reflecting growth across both public funds and core client deposits. Importantly, we continue to see favorable mixed improvement and operate during the quarter with only $8 million of brokered deposits. Non-interest-bearing deposits increased 6.2% in the quarter and now represents approximately 19.7% of total deposits. This shift meaningfully supports our cost of funds and improves the durability of our funding base. The quarter-over-quarter increase in deposits was driven by seasonal public fund inflows, as well as steady growth from commercial and private banking clients. We are particularly pleased by the continued stability of our core deposit franchise, which reflects core operating and treasury management relationships rather than rate-sensitive behavior. As a result of deposit growth and selective loan originations, our loan and deposit ratio improved to 92.8%, providing additional on-balance sheet liquidity and positioning as well to continue to support organic loan growth going forward without relying on higher-cost wholesale funding. Overall, our deposit franchise remains a competitive advantage supporting loan growth and providing flexibility as we navigate the evolving rate environments. Third to page 18, net interest income remained stable at $44.9 million. Reported net interest margin expanded 8 basis points to 3.77%, a new post IPO high. Purchase accounting accretion contributed approximately 25 basis points in the quarter. Excluding accretion, core margin was 3.52%, representing a 35 basis point improvement from the core margin in the fourth quarter. Drivers of the quarter margin improvement included a 21 basis point decline in the total cost of funds to 1.97% and a higher portfolio yield of 3.84% following the fourth quarter balance sheet repositioning. In addition, strong new business margins across both loans and deposits supported continued margin momentum. New loans were originated at average rates in the low to mid 6% range, while new deposits were in the low to mid 2% range. Turning to page 19, adjusted fee income, excluding the balance sheet for positioning and other one-time items, declined 3.2% from the prior quarter, primarily due to lower swap fee revenue. Importantly, fee income continues to represent over 40% of total revenue, demonstrating the value of our diversified model in a dynamic rate environment. Let's turn to page 20 for additional detail on fee income. Turning to banking services fee income, adjusted banking fees declined modestly from the prior quarter, primarily driven by lower swap revenues. We do not include swap revenues in guidance due to inherent variability and client-driven timing. Importantly, our core transaction-based fees remain stable, supported by continued activity across our commercial and consumer client base. Mortgage fee income increased over 130% from the prior year, driven by increased originations, improved gain on sale margins, and a higher valuation of mortgage servicing rights. While originations remain seasonally lower, economics per loan improved, demonstrating our ability to generate solid fee contribution even in a muted volume environment. On page 21, I'll provide highlights for retirement and benefits services. Total revenue increased to 17.4 million dollars of 0.8 percent linked order. Assets on administration and management declined 5.9 percent. It's important to note this change had and expected to have minimal impact on revenues as the revenue was replaced with new partnership on board during the quarter. Synergistic deposits within the retirement segment increased 2.3% in the quarter. HSA deposits grew 7.1% to approximately $218 million and continued to be a particularly attractive funding source, carrying an average cost of roughly 10 basis points. During the page 22 and Wealth Advisory Services, revenue in the quarter was $7.2 million. On a link quarter basis, revenue declined a modest 2.7%, primarily driven by market-related pressure on asset values as client retention remained strong. Assets under administration and management decreased 1.2% from the prior quarter, reflecting broader market performance during the period. From a fee-mix standpoint, the decline was evenly split between asset-based and transaction-based revenue, consistent with lower market levels and typical first-quarter seasonality. Turn to page 23, our expense discipline continued to translate into positive operating leverage during the quarter. Reported non-interest expense declined 2.9% on a linked quarter basis, reflecting lower incentive compensation as both mortgage activity and banking production were seasonally lower. Importantly, this decline was achieved while we continued to invest in the franchise. The increase in professional fees during the quarter was driven by the reclassification of certain vendor services previously recorded within business services and technology, rather than incremental new spend. Overall, expense trends remained well controlled, and we continue to demonstrate the scalability of our operating model as revenue growth outpates expense growth in the first quarter. This discipline supports both near-term profitability and our ability to invest selectively in growth initiatives without compromising returns. Turn to page 24, asset quality improved meaningfully. While net charge-offs were 71 basis points, the increase was driven primarily by a single $6.4 million charge-off on one previously identified C&I relationship that had previously been placed on non-accrual. This charge-down relationship still has remaining reserves of 78%. Importantly, non-performing assets declined $15.4 million link order and criticized loans were down 43% year-over-year. We recorded a $4.9 million reserve release, primarily driven by lower loan balances and an improved mix. Despite the continued positive trends, we maintained reserve level above the industry at 1.25%. On page 25, capital and liquidity remain strong. Tangible common equity to tangible assets improved to 8.85% and tangible book value per share increased to $18.15. We continue to return capital to shareholders through both our quarterly dividend and $6 million of share repurchases at an average price of $23.19 while maintaining substantial liquidity to support organic growth. Turning to page 26, our 2026 guidance has improved and reflects continued discipline and growth continued discipline growth and positive operating leverage we expect the following loans to grow at a mid single digit rate for the full year despite more than 400 million dollars of contractual maturities deposits to grow in the low single digits we have ample liquidity to support loan growth in excess of deposit growth a net interest margin of approximately 3.55 percent to 3.65 percent for 2026. in the second quarter we expect about 20 basis points of contractual purchase accounting accretion also for additional context the exit rate of our net interest margin was approximately 3.65 percent for the month of march adjusted non-interest income to grow to grow in the mid single digits driven by continued growth under wealth and retirement businesses consistent with prior guidance swaps the income is not included given variability Total net revenue growth in the mid-single digits, with non-interest expense growth in the low single digits, will continue to support positive operating leverage. We do expect second quarter non-interest expenses to be slightly higher due to a seasonal uptick in mortgage and banking production, along with proved equity markets in our wealth division, which will push incentives higher. Full-year return on assets will exceed 1.25%. Finally, for each additional 25 basis point cut in rates, we would expect net interest margins to improve roughly three to five basis points. In summary, our first quarter performance demonstrates that the earnings power of the franchise is taking flight, and we believe Alaris is well positioned for 2026 and beyond to reach new heights. With that, I'll now open it up for Q&A.
Operator
Thank you. Keep in mind, if you would like to ask a question, please press star 11 on your telephone. You will then hear that automated message advising your hand is raised. We also ask that you please wait for your name and company to be announced before proceeding with your question. One moment while we compile the Q&A roster. The first question will be coming from the line of Brandon Nozzle of Hard A Group. Your line is open.
Hey, good morning, everybody. Hope you're doing well. Maybe just starting off here on the retirement business, Can you just unpack the decline in plan participants in AUA this quarter and help us understand why is revenue neutral, as you pointed out in the release?
Speaker 9
Yeah, Brendan, it's Forrest Wilson. Thanks for the question. I can say, since I got here, we've been putting efforts on a much more disciplined and aggressive approach to our growth strategy, really scrutinizing the mix of business that we take on more closely than ever, and specifically looking at profitability operational leverage and complexity in this past quarter we were able to exit a large low margin client that uh it was a legacy relationship that had significant assets but generated limited revenue relative to size and added kind of disproportionate operational complexity for sure for our division um coincidentally additionally... Hey, Forrest?
Forrest, this is Al. We're getting some feedback here. Can you start over because you're sounding a little muffled?
Speaker 9
Yeah, sorry about that. Is that okay?
Speaker 4
That's okay. I can take it, Forrest.
Speaker 4
Thank you for the question. In regards to the drop in assets participants for the quarter, it was driven by the exit of a large lower margin legacy relationship and replaced with a new partnership that has much higher levels of profitability, but lower levels of assets and participants.
All right. Sorry about that. Thanks, Katie.
Speaker 4
Yeah, no problem.
Yeah, I mean, as Katie mentioned, so coincidentally, we exited a large low margin client that had significant assets. And we onboarded a very substantial new partnership that does have lower assets, but is much higher, more simplified business, which is in line with our strategy. So all in all, it was absolutely just an episodic event of this quarter, but does reflect a deliberate focus on us trying to achieve higher quality, more profitable business. um but it uh happened in the same quarter and it's largely a revenue neutral event between the two okay all right that's helpful color there i appreciate it um maybe moving on to um loan growth and demand um can you spend a minute talking about what gives you confidence you'll still hit the the mid single digit growth guide for the year just given the the softer start to the year.
Yeah, this is Jim Collins. We're staying the course, right? We started off a little slow on loan production, but we are moving out some investor CRE that doesn't fit our risk tolerance or is some risk-rated loans that we're pushing out now. But our C&I pipelines are fairly robust in all markets except for our ag our ag is relatively flat which is fine with us um we will still plan to hit single digit growth for the year but we are still pushing out some credits for uh in 2026 in the in the investor cre buckets okay that's helpful um i'm going to sneak one more in there um just on the margin al i think you said the exit margin in the month of march was 365 265 versus the quarters reported 377.
Just help us understand kind of the evolution from the full quarters reported number to that exit margin. Like, what were the puts and takes there?
Yeah, I mean, a lot of it had to be lower deposit mix. So, we did see really good mix shift there, especially on the deposit side, because they had good inflows there. We do expect lower purchase accounting increase on a go-forward basis. That's why I want to get the exit rate there. So, we're We're only anticipating 20 basis points of purchasing account increasing in the second quarter, and it's probably going to step down from there because as we continue to see accelerated payoffs that's borrowing from the future into today. So those are kind of the main puts and takes. We did – our cost of funds did decline nicely, too, from the Fed cuts in the fourth quarter of last year, and that was one of the big drivers along with the BSR. Okay. Thanks, Pat. Appreciate you taking my questions.
Operator
Thank you. One moment for the next question. And the next question is coming from the line of Jeff Rulis of DA Davidson. Your line is open.
Just circling back on that margin, Al, just to be clear, the $355 to $365, is that – are you excluding accretion?
No, that's total reported numbers. That's for the full year.
And you're including your expected accretion in that figure?
Correct, with no accelerated payoff for the remainder of the year. So we do expect personal accounting accretion to decrease as each quarter progresses.
Okay. And the, you know, I think you mentioned some adjustments in the March quarter, but that would imply flat to down. Is that maybe just sounds like kind of margin compression from, you know, going forward? And what's the, I guess, the cautiousness on that part? Is it just easing of deposit benefits?
Yeah, no problem, Jeff. So it is partially easing of deposit benefits. We did see a couple of rate cuts at the late last year, but also, too, in the second and third quarters, we typically see upflows of deposits, especially from our public funds. So that's going to put a little pressure on our deposit base because as we replace some of our lower-cost funding with higher-cost funding, that'll put a little bit of pressure on there as well.
Okay. And, Al, in the first quarter, were there any interest recoveries in the margin that impacted the 377? Is that anything in there? No, no, we're not. Okay. Got it. And then one other question is just to kind of back into the loan growth side, maybe do you have production, you know, gross production in the first quarter versus Q4. It sounds like, you know, I heard the last commentary about, you know, pushing some credits out, but trying to get a sense for that product. It sounds pretty good on a core basis. So, anything on the production numbers that you can give us quarter over quarter?
From a CNI standpoint, we had really solid CNI growth. I don't have the numbers in front of me, per se, but we're driving mid-market C&I growth fairly well with the full relationships. The CRE, some of the CRE that we put on the books two, three years ago, that's what we're moving off the books, first quarter, second quarter, that's what you'll see moving off the books. And you'll continue to see the percentages of C&I grow quarter over quarter like you did last year. When you saw year over year 10% C&I growth, you'll continue to see that through 2026 and 27, as that has been our core focus the last three years.
Would you say production in C&I was greater in the first quarter than it was in in the fourth quarter?
No, I think it was a little bit lower than it was in the fourth quarter, but I think the pipelines building to second and third quarter look very healthy.
Operator
Thank you. One moment for the next question. And the next question will be coming from the line of Nathan Reiss of Piper Sandler. Your line is open.
Hi, everyone. Thanks for taking the question. Al, just going back to the margin discussion, if you strip out the accretion that you mentioned in the quarter, you know, that implies core loan yields are kind of 560 in one queue. And to get to your margin guy, I think that would imply, you know, a decent step down in loan yields, but it doesn't sound like there's anything unique in kind of that core loan yield in terms of interest recoveries in response to earlier questions. So I'm just trying to kind of jive the trajectory of loan yields, particularly within the context of what you mentioned in terms of new loan production coming on the low to mid-sixes.
Thanks for that, Nate. I mean, basically, with just a little conservatism there, especially as we, you know, we still think our core margin will be in the mid threes, you know, but as we continue, you know, as Jim probably could talk about this a little bit more too, but we are seeing competition pick up, especially in the deposit front. So, you know, the benefit as those deposit costs of fund decreases is probably behind us right now unless we see another Fed cut in the future because we are seeing more pressure on deposit costs in our footprint.
Yeah, I would say in all markets. Obviously, all banks are focused on deposits, just as we are. It's getting extremely competitive. It's been competitive the whole time. Everybody's sharpening their pencils, so that continues to tighten.
Okay, that's really helpful. Thanks. Maybe a question for Katie, just in terms of some updated thoughts on excess capital management. You guys are building capital of pretty strong clips that even with some balance sheet growth returning, I think you're still going to be accruing capital quite nicely going forward so just curious how you're thinking about maybe executing on buybacks as a more continuous capital management tool particularly just imagine your you know the valuation probably isn't quite where it needs to be or should be considering where you trade on price tendril basis.
Speaker 4
Yes great question thank you.
So from a priority standpoint pretty consistent with what we've discussed in the previous quarters invest first and foremost in organic growth but returning capital opportunistically especially as you mentioned when valuations warranted is continues to be a priority we were active this quarter we intend to remain active in our buyback going forward okay really helpful if I could just sneak one more in on the wealth management front would just be curious to get an update in terms of kind of the traction you're seeing from some of the production related hires that you brought on over the last several quarters, and just generally how you're thinking about that revenue line growing this year, assuming we have some stability in equity market valuations over the balance of this year?
Yeah, I would say we put on some hires end of last year, a couple more at the beginning of this year. We're seeing some traction on new revenue from them, and we have some additional hires that we're looking to hopefully hire on the balance half of this year. We've had solid retention of all clients as we put on that platform. If you recall last year, we've had, you know, the first quarter was predominantly just issues with the markets, but we should see generally good performance out of additional revenue growth out of new clients as we're putting on new wealth advisors going forward.
Okay. That's great color. I really appreciate it. Thanks, everyone.
Operator
Thank you. If you would like to ask a question, please press star one one on your telephone. Our next question will be coming from the line of Damon Del Monte of KBW. Your line is open.
Hey, everybody. Hope you're all doing well today, and thanks for taking my questions here. So first, I'm going to circle back on the loan growth. So it sounds like you still have some targeted CRE loans to kind of work off the balance sheet. So, as you think about, like, the quarterly cadence going forward, should we expect kind of, like, flat-ex balances here in the second quarter and then a nice jump in the third and fourth quarter to kind of get you to that full-year target?
I would look to that, yes.
Okay, great. And then, given the slower growth here expected in the second quarter, should we, you know, kind of model in a very modest provision, especially given the sizable release of reserves this quarter? Like, it seems like you feel like you've right-sized your reserve given the credit profile you have. So, should we expect kind of a minimal provision that would just cover whatever charge-offs that you have?
Yeah, Damon, I think that's right. I mean, going forward, our provision is going to be driven by loan growth and really the macroeconomic factors.
And so do you feel like the mid-120s is probably a good run rate for you guys over time, absent any type of, obviously, macro deterioration?
Yeah. I mean, you know, when I look at our pooled reserve, we're north of one, you know, 110 to 120, I think, is a fair range. of course, depending on what happens in the economy.
Okay, okay, great. And then I guess lastly on expenses, I think, Al, did you say two to three, or sorry, low single-digit growth for the full year off of last year? All right, great. That's all that I had.
Operator
Thank you. And we have a follow-up question from the line of Brandon Noslow of Horde Group. Please go ahead.
Looking at – just looking at the mortgage banking segment, like if I look at originations and sales, like those were both seasonally down, you know, quite a bit, but the revenue was actually up sequentially. And I think you mentioned kind of MSR, fair value benefits. Can you just size up, you know, how much of a benefit the MSR was this quarter?
Let me get that number for you. The other benefit, too, was that in our pipelines in the fourth quarter, we did have, you know, the rate cuts affecting our pipelines. So, we actually had some mortgages in there that came in at higher rates. A lot of us get bakery gain on sale. So, I'd say that was a bigger driver for mortgages that quarter. Less impact from the MSR part.
And then one final one for me. I think you folks said in the prep remarks that you continue to make progress on that one large nonaccrual loan that is still kind of working through. resolution. Can you give off a little bit more color on kind of where you are on that credit, how you reserved, and kind of where ultimate loss content on that loan might end up?
Sure, Brendan. This is Karin. We do continue to make progress currently negotiating a sale on that deal. We are getting more clarity around value as we go through that process, And so, we actually decreased our reserve from about 17% in Q1 to about 8% in Q2.
All right. Thank you for taking the follow-ups. I appreciate it.
Yep. And, Brandon, just to close the loop on the fair value mark, we're just looking at right now a couple hundred thousand for fair value on the MSR mark.
Operator
Thank you. I will now be turning the call back over to Katie for closing remarks. This will conclude our Q&A session.
Speaker 4
All right. Well, thank you, everyone. Appreciate you all joining today. I just want to take this opportunity to thank our team, first and foremost. The results that we discussed today and that you heard about today reflect our culture, our talent, and our discipline across Alaris. And we have built a stronger organization in a relatively short period of time. Very proud of how our teams continue to execute towards our long-term objectives. Over the past few years, I think the consistency of our fundamentals is evident. This quarter represents another pearl on the string. Discipline execution of our strategy that we've been articulating. Continued progress across earnings power, margin, funding, capital, and credit quality. I do want to mention that our overall credit quality has improved meaningfully. Trends in asset quality, criticized loans, and non-performing assets continues to move in the right direction. And we do remain confident that the net charge also normalized towards our long term historical averages, which compare favorably to the industry. From a balance sheet and capital allocation standpoint, we are growing where we want to grow with solid momentum in the verticals that we've invested in. We remain focused on consistent execution, and we feel great about the foundation we are continuing to build from, the momentum of the company, and we are grateful for all of the collaboration and hard work of our talented team members. Thank you again for your time today and for your continued interest in Alaris.
Operator
Thank you. The conference is now concluded. it.
Operator
Thank you for attending today's presentation. You may now all disconnect.