Operator
Good morning, and welcome to the Our House First Quarter 2026 Earnings Conference Call. Please note that this call is being recorded and that the reproduction of any part of this call is not permitted without written authorization from the company. I will now turn the call over to your host, Tara Atwood, Sega Vice President of Investor Relations. Please go ahead.
Good morning, and thank you for joining us for the Our House First Quarter 2026 Earnings Call. Joining me on today's call for prepared remarks are John Reed, our founder, chairman, and chief executive officer, and Michael Lee, our chief financial officer. Jennifer Porter, our chief marketing and e-commerce officer, will join us for the Q&A portion of the call. During Q&A, we kindly ask that you limit yourself to one question only. This will allow us to get to as many callers as possible within our one-hour window. You are welcome to re-queue for additional questions if time permits. We issued our earnings press release in Form 10-Q for the quarter ended March 31, 2026, before the market opened today. Those documents are available in our investor relations website at ir.ourhouse.com. A replay of the call will be available on our website within 24 hours. I would like to remind everyone that our remarks today concerning future expectations, events, objectives, strategies, targets, trends, or results constitute forward-looking statements. Actual results or events may differ materially due to a number of risks and uncertainties. For a summary of these risk factors and additional information, please refer to this morning's press release in the cautionary statements and risk factors described in our most recent annual report on Form 10-K and subsequent 10-Qs, as such factors may be updated from time to time in our filings with the SEC. The forward-looking statements are made as of today's date and accept as may be required by law, the company undertakes no obligation to update or revise new statements. We will also refer to certain non-GAAP financial measures, and this morning's press release includes the relevant non-GAAP reconciliations. Now I will turn the call over to John.
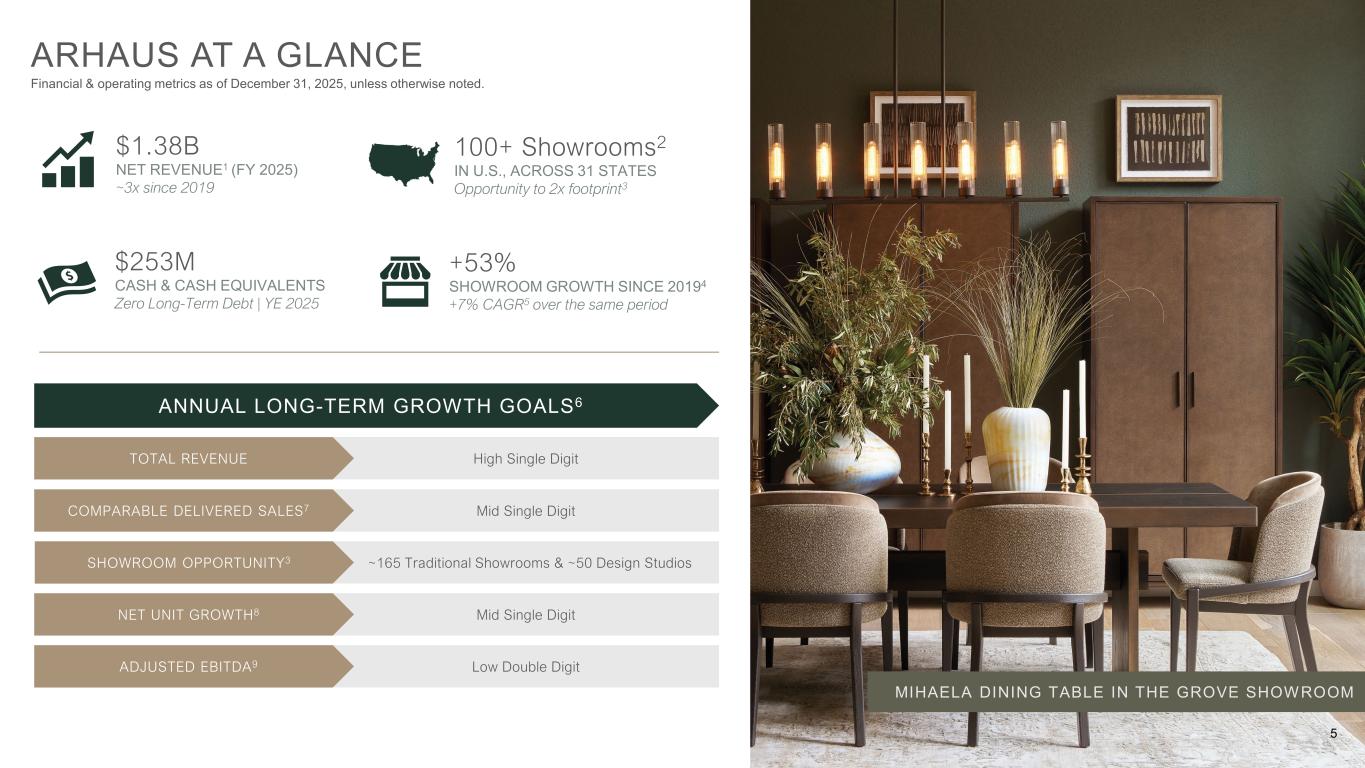
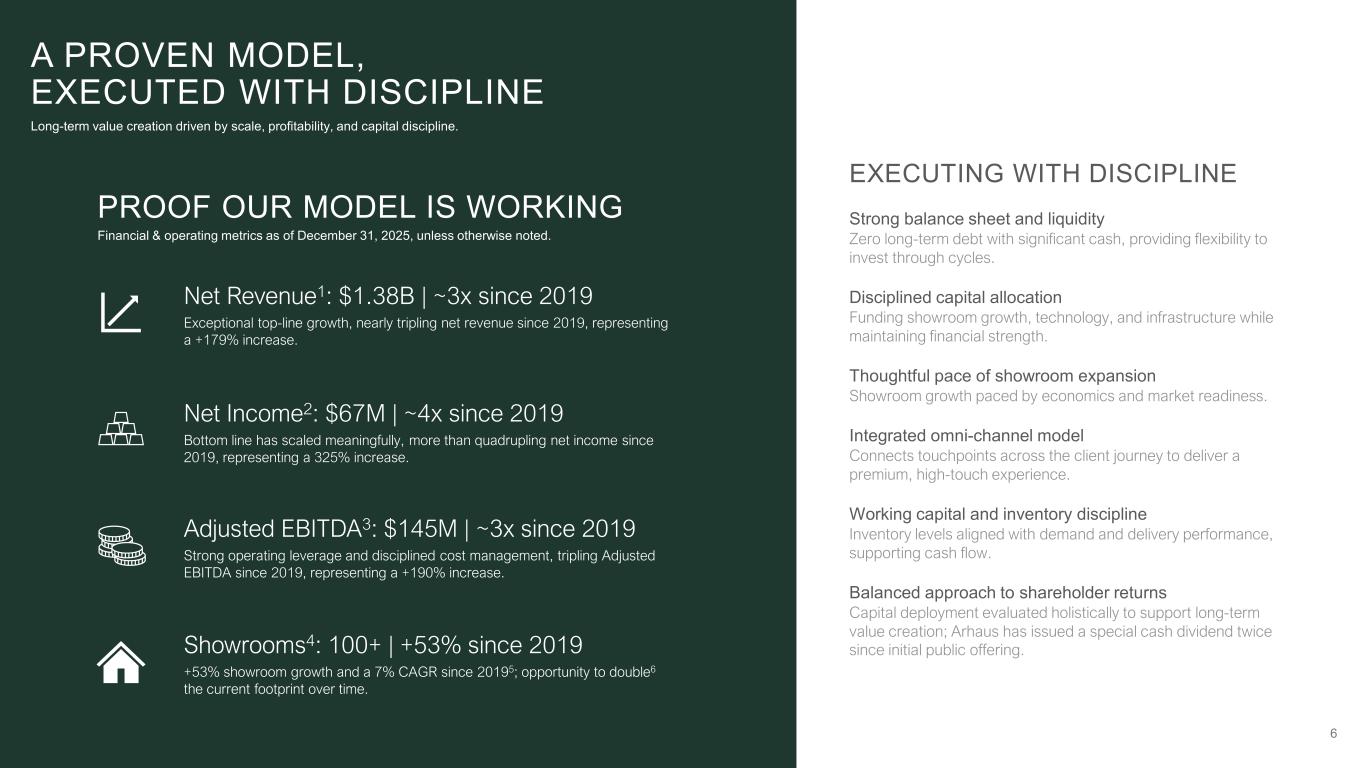
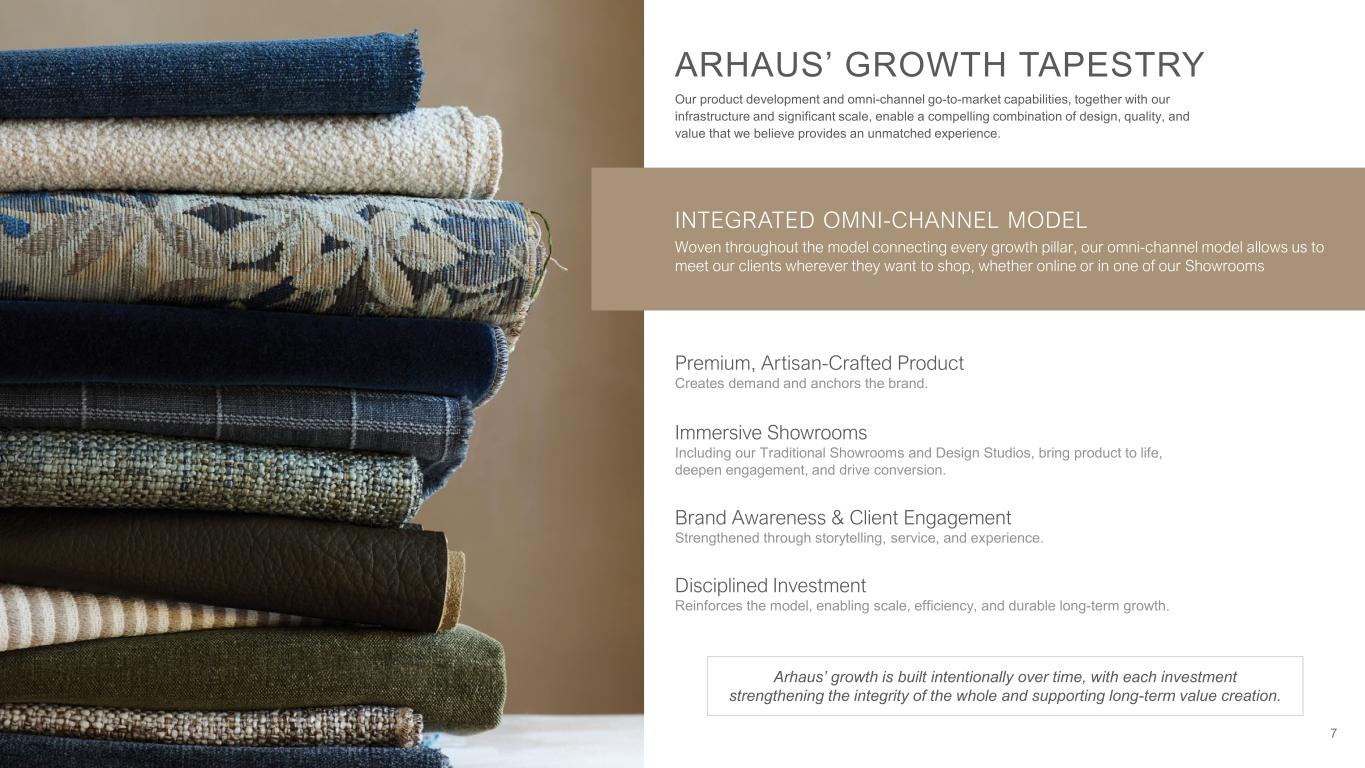
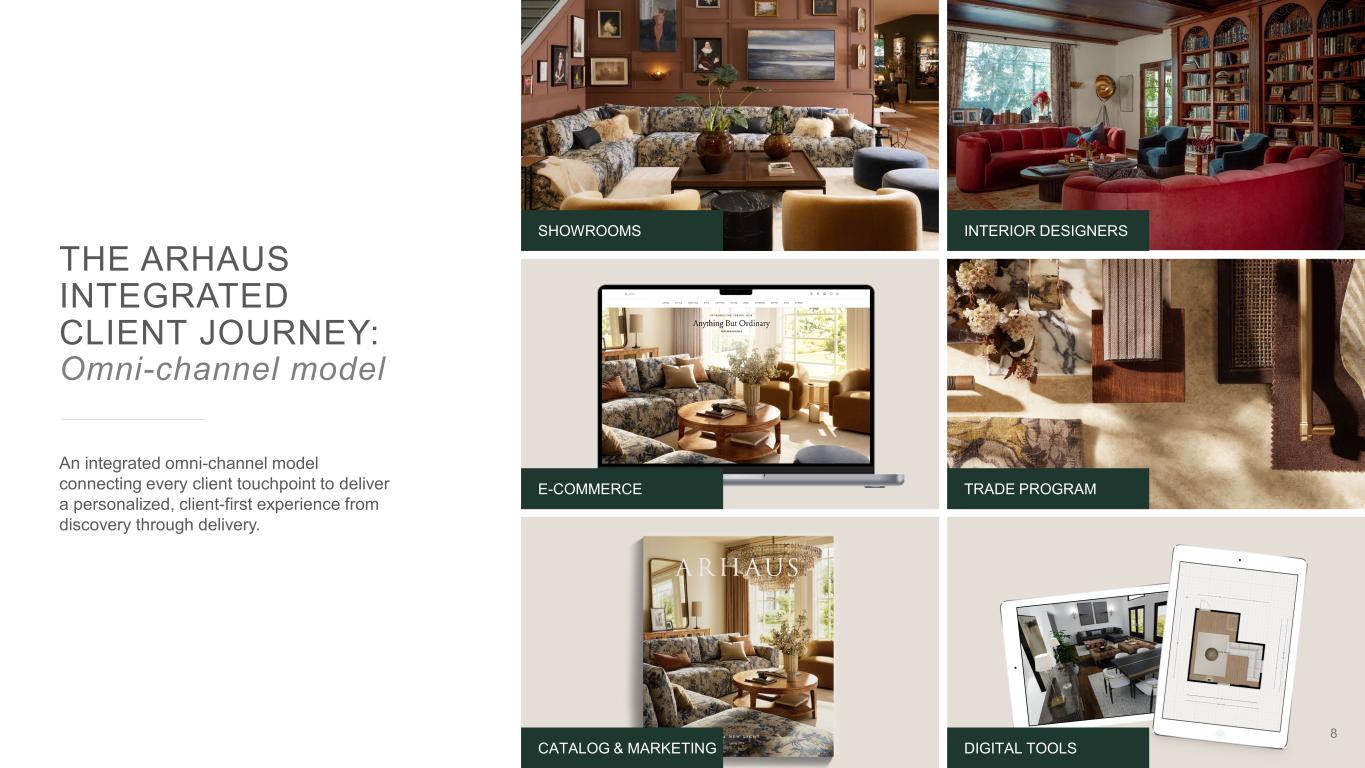
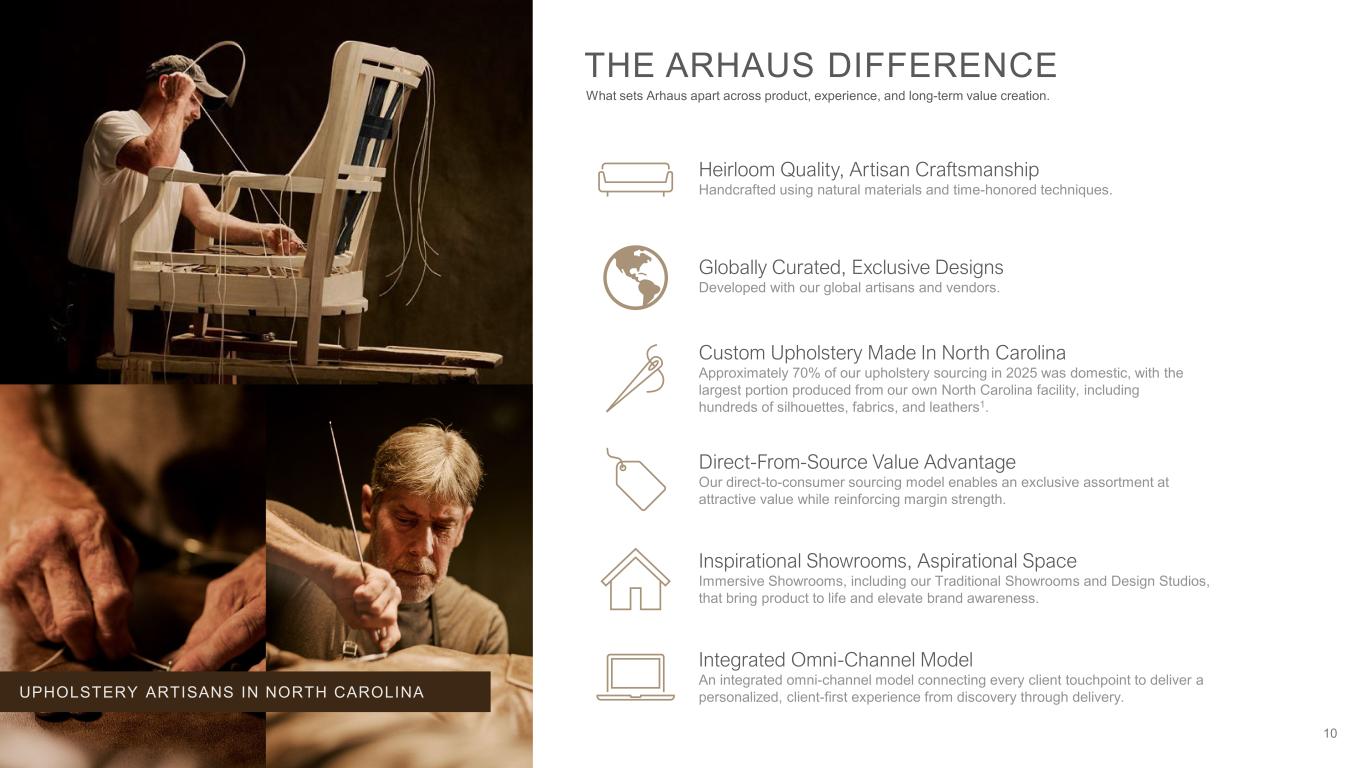
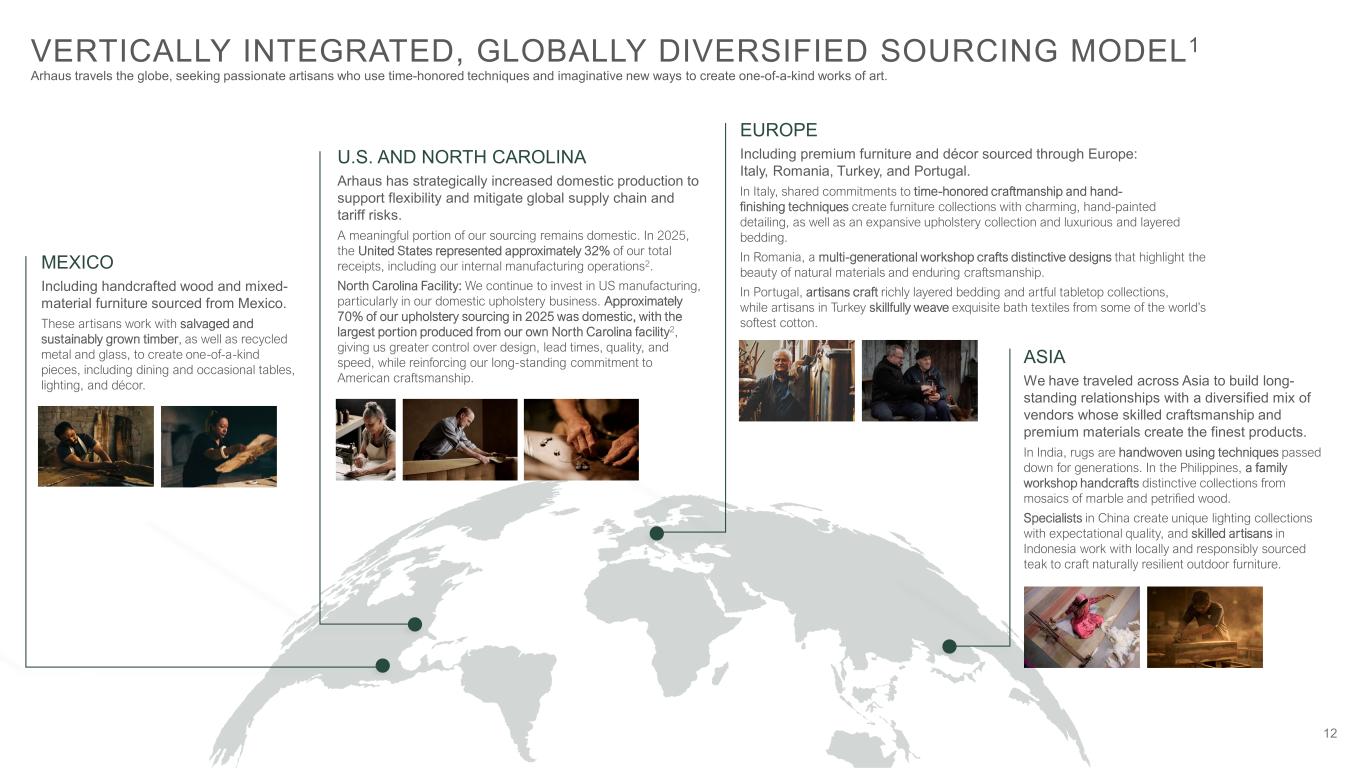
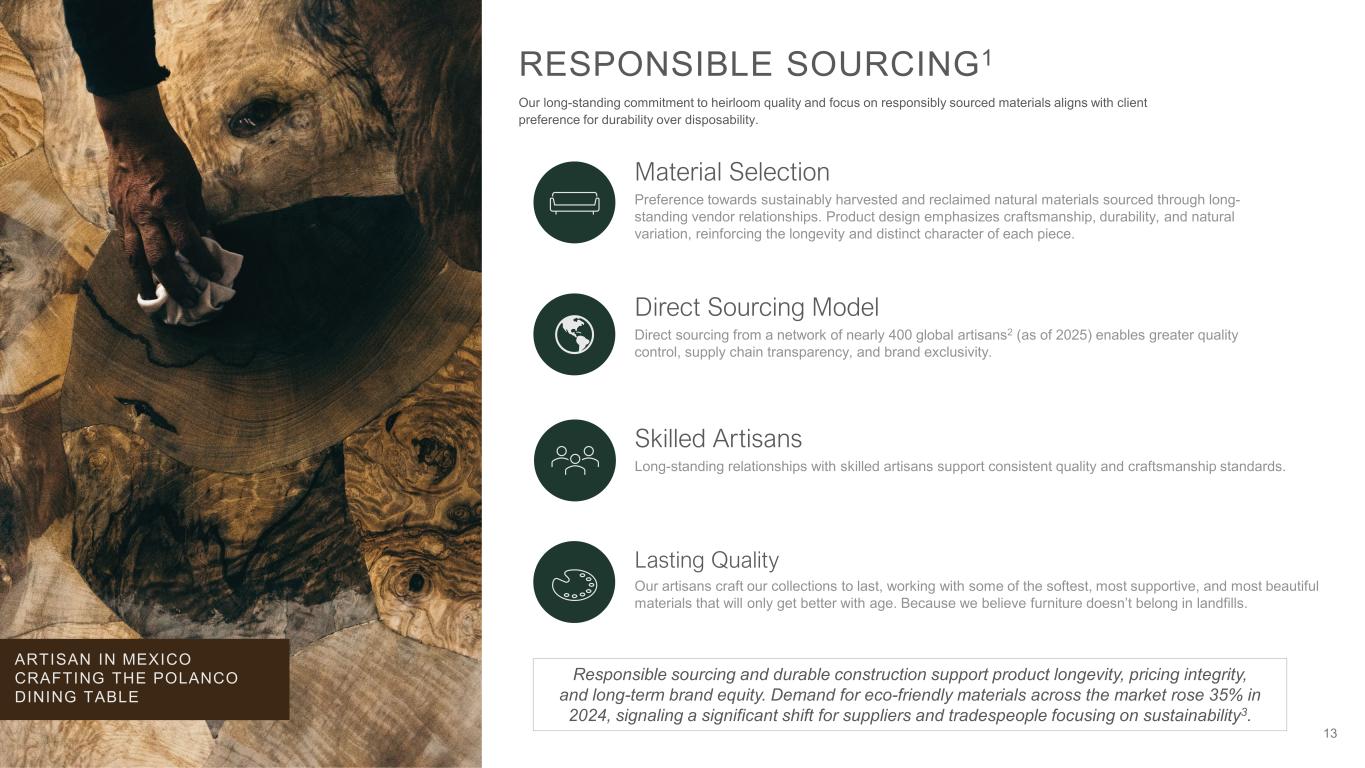
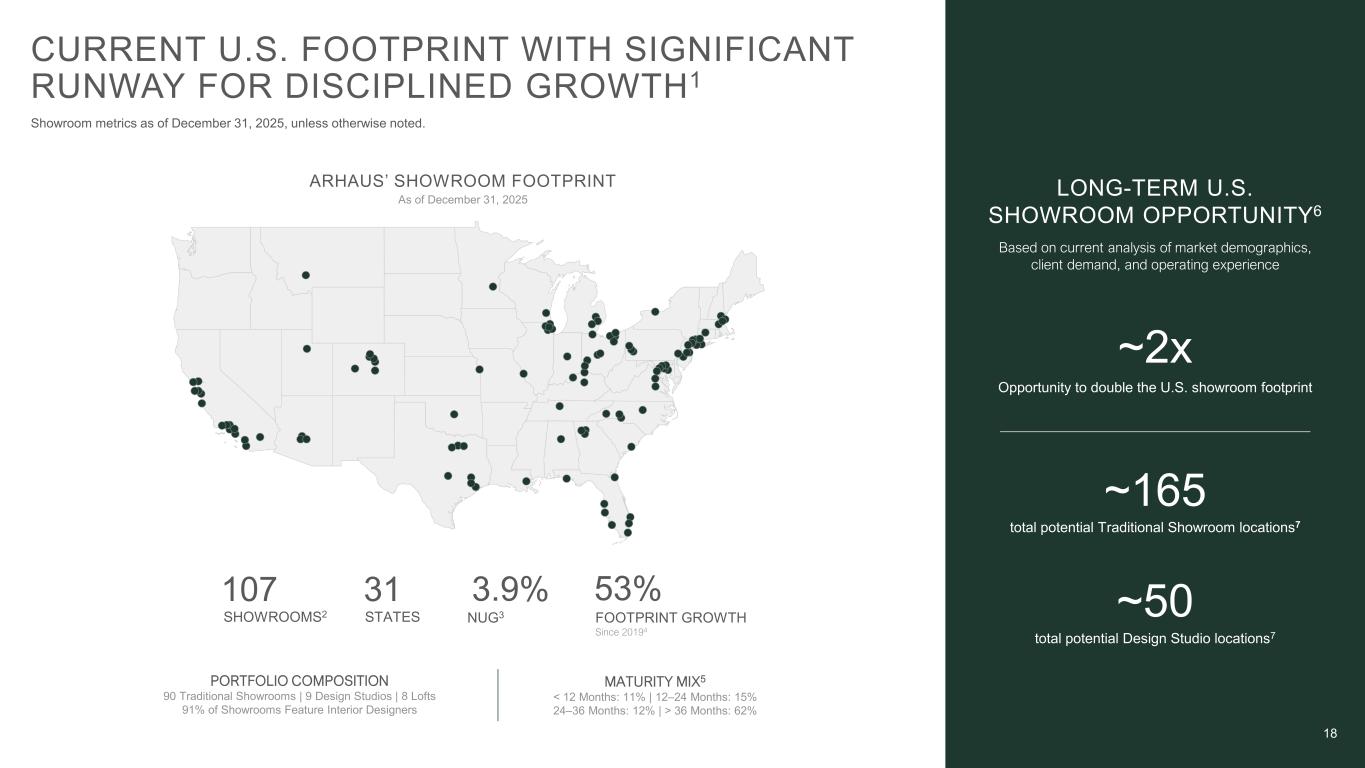
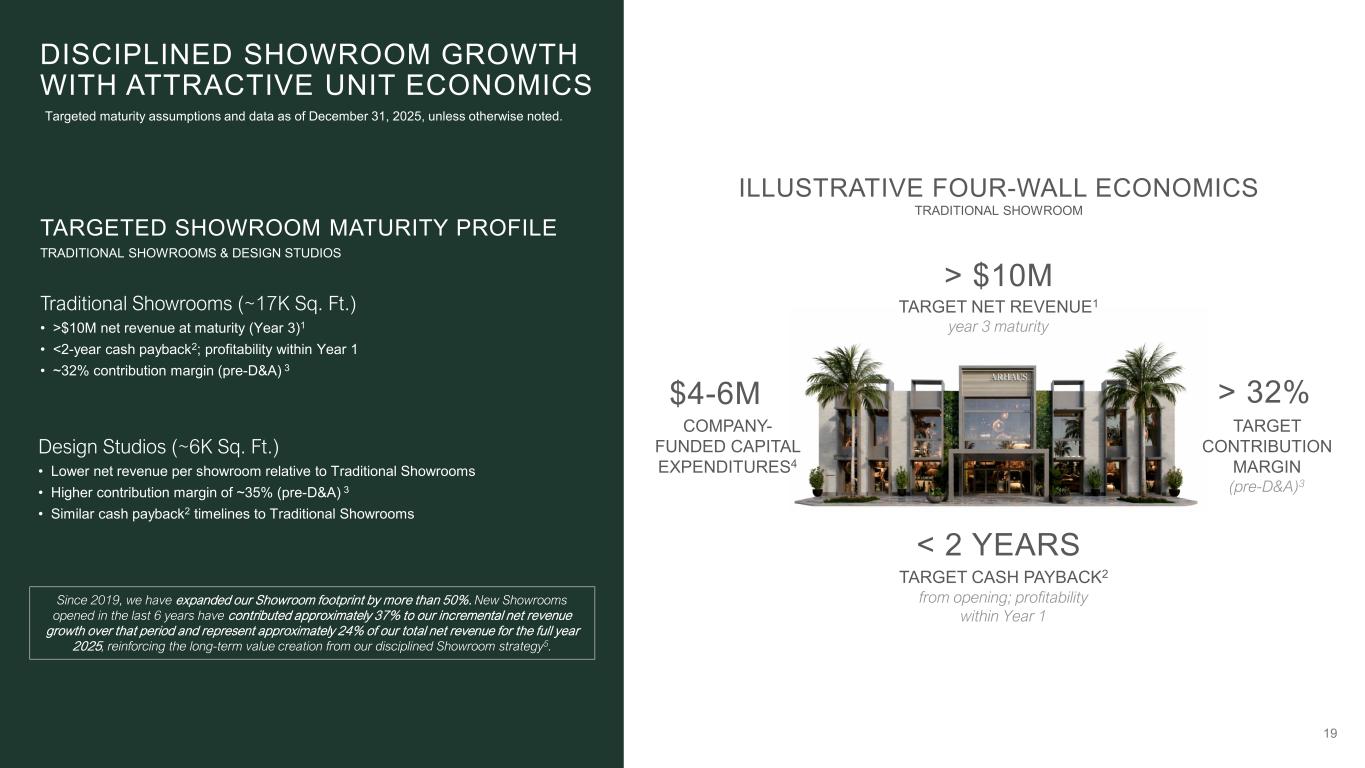
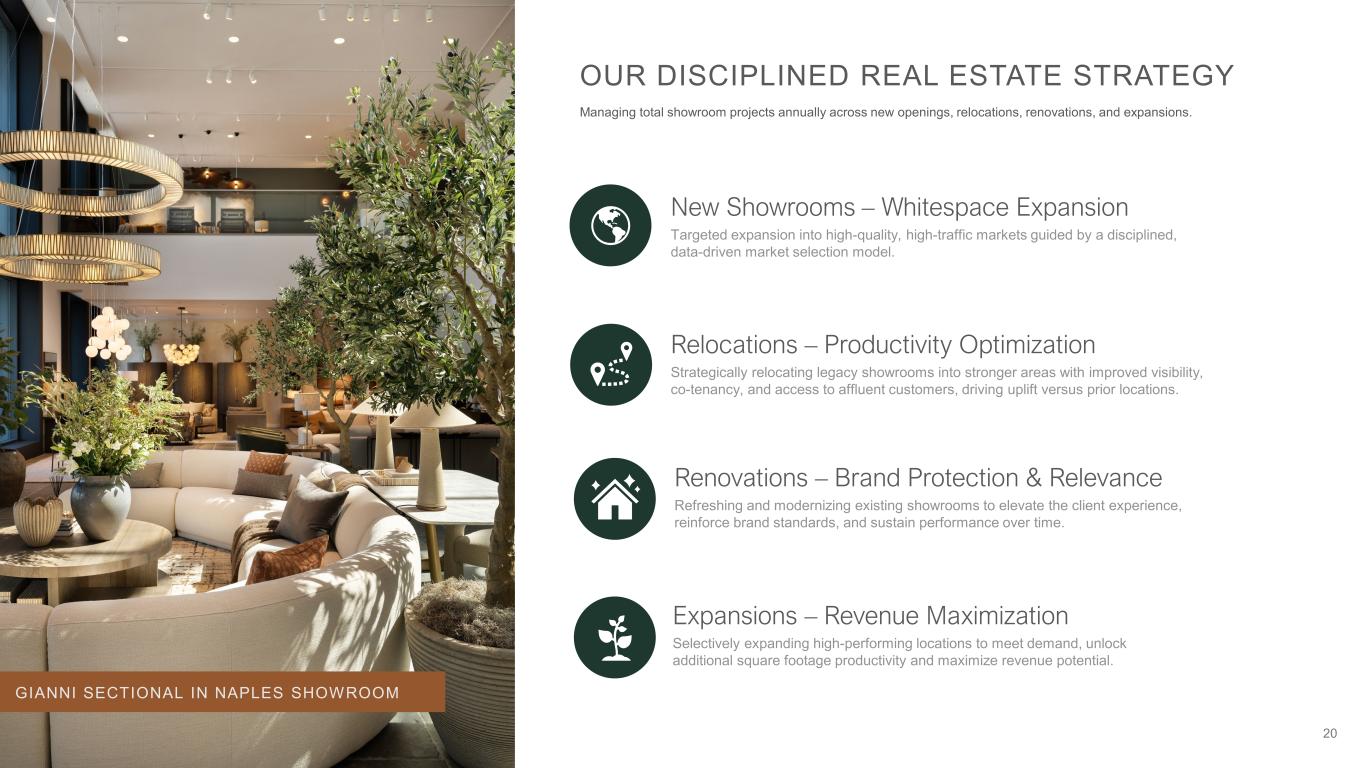
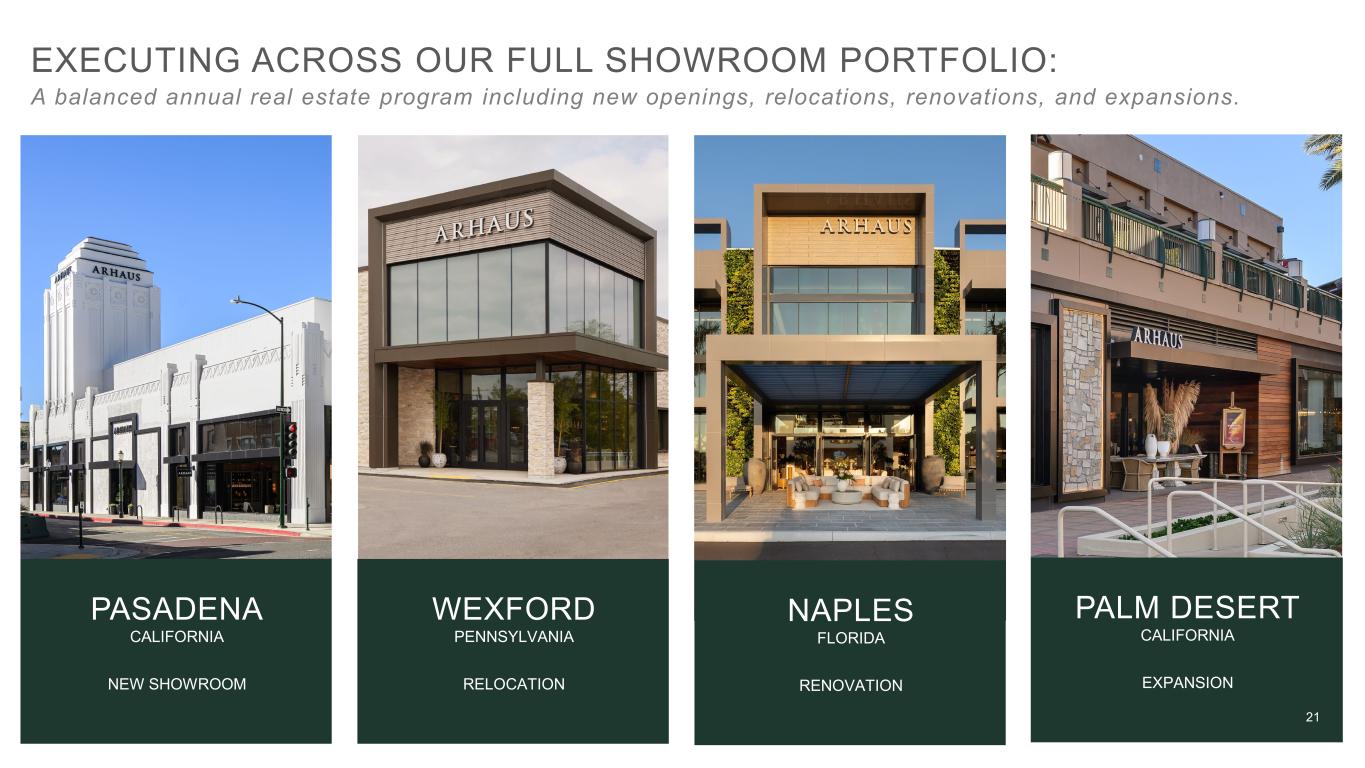
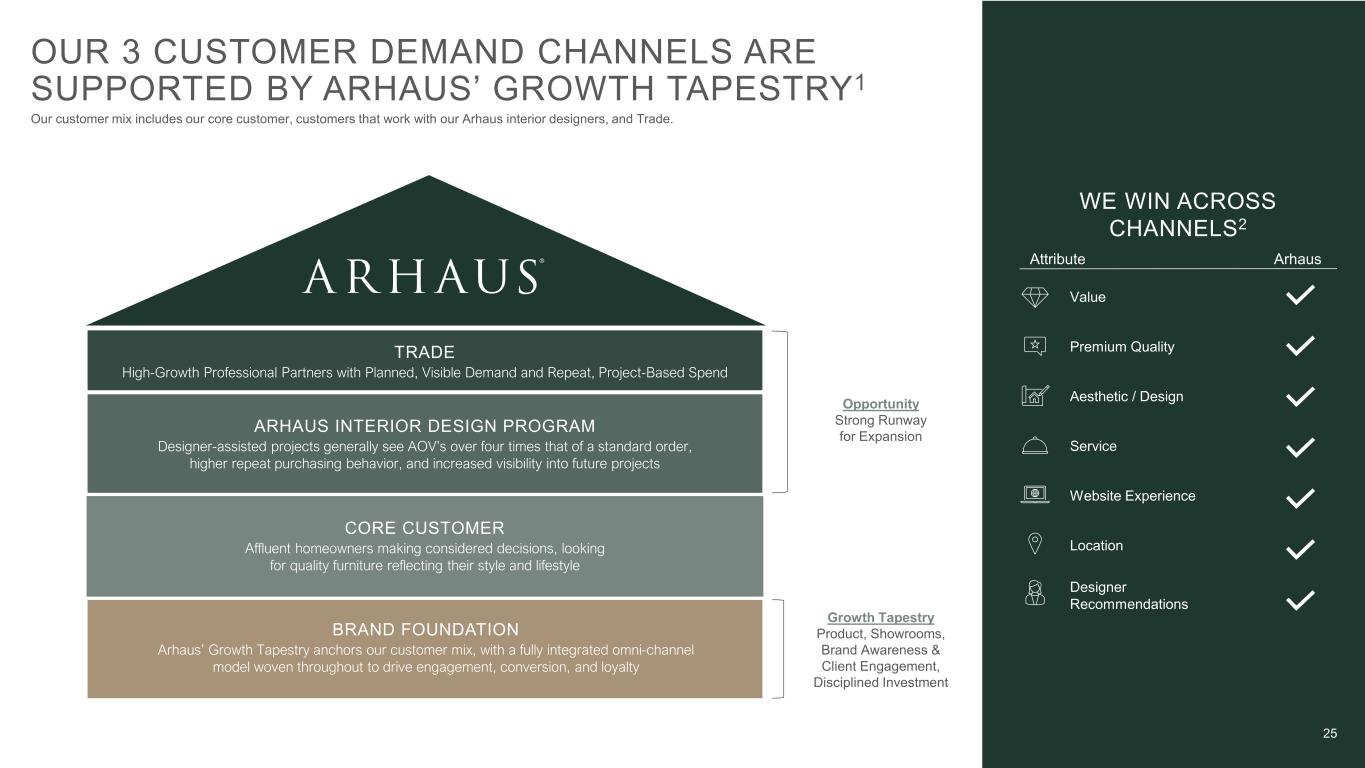
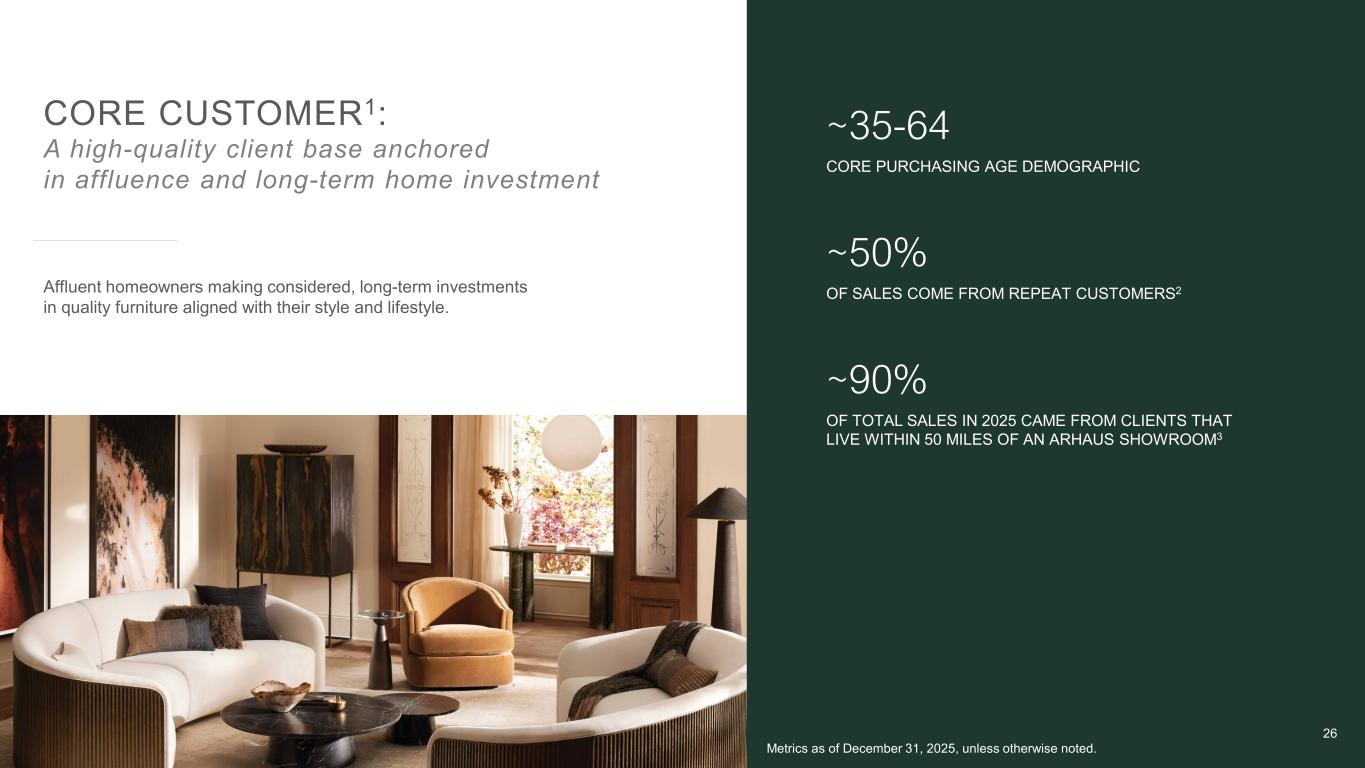
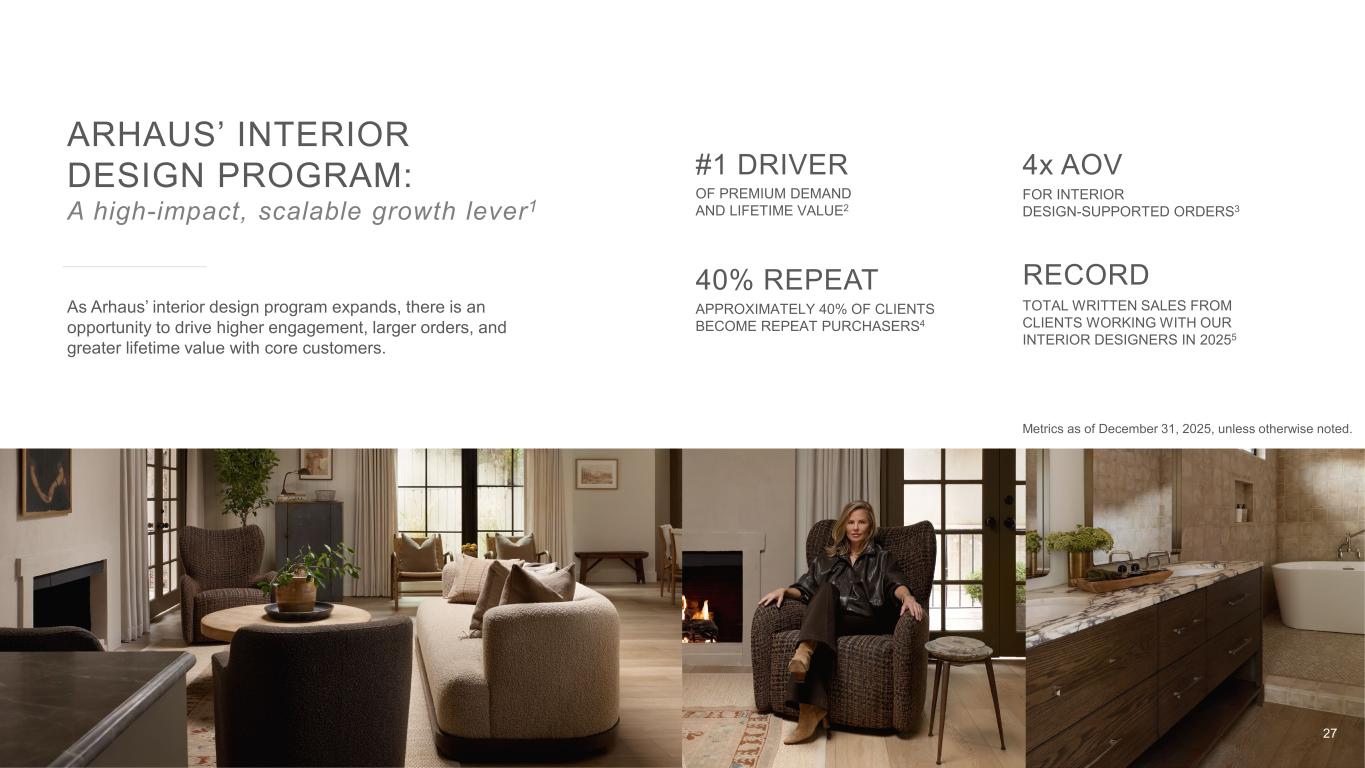
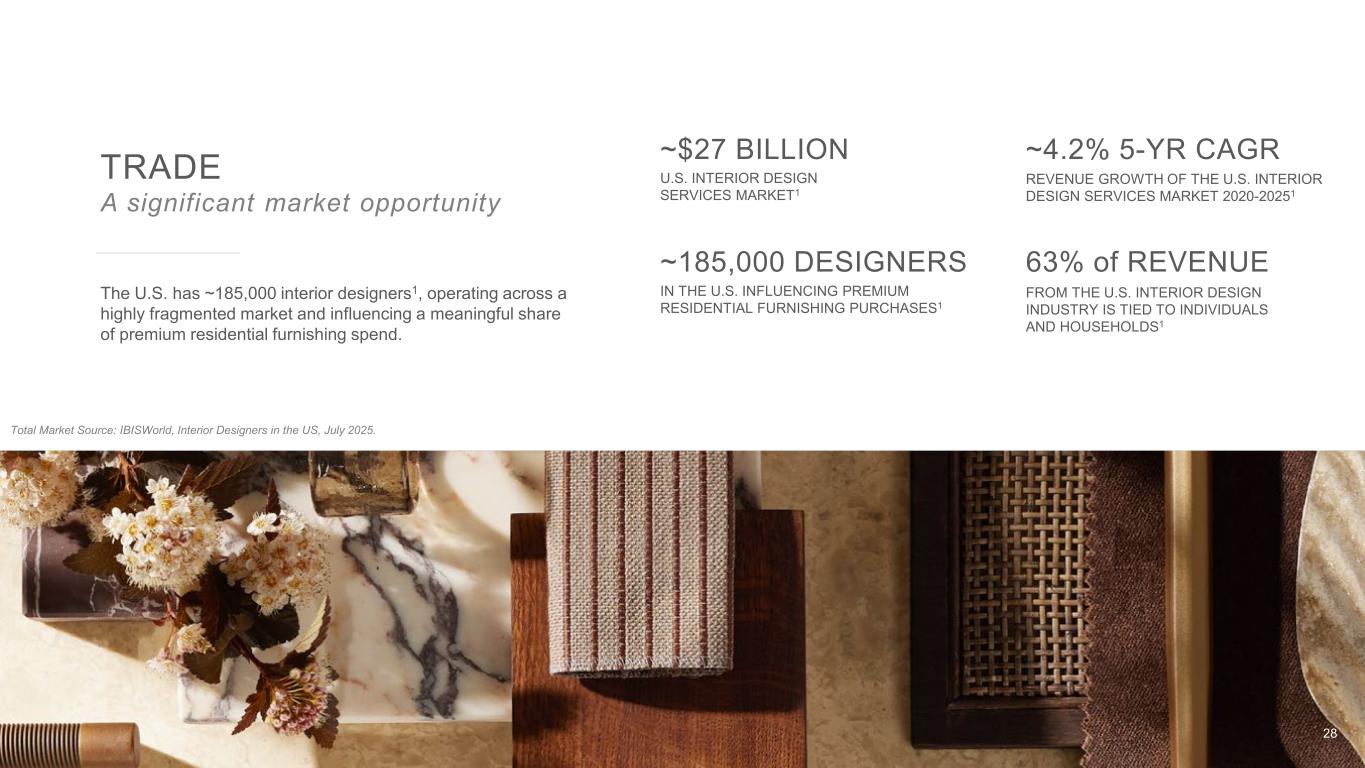
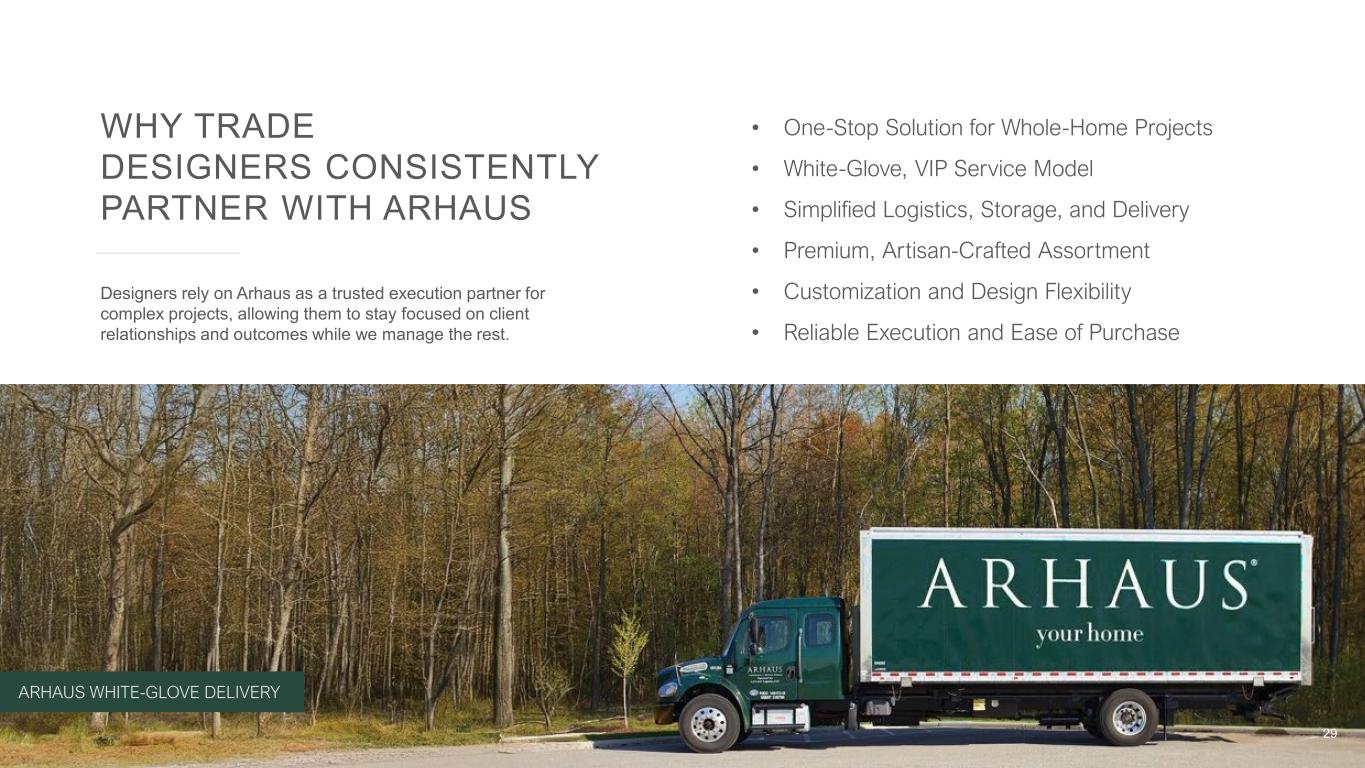
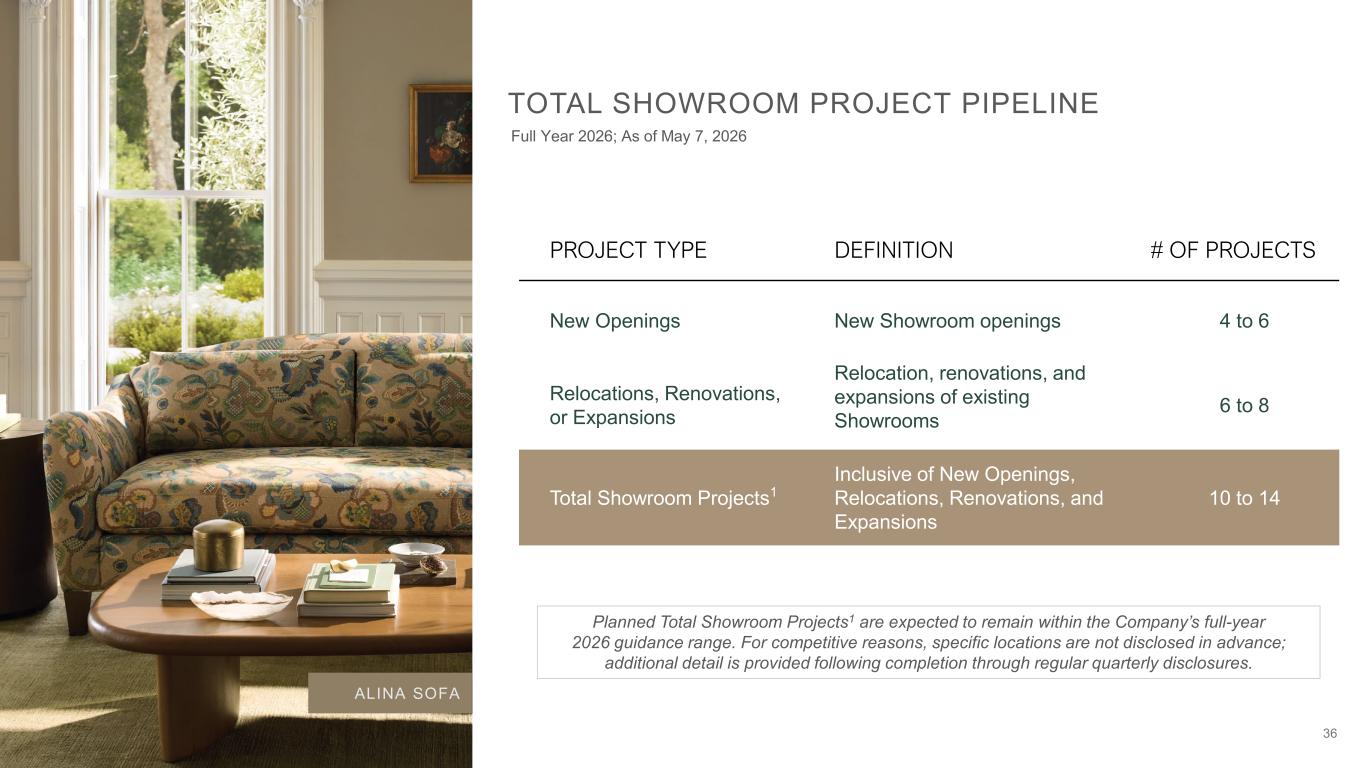
Thanks, Tara. Good morning, everyone, and thank you for joining us. I want to start by discussing our first quarter performance, how we view the current environment, and why we remain confident in the long-term opportunity ahead of us. We have been in business for over 40 years, and when you have operated through as many cycles as we have, you learn that quarter-to-quarter fluctuations matter, but they do not define a business. We are building our house for the long term. The first quarter marked the highest first quarter net revenue in our history. This reflects the strength of our operating model, the resilience of our client base, and the discipline execution across all our teams. We delivered this performance despite several temporary headwinds. First, more than half of our showrooms experienced weather-related disruptions at some point in the quarter, including temporarily closures in several key markets. We also saw a delay in our spring catalog release, which shifted some demand timing. In addition, just 48 hours after our previous earnings call, the conflict in Iran began, creating a broader macro uncertainty and contributing to more cautious consumer sentiment. That caution was most visible in our comparable written sales, which decreased a little over 5% during the quarter. We believe that our pressure was primarily driven by those temporary factors, weather disruption, delayed catalog timing, and, of course, the broader macro uncertainty. Importantly, we review this as short-term pressures, not structural changes. When we look at the second half of March and trends continuing through April and into May, we saw meaningful improvement and stronger momentum. That gives us confidence as we move through the second quarter. As we have for four decades, we navigate cycles by staying focused on what we can control. Our long-term strategy remains unchanged, and we continue to execute with discipline across the key drivers of our business. Short-term volatility can create noise, but it does not change who we are, the strength of our brand, or the opportunity ahead of us. Our future is incredibly bright. We believe we are exceptionally well positioned with our product, our design leadership, and our ability to stay ahead of where the customer is going. We continue to deliver differentiated collections that set us apart and strengthen our competitive position. Let me walk you through five key growth drivers. First, we remain focused on product innovation, which is the foundation of our brand and one of our strongest competitive advantages. We continue to invest through cycles in livable luxury, heirloom quality, and artisan crafted pieces that are built to last for generations. Our assortment and quality is exclusive to our house and cannot be purchased or replicated elsewhere, reinforcing the uniqueness of our brand and the emotional connection our clients have with our brands. Our aesthetic breadth spans traditional, transitional, and modern designs, with a level of customization that is meaningfully differentiated for us. A key competitive advantage is our custom upholstery, with the majority of our upholstery sourced domestically. This gives us greater control over quality, cost, lead times, and the client experience. We believe we are in one of the strongest periods of product innovation in our history, with 2026 featuring some of our most expressive designs to date. We are seeing a shift from neutral-only palettes towards richer colors, patterns, architectural silhouettes, and layered textures. We have been ahead of this trend, a traditional evolution, refining classic silhouettes for modern living with pieces that feel collected over time, rooted in craftsmanship and layered in character. You see it in our tailoring trim, fringe, distinctive textiles, materials that create a warmth and individuality in your home. At the same time, we continue to expand our customization capabilities. with hundreds of silhouettes and more than 700 fabrics and leathers, allowing clients and our designers to create something truly personal and uniquely special. Our vertically integrated sourcing model further strengthens our quality standards. We work directly with artisans across North America, Europe, and South Asia, many of which we have partnered with for decades, using time-honored craftsmanship and responsible sourcing practices. Since our founding more than 40 years ago, we believed furniture should be responsibly sourced, lovingly made, and built to last. And because of our unique model, we are extremely competitive in our pricing, in most cases lower retails and better quality than many of our competition. We remain committed to investing in product innovation during periods of uncertainty because we have consistently seen that strong product cycle positions us to capture sales when consumer confidence improves. Second, we remain committed to our showroom growth strategy. These are longer-term investments with attractive returns, and we continue to see meaningful white space opportunities. Since 2019 through 2025, we have grown our showroom footprint for more than 50%, and showrooms open during this period represented 37% of our net revenue growth, reinforcing the long-term value creation of our disciplined approach. As of today, we operate 108 showrooms, including our new traditional showroom in Ashburn, Virginia, which opened just last month. We were particularly excited about this location in Ashburn, one of the most affluent areas in the country. It is a premium lifestyle destination that aligns exceptionally well with our client base and our showroom growth strategy. And just this week, we completed the expansion of our Park Meadows showroom in Lone Tree, Colorado, an important market for us. Park Meadows is a premium luxury retail destination supported by affluent demographics and premium cotendency. Expanding this showroom reflects strong local engagement, showroom productivity, and an opportunity to deepen client relationships through greater product presentations, design services, and more expansive showroom experience. For 2026, we continue to expect to complete approximately 10 to 14 showroom projects, including four to six new openings, six to eight relocation, renovations, or expansions. We remain confident in our long-term showroom strategy because proximity matters. Our showrooms are often the front door to the brand, driving client engagement, conversion, and long-term relationships. Third, we remain committed to the investments in our infrastructure needed to grow our business. We are making meaningful progress across initiatives focused on modernizing our distribution network and technology infrastructure, which are foundational to our long-term growth, improved operational efficiencies, and an enhanced client experience. At our core, we believe that investing with discipline, even during periods of uncertainty, will help us emerge with stronger, more durable, competitive advantages. I'll let Mike dive deeper into the progress of our strategic investments shortly. Fourth, we remain focused on our client. This includes delivering an exceptional client experience across three primary channels, our core customers, our clients that are engaged with our house interior designers, and our trade partners. These relationships are central to how we build loyalty, deepen engagement, and capture market share, particularly during periods of macroeconomic uncertainty. Our interior designers continue to be one of the most powerful drivers of demand across the brand. Designer-supported projects generate meaningful of higher order values, drive stronger repeat engagement, and provide greater visibility into our future projects. In the first quarter, our house and charity designers represented a significant percent of our total written sales, and we expect this to continue to grow. We are seeing similar momentum with the trade, which represents another attractive long-term demand channel for us. We recently launched our newly redesigned Our House Trade Program, which was built in collaboration with the feedback from our trade community and designed to strengthen the relationship with design professionals, builders, and developers. Additionally, the program provides personalized order support, access to our exclusive products, and a customized trade dashboard that empowers professionals to better serve their clients, including design tools for 3D and 2D room planning. The U.S. interior design market is approximately $27 billion. We see significant long-term opportunities to grow our reach within this channel. Lastly, we remain focused on building out our integrated omni-channel model. Our omni-channel model allows us to meet our clients wherever they choose to engage, whether online or in one of our showrooms. Our showrooms, we curate immersive, traditionally inspired spaces that feel layered, warm, and aspirational. Clients don't simply see a piece of furniture. They feel transported into a home that reflects their own. Digitally, we extend the same emotional experience through enhanced storytelling, ensuring a seamless connection across e-commerce platforms and showroom experience. Forty years in, we have navigated recessions, market disruptions, supply chain shocks, and a pandemic. The long-term strategy for our house remains intact, and we are focused on the discipline execution across five key drivers of our business that I had just shared. At the same time, we are making strategic adjustments to thoughtfully navigate the near-term environment. These include being more deliberate with the pace of our investments, taking a more measured approach to headcount growth, and in the near term, implementing new promotions to help accelerate the client journey from aspirational to conversion, and increasing our marketing efforts to further and increase engagement and conversion, while keeping an eye on cost to protect margins. In closing, in closing, our product is exceptional. Our client continues to invest in their home, and our showrooms are very productive. Our balance sheet remains a competitive advantage. We are debt-free and operating from a position of strength. This gives us flexibility to invest through the cycle while maintaining a disciplined approach to allocate capital. investing in the business, returning value to shareholders, and maintaining financial flexibility. Now, I'll turn it over to Mike.
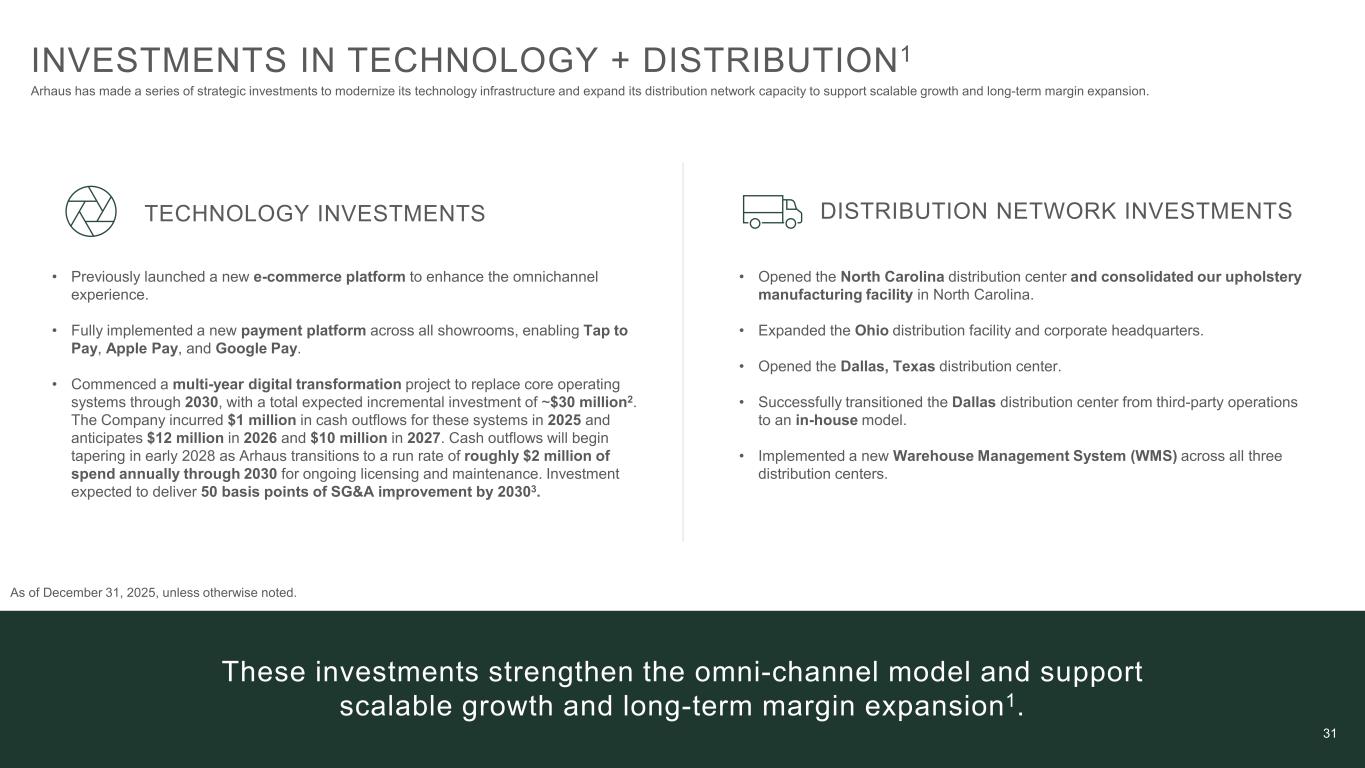
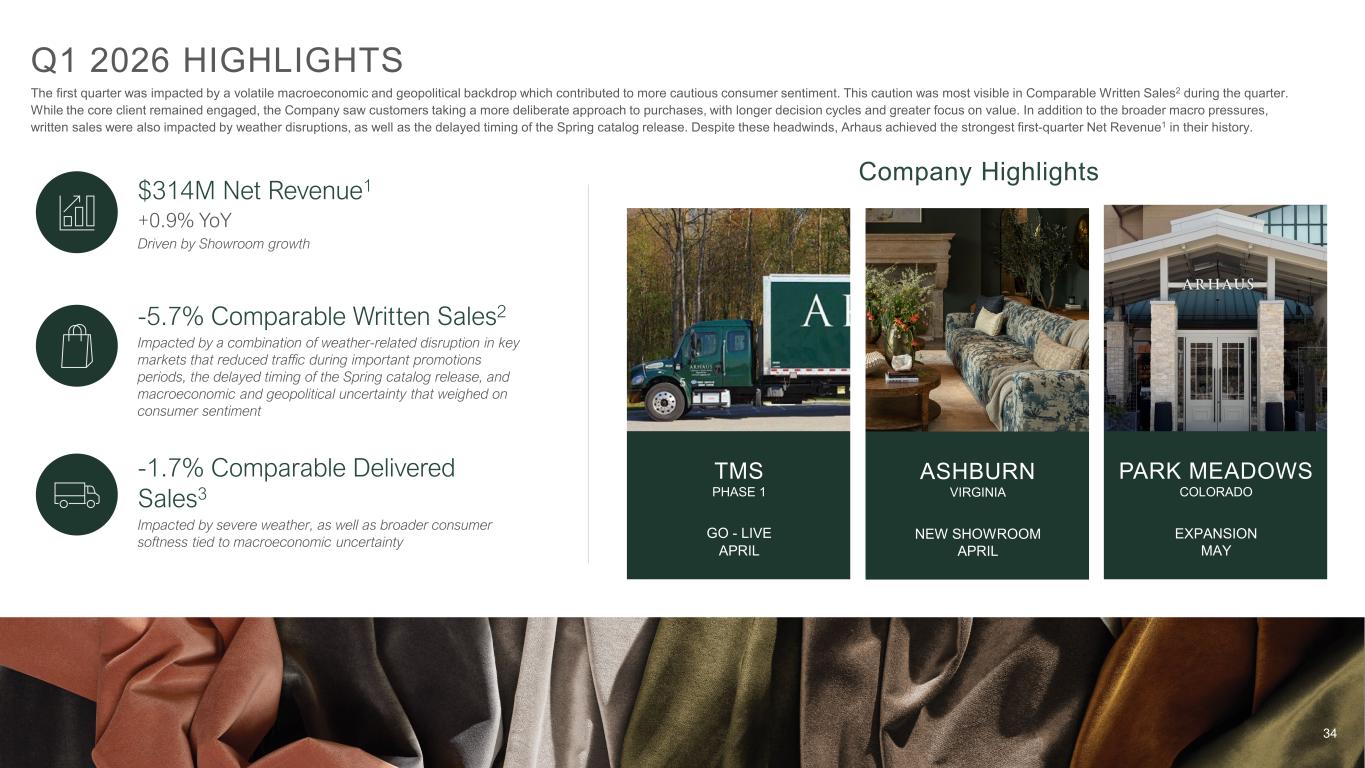
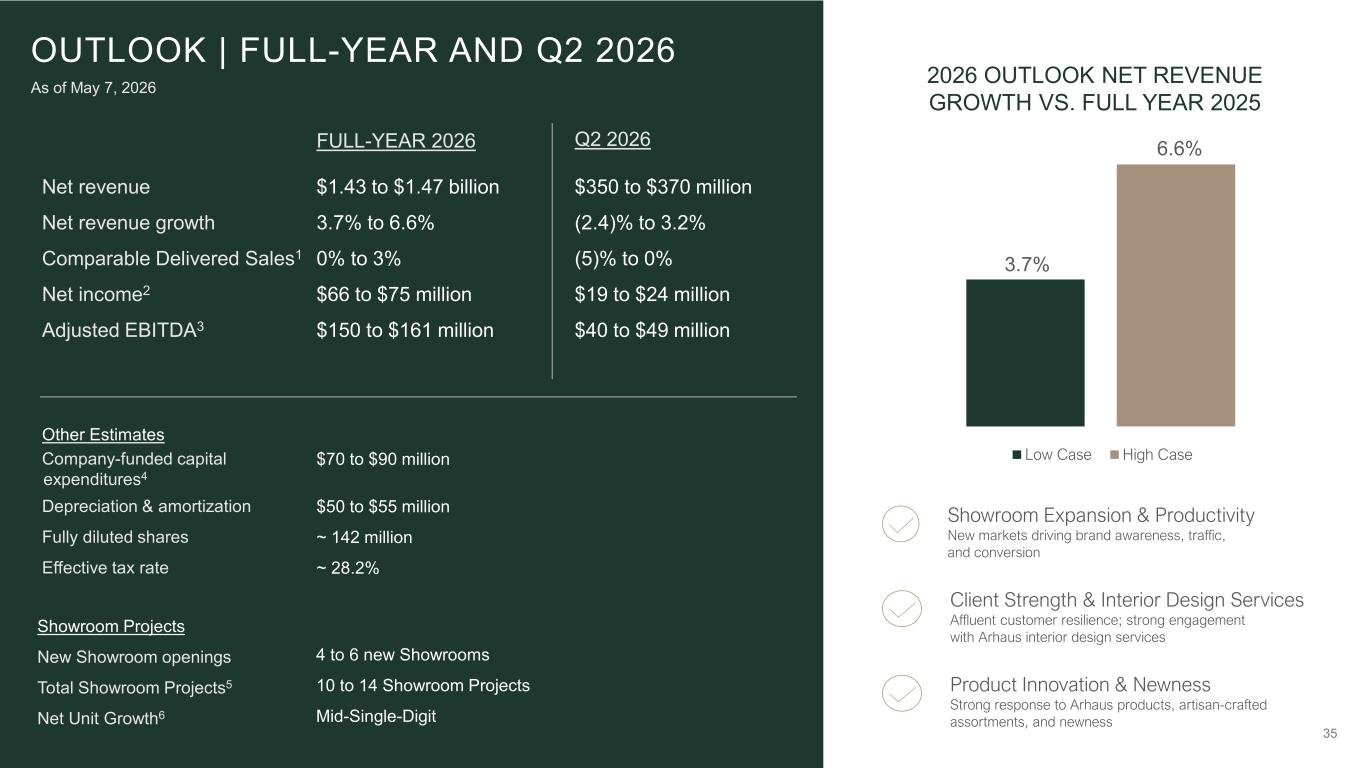
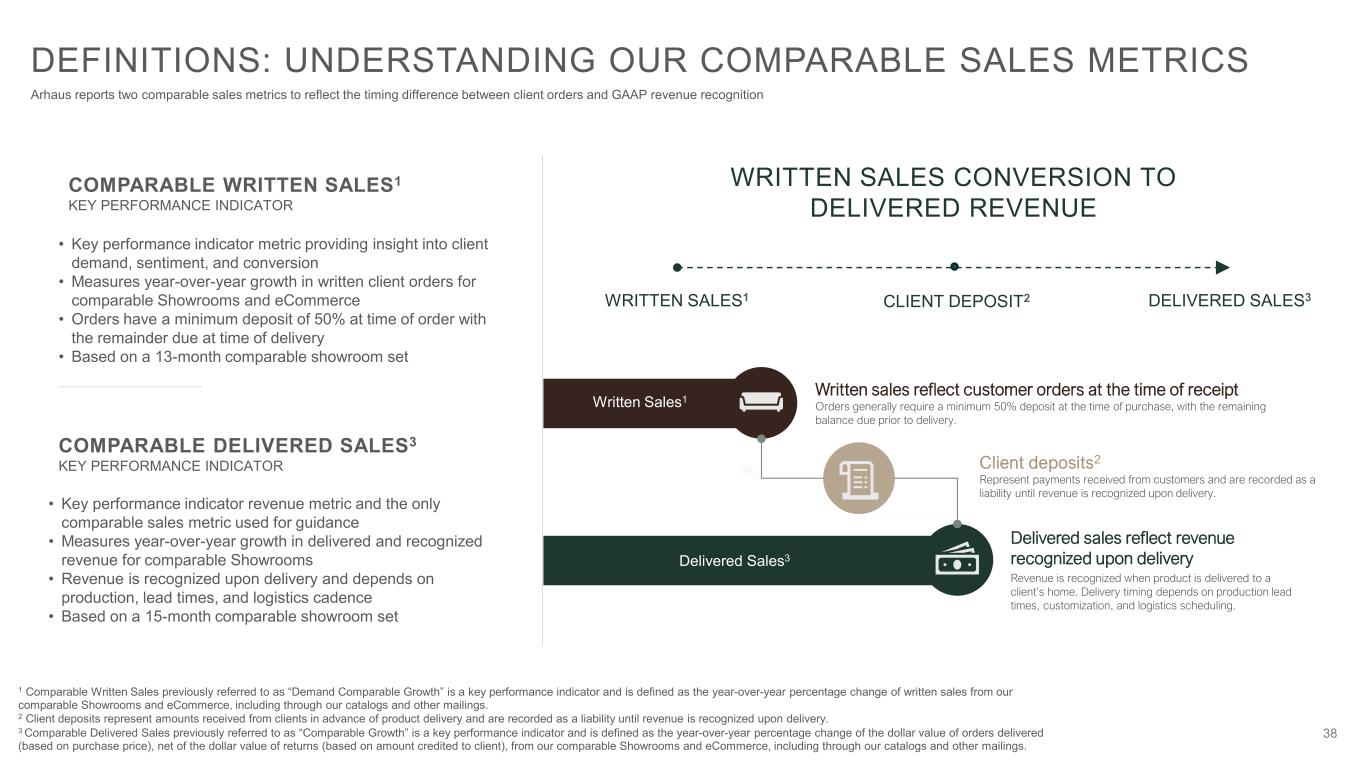
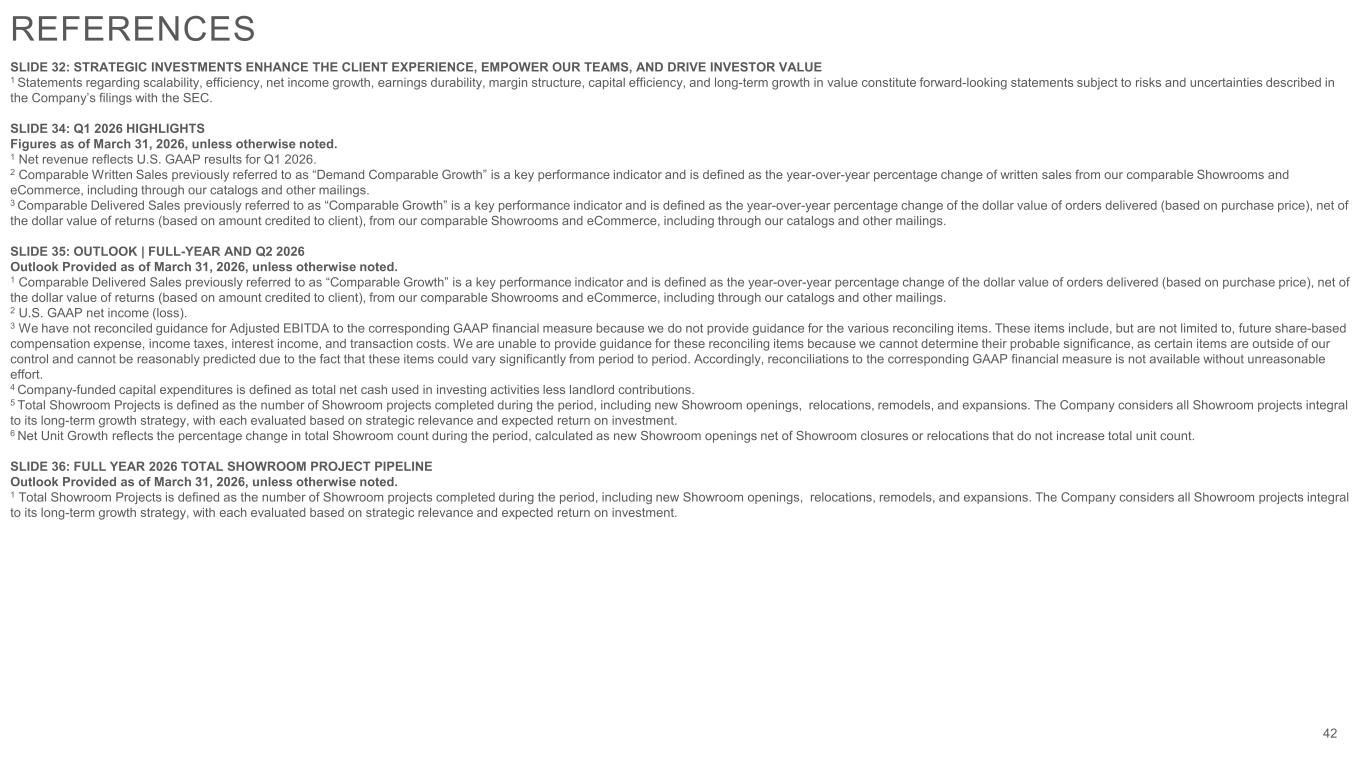
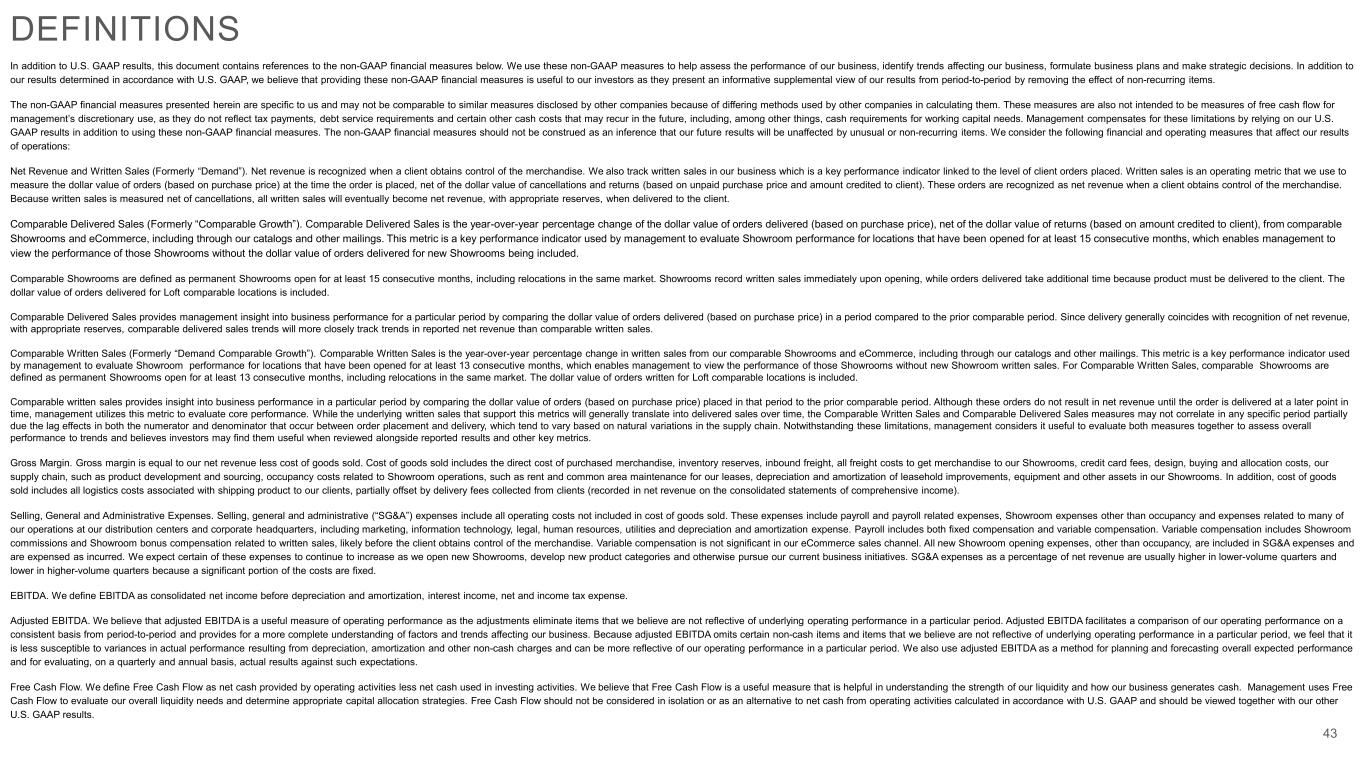
All right. Thanks, John, and good morning, everyone. As I reflect on my first year in this role, I'm proud of what we have accomplished across the business and the discipline with which our teams have continued to execute. Even in a more challenging environment, we remain focused on strengthening our operations, investing in the business, and positioning our house for long-term profitable growth. And that perspective gives me continued confidence in the strength of our model, the resilience of our client base, and our ability to navigate near-term volatility while staying committed to our long-term strategy. Net revenue was $314 million in the first quarter, up 0.9% year-over-year and above the midpoint of our guidance range, making the largest first quarter net revenue in our history. This performance is particularly notable as we lapped a prior year period that did not face the same tariff uncertainty, macro volatility, or geopolitical disruption. And despite these ongoing headwinds, including the recent escalation in global conflict, we continue to deliver net revenue growth through a volatile environment. Gross profit was $114 million, down 1% versus last year, with gross margin decreasing 70 basis points to 36.4%, driven by higher fuel prices of 40 basis points and showroom occupancy costs of 40 basis points. Selling general and administrative expenses increased 1.9 percent to 112 million, driven by a $1.9 million increase primarily related to strategic investments to support and drive the growth of the business, including supply chain and technology improvements and other corporate expenses. As a result, SG&A load increased 40 basis points to 35.7 percent. Net income was $2.2 million and within our guidance, and adjusted EBITDA was $18 million and within our guidance range. Adjusted EBITDA margin decreased 30 basis points year over year. As a reminder, there is a seasonal impact to margins in the first quarter, which carries lower net revenue as a result of less operating leverage. Turning to our comparable metrics, comparable delivered sales decreased 1.7 percent above the midpoint of our guidance range. Performance during the quarter was impacted by severe weather, our delayed catalog, as well as broader consumer softness tied to macroeconomic uncertainty, which weighed on overall delivery volumes. Comparable written sales decreased 5.7 percent, driven by a combination of factors. Weather-related disruption in key markets reduced traffic during important promotional periods, including our semi-annual storewide sale in January. In total, more than half of our showrooms experienced temporary closures at some point during the quarter due to adverse weather conditions. Additionally, the delayed timing of our spring catalog release, as well as macroeconomic and geopolitical uncertainty, including the war in Iran, impacted comparable written sales. While comparable written sales were pressured during the quarter, trends improved meaningfully in the back half of March, where elevated promotional activity drove stronger engagement and improved conversion. That trend continued in April and into May. Turning to our balance sheet and liquidity, we ended the quarter with $177 million in cash and cash equivalents, a decrease of 30% from December 31st, 2025. This primarily reflects the $49 million special cash dividend paid in March. Net merchandise inventory totaled $369 million, up 9% from December 31st, 2025, and the increase reflects higher product costs, including the impact of tariffs, as well as inventory investments, including increased depth in bestsellers, as well as new product introductions, in addition to outdoor assortments ahead of the seasonal ramp. Excluding tariff impact, net merchandise inventory would be up approximately 6% from December 31, 2025. Turning to strategic investments, we continue to make meaningful progress on numerous initiatives to modernize our distribution network and our technology infrastructure. This initiative is aligned with our long-term strategy designed to improve operational efficiency, enhance the client experience, and strengthen our internal controls and support profitability. Simply put, these investments are foundational to supporting our next phase of growth. A recent milestone was a go-live of phase one of our transportation management system in April. This is an important foundational step in modernizing our distribution network and strengthening our transportation capabilities across the business. We are now live with the new TMS system and are nearing the end of our hypercare phase, at which point we will be fully operational. And as with any large-scale implementation, there is continued work underway and our teams remain focused on execution and long-term success. Our TMS is expected to deliver several meaningful benefits over time. First, improved cost efficiencies through better load optimization, route planning, and carrier selection, helping us to reduce transportation expense and improve network productivity. Second, greater operational visibility through real-time tracking and system-driven planning, replacing manual processes and giving us stronger control across the delivery journey. And third, stronger integration and scalability across our broader distribution network, creating efficiencies through connectivity with our warehouse management systems and other platforms. We are encouraged by the progress and excited about the long-term value this platform can create as we continue to expand capabilities across the network. Additionally, we continue to make meaningful progress on our order management system and enterprise resource planning initiatives. Our OMS investment is critical to enhancing the client experience and improving the purchase journey across our omni-channel model, while our ERP investment is designed to modernize our core financial and operational systems. Execution across our distribution network and technology infrastructure investment remains our top priority, and success is delivering these initiatives on time, on budget, and within scope. Equally important is the cultural shift underway. As we implement these systems, we are increasing accountability and standardization across our house, building a more scalable and disciplined operating model. Overall, we view these strategic investments as essential to strengthening our foundation and positioning our house for long-term profitable growth. Turning to tariffs and sourcing, trade policy remains fluid, particularly following the recent Supreme Court ruling on certain IEPA-related tariffs and the rollout of the CBP refund process. We are actively evaluating the potential implications, including the administrative process required to pursue refunds. Separately, the 10% global tariff implemented under Section in 122 is currently scheduled to expire in July, though the path forward remains uncertain. Given this evolving backdrop, we continue to take a disciplined and measured approach. Importantly, our diversified sourcing strategy and meaningful domestic manufacturing footprint position us well across the range of potential policy scenarios. Based on current policy, we continue to estimate 2026 tariff impacts to be in the range of $30 to $40 million. This reflects some benefits from vendor negotiations, sourcing shifts, and operational efficiencies. We will continue to assess pricing over the coming months and quarters and plan to respond quickly and thoughtfully as conditions evolve. Turning to our outlook, while we continue to operate in a challenging environment, we remain confident in our full-year 2026 outlook. In the first quarter, we achieved results within our expected range, and we continue to believe our long-term strategy and operating model position as well to navigate near-term volatility. We recognize that the consumer has been pressured by broader economic uncertainty, geopolitical tensions, and shifting consumer sentiment. And that being said, we also see several meaningful factors supporting the balance of the year. First, we entered the second quarter with healthy client deposits, which we expect to convert to delivered revenue as inventory availability and in-stock positions improve across key categories. Second, we have increased promotional activity and marketing efforts to drive volume and client engagement, strengthen brand awareness, and stimulate demand. And third, we have seen continued strength in our interior your design, and trade channels. As a result, these factors continue to support our confidence in the back half of the year. Importantly, because of prior pricing actions, we have flexibility to increase our promotional activity while continuing to protect our margins. This allows us to support volume and demand generation without creating meaningful pressure on profitability. As we have said before, for our client base, we believe demand is often deferred rather than lost. Our clients make considered purchases and we believe deferred demand, improved product availability, and demand generation efforts support our confidence in maintaining our full-year guidance. It's also important to note that our current outlook does not include any benefits from potential IEPA tariff refunds. As we gain full clarity and confirmation around those refunds, we will evaluate any impact and update our guidance if necessary. For the full year, we continued to expect net revenue between $1.43 billion and $1.47 billion for year-over-year growth of between 3.7% and 6.6%. Comparable delivered sales of flat to plus 3%, net income of $66 million to $75 million, and adjusted EBITDA of $150 million to $161 million. For the second quarter of 2026, we expect continued near-term pressure on demand as consumers remain cautious amid ongoing macroeconomic and geopolitical uncertainty. Our second quarter outlook reflects a range of outcomes with the low-end assuming continued pressure on demand trends and the high-end incorporating benefits from improved inventory availability, strong in-stock positions, client deposit conversion, and the positive impact of our increased marketing and promotional activity. As a reminder, we are also lapping a particularly strong second quarter in the prior year, which benefited from elevated delivered sales following insourcing of operations of our Dallas Distribution Center. And therefore, second quarter performance should be viewed in the context of this year-over-year comparison. For the second quarter of 2026, we expect net revenue between $350 million to $370 million for a year-over-year growth rate of down 2.4% to up 3.2%, with comparable delivered sales of minus 5% to flat and net income of $19 million to $24 million and adjusted EBITDA of $40 million to $49 million. In closing, we are controlling what we can control and investing where it matters most and positioning our house to emerge stronger. We have the brand, the product, the balance sheet, and the strategy to navigate this period and capture opportunity as demand improves. Thank you to our teams across our house for their focus and execution. And to our shareholders, thank you for your continued support. And with that, I'll turn it over to the operator. We are happy to answer your questions.
Operator
Thank you. We will now be conducting the question and answer session. We ask that you limit yourself to one question and one question only. If you would like to ask a question, please press star 1 on your telephone keypad. A confirmation tone will indicate your line is in the question queue. You may press star 2 if you would like to remove your question from the queue. For participants using a speaker equipment, it may be necessary to pick up your handset before pressing the star keys.
Operator
One moment while we pull for questions. the first question comes from the line of andrew carter with steeple thank you good morning i wanted to ask in terms of your reiteration of guidance your the guidance implies i think three percent to kind of six and a half percent comparable growth in the second half of the year in terms of where your written trends are today comparable are they supportive of that kind of outlook or do they need to accelerate from here to get to the low end high end etc thanks yeah Good morning.
Thanks, Andrew. Look, let me first take a step back and remind everyone of the approach we took to setting our full-year guidance back in February. Really, starting with the top line, our guidance assumed a continuation of a weak housing market. It assumed continued investments in home remodeling and renovations. And then we also assumed growth from our new trade model as a platform for growth into FY26. And with this, we arrived at a range of around zero to 3% comp delivered growth. And that was further supported by 350 basis points of growth tied to new showrooms in the development pipeline. So that was really what underpinned our top line guide. Our EBITDA margin guide was based on flattish gross margins for the year, reflecting modest inflationary headwinds, a full year of tariff impacts, as well as pricing actions and improved mix, as well as various productivity initiatives to help offset some of those headwinds. From an operating expense perspective, we assumed continued funding of our digital transformation, which started last November and will continue through this year, as well as increases for sales and marketing investments to help drive the top line. So that's what led to our EBITDA guidance of $151 to $160 million for the year. And look, as we mentioned in our prepared marks, Q1 was challenging. We faced very difficult weather conditions. And just to give you a little more color, we had 60 showrooms close for five days in January, which included a weekend. we had 20 showrooms close later in January for two days, and then another 20 showroom closures in February for three days. So, if you just run the math on selling days against the quarter, it's about a 4% reduction in selling days as a result of those weather-related closures. We also, you know, had delays on the catalog, which coincided with our January store-wide sale and the catalogs, a majority of the catalogs did not show up in people's homes until the end of January. And when you take that and then add the impact of the war and the commensurate impacts of the capital markets and what it meant to consumer sentiment, along with the associated inflation concerns that are emerging, we kind of had a perfect storm in Q1. So, you know, putting all that into context, we did see a meaningful improvement in, you know, showroom traffic and client engagement as we exited Q1 and proceeded into Q2. And that engagement really has continued through April and into May. And that's, you know, it's consistent with what we've highlighted in the past, which is our clients tend to be, you know, very resilient. They often are the fastest to return following a period of uncertainty. And though we're all cautious about the macro backdrop, we believe we're out of the woods when it comes to some of those unique challenges we faced in Q1. So we've elected to hold our guide based on somewhat of an elevated risk profile. And if you just look at our distance to go, taking our full year guide and bouncing that against what that means for Q2 to Q4, you know, we've got to deliver 1% to 4% delivered comp growth versus the full-year guide of 0% to 3%. So, it's about another point from a distance-to-go perspective. So, you know, again, very elevated but achievable given we know how Q2 is shaping up and we know everything that's in store, you know, for H2. So, you know, that's a little bit of a backdrop. And then I also want to highlight that, you know, we're entering a period where our inventory availability and our in-stock now status is reaching recent highs. You know, we haven't talked a lot about it, but as we've navigated through tariffs, you know, over the last six to eight months, we've had, you know, portions of inventory where, you know, we were oversold and we had elongated, you know, lead times. And we're in a much stronger position now than we were, you know, even two, three months ago. So really, really optimistic that we're well positioned, you know, from that perspective. You know, as far as our Q2 guide goes, Andrew, recall that we are overlapping, you know, a pretty big Q2 of last year. Our delivered comp was up 10.5% last year in Q2, and that was, you know, driven by the early ramp of Dallas. and, you know, as we sit here today, five weeks into the quarter, you know, we're trending toward the high end of our Q2 guide, but we kept our range wide because of the ongoing uncertainty that we're facing, and we think that's prudent. So, once again, because of that Q2 overlap, I would encourage everyone to look at our Q2 guide relative to two years ago, and in doing that, you'll see that our Q2 revenue guide is plus 13 to plus 19% versus 2024. And if you look at adjusted EBITDA, it's essentially flat to up 2020 top. I'm sorry, it's flat to plus 22% versus 2024. So just looking at it, taking the overlap out of play and looking at it versus two years ago. So that's how significant that Q2 overlap was for us. And again, just one final comment when we get back to our full-year guide looking at EBITDA, we do have an elevated risk profile, really driven by a variety of inflationary headwinds. I mentioned fuel costs that are having both a direct and indirect impact on our business, and we are taking actions to mitigate these costs. And while we have a number of productivity initiatives underway, we expect that to start to flow through in the second half as well. And we'll share more details on these as they materialize. And just one, you know, final reminder, our current guidance does not include anything on tariff refunds. We just don't know enough at this stage to guide on it. But I can assure you by the end of Q2, we'll have more information to share. So hopefully that gives you a little color on, you know, the building blocks behind our full year guide as we sit here, you know, five weeks into Q2.
And I just want to add one little piece just to our full year 2026 Adjusted EBITDA Guide is $150 million to $161 million for the full year.
Operator
Thank you, Tara. Next question, we'll hear from Marilyn Chet with Bank of America.
Thank you for taking my question. I was wondering if you could remind us the timeline of your order management system and ERP rollout, are you still targeting 1Q-2027 for deployment? And can you remind us the P&L impact from that investment in 26? I think maybe you expected to see some gross margin efficiencies from the transportation management part of that in the second half, but just wondering what kind of SG&A cost you will see in 2026.
Yeah, thanks for the question. Look, we're really excited about the progress we're making on our digital transformation. The TMS system is going to provide meaningful benefits to our supply chain. In fact, even though we're still in the hypercare phase, which we do expect to end in the next few days, by the way, we are already looking at the underlying KPIs that measure load rates and all the associated efficiencies that we expected to get from this transportation management system. So, early indicators are that, yes, we are already seeing some of those benefits. When you go fully operational on the TMS, which would include the phase two portion of that project, which kicks off here in the next few weeks, and it helps us with inbound transportation, we expect to see $4 to $5 million a year in annualized benefits on just that transportation line item. For FY26, we're forecasting $1 to $2 million of benefits. Maybe we'll do a little bit better than that, but that's what we're modeling. When you look at the other components of the digital transformation, which include the ERP and the OMS, as we sit here today, we're on schedule. With these projects, you always have week-to-week volatility on, are we on track on certain tasks? Some we're ahead on, some are behind on, but on its entirety, we are still tracking for a Q1 launch on both of those systems. And, you know, so far we're on budget and generally no massive like scope changes at this point. We feel pretty good about the scope. There's a few things here and there that, you know, that we're looking at, but generally in terms of the overall deliverables, you know, we're tracking quite well. Going back to our business case on this, there's a tremendous number of benefits that emerge over the next few years. Some of it is tied to software savings as we consolidate our ecosystem and have fewer systems that we're paying licensing fees on. Some of it is in the form of IT efficiencies where we can streamline our support costs. And then some of it just comes down to SG&A efficiency across the organization. And just from an SG&A perspective, we're modeling 50 basis points of SG&A load that will materialize over the next, you know, two years. So, that's still what we're targeting. And that's, you know, again, it will come across different pockets of the organization, a lot of that being back office costs, whether it's, you know, things like, you payroll, accounts payable, and other transactional areas of the business. But getting back to your point on that order management system, we see this as a significant unlock to how we fill orders, how we deploy inventory, and we think that's going to be a big unlock just from a productivity perspective, but also from a customer experience perspective. So lots more to come. We'll keep you updated quarterly on this, but tracking extremely well at this juncture.
Operator
And next we'll hear from Cristina Fernandez with Telsey Advisory Group.
Hi, good morning. I had a question for John. Can you talk about how consumers are responding to the newness, whether it was the spring collection or the expanded outdoor and the bath introductions you did in the fall. And also a clarification on the current trend when you talk about significant improvement. in, has the demand turned positive, or is it still negative but vastly improved from earlier in the quarter?
Hi, Christina. Yeah, thanks for the question. Yeah, product-wise, you know, I think, as I said in the recorded talk, that, you know, this is our biggest launch of new product, most exciting time, you know, I think in our As I'm sure you may or may not know, but, you know, trends have changed very quickly in the last year or so, and they've changed really into our favorite product that is just right down our sweet spot. You know, it had been very stark white or even before that just gray, neutral fabrics, you know, very flat, and we've always been much more eclectic, much warmer and so forth. So it's a great time right now. We accelerated the launch of some of our products, and I'm thrilled to report that in the big picture, the results have been phenomenal. Now we're playing catch-up to get them to all stores. You know, a lot of these groups that would say would have tested in 20 stores, put on the web, and so forth. We monitor closely, and if it's outperforming, product that's currently on floors, and then we switch floor samples and send it out to all the stores. So we're in that process right now, but everything's looking fantastic. I'm loving the wood pieces, the designs, the shapes. I just got back from the Milan furniture show last week, week before, and I've got to say we should have had a booth there because I think our product looks better than anybody else's I saw in Milan. I've never said that before, but I think it's the truth. We are dead on right with the trends, and we're way ahead of the competition in it. And, yeah, it's going to be a fun year for that.
And, Christina, just to add a little bit of color there, too, you know, Mike and John both referred to our catalog being delayed earlier. And, you know, specifically, as I think you all know, we have various catalogs and direct mailings that we send out. Big book at 228 pages, a 12-page or postcard. The catalog that was affected with those delays was that 228-page book. And that is really the supporting system for us introducing all of that incredible new product and getting it out to our customers and into their homes. So, you know, just looking at that, customers are really responding well to that product. and now getting that marketing into homes, launching digital campaigns throughout the quarter, and then we actually have gotten our early summer catalog out into homes at the end of March here. We're just really excited to continue to see that initial engagement and excitement of that product, it continuing to grow, going into Q2 now, that more people know that it's out there and are being driven into stores to go and see it.
And it's obviously the beginning of the outdoor season. So far, it's been phenomenal.
So we're very, very happy with the results and learning a lot for next year to even get better. I would just add on, on the newness front, in Q1, I think our newness was at around 12% of sales, up from 8% of sales last year. So continuing to lean more into that, and that trend continued into April. And, look, I know, you know, we talked about not getting into month-to-month, you know, disclosures, but I think the question was, has demand turned positive in April? It absolutely has turned positive, and I can tell you April and May are performing even ahead of some of our internal forecasts, so we are very, very encouraged by the momentum in the business. And, you know, we talk about U-shaped recoveries and V-shaped recoveries. I would say April was more like a V-shaped recovery in that regard.
Operator
Next, we'll move on to Stephen Forbes with Guggenheim Securities.
Good morning, John. John or Mike, maybe a two-part question. First, can you expand on the promotional change that you're investing behind versus the traditional buy more, save more, just so we sort of understand sort of what you guys are leaning into? And then secondarily, the new trade model that you've launched here, we'd love to just hear you talk about sort of what are the key attributes of it and what's really resonating with the trade professionals.
Sure, Stephen. I can start and Jen can help with the promotion side. But the trade model is pretty simple. We have these outside folks that have their own businesses and they have their own clients. they bring to various people and hopefully more and more to us. So all we did was we offered a second way for them to make an income. It was we were giving them basically a commission, so to speak, type of format, and now we've offered them a discount instead, one or the other. They get to choose, which is more the traditional way that most of them, many of them work. So we just offered a second way of them to make income using our product. And so far, our response has been phenomenal. Very, very early to say it. I think it's only 30 days we launched it or something. But so far, so good. And then, Jen, maybe you can fill them in on the promotional thing. because it hasn't been that different, I don't think.
Yeah, Stephen, good question on the promotions. So looking at our Q1 approach to promotions, really strategy was very similar and in line with what we've talked about previously in 2025 with a lot of the buy more, save mores and those types of promotions that we've talked about on prior calls. Going into April, we purposely elevated our promotional activity and that was in reaction both to what's going on in the macro and then also the challenging Q1 environment that was spoken to prior on this call. And, you know, as Mike just said, we're really pleased with what's happening in April. We started to see that pick up at second half of May, really pleased with April, really pleased with what we're seeing going into May as well. I think when you look at our approach, you know, what we're looking at is the underlying health and quality of our business. So even with the challenging environment in Q1, our customers are remaining highly engaged. We have an affluent customer. They're still looking for the furniture. They're still doing those big projects. And we're seeing that underlying quality of our demand remaining really strong. If you look at orders over 10,000, over 100,000, those bigger projects, they're really good. We're really pleased with that engagement, with clients coming in and working with our interior designers. as John just mentioned, with trade designers as well. So that structure is looking good. What we are seeing is that customers are being more deliberate. They're more considered. We started talking about that last year. We saw that in Q1. And so our approach to promotions, our approach to marketing, our approach to really just outreach to the customers is really focused on that, focusing on what we are doing really well, which as John has referenced, clients are responding really well to the products. They're responding really well to our quality, our unique assortment, the craft that only we can offer. And so that is really what we're positioning out in the market. We're looking to engage them with marketing, really trying to be creative with the content and the ways that we're getting that messaging out to customers. And then similarly with promotions, really looking at what are those drivers where we can help, first off, keep our house top of mind, continue to introduce our house to new potential clients who maybe don't know about us yet, but then also really looking at those levers to drive the consideration to conversion window. And pleased with what we've seen in April, pleased with our plans for the next coming months here, and we'll continue to monitor our business, the macro, and adapt and evolve throughout the year as we think.
Operator
Thank you. Thank you. Thank you, Stephen.
Operator
And next we'll hear from Peter Benedict with Baird.
Hey, good morning, guys. This is Zach back on for Peter. Thanks for taking our question. Mike, you mentioned a flattish gross margin view for the year. I think you had previously discussed 60 to 70 basis points of expansion. Can you help us understand the change there and your assumptions for oil and fuel costs over the balance of 2026, and then maybe on the Q2 EBITDA range as well. Realize you have some tough compares in the quarter, but if you could unpack the drivers of compression there and help us understand how that moderates in the second half, that would be helpful. Thank you.
Yeah, Zach, look, fuel costs are highly, highly uncertain at this point, but that's really the driving force behind gross margin. And, you know, there's about a 40 basis point impact in Q1, and that impact really, you know, is about half a quarter's worth of impact. So, when you, you know, take into account that, you know, we've got a full quarter impact coming up, and we also have a lag effect between any mitigations taking place and when they actually flow through the P&L. So, a little bit more cautious as it relates to fuel, and look, everything we're hearing is that even if the war ends, the lag effect on fuel prices coming down is going to really, you know, be in months and quarters, not weeks. So, if anything, we're just being a little bit cautious there. But again, I want to emphasize that, you know, we've got mitigation steps that are underway, and we think we can fully offset that in terms of ongoing structural costs. It just takes a little bit of time to get it going in the P&L and for it to flow through to delivery. So that's something just to be mindful of. It's just that lag effect. In terms of the overall EBITDA for the balance of the year, look, inflation is persistent and And it's real, you know, sort of setting aside the fuel costs, there are indirect impacts from fuel costs and even little things like fuel costs impacting the foam in our manufacturing business, right? And these aren't huge. Maybe there are a lot of, you know, I'll call it ankle biters in terms of these, you know, impacts that are happening across the business. But we're increasingly, you know, leaning on productivity initiatives to help offset that. but the inflation impacts are real. So that's something that we're, you know, continuing to manage, you know, day in, day out. You know, some of it's, you know, more business as usual, you know, with our suppliers around the world, you know, different suppliers are facing different cost pressures. Some aren't facing any and some are facing more than others, but we continue to work through that. I don't see as much from a product cost perspective as I do from a, you know, supply chain, logistics perspective, even container costs, right? Getting containers now are more expensive than they were even, you know, three months ago. So really managing through that, but nothing that I would say is a structural change to our business. It's really just leaning on productivity initiatives to help offset those. So more to come as we get through Q2 on some of those mitigation steps, but we're really excited about some of the opportunities that we're discussing internally to help absorb some of those headwinds.
Operator
Our next question, we'll hear from Jonathan Matuski with Jeffries.
Hi, this is Andres. I'm on for Jonathan. Thanks so much for taking the question. With S&P at all-time highs and the wealth effect historically being a key driver of your consumer, what's the broader macro and housing environment you're embedding in the back half?
Yeah, it's a great question. The stock market volatility and its impact on our business, it is real. Even going back to last April when a lot of the tariffs were announced for the first time and the stock market reaction, there's a pretty good correlation between what we see and the capital market outlook. look, our guide is really based on, you know, a continuation of a lot of the fundamentals that we're seeing today. I wouldn't say that we build our plans based on the S&P being at an all-time high, but we're certainly not building into our full-year guide a recession. So, look, we know that job growth is a bit anemic right now. We know that inflation's real. We know that the housing market's weak. We know that the 10-year continues to move up, so consumer credit is being impacted. But again, a lot of our business comes from the high-end consumer, and when we look at high-end housing, high-end housing continues to perform well. As recent as the last 30, 60 days, measures on luxury home sales continuing to perform well. High-end consumers are still investing in projects, home remodels. So, that continues to do well. So, that's really what's underscoring our full-year outlook from a, call it an infrastructure perspective. But, you know, most of our outlook is weighted on the promotion plans, the product that's coming, the marketing, you know, new showroom expansion, things like that, which fit into the category of controllable. And I can tell you that, you know, one of the reasons why we've held our guide is that we feel really good about the balance of this year from a product perspective, from an inventory perspective. I know there's some questions about why inventory is up, but we are coming out of a cycle where, you know, we had out of stocks on a number of items. So we're in a pretty good spot overall. And yes, we recognize the volatility of the backdrop is still there. And I would say that's what's driving maybe a wider range than we would normally have on our guide is just protecting against that uncertainty. So hopefully that helps give some context.
Operator
And our next question we'll hear from Peter Keith with Piper Sandler.
Hi, this is Alexia Morgan on for Peter Keith. Thanks for taking our question. We've been monitoring supply chain disruption stemming from the Texas chemical plant incident in March. Could you frame up your exposure there to the resulting foam and polyol shortages? Are you anticipating any material delays in upholstery or other categories? And how do we model the potential impact there?
That's a good question. Yes, we're fully aware of that incident. And we are very comfortable, confident with our foam supply. So not expecting any disruption in terms of the supply chain. We are experiencing some cost pressures on foam, but that's a relatively small percentage of the overall product cost. So it's not a meaningful factor. It's just another example of those ankle-biter headwinds that we're fighting through, candidly. But since you mentioned it, I do want to just acknowledge the great work that our manufacturing team is doing. We continue to set new records on upholstery sales each and every month, and we're sort of battling through a surge in special order upholstery. We're producing at higher levels than we've been in a long time. We've even added a second shift in manufacturing to keep up with that demand. And so that continues to be an area of our business that is a strategic advantage for us and feel really well-positioned to deliver on those 700 fabrics and leathers that we offer through our special order program.
Operator
Great. Thank you.
Operator
And we'll hear from Simon Gutman with Morgan Stanley.
Hey, good morning. It's Simeon Gutman. How are you? I wanted to ask, I guess, two parts. First, the decel and written orders quarter to date, can you talk about how that shapes the visibility for the rest of the year? And I know you mentioned a lot of other factors and variables at play. And then can you talk about new gallery productivity, how they're performing, and then what that implies, I guess, for older or existing galleries? I assume they're doing less good, but can you talk about the dispersion between them? Thanks.
Sure, Simeon, I could start with the galleries. Yeah, I mean, we track, obviously, new ones, old ones, and so forth every single month. And, yeah, over a big picture on new galleries that have been open a year or so, we've been very, very happy with their performance. They've been hitting our plans and exceeding them in quite a few cases. And that's not only new galleries, but galleries we came back and renovated or moved. An example, we had a great gallery in Pittsburgh for, gosh, 20 years. We moved it down the street and a little larger, better looking, far better looking, and sales have been through the roof. So things like that that have been working in both new, brand new ones and moving or renovating existing ones. So, yeah, I think they're outperforming as a whole. The, you know, the fleet as a total, but both are doing well. Pockets are, you know, pockets in the country are doing better than others. just because of the weather and so forth.
And then the second question... And then just to follow up on your question, Samantha, about just how the written orders are performing and the momentum there, again, I would just underscore our earlier remarks that we really started to see improvement in the second half of March and even what I would call an acceleration into April and May. And it certainly has felt like a V-shaped recovery from that moment onward, and we are, you know, shooting for the high end of our Q2 guide as a result, and, you know, just a reminder that that guide's really just informed by, you know, the uncertainty that's out there, but as we sit here today, we're really confident in how the Q2 orders are shaping up.
Operator
So, with that, we'll leave it at that.
Operator
Thank you, ladies and gentlemen. We We have reached the end of the question and answer session. I would now like to turn the floor over to Chair Atwood for closing remarks and comments.
Thanks, everyone, for joining us today.
Thanks, everybody. Appreciate your questions. Bye.