Operator
Hello, and welcome to Bank of California's First Quarter 2026 Earnings Conference Call. If you need operator assistance, please press star then zero. I'll now turn it over to Anne DeVries, Head of Investor Relations at Bank of California. Please go ahead.
Good morning, and thank you for joining Bank of California's First Quarter Earnings Call. Today's call is being recorded, and a copy of the recording will be available later today on our Investor Relations website. Today's presentation will also include non-debt measures. The reconciliations for these measures and additional required information is available in the earnings press release and earnings presentation, which are available on our investor relations website. Before we begin, we would also like to remind everyone that today's call will include forward-looking statements, including statements about our targets, goals, strategies, and outlook for 2026 and beyond. They're subject to risks, uncertainties, and other factors outside of our control, and actual results may differ materially. For discussion of some of the risks that could affect our results, please see our safe harbor statement on forward-looking statements included in both the earnings release and the earnings presentation, as well as the risk factor section of our most recent 10K. Joining me on today's call are Jared Wolfe, Chairman and Chief Executive Officer, and Joe Cowder, Chief Financial Officer. After our prepared remarks, we will be taking questions from the analyst community. I would like to now turn the conference call over to Jared.
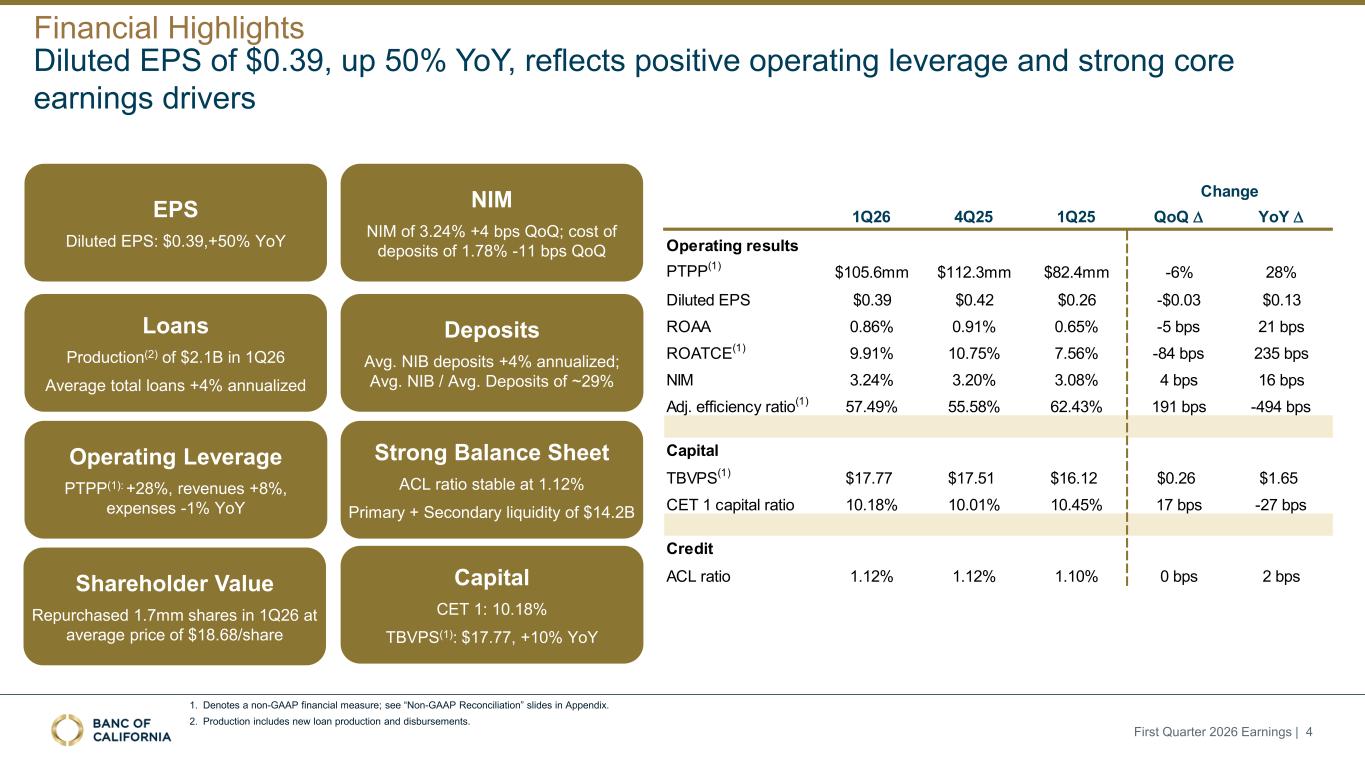
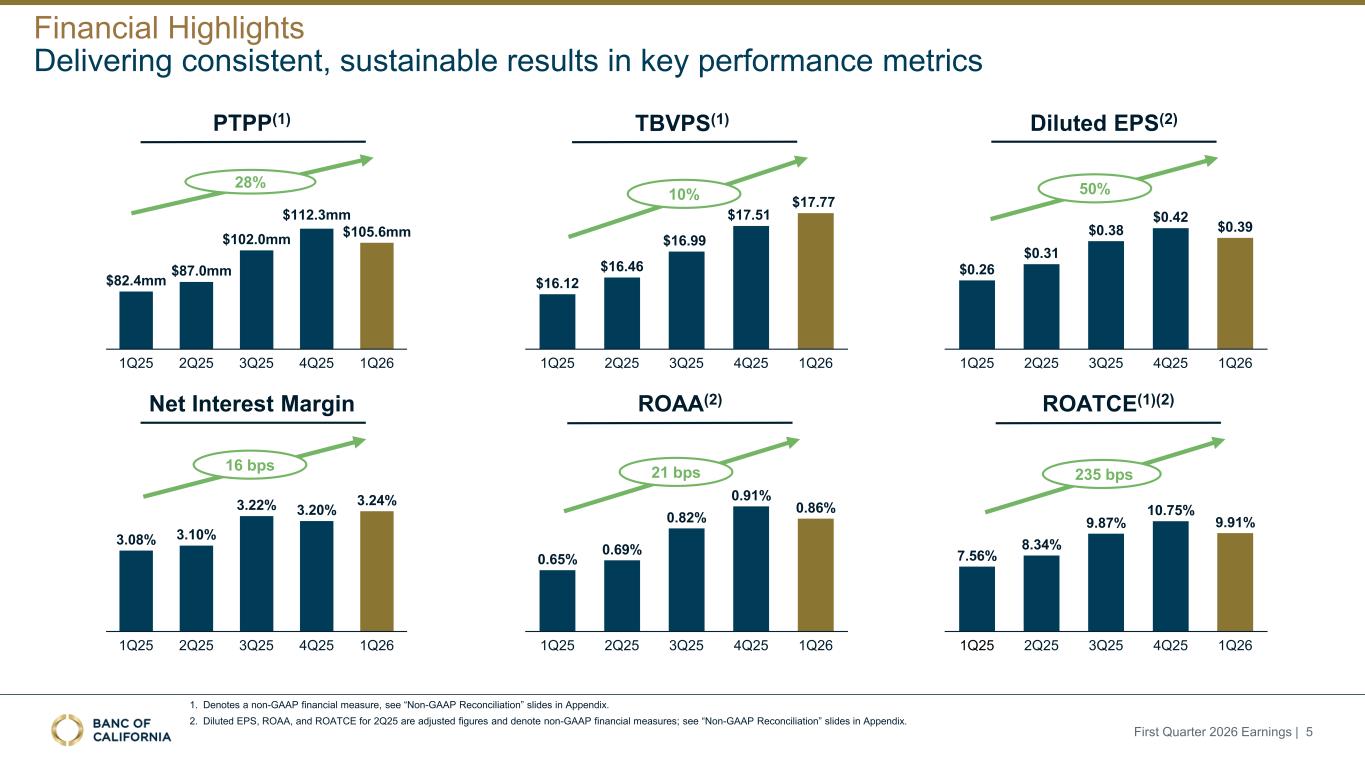
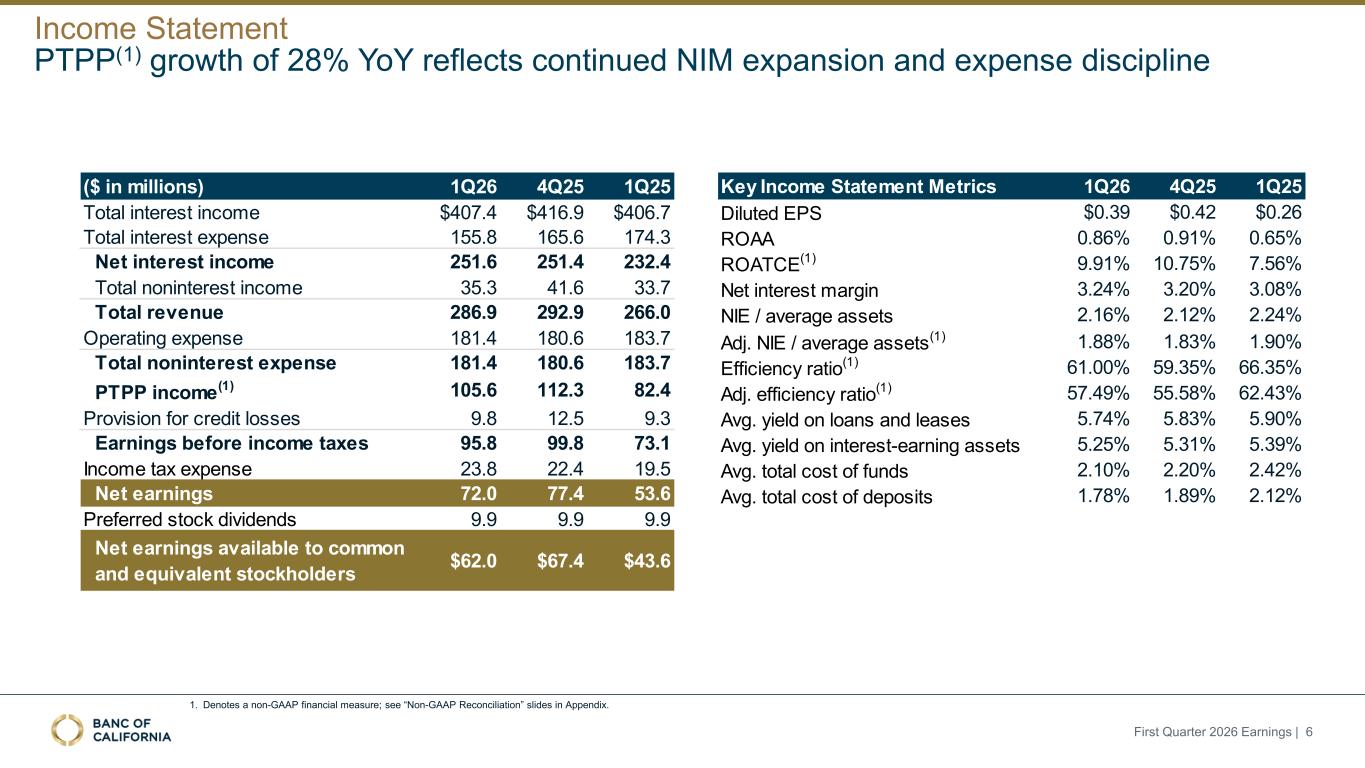
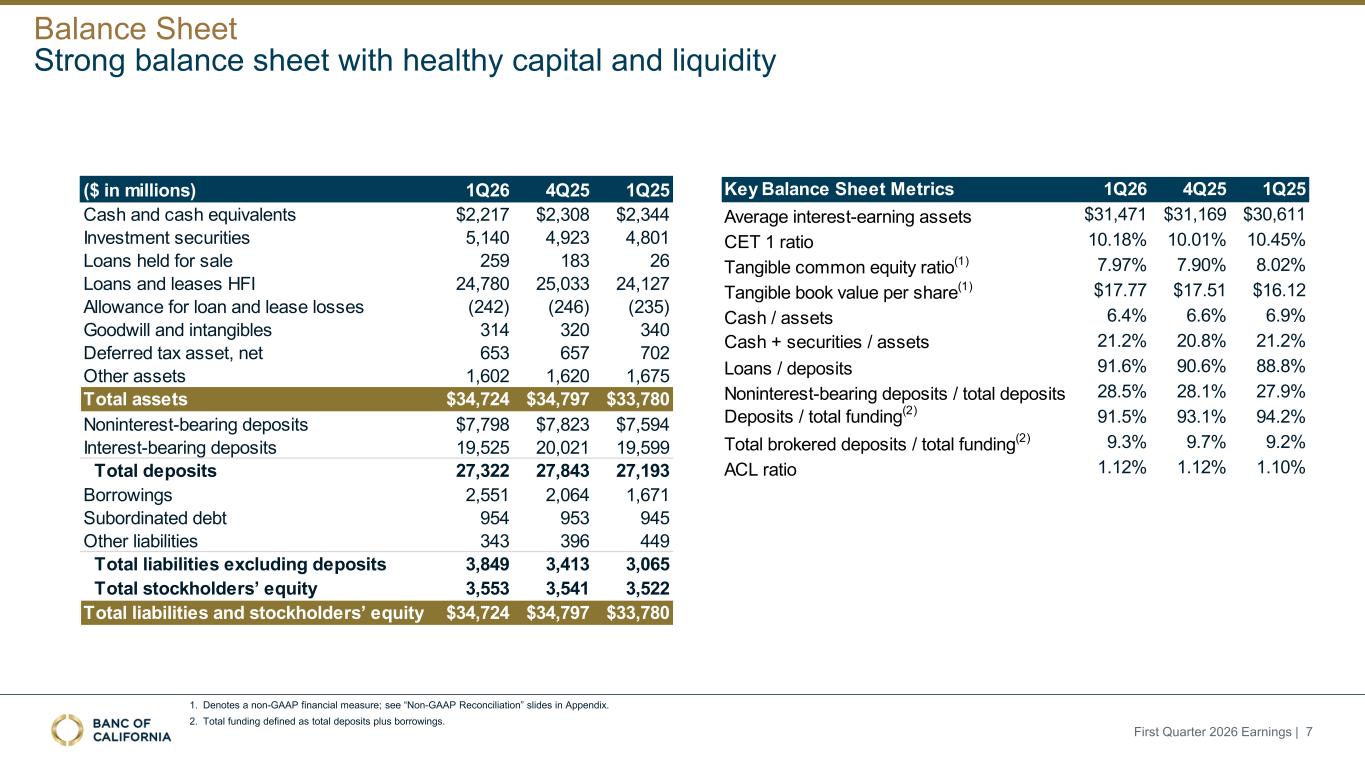
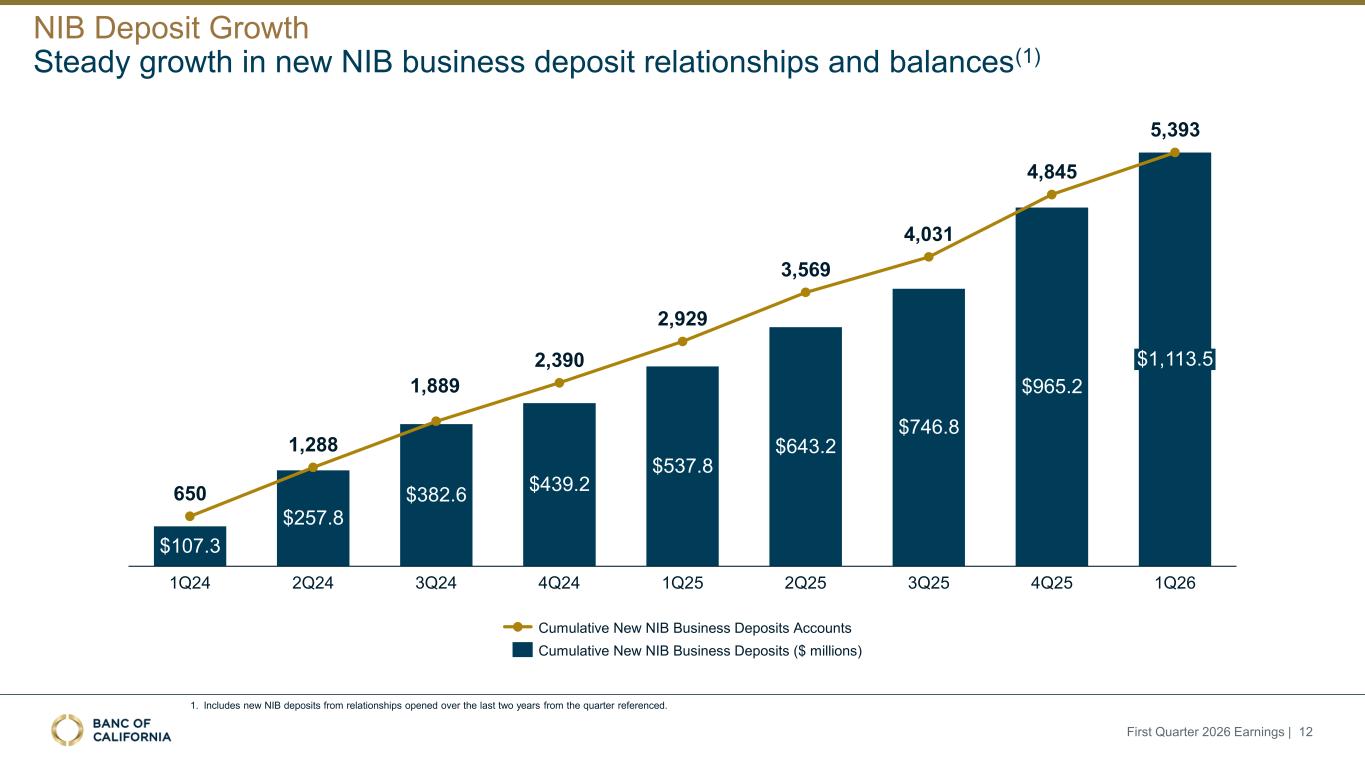
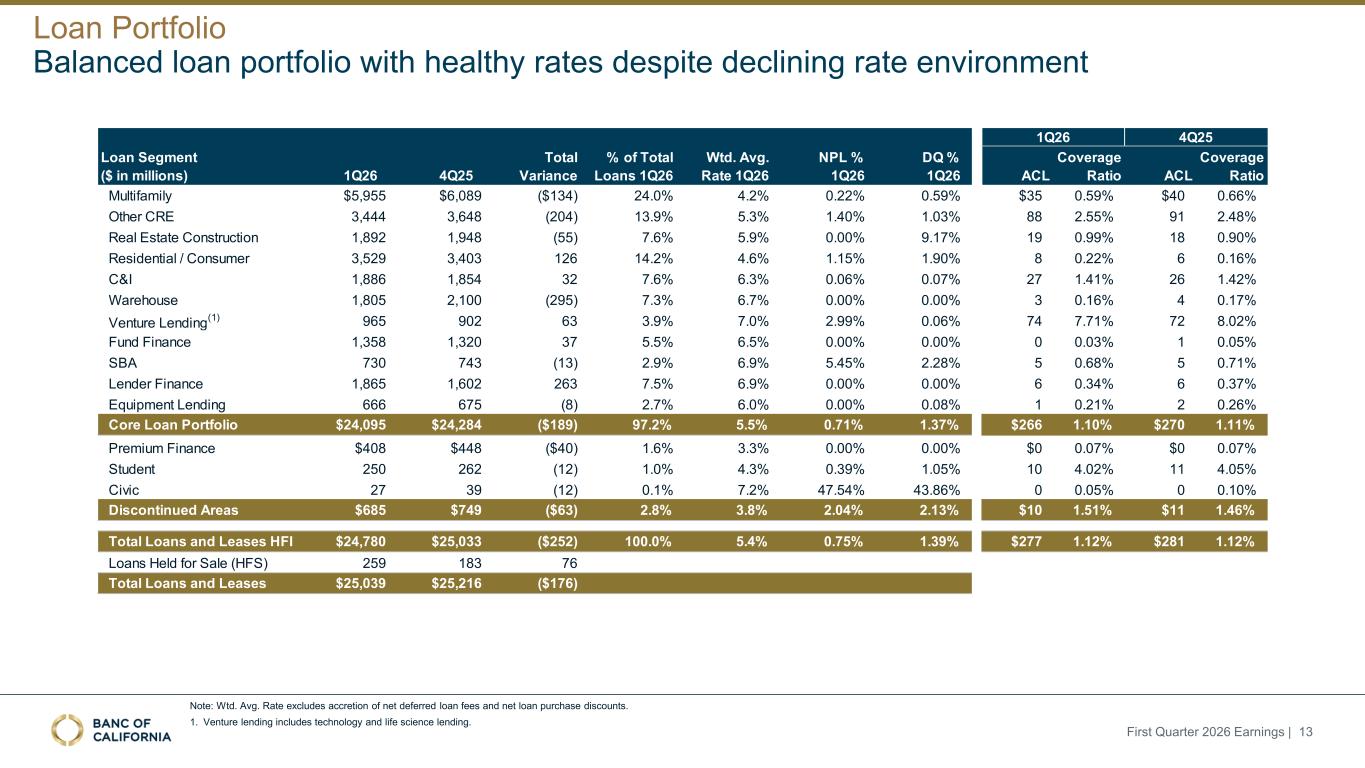
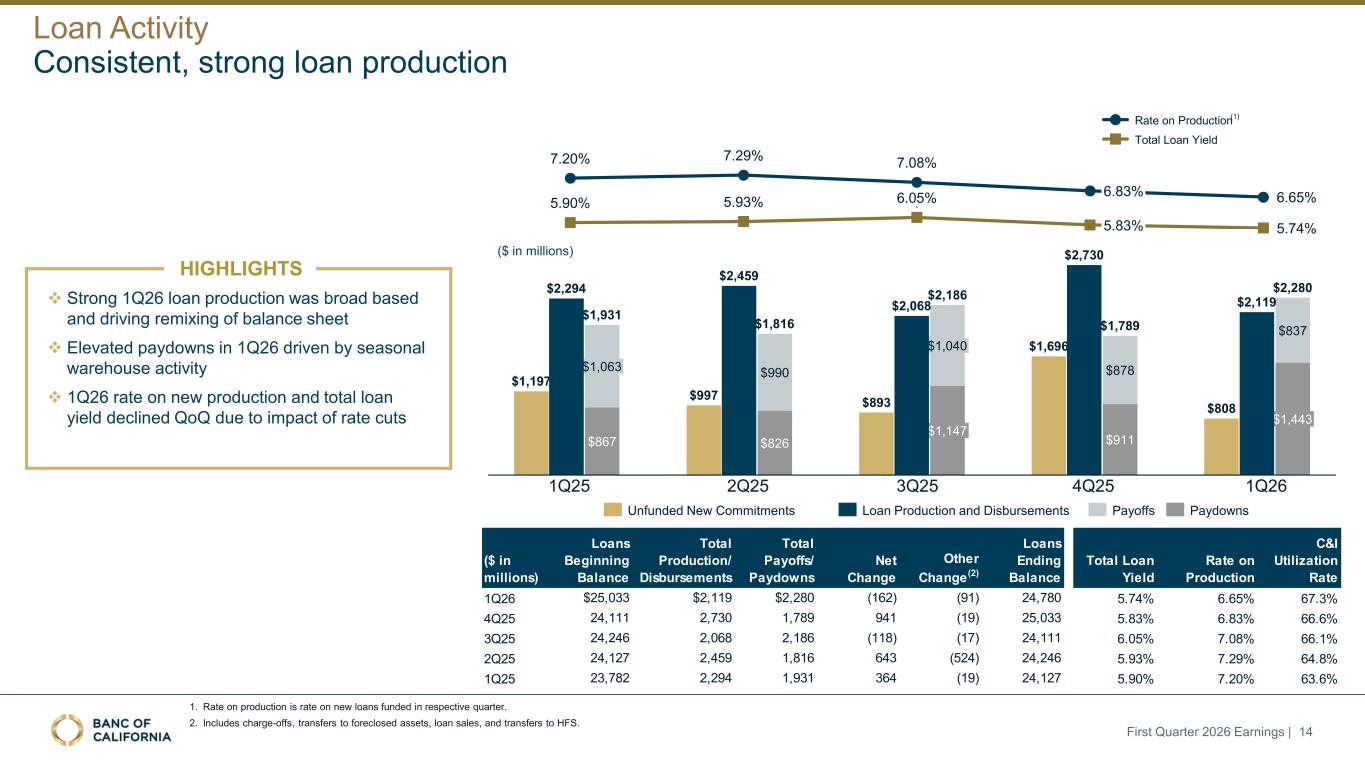
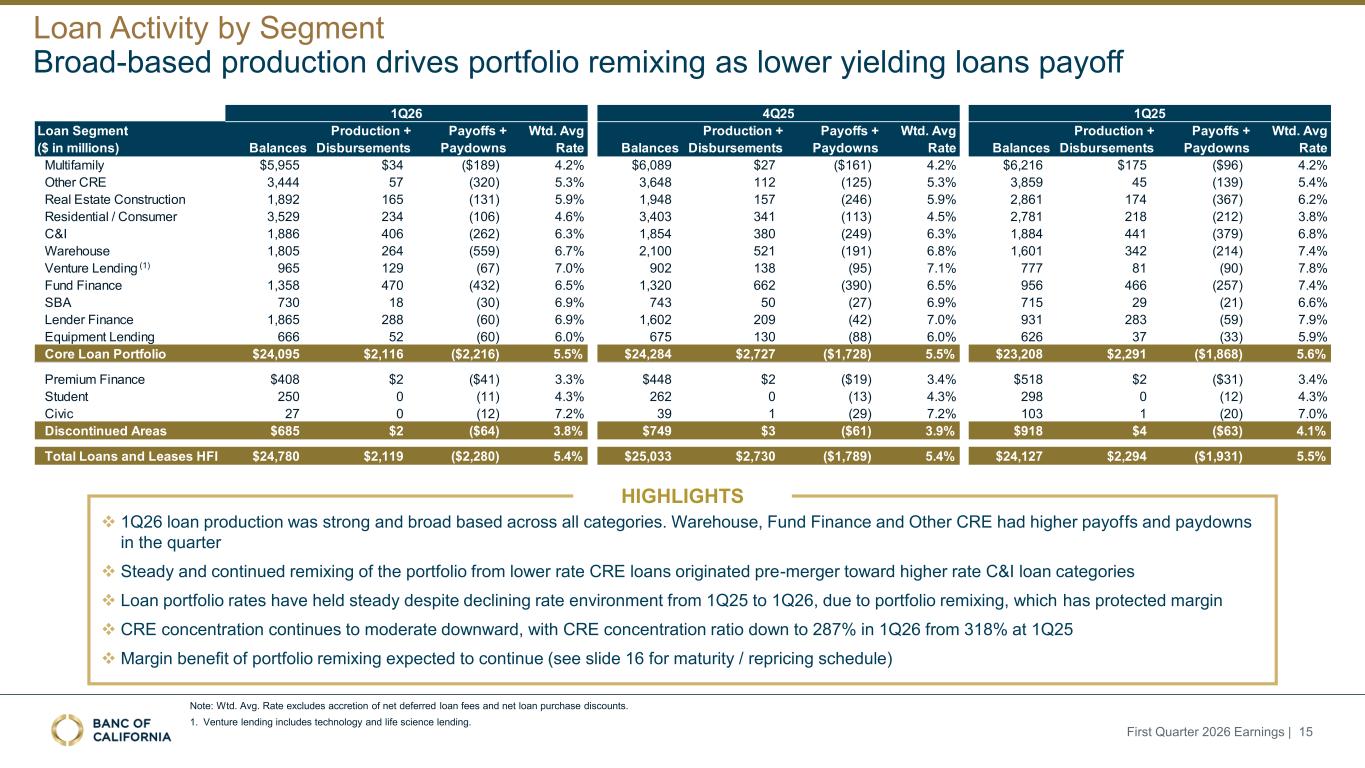
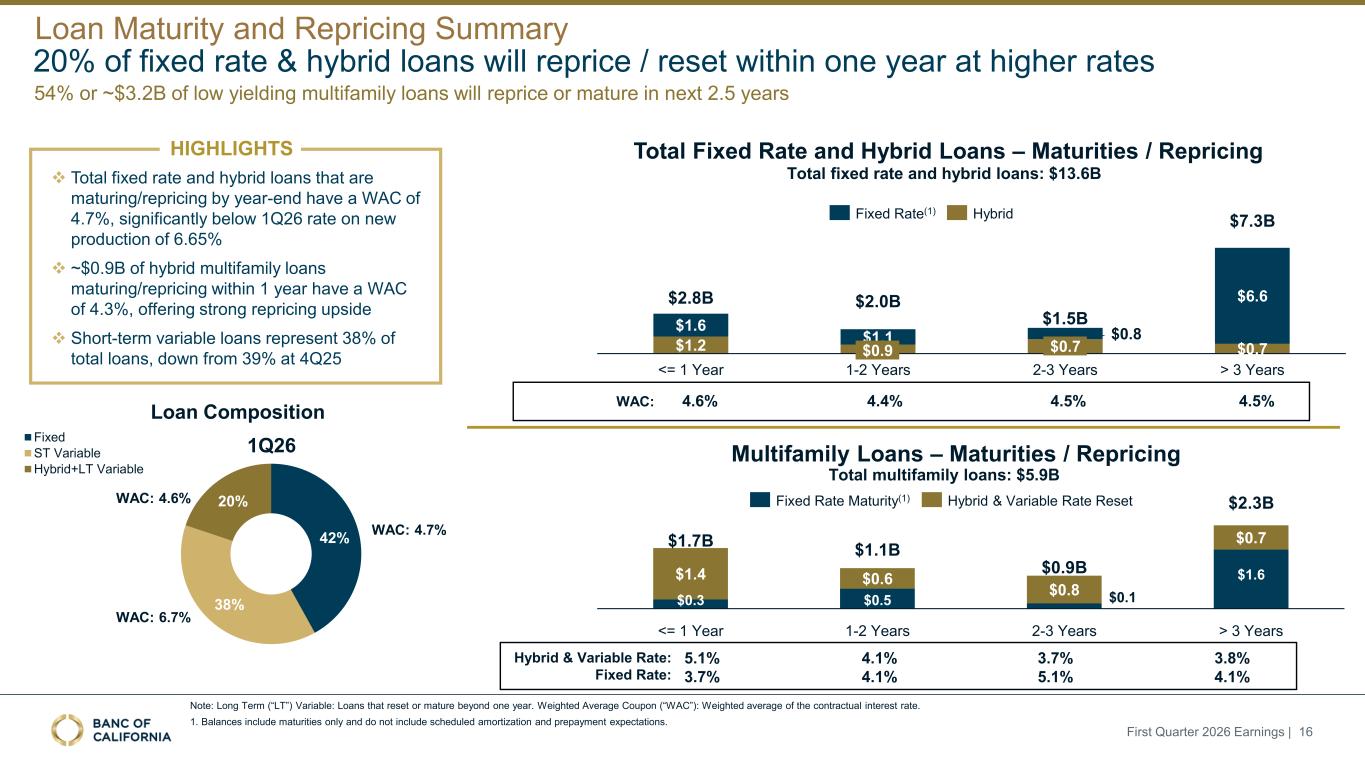
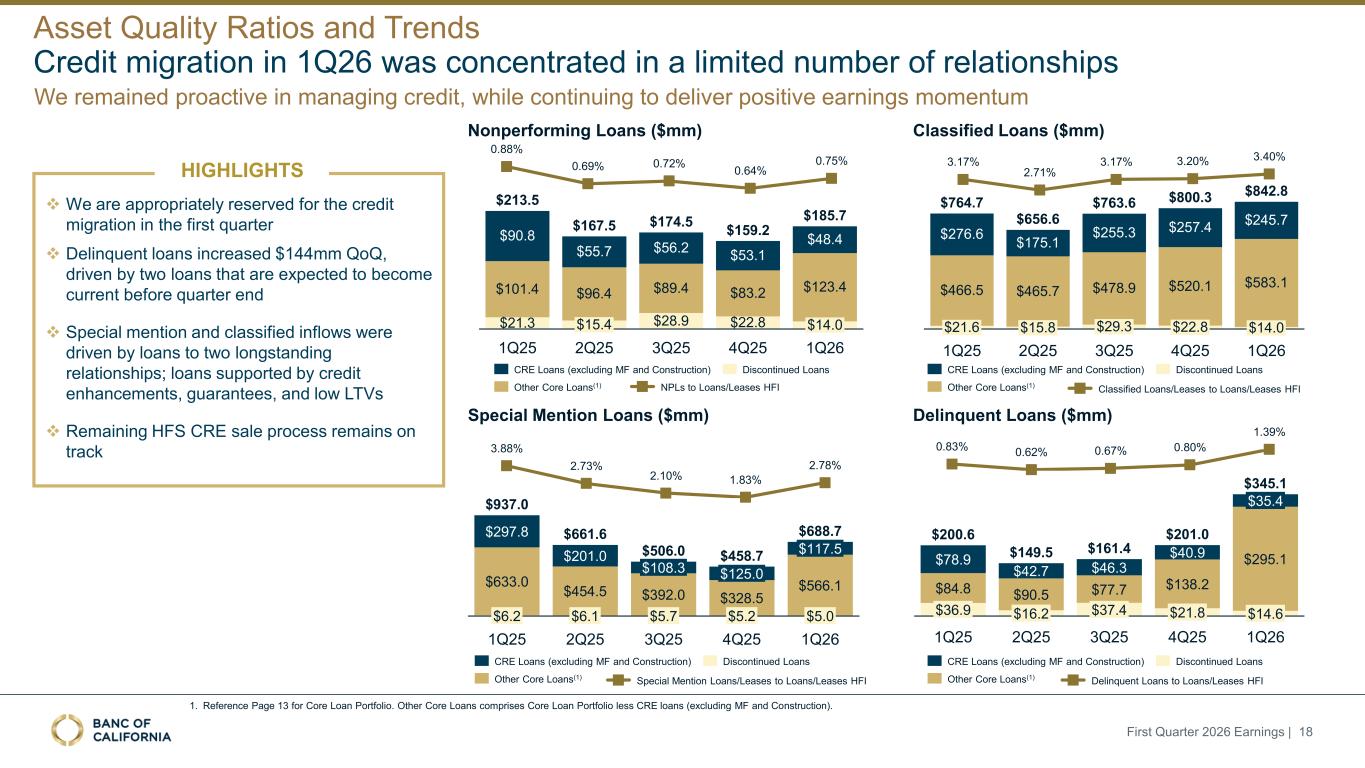
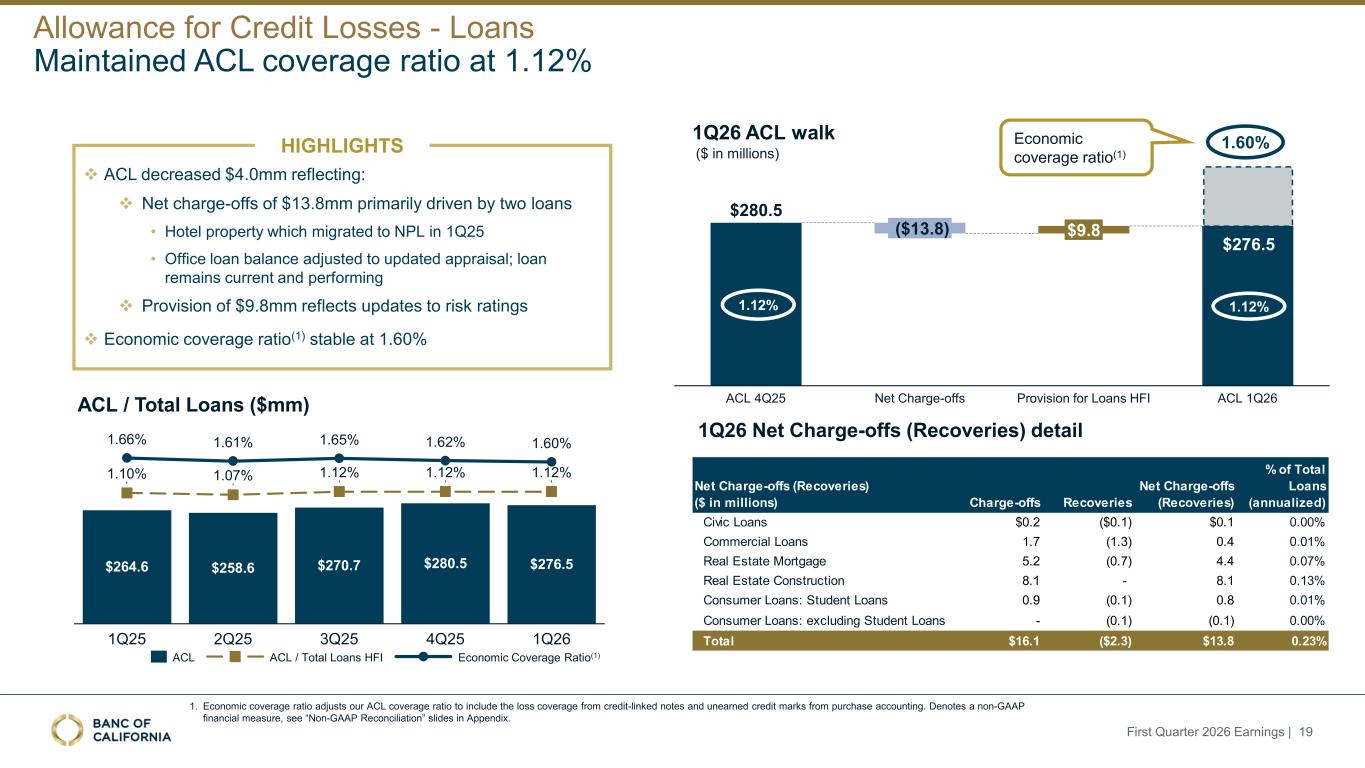
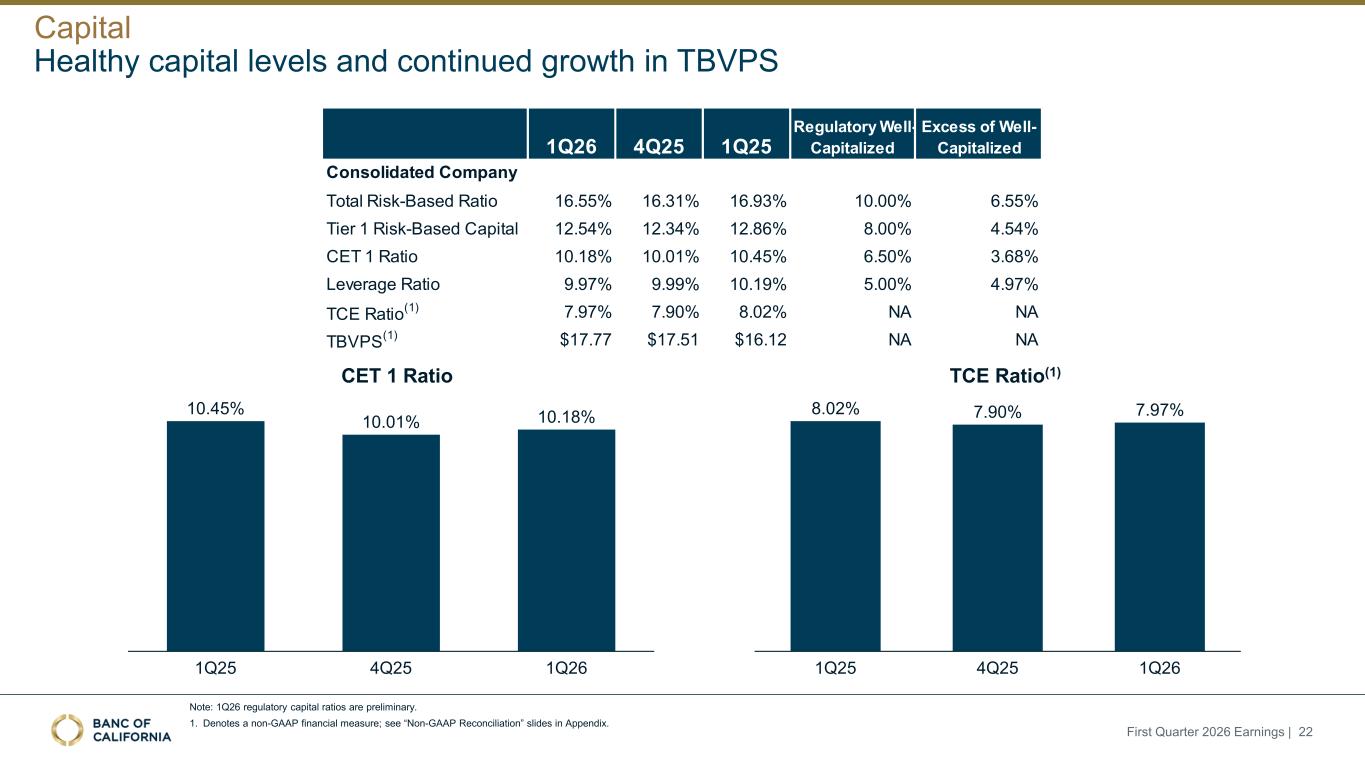
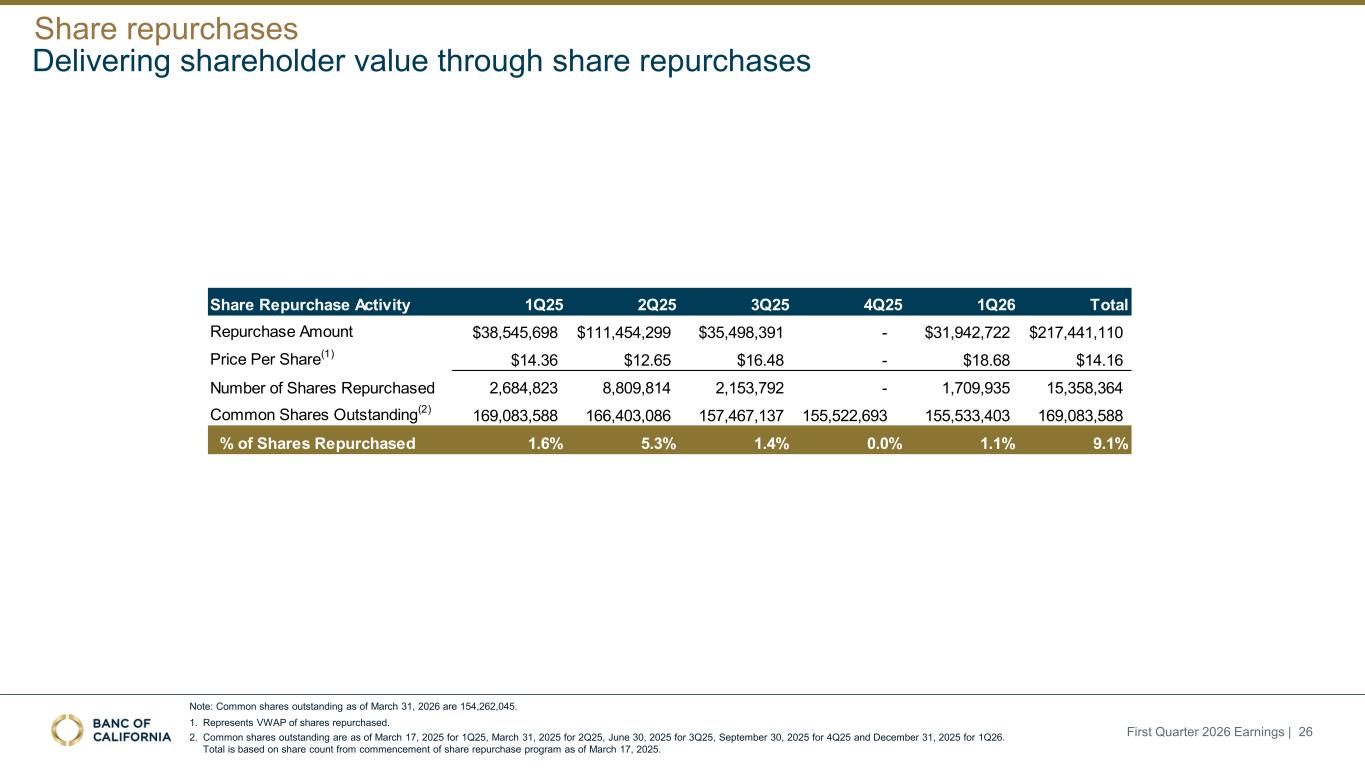
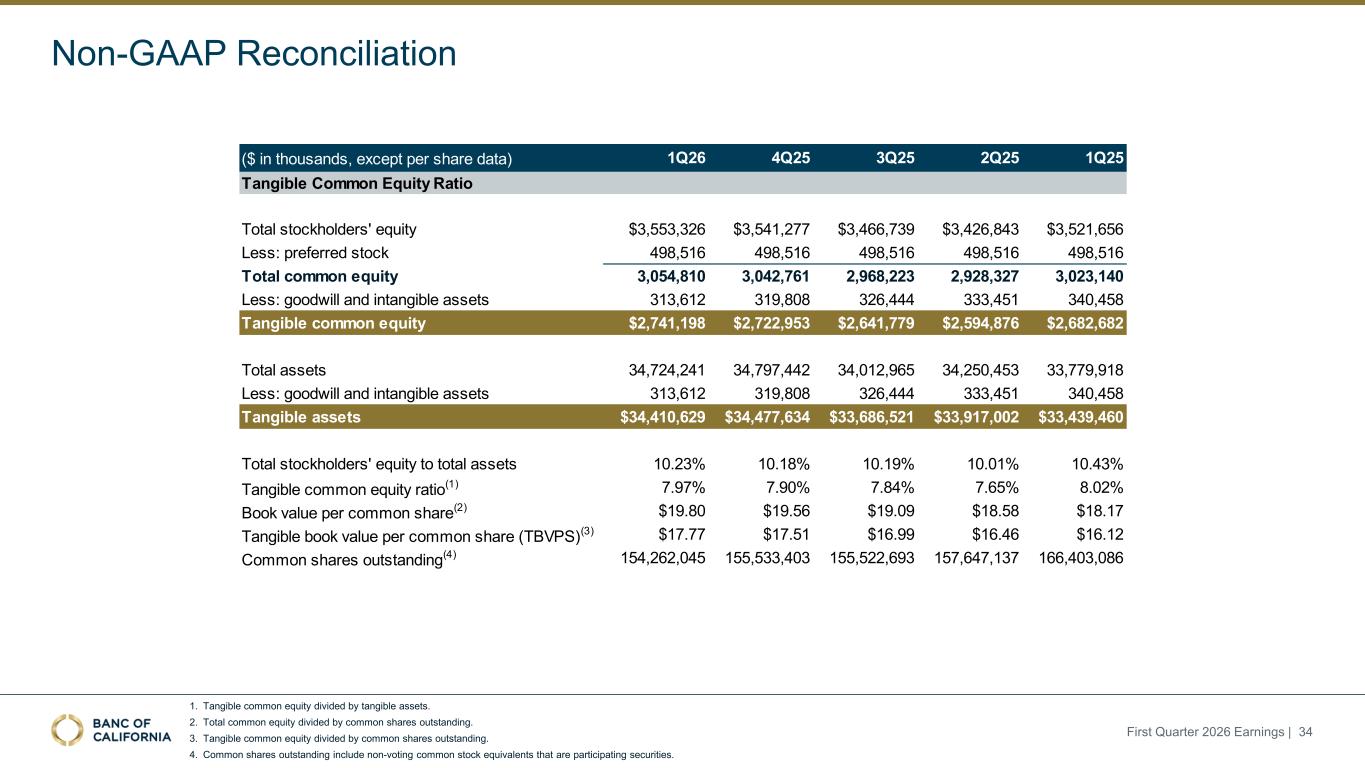
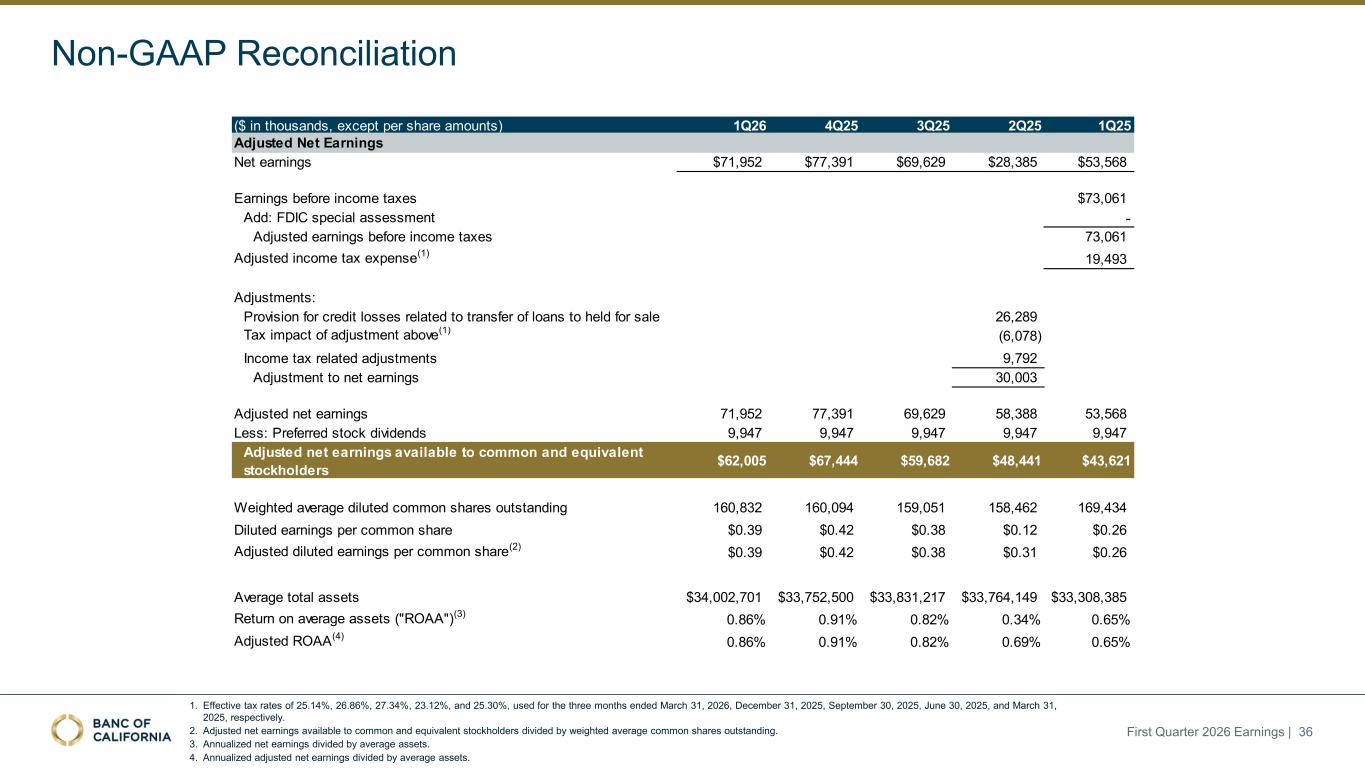
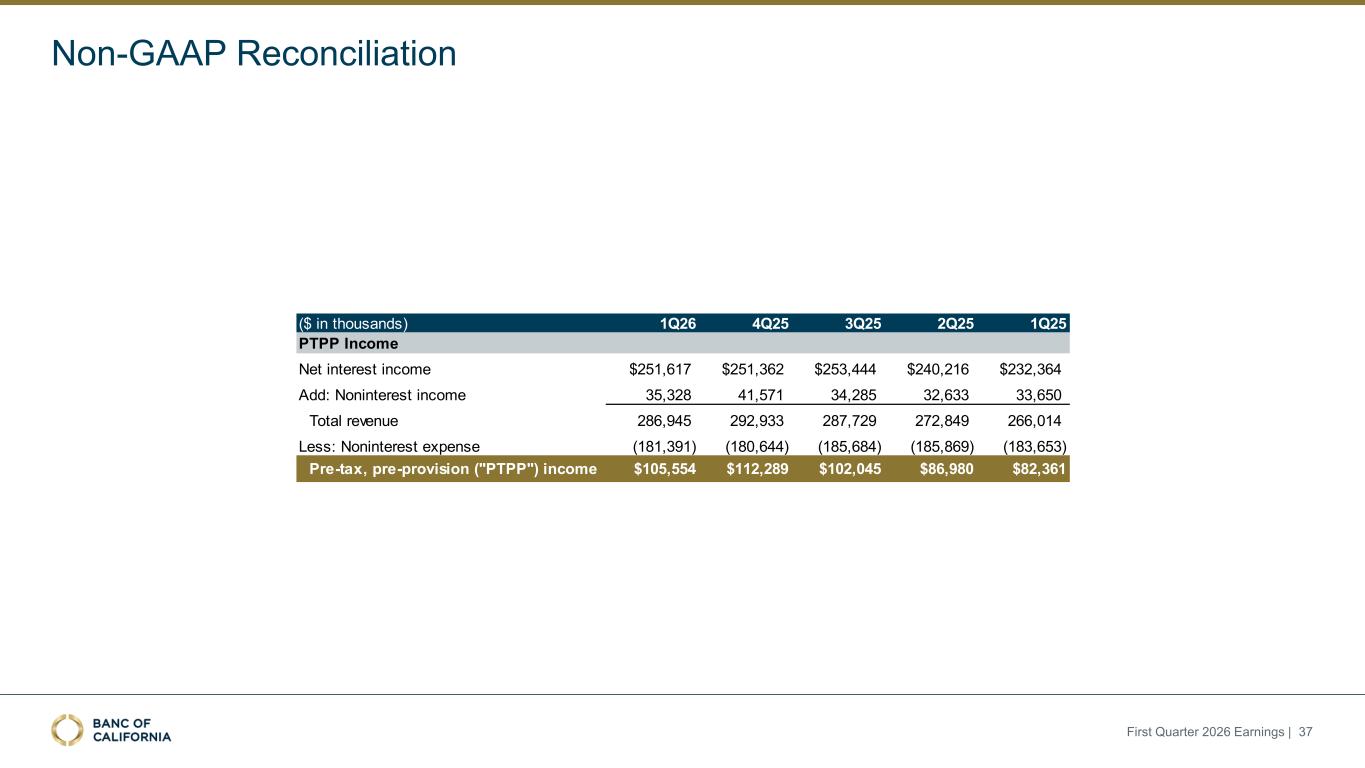
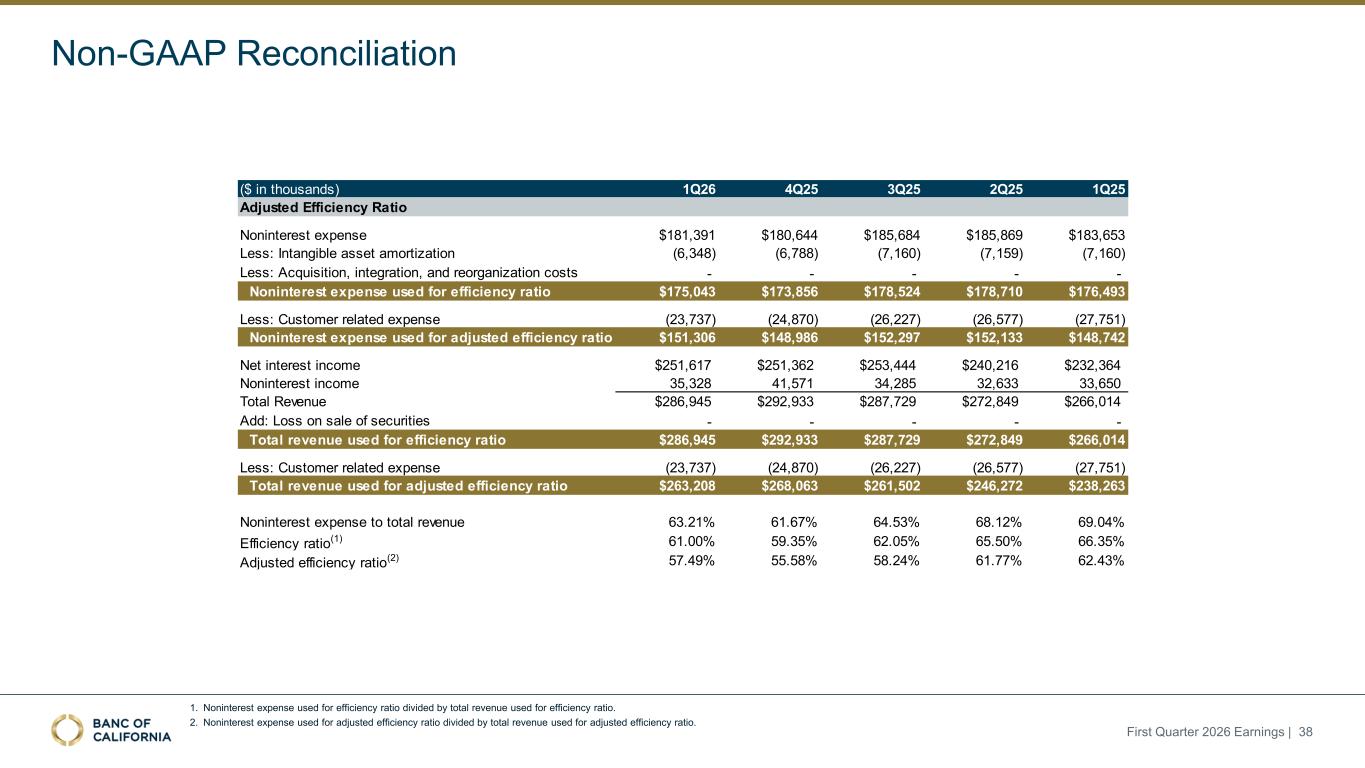
Thanks, Anne. Good morning, everybody. We're pleased to report another strong quarter for Bank of California with year-over-year earnings growth, net interest margin expansion, and continued positive operating leverage. First quarter earnings per share grew 50% from a year ago to $0.39, driven by continued net interest margin expansion and positive operating leverage. Pre-tax pre-provision income increased 28%, while our adjusted efficiency ratio improved by nearly 500 basis points year-over-year. More importantly, the quarter reinforced our confidence in the earnings trajectory ahead. We continue to see durable momentum across the core drivers of the franchise, including margin expansion, deposit mix improvement, disciplined expense management, and embedded balance sheet remixing that should support profitability and shareholder value for the coming quarters. Efficient use of capital remains an important priority for us. In the first quarter, we repurchased 1.7 million shares and also extended our buyback program through March 27 and increased our dividend from $0.10 per share to $0.12 per share. We also announced our plans to redeem $385 million of subordinated debt in May. These actions reflect both our confidence in the long-term value we are building and our commitment to deploying capital thoughtfully and opportunistically for the benefit of shareholders. Our core earnings engine continues to generate capital at a healthy pace with CET1 ratio of 10.18% at quarter end, while our tangible book value per share increased 1.5% quarter-over-quarter to $17.77. Core deposit trends were constructive during the quarter with continued growth in average non-interest-sparing deposits of 4% annualized quarter-over-quarter and improvement in deposit mix with NIB representing about 29% of total average deposits. We continue to steadily attract new business relationships and are also seeing non-interest-sparing deposit balances ramp up in previously opened accounts. with average balances per account of 2.5% from the prior quarter. That reflects the quality of the relationships our teams are bringing in and the strength of our relationship-based deposit strategy. Loan production and disbursements remain strong at $2.1 billion in the quarter, with healthy and broad-based activity across the portfolio. Strong production levels continue to drive the remixing of the balance sheet toward higher-rate loans from lower fixed-rate legacy CRE loans. This remixing has helped protect our overall loan yield and net interest margin despite a declining rate environment. We expect the margin benefit from remixing to continue as new production comes in at meaningfully higher rates than maturing loans, providing embedded earnings upside in the portfolio. New production in Q1 came in at a rate of 6.65%, while fixed rate and hybrid loan repricing or maturing by year-end have a weighted average coupon of 4.7%. We view that ongoing remixing as an important driver of future net interest income growth. This quarter, we continue to manage credit proactively, remaining quick to upgrade and slow to downgrade. This resulted in some credit migration during the quarter, which was concentrated in a few specific real estate credits and does not reflect a broad change in portfolio performance or underwriting standards. We believe this disciplined approach to managing credit is important because it allows us to address issues early, helps reduce the risk of larger surprises later and should keep credit from becoming a more meaningful headwind as we continue to grow earnings. As in the past, we will migrate credit when appropriate to take proactive action. We expect the ratios to improve over several quarters. And importantly, such migration will not disrupt our earnings trajectory. This quarter's delinquency and special mention inflows were primarily driven by a limited number of credits with defined resolution paths. Special mention inflows and delinquency inflows were driven primarily by LIHTC or low-income housing tax credit loans tied to a long-standing customer where we've had a relationship for more than 20 years with no historical losses. The loans have low loan-to-values and personal guarantees in place and strong collateral values, and we expect them to be made current before the end of the second quarter. Classified inflows were tied mainly to two multifamily loans in a single relationship tied to a long-standing customer of the company. These loans were restructured with credit enhancements and are not expected to result in any losses. Overall, we do not expect losses to appear with migrated loans based on our strong collateral and defined resolution paths. Net charge-offs were 13.8 million, or 23 basis points, annualized and were driven by two specific situations that had already been identified and actively managed. Net charge-offs also included a partial charge-off related to a hotel property that migrated to non-performing status in the first quarter of 25, and an office loan where the balance was adjusted to reflect an updated appraisal while the loan remains current and performing. We do not view these items as indicative of broader deterioration trend in any of our portfolios. Importantly, reserve levels remain solid. We increased reserves where appropriate in the areas that saw migration. Taken together, we do not expect this quarter's credit migration to disrupt our earnings trajectory. Our balance sheet remains strong with healthy capital and liquidity positions. We are also encouraged by the constructive backdrop from proposed regulatory changes around capital requirements, which if finalized substantially as proposed, could provide $150 to $160 million of additional CT1. That would create additional flexibility as we evaluate attractive capital deployment opportunities, including further optimizing our balance sheet to accelerate our earnings trajectory, supporting prudent balance sheet growth and returning capital to our shareholders. The $150 to $160 million is a baseline projection and could be higher under various scenarios. Overall, this was another strong quarter for Bank of California. We continue to build the company the right way with disciplined execution, a strong and resilient balance sheet, and a clear focus on sustainable growth and long-term shareholder value. Let me now turn it over to Joe for some additional financial details, and I'll return afterwards. Joe?
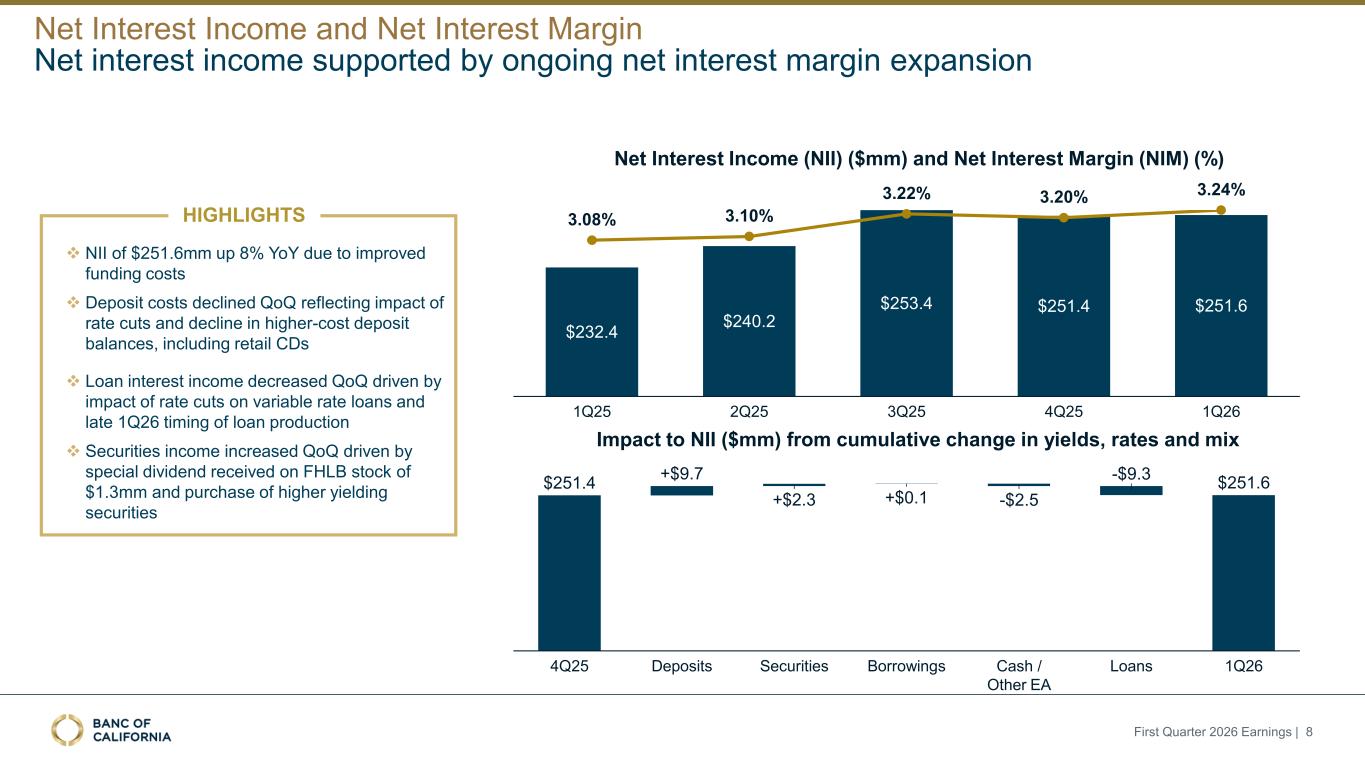
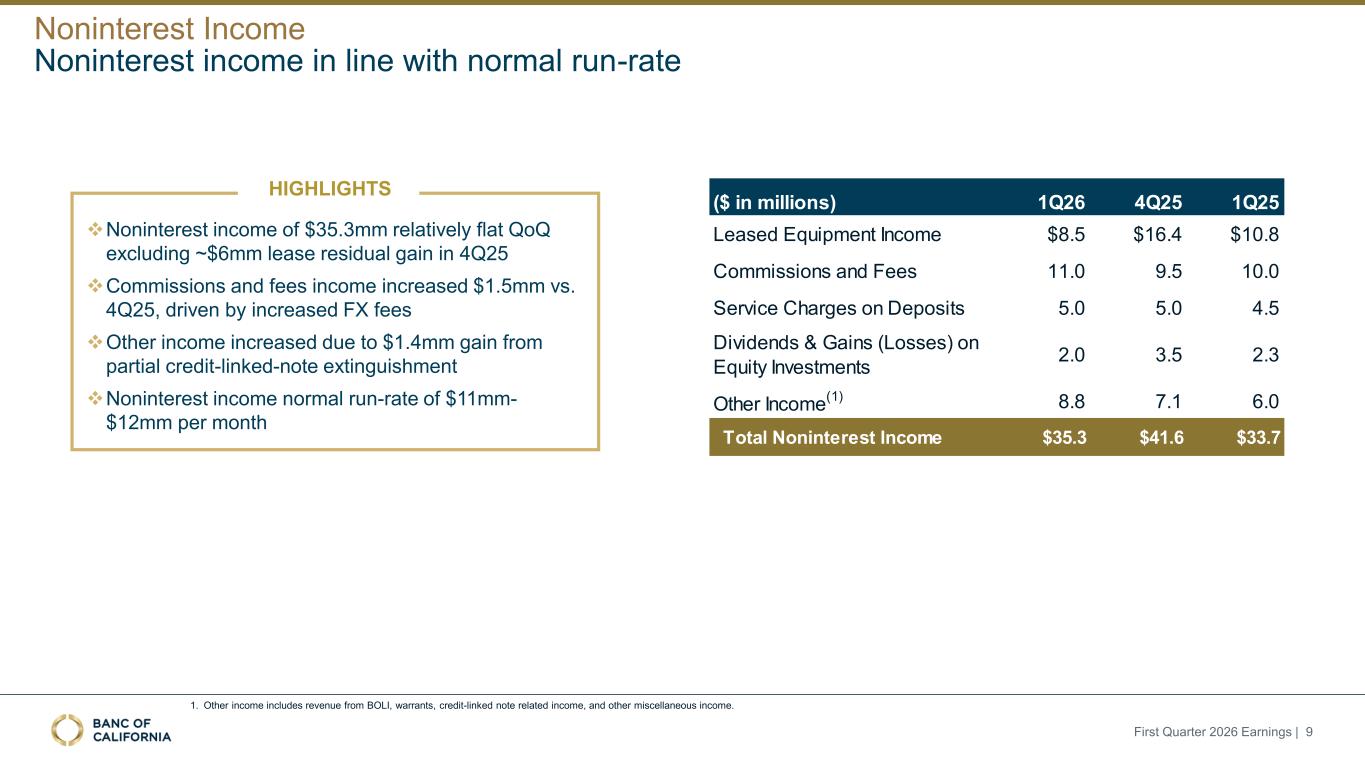
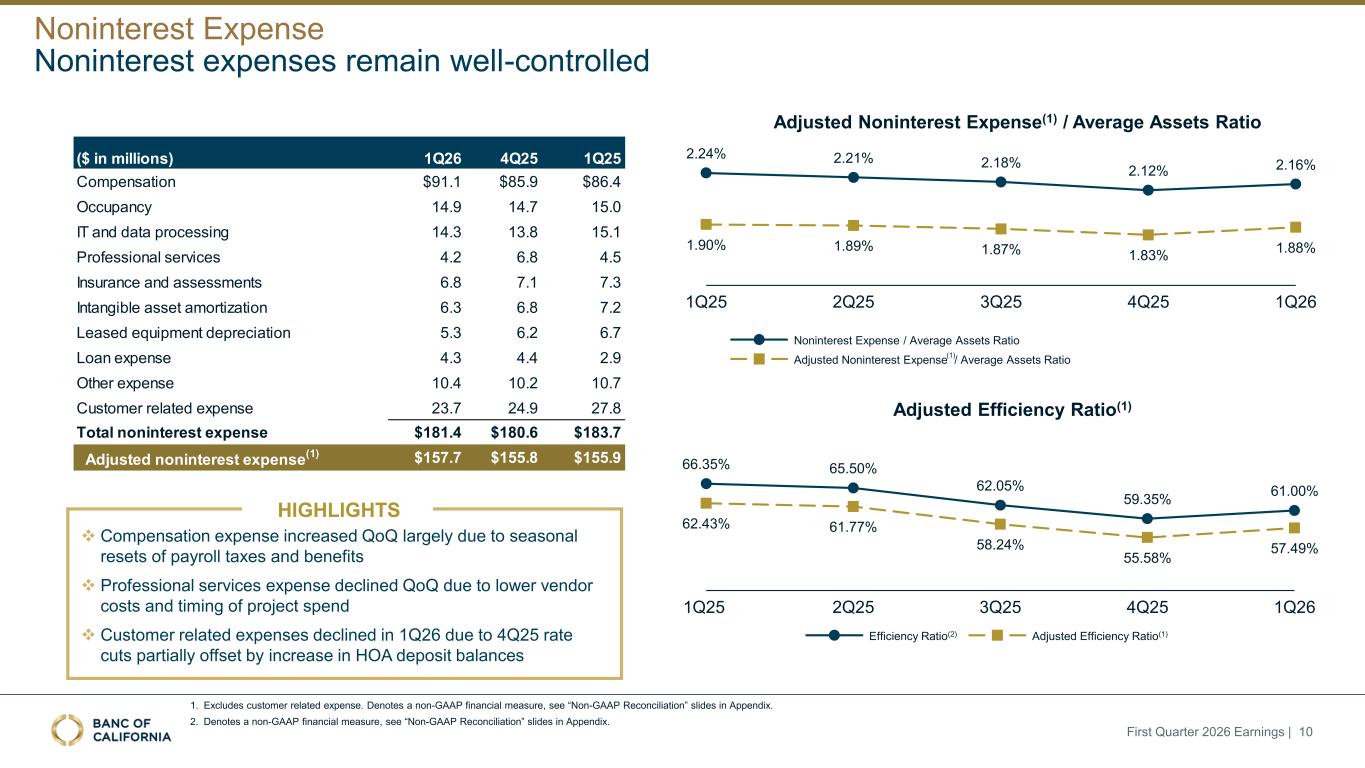
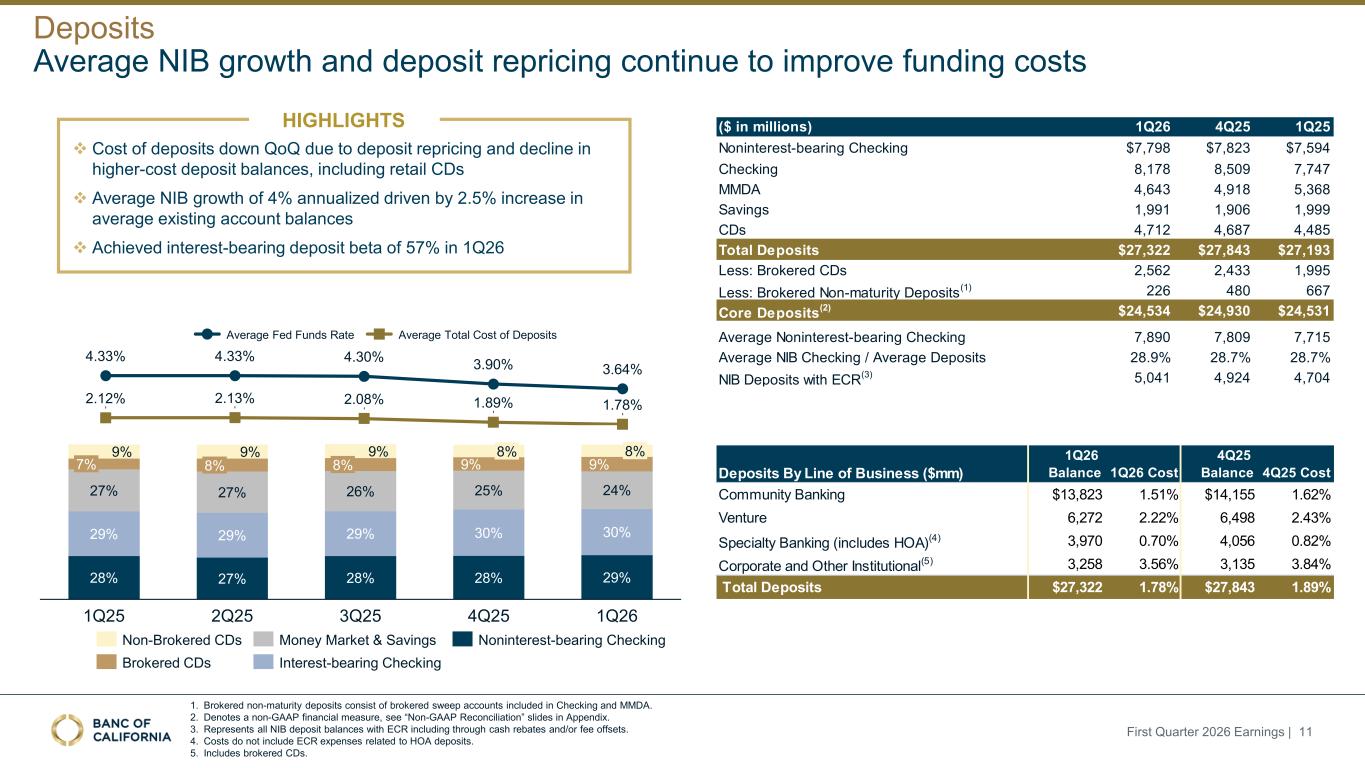
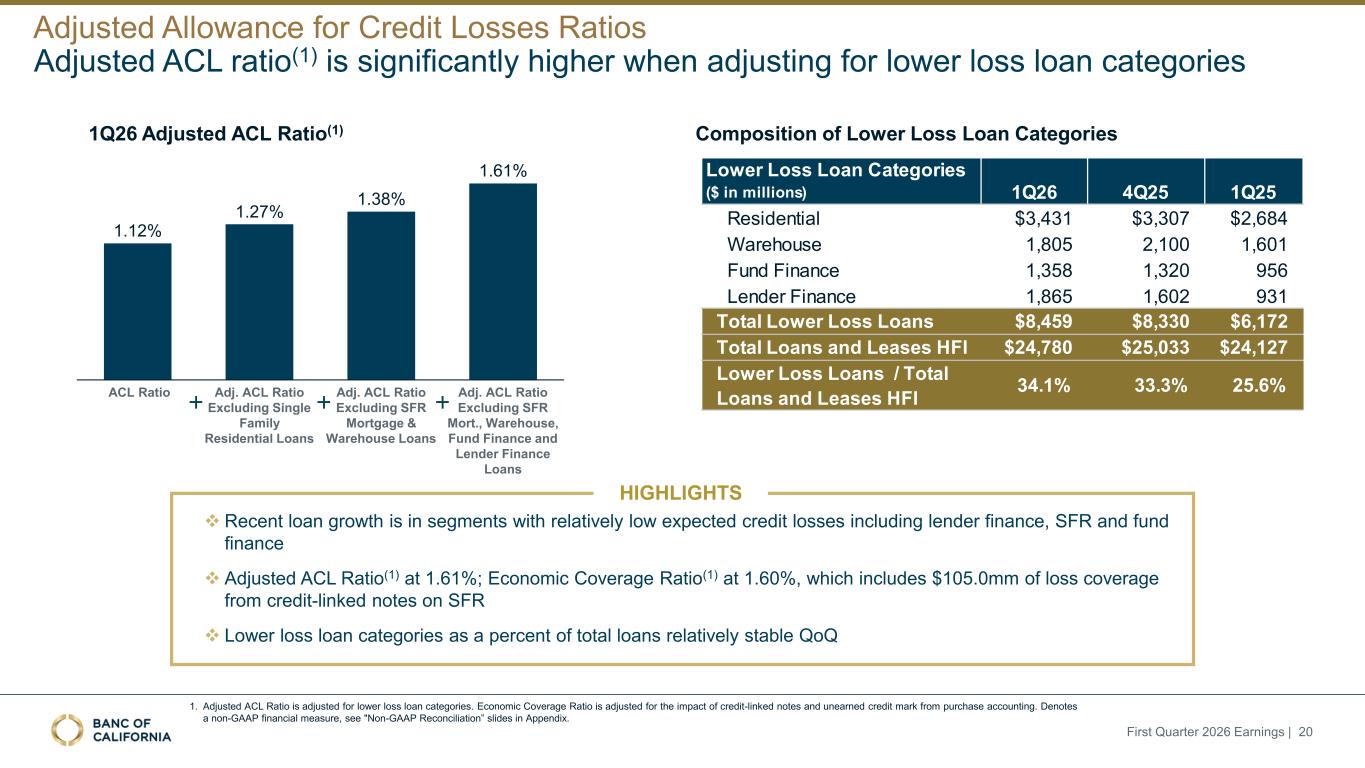
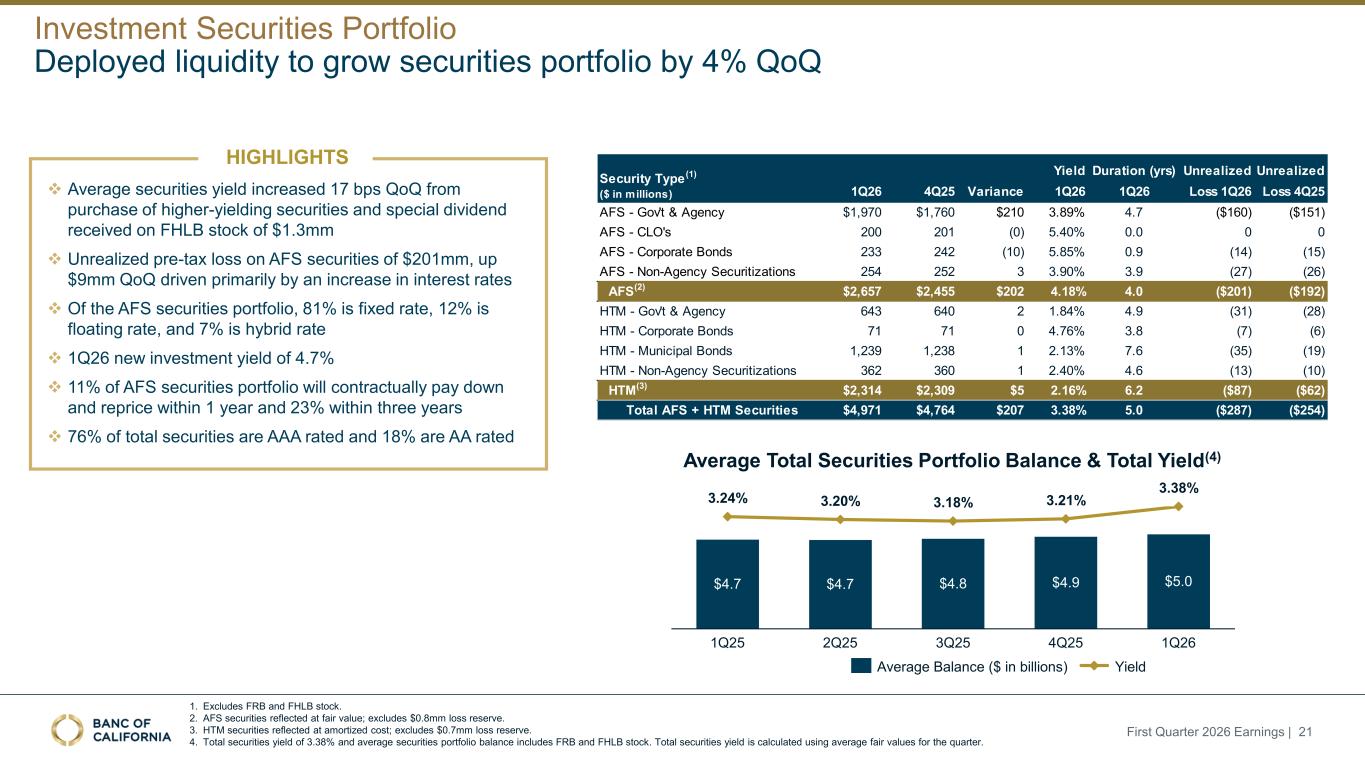
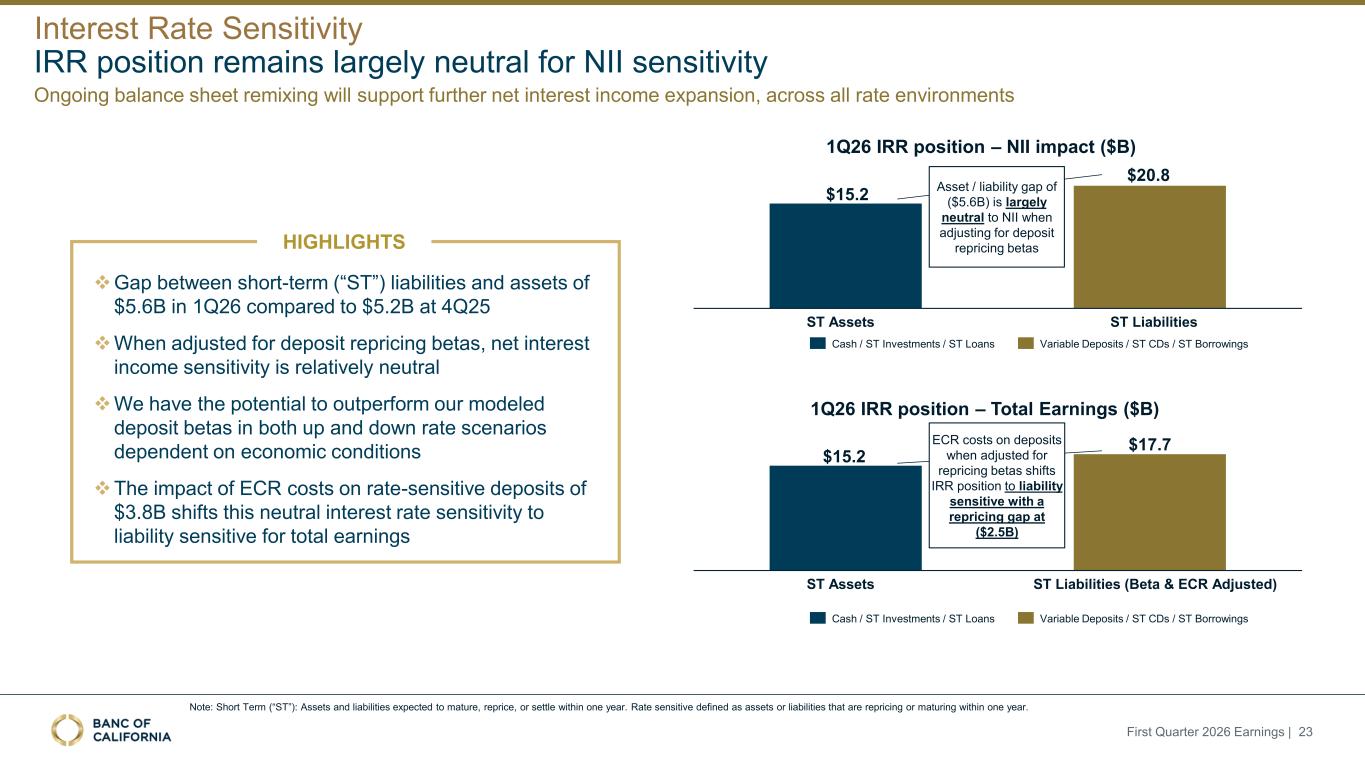
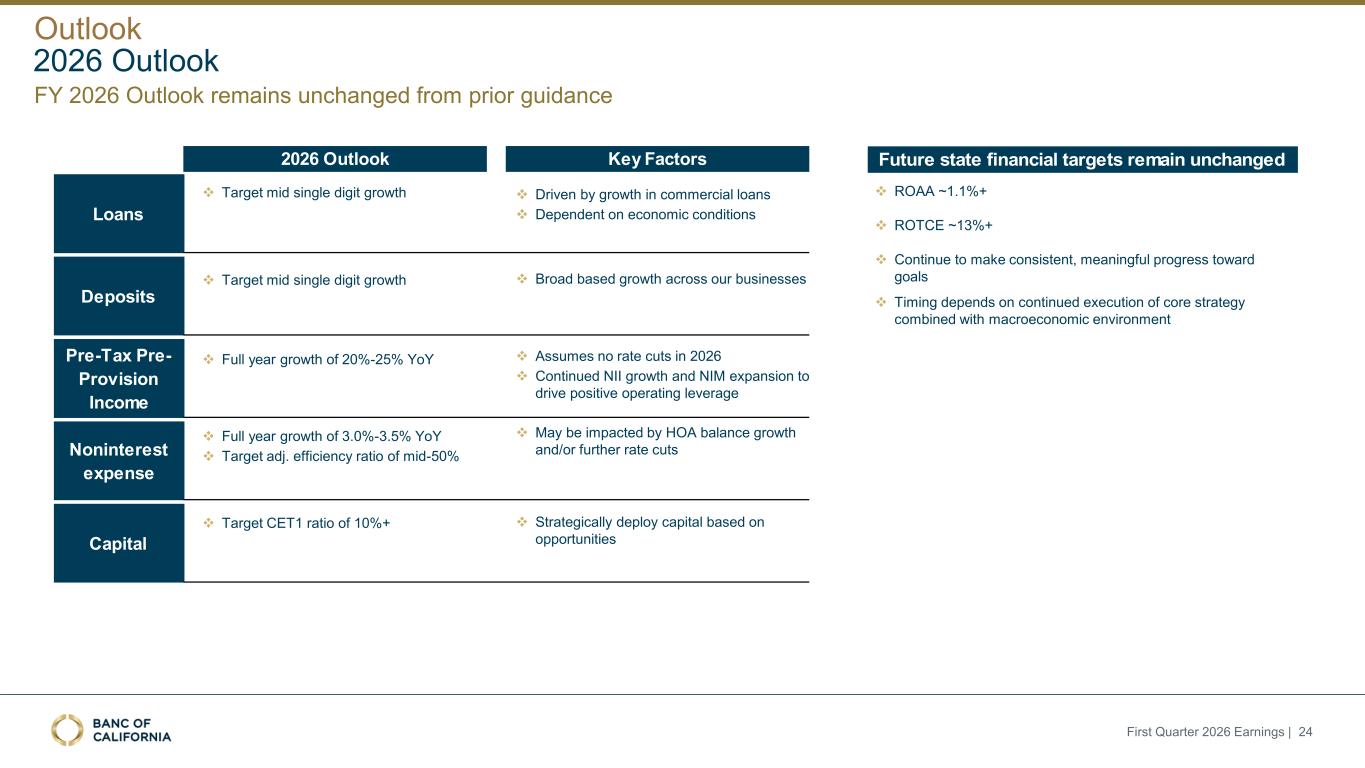
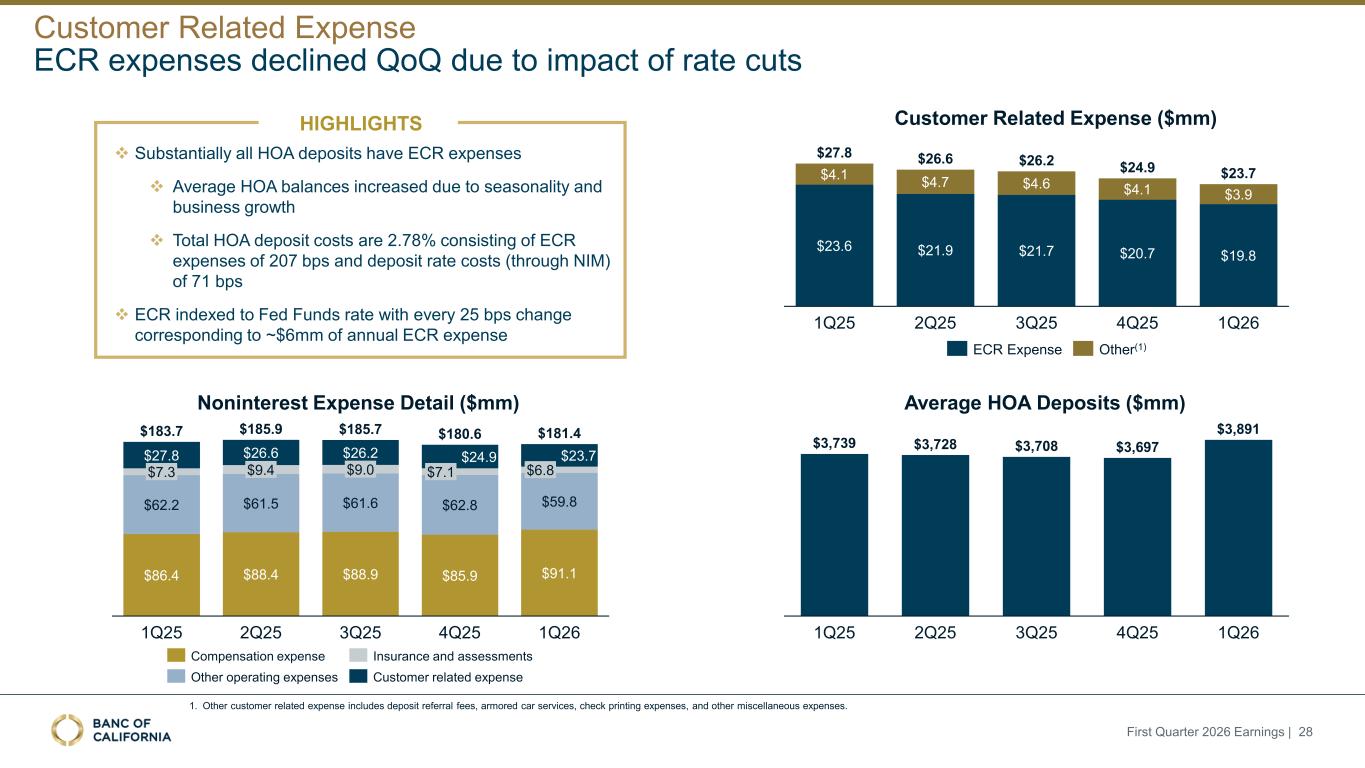
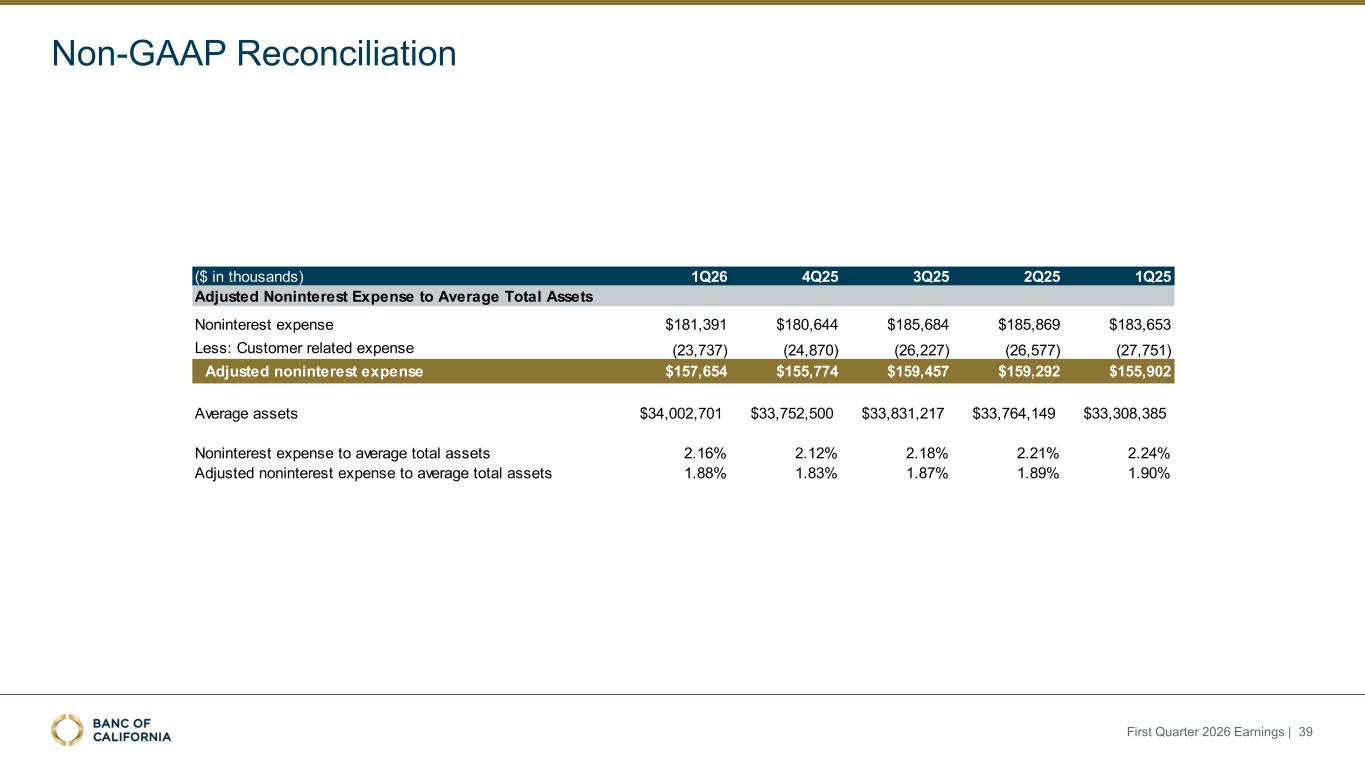
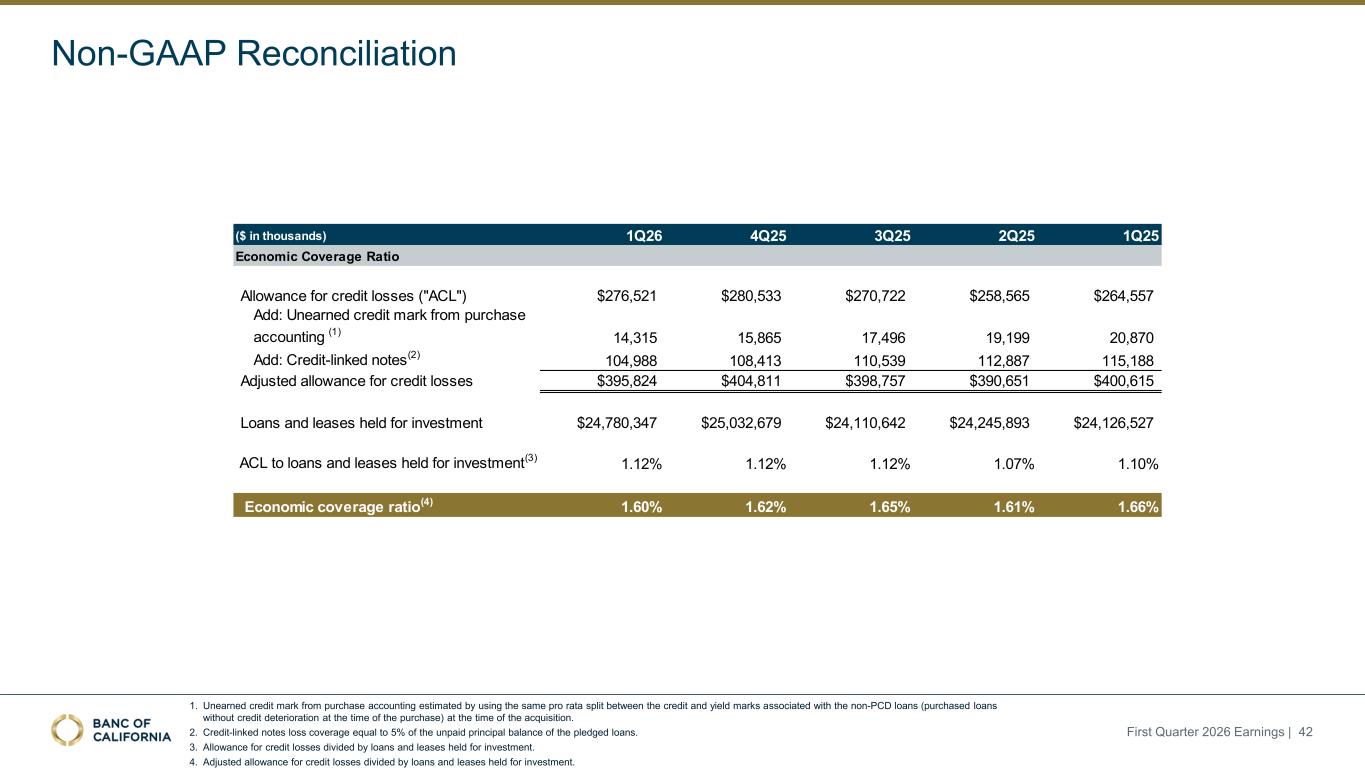
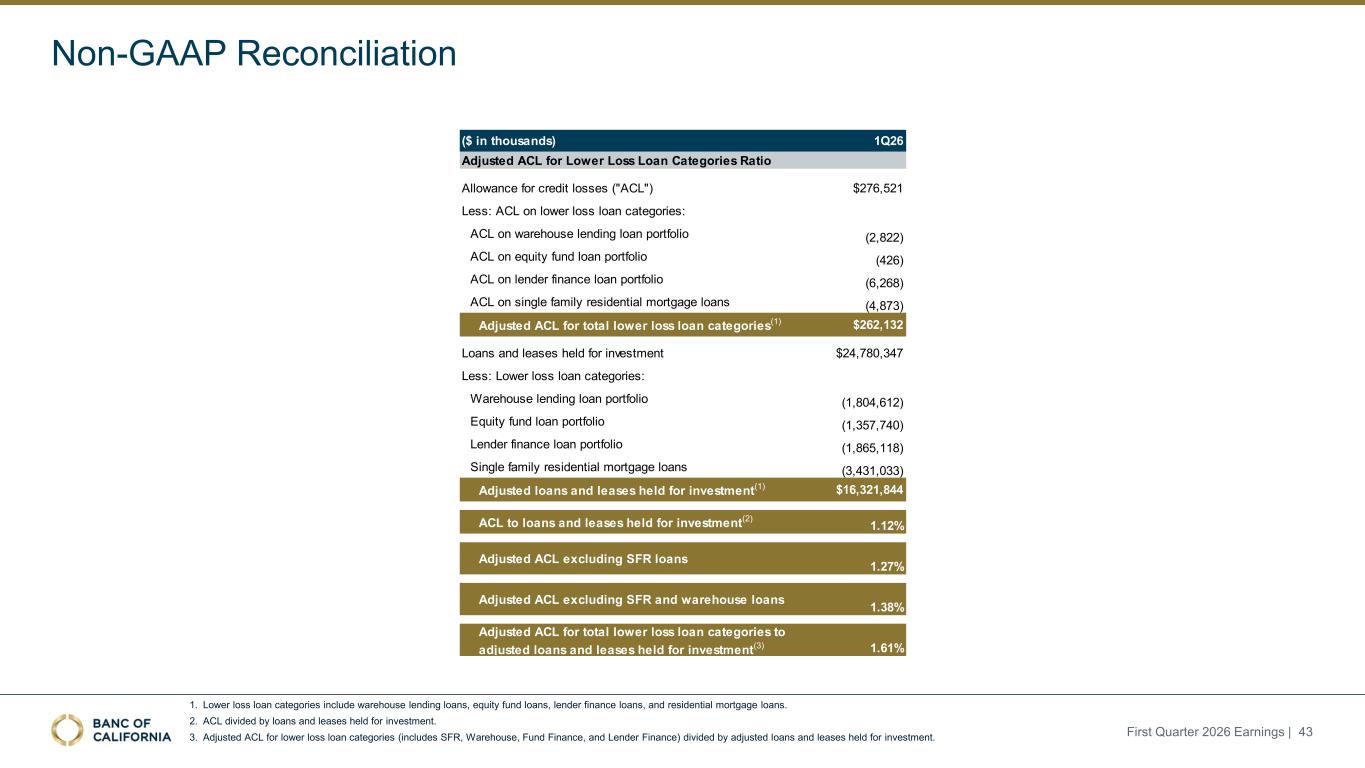
Thank you, Jared. For the quarter, we reported net income of $62 million, or 39 cents per diluted share, which was up 50% from 26 cents per diluted share in the comparable period, prior year period. Net interest income of $251.6 million increased 8% year over year and was relatively flat versus the prior quarter. The increase in net interest income from a year ago reflects materially improved funding costs, while the linked quarter variance was mainly due to two fewer days in Q1 versus Q4. Q1 interest income from securities also increased due to the purchase of high-yielding securities and a $1.3 million special dividend on FHLB stock. Net interest margin expanded to 3.24% of four basis points from Q4 and 16 basis points from a year ago, driven primarily by lower funding costs. Our spot NIM at March 31st was 3.22% after normalizing for the FHLB special dividend. We expect NIM to continue expanding through the remainder of the year supported by strong production, ongoing balance sheet remixing, and disciplined deposit pricing and mix. These tailwinds are evident in our portfolio today. As a result, we continue to expect average quarterly NIM expansion of three to four basis points, though the path may not be perfectly linear. As always, we do not assume any Fed rate cuts in our outlook. Average loan yield declined nine basis points to 5.74% versus the Q4 loan yield of 5.83% and was relatively flat to the December 31 spot yield of 5.75%. The Q1 loan yield reflects the full quarter impact of two Fed rate cuts on the rates for new production and on our floating rate loan portfolio, which represents 38% of total loans. Our spot loan yield at the end of Q1 remained stable at 5.75%. Total average loan balances increased 4% annualized. While Q1 loan production was strong, end-of-period loans declined modestly from the prior quarter, mainly due to higher payoffs and paydowns, which were primarily in warehouse, fund finance, and other CRE. We continue to expect full-year loan growth in mid-single digits, dependent on broader economic conditions. Deposit trends remain solid, with average non-interest-bearing deposits continuing to grow in the quarter and average core deposits, excluding one-way ICS deposit sales, also increasing modestly. We use one-way ICS sales to move deposits off balance sheet and manage excess liquidity. In the first quarter, average balances swept off balance sheet through one-way ICS sales were $271 million. End-of-period deposits declined slightly from the fourth quarter due to lower broker deposits and retail CD deposits. We continue to expect deposits to grow mid-single digits for the course of this year. Deposit cost declined 11 basis points to 1.78%, driven by the benefit of Q4 Fed rate cuts and the continued runoff of higher-cost deposits. We remained disciplined on pricing and achieved an interest-bearing deposit beta of 57% in the first quarter. Spot cost of deposits at March 31st was 1.78%. Our balance sheet remains positioned to perform well across rate environments and is largely neutral to changes in rates from a net interest income perspective. Sitting at neutral, we have the flexibility to manage our balance sheet to optimize results in any interest rate environment. For example, in a rising rate environment, we would expect to manage deposit betas to be more measured than in a down rate cycle, and the interest rate impact would be outpaced by the impact of interest income of the contractual repricing of our variable rate loans. At the same time, we expect ongoing balance sheet remixing to continue to support net interest income expansion across rate environments. Fixed rate and hybrid loan repricing or maturing by year-end have a weighted average coupon of 4.7%, well below current production rates, and approximately $3.2 billion of multifamily loans are expected to mature or reprice over the next two and a half years. That embedded repricing opportunity remains an important earnings tailwind. Non-interest income was $35.3 million, which was relatively flat quarter over quarter when excluding the $6 million least residual gain in the fourth quarter. Non-interest expense of $181.4 million was relatively flat from the prior quarter and down 1% from a year ago. Compensation expense increased linked quarter due to seasonality, which includes Q1 resets for payroll taxes and benefits. Customer-related expenses declined $1.1 million quarter-over-quarter due to the impact from Q4 rate cuts on ECR costs. The broader expense base remains well-controlled, and we continue to target positive operating leverage through revenue growth, margin expansion, and disciplined expense management. Turning to credit, reserve levels remain solid with the ACL ratio stable at 1.12% and the economic coverage ratio at 1.60%. Provisioned expense of $9.8 million reflects the Q1 migration and impact of other credit activity. While the Moody's updated economic forecast, which included a significant improvement in the CRE price index, would have supported a reserve release, we continue to maintain a more conservative outlook for purposes of our methodology and increase the weighting of adverse scenarios, offsetting that benefit. We continue to believe overall loan reserve levels are appropriate, particularly given the continued shift in growth towards historically lower loss categories, which now represent 34% of loans held for investment. We are pleased with the strong start to the year and the progress we are making in building the company's earnings power. As we look ahead to the rest of 2026, we are reaffirming our guidance for pre-tax, pre-provisioned income growth of 20 to 25 percent and non-interest expense growth of 3 to 3.5 percent. Our net drivers of earnings growth remain firmly in place, including continued loan portfolio remixing, discipline and expense management, healthy client activity, and further benefits from deposit repricing and mix. Taken together, those levers give us good visibility into continued earnings growth through the balance of the year. And with that, I will turn the call back over to Jared.
Thank you, Joe. This was another strong quarter for Banking California with continued progress in key areas, positive operating leverage, growth in our core earnings drivers, strong balance sheet fundamentals, discipline, expense, and credit management, and, of course, thoughtful capital deployment. The consistency of our results reflects the quality of the franchise we have built and the discipline with which our teams continue to execute. As we look ahead, we remain mindful of the uncertainty created by the conflict in the Middle East and the potential for second-order effects on growth, inflation, and client activity. That said, what we are seeing today across our business lines is very positive, with strong pipelines, a resilient client base, and a healthy balance sheet. Our teams continue to win relationships in all areas of our business, and we remain very optimistic with strong pipelines. Importantly, our outlook is supported primarily by company-specific levers already in motion, rather than by the need for a more favorable macro environment. We remain confident in the path ahead as our drivers of earnings growth are tangible, diversified, and already underway. We have a valuable deposit franchise, attractive business segments, strong pipelines, and a healthy balance sheet. We also have meaningful embedded earnings opportunities over time, including, as Joe mentioned, the runoff of approximately $8 billion of lower-yielding assets, the redemption of expensive capital, including our preferred stock, and the opportunity to further optimize the balance sheet as the regulatory backdrop improves. These levers provide additional flexibility to accelerate earnings growth and compound shareholder value. We are also making strong progress in deploying AI tools broadly across the company, with nearly universal employee access, robust co-pilot active user rate, broad developer adoption, and more than 80% of our developers using AI in their daily workflows. We see AI as a practical enabler of productivity, operating leverage, risk management, and scalable growth, and we are already seeing early signs of efficiency gains across code development, reporting, compliance support, and workflow automation. We also have a number of targeted use cases underway, including BSA review support and customer service applications. Over time, we expect these efforts to contribute to a more efficient operating model and improve client service. Our focus remains the same, to continue growing high-quality, consistent, and sustainable earnings by serving clients well, adding strong new relationships, maintaining disciplined underwriting and expense management, and further optimizing the balance sheet to drive long-term shareholder value. We like the momentum in the business. We see multiple embedded levers for future earnings growth, and we believe Bank of California is well-positioned for continued progress in 26 and beyond. I want to thank our employees for everything they are doing to move the company forward. Their execution, commitment, and focus continue to set us apart in all of our markets. With that, operator, let's open up the line for questions.
Operator
Thank you. We will now begin the question and answer session. To ask a question, you may press star than 1 on your telephone keypad. If you're using a speakerphone, please pick up your handset before pressing the keys. If at any time your question has been addressed and you would like to withdraw your question, please press star than two. At this time, we will pause momentarily to assemble our roster. The first question comes from David Ciaverini with Jeffries. Please go ahead.
Hi, thanks for taking the questions. Morning. Morning. So I wanted to start on credit quality. You touched on this a bit, but can you walk through what the plan is for working out the increases in special mention and non-performing loans you You mentioned about the two credits that were restructured with credit enhancements. Can you talk about what those enhancements were? Did these borrowers contribute more equity into their projects?
Yes, they contributed more equity in both cases in those loans that were downgraded. They brought more equity. We want to see as more time, and we want to see them work according to plan. We have every expectation that we will, but when we talk about being quick to downgrade and slow to upgrade, we don't immediately make a change to the rating just because they provided the credit enhancement. We want to see performance over time, and we expect that these projects will return to normalcy over time and be upgraded with, you know, improvement over several quarters. We also have visibility to other projects in those classifications that we expect to be upgraded, and so that's why over time we expect to see benefits not only from those projects but other projects in those categories.
Got it. Very helpful. And then shifting over to the net interest margin, it sounds like you have some good tailwinds in place, especially with, you know, the 665 production versus the 47 rolling off. The three to four basis points of quarterly expansion, how linear should that be? And remind us of the sensitivity to rate cuts to the extent we do get some rate cuts later this year.
Yeah, I'll start and then I'll let Joe jump in. So we sit today relatively neutral. And we believe, as Joe mentioned, we have the ability to pivot depending on the rate environment. You know, we've already seen that in a down rate environment, our net interest margin expands. In an up rate environment, we would expect to have deposit increases trail and go much more slowly. And we'd benefit from rising rates in our floating rate loan portfolio and new production. And so we would expect to benefit in a rising rate environment as well. And we think that those benefits would more than offset any sort of contribution that ECR would take in an upright environment, you know, in that case. Joe, do you want to comment specifically on how linear our NIMS should move?
So, you know, in theory, it should be pretty linear through the year. picking up as the year goes on, as we grow our balance sheet and as we add more higher-yielding loans and continue to manage our credit costs, the NIM improvement and benefit will expand as the year goes on.
David, what we don't have in there is accelerated accretion. And so we have these $8 billion of loans, which we know we're going to pay off or pay down at some point. And when that happens, we will get the accelerated accretion from the portion that was marked during the merger.
Operator
Thank you. The next question comes from Matthew Clark with Piper Sandler. Please go ahead.
Hey, good morning. Good morning. Just on the expense run rate, you're on pace to be flattish relative to last year, and you maintain the 3% to 3.5% growth guide, I guess. You know, what are the things coming online that we should think about that would cause that run rate to grow from here this year?
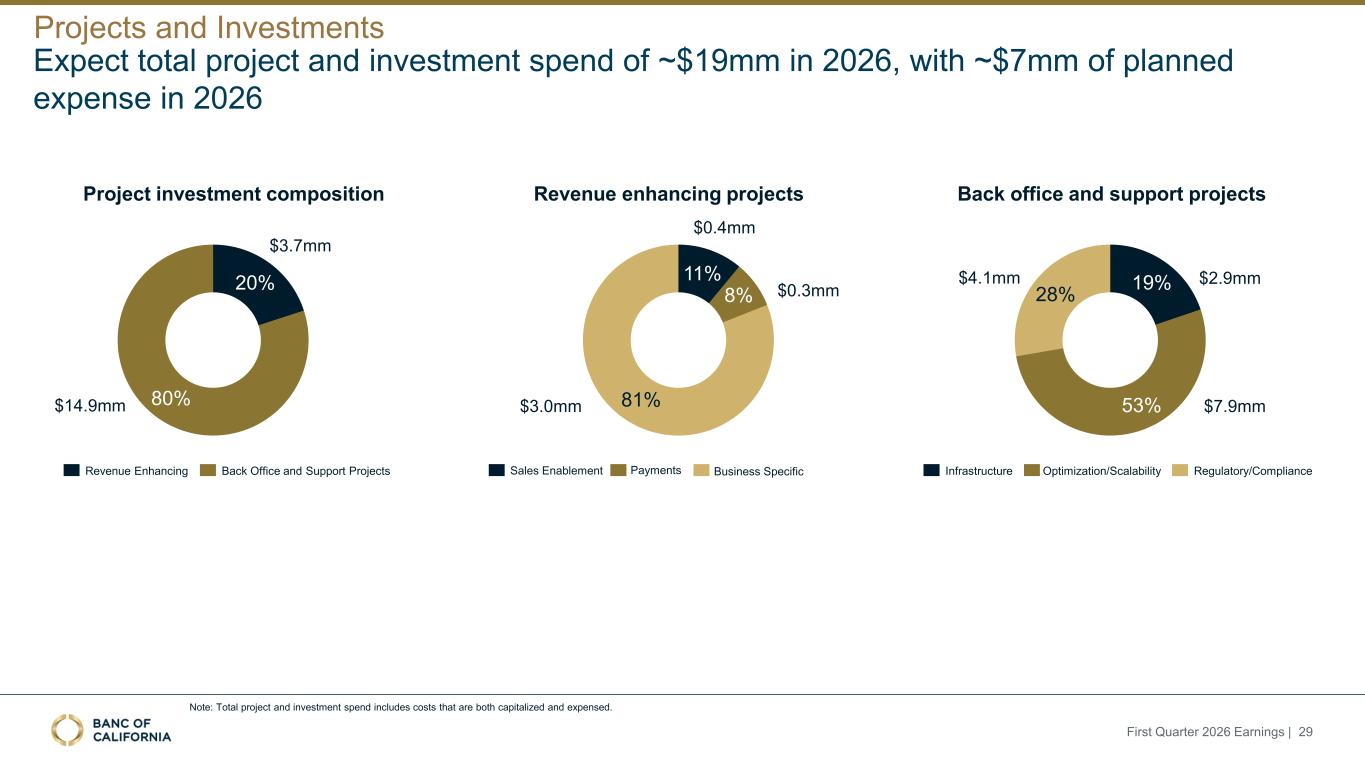
As we look into, you know, the next couple of quarters, you'll see a little bit of an increase, continued increase in compensation expense as, you know, the year-end inflation adjustments and those things kick in. They'll be somewhat mitigated by the, you know, the payroll taxes and the other benefit adjustments coming in. but they should step up just a little bit. And then also we're probably making some more investments in our platform, so you'll see a little bit of an increase potentially in some of the professional fees and other things as we move forward in some of our really important projects to grow earnings and help the balance sheet.
Matthew, I would just say on that that we're going to continue to be disciplined. I think it's normal to expect those increases through the year. if we find ways to offset them, we will do that just because we believe that we can keep finding efficiencies. I mean, this AI stuff is real, and we're seeing some early signs and some early wins. And so we won't lose the opportunity to manage expenses as we always have. Absolutely.
Okay. And then just on the ECR, deposit balances, understand the sensitivity to rate, but with no rate cuts this year, assuming there's no rate cuts, is there any effort to try to remix away from those deposits or try to incrementally push those costs down?
We're looking for ways to improve our deposit costs across the board. The biggest and most important way to do that is to bring in non-inspirating deposits that have no expectation of yield, that rely on our services. And we have a lot of efforts underway. We continue to make progress there. I'm really pleased with what our teams are doing. I see stories every day of clients coming to the bank, bringing more. I mean, I get really jazzed by the stories that my team shares with me. You know, even this morning hearing about a client that got acquired, and then the company that acquired them decided that they were going to keep all of the deposits at our bank because we were getting better service than – giving better service than they were, and they brought more deposits in. And, you know, then there was another story about a customer that had left after the merger to a large bank, wasn't getting the service that they expected, brought back $3 million in deposits. I mean, these stories are meaningful. And so the first thing we can do is bring back operating accounts and grow operating accounts. And we're doing it in a really, I think our teams are doing a great job. The second is to be very proactive on deposit costs, whether or not there are rate adjustments from Fed rate cuts or Fed rate increases and see how we can manage our deposit costs. As it relates to ECR, those contracts that we have generally come up annually. And when they come up, depending upon our deposit flexibility, we will negotiate with them to improve our positioning. And that's been the case the last two years as our deposit positioning has been better and we've been able to negotiate those accounts to our benefit.
Operator
The next question comes from David Feaster with Raymond James. Please go ahead.
Hey, good morning. Good morning. Um, Jared, I wanted to follow up on some of your commentary that you talked about on the capital side, just with the regulatory capital relief. Could you talk about what your top priorities might be at this point? Obviously, buybacks are extremely attractive, but curious whether there's any other capital deployment or optimization opportunities that you'd be considering or that are on the table.
Look, I think there's, we run a lot of different scenarios. And, you know, obviously buybacks are a big part of it, using it to redeem preferred, you know, things that we have in plans. We wouldn't need other funding sources if we did that. We would obviously look at our balance sheet and look at low-hanging fruit and look at things that are suboptimally priced and see what we could do with that and what the earnback might be. But, you know, the 150 to 160 million is, as I would say, a very conservative estimate of what we could achieve under these new rules. We're still doing the analysis, but the initial analysis, we had a third party look at it and they think we're going to get more than that. So I feel very good about that opportunity for us specifically. And there are a number of things that we could do.
OK, that's helpful. That's a nice windfall. um and maybe switching gears to the loan growth side i mean i appreciate that you guys reiterated the loan growth guide i wanted to dig in how do you get to your mid single digit pace of growth this year obviously warehouse is seasonally weaker but production was solid it was diversified this quarter i'm just kind of curious how do you think about production over the course of the year some of the key drivers behind that and you know how do you know ongoing payoffs and paydowns play to some of those expectations.
Yeah, so we put a new chart in the deck that I'm sure folks will focus on, which is on page 14. Excuse me, it's on page 15 that shows production and disbursements as well as paydowns and payoffs so that people could break down and see how heavy the production was and how broad-based it actually was and the average rate. And, you know, one of the best things about that chart is it shows that our weighted average rate on loans, since the first quarter of last year, despite the declining rate environment, has stayed flat, which is exactly what we talk about, that remixing our portfolio as deposit costs have dropped has resulted in our margin expansion and making more money on a flat balance sheet. And we know that that will continue to be true. So whether or not we have net growth or just remixing from our high production, we will continue to make more money. If we grow the balance sheet as well, we're going to make money faster. We're going to make earnings, we'll grow even faster than what we've projected. We have in our budget hitting our numbers with a balance sheet that doesn't need to grow as fast. And if we grow faster, we're going to make even more money. So we feel very confident about that. You know, we have line of sight into kind of what the payoffs were and where they are. And we think that they were elevated and historically, by historical means, they were in the first quarter. Whether they remain elevated is kind of hard to know, but right now it looks like production is going to outpace payoffs and paydowns for the foreseeable future, and we hope that's the case. There are certain loan pools that we can buy to improve the balance sheet if we think it's necessary. But overall, we still expect mid-single-digit loan growth. It's just one quarter. This happened last year as well, where we had lower production early on or in certain quarters, but we still ended up pretty much at our targets. And so it's too early to say that we're not going to hit our targets based on everything we see. But even if, for example, we had lower net growth, by our estimates, we still hit our earnings targets based on our ability to remix the balance sheet. And that's why we put it in there, because we think the power of that is pretty important.
Operator
The next question comes from Jared Shaw with Barclays. Please go ahead.
Hey, everybody. Thanks. Hey, I guess just sticking with that, you know, when we look at the production numbers staying, you know, relatively stable down a little bit, but relatively stable, what would have to happen to really see that grow? You know, Jared, you've spoken about the strength of the economies that you're working in and the competitive disruption that's happened. You know, I guess why not? What's keeping that production from really growing more?
Well, I mean, the production is, I think, first quarter is generally a little bit lower. So we were 2.1 versus 2.2 last year. In the fourth quarter, we were 2.7 billion. Those are pretty good numbers on a loan portfolio that's, you know, $24 billion to grow $8 billion of production on a $24 billion loan portfolio. Are there things that we could move faster? We probably could, but I, you know, and I think we could ask various of our business units to increase sizes and to take larger positions and make more capital available. But we really believe that it's necessary to grow in balance. And, you know, we look at deposit flows. We look at our balance sheet overall. We are obviously at a loan to deposit ratio, which is very comfortable. We can move that up. But I'm not looking to necessarily just grow as fast as we can. And we're looking to do it in a very sustainable, reliable way so that earnings are repeatable and that they are consistent, reliable, high-quality earnings. So I guess, Jared, I would say that we could move faster. It feels like we're at a pretty good pace right now, and we're moving a little bit faster than the economy around us, and it feels like a good pace.
Okay. All right. Thanks. And then on the $8 billion of sort of identified target runoff, how long does that take to move through the system?
So we have $6 billion of multifamily loans that will reprice or mature. Half of those $6 billion mature or reprice in the next two and a half years. That's the bulk of it. And so we have a chart on page 16 of our deck that kind of walks through the repricing of those loans. But there are some pretty big groups of multifamily loans that mature reprice. You know, less than one year is $1.7 billion, and then $1.1 billion is one to two years. And then there's a big chunk that's more than three years, that's $2.3 billion. So we see $2.8 billion in the next one and a half to two years, and then there's about a billion that's the next two to three years. That's how you get to the 3.2 over two and a half years.
Yeah. Okay. All right. Good. And then on the deposit side, how have flows been sort of early in second quarter? I mean, I know there's obviously a lot of seasonality with some of the first quarter flows, but looking at end-of-period versus average. Any color there?
Yeah, we're up this quarter relative to last quarter at the same time, so inflows have been higher early in this quarter relative to last quarter, and last quarter our averages were pretty up. End of the first quarter, oftentimes in the first quarter things come out for taxes and things like that. I didn't really think that much about it. our averages are what moved the balance sheet and it felt like we had a really good quarter but so far we're up higher this quarter than last quarter at this point in time.
If I could squeeze one more in the allowance ratio you talked about utilizing more of the adverse scenario to prevent more reserve releases with the loan book the way it is right now is 96 basis points are a good level to, you know, assuming that there's no broader economic backdrop change? Is that a good level to expect for the rest of the year?
Yeah, I think so. Our ACL is 1.12 and, you know, our economic coverage is about 160. And I think that that feels very comfortable. That assumes we continue provisioning around this level that we did this quarter, you know, nine, nine and a half. And I guess, depending on production, could get up to 10 or 11, but it feels like it's the right level.
Operator
The next question comes from Andrew Terrell with Stevens. Please go ahead.
Hey, good morning. I want to ask a question on the brokered time deposits. It looks like, you know, over the past year, those are up 500 million or so. And just curious, I hear some of your comments about early kind of 2Q flows on the deposits. But just as we think about mid-single-digit deposit growth for this year, Should we expect more broker deposit addition throughout the year to support that growth? Or do you think there's, you know, on the other side, opportunity to kind of remix the broker position this year?
Well, I'll let Joe go into detail on it. But my initial answer is that we focus on overall deposit costs and keep brokered within a band. And we will opportunistically use it, especially when we see that we have paydowns coming in certain areas. We have big chunks of deposits that are running off, and we will selectively go into the brokered market when we find that it's got better pricing than some other things that we might be seeing relative to deposits that are coming off. So we continue to move our cost of deposits down, and so we don't mind selectively using brokered. Joe, do you have more detail on that?
Yeah, so we were at – our brokered was 9.3% of total fundings this quarter compared to 9.7% in the fourth quarter. pretty flat when I look at it year over year. You know, the other thing I would say is brokered is also, it depends a little bit on loan growth. So if we do see some of the pickup in loan growth and it accelerates, we're able to put really good high quality loans on the books. I mean, we do need to keep it in balance with deposits, but sometimes we're not afraid to dip into brokered a little bit to, you know, to help put those loans on our balance sheet, knowing that deposits are going to catch up.
Yeah, we actually, to that point, I mean, we saw that loans were coming in late and we saw average balances moving down. And we said, okay, let's grab some, let's keep our loan deposit ratio in balance and let's grab some brokered. And that way we can make sure that we keep things in balance. And if we have access, we'll just invest it. And so just kind of, I think our team is pretty good at balance sheet management. We can let our loan deposit ratio float up as well if we want to.
Yep. Yep. Makes sense. I know you've got some term on the borrowing side, but is there any term in the broker deposit portfolio? Is it all shorter floating rate?
We have... Go ahead, Joe.
I was just going to say, we do a little bit of term. It's mostly... It's largely... Let's put this way, it's all less than a year, but it's largely within three to six months, and then there's a little bit of it that goes out a little bit further, so nine months or 12 months.
Okay, great. Thanks for taking the questions.
Operator
Thank you. The next question comes from Chris McGrady with KBW. Please go ahead.
Jared, on the credit, I mean, you guys went through a similar – I'm interested in kind of the comparison when you made some portfolio downgrades last year where you ultimately worked things through. What's different or similar this year as you kind of go through this process?
So it's pretty similar in that, you know, at various times, first of all, these are some larger legacy relationships where we are trying to migrate them down to more manageable levels. Similar to last year, we migrated this. It did not get in the way of earnings, and we just continued to earn through it, and gradually our ratio has improved. You know, is this the last chunk of it? Probably. It's pretty close. I mean, you never say never because something else pops up the moment you say that. But I feel pretty good about where we are, and it was just time to kind of move stuff around. You know, you have conversations and relationships, and you say, look, we don't want these relationships to be this large anymore. We'd like you to move these things faster. That was the case in a couple of the loans. In some of the other loans, I think they just didn't manage it well. And we were watching them, and we kind of held their feet to the fire and said, look, you guys need to do this differently, and we're going to hold you to it. And as we mentioned, we've got personal guarantees and plenty of support, and these LIHTC loans are very valuable loans, and they're really good projects in their housing that's sorely needed and there are tax benefits to it. And so I'm not worried about the outcome, but sometimes this is just the right thing to do. And so I would say there's similarities to how we did it last year in that we expect the ratios to migrate better over several quarters, their large relationships, and I think we just kind of set expectations a little bit more aggressively than maybe they had been set in the past for the borrowers.
Okay. Thanks for that. And then maybe could you speak, while we're talking about credit, could you just speak about the Legacy Square One book from PacWest? Obviously, software is a big topic, but just remind us overall the makeup of the book. I know it changed over the years when you were independent, but just how you're viewing about tech.
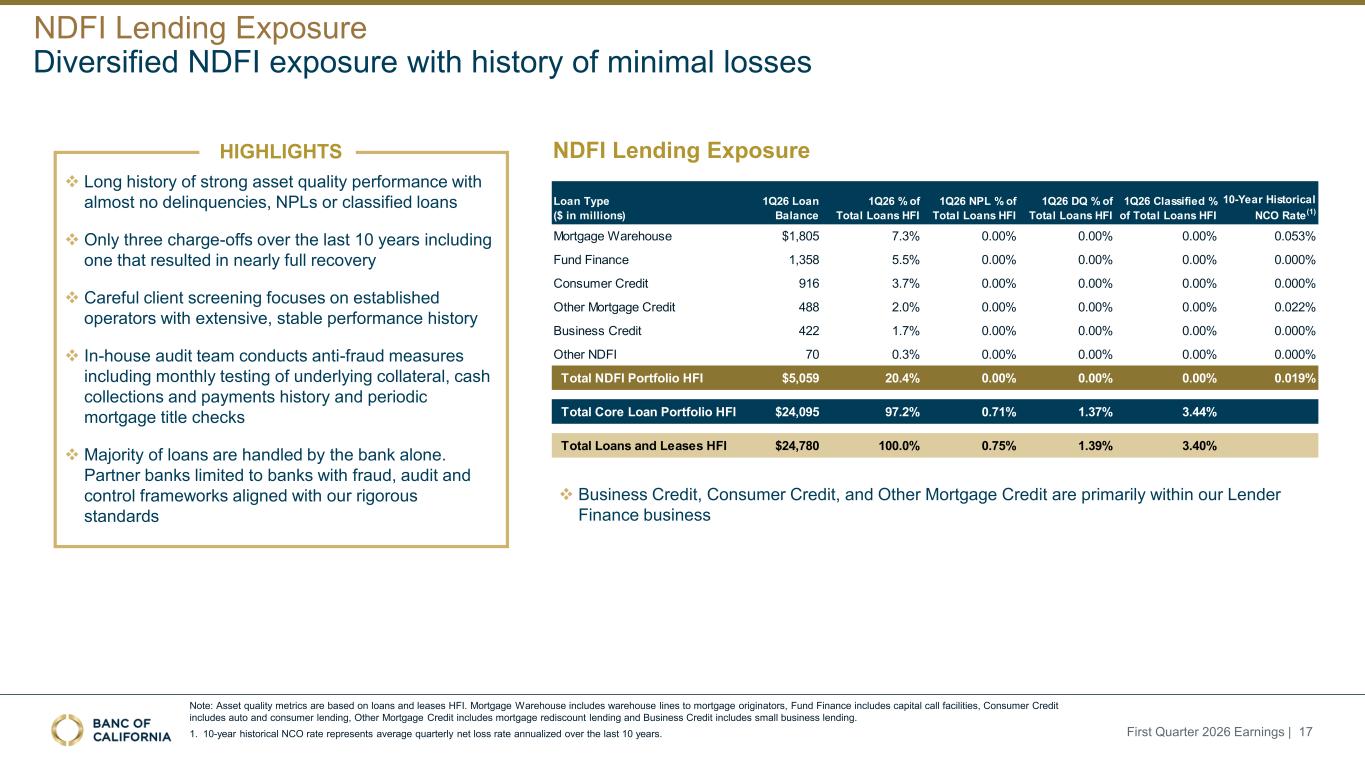
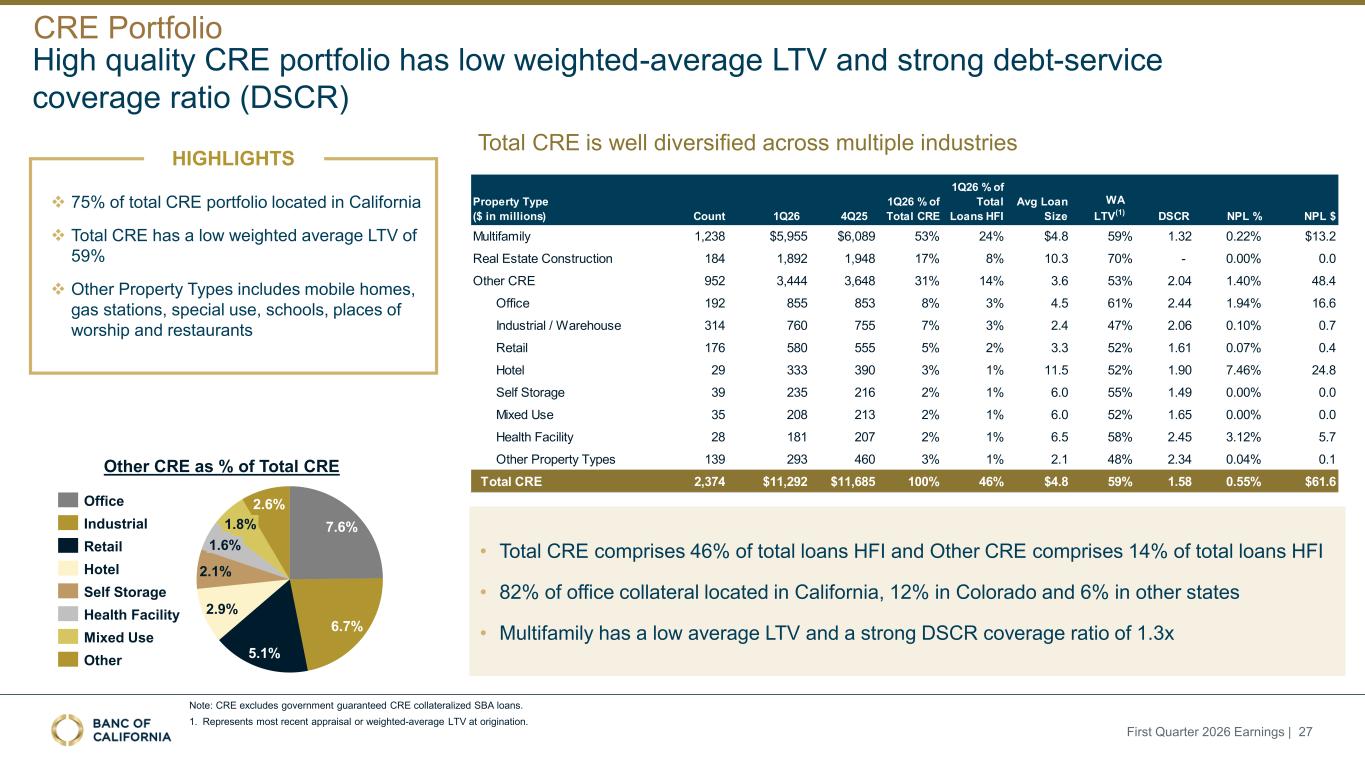
So here's the – our venture ecosystem generally, which is outlined in our deck, is – because the whole square one was more than just, quote, text. So I think it's important to kind of lay out what everything is. So we have fund finance, which is capital call lines are credit to private equity and venture capital firms. That's approximately $1.4 billion, and its deposits is about the same amount. okay so 1.4 billion of deposits and 1.4 billion of loans those are fund finance the rest of our venture and square one ecosystem is a little about 950 million of loans split evenly between fund finance excuse me split evenly between tech and life sciences so call it 450 or 475 of tech and 475 of life sciences and they have 5 billion of deposits against that 900 950 million of loans Of the 450 in tech, we did an analysis of where we thought software might be disrupted by AI or any of our tech clients might be disrupted by AI in a negative way such that their business model was disrupted or, you know, their funding potential was disrupted. And we ran this a couple different ways, and we came up with a handful of loans and a little over $4 million of outstanding loans that we thought were, you know, kind of on the watch list, on the high-risk watch list. That's it. So I would say that, you know, while we keep monitoring this and we have to keep looking at it, it's not something that we see as something that is materially disrupting our portfolio today, although we're going to continue watching it. But it's important to remember, out of our $24 billion of loans, that tech group is $450 million, $475 million, of which a small portion would be, you know, attached to what people think about as software that could be disrupted, and $5 billion of deposits between tech and life sciences.
That's a great call. Thank you.
Operator
Thank you. The next question comes from Gary Tenner with DA Davidson. Please go ahead.
Thanks. Good morning. I had a follow-up on the NIMH question, Joe. You had mentioned the kind of pace of NIMH expansion over the course of the year. I'm just wondering, is that expansion and your projections pretty exclusively driven by the asset side and the yield side, or is there any material contribution from further reduction in funding costs over the course of the year?
I would say that there's a combination of both. There's definitely benefit from loans continuing to grow. But as we, you know, we have deposit growth in conjunction with our loan growth. And then, you know, that deposit growth is hopefully, you know, we focus, we really focus on bringing in non-interest-bearing deposits. It's our life's blood, and we continue to try to grow that. And every time, you know, there's few things we can do that's more profitable to us than grow a non-interest-bearing, you know, add a non-interest-bearing deposit. So as that, you know, you saw the NIB percentage grow slightly this quarter, we expect that to continue to hopefully grow towards this year. And as our mix of our deposits grows to, you know, be more heavily weighted towards the NIB and other lower cost interest bearing, we expect to pick up a little bit of an in from that as well as from the loan growth.
Gary, I think this quarter, you know, it was mostly, Gary, I think this quarter we saw more contribution from, you know, the full-quarter benefit of deposit cost reduction from the Fed cuts in the fourth quarter. But, you know, the fact that our loan portfolio loan yield is flat and declining rate environment is pretty powerful. And so, you know, I think in an uptick environment, you'd see a lot more from the loan yield, and I think in a downtick environment, you'd see a lot more from the deposit side.
Yeah, no, that all makes sense. I mean, just thinking about a prospective neutral environment, perhaps for the rest of the year, kind of just trying to get a sense of room on one side versus the other.
Yeah, I think in a neutral environment, you know, it's a lot of it, to your point, is probably probably loan based because the loans we're putting on are such such higher rate than the loans coming off. So I think that's probably a fair way to think about it. Yep.
Yep. Makes sense. And I just wanted to ask if you have any other thoughts you could share on the BankEdge product, having brought on Chris Healy a couple months ago to kind of head that business.
Yeah, Yeah, thanks for asking. Chris is doing a great job with the team, and I'm actually getting an updated budget this week where we're looking at kind of the expectations for our BankEdge, which is our merchant acquiring platform, as well as our card products where we're issuing. And both are doing extremely well. We expect the back half of the year to provide more guidance on how we think these things will contribute going forward. But I'm really pleased with our focus here, and I think Chris is going to bring some ideas to the bank that he brought to his prior institution about how they accelerated growth on both the card side and the merchant acquiring side through partnerships and direct selling, and so more to come on that. Thank you.
Operator
The next question comes from Anthony Elion and J.P. Morgan. Please go ahead.
Hi, everyone. On NII last quarter, you gave us a range of up 10% to 12% for the full year, including accretion. Does that still feel like the right level, and can you talk about the cadence of NII over the course of this year?
Yes. We're still feeling pretty comfortable about all of our guidance we provided at the end of 25, which we'll see as loans pick up. And as, you know, we definitely, you know, Jerry's already mentioned, we do have some seasonality. The first quarter is usually, you know, it's historically been one of our weaker quarters. It usually picks up a bit in the second quarter and continues throughout the year. So we still feel pretty confident about those numbers and that those will be coming in.
And then on comp expense, Joe, can you quantify how much the seasonal resets contributed to 1Q and how much of that you expect to come out of 2Q and going forward? Thank you.
Well, I think you can just look at it on the non-interest expense page, and you can just see that the amount of the compensation increase from the fourth quarter to the first quarter, that's substantially all driven by the resets. And I'm sorry, what was the second part of the question?
I think you answered it, just how much is expected to come out.
Well, not all of it will come out. So, you know, over the year, you know, maybe half to two-thirds of it, they've come out. Those increases come out. Of course, as people hit their Social Security limits or they hit their 401K match limits, those will roll off.
Operator
This concludes our question and answer session and Bank of California's first quarter 2026 earnings conference call. Thank you for attending today's presentation. You may now disconnect.