Operator
Good morning. My name is Jen and I will be your conference facilitator today. At this time, I'd like to welcome everyone to the BlackRock Incorporated First Quarter 2026 Earnings Teleconference. Our host for today's call will be Chairman and Chief Executive Officer Lawrence D. Fink, Chief Financial Officer Martin S. Small, President Robert S. Capito, and General Counsel Christopher J. Mead. All lines have been placed on mute to prevent any background noise after the speaker's remarks there will be a question and answer period if you'd like to ask a question during this time simply press star then the number one on your telephone keypad if you'd like to withdraw your question please press star two thank you mr mead you may begin your conference good morning everyone i'm chris mead the general counsel of blackrock before we begin i'd like to remind you that during the course of this call we may make a number of forward-looking statements.
We call your attention to the fact that BlackRock's actual results may of course differ from these statements. As you know, BlackRock has filed reports with the FCC which list some of the factors that may cause the results of BlackRock to differ materially from what we say today. BlackRock assumes no duty and does not undertake to update any forward-looking statements. So with that, I'll turn it over to Martin.
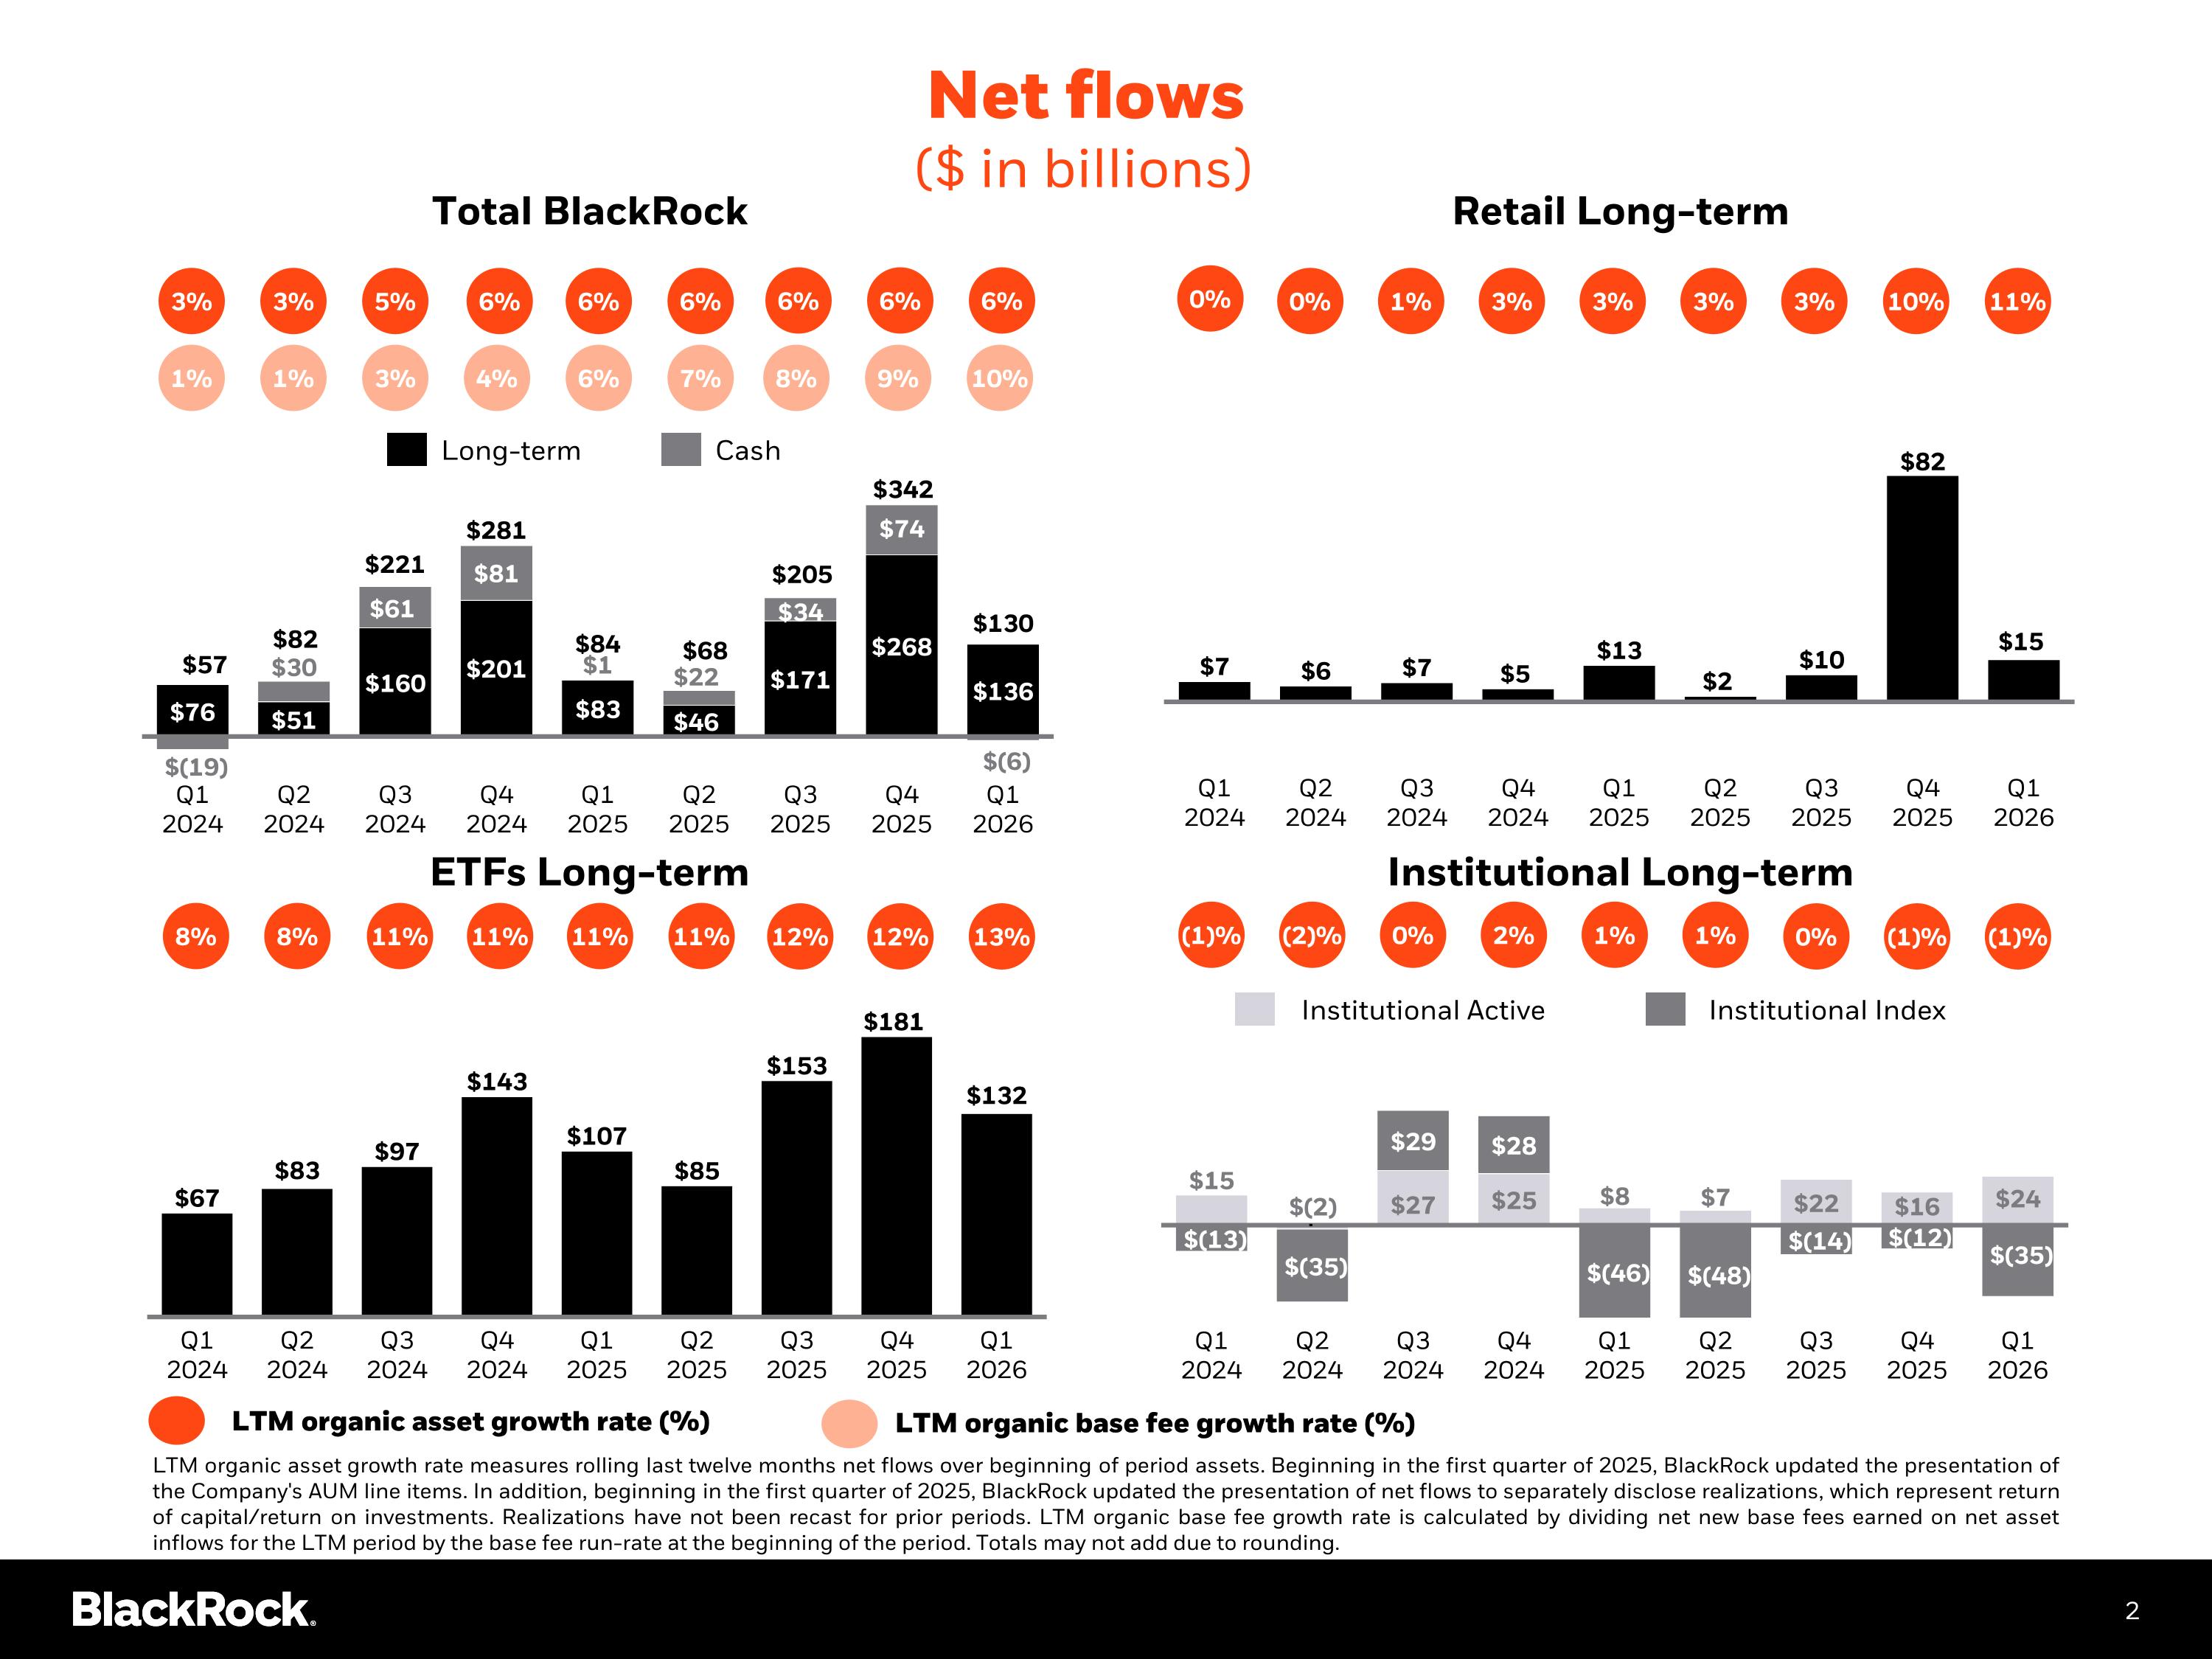
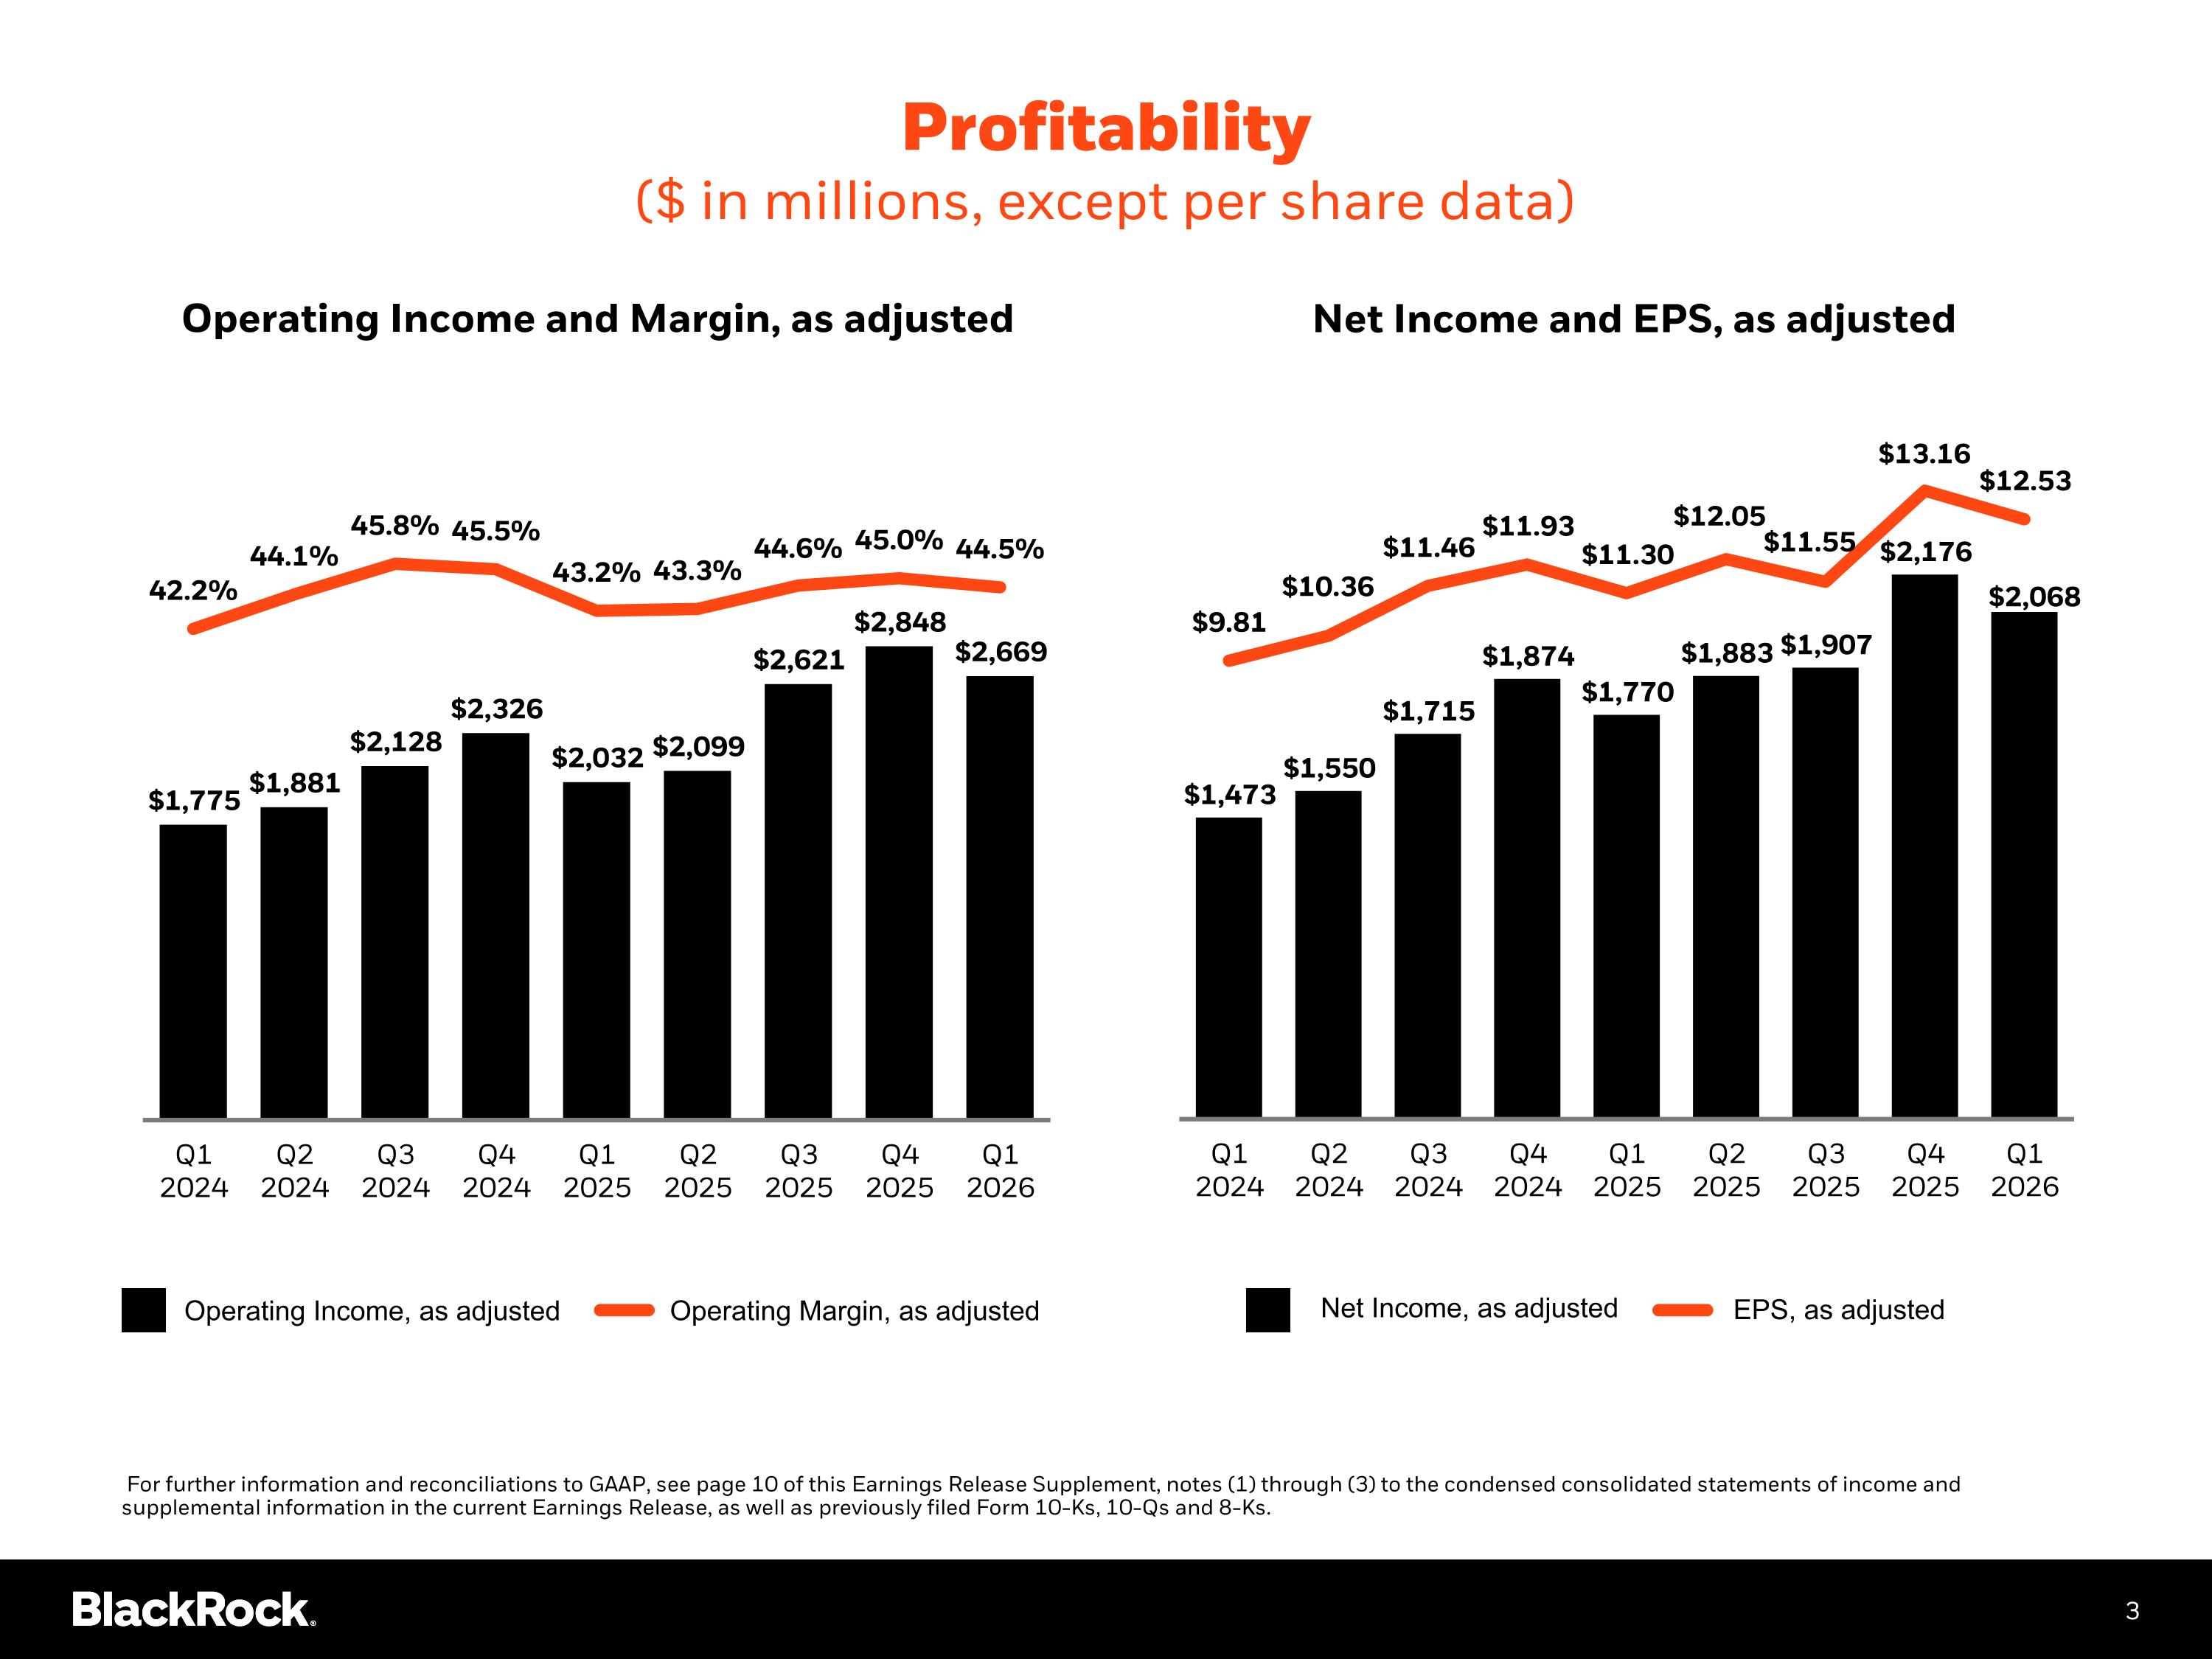
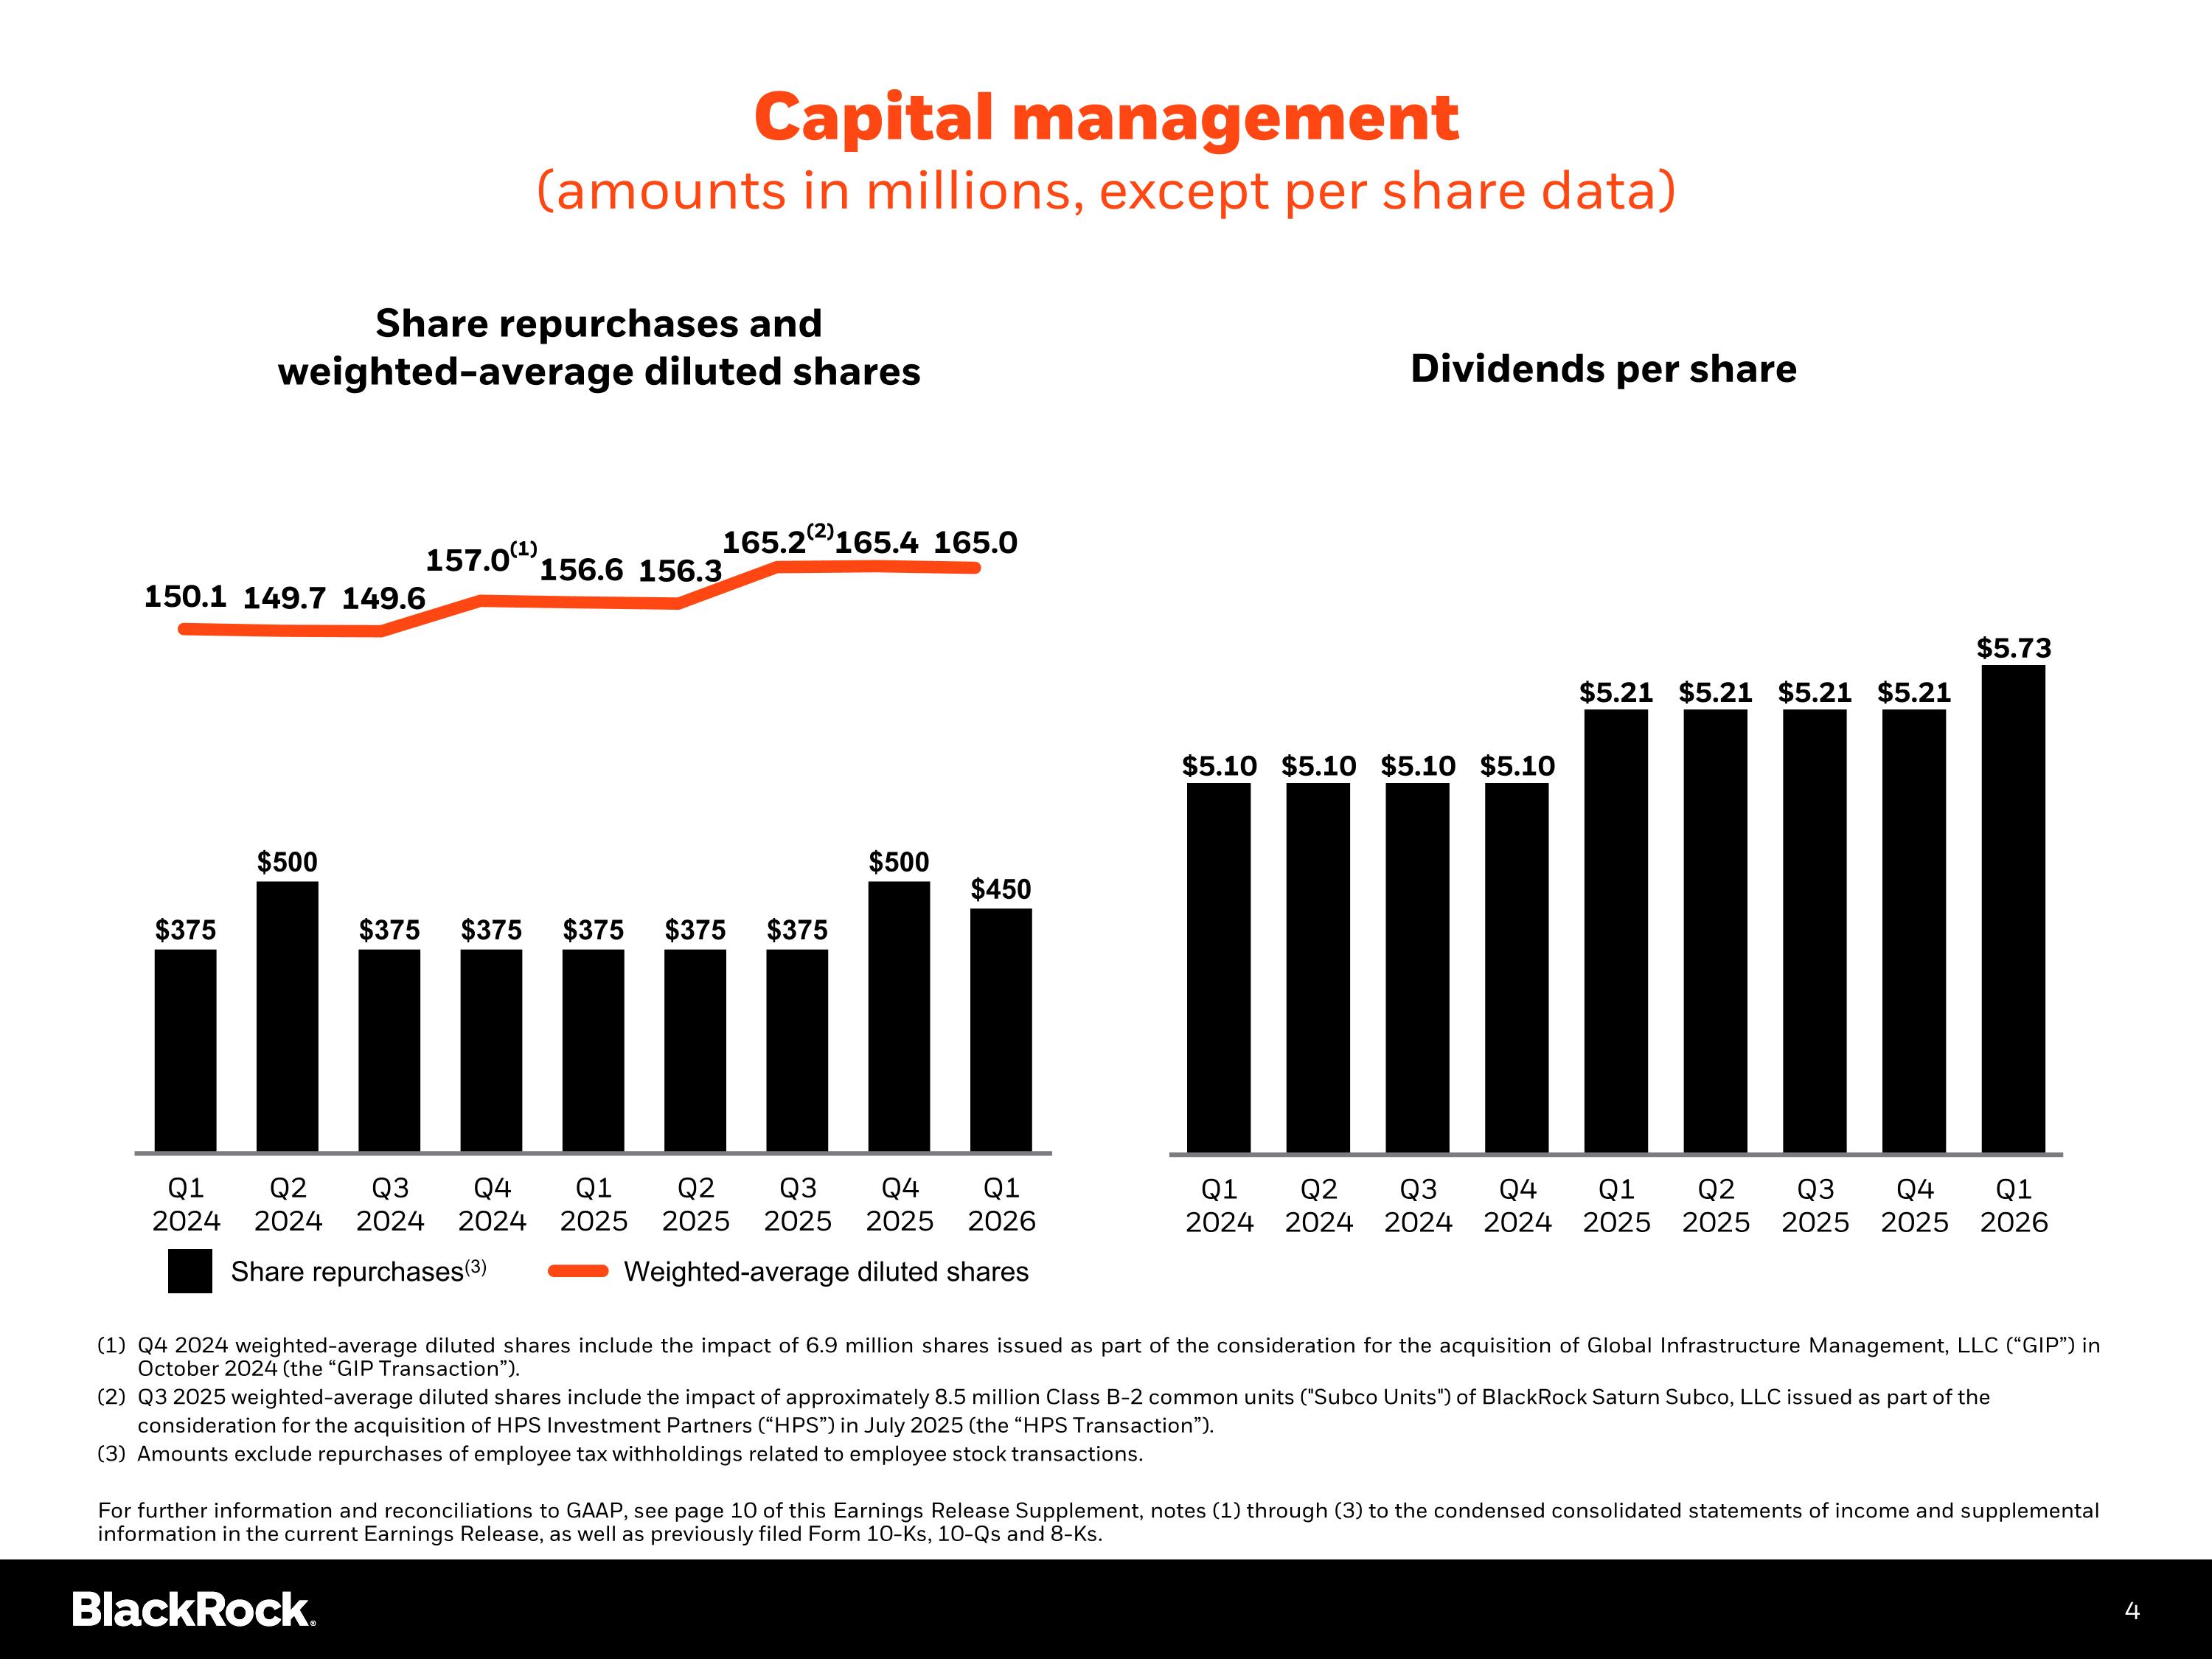
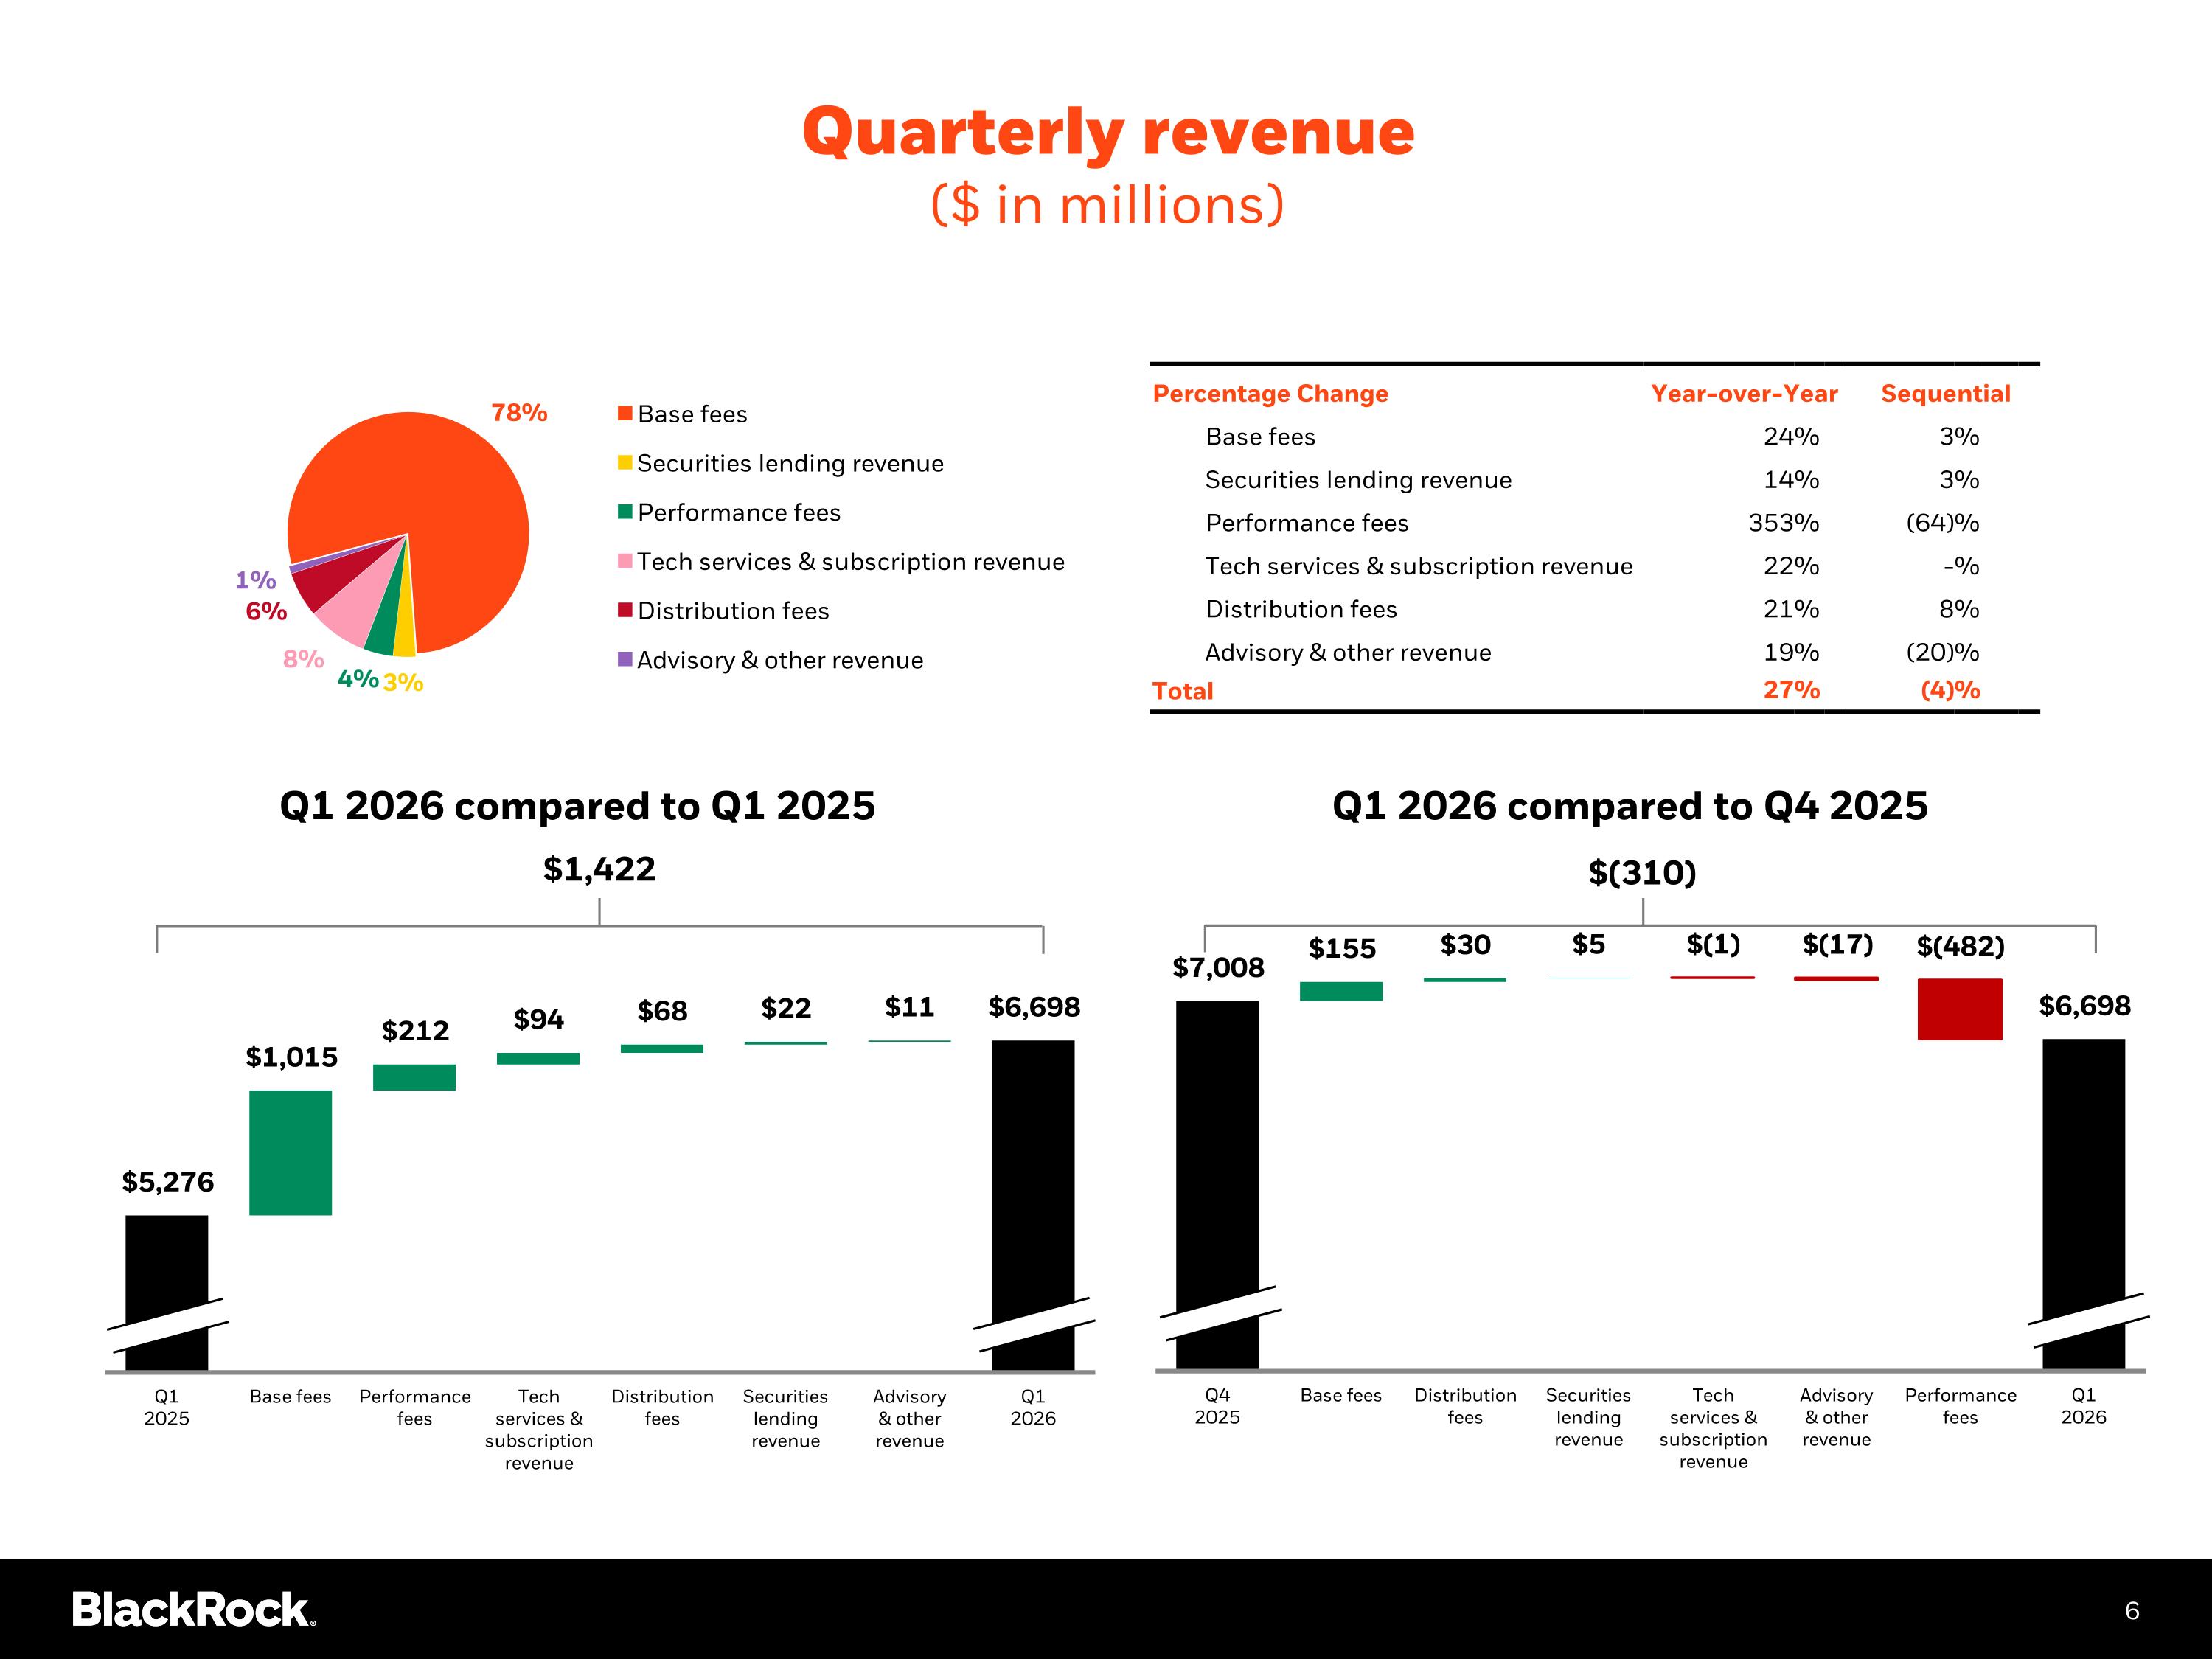
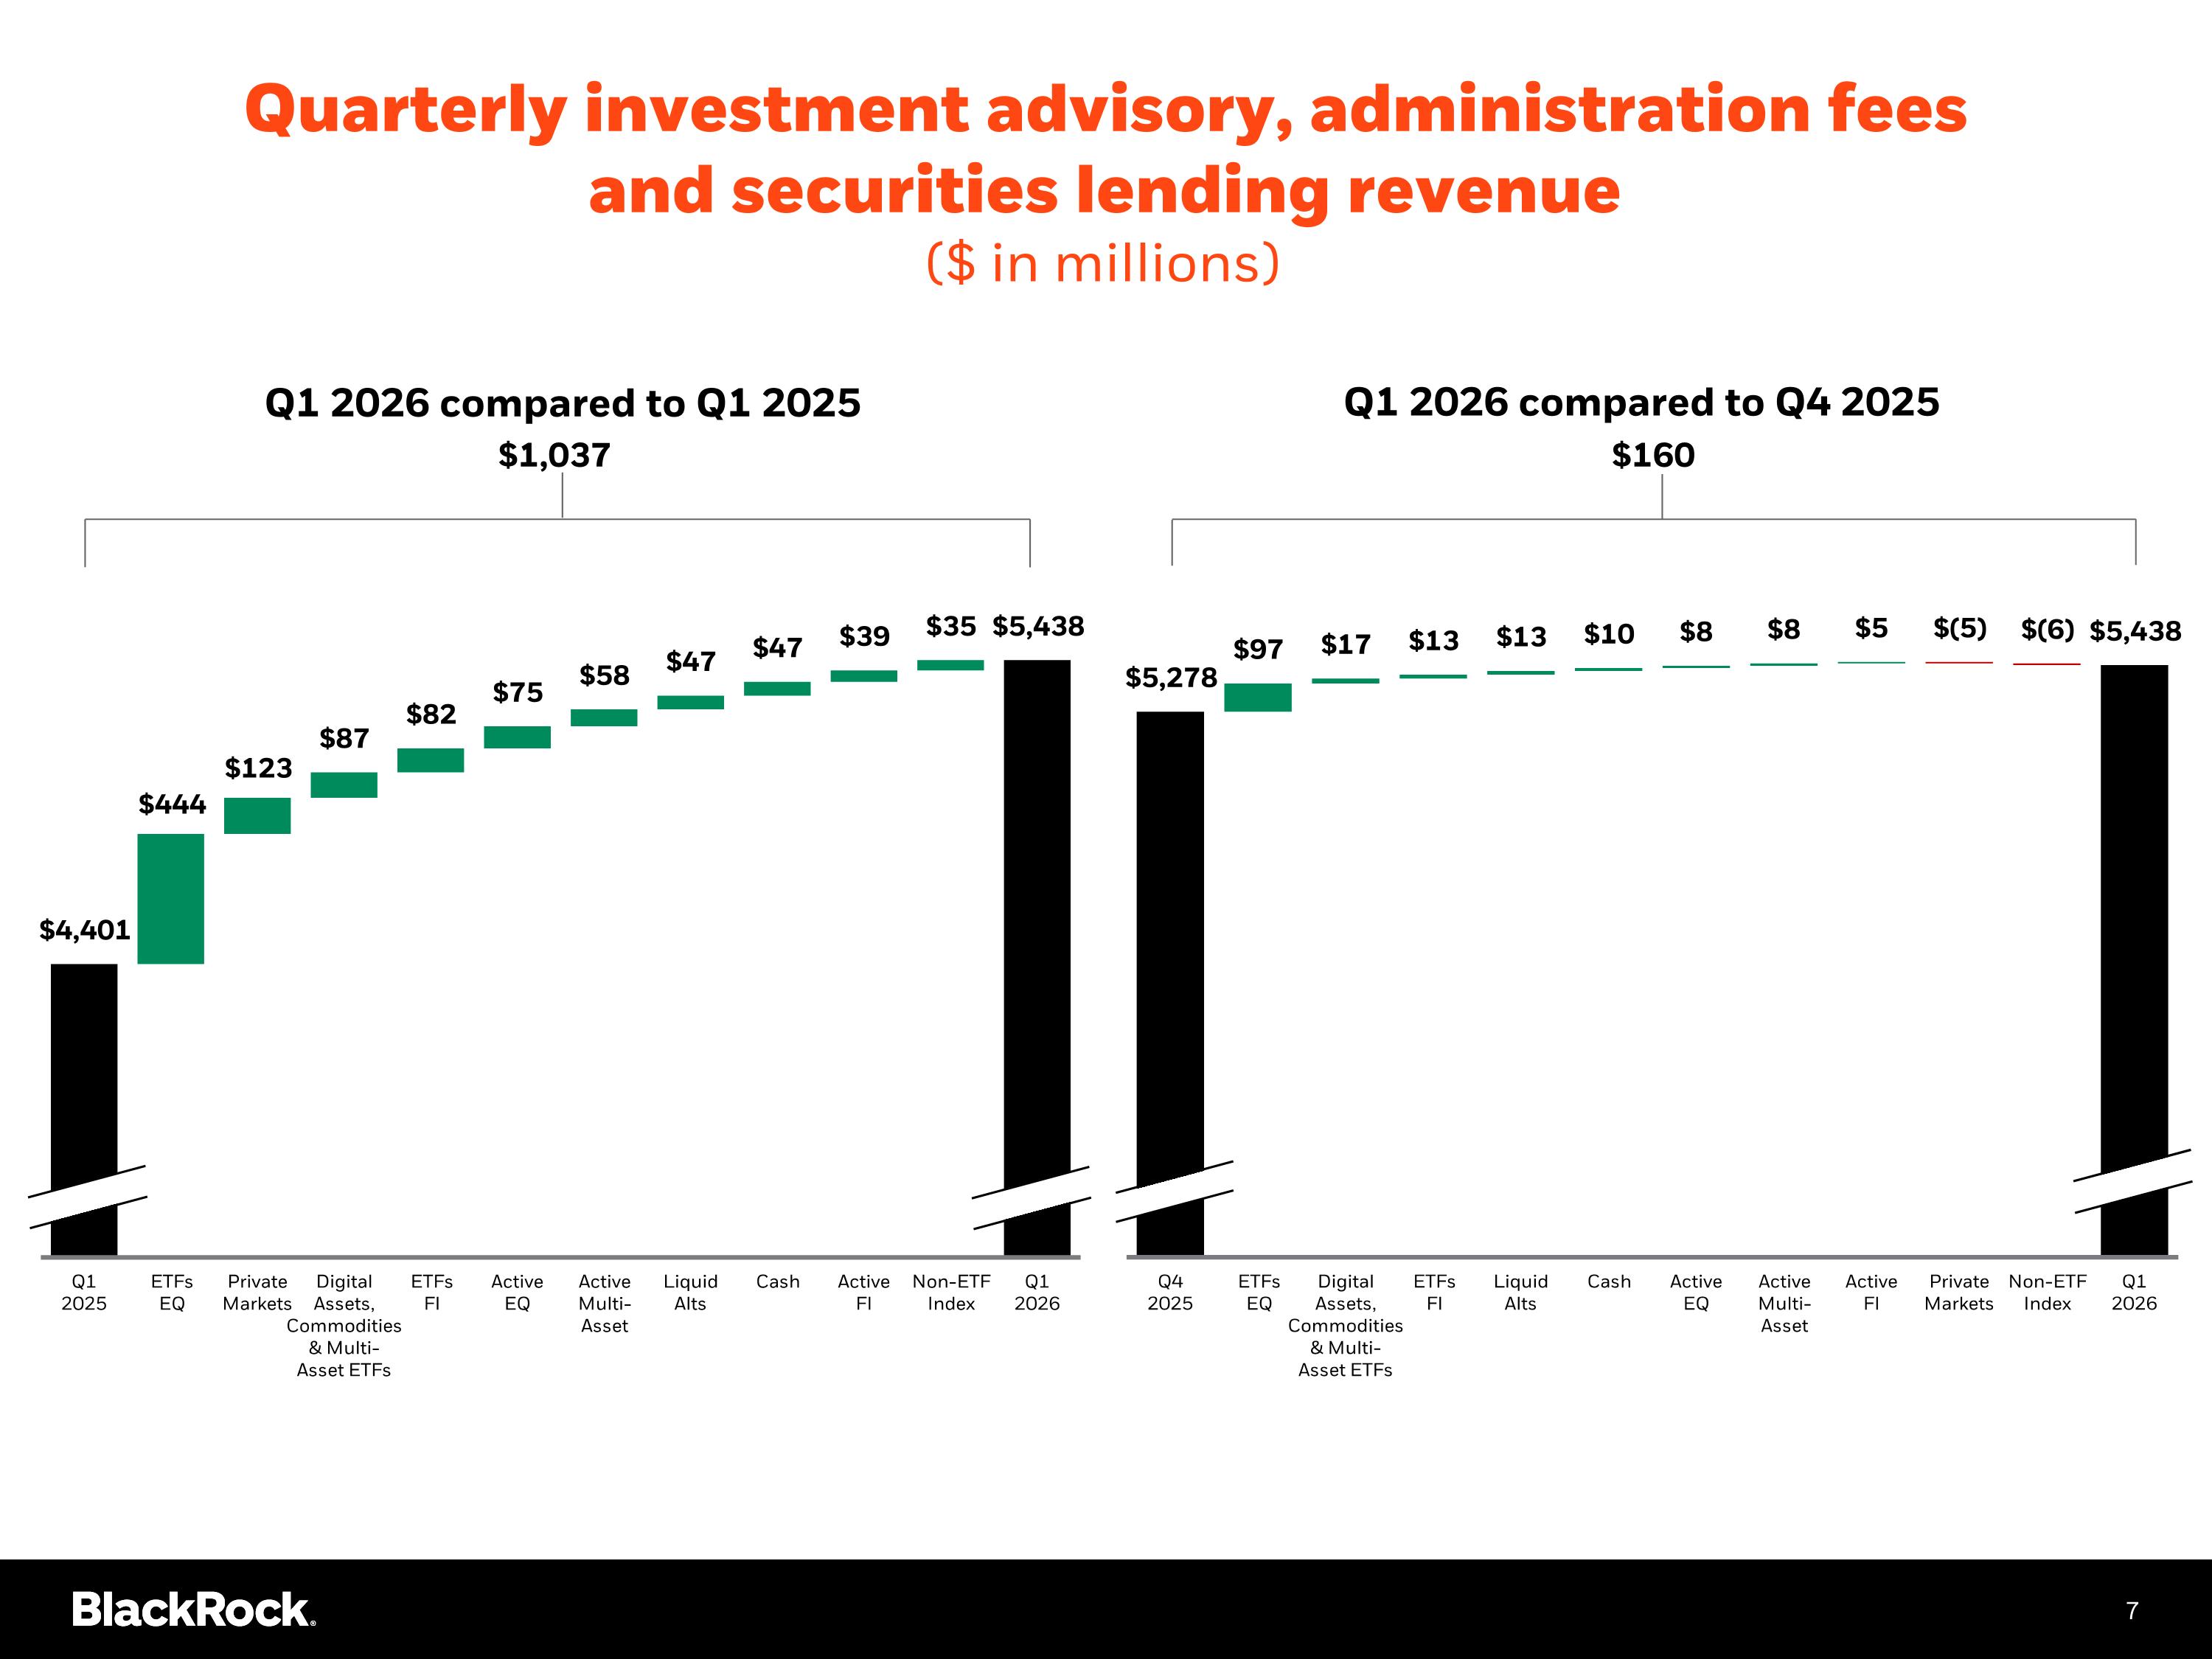
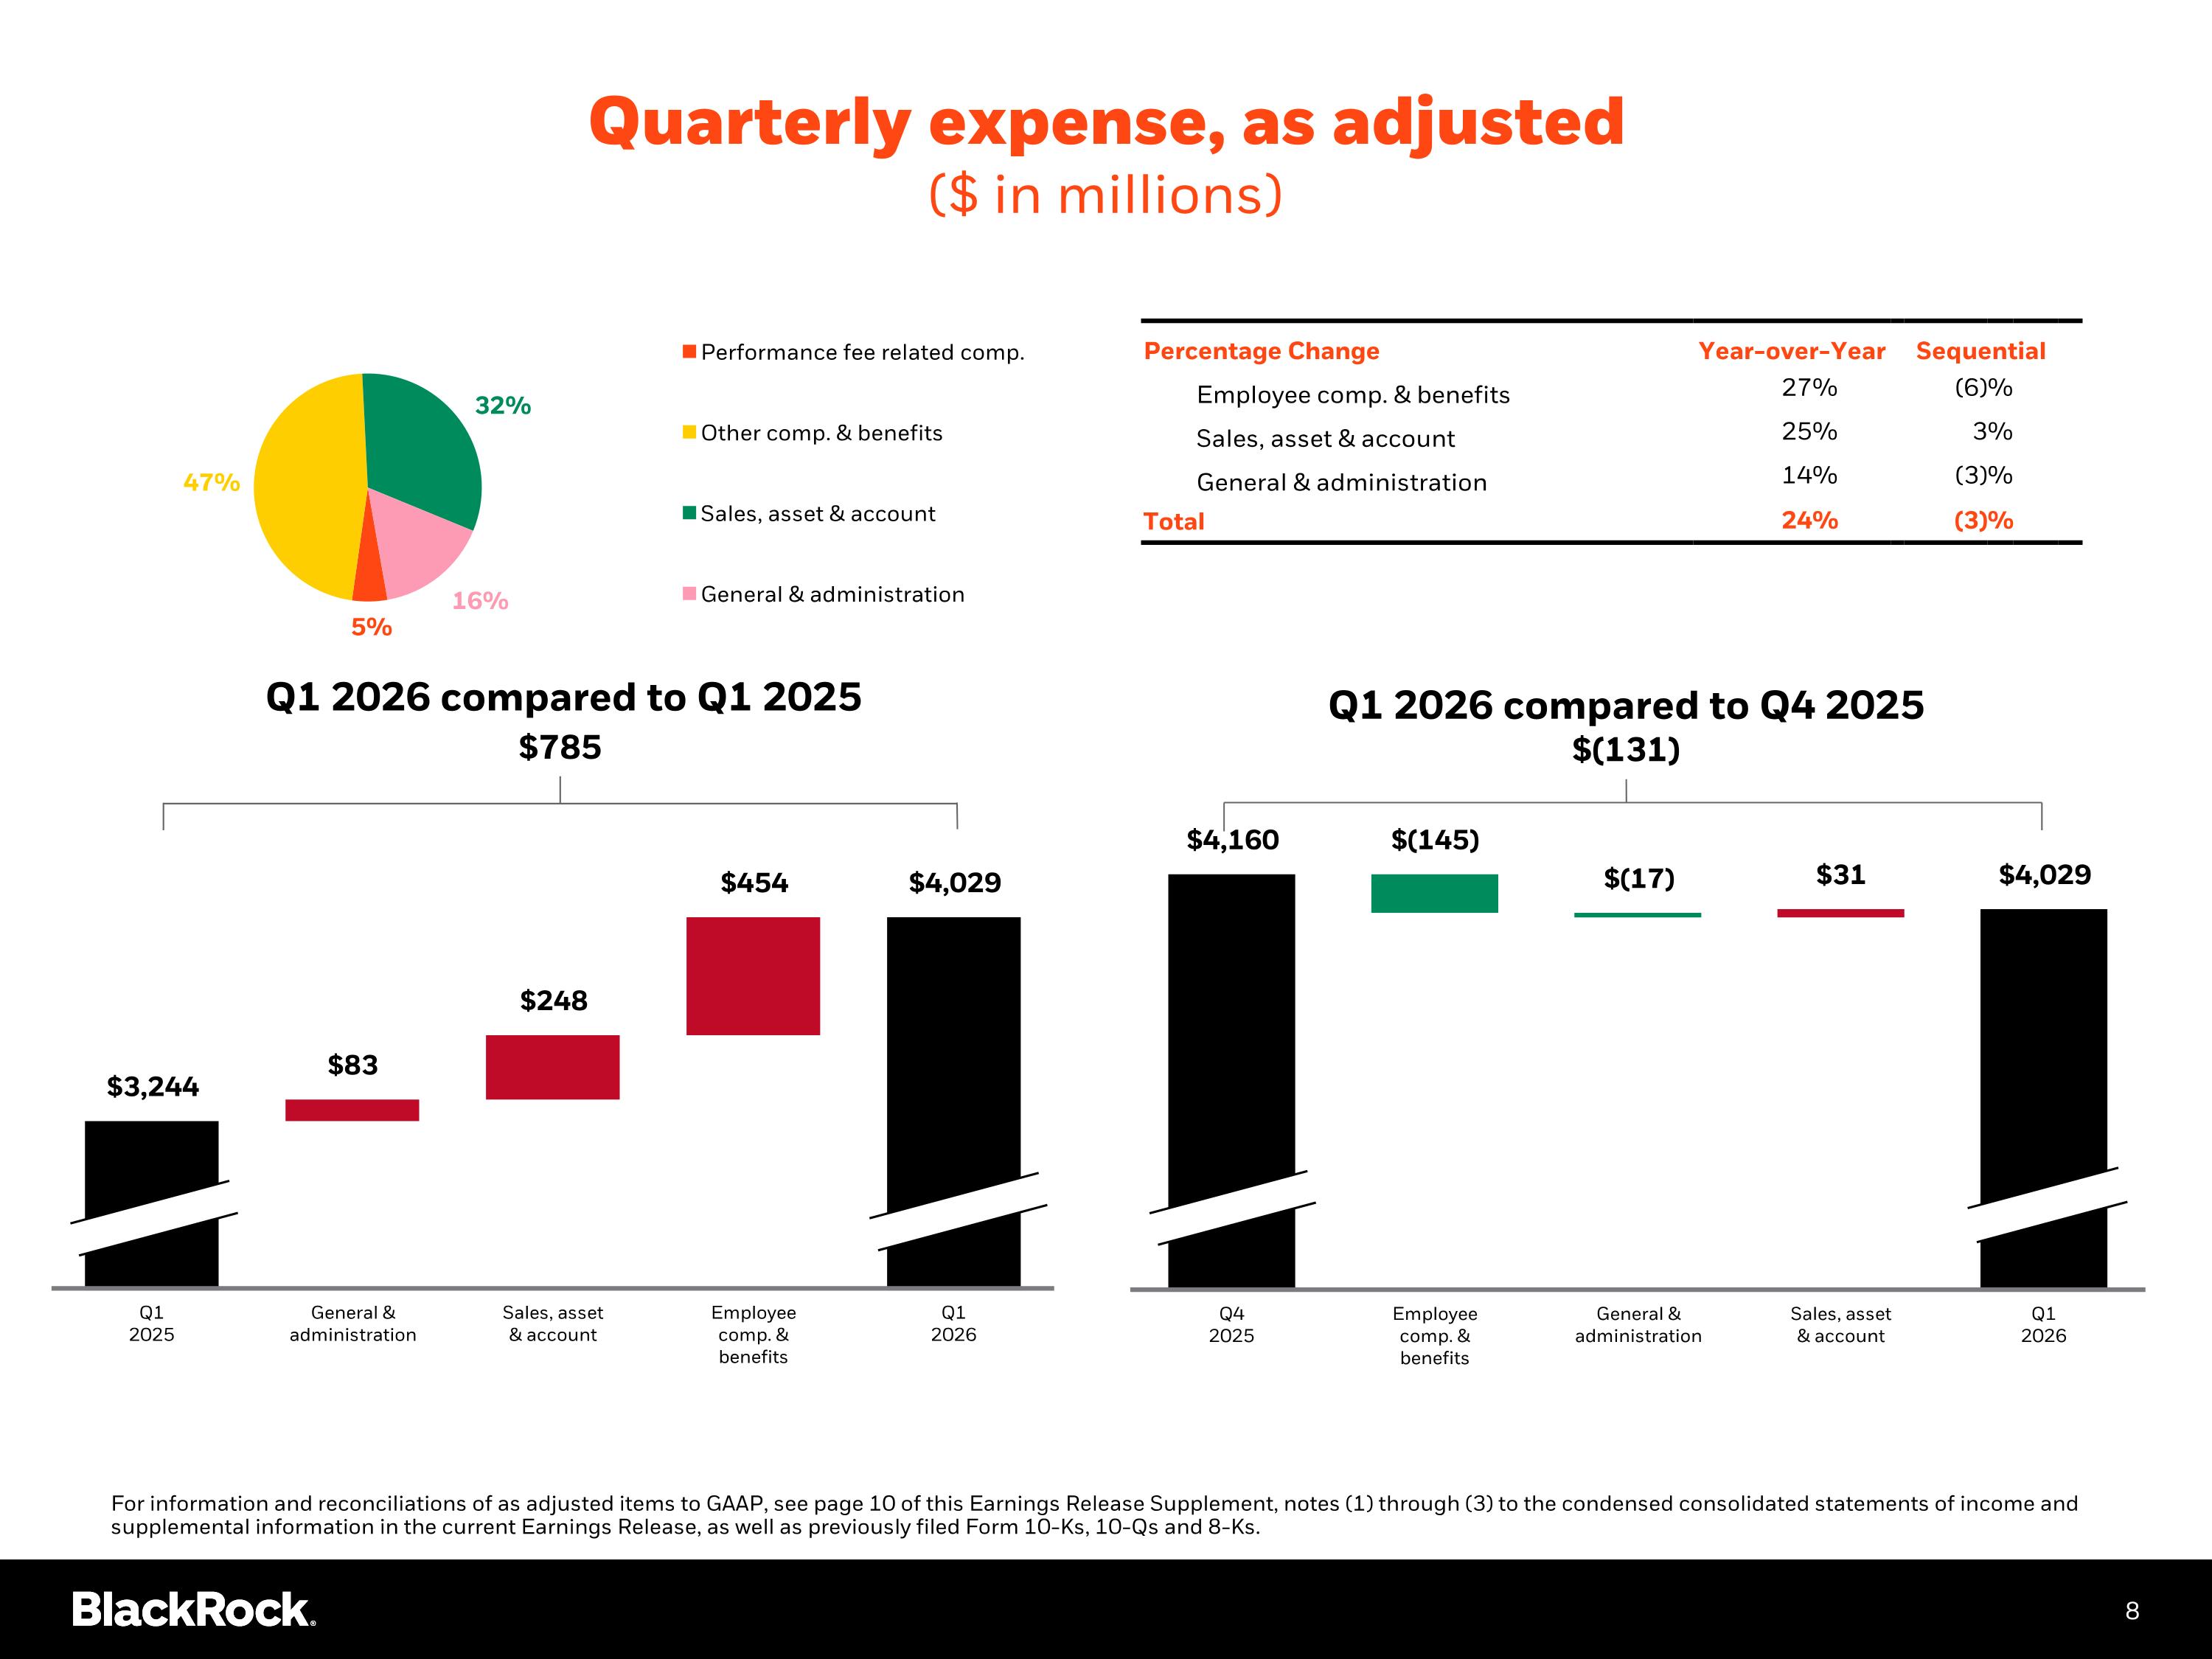
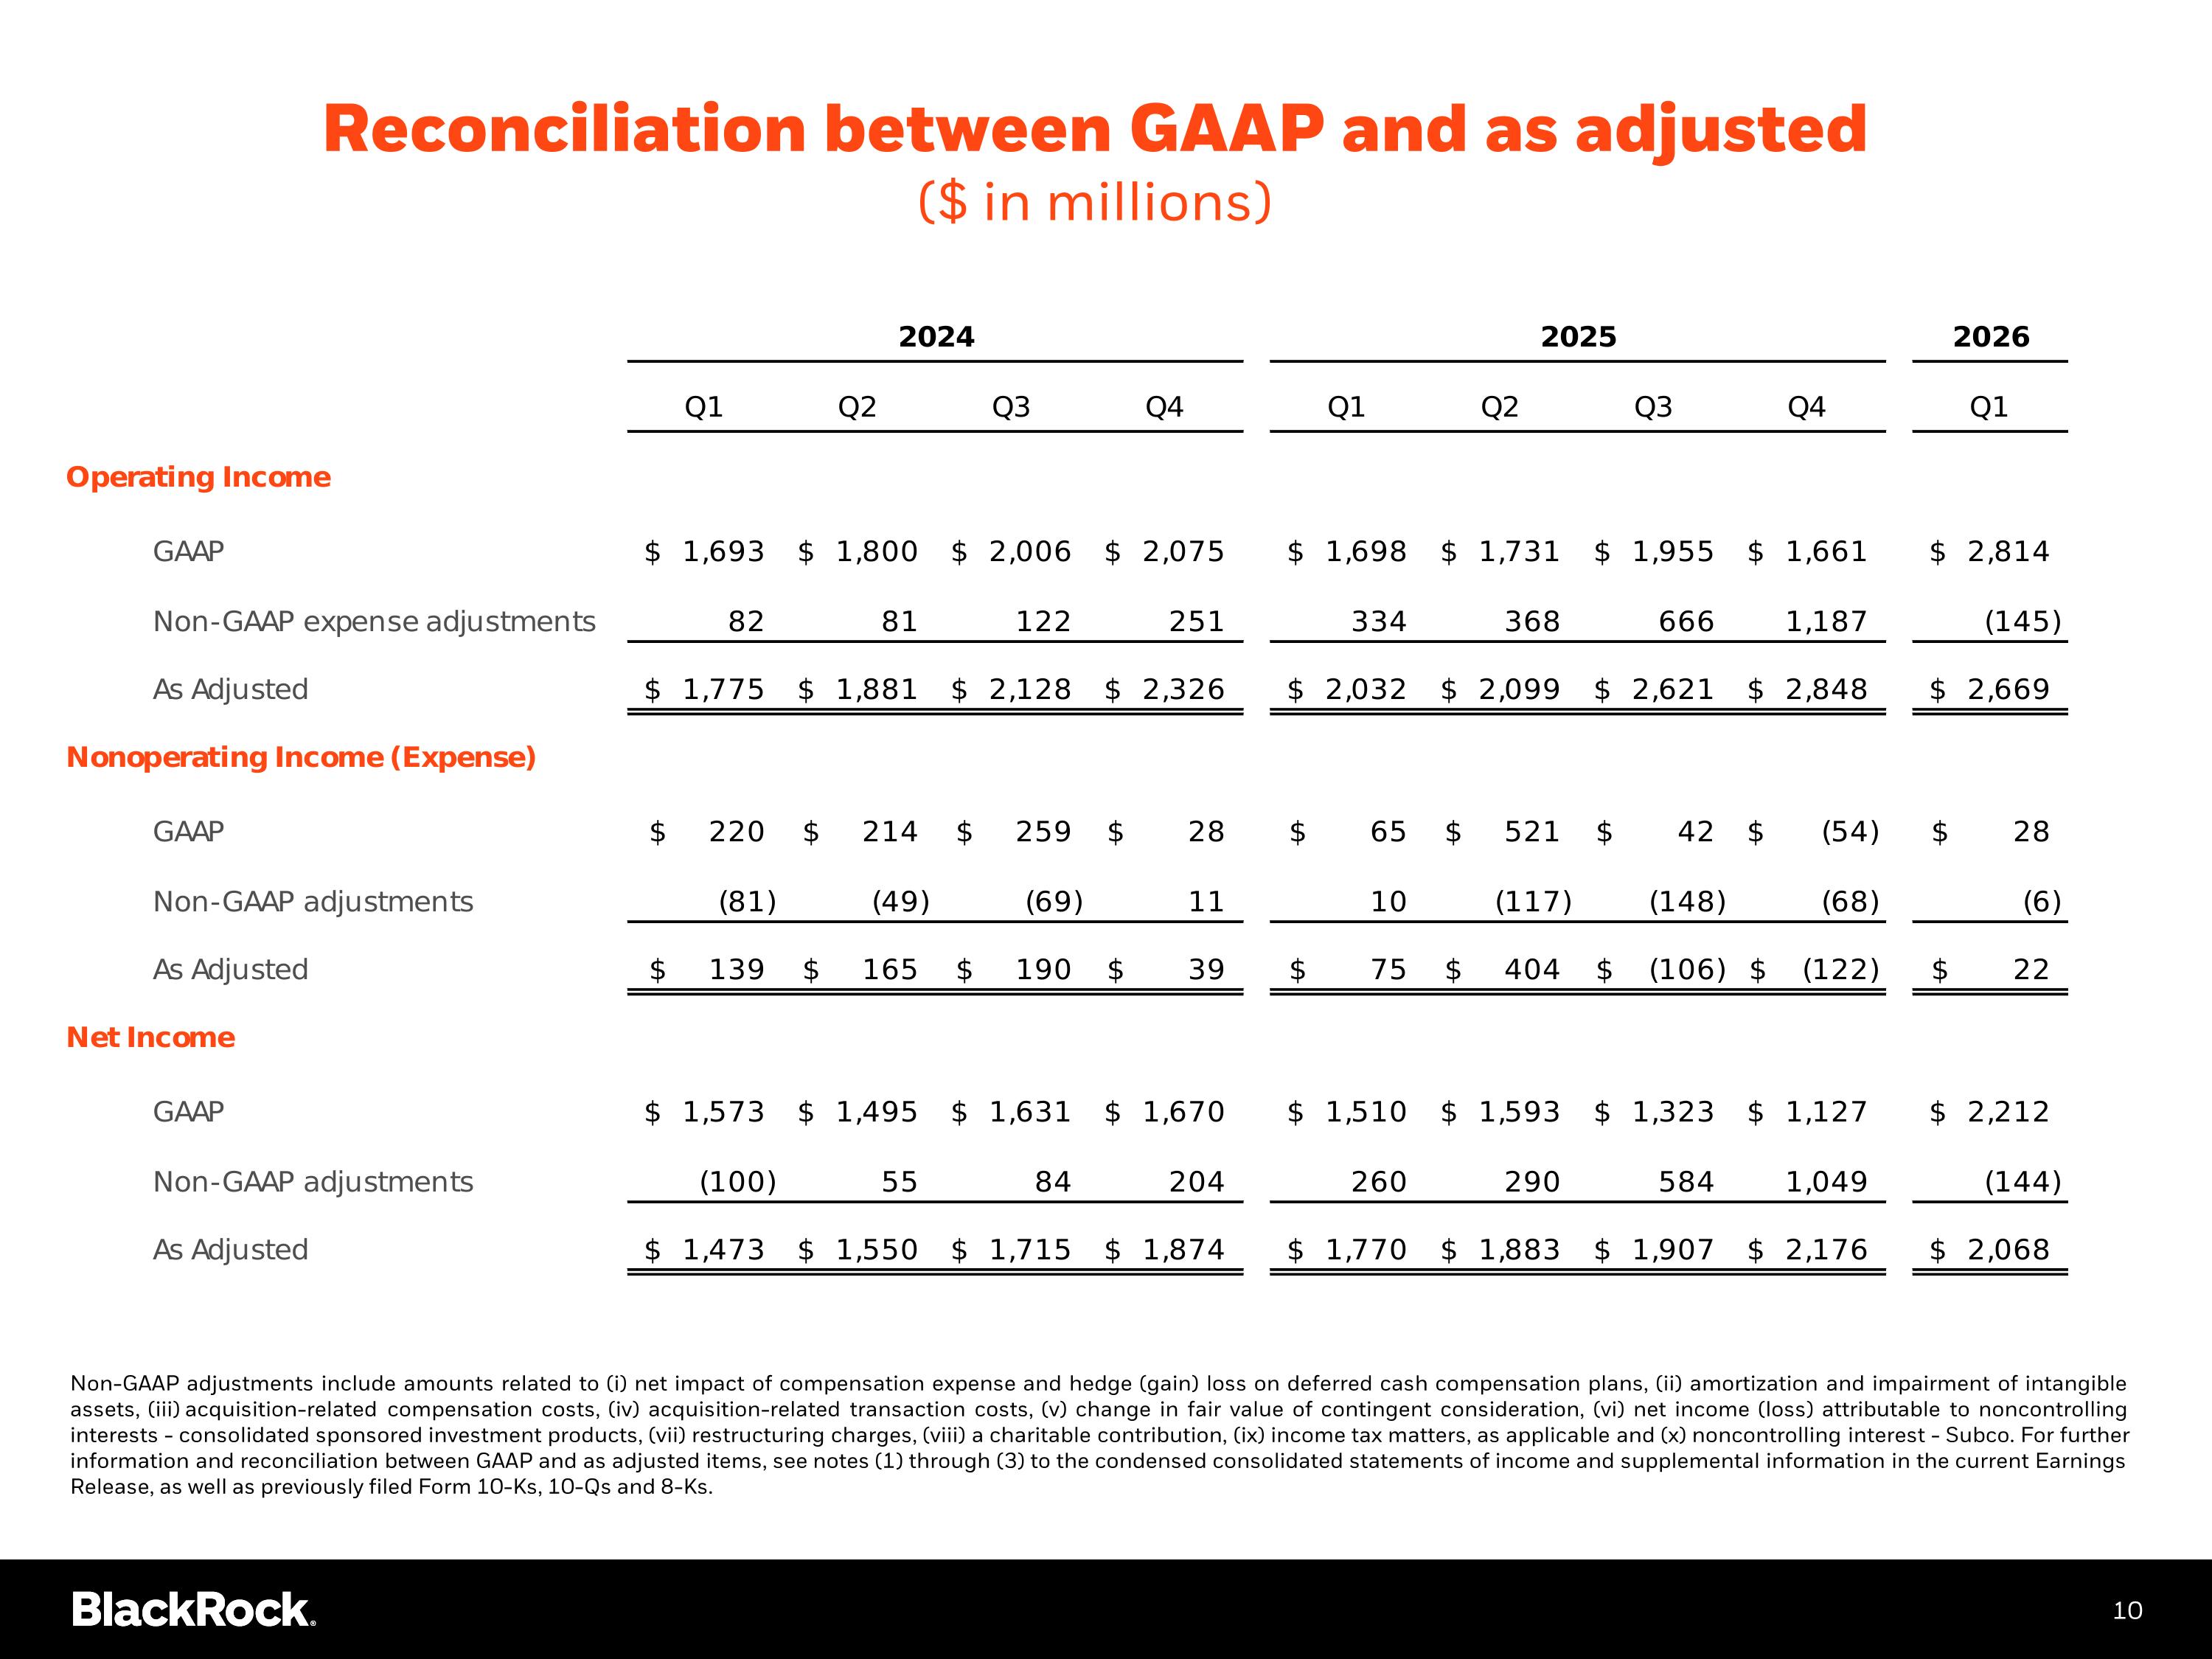
Thanks, Chris. Good morning, everyone. It's my pleasure to present results for the first quarter of 2026. Before I turn it over to Larry, I'll review our financial performance and business results. Our earnings release discloses both GAAP and as-adjusted results. A reconciliation between GAAP and our as-adjusted results has been included in the tables attached to today's press release. I'll be focusing primarily on our as-adjusted results. It's been a standout start to the year for BlackRock. Our first quarter revenue, operating income, and earnings per share grew double digits. We expanded margins by over 100 basis points, and we delivered 8% organic base fee growth. That's our seventh consecutive quarter at or above 5%, bringing the last 12 months organic base fee growth to 10%. What's driving that performance is deep engagement with clients. We're providing advice, insights, and access across the whole portfolio. allowing clients to efficiently implement both long-term strategic asset allocation moves and tactical exposures to navigate near-term themes and markets. These higher-velocity markets bring clients closer to our firm. BlackRock is winning mindshare and walletshare, reflected in $130 billion of net inflows in the first quarter. Organic growth is durable and broad-based. It's consistently across product, region, and client type. Firms we brought together deliberately are now compounding even faster in our results and with our clients. You see it across the BlackRock portfolio. Appirio flows accelerating as advisors bring tax-aware direct indexing into the core of accounts. iShares leading the industry across active and index. Infrastructure, fundraising, and deployment ahead of plan. The first quarter of 2026 unfolded in a more volatile market environment. Markets showed heightened sensitivity to incremental economic data, with volatility rising across rates, equities, and currencies. There is real impactful geopolitical uncertainty. There's both excitement and anxiety about how artificial intelligence will impact day-to-day lives and business models. As capital reallocates and assumptions are challenged, markets can feel unsettled even when underlying fundamentals are sound. That dynamic is evident today. While headlines and sentiment remain uneven, BlackRock's performance tells a very different story. Our fundamentals are strong. Organic base fee growth remains well above target, and margin expansion continues to reflect the operating leverage built into our model. Momentum across our business continues to accelerate. That momentum is rooted in clients wanting to partner with scaled, trusted platforms, and they're consolidating more of their portfolios with BlackRock. Turning to our financial results. First quarter revenue of $6.7 billion increased 27% year-over-year, driven by organic growth, the impact of higher markets on average AUM, the acquisitions of HPS and Prequin, and higher technology services and subscription revenue. Operating income of $2.7 billion was up 31%, and earnings per share of $12.53 was 11% higher versus a year ago. EPS also reflected lower non-operating income, a higher effective tax rate, and higher share count in the current quarter linked to the closing of the HPS transaction on July 1st, 2025. Non-operating results for the quarter included 66 million of net investment gains driven primarily by equity method earnings and non-cash valuation gains in our minority investments our as-adjusted tax rate for the first quarter was approximately 23 percent this reflected 57 million of discrete tax benefits related to stock-based compensation awards that vest in the first quarter of each year we continue to estimate that 25 is a reasonable projected tax run rate for the remainder of 2026. The actual effective tax rate may differ because of non-recurring or discrete items or potential changes in tax legislation. First quarter base fee and securities lending revenue of $5.4 billion was up 24% year over year, driven by the positive impact of market beta on average AUM, organic base fee growth, and approximately $230 million in base fees from HPS. On an equivalent day count basis, our annualized effective fee rate was two tenths of a basis point higher compared to the fourth quarter. Our fee rate benefited from outperformance of international equity markets relative to the U.S., along with client demand for international iShares exposures, and our structural growers in systematic equities, private markets, Apirio, and active ETFs. Performance fees of $272 million increased from a year ago, reflecting higher revenue from alternatives, which includes $121 million in performance fees from HPS. Quarterly technology services and subscription revenue was up 22% compared to a year ago. Growth reflects sustained demand for our full range of Aladdin technology offerings and a full-quarter impact of the PreQIN transaction, which closed on March 3, 2025. PreQIN added approximately $65 million to first quarter revenue. Annual contract value, or ACV, increased 14% year-over-year. We remain committed to low to mid-teens ACV growth over the long term. Total expense increased 24% year-over-year, reflecting higher compensation, sales asset and account expense, and G&A. Employee compensation and benefit expense was up 27%, reflecting higher incentive compensation linked to higher operating income and performance fees, and higher headcount associated with the onboarding of HPS and frequent employees. Sales asset and account expense increased 25% compared to a year ago, primarily driven by higher distribution and servicing costs and direct fund expense. G&A expense increased 14%, primarily driven by the impact of the HPS and Prequent Acquisitions. Excluding the impact of the HPS and Prequent Acquisitions, G&A would have increased a mid-single-digit percentage from a year ago. Our first quarter as-adjusted operating margin of 44.5% was up 130 basis points from a year ago, reflecting the positive impact of markets on revenue and strong organic base fee growth. We continue to deliver higher margin expansion on recurring fee-related earnings. Excluding the impact of all performance fees and related compensation, our adjusted operating margin for the first quarter would have been 45.6%, up 180 basis points year over year. We repurchased $450 million worth of shares in the first quarter. At present, based on our capital spending plans for the year and subject to market and other conditions, we still anticipate repurchasing at least $450 million of shares per quarter for the balance of the year, consistent with our January guidance. In the first quarter, BlackRock generated total net inflows of $130 billion, led by strength across ETFs, active, and private markets. Record first quarter ETF net inflows of $132 billion were led by index bond ETFs, with $41 billion of net inflows. Precision exposures, core equity, and active ETFs added $39 billion, $32 billion, and $19 billion, respectively. Client demand for international diversification presents meaningful upside for BlackRock, particularly in areas like emerging markets and precision single-country allocations. This demand for premium exposures that are specific to iShares resulted in double-digit organic base fee growth for ETFs in the quarter. Retail net inflows of $15 billion reflected continued strength in our systematic liquid alternatives, active fixed income, and evergreen private markets offerings. Subscriptions for HPS's flagship non-traded BDC continue, with approximately $150 million of subscriptions for the April window. Demand for Appirio and SpiderRock is also accelerating, as financial advisors turn to these platforms for customized and tax-aware strategies. Apirio generated a record 13 billion of net inflows, and SpiderRock added over 1 billion in the quarter. Apirio's AUM has more than tripled, and SpiderRock's AUM has more than doubled in the five and two years since their respective closings. Institutional active net inflows were 24 billion, driven by our Lifepath target date franchise, private markets, and systematic strategies. These inflows were partially offset by a few client-specific active fixed income redemptions. Institutional index net outflows of $35 billion were concentrated in low-fee index equities. In private markets, we continue to see strong momentum supported by investment performance, differentiated deal flow, and the breadth of our client relationships. We saw an aggregate $9 billion of net inflows led by private credit and infrastructure and primarily driven by deployment activity. Finally, BlackRock's cash management platform saw $6 billion of net outflows in the first quarter. Cash management results reflected seasonal redemptions from U.S. government funds, partially offset by growth in customized cash mandates. BlackRock's had its best helping clients navigate intense periods of transformation across industries, markets, and geopolitics. capital is moving. Wealth management platforms, institutions, consultants, they're evaluating their providers of asset management services. Our whole portfolio model has a proven track record of capturing momentum and gaining share in these environments. BlackRock is simultaneously a leading public markets manager, a scaled private markets platform, and a global technology company. That's not something that can be replicated overnight. Our clients know it. Our results prove it. We generated 8% organic base fee growth in the quarter and 10% over the last 12 months. At the same time, we grew revenue and operating income double digits and expanded margins by over 100 basis points. When clients are making big decisions about their portfolios, they're choosing BlackRock because we can meet them across public markets, private markets, and technology all on one platform.
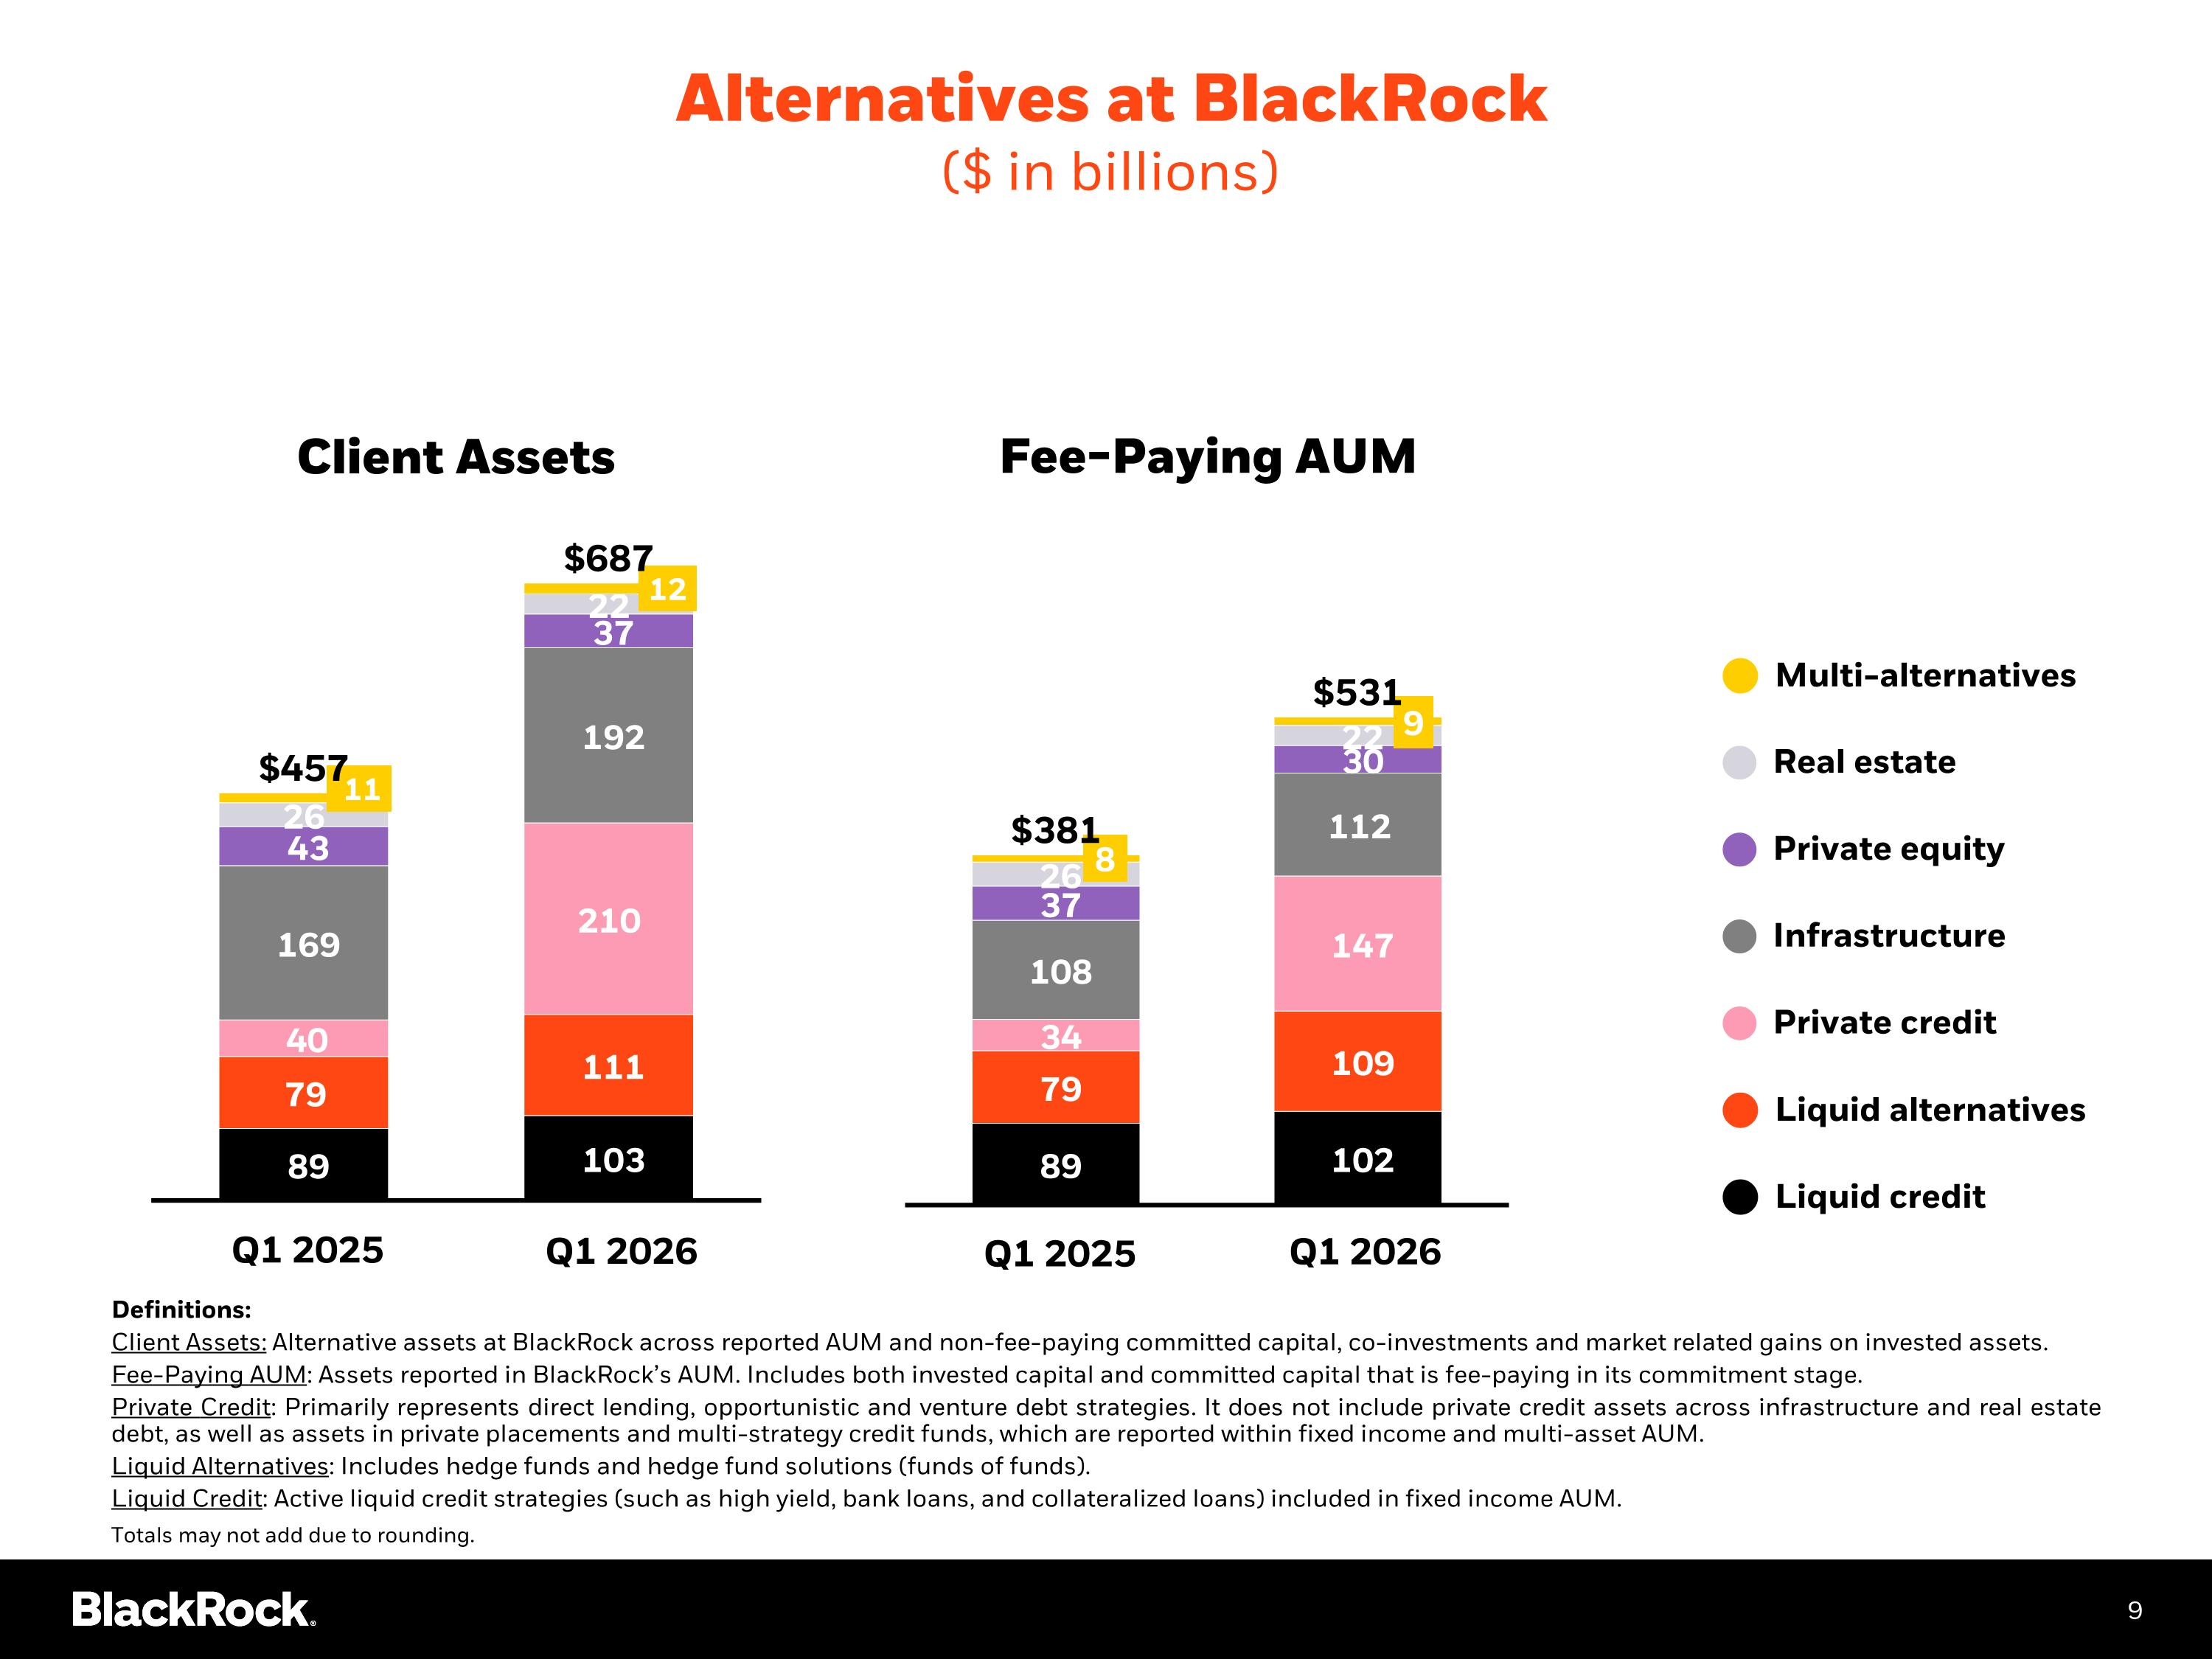
We have the investment expertise, the technology, the global reach, and the track record and we have nearly 25 000 colleagues one blackrock working together to deliver excellence for our clients and growth for our shareholders with that i'll turn it over to larry thank you martin good morning everyone and thank you for joining the call this was one of the strongest starts to a year in black rock's history clients awarded us with 130 billion dollars in net inflows in the first quarter that drove eight percent organic base fee growth representing our highest first quarter in the last five years technology services acv grew 14 our margins expanded by over 100 basis points to 44.5 and our firm's effective fee rate moved upward and over the last 12 months clients and trusted BlackRock with $744 billion in net new assets, powering 10% organic base fee growth. Our result reflects a global business with accelerating momentum, deep client engagement worldwide, and a platform built to compound through cycles. But our position reflects something larger than one quarter or even one year results. The conversations I'm having with clients around the world confirm what our results already show. Our business is becoming more global and more connected. Our brand is strengthening in every region in which we operate. I've seen it deepen even in the last few weeks in my trips to Mexico, Europe, and my conversations with colleagues and clients in the Middle East. I want to recognize the resilience and partnership from our employees, our clients, and our board members in the Middle East. We'll continue to do everything we can to support them. In a world where capital is moving and provider relationships are being re-evaluated, BlackRock is a trusted destination. A major part of my role has always been spending time with clients. By 2026, schedule has already been filled with rich dialogue with CEOs, sovereign wealth funds, pension funds, insurance CIOs, wealth managers, and governments in these conversations i hear a consistent theme the world feels different not just uncertain but different the world is reorganizing around self-reliance ai is reshaping how we live and how we work private markets are a large and growing part of the capital markets and clients are turning to blackrock to help them understand what this means for their portfolios and for their beneficiaries we're engaged with clients across every channel geography and asset class many of these conversations would not have been possible five years ago because the platform we have we now have built did not exist will we built it by bridging public and private markets and by expanding iShares into new regions and asset classes by unlocking personal SMA through Appirio, and by making active a true scale business through Systematic Alpha. BlackRock is playing a role that goes beyond asset management. We're partnering with governments and clients to help more people grow with their economies and with our countries. Through iShares and our local platforms, we're helping turn citizens into investors in their local economies, in India, in Mexico, in Japan, in Europe, and beyond. Much of our work is focused on making retirement investing more accessible. Strong retirement systems deepen on deep functioning capital markets, and deep capital markets are built in part by the savings of people planning for retirement. BlackRock's role in retirement is resonating in every conversation I have with every governmental leader. Retirement is foundational to BlackRock. Our platform spans defined benefits and defined contributions and brings together public and private markets, active and indexed, and technology at a global scale. That combination differentiates us in the U.S. as plan sponsors consider the role of private markets in 401ks. But it's also shaping how we partner with clients in regions like the Middle East and India to build a more durable retirement system and local capital markets. We're invested ahead of our clients' needs and secular forces, driving growth in capital markets. We're more confident than ever in our model, and the breadth of our pipeline has never been greater. BlockRock's diversified platform is an advantage. We develop whole portfolio solutions at scale. we're deepening client relationships and enabling more durable growth. It provides resilience and it gives us upside capture when market conditions shift. When clients rotate towards international exposures they did this quarter BlackRock benefits. iShares is differentiated in that it indexes virtually every slice of global equities and bond markets from broad benchmarks to emerging markets, to single country precision exposures. Demand for these premium exposures drove record iShares first quarter net inflows of $132 billion, with net base fees double what they were compared to this time last year. Our active ETF platform has grown four times in the last two years to more than $110 billion in AUM. Net inflows of $19 billion led the industry. We said that we believe that active ETFs can be a $500 million or greater revenue generated by 2030, and we're already more than halfway there. Strong client engagement drove $3 billion of active equity net inflows. For BlackRock, active equity is a growth area. Our systematic equity offerings remain one of the leading investment performance engines. We're working on a number of other systematic equity assignments with clients around the world. Clients want to harness AI, decades of proprietary data, and BlackRock's track record of turning quantitative rigor into long-term investment performance. Then in retail active fixed income, we raised $2 billion, led by our top-performing, unconstrained strategic income opportunity fund. We're firmly in the era of whole portfolios. clients want advice, they need allocation, and implementation across public and private markets together at scale. A decade ago, fiduciary's best practice often meant diversifying across a number of managers. As portfolios and governance have grown more complex, our clients are actually increasingly choosing to work with fewer strategic partners, many times just one. We see that shift reflecting the industry outsourced CIO assets which have more than doubled over the last five years. This movement towards whole portfolios is playing directly to our strengths. Clients are choosing BlackRock because we build together asset management and technology across public and private markets seamlessly in one integrated platform. The whole portfolio construct has resonated for years in our institutional channel, where we've been entrusted with approximately 300 billion dollars in large-scale outsourcing mandates over the last three years. In wealth, we are also opening new avenues of growth as demand for public private tax awareness investing reshapes how investors build their portfolios. BlackRock's wealth platform spans over 1 trillion dollars in AUM with global distribution across tens of thousands of financial advisors. It delivers seamlessly integrated public and private market solutions, model portfolios, and practice management capabilities. That significant value proposition is wealth management firms rethink their product shelves and look to do more with fewer partners. We're seeing demand across our wealth offering. That includes a record quarter in Imperio and Spider Rock, outsourcing mandates and net inflows into liquid active and private market strategies. Private markets including net inflows into our LTIF 2.0 funds in Europe and our flagship non-traded credited BDC. The combinations of GIP and HBS with BlackRock are surpassing the highest expectations we underwrote. GIP-5 closed above its $25 billion dollar target and is already a majority committed through recently announced deals like TCR, AES, and Aligned. Then joining HBS outsourcing structuring expertise with BlackRock Relationship Network has supercharged our combined origination capabilities. That allowed us to be more selective while still actively deploying capital at scale. These businesses are not just integrating, these businesses are accelerating. There's been a lot of attention on private credit, but the headlines do not reflect what clients are telling us, what our portfolio data shows, or where we see the market going. Demand is structural. Private credit serves an important role in the financing ecosystems. Banks, governments, public capital markets cannot fully address the world's growth and investment capital needs. that isn't changing. Much of the focus on wealth vehicles like BDCs, interval funds and tender funds. But these funds, these make up around $550 billion in AUM or about 25% of the $2.2 trillion private credit industry. Actually, institutional demand is accelerating. They're increasing allocation to private credit as wider spreads or enhancing return potential and defaults, while normalizing are still within historical standards. Private credit has historically offered asset level yields that are approximately 150 basic points higher than comparable rated traditional fixed income. New activity levels have been somewhat lower in the first quarter, which is partially seasonal and reflects related to market uncertainty. But new regular wage, direct lending opportunities are being quoted 25 to 50 basic points wider than where the market was in the fourth quarter, with select opportunities over 100 basic points wider. Periods of market disallocation are when private credit investment opportunities are most compelling. BlackRock's private financing solution platform benefited from a balanced and diversified client base across investor types and geographies. We have particularly strong representation among insurance companies and pensions, as well as sovereign wealth funds and private market relationships. About 85 percent of private financing solution investor base is institutional focused, leading to greater capital durability across market cycles. This enables us to remain active investors across market environments, which should ultimately lead to better long-term risk-adjusted returns. Over the last five to seven years, relatively benign credit markets have lifted all boats. As the overall market environment becomes more complex, we expect to see much more dispersion in performance among private credit managers. That's an environment we like to compete in. We believe that HBS's strong underwriting discipline and its proactive risk management will compare favorably and ultimately will result in differentiated returns and share gains. Private credit has scaled rapidly and the risk management infrastructure supported has not kept pace. That is a meaningful opportunity for Aladdin. We already have a comprehensive public-private workflow and data offering through Aladdin, eFront, and Prequent.
We're positioning BlackRock and Aladdin to be the language of private credit portfolios for transparency and for risk analytics.
We believe that the combination of Prequent and eFront data represents the broadest universal available in the markets. Aladdin's value as an enterprise-wide operating system is only amplified in a world with more need for real-time verified data on one single platform. We have visibility on strong future fundraising and deployment across multiple dimensions of our private credit platform. Institutional client demand for private credit continues to grow, particularly with insurance companies. This quarter we signed a multi-billion dollar rotation into a high-grade private credit from an existing insurance client. This will drive revenue growth as is deployed over future quarters. We have a multi-billion notified insurance pipeline for a similar mandates. Fundraising in HBS's junior capital strategies tracking well and we saw approximately 150 million in HLEN April subscriptions. BlackRock is at the forefront of innovation and advocacy in retirement. That includes reimagining how people save and spend across longer lives. It's working with plan sponsors and policy makers to deliver better retirement outcomes. The Department of Labor's proposed rule is a major development towards a framework to include private assets and target date funds. BlackRock will be at the forefront of this opportunity. We have a $600 billion life path target date franchise where we saw 15 billion of net inflows in the quarter that included a four billion dollars into life path dynamic our active solution our life path dynamic range is well positioned to to eventually include private markets exposure along public equities and fixed income as private assets potentially enter the defined contribution market plan sponsors need to partner with a target date, history, long-term track market, private market scale, and technology and data to satisfy their fiduciary oversight. BlackRock delivers on every one of those points. We have our leading DCIO business, a top five alternative platform, a public and private technology and data platform. The DOL's proposed rule is clear that fiduciary standards will demand rigorous data and performance benchmarking for private assets it reinforces what we've been saying all along plan fiduciaries will need institutional grade data and performance benchmarks to make defensible allocation decisions that's exactly what frequent provides and our leading uh our leadership in target date private markets investing and data clearly differentiates blackrock we are with all our plan sponsors. This has been one of our strongest starts in BlackRock's history. It's not that we were benefiting from a favorable moment. We're actually benefiting from a durable platform, one that has been built over decades, over long strategies, and we are equipped for this type of environment, an environment where capital is moving and fundamentals are being re-evaluated. The pipeline ahead of us is among the broadest I have seen at BlackRock. Actually, momentum is accelerating. We're energized by these opportunities ahead. And most importantly, I would like to thank all of our BlackRock colleagues for the work they've done each day to deliver for our clients and our shareholders. With that operator, let's open it up for questions.
Operator
Thank you. At this time, I'd like to remind everyone, in order to ask a question, please press star to the number one on your telephone keypad. If you do ask a question, please take your phone off its speaker setting and use your handset to avoid any potential feedback. Please limit yourself to one question. If you have a follow-up, please re-enter the queue. We'll pause for just a moment to compile the Q&A roster. Your first question comes from Michael Cypress of Morgan Stanley.
Hi, Michael. Good morning.
Hey, good morning. Thanks for taking the question. I wanted to ask about the wealth channel penetration. I was hoping you could update us on the progress penetrating U.S. and international wealth channels, particularly for alternative products? What milestone should we be tracking over the next 12, 24 months, and what impact might we see from the uptick in redemptions across evergreen private credit products?
Martin? Thanks, Mike. So we're proud to manage more than a trillion dollars of assets for wealth managers across the BlackRock platform. It really covers every corner of a client portfolio from models to separately managed accounts, ETFs, private markets. We're a technology provider. Our Aladdin technology sits on the desktop of Financial Advisor that brings institutional quality portfolio construction right to the desktops. We have the largest client-facing team in the industry covering every corner of the U.S. marketplace from full-service brokerage and wire houses to independent broker dealers and RIAs. And we have very strong relationships with private banks all across the world in the United States and the Americas, Europe, and Asia. We have a diversified product business, strong track records, and great distribution. I think you really see that come through in the first quarter retail net inflows of $15 That was driven by a record $13 billion into a period, $3 billion into liquid alternative strategies, as well as demand for strategic income opportunities, active fixed income, and our evergreen private markets. I'd call out that that's nine consecutive quarters of retail net inflows. So this continues to be a durable, strong growth channel for us. Let me comment just on kind of two areas that I think are worth highlighting. So the first is that growth in this channel is being driven by demand for whole portfolio services, the move from brokerage to advisory, and that's led to a growth of ETFs and SMAs, two places where BlackRock is an industry leader. It's also put a big focus on after-tax investing. I think for a long time, the language of the industry was sort of pre-tax returns or asset class level returns. The fact is our clients pay for college, they pay for healthcare, they pay for mortgages. They ultimately pay with those things with after-tax dollars. So putting after-tax portfolio construction has been at the heart of what we're trying to do at BlackRock for taxable investors all over the world. It was at the heart of the rationale for the Appirio acquisition, and it's really driving growth in these businesses. Appirio net inflows were record levels for a fifth straight year in 2025, and we saw a new quarterly record in the first quarter with $13 billion. SpiderRock added a quarterly record of a billion dollars of flows with options overlay on top of SMAs. I'd call out just some interesting things there that I think are kind of high growth areas. In that 13 billion of direct indexing flows, about 9 billion was long only traditional direct indexing. 4 billion was in long short strategies. Think of those as having additional abilities to create tax loss harvesting opportunities. We continue to see a lot of growth there in that platform and we have a really unique advantage of bringing together the long-only capability with the long-short. So we continue to believe that long-short direct indexing with options overlay is going to be a great growth area, and we hope to double-triple that business over in the near term. Second, model portfolios. Model portfolios in the wealth management segment is the same as OCIO in the institutional segment. It brings professional management. It brings scale. It brings convenience. and customized and ETF-based models are really a huge part of an advisor's growing practice. Roughly 40-plus percent of our iShares flows, particularly in the U.S., come from model portfolios. So we're expanding those solutions to include private markets in the convenience of a model portfolio. And then just last on your piece about Evergreen, Evergreen wealth strategies are a big part of what we see as being retail access vehicles for wealth management platforms. And even with some moderation of private credit BDC flows, overall evergreen flows are pretty stable and steady. I think you see that in the industry data, whether that's on interval funds, tenor funds, private equity, real estate, secondaries, infrastructure, so on and so forth. So we think there's a great opportunity to continue to expand our evergreen lineup. We have our HLEND flagship, and we're on track to bring an H-series of vehicles to market for private wealth over the course of 2026. You can actually find registration statements on the SEC Edgar website for real assets or HREAL and net lease strategies with HLEND, excuse me, HNET. And we launched HLEND-E in Europe, and we're bringing a new GIP core infrastructure fund to market in Europe as well, which we think will be a great jumping off point for private wealth. So we have a lot of ways to grow in wealth. We continue to be really optimistic about our opportunities there in ETFs, SMAs, liquid alls, private markets, as well as Aladdin Wealth and Models. So we look forward to keeping you updated on our progress there.
Operator
Your next question comes from Craig Siegenthaler with Banks America.
Good morning, Craig. Good morning, Larry. Hope everyone's doing well. Two weeks ago, we received a proposal from the Department of Labor to help support DC plan sponsors' decisions to select privates in the $14 trillion foreign K channel. So just given your size with your target date franchise, what are your initial thoughts on the proposal? And also, any thoughts on if you could launch a new series of target date strategies or use your existing strategies and just have a privates allocation?
Let me have Martin start with that, and then I'll finish it up. But let me just say one thing importantly. Every country that we are talking to are refocusing on how can they expand their capital markets through retirement. And they're seeing retirement as an incredible, important component. And when you think about more and more countries are focusing on how to become more self-reliant, whether that's in a form of technology or energy, there is more and more conversation about being more self-reliant on their own fundraising needs. And to do that is to move money from bank accounts into investable assets. And so retirement is a conversation where every country... Let me turn it to Martin specifically with the DOL question.
Thanks, Larry, and thanks, Greg. So We're really energized by this activity that we've seen from policymakers, consultants, plan sponsors. As I've said before, I've been doing this for 20-plus years. We've seen more advancements on private markets to 401k in the last 12 months than in the last 20 years. I would really applaud the leadership team at the Department of Labor for huge engagement with the industry, with the trade associations, with consultants, with plan sponsors, with companies. they've really sweated the details. And I think the notice to propose rule that the department released, to be honest, is better than we expected it to be and really paves the way, I think, for healthy engagement in this common period about opportunities to make this even more compelling for planned fiduciaries, and most importantly, to deliver diversified, professionally managed portfolios that put together public and private markets for long-dated retirement portfolios. You know, more than half the assets that we manage at BlackRock are related to retirement. As Larry mentioned in his remarks, we're the number one DCIO firm with over $600 billion in target date funds, and we're a top five private markets manager. So we see a great opportunity to really deliver for clients here. If you look at the Department of Labor Notice to Propose Rulemaking, it sort of goes through and emphasizes ERISA and a process-based review of six factors, performance, fees and expenses, liquidity, valuation, benchmarking, and complexity. And I think in Larry's comments from quarter to quarter, he's been very clear in talking about the value of things like frequent data, especially on that part of benchmarking and how plan sponsors and consultants can make good fiduciary sound process-based decisions under the protections of ERISA by leveraging data. We think that's a huge opportunity to do good while we do well, to do good for plan sponsors and for plan participants while we do well. Second, we think kind of delivering performance, value for money, liquidity, sound valuation, doing that in a target date fund, delivering these exposures in a target date fund, we think is the best way to do it for DC plans. If you look at inflows into 401k, they almost all come through QDIA, which is target date funds, balanced funds, and managed accounts that look like those things. So ultimately, we think that as and when the new DOL rule takes hold, we believe that a broader range of target date funds are really going to benefit from the diversification of private markets in a professionally managed vehicle that has fiduciary sound decision making. We have our product coming to market with Great Gray this year.
We're going to be launching a life path with privates, all of which is to try to build a track record so that plan sponsors and consultants can get more comfortable with these structures uh as the dol uh rule hopefully takes hold towards the back half of the year and we get uh really running in 2027. i would just add another macro view i think it's you know if we are going to really excel um as a country but across all countries the need for more citizens to grow with our country by utilizing savings and translating that into investing and to have a complete range of investable products whether they're you know passive or active public or private i think is very very important this is the type of conversations we're having across the spectrum of countries and opportunities i think there's a huge um awakening of understanding the power of retirement the power of retirement that flows through the capital markets. And so this is not just a U.S. phenomenon, but it's a phenomenon that is being discussed in all the quarters throughout the world.
Operator
Your next question comes from Alex Blostein of Goldman Sachs.
Good morning, Alex. Hi, Larry. Good morning. I wanted to ask you guys a little bit of a bigger picture question. So you mentioned your prepared remarks that in prior periods of dislocation, BlackRock tends to gain share. We've seen it in multiple cycles when there's more money in motion. Does that happen again this time around? And if so, I was hoping you could add a little more specificity in terms of which products and which asset classes BlackRock is best positioned to gain share if, in fact, we do see more money in motion on the back of all this and ultimately implications for the firm's organic basic growth over the next 12 to 18 months. Thanks.
Well, I think we've said it in different snippets, but I do believe We've our positioning in retirement, our positioning in now infrastructure and privates, our positioning in high shares and the breadth and the global footprint we have, we're just seeing more and more different types of opportunity. The speed in which we're deploying capital in GIP-5 and infrastructure, I talked about that the opportunities uh for more and more countries are looking to uh and having a great need to build out their infrastructure especially with this ai revolution going on uh actually now getting back to self-reliance more and more countries have a greater need to find different sources of power for self-reliance and dependent on the importation of energy so the need for building out, let's say, solar, which I talked about in my chairman letter a few weeks ago. But I do believe it's our positioning across ETFs, the scale of ETFs, the granularity of ETFs, which are unmatched by any other ETF provider. And then just the entire footprint allows us to have these different types of conversations globally. In the U.S., as Martin just discussed, the role of a period in terms of tax advantage portfolios as the threat of higher taxes and all these other issues are playing into the strength of the platform that BlackRock systematically built over the last 20 years. And I think if you think about the platform that we built, the book across public and private markets, and now the platform we built across public and private markets, overlaying investment technology has given us this unique ability to have conversations in all the corners of the world. And I can't underscore enough the conversations we're having related to the growth and role of capital markets. I have had conversations even in this week about the need for Europe to have a capital markets union. What does that mean? The conversations we're having across Japan and the Middle East and every other corners. I was in Mexico last week talking about that role and that opportunity. So we're involved in these conversations at the government level, but involved in these conversations at the institutional level, and our platform also speaks to the wealth platforms worldwide. Martin, do you want to follow up with any more of that?
Yeah, I think Larry captures the sort of gestalt of the client perspective, I think, beautifully. Alex, I'd note for you that March 2026 was the worst month for broad markets since September 2022. In September 22, broad stocks were down 10%. Broad bonds were down 4% to 5%. In March 26, stocks were down 7% to 10%. Broad bonds traded down 2% to 3%. I think BlackRock is getting better and better and better through market environments of taking share and delivering more sustained organic growth. and we think we can confidently and consistently deliver 6% to 7% growth from our structural growth segments when markets are especially supportive or when clients rotate into higher fee segments in any quarter. There's two broad vectors for this growth. The first is structural growers. The second is whole portfolio relationships. The structural growers are the products and services that have this all-weather growth. their ETFs, their private markets, models, tax-aware strategies like Appirio and SpiderRock and Systematic. They're the ones where I think we take disproportionate share as those structural trends advance forward. But the second avenue of sustained organic growth is whole portfolios, right? It's that clients want to consolidate business with fewer providers. They're looking for more from the platforms that they do business with. So share gains are a source of organic growth for scaled players like BlackRock. I mean, if you look at the industry flows for the last several years, the top five asset managers, they're consolidating 80 plus percent of the flows. But this is still an extraordinarily fragmented business by assets and revenue. So this ability to consolidate share is another avenue of sustained organic growth. And my own sense of the markets today across some of the private credit tumult is that this is an opportunity for BlackRock to take share in that market, particularly in private markets across wealth platforms, where clients are saying, we want a more whole portfolio relationship so that we can think about how to put our public markets together with our private markets, how we can manage our practices through these market cycles. So we actually think some of this shakeout and credit is actually good for our organic base fee growth profile away from the structural growers that we're confident in already.
Operator
Your next question comes from Mike Brown of UBS.
Great. Good. Good morning, Larry. That's a bit more of a macro question here. With the Middle East conflict, that certainly presents some clear geopolitical macro challenges here that could perhaps shift some of the capital priority. You touched on that a little bit here, but But are you seeing any change in sovereign wealth behavior as they think about allocations and maybe any read on Asia, just given some of the added pressure to their economies from higher energy prices? Thank you.
Specifically in the Middle East, we have not seen any change in behavior. This week, I'm meeting two finance ministers from the Middle East. We could tell you in some of the co-investments that we've done already in the last few months, the Middle East has participated quite largely in some of our co-investments and their opportunities. So in actuality, we've seen actually no change of behavior. We have an announcement that's forthcoming in the next week or so related to, you know, retirement win we have in the Middle East. So actually, very little behavior changed, but our dialogues are probably a little more constant, a little more, you know, talking about how should they play all this and what should they do. But at this moment, we have not seen any withdrawals from sovereign funds to the treasuries of these countries. If anything, I think the money is still continuing to flow into their own individual sovereign funds but their investment behavior has not changed now obviously things could change if if there's a prolonged uncertainty and a prolonged violence in the region so on that note you know we are working closely with our our friends our employees everybody who who is affected by this conflict so we have spent a lot of time there we've been working with our employees. Over the course of the last year, we've built out our offices in almost every country in the Middle East. And so we and with the idea that we see huge opportunities, we are continuing to build up those offices. Obviously, there is stress around that at the moment related to the conflict, but we see no behavior changes at all. And in fact, they're probably more they're articulating, I would say more opportunities, not less opportunities at this moment. Related to any places in the world where higher energy costs is a tax, as I said earlier, we were witnessing in some places where the increase in energy costs are being absorbed by governments, and that's happening in parts of Europe already and also in Asia. All that means is, you know, the deficits are are probably to be rising or I need to do as they build that infrastructure need for more public private is more realistic and so I would argue this all presents bigger and better opportunities across the board that that being said we obviously we don't have any uh insight as to uh how and when the the the this conflict will end um but we are in constant dialogue with our partners and our friends in the Middle East we're in we probably have had more client calls uh more calls with leadership and governments than ever before and we need to be making sure that we're staying in front of our our clients and remain a trusted partner and and I think the evidence speaks quite loudly that we are one of their key trusted partners your next question comes from Brian Bedell of Deutsche Bank Oh, great.
Hey, good morning. How's everyone doing? I think well. Excellent. So, a question on a two-parter, one for Martin and then one for Larry, but it's around organic base fee growth and scaling that. So, you know, beta has always been your best sort of incremental margin opportunity, but as you grow the organic base fee growth faster, do you see a better ability to scale that over time? And, you know, are you seeing more demand from outside the U.S.? Like you said, there was an incremental shift towards non-U.S. Are you seeing that continuing? And then if you could just comment on the, you know, nice expansion of the base fee rate, But if you can comment on what you're seeing as the exit base fee rate for the quarter. I don't think I heard that.
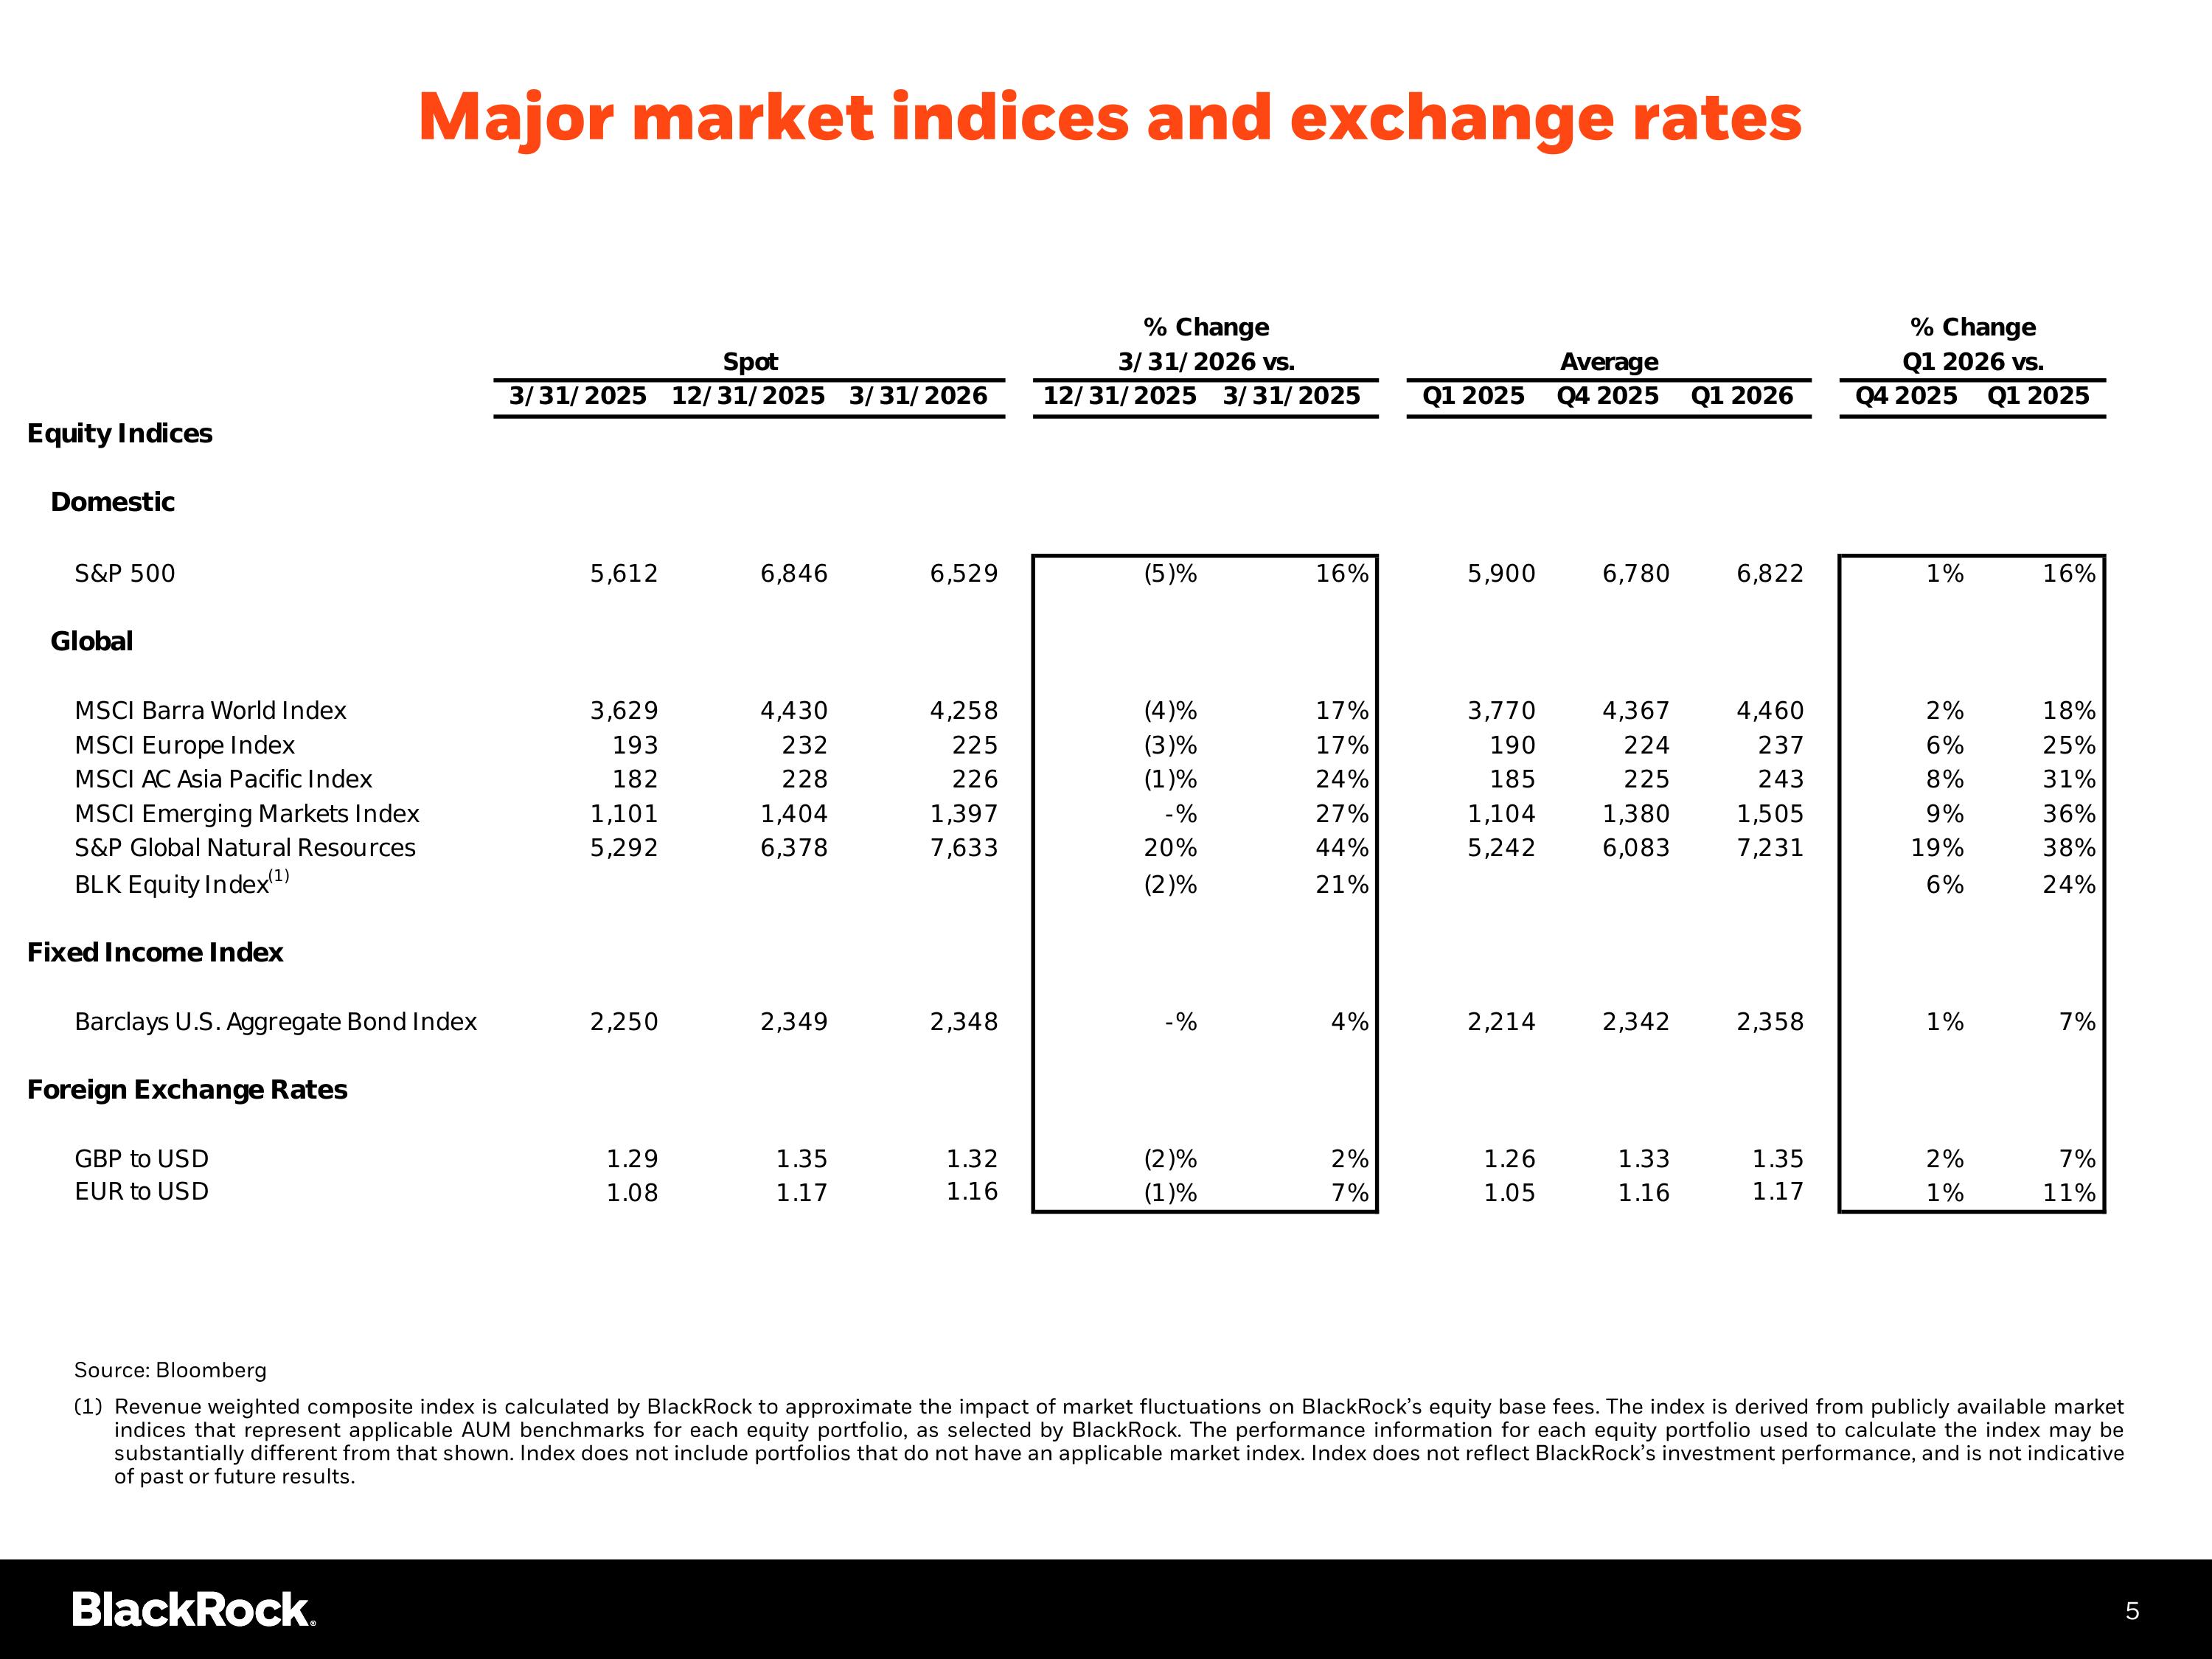
Let me turn that to Martin. Thanks, Brian. Hope you're well. So maybe I'll start just on kind of margin. We continue to deliver industry-leading margins over the cycle. And as I laid out at 2025 Investor Day, we continue to target a 45% or greater adjusted operating margin, with our margin on recurring fee-related earnings running higher. We expanded both operating and recurring FRE margins by over 100 basis points this quarter. We did that in an environment where AUM actually finished on a spot basis lower than average. Our operating margin for the quarter was 44.5%, while the margin X performance fees and related comp was 45.6. I guess on the forward, what I'd say is we've run BlackRock at margins north of 45% before. We've run them close to 47% back in 21. And we did that at a time when we didn't have a large-scale private markets franchise. Now we've added these engines of infrastructure and alternative credit with our colleagues from GIP and HPS. Both of those franchises were north of 50% FRE margins when they joined BlackRock. So I think we can ultimately do two things. Over time, we'll see the margin on fee-recurring earnings driving upwards towards the trajectory of what I'd say is the best-in-class private markets names, north of 50%. We think we can do that through the acquired businesses, but we also have these highly scaled franchises and ETFs and digital assets and systematic equities that can help propel FRE margins higher. And then second, with constructive margins, excuse me, with constructive markets, with a higher fee rate on flows, which we've been driving, and strong organic growth, we can pull the fully burdened operating margin of the company up as well. And as I said, we've run the company at 47%, so I don't see 45% or 46% as a ceiling. As you mentioned, we had 8% annualized organic base fee growth in the quarter, 10% over the last 12 months. That's seven consecutive quarters over 5%. The fee rate was up two-tenths of a basis point sequentially. That's on strong market performance in our higher fee public markets book, particularly coming from EM and international equities, along with this client demand for international iShares exposures and the systematic growers that have higher fee rates, like systematic equities, private markets, Appirio, and active ETFs. What I'd say is global equity markets have improved in April, and we always disclose the revenue-weighted indexes in the supplement, but the BlackRock equity index is up about 5% in the first two weeks of April. At the end of March, our base fee entry rate was approximately 2% lower than the first quarter base fees, but that's basically been recovered with the April market performance.
Operator
Your next question comes from Dan Fannin of Jefferies.
Thanks. Good morning. I was hoping you could expand upon some of the trends at HPS and just private credit broadly and distinguish between the institutional conversation activity versus what you're seeing in retail and also comment on deployment in this type of market as well.
Martin? Yeah, I guess I'll start with, you know, first that, you know, HLend is one of the best performing non-traded BDCs in the market. It's logged 10.4% annualized total return since inception. It's one of the only funds among major peers with positive performance in 26, with 840 million of Q1 subscriptions, including the DRIP, and approximately 150 million for the April window. We continue to see good engagement with the HLEN base. We continue to see good engagement across wealth clients for evergreen structures. And we continue to believe that we can grow there through time. I would offer just briefly that I think BlackRock's in a different place than other firms on these questions. For BlackRock, our 2030 strategies to drive organic base fee growth at 5-plus percent through a broad public-private markets platform. and our track record showing that we can more consistently generate six to eight percent and so we're not reliant on any one engine we're not reliant on uh on any one um on any one product so we may or may not go through a period of elevated redemptions relative to historical levels and more muted subscriptions and wealth channels for private credit funds we don't know for certain we do see long-term demand for institutional grade private credit as intact And HLEN flows and fee rates are just generally accretive to our 2030 plan, whether they're at 25% or 50% or 75% of historical levels. We're broadening out the evergreen lineup, as I mentioned, with real assets, with net lease strategies, with Europe. So we think we have great opportunities to grow in wealth. What I'd say is the business is generally about 10% retail private markets at BlackRock. So call it 85 to 90 percent of the base is institutional. And there we've actually seen strong demand. If anything, with some of the retail pullback, we've seen stronger institutional fundraising, stronger institutional deployment. And some of the spreads that we see today in direct lending and asset-based finance are some of the most attractive on this market pullback. So we generally are very constructive on institutional fundraising in and around private credit strategies.
Operator
Your next question comes from Brennan Hocken of BMO Capital Markets.
Good morning. Thank you for taking my question. Curious to hear your plans. We saw that you guys filed for the IQQ. So curious to hear your plans around that and the NASDAQ complex and whether or not you guys are considering a fee holiday to help your product gain scale. Looking at the S&P complex, it's much larger. So if we see a chance for competing products to get launched there, do you – the idea that it would ban the pie versus cannibalize?
Good. Thanks, Brennan. Hope you're well. So we filed a registration statement with the SEC on the NASDAQ 100 Index ETF, the IQQ. So due to those regulatory filing restrictions, we're not able to provide a lot of detail beyond what's in the filing. What I will say is that at BlackRock, we have a longstanding and continuously growing partnership with NASDAQ. We're already the largest manager of NASDAQ 100 ETFs outside the United States. We manage $25 billion across ETFs listed in Europe, Canada, and Hong Kong. In the U.S., we also have the NASDAQ Top 30 and Next 70 Index ETFs, as well as the NASDAQ premium income ETFs. And now IQQ is similarly trying to facilitate access for U.S. investors with an iShares quality option in one of the most widely tracked indexes. We're differentiated at BlackRock. We've got two distinct global ETF ranges, the U.S. and Europe. These scaled platforms enable us to port proven growth franchises and distribution approaches across geographies that's a meaningful differentiator for BlackRock so we believe we continue to grow access to these exposures with high quality iShares institutional grade management and we look forward to keeping you updated on our progress once we get through the registration period ladies and gentlemen we have reached a lot of time for questions Mr. Fink do you have any closing remarks Thank you operator.
Thank you for all joining us this morning and for your continued interest at BlackRock. We open 2026 with one of our best starts to the year on record. We're aligning our platform alongside long-term client needs and structural growth drivers and it's showing up in a meaningful way in our results. The strength of the firm, our breadth, our scale, our connectivity is positioning us well to continue to be delivering value for our clients and differentiating long-term growth for our shareholders. Thank you and have a good quarter.
Operator
This concludes today's teleconference. You may now