Speaker 0
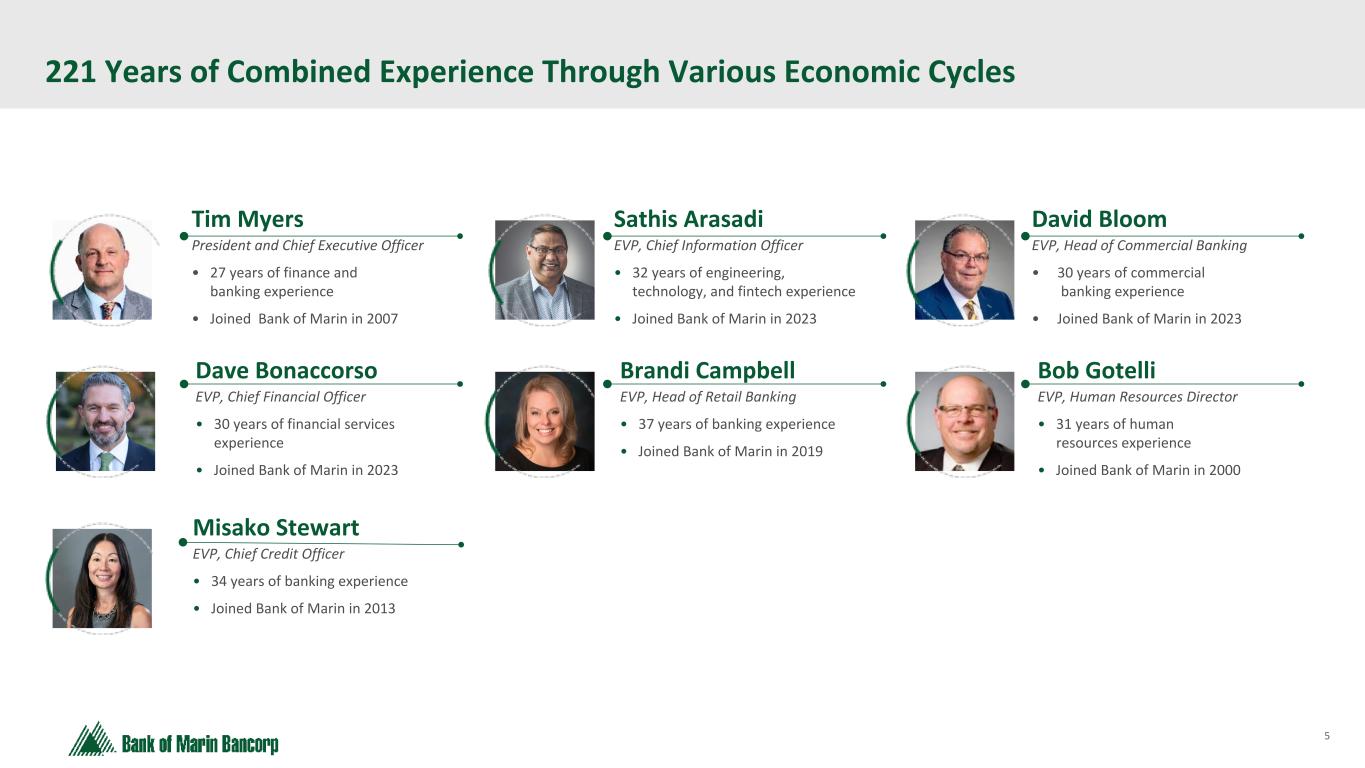
Good morning. Thank you for joining Bank of Marin Bancorp's earnings call for the first quarter ended 03/31/2026. I am Krissy Meyer, Corporate Secretary for Bank of Marin Bancorp. During the presentation, all participants will be in a listen-only mode. After the call, we will conduct a question and answer session. Joining us on the call today are Bank of Marin President and CEO, Timothy D. Myers, and Chief Financial Officer, David Bonaccorso. Our earnings news release and supplementary presentation, which were issued this morning, can be found in the Investor Relations section of our website at bankofmarin.com, where this call is also being webcast. Closed captioning is available during the live webcast as well as on the webcast replay. Before we get started, I want to note that we will be discussing some non-GAAP financial measures. Please refer to the reconciliation table in our earnings news release for both GAAP and non-GAAP measures. Additionally, the discussion on the call is based on information we knew as of Friday, April 24, 2026, and may contain forward-looking statements that involve risks and uncertainties. Actual results may differ materially from those set forth in such statements. For a discussion on these risks and uncertainties, please review the forward-looking statements disclosure in our earnings news release as well as our SEC filings. Following our prepared remarks, Timothy D. Myers, David Bonaccorso, and our Chief Credit Officer, Misako Stewart, will be available to answer your questions. I will now turn the call over to Timothy D. Myers.
Speaker 1
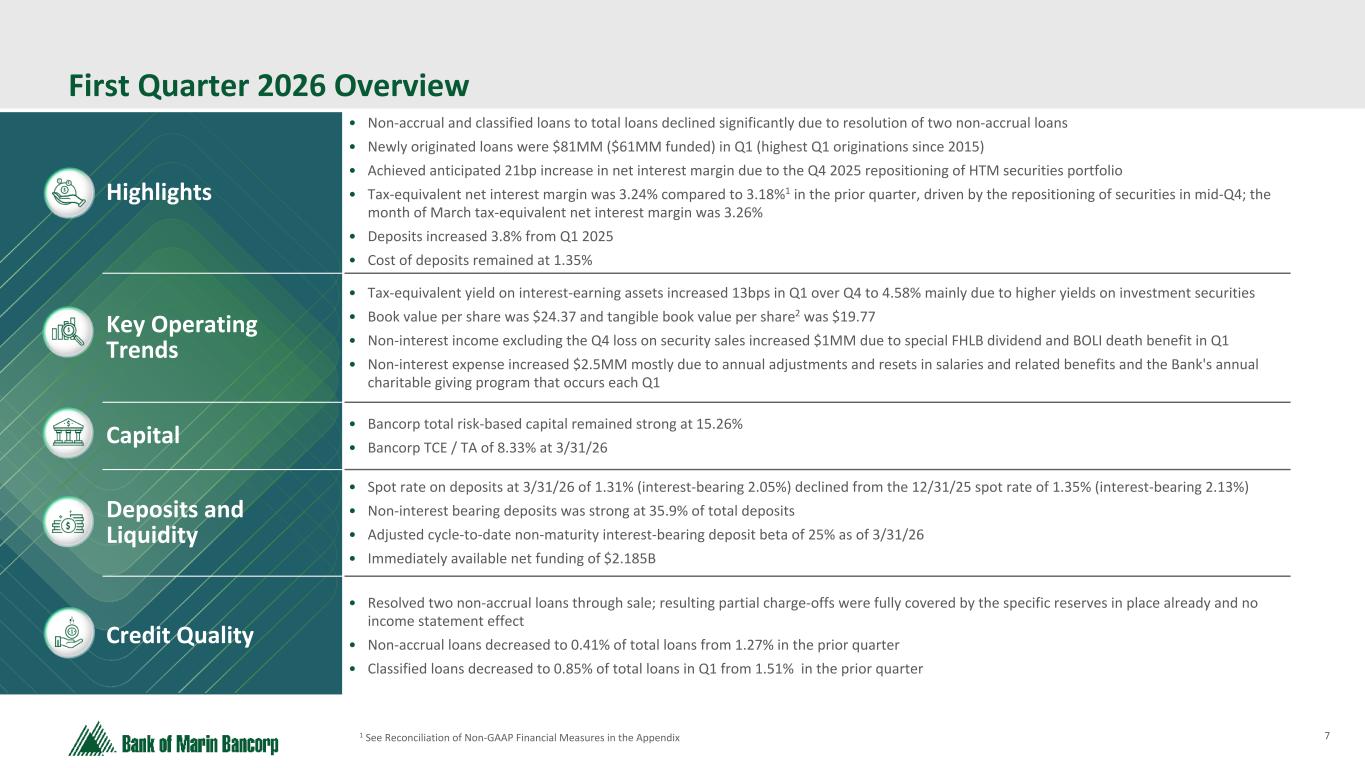
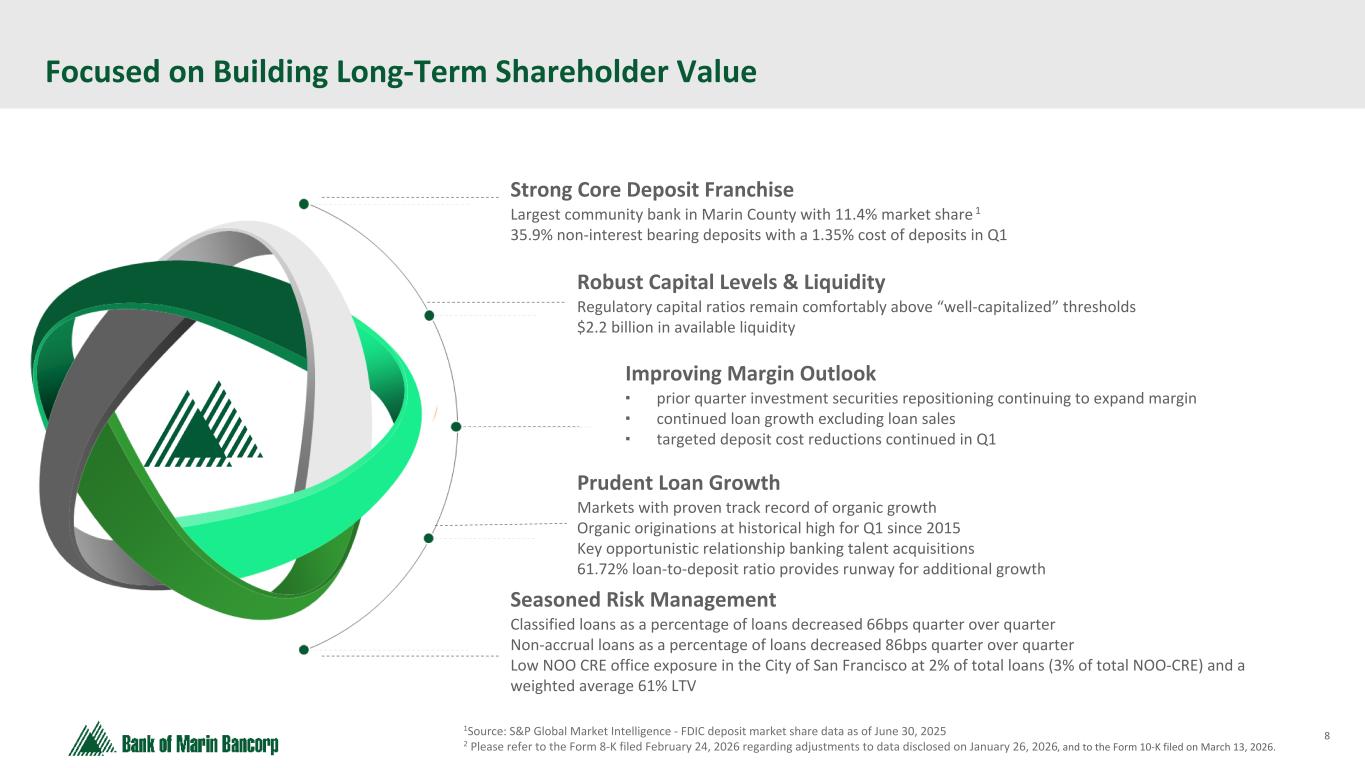
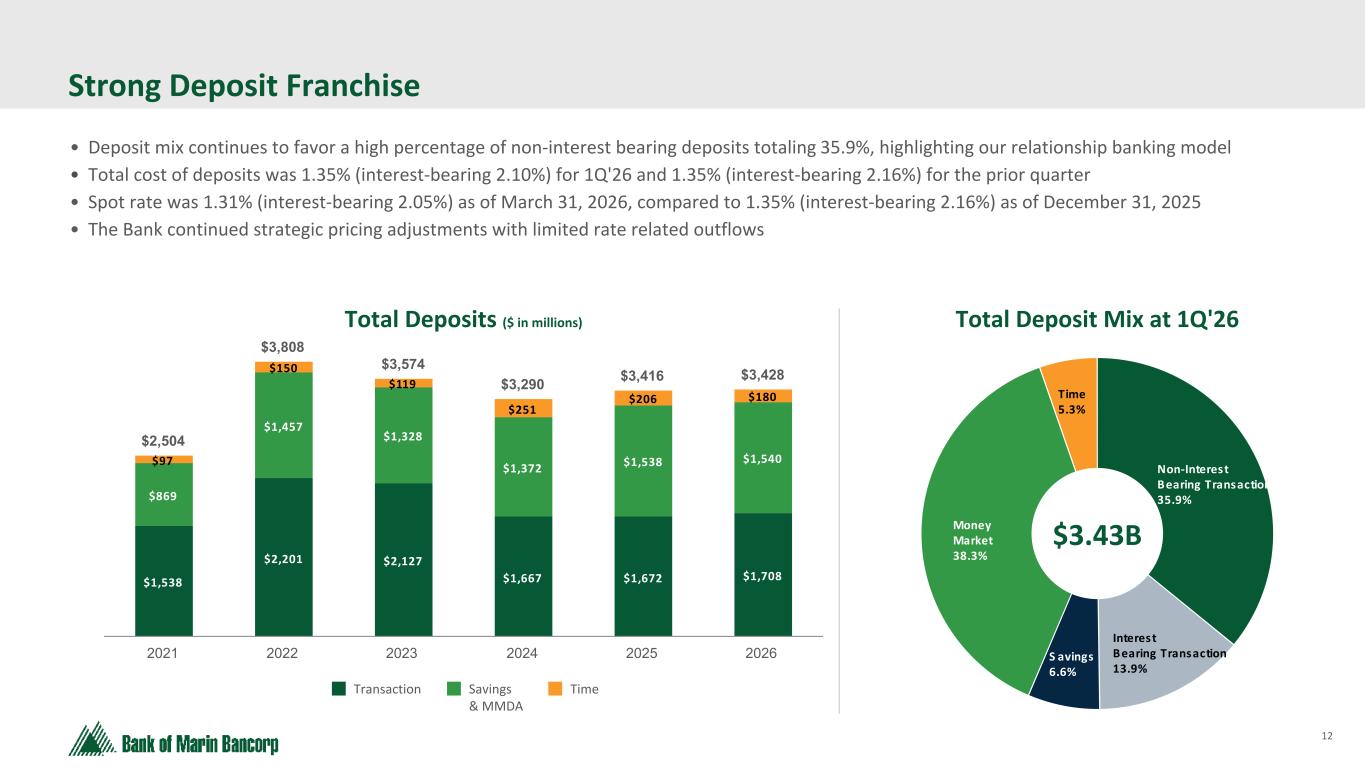
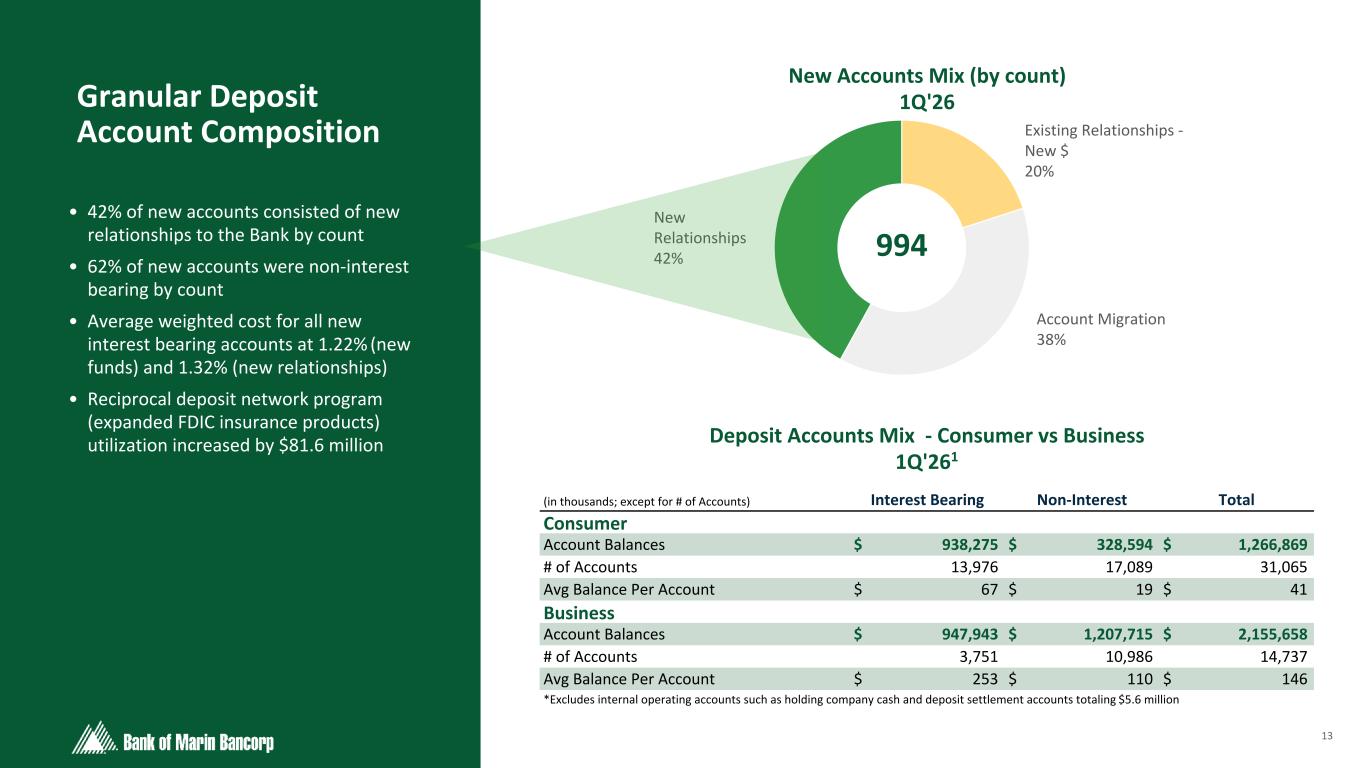
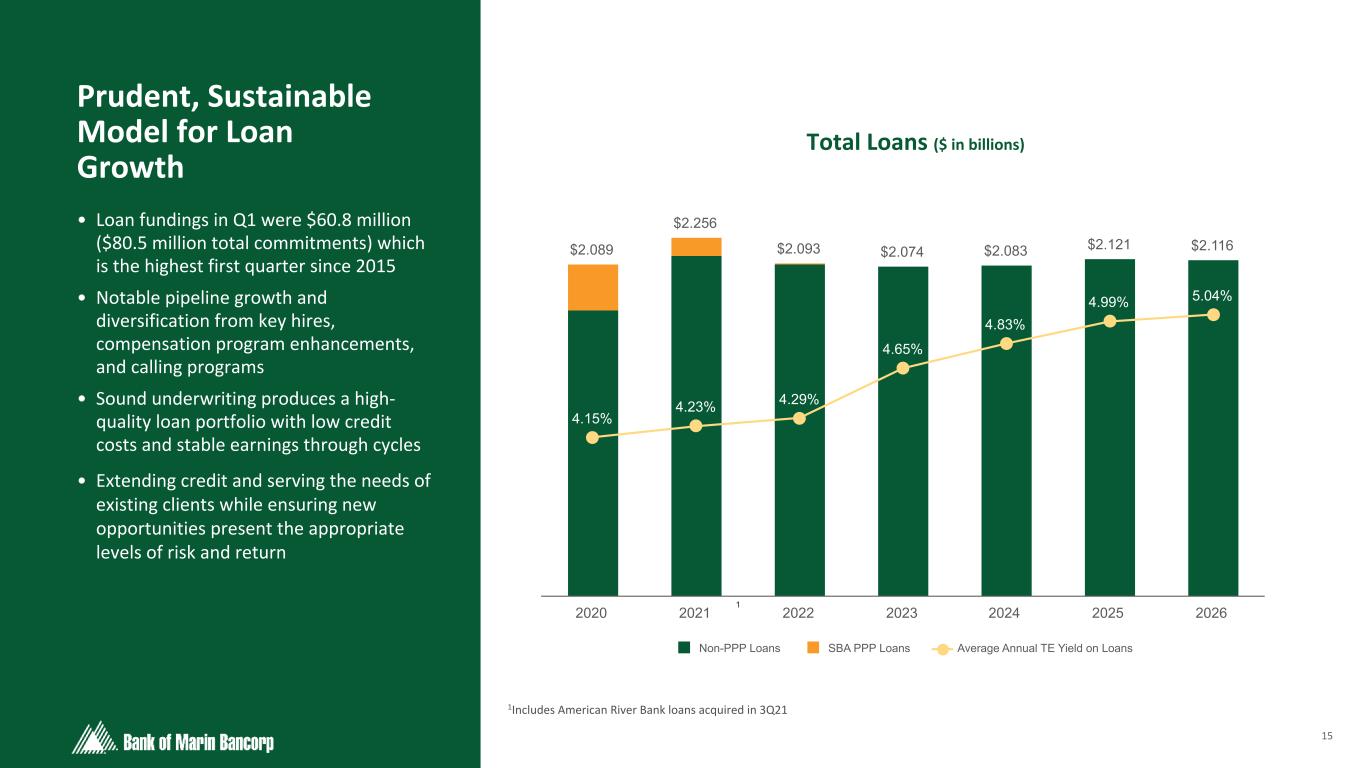
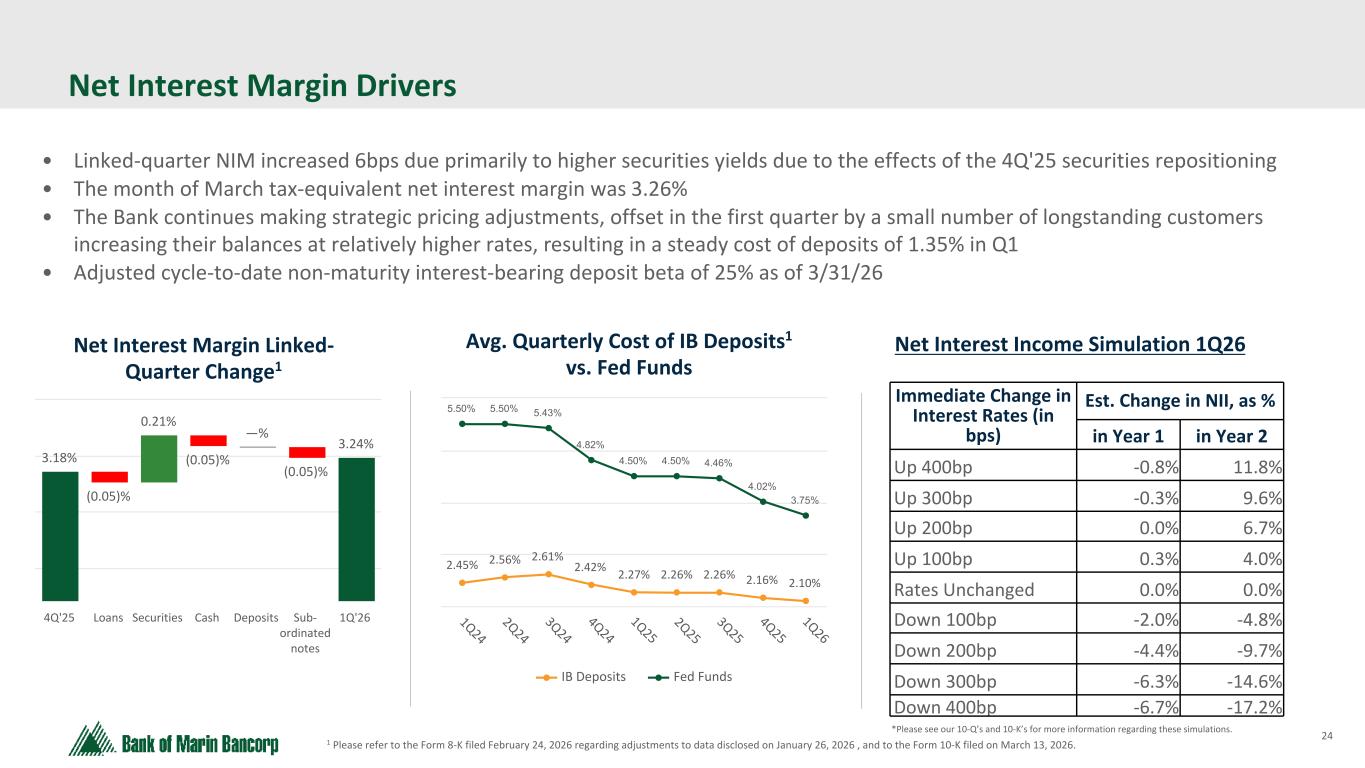
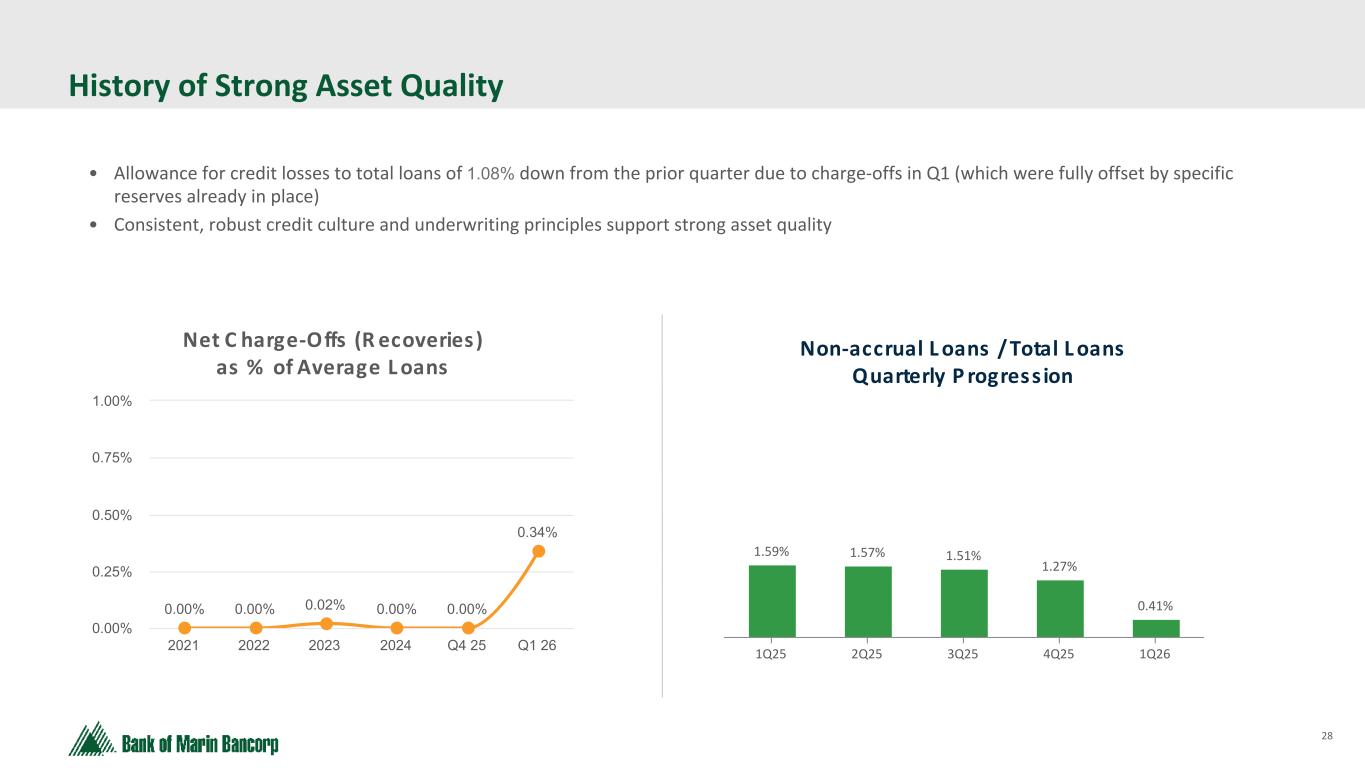
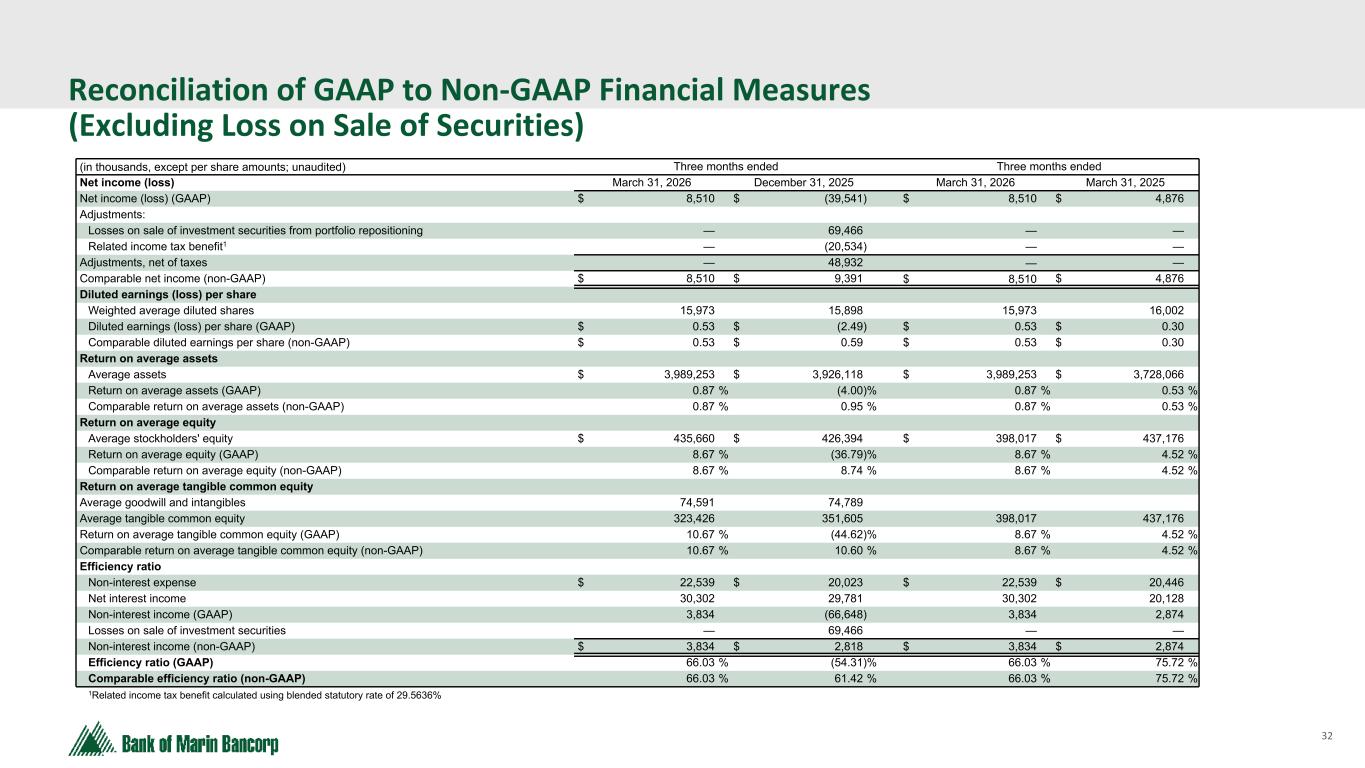
Thank you, Krissy. Good morning, everyone, and welcome to our quarterly earnings call. We are very pleased that our execution in the first quarter across a number of key areas resulted in continued improvement in year-over-year profitability metrics, loan production, net interest margin expansion, and improved credit quality. I would like to discuss our first quarter highlights. Compared to 2025, net income and earnings per share grew by 7,577%, respectively, in the first quarter of this year. Largely due to the repositioning of our balance sheet, our net interest margin increased 6 basis points on a sequential quarter basis and 47 basis points over the prior year’s period. During the quarter, we originated $81 million in new loans, $61 million of which was funded, an almost 30% increase over the prior year’s period. While the first quarter is a seasonally slower period for production, the additional hires we made to our banking team, the generally favorable economic conditions we continue to see in our markets, and a healthy increase in commercial real estate loan demand led to our strongest first quarter in a number of years. New loan product allocation was roughly in line with our existing portfolio with a slight skewing towards C&I. During the quarter, we worked diligently to improve our credit quality. We sold our longest-tenure classified and nonaccrual loans totaling $16.3 million, which were downgraded to substandard in 2021 and moved to nonaccrual in 2024. At that time, we took specific reserves of $7.3 million based on property valuation. The note sale proceeds validated our reserve assumptions, with the charge-offs equaling the specific amounts reserved. While other workouts were offset by new downgrades, the impact of the note sales on credit metrics was substantial. Nonaccrual loans declined from 1.27% of assets to 0.41%, and the ratio of classified to total loans decreased from 1.51% to 0.85%. Notably, following the note sales, virtually all of the remaining nonaccrual balances are comprised of one non-owner-occupied commercial real estate loan that has no loss expectations based on underlying valuation and cash flow. Despite strong seasonal loan originations, Q1 loan growth was negatively impacted by our nonaccrual loan resolutions. Excluding these purposeful exits, loan payoffs were roughly in line with the prior year’s period and were generally driven by asset sales and cash payoffs. We continue to experience elevated payoffs in consumer-related loans, primarily within acquired portfolios including auto and mortgage loans. Despite these dynamics, our net interest margin benefited as new loans came onto the books at an average rate that was 40 basis points higher than the average rate on payoffs. A Q4 interest recovery of $667 thousand not repeated in Q1 and the decreased number of days in the first quarter masked that rate-spread benefit. Excluding other unique transactions, we believe our loan originations will positively impact the net interest margin in 2026 going forward. Our banking team continues its relationship-based approach to attract lending opportunities and to cultivate new, deeply rooted relationships, with particularly strong momentum in the first quarter in the Greater Sacramento area. While we continue to navigate a competitive market environment on pricing and structure, we have attracted a significant amount of new client relationships while maintaining our disciplined underwriting and pricing criteria. Our total deposits increased in the first quarter due to a combination of increased balances from long-time clients as well as continued activity bringing in new relationships. The rate environment remains competitive and clients remain rate sensitive; however, they continue to bank with us for our service levels, accessibility, and commitment to our communities, allowing us to continue reducing our cost of deposits while growing our deposit base. With that, I will turn the call over to David Bonaccorso to discuss our financial results in greater detail.
Speaker 2
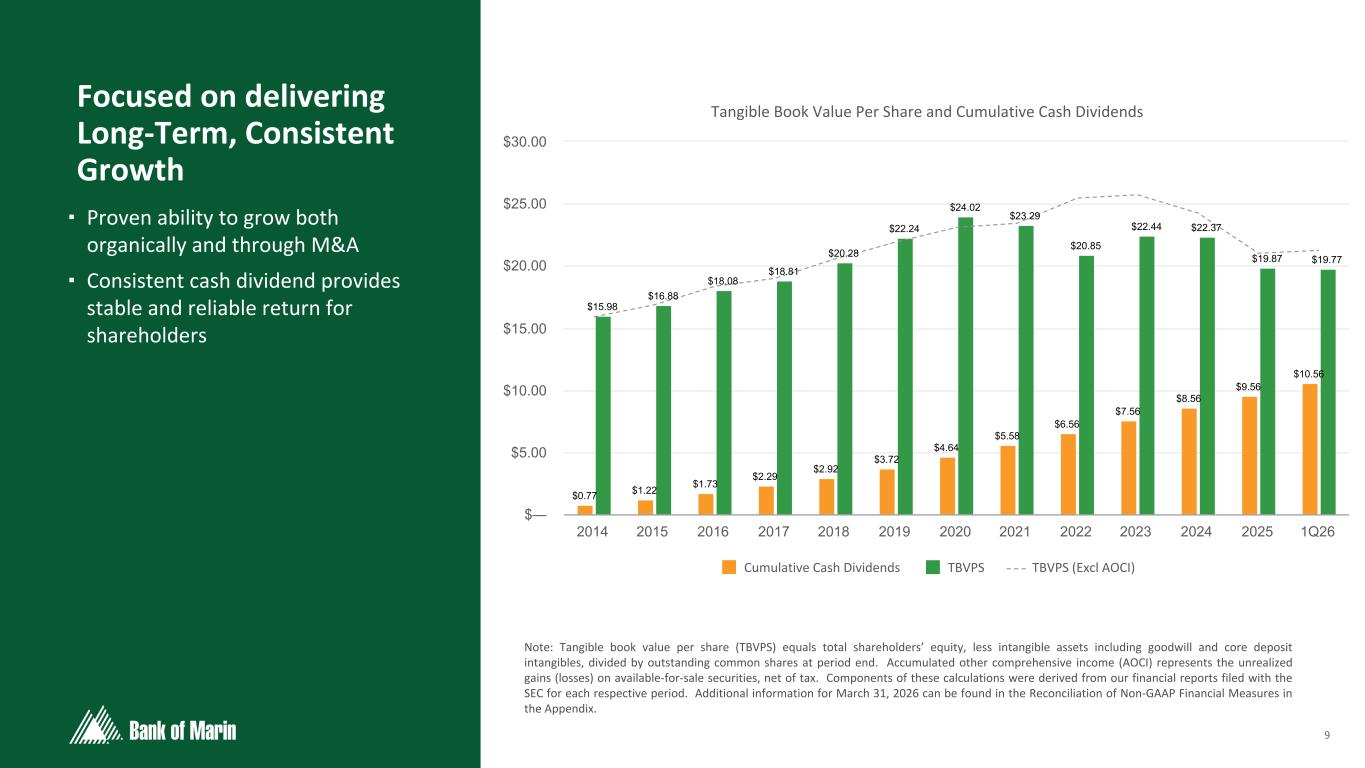
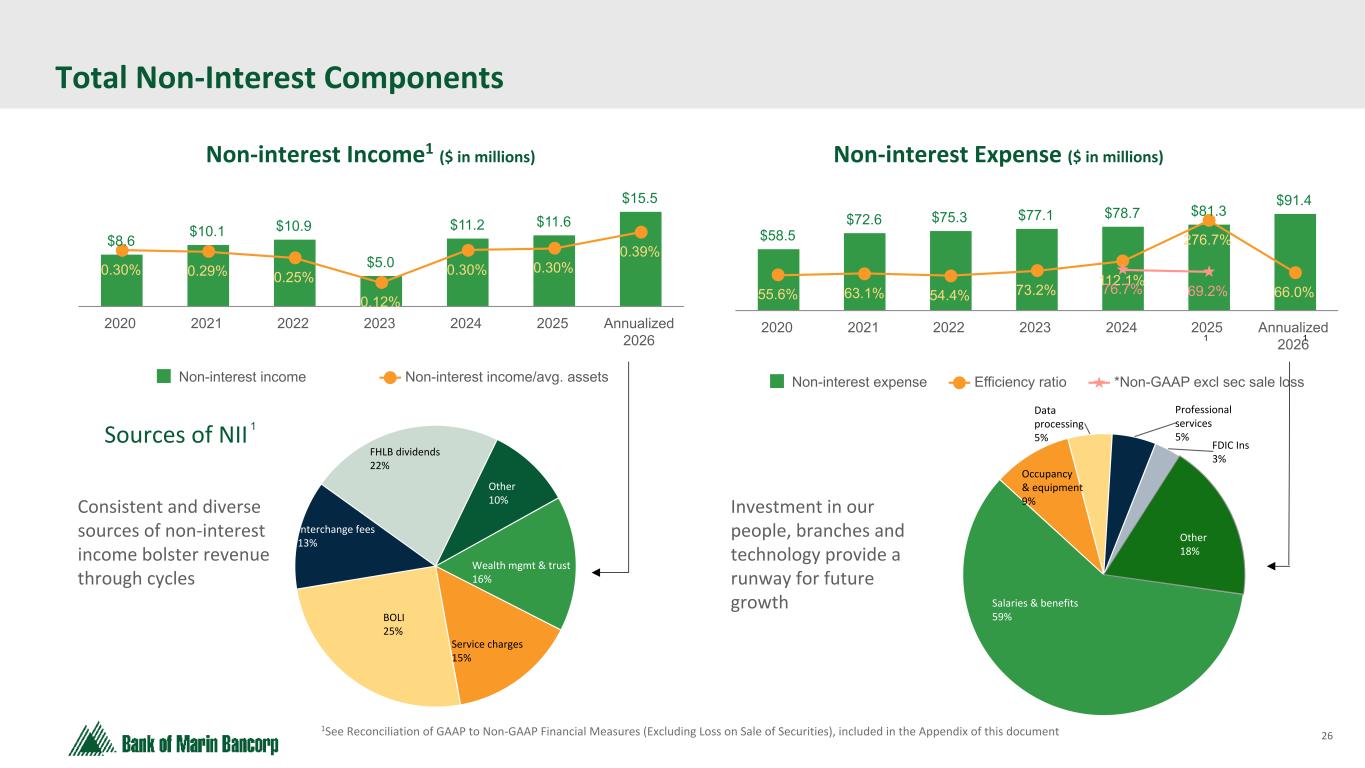
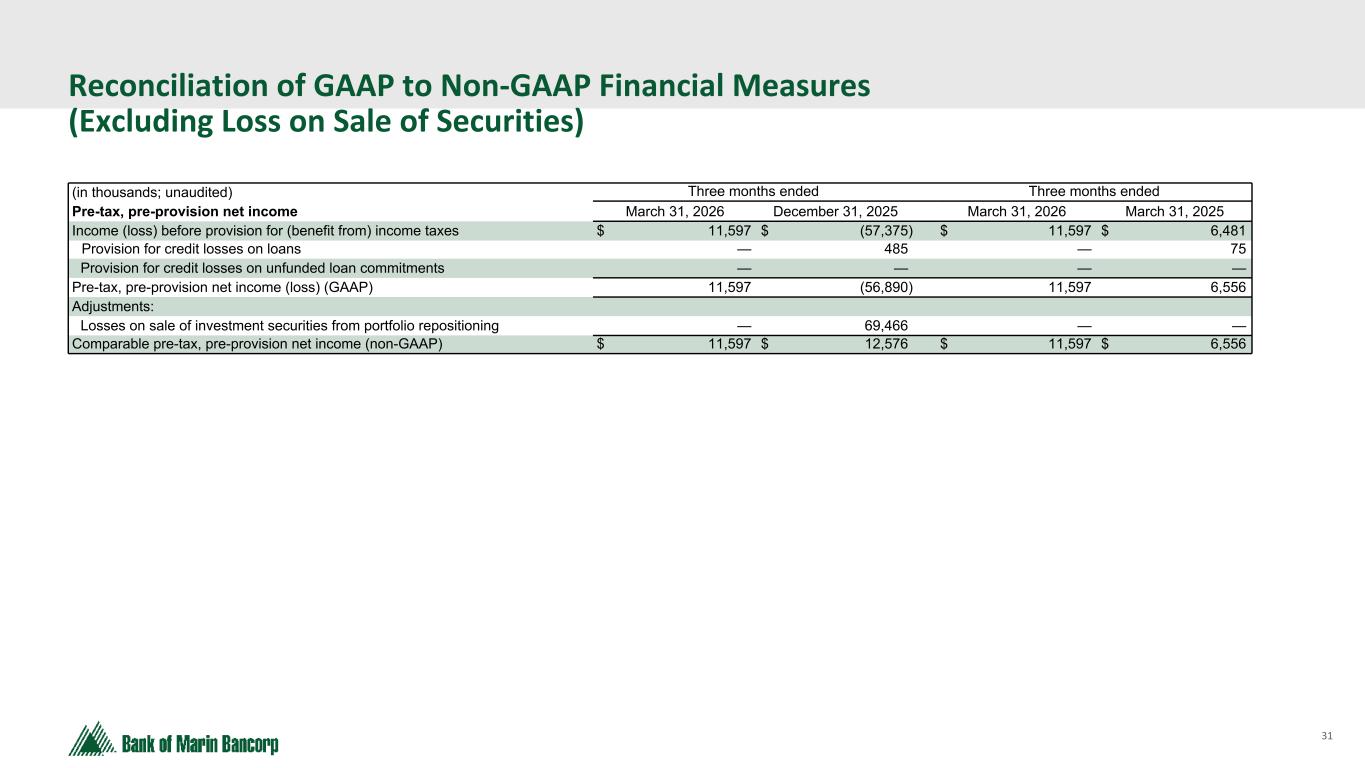
Thanks, Tim, and good morning, everyone. Our net income was $8.5 million, or $0.53 per share. Our net interest income increased from the prior quarter to $30.3 million due to average balance sheet growth and higher investment security yields and reduced deposit costs, as well as the positive churn in the loan portfolio that Timothy D. Myers discussed, resulting in a 6 basis point increase in our net interest margin. Adjusting for the fourth quarter recovery of interest and fees on a paid-off nonaccrual loan relationship, our sequential quarter net interest margin growth would have been even more impressive at 14 basis points. During the quarter, the expansion of a deposit relationship with a relatively high cost was a headwind to net interest margin. At quarter-end we moved a portion of these funds off balance sheet to take advantage of a relatively high one-way sell rate, which boosts our overall net income and contributes to noninterest income. This opportunity has persisted into Q2; we will continue to look for opportunities like these to actively manage our balance sheet to improve shareholder returns. Moving to noninterest income, most areas of fee income were relatively consistent with the prior quarter, although we did receive a special dividend on FHLB stock as well as a BOLI death benefit, which positively impacted our total noninterest income in the first quarter. Our noninterest expense increased by $2.5 million from the prior quarter, primarily due to higher salaries and employee benefits related to seasonal salary and benefit accrual resets, including payroll taxes, incentive compensation accruals, profit sharing, insurance, and 401(k) matching. The first quarter also included a higher level of our annual charitable giving, which we expect will comprise almost 70% of the total for 2026. Overall, Q1 noninterest expense was broadly in line with our expectations. Though charitable giving is expected to return to more normalized levels during the coming quarters, we otherwise expect noninterest expense to continue near current levels as we continue to invest in people and technology, which we believe will fuel our growth and ultimately drive shareholder returns. Due to the improvement in asset quality in our loan portfolio and the substantial level of reserves we have already built, we did not require a provision for credit losses in the first quarter, and our allowance for credit losses remained strong at 1.08% of total loans, which we believe is an appropriate level following the sale of our nonperforming loans. Given the continued strength of our capital ratios, our Board of Directors declared a dividend of $0.25 per share on April 23, the eighty-fourth consecutive quarterly dividend paid by the company. With that, I will turn it back over to you, Tim, to share some final comments.
Speaker 1
Thank you, Dave. We continue to see stable economic conditions in our markets. Our credit quality continues to improve. Our loan pipeline remains strong amid healthy demand, and we continue to expect to generate solid loan growth in 2026 while also continuing to grow deposits through the addition of new relationships and expansion of existing client relationships. Given the positive trends we are seeing in many key metrics, we expect to continue to deliver strong financial performance for our shareholders as we move through the year. With that, I want to thank everyone on today’s call for your interest and your support. We will now open the call to questions.
Operator
If you would like to ask a question, please click on the raise hand button at the bottom of your screen. Once prompted, please unmute your line and ask your question. We will now pause a moment to assemble the queue. Our first question will come from Matthew Clark with Piper Sandler. You may now unmute and ask your question.
Speaker 1
Good morning, Matthew.
How much was the interest reversal that negatively impacted the loan yield on a dollar basis? That was prior, in Q4? It was, I believe, $667 thousand. Oh, okay. I am sorry. I think I misheard you. I thought there was another one in Q1. There is not; it was—
Speaker 1
Quarter over quarter, part of the decline was impacted by that $670 thousand interest accrual reversal in Q4.
Got it. Okay. Thank you. And then I saw the spot rate on deposits. How are you thinking about deposit costs beyond that spot rate with the Fed on hold, and what would you suggest is your marginal cost of new deposits these days?
Speaker 2
I think, similar to what we have done in recent quarters, we will continue to make targeted adjustments away from Fed cuts. Obviously, probably fewer Fed cuts are expected now than compared to what the market was expecting to start the year. So that is how we will continue to address that. We also have time deposit repricing happening in the background; I believe that was a 24 basis point decline sequential quarter. So those are a couple of data points. Anything else you want to add, Tim?
Speaker 1
No. I think some of the pressure on total deposits continues to be just large existing clients that have relationship rates that continue to go up. Some of that we are managing with one-way sells, etc. But overall, we continue to look for off-cycle reductions. And as you noted, the spot rate is 4 basis points lower than the total deposit rate at the end of the year.
Yep. Okay. Great. And then you have not bought back stock for the last couple of quarters. You have a lot of your credit pretty much resolved here. How should we think about the buyback here going forward?
Speaker 1
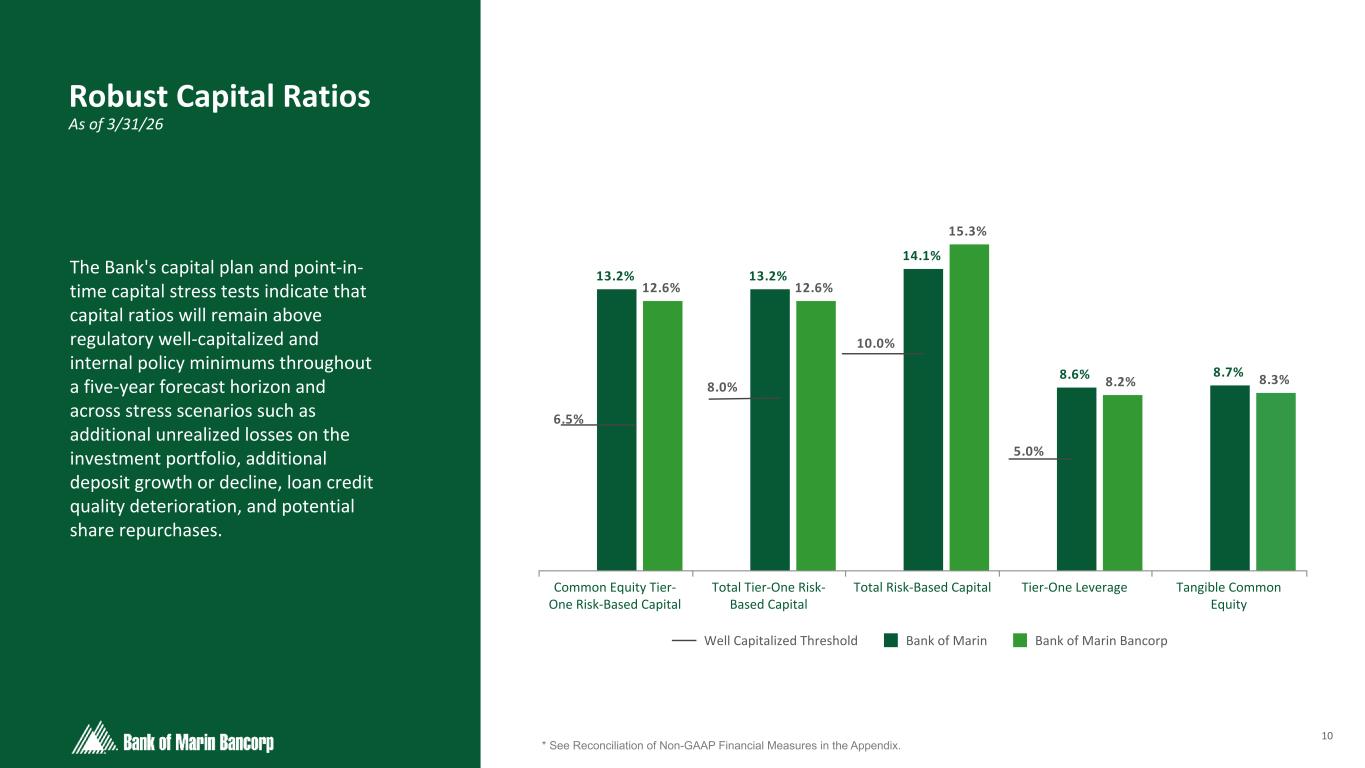
As we described when we did the balance sheet restructure, given that we got support from the regulators and our constituents to do it without any equity raise, just with sub debt, we had said we were going to earn our way back into a median leverage ratio or CET1 ratio coming back toward peer levels. Certainly at the time, the perception was that holding more capital is better in the event that the credit situation with those loans worsened. As you noted, taking that off the table brings us closer to having a comfort level to do that. So it is a conversation we are going to start having. But we still want to earn our way back into a bit of a higher ratio before maybe embarking on that. Not needing to keep capital for the risk inherent in those deals we shed during the quarter makes us feel better about having that conversation. I do not want to overpromise, but that did remove a big hurdle for sure.
Operator
Your next question will come from Jeffrey Allen Rulis with D.A. Davidson.
Speaker 5
I guess, kind of following the restatement you had during the quarter, trying to get my bearings on the margin and expense levels. I think you outlined the expense expectation—it sounds like pretty flat from here, a pretty front-end loaded Q1 and then leveling off. But if I try to get into NII and the margin, I think we had discussions of a terminal margin level in the high 3s given the adjusted number is sort of a mid-3 figure. I am trying to get a sense for—there has been a lot of restructuring and repositioning. It sounds like there is still an upward bias to the margin, but all in, whether specific or not, what margin level is indicative of the balance sheet today?
Speaker 2
I think on a full-year basis, mid-3s is probably still appropriate, in line with the comment you just made, obviously adjusted downward given the restructuring. We covered deposit costs a little bit, but we still think there are decent tailwinds with regard to loan repricing.
Speaker 5
So, Dave, the step-up this quarter, linked quarter—the jump-off rate of March is 3.26%. And you are saying by the end of the year, a mid-3s is doable. Would that put the linked-quarter margin increase—give or take—a pretty good proxy?
Speaker 2
I would look at it a different way. You are probably looking at a handful of basis points a quarter. There are some movements comparing off the prior quarter with that nonaccrual loan payoff, etc. But that is how I would think about it moving ahead: with the benefits to loan repricing, that is probably worth a few basis points, and then any other deposit repricing benefits we have along the way would add to that, such that you get potentially up to a mid-3s number for the year.
Speaker 5
That is great. Thank you. And then maybe just one other question on the credit side. The timing of the large loan resolution—is that its own independent path, or do you find that is indicative of something moving in the market that makes you feel like you can move forward on this other larger $8 million owner-occupied CRE? Or do you view them really independently? Is that something that you were chasing down separately? And for this remaining loan, do you expect the workout phase to continue for quarters to come?
Speaker 1
They are completely different animals, Jeff. The notes we sold were the ones we downgraded—that was our pandemic special that we have been talking about at length for a number of years. The market was not going to recover in time for that to be properly restructured. We are not going to maintain a loan on our books where we need to take a charge-off, so we elected to sell the note, and Misako has done a really good job of estimating value and negotiating that sale such that we did not have any further provisioning impact. The other loan we have mentioned on the calls is something where, again, the loan-to-value, the debt service coverage ratio—all the metrics are adequate. We are in a dispute over terms of an extension or renewal—an extension. That is what is keeping it where it is. We are in the middle of a legal process on that, so it is not apples to apples. We will continue to look to resolve that, but we do not have any loss expectations on that credit, whereas the other one had a serious valuation impact, as you know.
Speaker 5
Appreciate it, Tim. Maybe most importantly, interested in your view of the general market on the CRE side. As you view vacancy rates and the broader Bay Area, is it firming up? How would you characterize recent CRE trends in the area?
Speaker 1
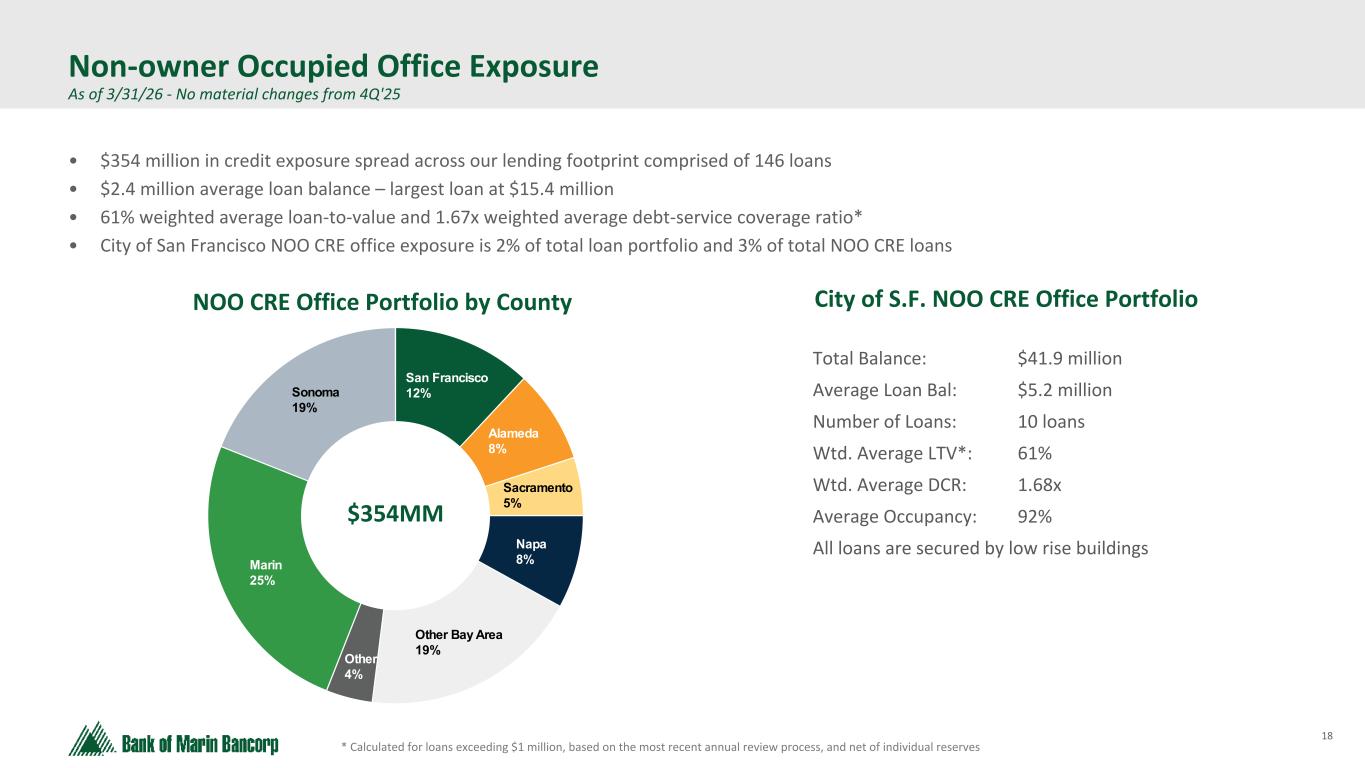
I would continue to bifurcate the Bay Area between San Francisco—particularly for office—and the rest of the Bay Area. We never saw the significant value degradation or lease rate declines in the outer markets that we saw in San Francisco, which, as you know, plummeted. The trends continue to be very positive, certainly a lot of that driven by AI-related investments. Even on the property, on the note we sold, we were looking at 20% to 30% a year of improving NOI. The market is rebounding. There is news about retail coming back in the retail areas. It had to hit a bottom. You see people being opportunistic now. For those of us that had assets at prior valuations, that was going to take a long time, but we certainly see more opportunism in the market. Some of our activity over the last couple of quarters has been related to people taking advantage and making purchases. I view all that as a positive. Again, I would bifurcate between dealing with an asset that was on the books before the value degradation and what is happening now. Overall, the trends remain very positive in San Francisco.
Speaker 5
Thanks. Appreciate it.
Operator
Your next question will come from Woody Lay with KBW.
Speaker 6
Hey, good morning, guys.
Speaker 2
Morning, Woody.
Speaker 6
I was hoping you could walk through the higher expenses in the first quarter—the jump from January. And it sounds like the forecast, excluding the charitable contribution, should remain relatively flat. Does that embed any additional hiring from here?
Speaker 2
Sure, I will start. Zooming out a little bit, the company has a long-standing history of very strong expense management. If you go back the last ten years or so, our noninterest expense to average assets has been in the favorable top 30% of peers. It is important to what we do, and that is despite operating in some pretty expensive markets. Where the deviation may have happened is if an estimate was jumping off of Q4 for personnel expense. Keep in mind we did have some incentive bonus reversals in Q4, and historically Q3 has probably been a better predictor of Q1 than Q4 has. Relative to Q3, our Q1 looks similar to where it has been the last couple of years. Then you put on top of that the annual resets we discussed in our earnings materials—payroll taxes, profit sharing, etc.—that is how we get to the key driver of our overall number this quarter, which is personnel. On charitable contributions, we expect that to normalize. One other area that was a bit of an outlier this quarter was FDIC insurance expense. Due to the repositioning, we had a lower leverage ratio and negative earnings in our last assessment because of those losses. That was applied to a higher assessment base given the balance sheet growth and also lower tangible equity. That explains some of the expense you are seeing in Q1, and we expect that to normalize as more of the benefits of the repositioning flow through.
Speaker 6
Got it. That is helpful. And then, putting some of the moving pieces together, it sounds like there is a continued tailwind to the margin. You have a slightly higher expense base, but it should be relatively stable versus Q1. So is the expectation still for positive operating leverage throughout the year?
Speaker 2
Yes. I agree with that.
Speaker 1
We are looking to be opportunistic, though, and continue to add hires that help us drive growth. I cannot really predict the timing for that, but we are looking to make strategic growth efforts in some of the markets that maybe have been lesser performing for us to get more pistons firing. If we can make some hires that can help drive growth, we will be doing that with a mind toward adding interest-bearing assets to the books. That could impact the run rate over the year. But as Dave said, when you take all the noise out, it starts to flatten out—minus any adds.
Speaker 6
Got it. Alright. I appreciate all the color. Thanks for taking my questions.
Operator
Your next question will come from Robert Andrew Terrell with Stephens.
Speaker 7
Hey, good morning. Maybe going back to the margin, I was hoping I could get a finer point on some of the loan repricing dynamics. Where are new origination yields coming in today, how does that compare to what is rolling off, and do you have a cadence of what you expect to reprice or turn over on the loan book throughout the year?
Speaker 2
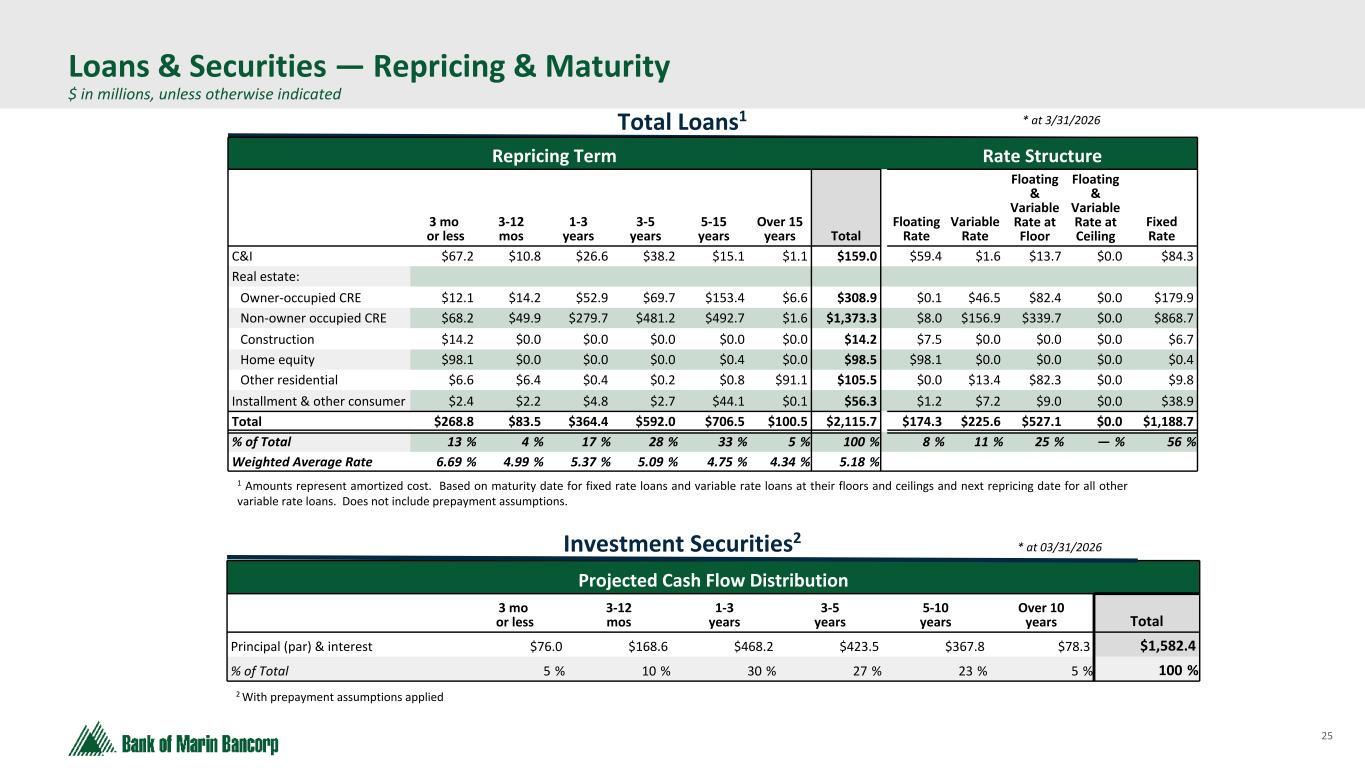
The usual statistic we give is a 12-month look at monthly loan yields, and that number is probably 15 to 20 basis points comparing the monthly loan yield in March 2026 to March 2025—interest rates flat and balance sheet flat. On yields of new loans, those were 5.91% in Q1, which compares to 5.51% for paid-off loans. We have about 17% of the portfolio repricing in the next year and 34% over the next three years. That is on page 25 of the deck. Not much change to those numbers, and still a relatively low level of floating rate.
Speaker 1
One of the headwinds is that for the prior couple of quarters, it was a pretty flat trend in new asset yields versus those paying off. We continue to have headwinds in the payoff of some of the acquired mortgage or auto loans that we have talked about, and that was one of the larger payoff categories in the quarter again, and those are at higher yields. Getting a 40 basis point lift despite that is encouraging, but that has been a headwind because those were some of our better-yielding loans, and the payoffs on that because of the rates have been slightly higher.
Speaker 7
Yep. Okay. Great. I appreciate it. If I could shift over—you talked a bit on the buyback—but your CET1 and capital ratios have normalized post the restructure last year. It seems like you are relatively in line with peer levels. Can you reframe—post the restructure and now that the credit picture looks a lot cleaner this quarter—where would you like to be from a CET1 or leverage ratio standpoint? Remind us of the north stars there or the binding constraints?
Speaker 1
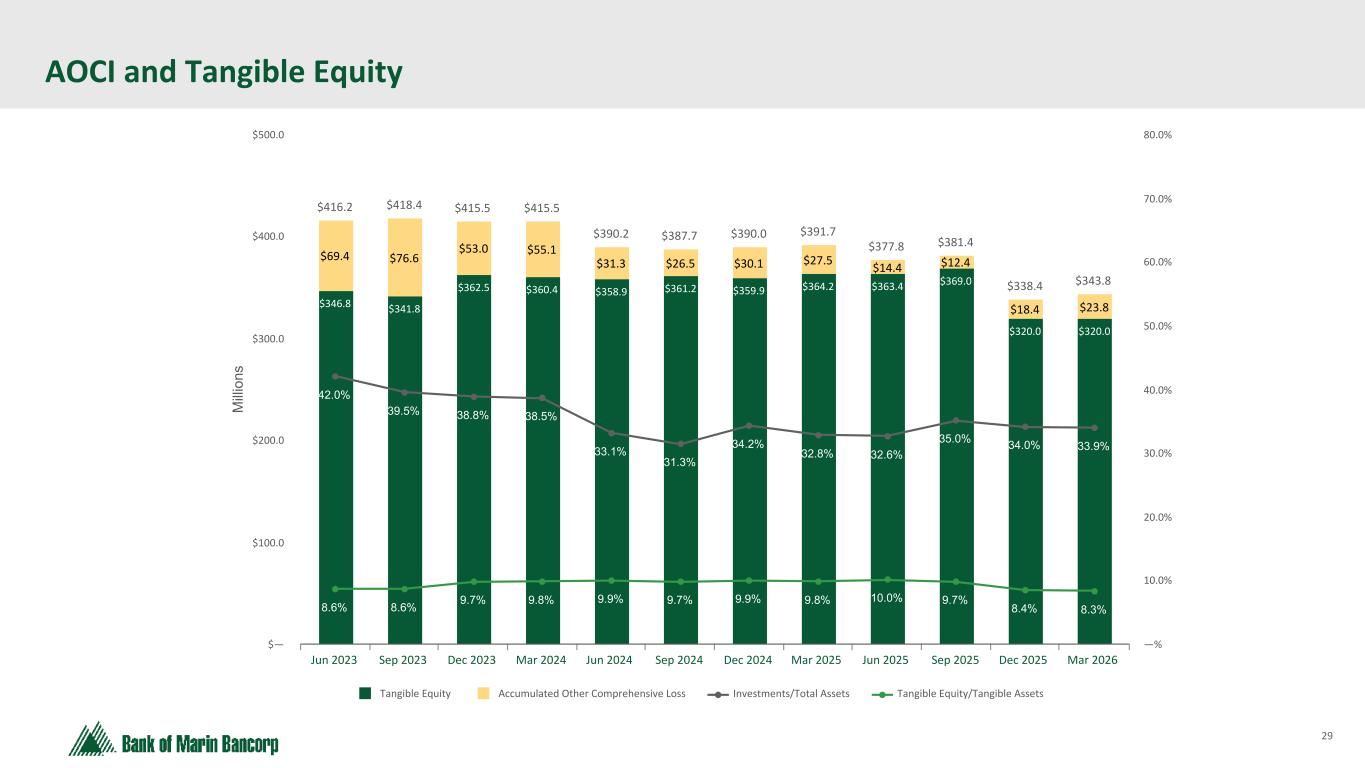
We have not really established a specific level where we need to be. It is all relative to the risk on your balance sheet, obviously. As I mentioned before, that is a conversation we are going to be more willing to have now that we have less risk within our loan book and less chance of large, surprising provisioning or charge-offs. I am reluctant to give a target there, but I would say it is a conversation we are going to be more willing to have as a management team and board. I will add, because a lot of attention gets paid to holding company capital ratios, an important consideration for us is our bank-level capital ratios and relative to peers there. I think that is where we have probably more to do in terms of rebuilding those.
Speaker 7
Makes sense. Last one from me. Your profitability is up quite a lot since the restructure, but ROTCE on an operating basis is still around that 10% level. As you step back and look at your forecast, where do you see the incremental levers to pull to improve profitability closer to peer levels?
Speaker 1
The two where we are most intently focused are building loan activity—particularly while yields are where they are—and driving more fee income. We have some strategic initiatives around that. Someone mentioned building more operating leverage into the model; that is what we are looking to do. If we make adds, it will be mainly around driving loan growth. If that happens quickly enough, you get that almost immediate positive operating leverage. And we have strategies around driving fee income that can add meaningfully to the bottom line—nothing overly dramatic, but important steps. I do not see any big cost reduction activity; the goal at this point is not to cut our way into more profitability.
Speaker 7
Got it. Okay. Thank you for taking the questions.
Operator
As a reminder, if you would like to ask a question, please click on the raise hand button at the bottom of your screen. Our next question will come from David Feaster with Raymond James.
Hi. Good morning, everybody.
On the growth side for a minute, there are some really encouraging trends with the originations and the pipeline growth. I was hoping you could elaborate on some of the drivers. You alluded to new hires—that makes obvious sense as to increasing productivity—but you also discussed in the deck comp program enhancements and updates to calling programs. Can you elaborate on what you did there, and how much of the growth in originations you are seeing this quarter is from new hires versus increasing productivity from existing bankers?
Speaker 1
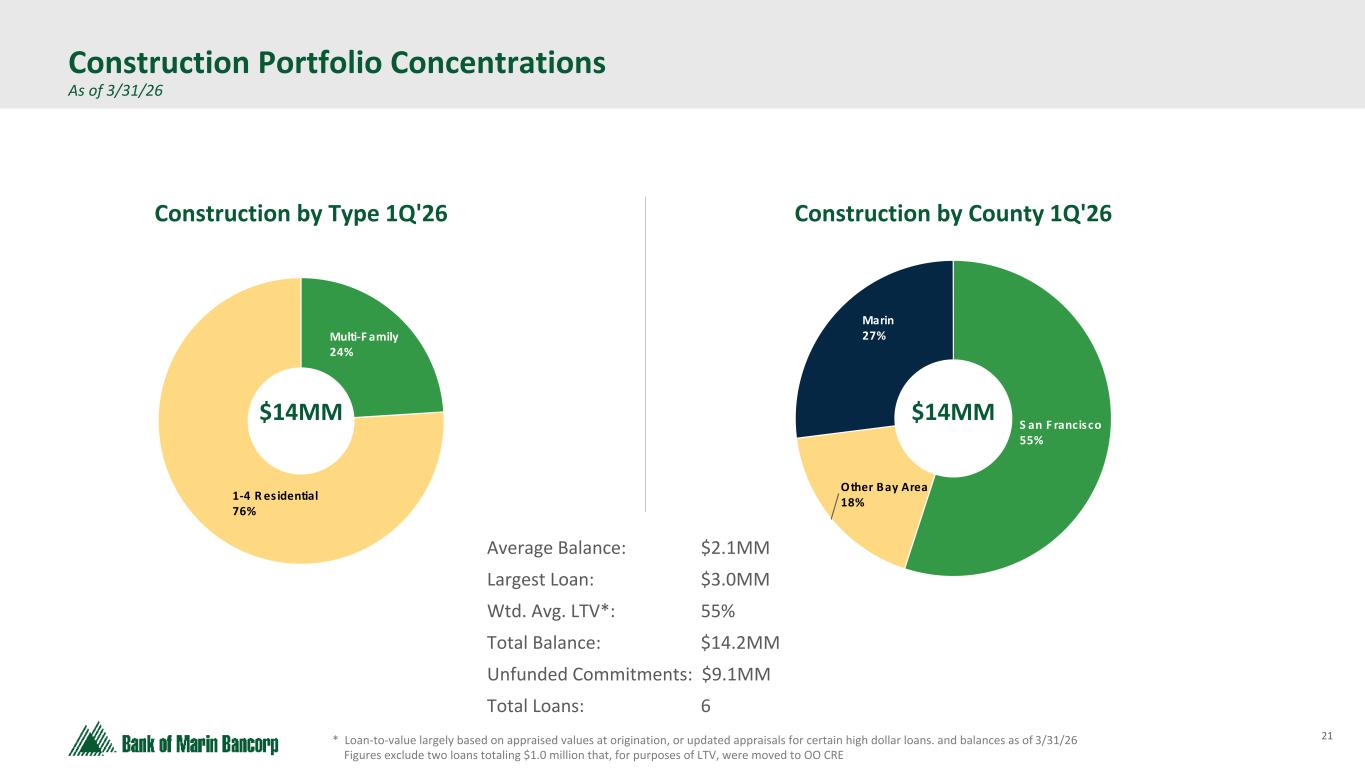
Thanks, David. I would say the majority of the production came from those hires we have been referencing over the last year. The top people continue to be the top people. We have made some leadership changes in our Sacramento market, realizing we needed to do better post the American River Bank acquisition to capture the opportunities out there, and that is paying dividends. I would say the Sacramento market overall is driving a good portion of the growth that was booked—even loans booked in other offices are to borrowers that are in Sacramento, just other people’s relationships. So it is doing a better job in Sacramento, doing a better job with hiring, and having an incentive plan that pays people fairly without so many caps so that you are incenting more of a hockey-stick approach. Maybe people have to do more to enter into the incentive component, but if they accelerate or exceed their higher hurdles, then the payouts get bigger. Combine good people with a better plan and you get results, and that is what we are seeing. We are starting to see life in the construction market. Our construction group has gotten a lot more active—going back to my comments earlier about activity in San Francisco—more people stepping in to buy properties for development for condos and single-family residences. We are starting to see that come back as well. It is not any one thing; it is a combination of all those things.
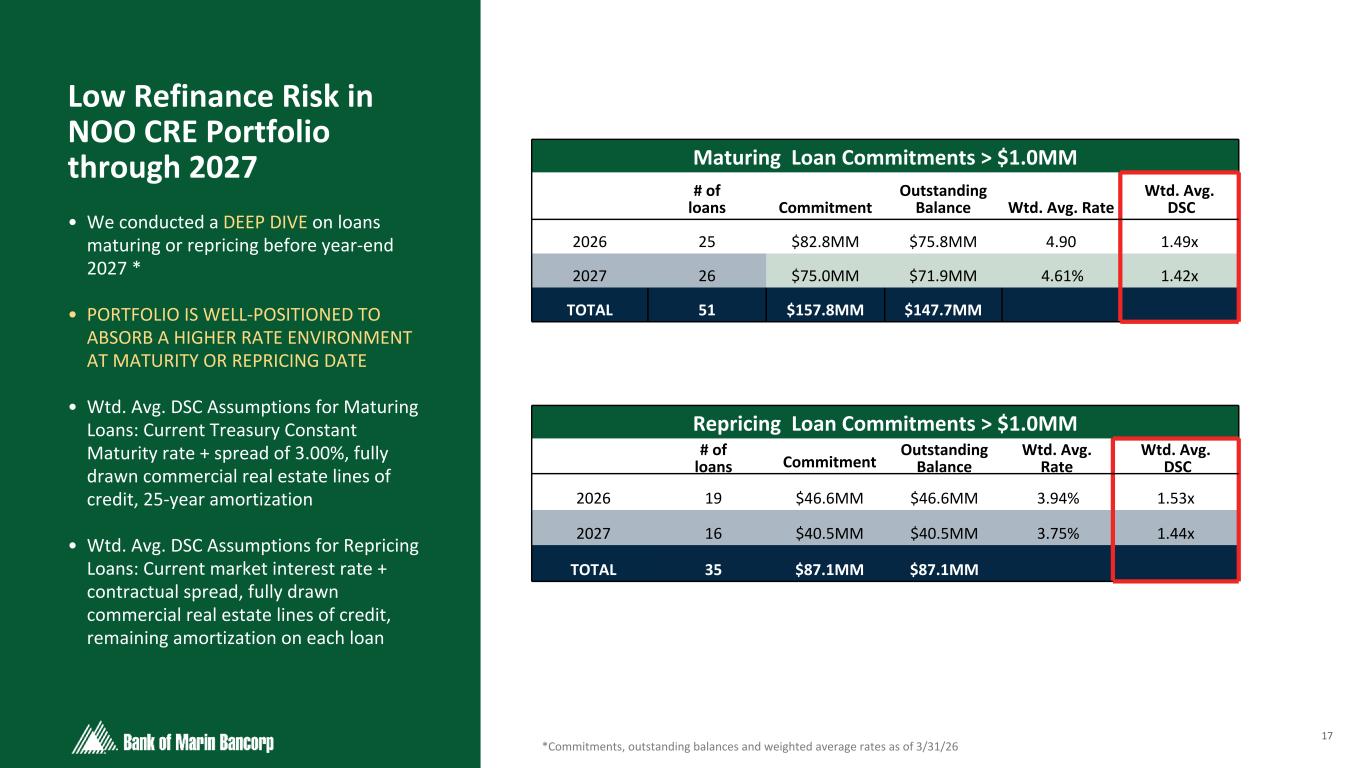
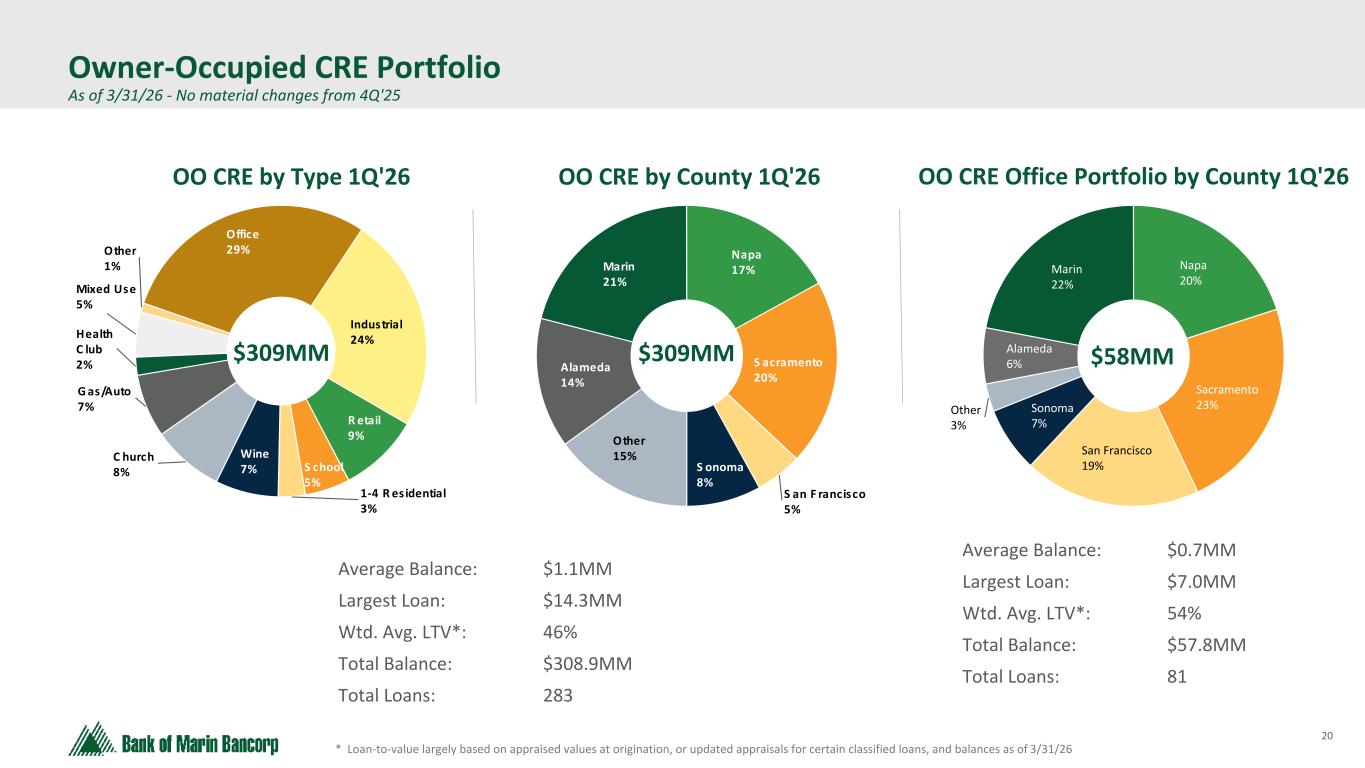
Okay. Maybe just touching on the credit side. It is nice to see the credit cleanup this quarter. Exclusive of that—with that in the rearview—things look pretty benign, at least on your balance sheet. What are you seeing on credit broadly? I know the wine industry is under a bit of pressure. You have done a deep dive into upcoming CRE maturities. Can you talk about the takeaways from that—high-level credit commentary—and whether you are seeing more pressure on underwriting or credit broadly given increasing industry competition?
Speaker 1
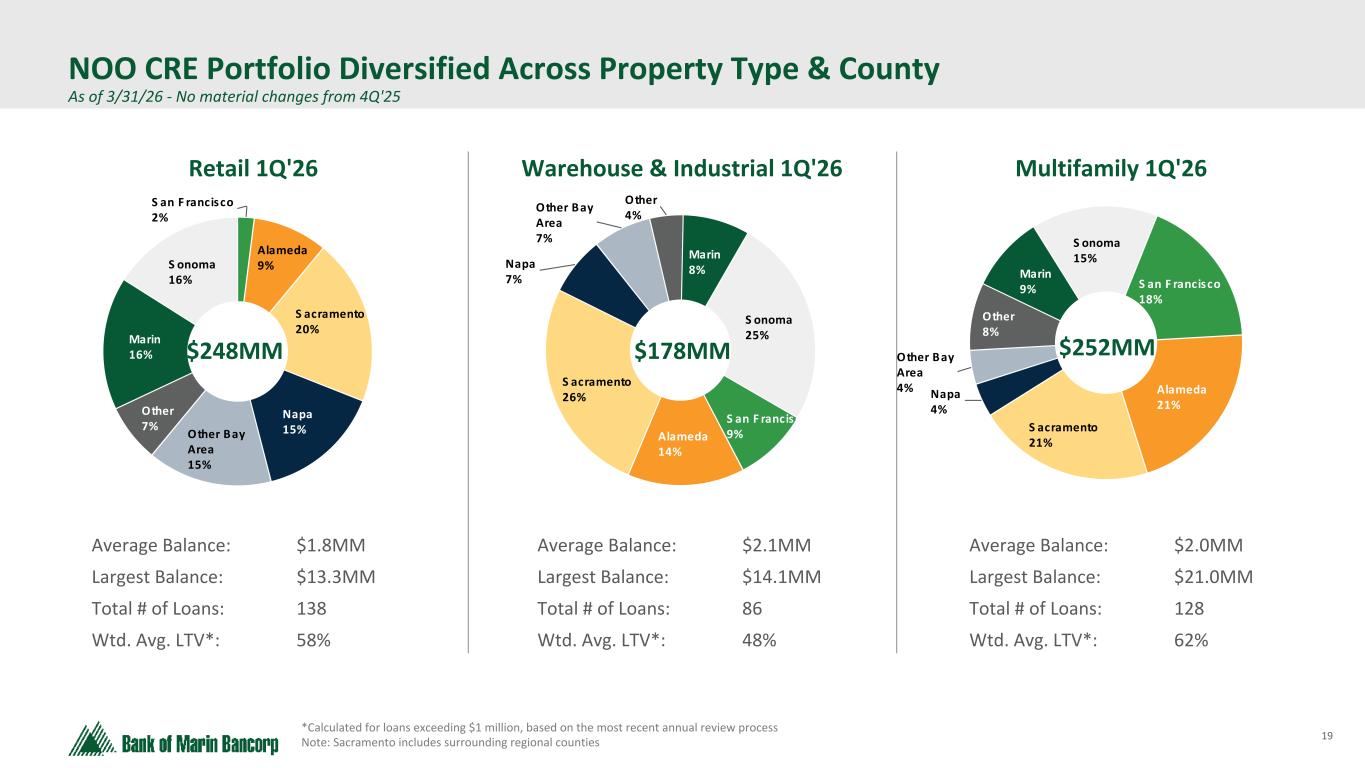
I will start at your end there. I think competition has picked up—loan-to-value, debt coverage, recourse versus nonrecourse. We certainly see the market getting frothy at times, particularly in certain asset classes like multifamily. Wine is a big weak spot. We think we are managing that well, and our exposure is not all that big there anymore, but as a headwind to part of the North Bay economy, yes, that industry is struggling. We do not see a lot of impact within our customer base from things that are making the national news like tariffs or cost of oil and transportation. Not that it is not out there, but we are generally seeing stable and healthy economic trends with what we are looking at. We feel good about our commercial real estate and, minus some ups and downs in individual performance, I do not see any trends that cause me to worry that we are going to revert back to larger downgrades into substandard or nonaccrual. If you took out the legal aspect of what we are dealing with on the singular nonaccrual loan we have, we would be back to almost zero, which, as you know, is where we love to be.
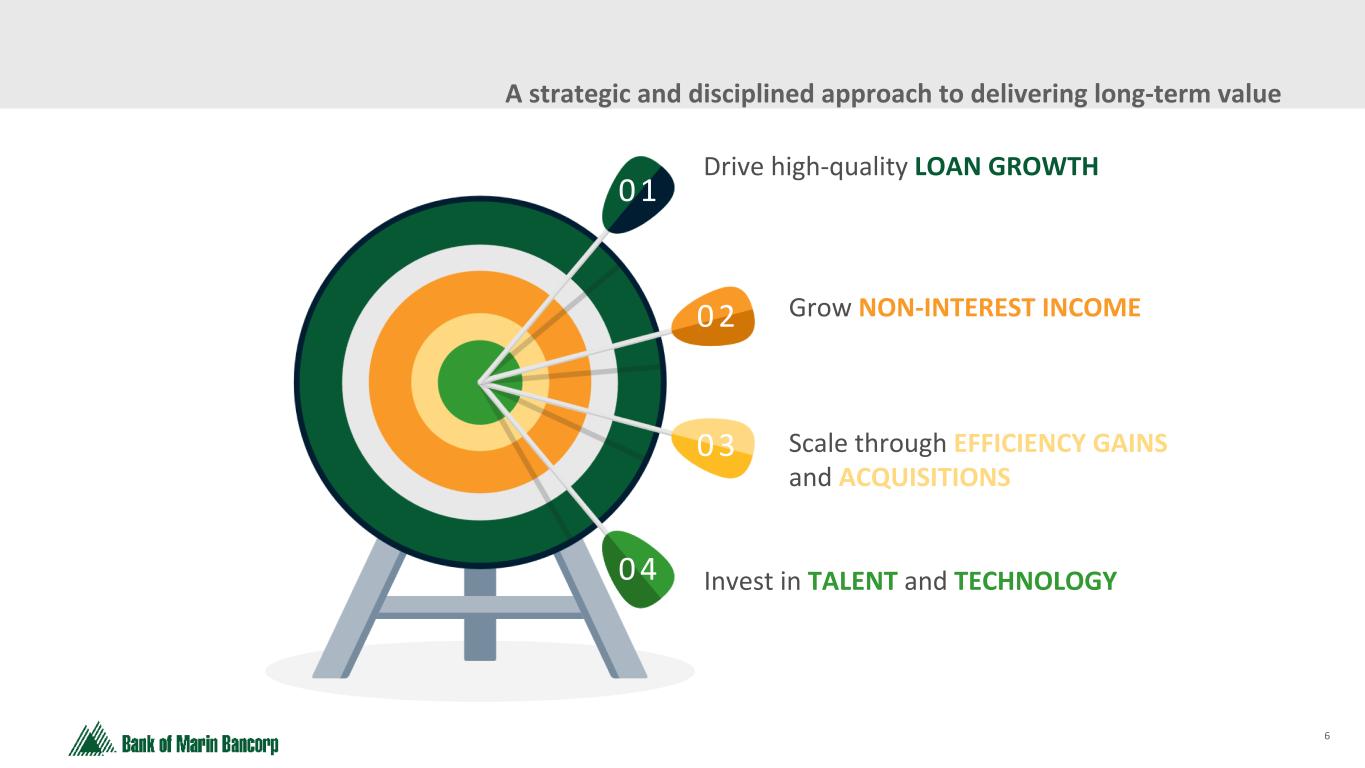
That is helpful. Looking at your slide deck—on slide six, you have those four top priorities to drive long-term value. Number three is scaling through efficiency gains and M&A. You already talked a bit about number four and number one, and said you are not going to talk about number two. I was hoping you could talk a bit about number three—where you are seeing opportunities for efficiency gains and any thoughts on M&A.
Speaker 1
I will talk about number two—it is not that I will not—it is just that giving guidance is something we are very reluctant to do. But we do have specific initiatives around treasury management fee income, wealth management and trust income. There are a number of components that will add up to a meaningful increase in that component, but no one thing that is overly dramatic. On M&A, getting our valuation back and continuing to build on that opens more doors for us. It is certainly something we remain open to; we have not shut the door on that at all. For a while, it was challenging on deal metrics with where we were trading, but we are hoping that continues to make improvements and M&A can become a more realistic opportunity for us. On efficiency, over the last couple of years we have done some staff adjustments and closed some branches. We are now in our second year of significant efficiency strategies within technology and back office, and going forward around AI—using that intelligently to build efficiencies into the system and more operating leverage. Again, it is lots of arrows in the quiver as opposed to any one or two big things. Those are the main things we mean in that number three.
That is helpful. Thanks, everybody.
Operator
Your next question will come from Timothy Norton Coffey with Brean Capital.
Speaker 9
Alright. How are you guys doing today?
Speaker 1
Good morning, Tim.
Speaker 9
Morning, Tim. I have a couple of questions on the loan side. When it comes to the spreads in the market right now, are you concerned about those spreads starting to compress given, one, the general level of competition, but also some of the new entrants to the market?
Speaker 1
There is no question there has been pretty incredible compression in pricing. We try to stick to an approach that meets our ROA hurdles. Generally, loans priced in the 200 over Treasury, depending on type of loan or above, are going to meet that. We regularly see people bidding at the 150 to 175 basis point level. Our job is to parse through those, get the really attractive opportunities, and not race to the bottom—get high-quality credit at as high a spread as we can. But the market is very aggressive on pricing.
Speaker 9
As you grow loans this year or book new loans, are you agnostic to the type, or do you prefer one over the other—like commercial over commercial real estate, for instance?
Speaker 1
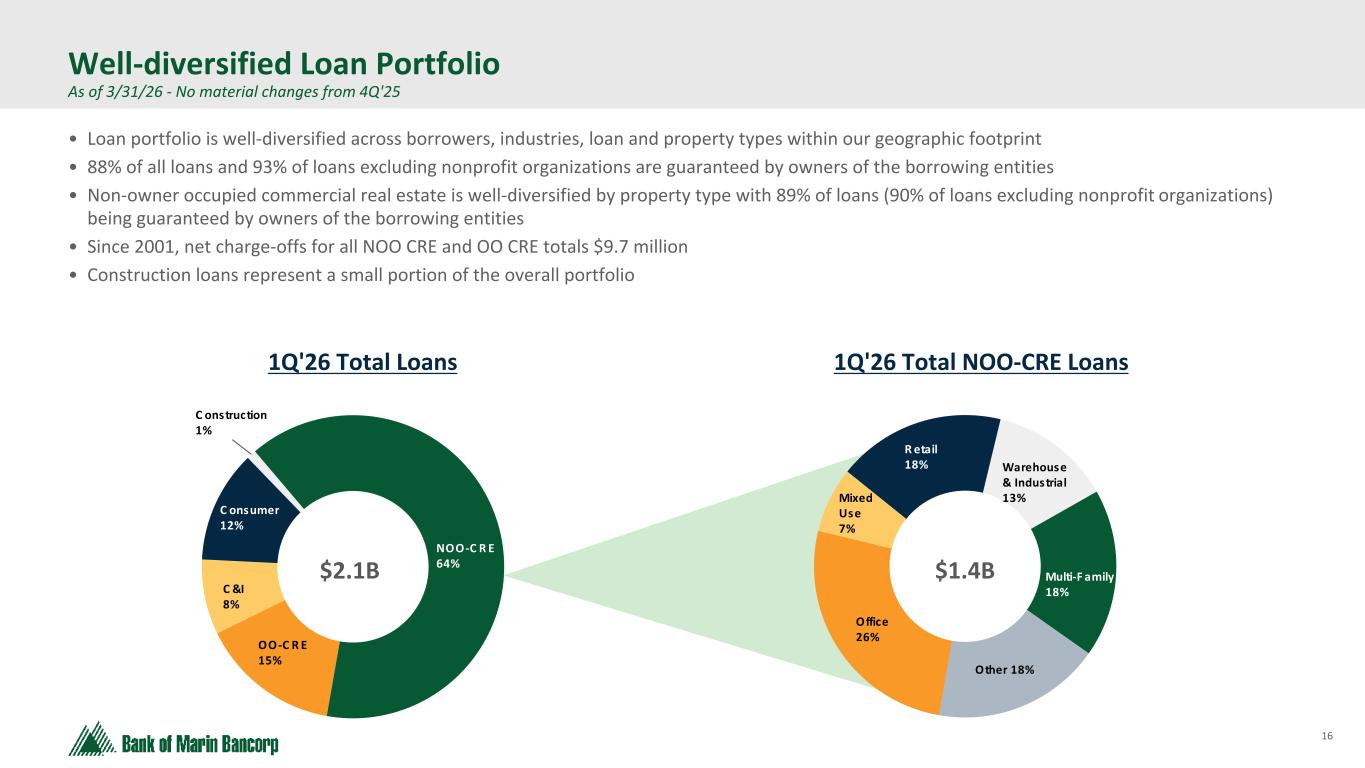
I have been saying for a while I would love to do a higher proportion of C&I. That is a slow shift to turn, but we are seeing a higher proportion. If you look at the breakdown of loans we booked this quarter, it pretty much mirrors that of the overall portfolio, but within that breakdown there was a skewing towards C&I. We had almost $9 million of unfunded commitments within that C&I bucket for the quarter, so we would love to continue to drive that. We are seeing a higher mix over the last few quarters of multifamily, and I think all of which has been CRA-qualified, so that accomplishes a number of things. If we can win a multifamily deal at a good spread, that is something worth being moderately aggressive over. I expect construction to pick back up—obviously there is always risk in that book you have to manage—but that has been a piston that was not firing. Given the kind of construction projects we did in the geographies we did them, it is nice to see that coming back as well. We are generally agnostic, but if we continue those trends, it will help from both a concentration standpoint and the growth aspect. Where we are doing a good job and where the growth in the market is right now seem to align pretty well.
Speaker 9
Further growth in C&I and construction, all else equal, would probably put upward pressure on your allowance ratio. Is that about right?
Speaker 1
It depends on the individual credits, but yes, that is possible.
Speaker 9
And then one for you, Dave. What is the appropriate tax rate to use?
Speaker 2
What we experienced this quarter, I think, is pretty indicative for the full year.
Speaker 9
Alright. Great. Those are my questions. Thank you much.
Speaker 1
A little easier year from a tax perspective than last year.
Speaker 9
Alright. Got it. Thank you.
Operator
We have no further questions at this time. I will hand back to Timothy D. Myers for closing remarks.
Speaker 1
Thank you again to everybody. If you need any follow-up information, by all means, please reach out to David Bonaccorso and/or myself, and we will get you answers. Looking forward to seeing you on the next quarterly call.