Operator
Thank you for standing by. My name is Tina, and I will be your conference operator today. At this time, I would like to welcome everyone to the Bankwell Financial Group Incorporated's first quarter 2026 earnings call. All lines have been placed on mute to prevent any background noise. After the speaker's remarks, there will be a question and answer session. To ask a question, simply press star 1 on your telephone keypad. To withdraw your question, press star 1 again. It is now my pleasure to turn the call over to Courtney Cicchetti, Executive Vice President and Chief Financial Officer. You may begin.
Thank you. Good morning, everyone. Welcome to Bankwell's first quarter 2026 earnings conference call. To access the call over the Internet and review the presentation materials that we will reference on the call, please visit our website at investor.mybankwell.com and go to the Events and Presentations tab for supporting materials. Our first quarter earnings release is also available on our website. Our remarks today may contain forward-looking statements and may refer to non-GAAP financial measures. All participants should refer to our SEC filings, including those found on forms 8K, 10Q, and 10K, for a complete discussion of forward-looking statements and any factors that could cause actual results to differ from those statements. And now, I will turn the call over to Chris Grisecki, Bankwell's Chief Executive Officer.
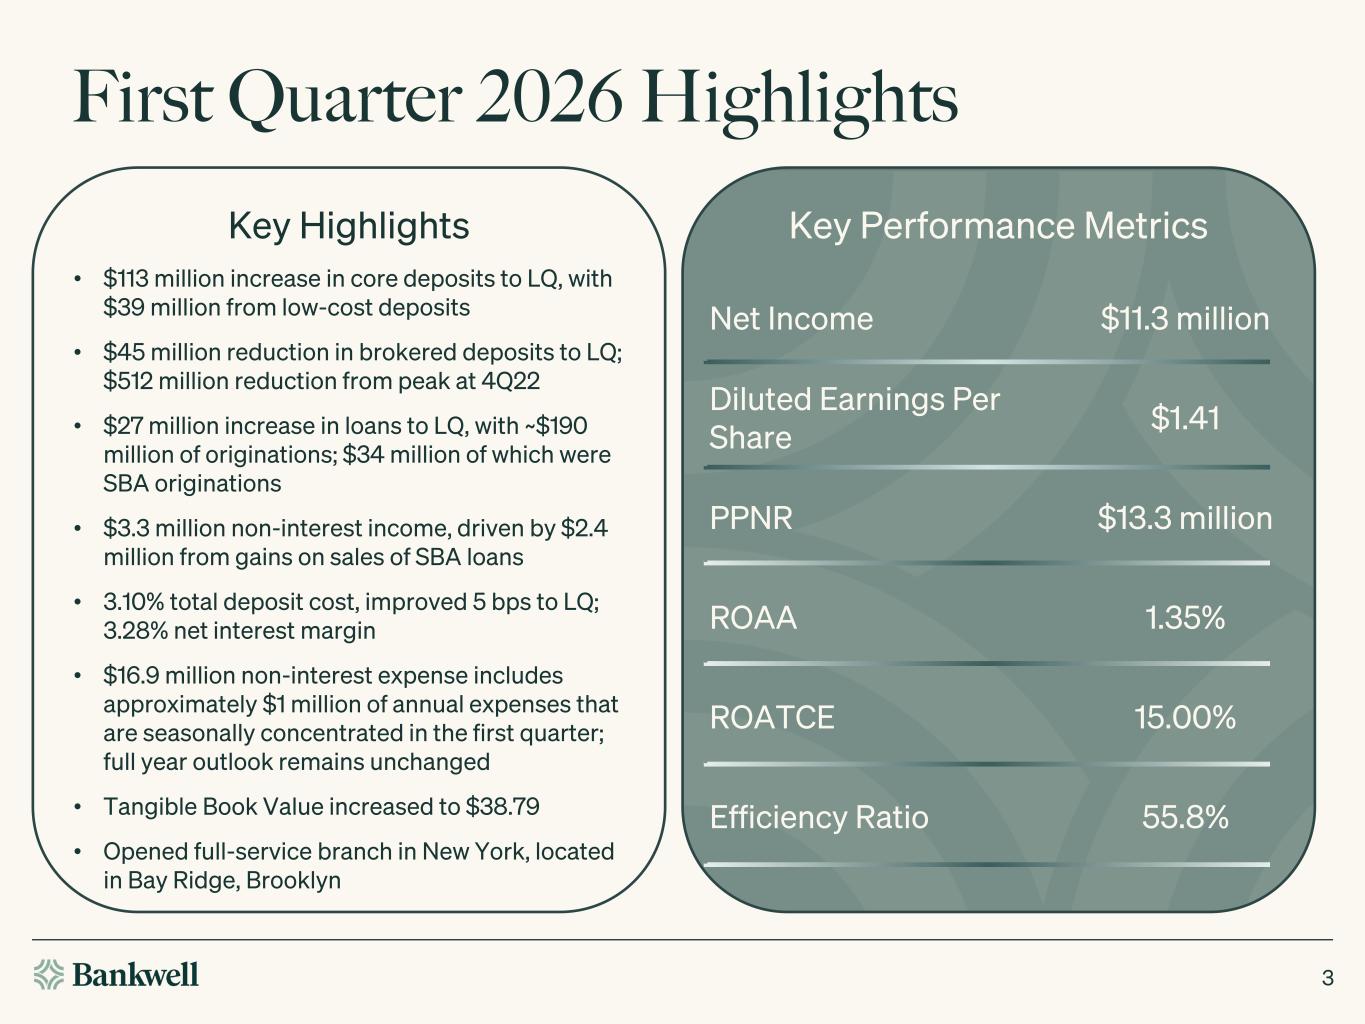
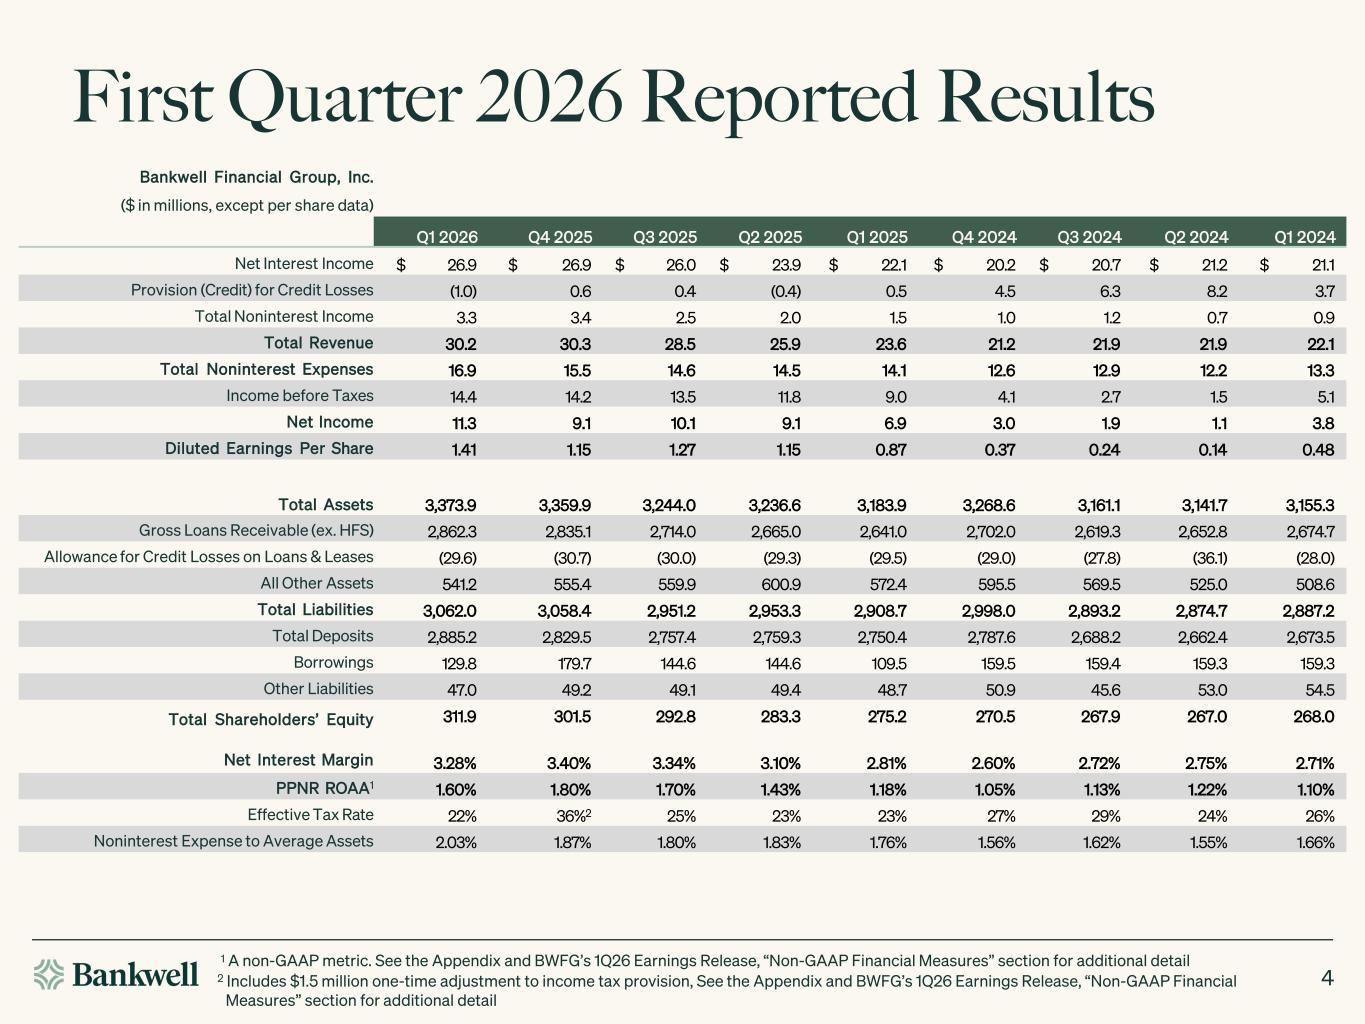
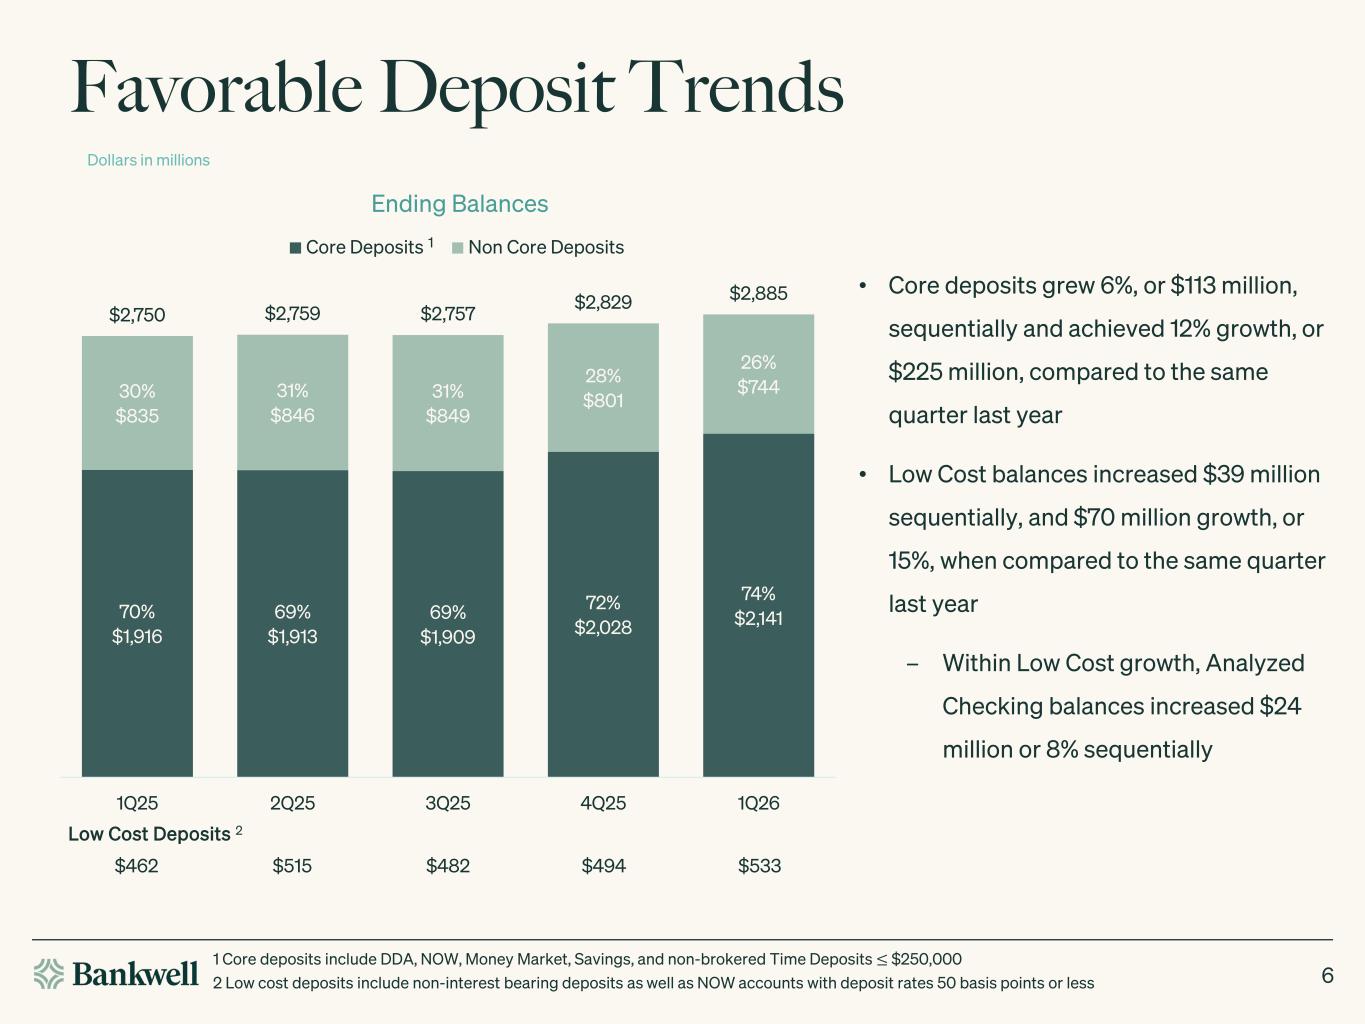
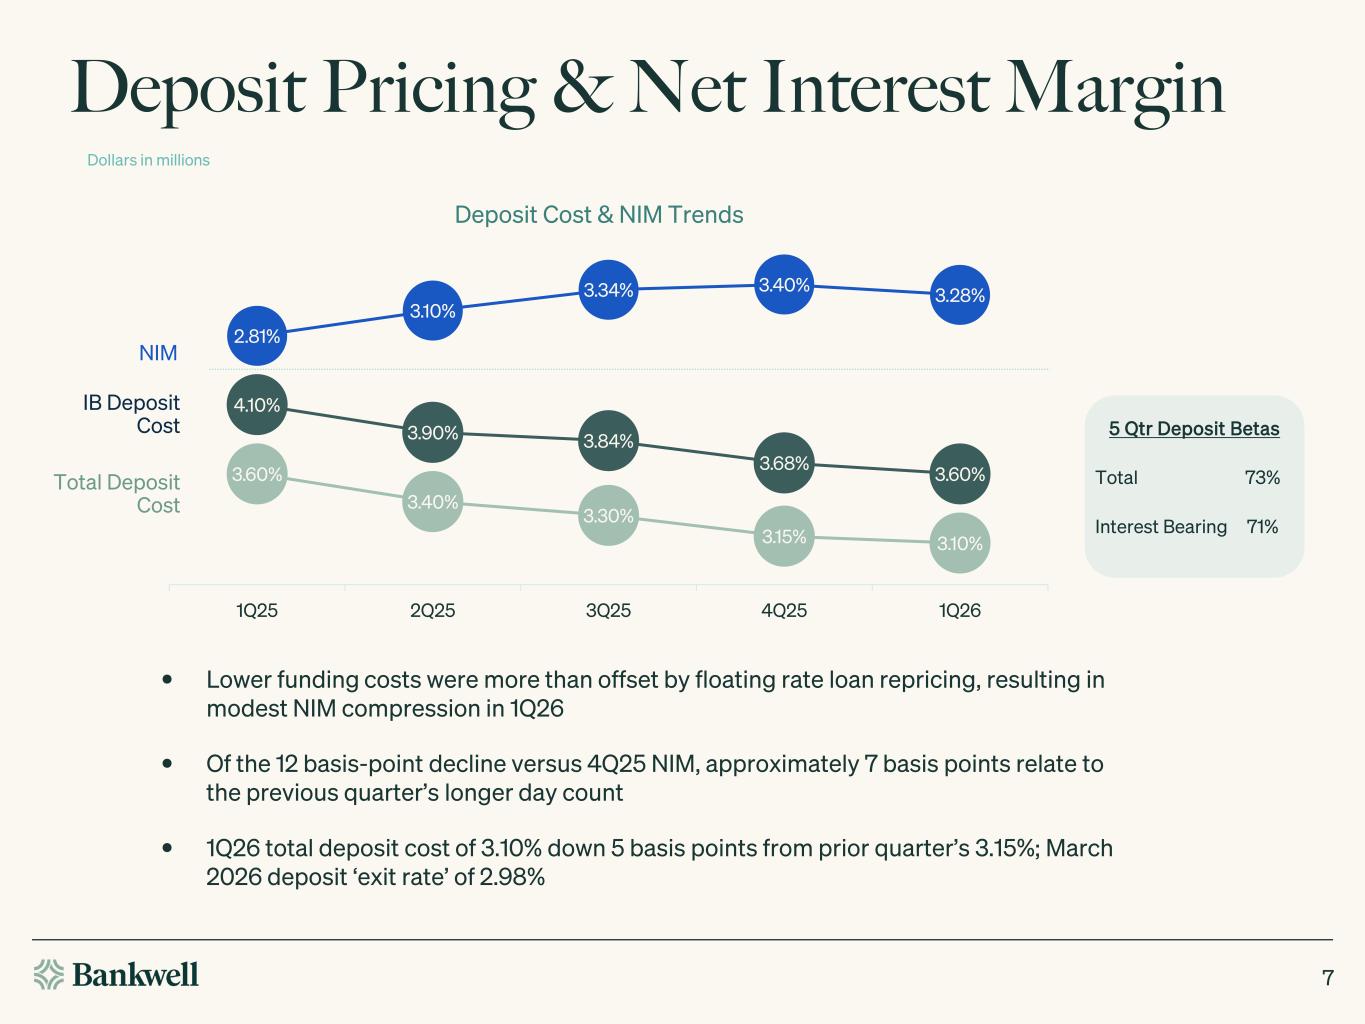
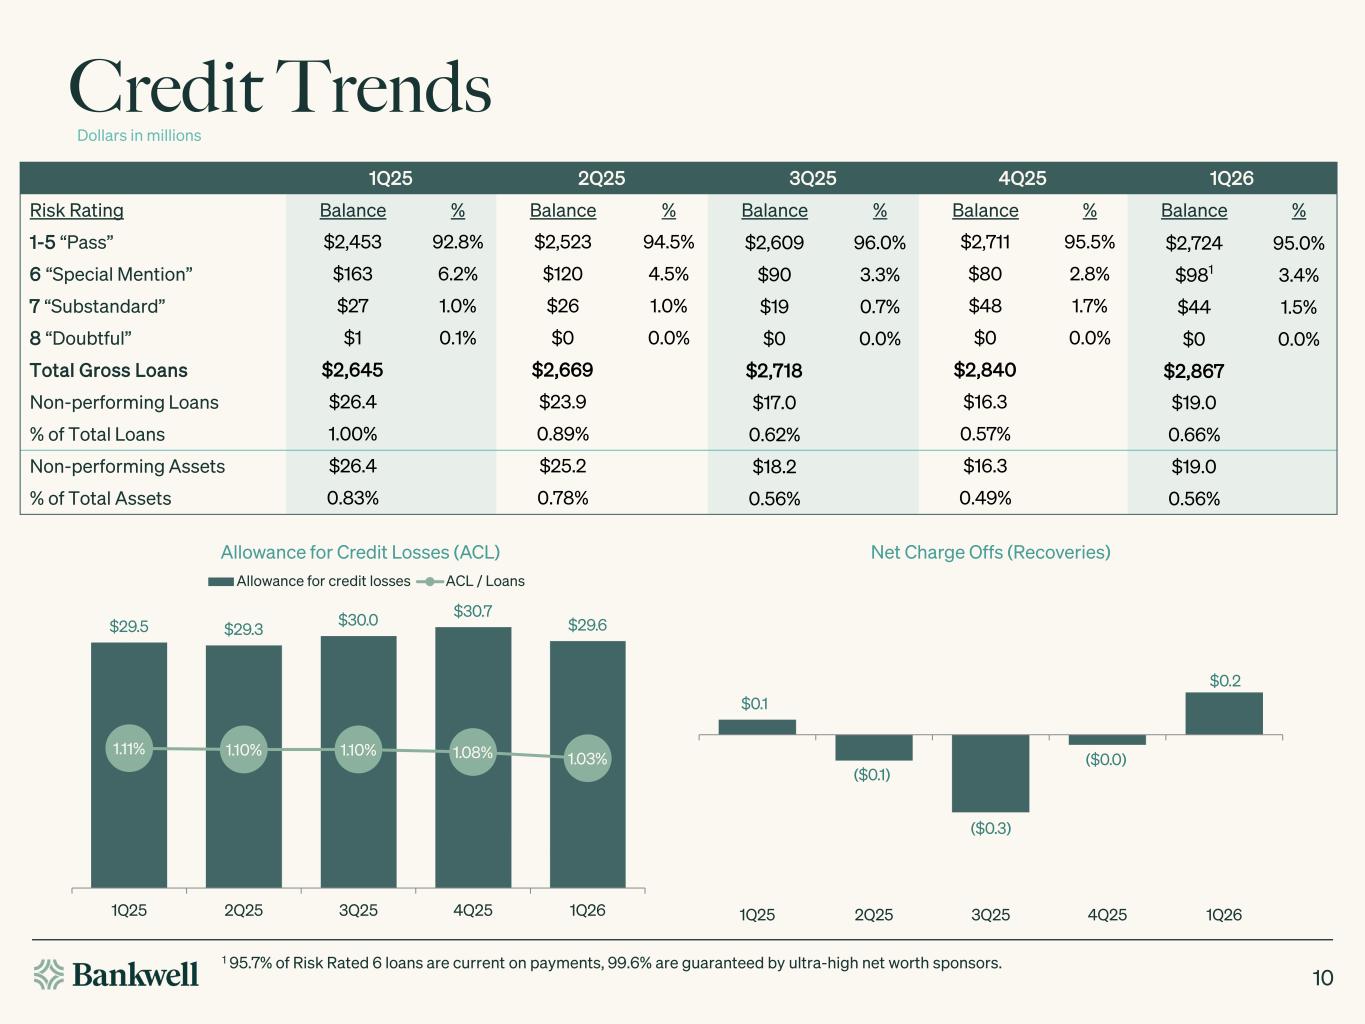
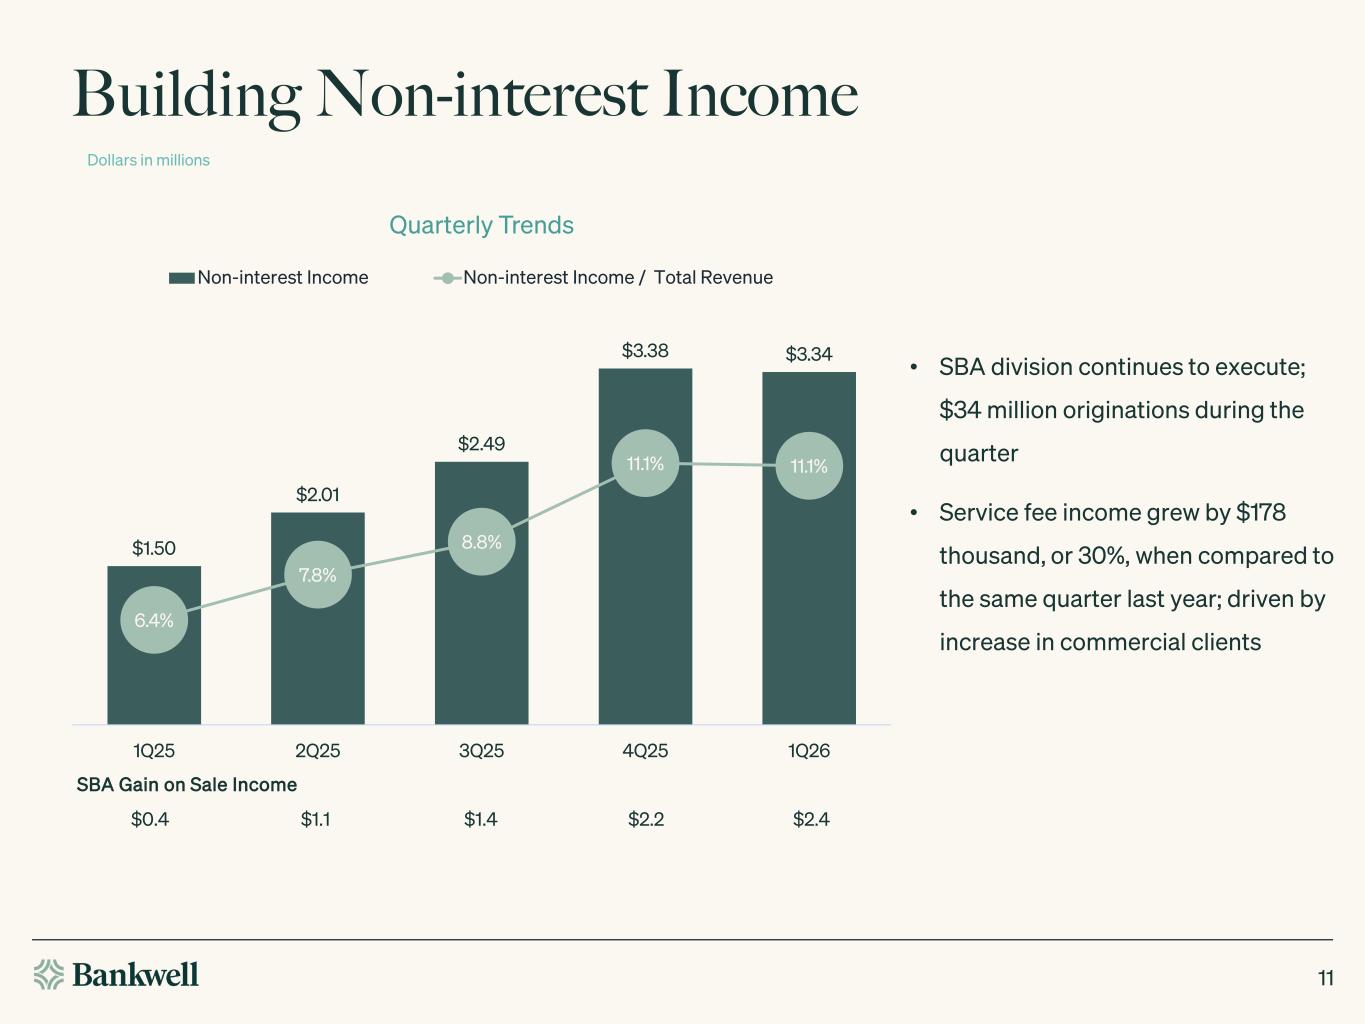
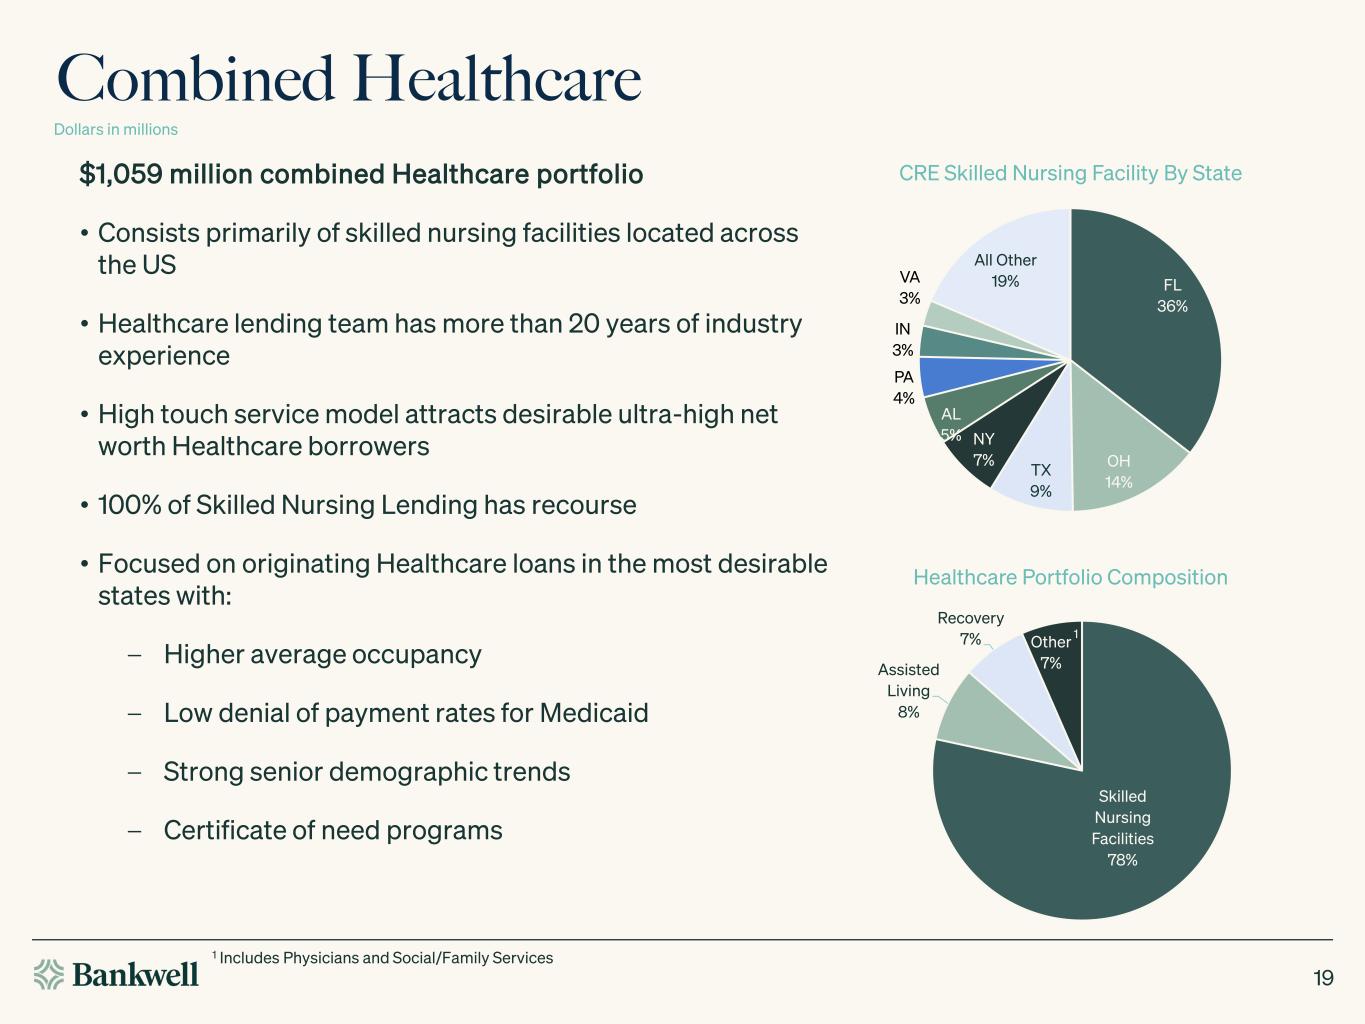
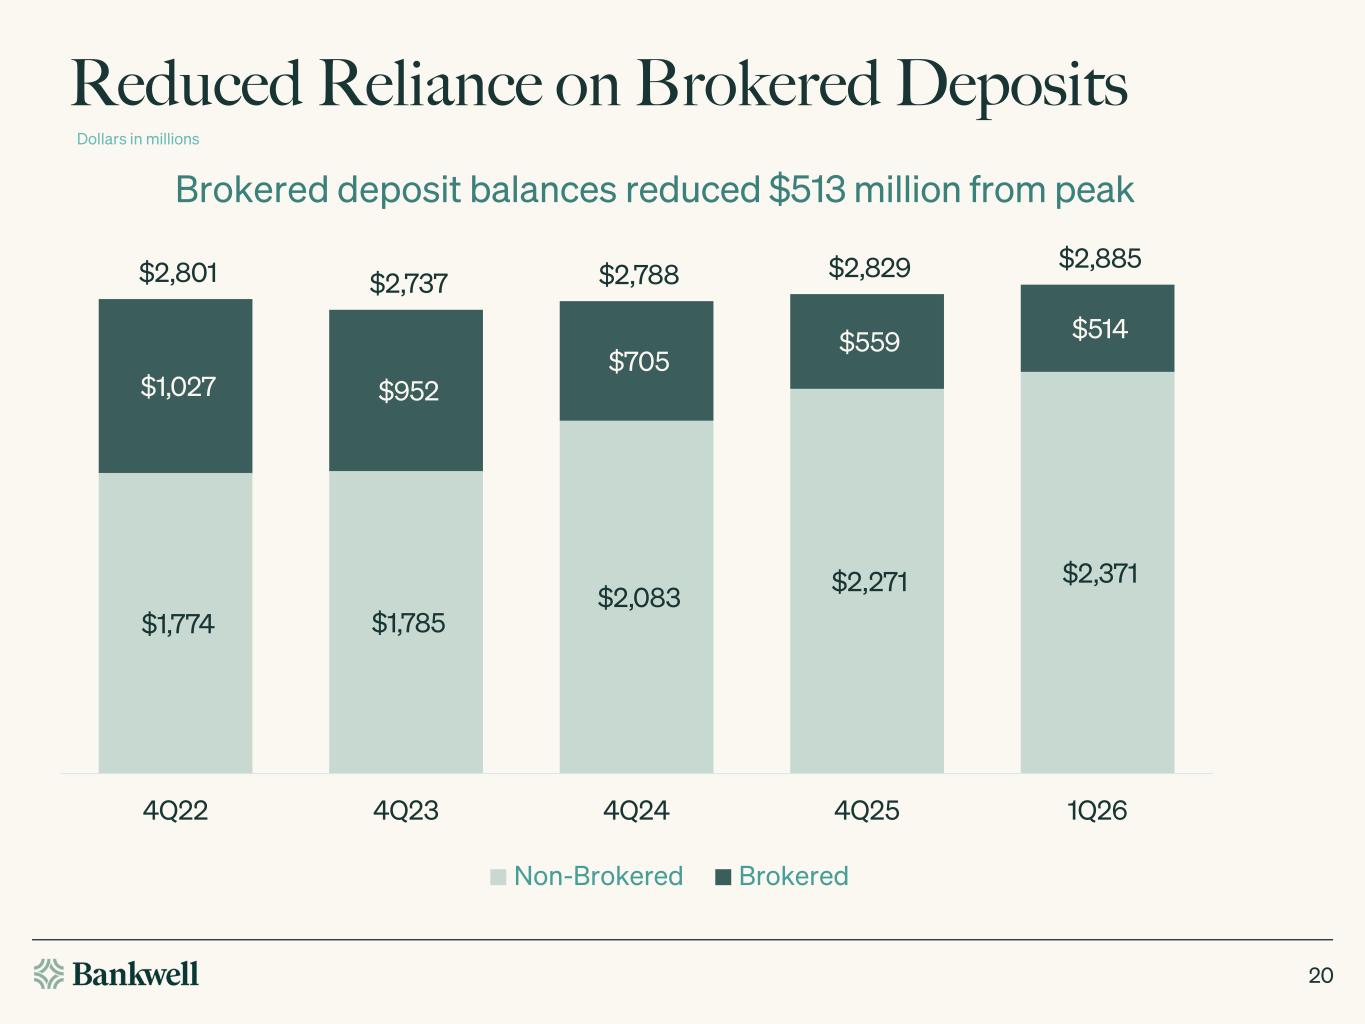
Thanks, Courtney. Welcome, and thank you to everyone for joining Bankwell's quarterly earnings call. This morning, I'm joined by Courtney Cecchetti, our Chief Financial Officer, and Matt McNeil, our President and Chief Banking Officer. We appreciate your interest in our performance, and I'm excited by this opportunity to discuss our results with you. We've delivered a solid start to 2026 with strong earnings, continued balance sheet improvement, and continued progress in our strategic priorities. For the first quarter, we reported GAAP net income of $11.3 million, or $1.41 per share. These results were supported by solid loan production, strong fee income from our SBA platform, lower funding costs, meaningful core deposit growth, and ongoing balance sheet optimization, including reduced reliance on wholesale funding and continued progress on building a more interest rate neutral balance sheet. Loan growth remained positive during the quarter with $190 million of originations including $34 million of SBA production resulting in net loan growth of $27 million. On an annualized basis this level of growth is consistent with our previously communicated guidance of four to five percent for the full year and our pipeline remains strong. Importantly, this growth is supported by strong core deposit inflows. Core deposits increased by $113 million sequentially, with $39 million coming from low-cost deposits. Included in that $39 million is $24 million of growth in analyzed checking balances for an 8% increase on the quarter. In addition to funding our loan growth, we've also reduced broker deposit balances and federal home loan bank borrowings by a combined $95 million, further improving our funding mix. Since our peak at the end of 2022, we've successfully reduced our broker deposits by $513 million for a 50% decline. The net interest margin was 328 basis points, reflecting modest pressure from asset repricing as floating rate loans reset lower, and an unfavorable day count impact relative to the prior quarter. These factors were partially offset by continued improvement in deposit costs, which declined five basis points sequentially to 310 basis points. Non-interest income remained a meaningful contributor to results totaling $3.3 million, which includes $2.4 million of SBA gain on sale income. Our SBA division continues to be an important part of our diversified revenue strategy and a meaningful source of recurring fee income. Credit quality remains healthy with expectations of further improvement. While non-performing assets increase modestly to 56 basis points of total assets, we have visibility into the resolution of several credits over the coming quarters. Overall asset quality metrics remain well within our internal expectations and reserve coverage levels remain appropriate finally we are excited to have opened our first full service branch in new york during the quarter located in bay ridge brooklyn the branch is home to an experienced private client banking team that joined bankwell in 2025 and the addition of this location enables the team to deliver bankless full suite of commercial and private client banking services on the ground in new york I'll now turn the call back to Courtney to walk through the financial results in more detail.
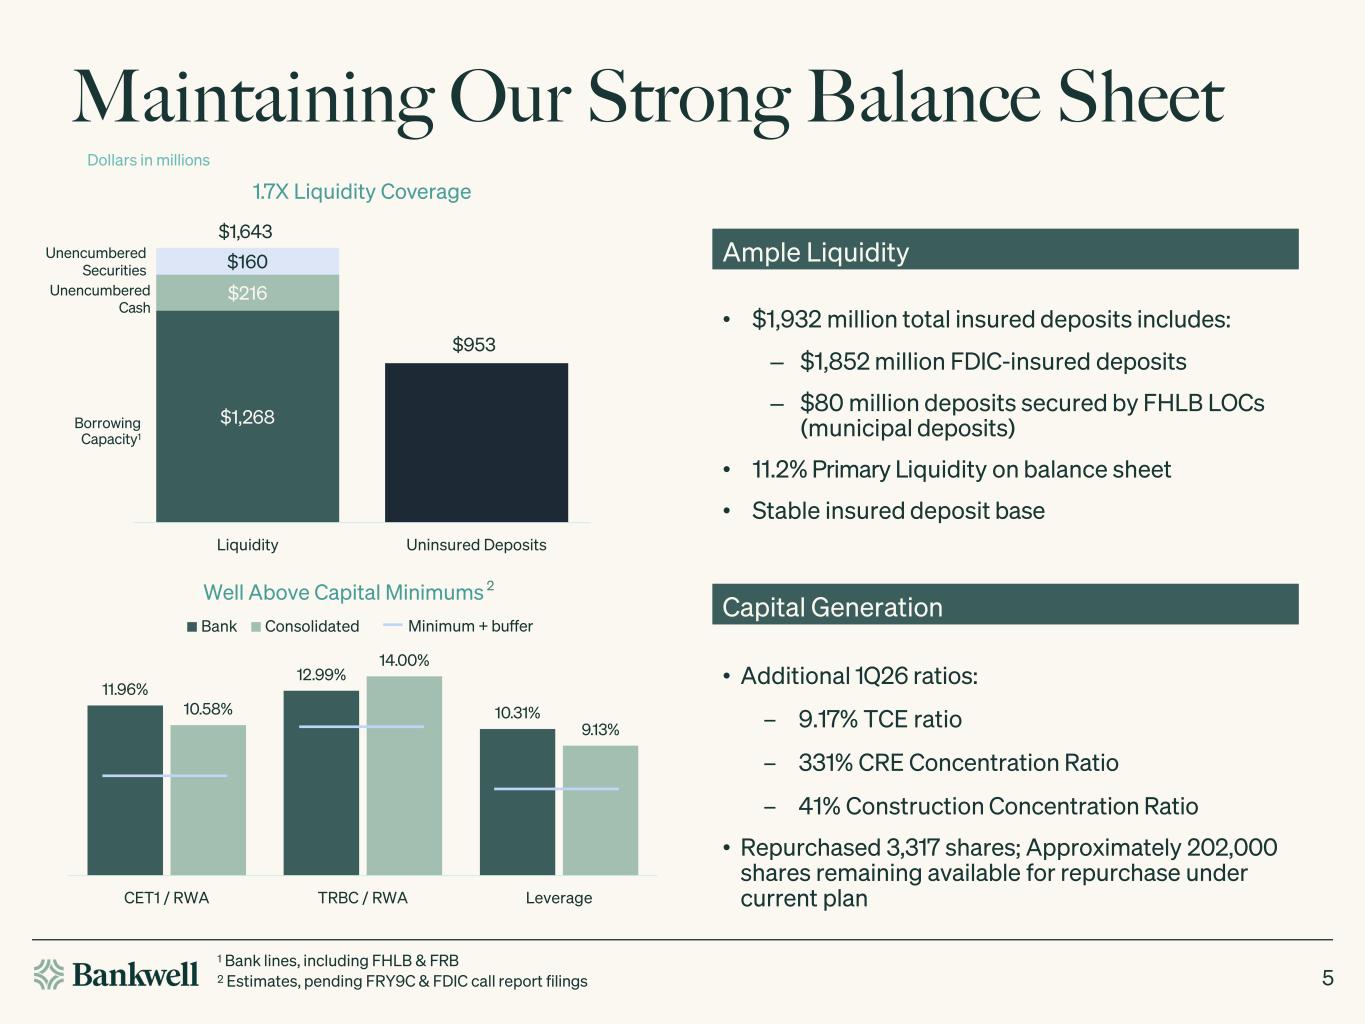
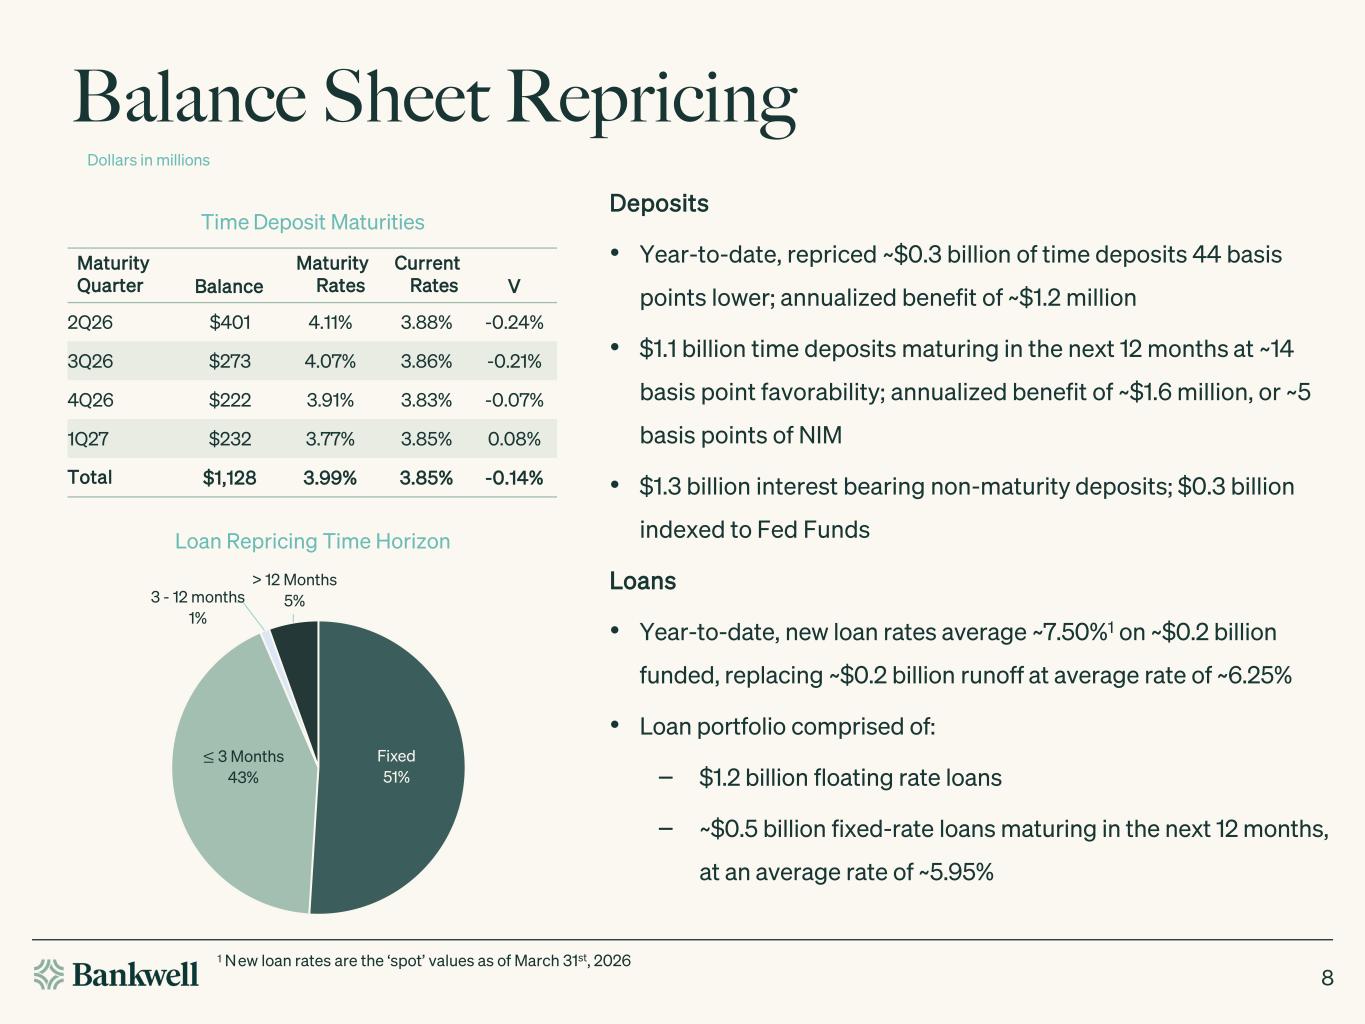
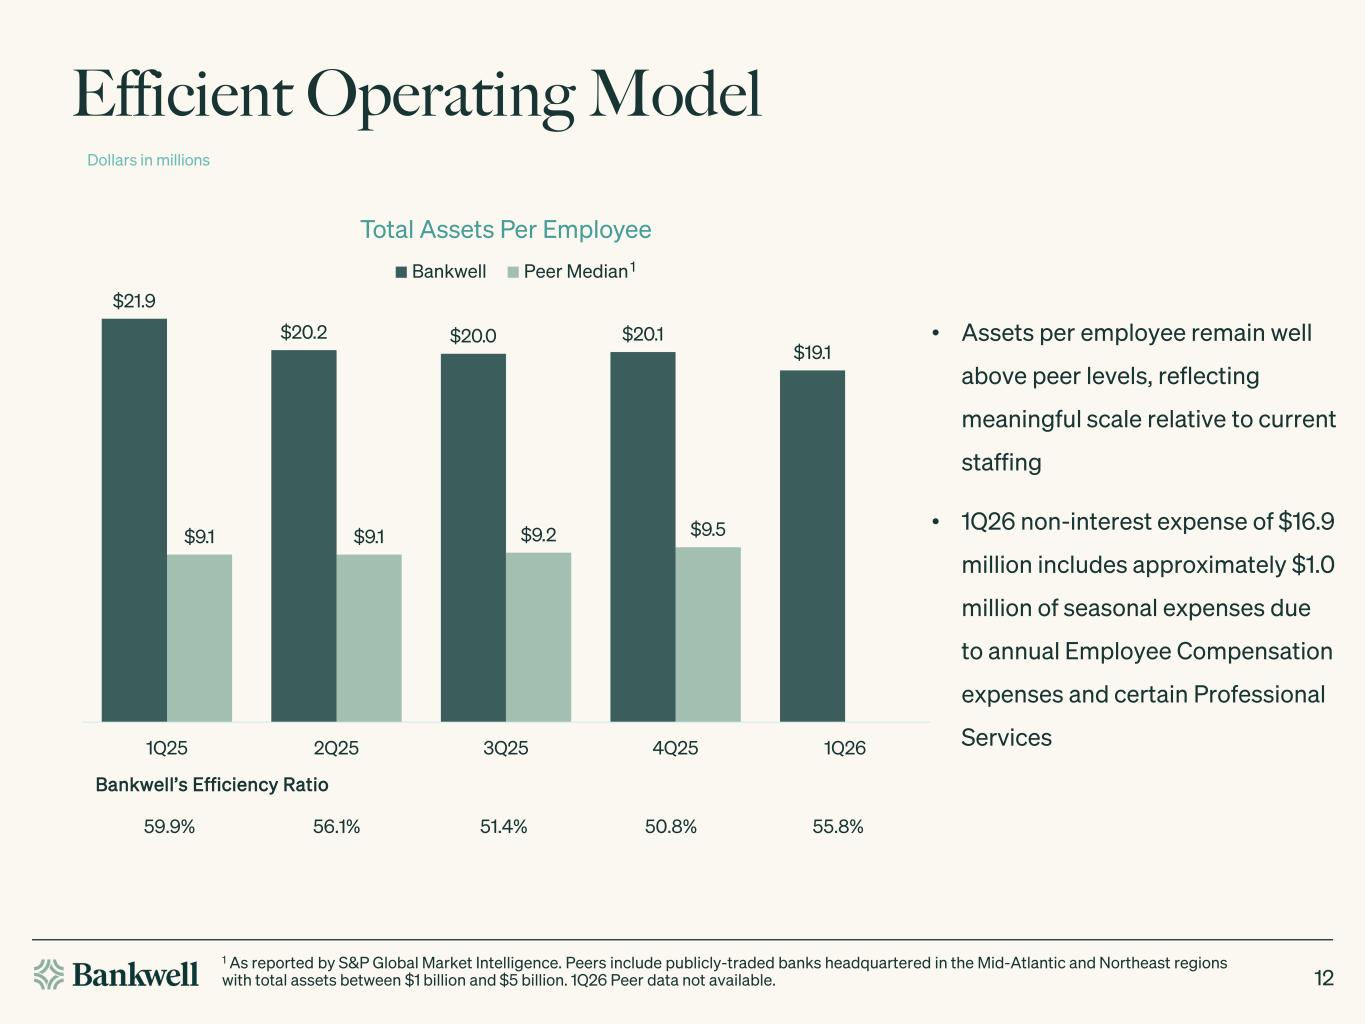
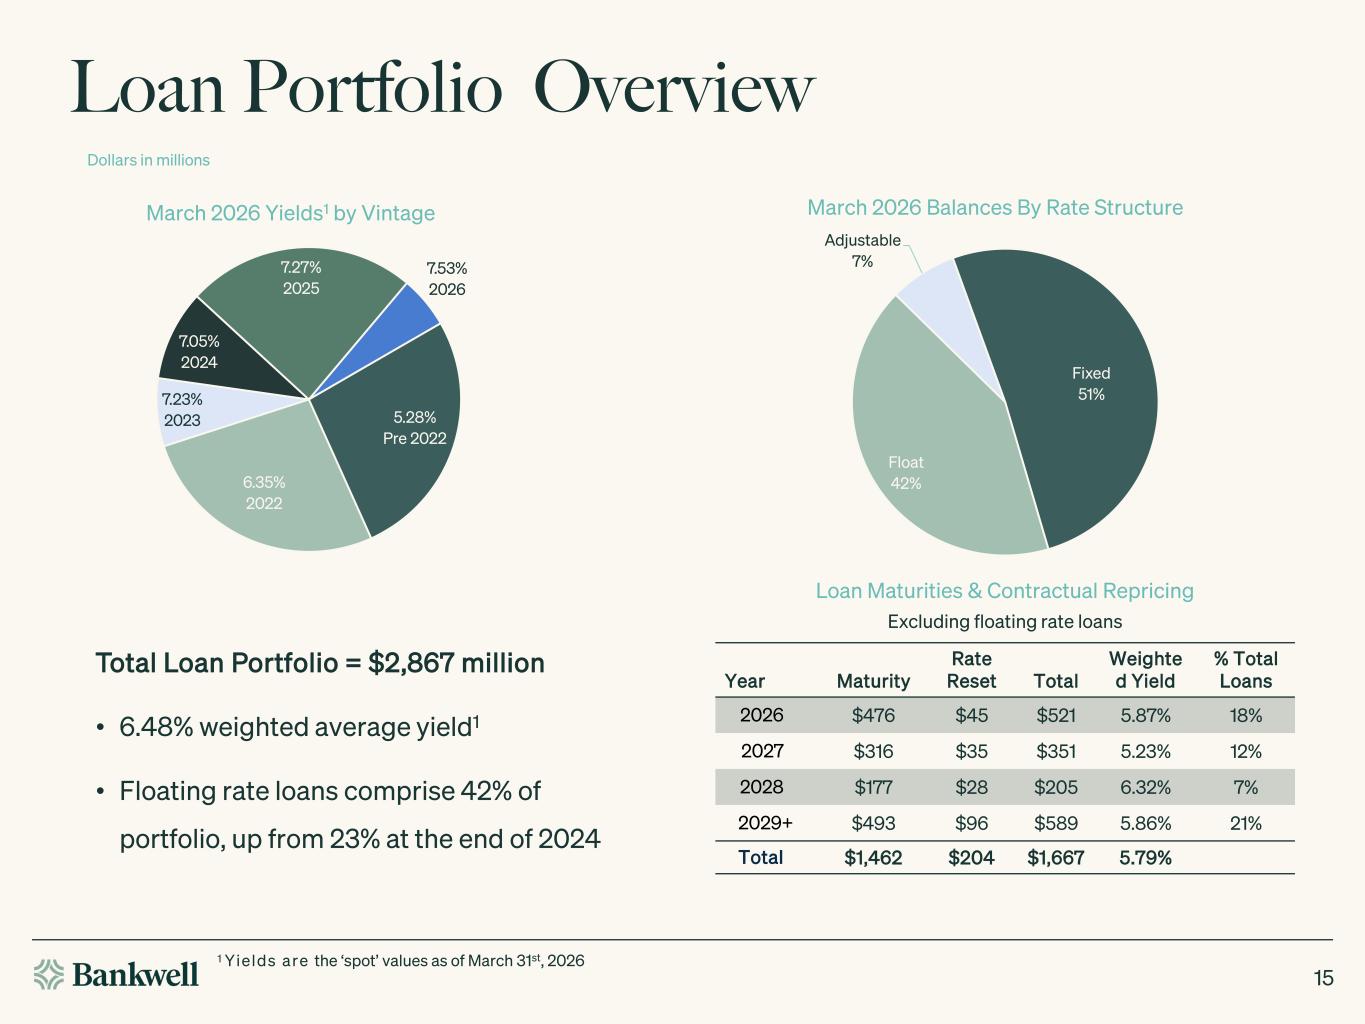
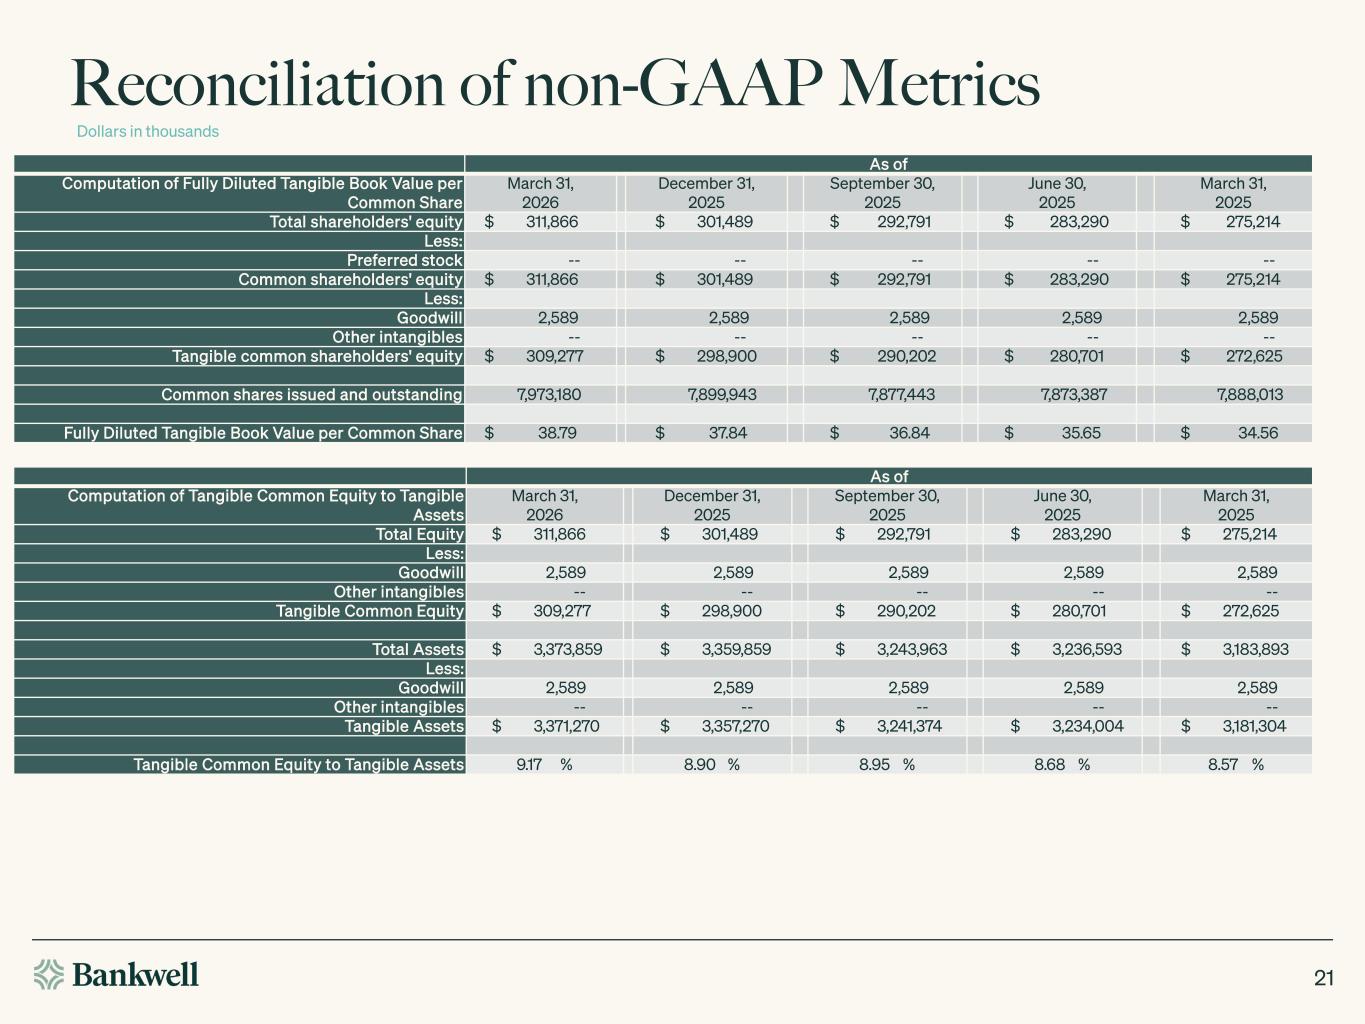
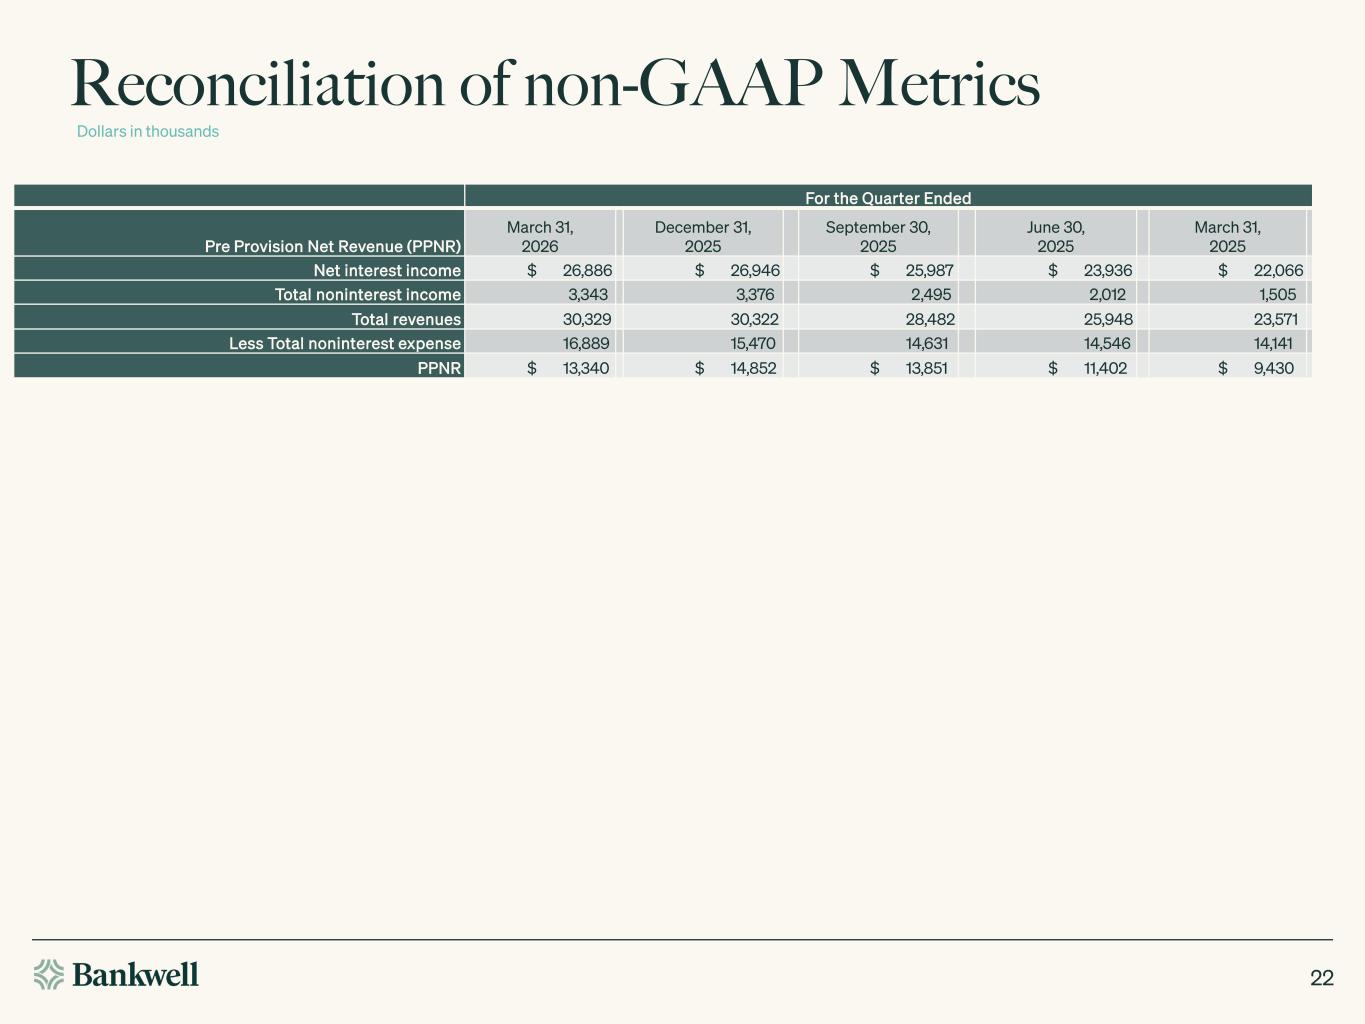
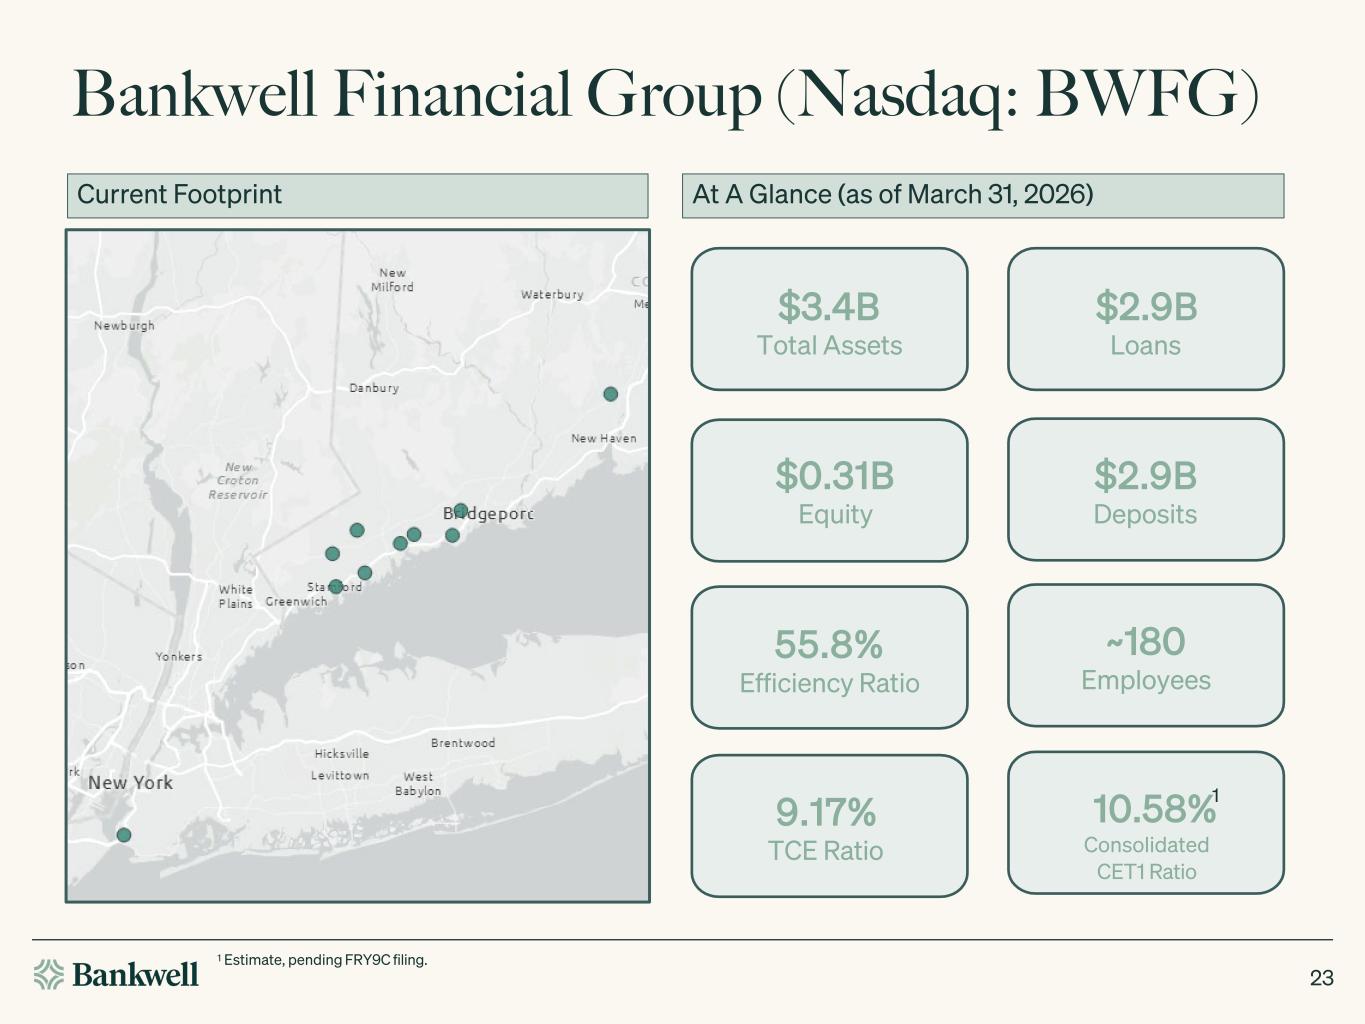
Thanks, Chris. Starting with the income statement, net interest income totaled $26.9 million for the first quarter and was largely unchanged compared to the prior quarter. Net interest margin declined modestly to 328 basis points, driven primarily by the repricing of floating rate loans in a lower rate environment and an unfavorable day count impact. On a day-count normalized basis, the sequential NIMH variance would have been approximately five basis points. These headwinds were partially offset by continued improvement in deposit costs. Total deposit costs declined to 310 basis points, down five basis points from the fourth quarter, and the bank exited March with a deposit cost exit rate of approximately 298 basis points. During the first quarter, we successfully repriced approximately $300 million of time deposits, 44 basis points lower, generating an expected annualized benefit of $1.2 million. In addition, over the next 12 months, approximately $1.1 billion of time deposits are expected to reprice favorably, with an average rate reduction of 14 basis points. This repricing is anticipated to deliver an incremental annualized benefit of roughly $1.6 million, or about 5 basis points of net interest margin. With respect to rate-sensitive assets, we've strategically increased the proportion of variable rate loans from just over 20% at the start of 2025 to approximately 42% at quarter end. Additional detail on asset and liability repricing as well as rate sensitivity is provided on page 8 of the investor presentation. Profitability remains solid in the quarter with return on average assets of 1.35% and a return on average tangible common equity of 15%. As deposit repricing continues to flow through the balance sheet and interest rate sensitivity moderates we expect incremental margin improvement over the balance of 2026 affirming our full year net interest income guidance of 111 to 112 million non-interest income totaled 3.3 million dollars for the quarter reflecting 2.4 million dollars of gains on sba loan sales and continued growth in service fee income driven by an expanding commercial client base based on our first quarter results we are raising our full year non-interest income guidance to 12 to 13 million dollars our pre-provision net revenue for the quarter was 13.3 million dollars or 1.6 percent of average assets compared to 1.8 percent in the prior quarter our ppnr was impacted by approximately 1 million dollars in annual non-interest expense typically incurred in the first quarter elevating total non-interest expense to 16.9 million dollars for the quarter these annual costs are primarily related to employee compensation and certain professional services despite these seasonal expenses our underlying non-interested expense run rate remains consistent with our prior guidance of 64 to 65 million dollars the efficiency ratio for the quarter was 55.8 percent which reflects the seasonality of first quarter expenses our provision for credit losses was a release of 1 million dollars for the quarter driven by the net impact of loan growth and economic factors embedded in our cecil model the allowance for credit losses ended the quarter at 1.03 percent of total loans with coverage of non-performing loans at approximately 155 percent from a capital and liquidity standpoint the balance sheet remained strong total assets ended the quarter at 3.4 billion dollars deposits totaled 2.9 billion dollars and both the bank and holding company remain well capitalized tangible common equity was 9.17 percent and our consolidated common equity tier one ratio was approximately 10.58 percent. We repurchased 3,317 shares during the quarter at an average price of $45.32 per share. Now I'll turn the call back to Chris for closing remarks.
Thanks, Courtney. In 2024, we laid out a plan to improve our funding mix, continue to grow our loan book in a disciplined manner, maintain strong credit quality, and build diversified sources of revenue we've also committed to continue to invest in our tech forward platform while managing expenses we are truly gratified by the results achieved through the planning and hard work done by our team and we thank them for their dedication we'll continue to execute on our strategic goals and look forward to sharing the results of our continuous growth and evolution with all of our stakeholders in the quarters ahead we thank our long-time customers for their continued support and welcome the many new customers who have helped us to grow our business. We also appreciate the continued support and interest from our shareholders and the investment community. Now operator, we're ready to open the line for questions.
Operator
As a reminder to ask a question, simply press star 1 on your telephone keypad. And from KBW, our first question comes from the line of Mark Shetley.
Operator
Please go ahead. hey good morning good morning you appreciate the uh the detail on the cds and how much that's come and do i think you said that's a five basis point benefit to the margin um so i'm just curious you know in this current rate environment now that you know it's seemingly more flat um are you seeing more competition on the deposit side um because i'm just trying to get a sense for how much the uh overall interest-bearing deposit costs can be worked out. Thanks.
First of all, the first part of that answer is the numbers that we put in that's expected to roll with CDS is based on market on the day that, you know, as of today's market. So it implies no further cuts or any deposits, if they roll to current, that's what the impact That was the first part of your question.
This is Matt. As far as the deposit competition, it is, you know, it's very competitive out there for deposits. You know, we're focused on bringing in low-cost deposits to bring down our funding costs, which is probably the most competitive area. However, you know, we're finding success and have been able to substantially grow core deposits in the quarter.
Right. So, you know, obviously it's competitive and loan growth, net loan growth was, you know, Approximately 2% quarter over quarter, but core loan growth was substantially higher. And with the, you know, so it was something like 7%, a hundred and a half, Corny?
Cor deposit growth was $113 million. So $113 million, about $30 million of that was analyzed or not just bearing a low cost, so almost 30%, 25%, 30% of what we brought in this quarter. And, you know, with the balance that didn't result in growth, we paid down more expensive borrowings. So we're happy with the deposit result, despite the competitive environment.
Improved mix in our deposits.
Operator
Okay, thanks. Appreciate it. And maybe switching gears really quick. So, you know, SBA was strong in the quarter, and it looks like originations are tracking higher than, you know, I think you previously talked about $100 million in originations for the quarter. So I'm just trying to get a sense of where you think, if there's any chance to that, and where SBA fits into the overall fee guide.
Yeah, we are having success with the SBA.
We have a really strong team.
I mean, we could definitely originate more SBA loans. We're choosing to keep the volume kind of level where it's at. We're not increasing our $100 million that we put out as, you know, how we were thinking about fee income, although other fees are coming in higher as well. So that is the reason for the increase in the fee guidance.
So if we wanted to do more, we could, is the answer. personally as we're two years into this where we're going in and measured got it i appreciate it that's that's it for me if i should take my questions thank you mark operator we're ready
Operator
for the next question apologies our next question is from the line of go ahead betty are you there
Speaker 8
yes sorry i didn't hear uh i didn't hear the name so my apologies on that no you're up betty All right, perfect. No worries. It's all good. It's just, you know, wanted to start by asking about the Brooklyn office. Just does that sort of serve as a home base for some of the deposit gathering teams that are in the city? And I was just curious, you know, how much lending do you think you will do out of that office?
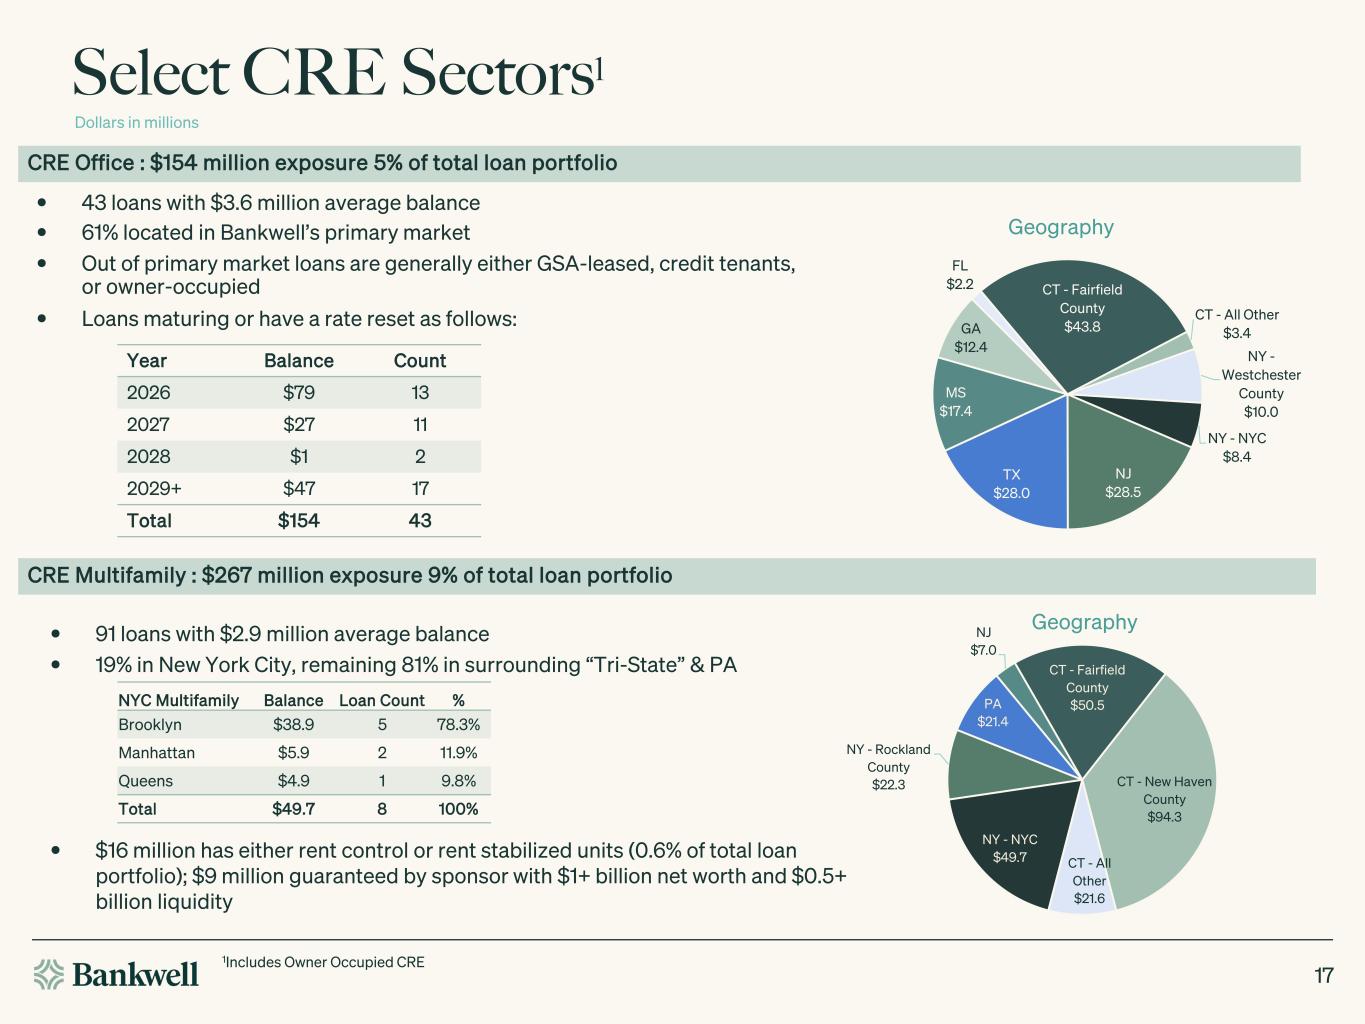
I think we'll do a modest amount of lending out of the office, Fetty. It wasn't the primary reason to open the office. It was definitely a deposit play, which is already you know taken off and been you know robust just in the you know 10 months leading up to the branch opening the team was very active and you know we've had good good success there lending isn't a part of the strategy there however we do it we do think that some loans will come out of it but we've been lending in and around NYC for for the since the existence of the bank so I really shouldn't change a whole lot as far as like the geography where we're lending I think we've said this before this is Chris it's we don't have a plan to go and try to find branches in particular markets or make
sure we have more branches we hired the people first and this is a very experienced private client group that's been together for years has already had you know material and significant impact on our organization and if what they needed is a branch to assist in their platform then we could build a branch it It wasn't, you know, we happened to love Brooklyn. I was born there, but we weren't going out of our way to enter that market. We were following our deposit team and their needs.
Betty
Analyst — Raymond James
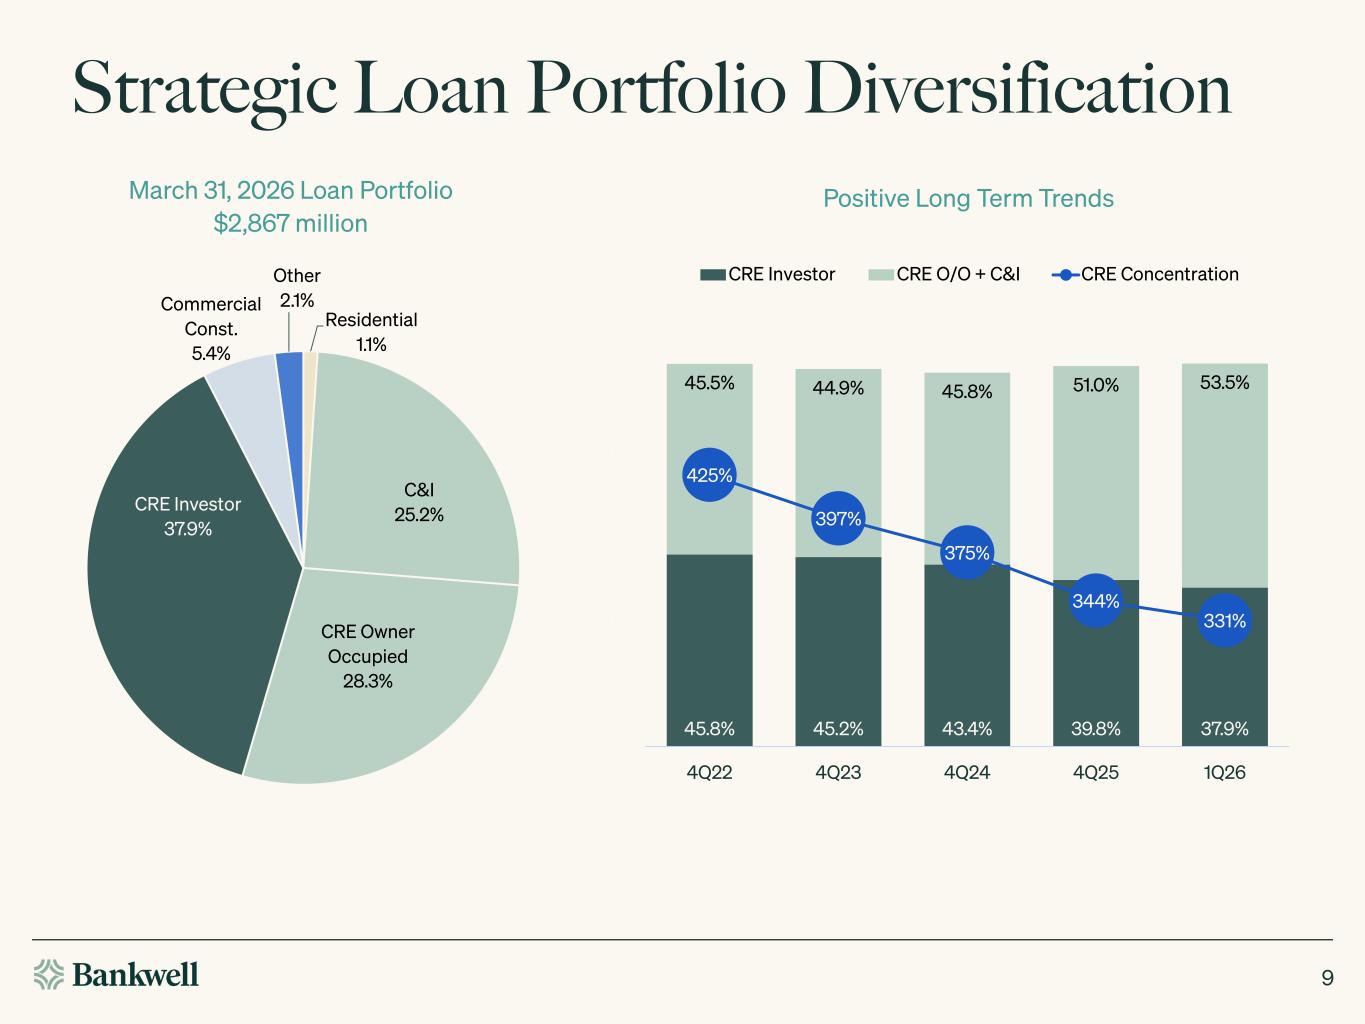
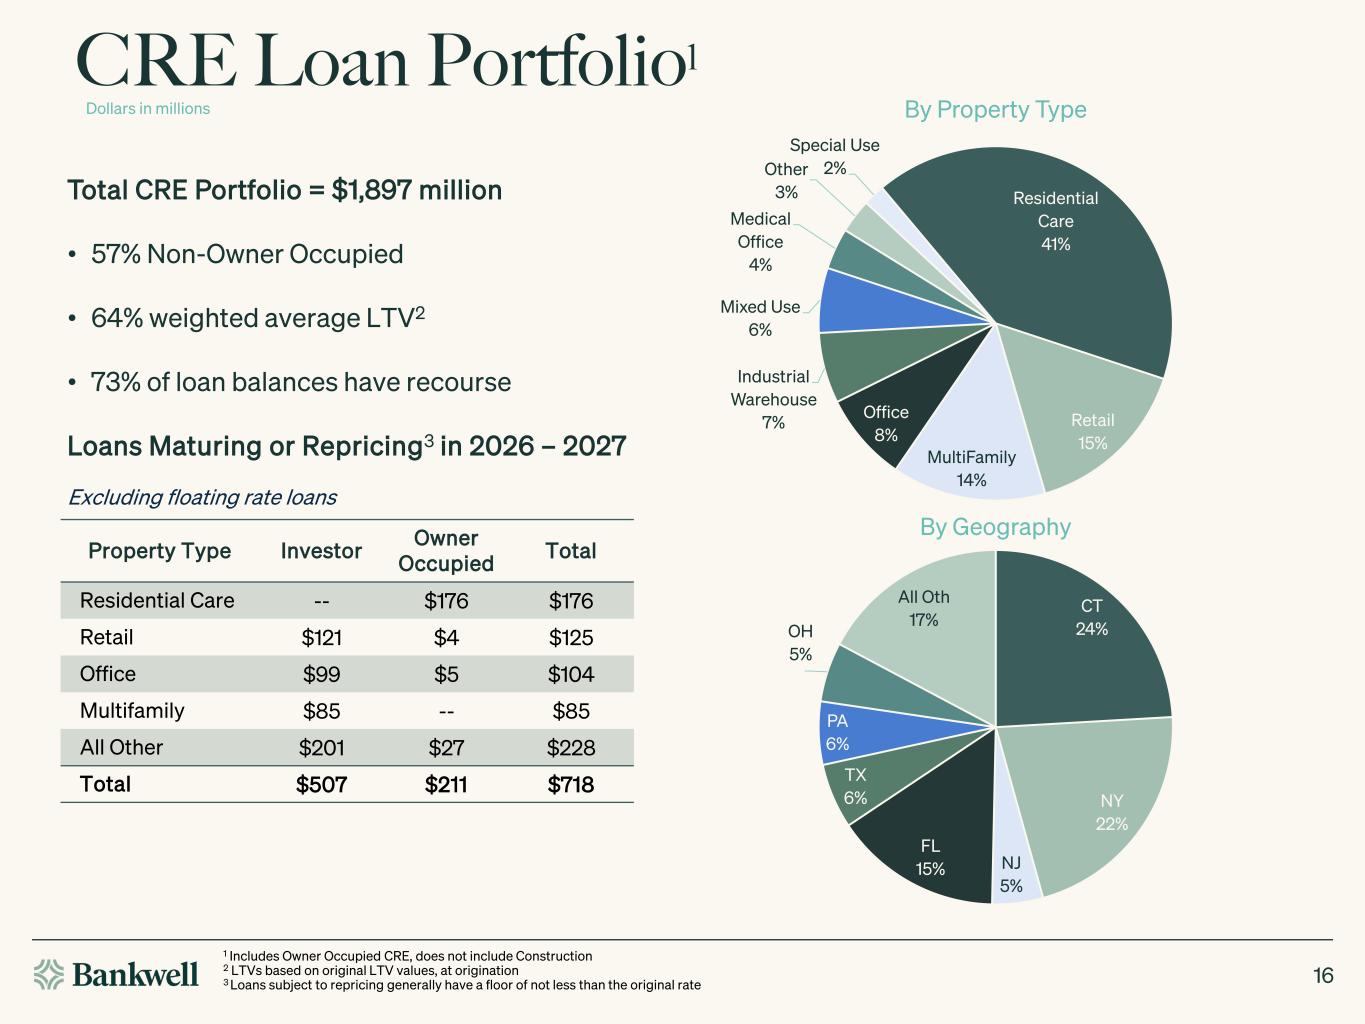
Got it. That's helpful. And then just, you know, switching gears to CRE concentration, given the current trend line, is it possible we could see that dip below 300% by year end or maybe early next year, just based on what's currently in the pipeline and capital build and what have you? or do you feel like you're kind of in a range where you're pretty comfortable uh you're not as worried about crossing that 300 threshold i'm sorry is it the creek concentration question yes um we don't have 300 as a target we're seeing a more diversified uh loan mix um it's conceivable but it's it's not the plan so you can look at the trend you know over the last
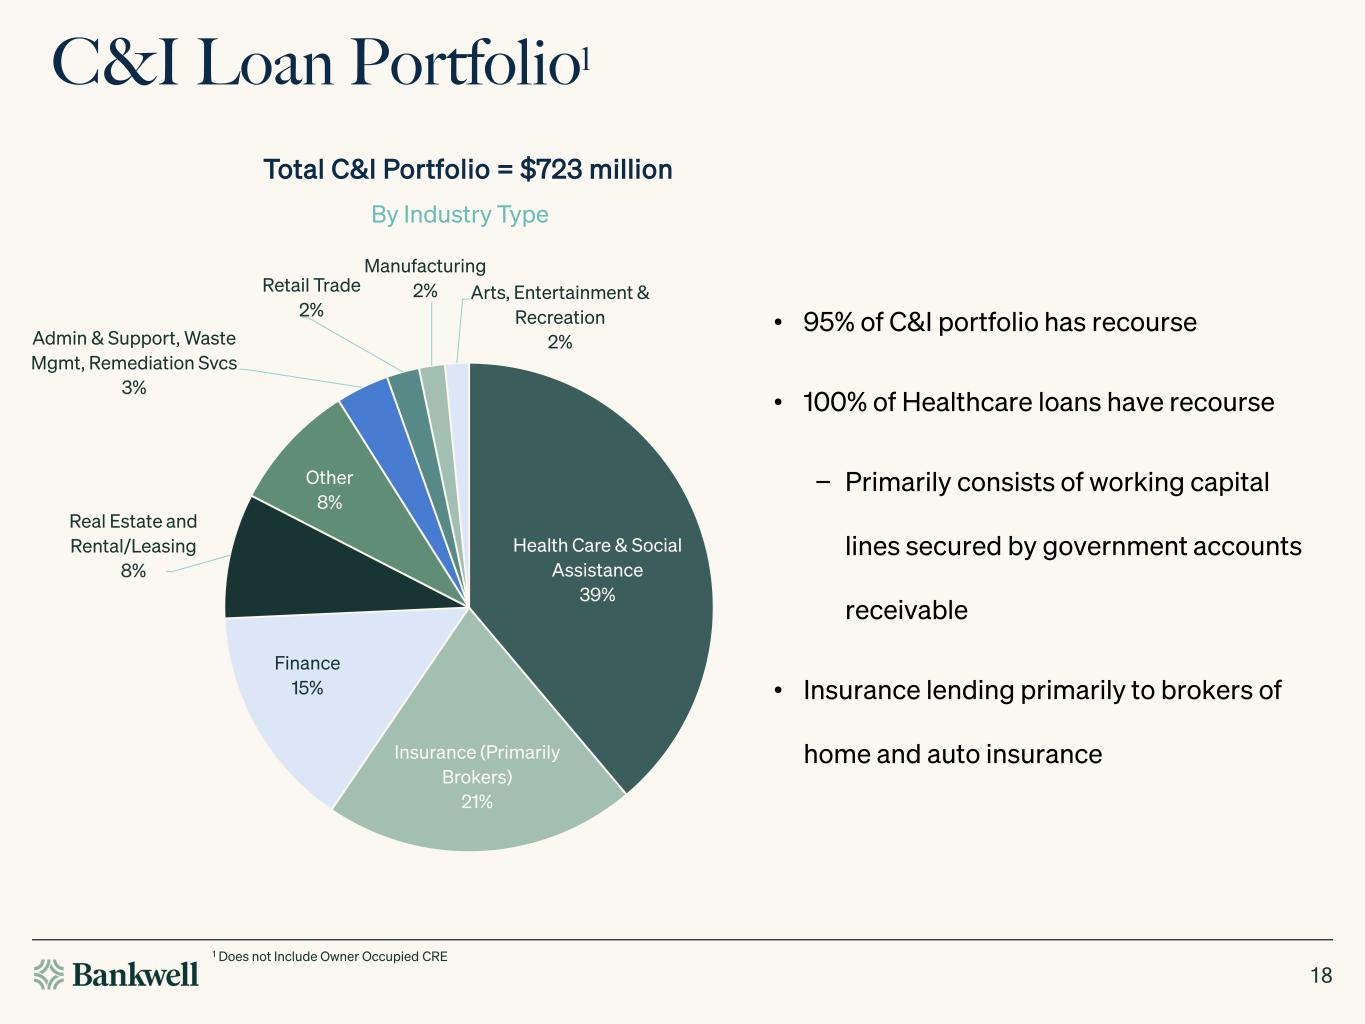
year we've come down 10 no more 375 40 basis points yeah we are happy where it is I guess we could live with it but I suspect over time we'll get down there it's whether it's year-end or not I don't know but it's been a consistent trend for a while and we're seeing a better flow of CNI deals and you know we haven't done much office etc so I think it'll naturally kind of get there but it's not a particular goal I wouldn't be surprised this came down another 10 20 basis points over the course of the year um and then just on the credit side it looked like the modest increase in accrual there was theory driven i apologize but i missed it in the
remarks but can you speak a little bit more on maybe what drove the the increase there what you might expect uh on resolution of those uh yeah the increase uh was was uh just a a a tenant left the building sponsors, you know, not able to make the payment. There's equity in the deal. We think that we'll be able to work with them to dispose of the real estate and be paid there. We, you know, as in Chris's comments, you heard that, you know, there is some visibility into resolution to several of the credits that are on our NPAs, and we expect those to happen in the, you know, next couple of quarters and you know have some meaningful resolution and a much lower nba number thanks for taking my question from raymond james your next question comes from the line of steve moss please go ahead hey guys good morning it's chase on for steve hey guys um on loan pricing uh can you tell me where new origination yields are coming on at these days
For the first quarter, our average rate was 7.5%.
Chase P.
Analyst — Raymond James (on for Steve Moss)
I appreciate that. And just one more from me. I thought you guys nibbled at buybacks this quarter. Can you tell us what would bring you more into that market?
I'm sorry. Can you repeat that? I heard buybacks and then cut out.
Chase P.
Analyst — Raymond James (on for Steve Moss)
Yeah, I saw you nibbled at buybacks. Could you tell us what would bring you more into that market?
We look at the price quarterly or daily when we're not in blackout. We had a plan in place. I expect the number will grow over the course of the year, but you have to look at our consolidated CET1 ratio, and we are still trying to grow that. If the levels we have gotten to the last couple days and the amount of stock that we issued, I wouldn't be surprised to see us over the course of the year nibble some back, but we still need to, you know, our goal is still to get to 11%, not necessarily by year end, and the CTE-1 ratio at the whole cove.
Chase P.
Analyst — Raymond James (on for Steve Moss)
All right, guys, I appreciate all the color. I have the questions that have been answered. Thank you, guys.
Operator
And with no further questions include, thank you. This does conclude today's conference call. you may now disconnect.