
CALM 8-K
Cal-Maine Foods Inc (CALM)
8-K
2023-11-14
For: 2023-11-14
View Original
Added on
April 11, 2026
UNITED STATES
SECURITIES AND EXCHANGE COMMISSION
WASHINGTON, DC 20549
FORM
CURRENT REPORT
Pursuant to Section 13 or 15(d) of the Securities Exchange Act
Date of Report (Date of Earliest Event Reported):
(Exact name of registrant as specified in its charter)
(State or other jurisdiction of
incorporation)
(Commission File Number)
(IRS Employer Identification No.)
,
,
,
(Address of principal executive offices (zip code))
-
(Registrant’s telephone number, including area code)
Check the appropriate box below if the Form 8-K filing is intended to simultaneously satisfy the filing obligation of the
registrant under any of the following provisions (see General Instruction A.2 below):
☐
☐
☐
☐
Securities registered pursuant to Section 12(b) of the Act:
Title of each class
Trading
Symbol(s)
Name of each exchange on which registered
The
Indicate by check mark whether the registrant is an emerging growth company as defined in Rule 405 of the Securities Act of
1933 (§230.405 of this chapter) or Rule 12b-2 of the Securities Exchange Act of 1934 (§240.12b-2 of this chapter).
Emerging growth company
If an emerging growth company, indicate by check mark if the registrant has elected not to use the extended transition period
for complying with any new or revised financial accounting standards provided pursuant to Section 13(a) of the Exchange
Act.
☐
Item 7.01. – Regulation FD Disclosure.
Beginning on November 15, 2022, Cal-Maine Foods, Inc. (the “Company”) will be participating in the Stephens 2023 Annual
Investment Conference and will use the investor presentation included as Exhibit 99.1 hereto (“Investor Presentation”) and
incorporated herein by reference. The fireside chat presentation by Sherman Miller, president and chief executive officer and Max
Bowman, vice president and chief financial officer, will begin at approximately 10:00 a.m. Central Time on Wednesday,
November 15, 2023, and will be available to investors via a live audio webcast. A link to the presentation and broadcast can be
found at the investor relations section of the Company’s website, www.calmainefoods.com. A replay will be available for 90 days.
In accordance with General Instruction B.2 of Form 8-K, the information in this Item 7.01 of this Current Report on Form 8-K,
including Exhibit 99.1 hereto, which are furnished herewith pursuant to and relate to this Item 7.01, shall not be deemed "filed"
for purposes of Section 18 of the Securities Exchange Act of 1934, as amended (the "Exchange Act"), or otherwise be subject
to the liabilities of Section 18 of the Exchange Act. The information in this Item 7.01 of this Current Report on Form 8-K and
Exhibit 99.1 hereto shall not be incorporated by reference into any filing or other document filed by the Company with the SEC
pursuant to the Securities Act of 1933, as amended, the rules and regulations of the SEC thereunder, the Exchange Act, or the
rules and regulations of the SEC thereunder except as shall be expressly set forth by specific reference to this Form 8-K in such
filing or document.
Item 9.01. Financial Statements and Exhibits
(d) Exhibits
Exhibit
Number
Description
99.1
104
Cover Page Interactive Data File, (embedded within the Inline XBRL document)
SIGNATURES
Pursuant to the requirements for the Securities Exchange Act of 1934, the registrant has duly caused this report to be signed on
its behalf by the undersigned hereunto duly authorized.
CAL-MAINE FOODS, INC.
Date:
November 14, 2023
By:
/s/ Max P. Bowman
Max P. Bowman
Director, Vice President, and Chief Financial Officer
Exhibit 99.1
CM Cal-Maine Foods Investor Presentation November 2023 © Cal-Maine Foods. All rights reserved.
Cal-Maine Foods SECTION 1 Company Overview CAL-MAINE FOODS | INVESTOR PRESENTATION | NOVEMBER 2023 2
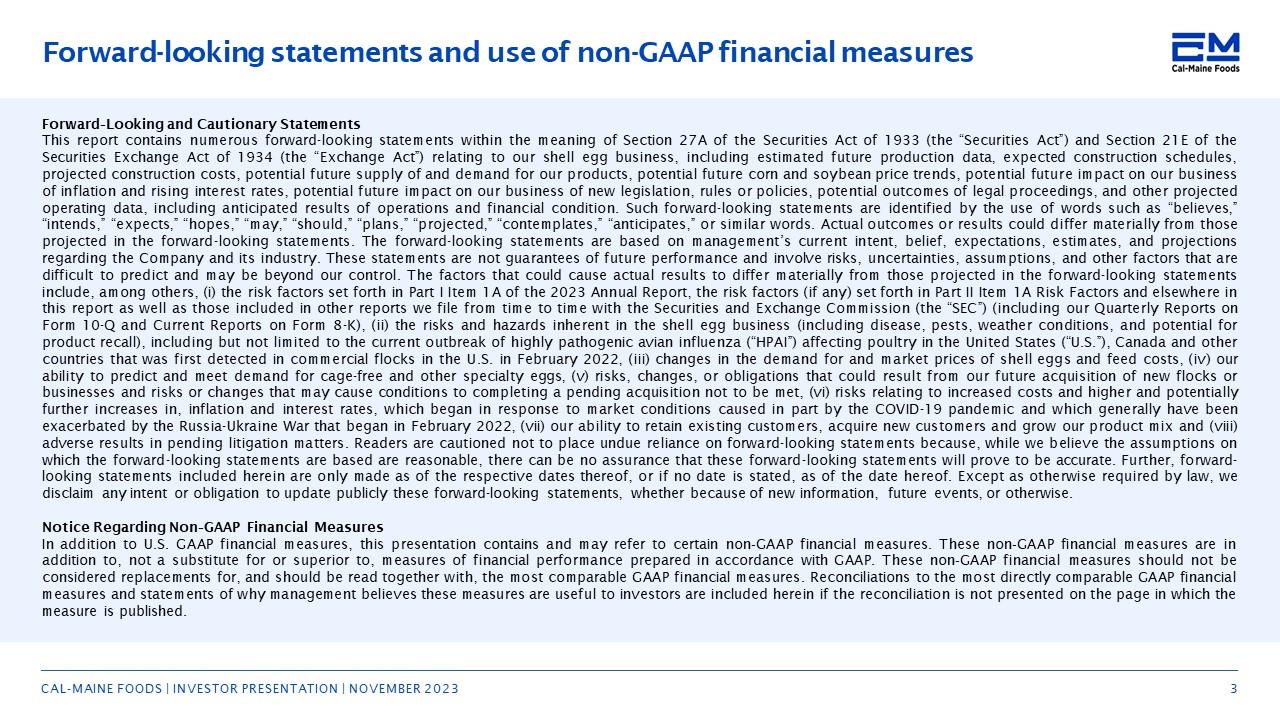
Cal-Maine Foods Forward-looking statements and use of non-GAAP financial measures Forward‐Looking and Cautionary Statements This report contains numerous forward-looking statements within the meaning of Section 27A of the Securities Act of 1933 (the “Securities Act”) and Section 21E of the Securities Exchange Act of 1934 (the “Exchange Act”) relating to our shell egg business, including estimated future production data, expected construction schedules, projected construction costs, potential future supply of and demand for our products, potential future corn and soybean price trends, potential future impact on our business of inflation and rising interest rates, potential future impact on our business of new legislation, rules or policies, potential outcomes of legal proceedings, and other projected operating data, including anticipated results of operations and financial condition. Such forward-looking statements are identified by the use of words such as “believes,” “intends,” “expects,” “hopes,” “may,” “should,” “plans,” “projected,” “contemplates,” “anticipates,” or similar words. Actual outcomes or results could differ materially from those projected in the forward -looking statements. The forward-looking statements are based on management’s current intent, belief, expectations, estimates, and projections regarding the Company and its industry. These statements are not guarantees of future performance and involve risks, uncertainties, assumptions, and other factors that are difficult to predict and may be beyond our control. The factors that could cause actual results to differ materially from those projected in the forward-looking statements include, among others, (i) the risk factors set forth in Part I Item 1A of the 2023 Annual Report, the risk factors (if any) set forth in Part II Item 1A Risk Factors and elsewhere in this report as well as those included in other reports we file from time to time with
the Securities and Exchange Commission (the “SEC”) (including our Quarterly Reports on Form 10-Q and Current Reports on Form 8-K), (ii) the risks and hazards inherent in the shell egg business (including disease, pests, weather conditions, and potential for product recall), including but not limited to the current outbreak of highly pathogenic avian influenza (“HPAI”) affecting poultry in the United States (“U.S.”), Canada and other countries that was first detected in commercial flocks in the U.S. in February 2022, (iii) changes in the demand for and market prices of shell eggs and feed costs, (iv) our ability to predict and meet demand for cage-free and other specialty eggs, (v) risks, changes, or obligations that could result from our future acquisition of new flocks or businesses and risks or changes that may cause conditions to completing a pending acquisition not to be met, (vi) risks relating to increased costs and higher and potentially further increases in, inflation and interest rates, which began in response to market conditions caused in part by the COVID-19 pandemic and which generally have been exacerbated by the Russia-Ukraine War that began in February 2022, (vii) our ability to retain existing customers, acquire new customers and grow our product mix and (viii) adverse results in pending litigation matters. Readers are cautioned not to place undue reliance on forward-looking statements because, while we believe the assumptions on which the forward-looking statements are based are reasonable, there can be no assurance that these forward-looking statements will prove to be accurate. Further, forward-looking statements included herein are only made as of the respective dates thereof, or if no date is stated, as of the date hereof. Except as otherwise required by law, we disclaim any intent or obligation to update publicly these forward-looking statements, whether because of new information,
future events, or otherwise. Notice Regarding Non‐GAAP Financial Measures In addition to U.S. GAAP financial measures, this presentation contains and may refer to certain non‐GAAP financial measures. These non‐GAAP financial measures are in addition to, not a substitute for or superior to, measures of financial performance prepared in accordance with GAAP. These non‐GAAP financial measures should not be considered replacements for, and should be read together with, the most comparable GAAP financial measures. Reconciliations to the most directly comparable GAAP financial measures and statements of why management believes these measures are useful to investors are included herein if the reconciliation is not presented on the page in which the measure is published. CAL-MAINE FOODS | INVESTOR PRESENTATION | NOVEMBER 2023 3
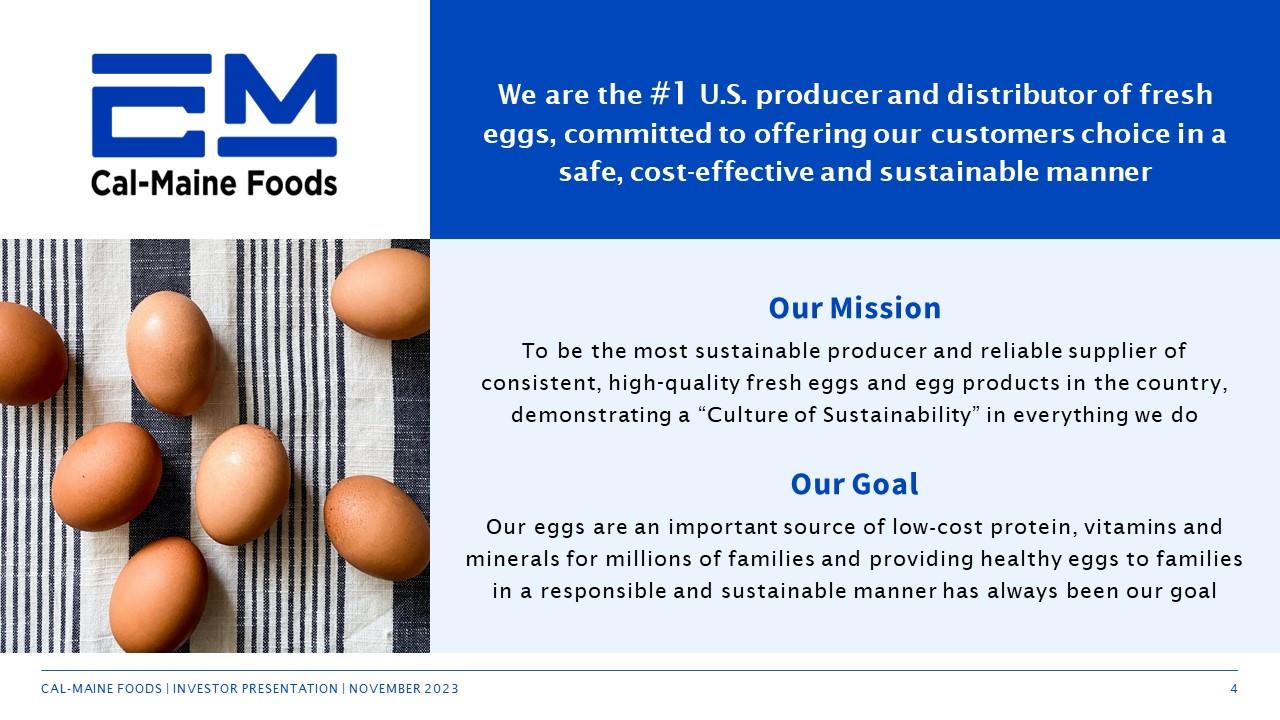
Cal-Maine Foods We are the #1 U.S. producer and distributor of fresh eggs, committed to offering our customers choice in a safe, cost-effective and sustainable manner Our Mission To be the most sustainable producer and reliable supplier of consistent, high-quality fresh eggs and egg products in the country, demonstrating a “Culture of Sustainability” in everything we do Our Goal Our eggs are an important source of low‐cost protein, vitamins and minerals for millions of families and providing healthy eggs to families in a responsible and sustainable manner has always been our goal CAL-MAINE FOODS | INVESTOR PRESENTATION | NOVEMBER 2023 4
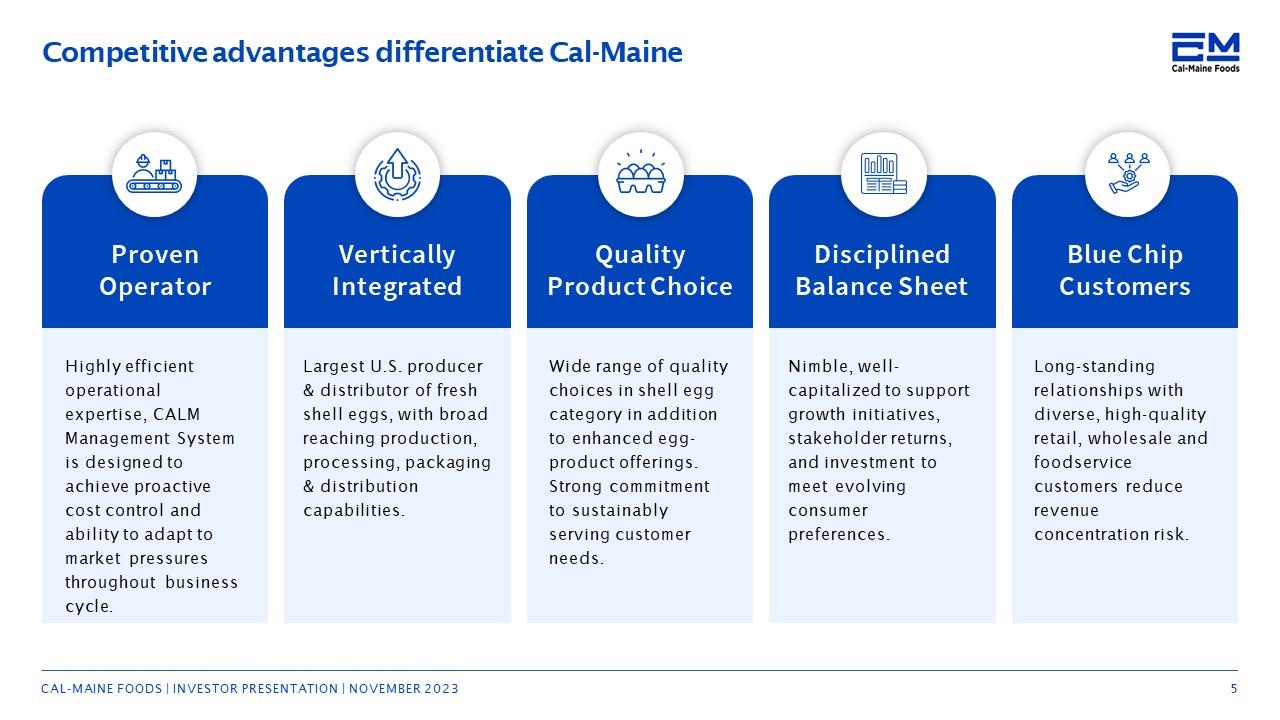
Cal-Maine Foods Competitive advantages differentiate Cal-Maine Prove Operator Highly efficient operational expertise, CALM Management System is designed to achieve proactive cost control and ability to adapt to market pressures throughout business cycle. Vertically Integrated Largest U.S. producer & distributor of fresh shell eggs, with broad reaching production, processing, packaging & distribution capabilities. Quality Product Choice Wide range of quality choices in shell egg category in addition to enhanced egg-product offerings. Strong commitment to sustainably serving customer needs. Disciplined Balance Sheet Nimble, well-capitalized to support growth initiatives, stakeholder returns, and investment to meet evolving consumer preferences. Blue Chip Customers Long-standing relationships with diverse, high-quality retail, wholesale and foodservice customers reduce revenue concentration risk. CAL-MAINE FOODS | INVESTOR PRESENTATION | NOVEMBER 2023 5
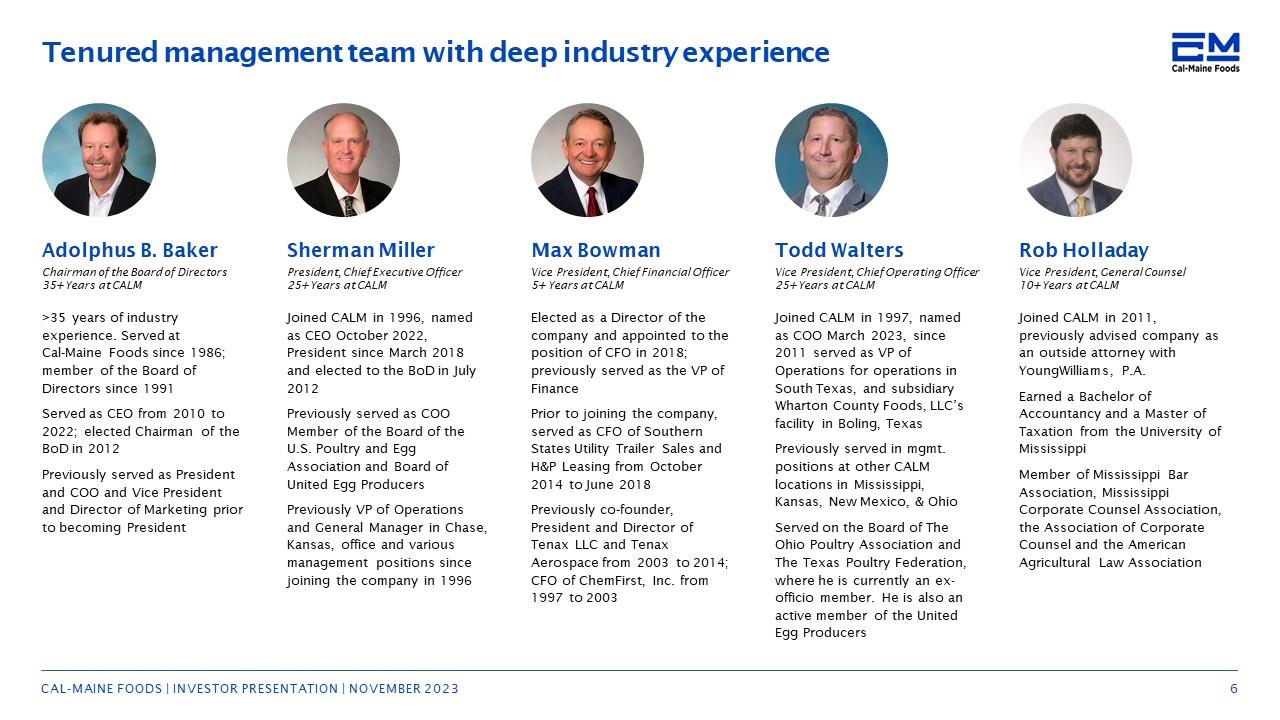
Cal-Maine Foods Tenured management team with deep industry experience Adolphus S. Baker Chairman of the Board of Directors 35+ years at CALM >35 years of industry experience. Served at Cal‐Maine Foods since 1986; member of the Board of Directors since 1991 Served as CEO from 2010 to 2022; elected Chairman of the BoD in 2012 Previously served as President and COO and Vice President and Director of Marketing prior to becoming President Sherman Miller President, Chief Execut ive Officer 25+ Years at CALM Joined CALM in 1996, named as CEO October 2022, President since March 2018 and elected to the BoD in July 2012 Previously served as COO Member of the Board of the U.S. Poultry and Egg Association and Board of United Egg Producers Previously VP of Operations and General Manager in Chase, Kansas, office and various management positions since joining the company in 1996 Max Bowman Vice President, Chief Financial Officer 5+ years at CALM Elected as a Director of the company and appointed to the position of CFO in 2018; previously served as the VP of Finance Prior to joining the company, served as CFO of Southern States Utility Trailer Sales and H&P Leasing from October 2014 to June 2018 Previously co‐founder, President and Director of Tenax LLC and Tenax Aerospace from 2003 to 2014; CFO of ChemFirst, Inc. from 1997 to 2003 Todd Walters Vice President, Chef Operating Officer 25+ Years at CALM Joined CALM in 1997, named as COO March 2023, since 2011 served as VP of Operations for operations in South Texas, and subsidiary Wharton County Foods, LLC’s facility in Boling, Texas Previously served in mgmt. positions at other CALM locations in Mississippi, Kansas, New Mexico, & Ohio Served on the Board of The Ohio Poultry Association and The Texas Poultry Federation, where he is currently an ex-officio member. He is also
an active member of the United Egg Producers Rob Holladay Vice President, General Counsel 10+ Years at CALM Joined CALM in 2011, previously advised company as an outside attorney with YoungWilliams, P.A. Earned a Bachelor of Accountancy and a Master of Taxation from the University of Mississippi Member of Mississippi Bar Association, Mississippi Corporate Counsel Association, the Association of Corporate Counsel and the American Agricultural Law Association CAL-MAINE FOODS | INVESTOR PRESENTATION | NOVEMBER 2023 6
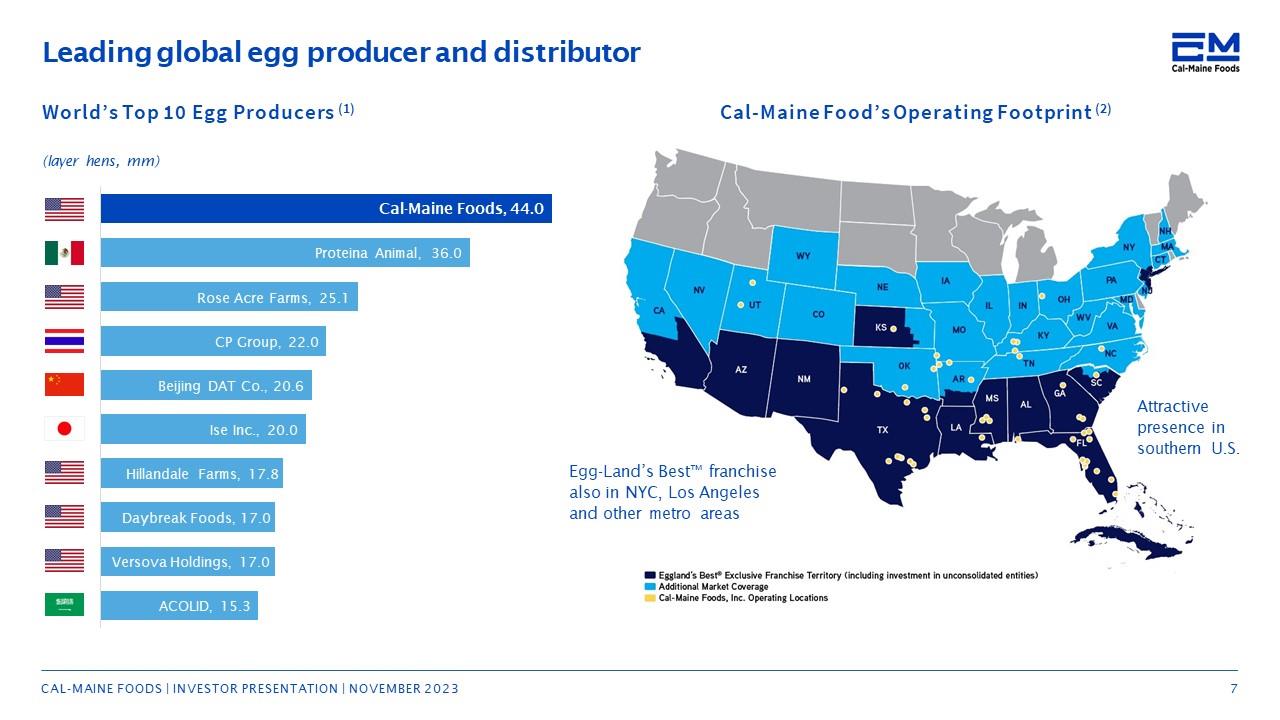
Cal-Maine Foods Leading global egg producer and distributor World’s Top 10 Egg Producer s(1) (layer hens, mm) Cal-Maine Foods, 44.0 Proteina Animal, 36.0 Rose Acre Farms, 25.1 CP Group, 22.0 Beijing DAT Co., 20.6 B®* Ise Inc., 20.0 Hillandale Farms, 1 7.8 HBF Daybreak Foods, 1 7.0 HP' Vers ova Holdings, 1 7.0 Br ACOLID, 15.3 Cal-Maine Food’s Operating Footprint (2) Egg-Land’s BestTM franchise also in NYC, Los Angeles and other metro areas Attractive presence in southern U.S. Eggland's Best® Exclusive Franchise Territory (including investment in unconsolidated entities) Additional Market Coverage Cal-Maine Foods, Inc. Operating Locations CAL-MAINE FOODS | INVESTOR PRESENTATION | NOVEMBER 2023 7
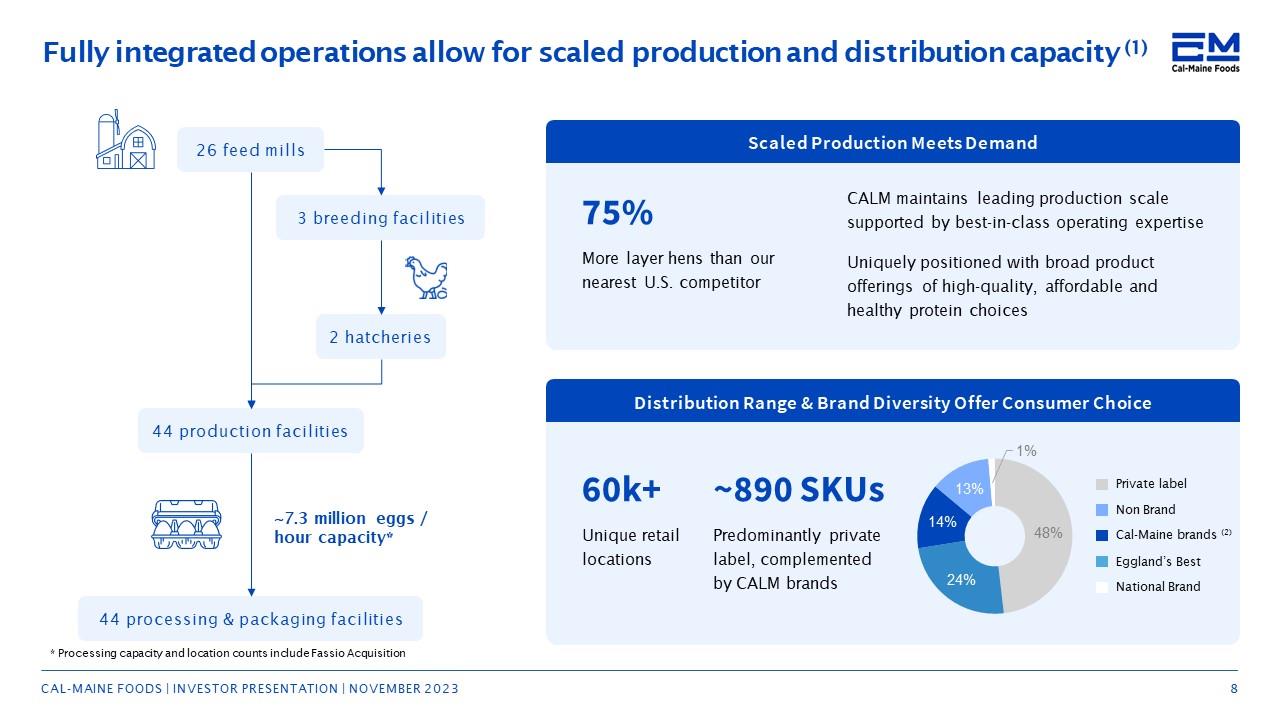
Cal-Maine Foods Fully integrated operations allow for scaled production and distribution capacity (1) 26 feed mills 3 breeding facilities 2 hatcheries 44 production facilities ~7.3 million eggs / hour capacity* 44 processing & packaging facilities. Scaled Production Meets Demand 75% More layer hens than our nearest U.S. competitor CALM maintains leading production scale supported by best-in-class operating expertise Uniquely positioned with broad product offerings of high-quality, affordable and healthy protein choices 60k+ Unique retail locations ~890 SKUs Predominantly private label, complemented by CALM brands 1% National Brand 48% Private label 24% Non Brand 14% Cal-Maine brands (2) 13% Eggland’s Best * Processing capacity and location counts include Fassio Acquisition CAL-MAINE FOODS | INVESTOR PRESENTATION | NOVEMBER 2023 8
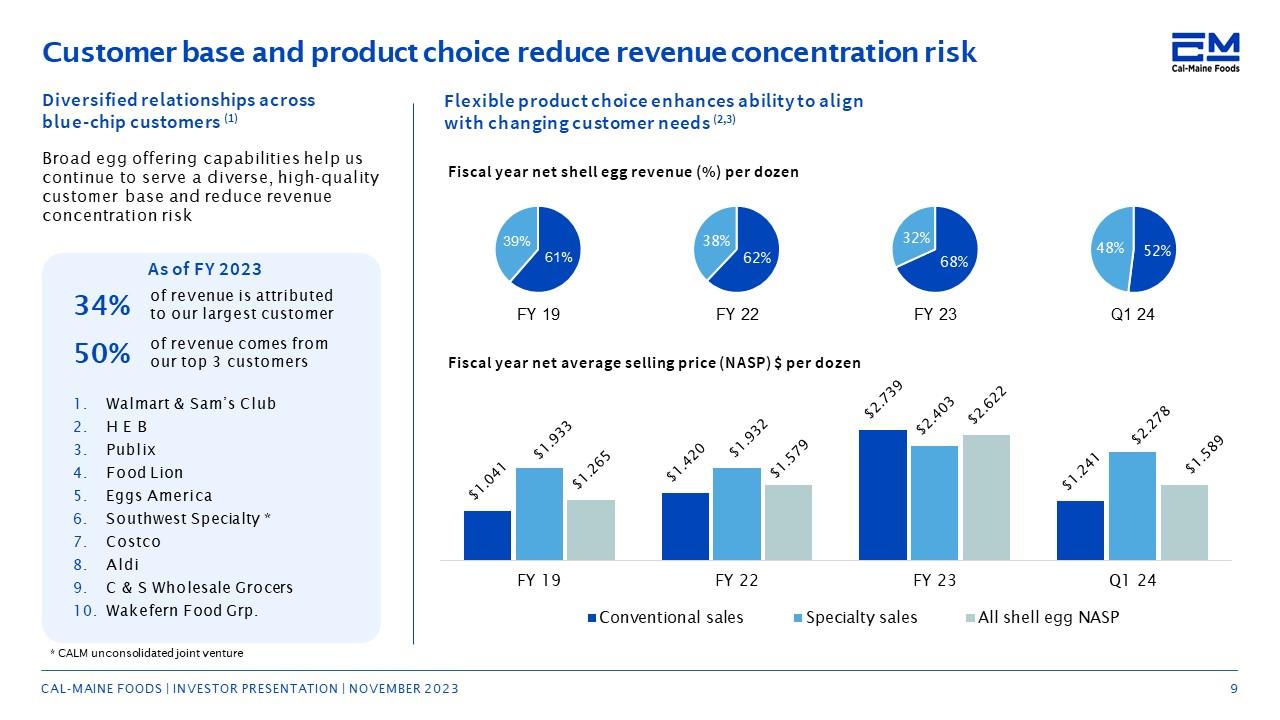
Cal-Maine Foods Customer base and product choice reduce revenue concentration risk Diversified relationships across blue-chip customers (1) Broad egg offering capabilities help us continue to serve a diverse, high-quality customer base and reduce revenue concentration risk As of FY 2023 34% of revenue is attributed to our largest customer 50% of revenue comes from our top 3 customers 1.Walmart & Sam’s Club 2.H E B 3.Publix 4.Food Lion 5.Eggs America 6.Southwest Specialty * 7.Costco 8.Aldi 9.C & S Wholesale Grocers 10.Wakefern Food Grp. Flexible product choice enhances ability to align with changing customer needs (2,3) Fiscal year net shell egg revenue (%) per dozen 39% 61% FY 19 38% 62% FY22 32% 68% FY 23 48% 52% Q1 24 Fiscal year net average selling price (NASP) $ per dozen $1,041 $1,420 $2,739 $1,241 $1,933 $1,932 $2,403 $2,278 $1,265 $1,579 $2,622 $1,589 FY 19 FY 22 FY 23 Q1 24 Conventional sales Specialty sales All shell egg NASP CAL-MAINE FOODS | INVESTOR PRESENTATION | NOVEMBER 2023 9
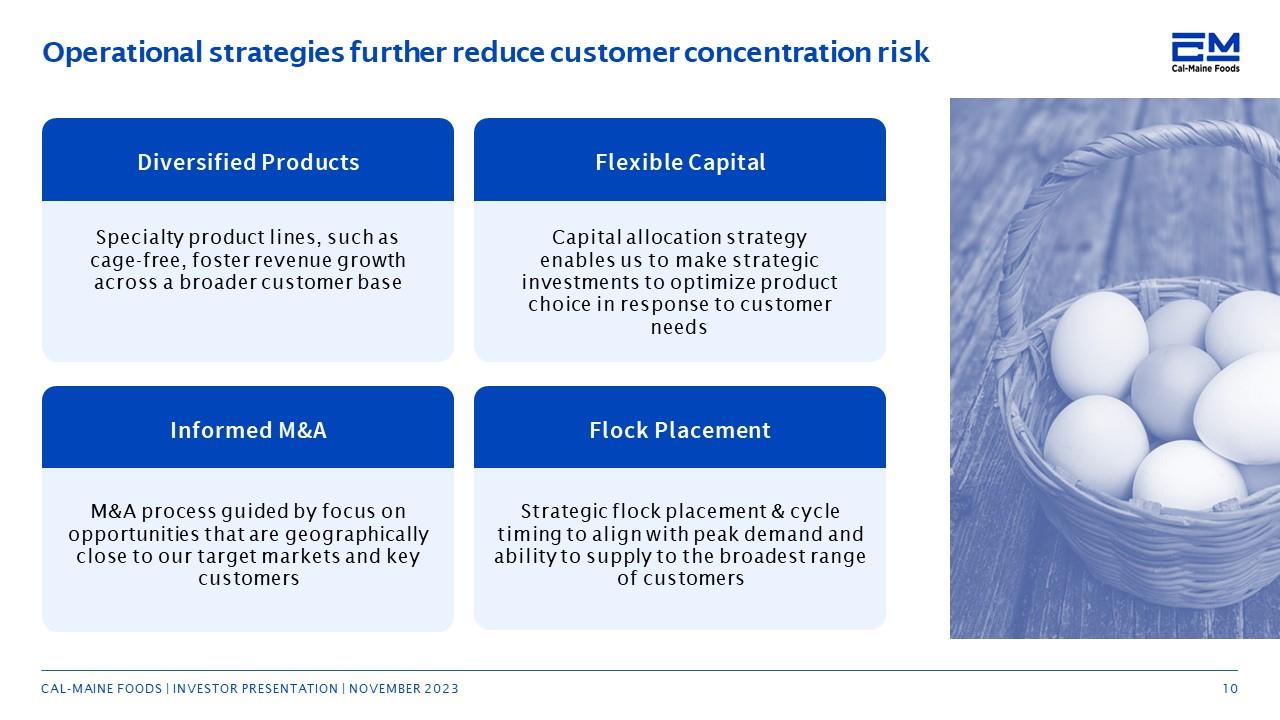
Cal-Maine Foods Operational strategies further reduce customer concentration risk Diversified Products Specialty product lines, such as cage-free, foster revenue growth across a broader customer base Flexible Capital Capital allocation strategy enables us to make strategic investments to optimize product choice in response to customer needs Informed M&A M&A process guided by focus on opportunities that are geographically close to our target markets and key customers Flock Placement Strategic flock placement & cycle timing to align with peak demand and ability to supply to the broadest range of customers CAL-MAINE FOODS | INVESTOR PRESENTATION | NOVEMBER 2023 10
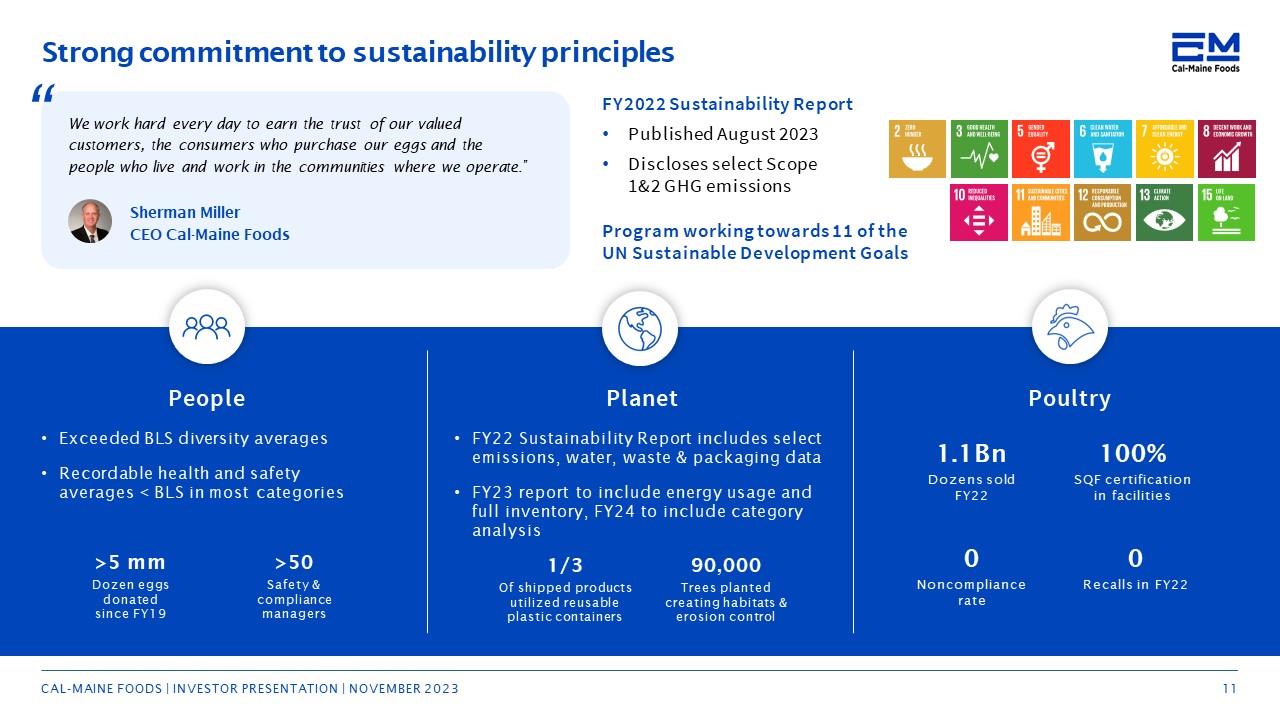
Cal-Maine Foods Strong commitment to sustainability principles We work hard every day to earn the trust of our valued customers, the consumers who purchase our eggs and the people who live and work in the communities where we operate.” Sherman Miller CEO Cal-Maine Foods FY2022 Sustainability Report Program working towards 11 of the UN Sustainable Development Goals •Published August 2023 •Discloses select Scope 1&2 GHG emissions People • Exceeded BLS diversity averages •Recordable health and safety averages < BLS in most categories >5 mm Dozen eggs donated since FY19 >50 Safety & compliance managers Planet •FY22 Sustainability Report includes select emissions, water, waste & packaging data •FY23 report to include energy usage and full inventory, FY24 to include category analysis 1/3 Of shipped products utilized reusable plastic containers 90,000 Trees planted creating habitats ^ erosion control Poultry 1.1Bn Dozens sold FY22 100% SQF certification in facilities 0 Noncompliance rate 0 Recalls in FY22 CAL-MAINE FOODS | INVESTOR PRESENTATION | NOVEMBER 2023 11
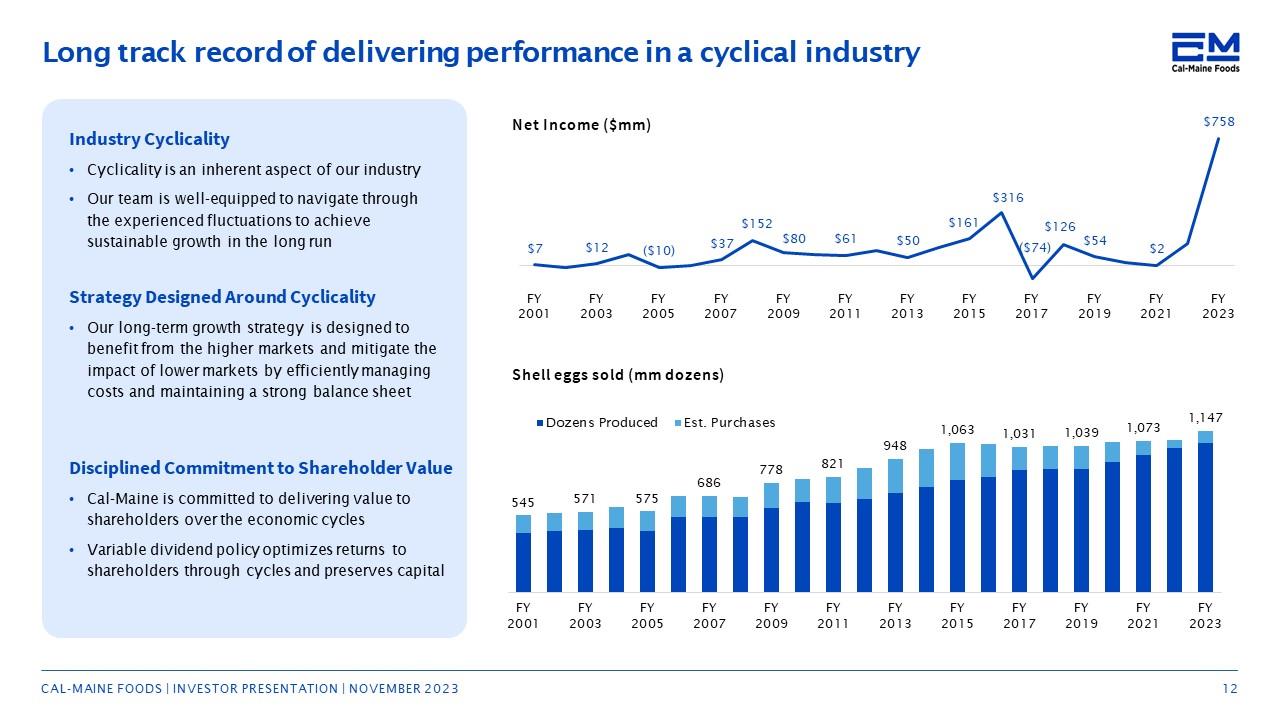
Cal-Maine Foods Long track record of delivering performance in a cyclical industry Industry Cyclicality • Cyclicality is an inherent aspect of our industry • Our team is well-equipped to navigate through the experienced fluctuations to achieve sustainable growth in the long run Strategy Designed Around Cyclicality •Our long-term growth strategy is designed to benefit from the higher markets and mitigate the impact of lower markets by efficiently managing costs and maintaining a strong balance sheet Disciplined Commitment to Shareholder Value •Cal-Maine is committed to delivering value to shareholders over the economic cycles •Variable dividend policy optimizes returns to shareholders through cycles and preserves capital Net Income ($mm) $7 $12 ($10) $37 $152 $80 $61 $50 $161 $316 ($74) $126 $54 $2 $758 FY FY FY FY FY FY FY FY FY FY FY FY 2001 2003 2005 2007 2009 2011 2013 2015 2017 2019 2021 2023 Shell eggs sold (mm dozens) Dozen Produced Est. Purchases 545 571 575 686 778 821 948 1,063 1,031 1,039 1,073 1,147 FY FY FY FY FY FY FY FY FY FY FY FY 2001 2003 2005 2007 2009 2011 2013 2015 2017 2019 2021 2023 CAL-MAINE FOODS | INVESTOR PRESENTATION | NOVEMBER 2023 12
Cal-Maine Foods SECTION 2 Long Term Drivers of our Business CAL-MAINE FOODS | INVESTOR PRESENTATION | NOVEMBER 2023 13
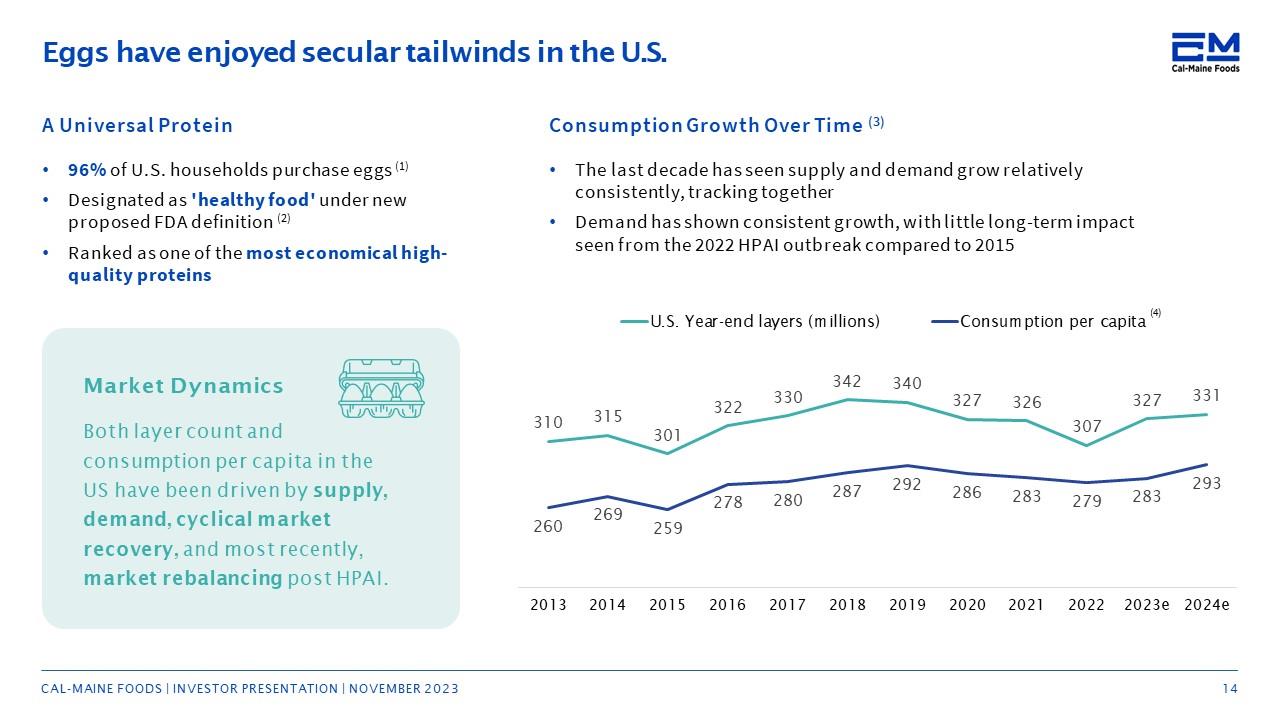
Cal-Maine Foods Eggs have enjoyed secular tailwinds in the U.S. A Universal Protein • 96% of U.S. households purchase eggs (1) •Designated as 'healthy food' under new proposed FDA definition (2) •Ranked as one of the most economical high-quality proteins Market Dynamics Both layer count and consumption per capita in the US have been driven by supply, demand, cyclical market recovery, and most recently, market rebalancing post HPAI. Consumption Growth Over Time (3) •The last decade has seen supply and demand grow relatively consistently, tracking together •Demand has shown consistent growth, with little long-term impact seen from the 2022 HPAI outbreak compared to 2015 U.S. Year -end layers (millions) Consumption per capita (4) 310 315 301 322 330 342 340 327 326 307 327 331 260 269 259 278 280 287 292 286 283 279 283 293 2013 2014 2015 2016 2017 2018 2019 2020 2021 2022 2023e 2024e CAL-MAINE FOODS | INVESTOR PRESENTATION | NOVEMBER 2023 14
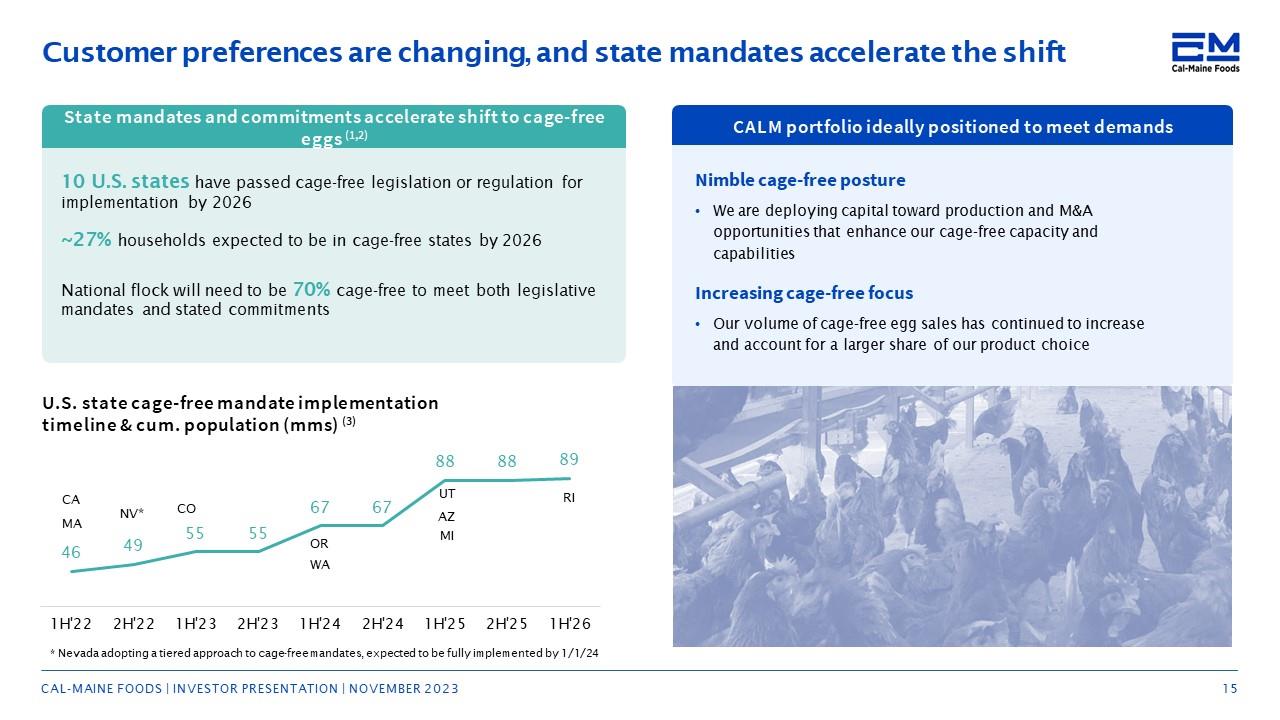
Cal-Maine Foods Customer preferences are changing, and state mandates accelerate the shift State mandates and commitments accelerate shift to cage-free eggs (1,2) 10 U.S. states have passed cage-free legislation or regulation for implementation by 2026 ~27% households expected to be in cage-free states by 2026 National flock will need to be 70% cage -free to meet both legislative mandates and stated commitments U.S. state cage-free mandate implementation timeline & cum. population (mms) (3) CA MA NV* CO OR WA UT AZ MI RI 46 49 55 55 67 67 88 88 89 1H'22 2H'22 1H'23 2H'23 1H'24 2H'24 1H'25 2H'25 1H'26 * Nevada adopting a tiered approach to cage -free mandates, expected to be fully implemented by 1/1/24 CALM portfolio ideally positioned to meet demands Nimble cage-free posture •We are deploying capital toward production and M&A opportunities that enhance our cage-free capacity and capabilities Increasing cage -free focus • Our volume of cage-free egg sales has continued to increase and account for a larger share of our product choice CAL-MAINE FOODS | INVESTOR PRESENTATION | NOVEMBER 2023 15
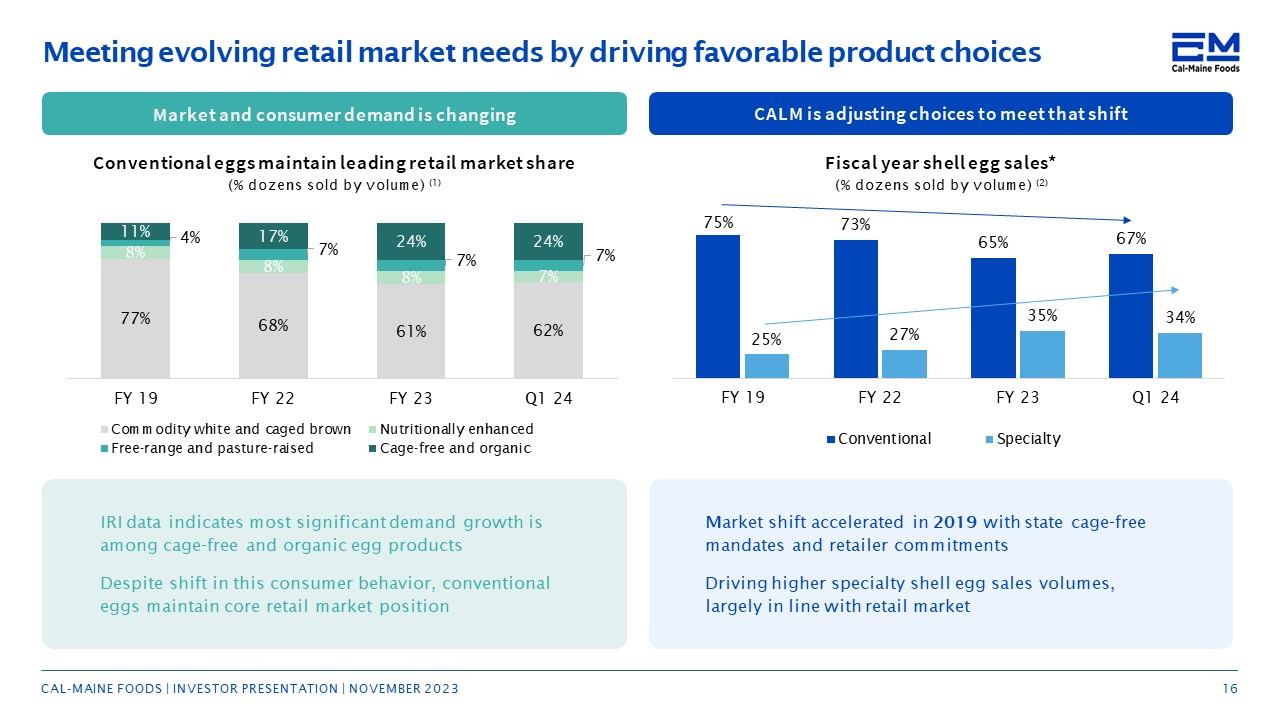
Cal-Maine Foods Meeting evolving retail market needs by driving favorable product choices Market and consumer demand is changing 77% 68% 61% 62% 8% 8% 8% 7% 4% 7% 7% 7% 11% 17% 24% 24% FY 19 FY 22 FY 23 Q1 24 Commodity white and caged brown Nutritionally enhanced Free-range and pasture-raised Cage-free and organic Conventional eggs maintain leading retail market share (% dozens sold by volume) (1) IRI data indicates most significant demand growth is among cage-free and organic egg products Despite shift in this consumer behavior, conventional eggs maintain core retail market position CALM is adjusting choices to meet that shift Fiscal year shell egg sales* (% dozens sold by volume) (2) 75% 73% 65% 67% 25% 27% 35% 34% FY 19 FY 22 FY 23 Q1 24 Conventional Specialty Market shift accelerated in 2019 with state cage-free mandates and retailer commitments Driving higher specialty shell egg sales volumes, largely in line with retail market CAL-MAINE FOODS | INVESTOR PRESENTATION | NOVEMBER 2023 16
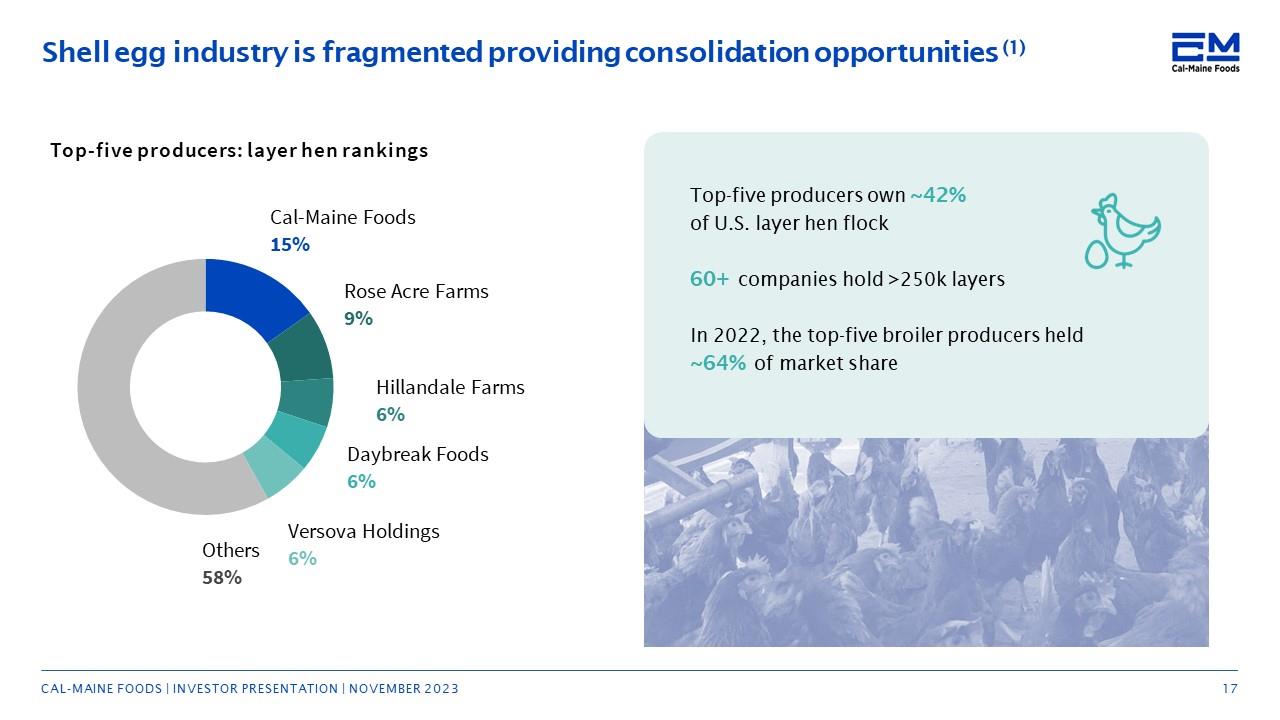
Cal-Maine Foods Shell egg industry is fragmented providing consolidation opportunities (1) Top-five producers: layer hen rankings Cal-Maine Foods15% Rose Acre Farms9% Hillandale Farms6% Daybreak Foods6% Versova Holdings6% Other 58% Top-five producers own ~42% of U.S. layer hen flock 60+ companies hold >250k layers In 2022, the top-five broiler producers held ~64% of market share CAL-MAINE FOODS | INVESTOR PRESENTATION | NOVEMBER 2023 17
Cal-Maine Foods SECTION 3 Executing Consistent Long-Term Strategy CAL-MAINE FOODS | INVESTOR PRESENTATION | NOVEMBER 2023 18
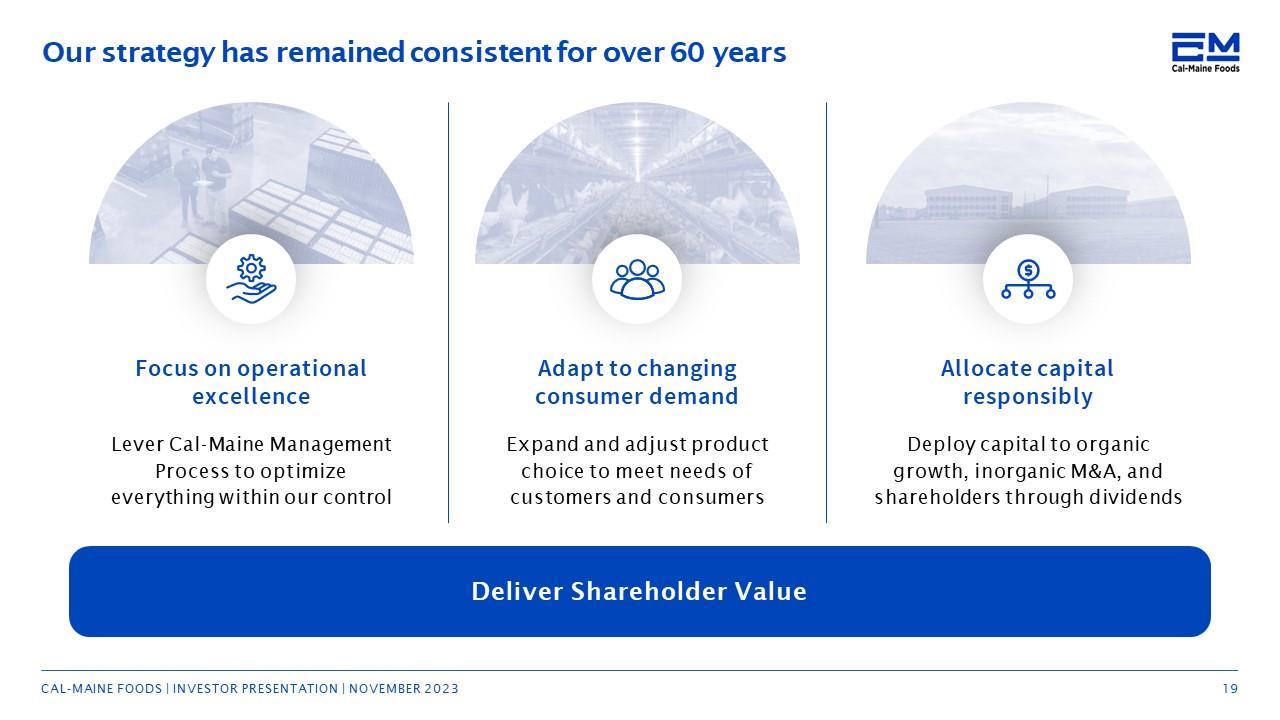
Cal-Maine Foods Our strategy has remained consistent for over 60 years Focus on operational excellence Lever Cal-Maine Management Process to optimize everything within our control Adapt to changing consumer demand Expand and adjust product choice to meet needs of customers and consumers Allocate capital responsibly Deploy capital to organic growth, inorganic M&A, and shareholders through dividends Deliver Shareholder Value CAL-MAINE FOODS | INVESTOR PRESENTATION | NOVEMBER 2023 19
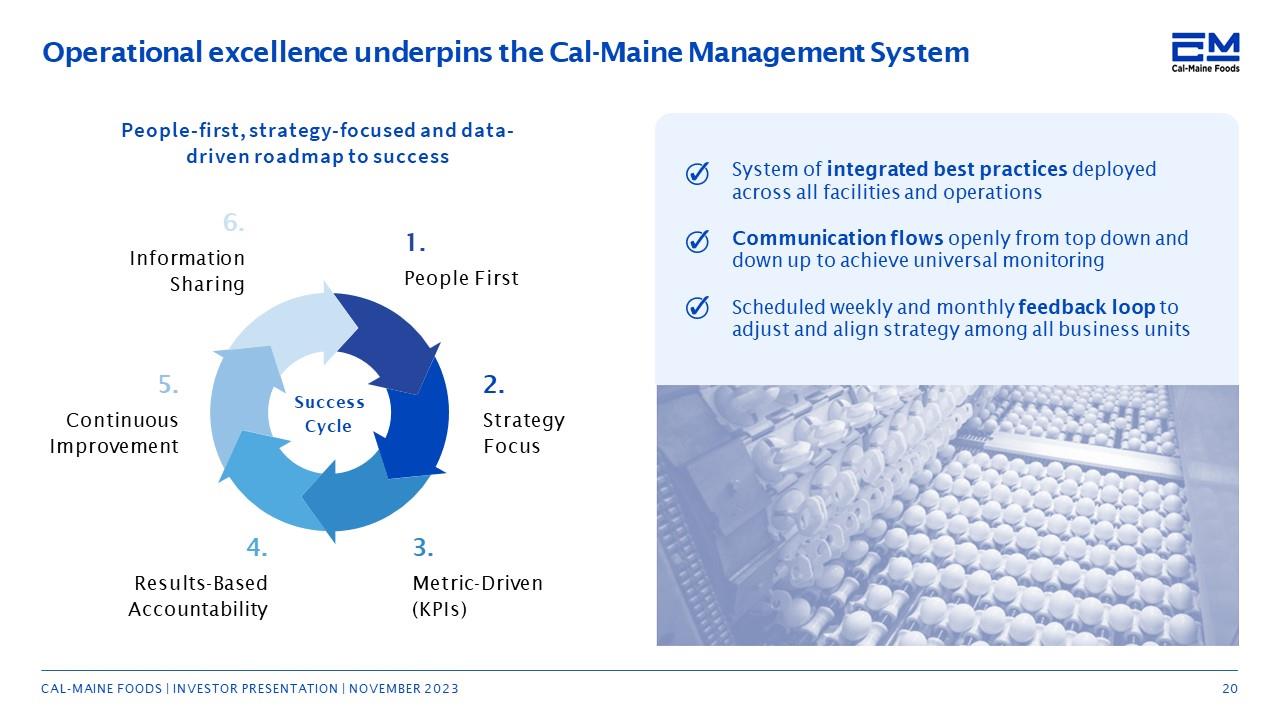
Cal-Maine Foods Operational excellence underpins the Cal-Maine Management System People-first, strategy-focused and datadriven roadmap to success Information Sharing ■ Continuous Improvement Results-Based Accountability 1. People First 2. Strategy Focus 3- Metric-Driven ÏKPIÜ System of integrated best practices deployed across all facilities and operations Communication flows openly from top down and down up to achieve universal monitoring Scheduled weekly and monthly feedback loop to adjust and align strategy among all business units CAL-MAINE FOODS | INVESTOR PRESENTATION | NOVEMBER 2023 20
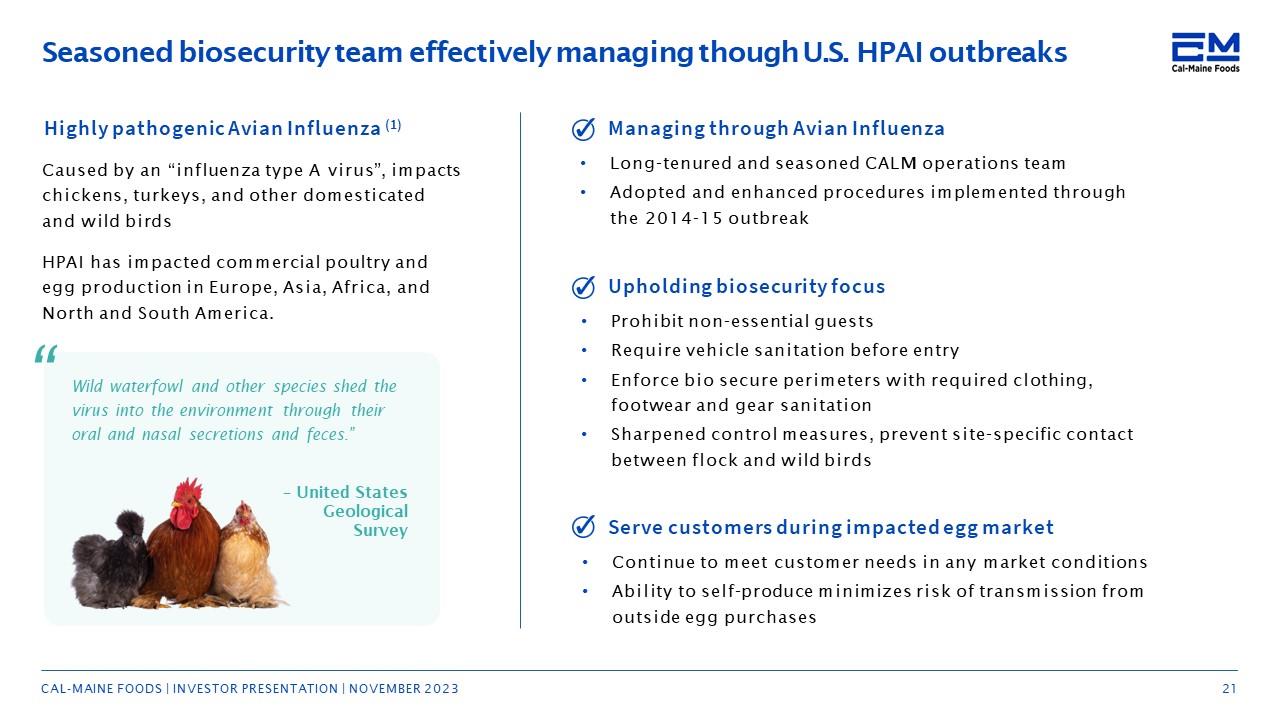
Cal-Maine Foods Seasoned biosecurity team effectively managing though U.S. HPAI outbreaks Highly pathogenic Avian Influenza (1) Caused by an “influenza type A virus”, impacts chickens, turkeys, and other domesticated and wild birds HPAI has impacted commercial poultry and egg production in Europe, Asia, Africa, and North and South America. Wild waterfowl and other species shed the virus into the environment through their oral and nasal secretions and feces.” – United States Geological Survey Managing through Avian Influenza • Long-tenured and seasoned CALM operations team •Adopted and enhanced procedures implemented through the 2014-15 outbreak Upholding biosecurity focus •Prohibit non-essential guests •Require vehicle sanitation before entry •Enforce bio secure perimeters with required clothing, footwear and gear sanitation •Sharpened control measures, prevent site-specific contact between flock and wild birds Serve customers during impacted egg market •Continue to meet customer needs in any market conditions •Ability to self-produce minimizes risk of transmission from outside egg purchases CAL -MAINE FOODS | INVESTOR PRESENTATION | NOVEMBER 2023 21
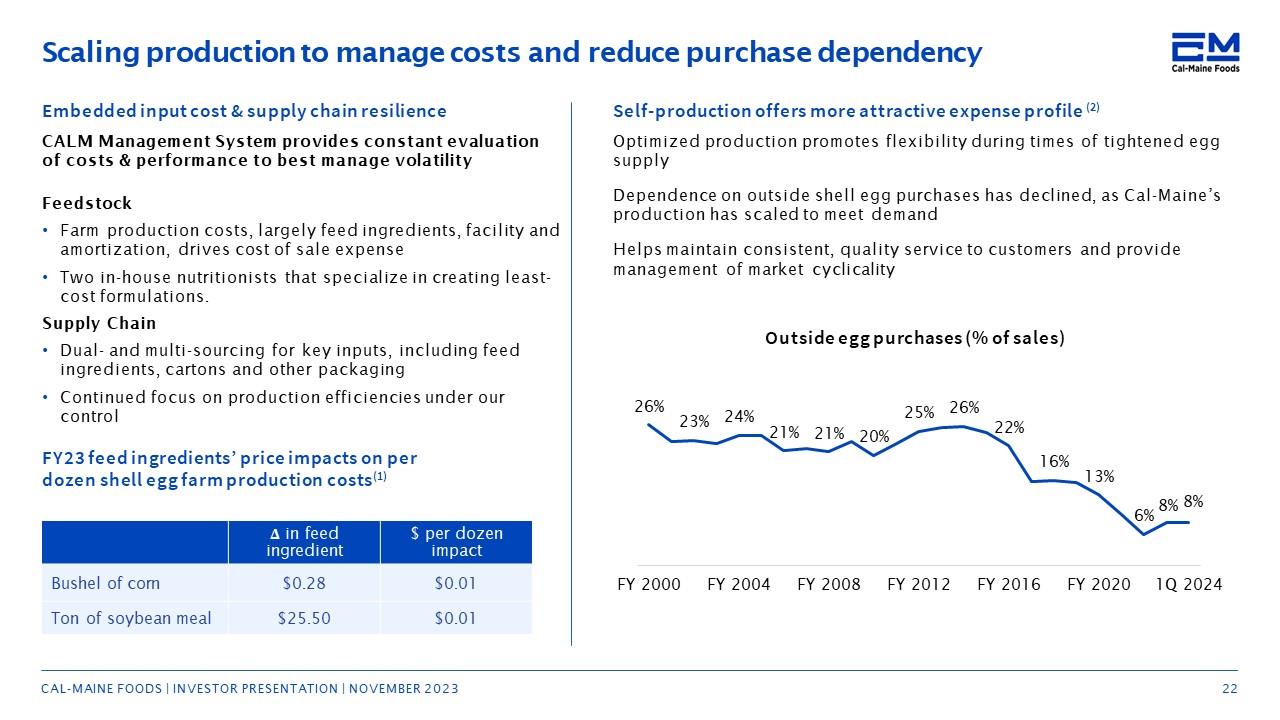
Cal-Maine Foods Scaling production to manage costs and reduce purchase dependency Embedded input cost & supply chain resilience CALM Management System provides constant evaluation of costs & performance to best manage volatility Feedstock •Farm production costs, largely feed ingredients, facility and amortization, drives cost of sale expense •Two in-house nutritionists that specialize in creating least-cost formulations. Supply Chain •Dual - and multi-sourcing for key inputs, including feed ingredients, cartons and other packaging •Continued focus on production efficiencies under our control FY23 feed ingredients’ price impacts on per dozen shell egg farm production costs(1) Bushel of corn Ton of soybean meal A in feed ingredient $ per dozen impact $0.28 $0.01 $25.50 $0.01 Self-production offers more attractive expense profile (2) Optimized production promotes flexibility during times of tightened egg supply Dependence on outside shell egg purchases has declined, as Cal-Maine’s production has scaled to meet demand Helps maintain consistent, quality service to customers and provide management of market cyclicality Outside egg purchases (% of sales) 26% 23% 24% 21% 21% 20% 25% 26% 22% 16% 13% 6% 8% 8% CAL-MAINE FOODS | INVESTOR PRESENTATION | NOVEMBER 2023 22
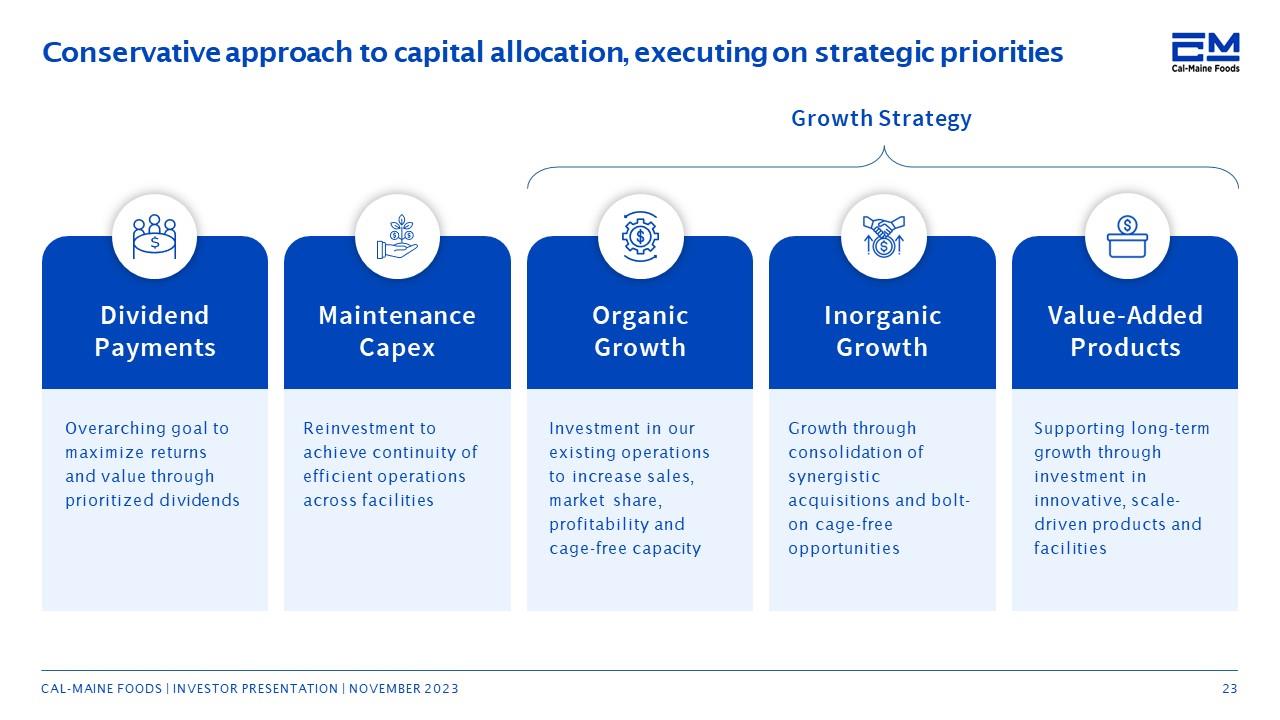
Cal-Maine Foods Conservative approach to capital allocation, executing on strategic priorities Dividend Payments Overarching goal to maximize returns and value through prioritized dividends Maintenance Capex Reinvestment to achieve continuity of efficient operations across facilities Growth Strategy Organic Growth Investment in our existing operations to increase sales, market share, profitability and cage-free capacity Inorganic Growth Growth through consolidation of synergistic acquisitions and bolt-on cage-free opportunities Value -Added Products Supporting long-term growth through investment in innovative, scale-driven products and facilities CAL-MAINE FOODS | INVESTOR PRESENTATION | NOVEMBER 2023 23
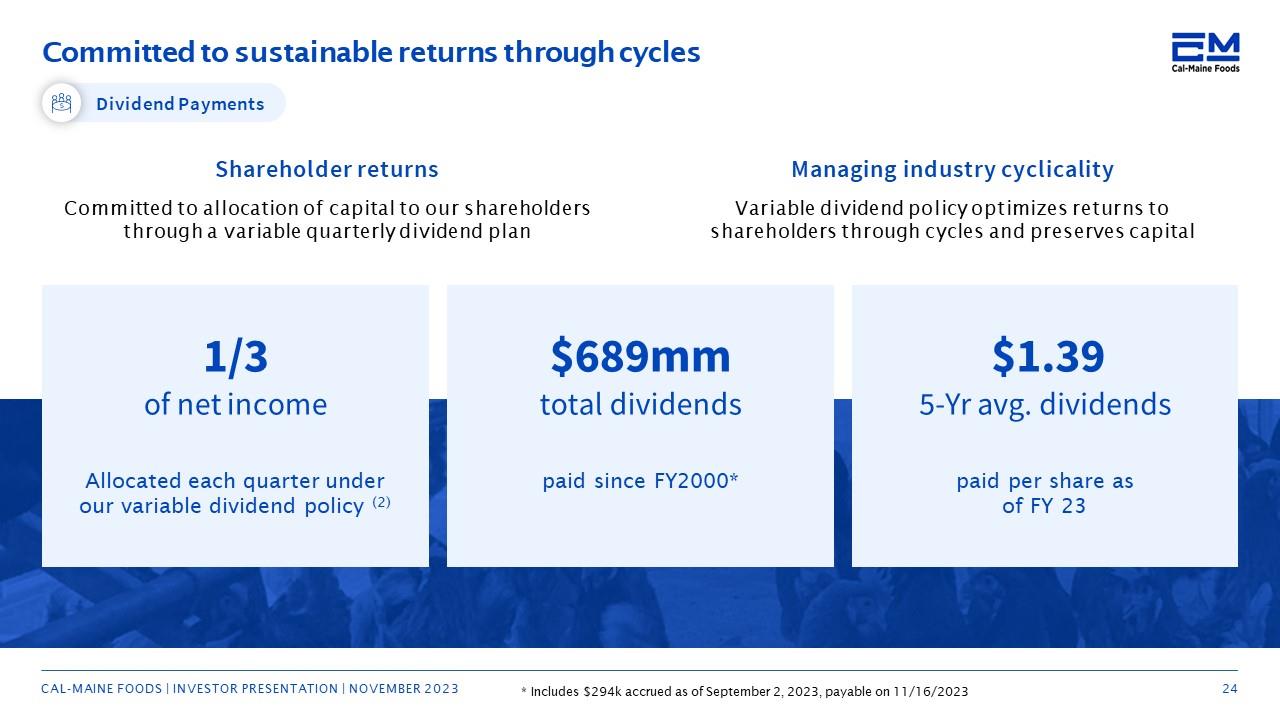
Cal-Maine Foods Committed to sustainable returns through cycles Dividend Payments Shareholder returns Committed to allocation of capital to our shareholders through a variable quarterly dividend plan Managing industry cyclicality Variable dividend policy optimizes returns to shareholders through cycles and preserves capital 1/3 Of net income Allocated each quarter under our variable dividend policy (2) $689mm total dividends paid since FY2000* $1.39 5-Yr avg. dividends paid per share as of FY 23 * Includes $294k accrued as of September 2, 2023, payable on 11/16/2023 CAL-MAINE FOODS | INVESTOR PRESENTATION | NOVEMBER 2023 24
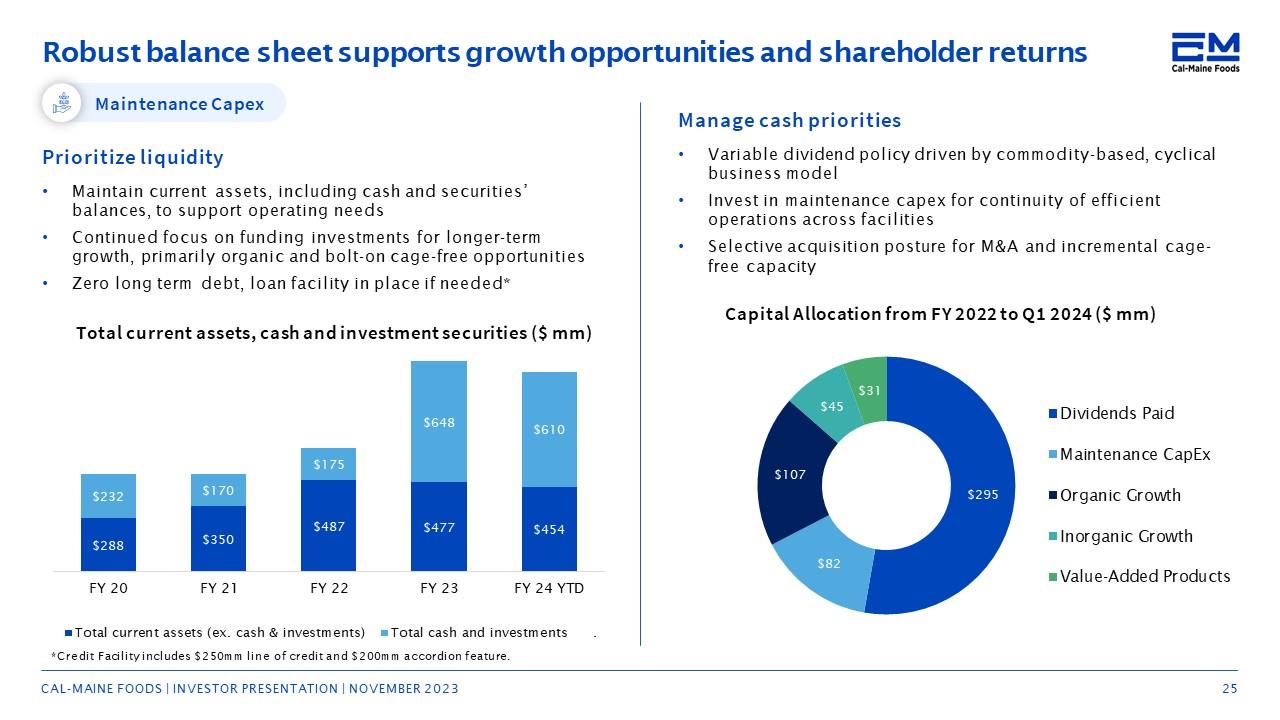
Cal-Maine Foods Robust balance sheet supports growth opportunities and shareholder returns Maintenance Capex Prioritize liquidity •Maintain current assets, including cash and securities’ balances, to support operating needs •Continued focus on funding investments for longer-term growth, primarily organic and bolt-on cage-free opportunities •Zero long term debt, loan facility in place if needed* Total current assets, cash and investment securities ($ mm) Total current assets (ex. cash & investments) Total cash and investments *Credit Facility includes $250mm line of credit and $200mm accordion feature. Manage cash priorities •Variable dividend policy driven by commodity-based, cyclical business model •Invest in maintenance capex for continuity of efficient operations across facilities •Selective acquisition posture for M&A and incremental cage-free capacity Capital Allocation from FY 2022 to Q1 2024 ($ mm) $295 Dividends Paid $82 Maintenance CapeEx $107 Organic Growth $45 Inorganic Growth $31 Value -Added Products CAL-MAINE FOODS | INVESTOR PRESENTATION | NOVEMBER 2023 25
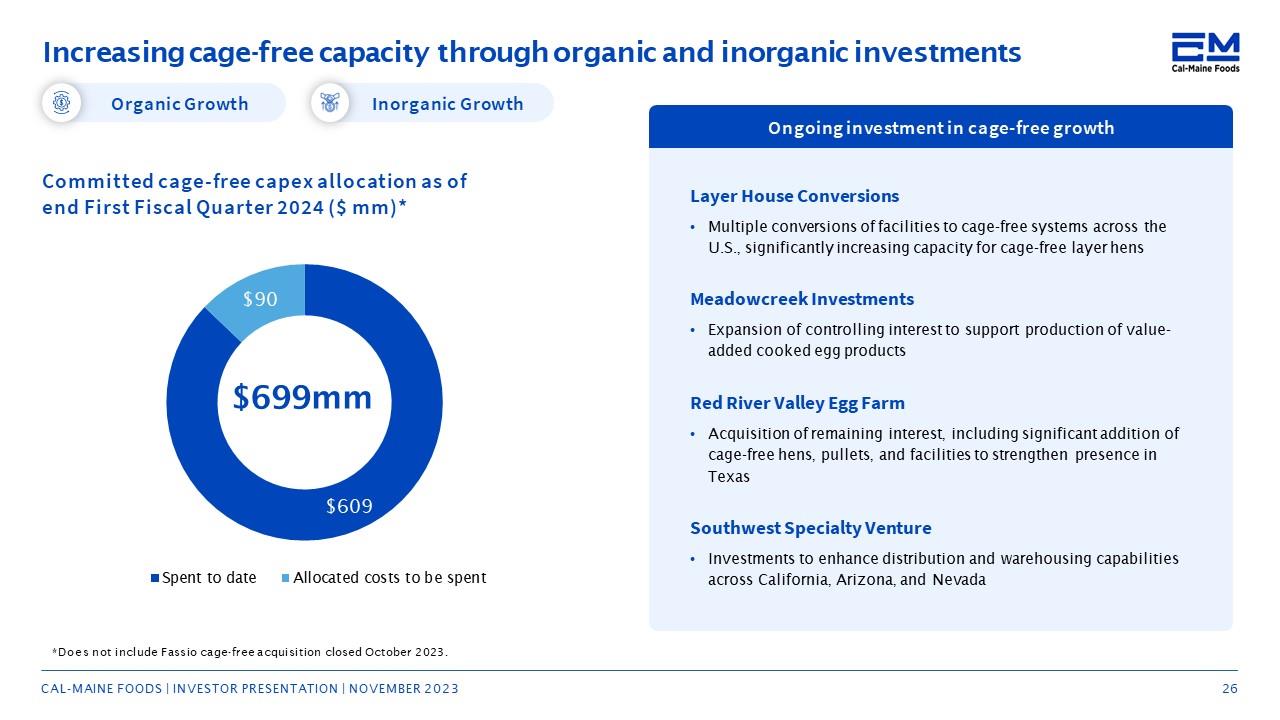
Cal-Maine Foods Increasing cage-free capacity through organic and inorganic investments Organic Growth Inorganic Growth Committed cage-free capex allocation as of end First Fiscal Quarter 2024 ($ mm)* $90 $609 $699 mm Spent to date Allocated costs to be spent Ongoing investment in cage-free growth Layer House Conversions •Multiple conversions of facilities to cage-free systems across the U.S., significantly increasing capacity for cage-free layer hens Meadowcreek Investments •Expansion of controlling interest to support production of value-added cooked egg products Red River Valley Egg Farm •Acquisition of remaining interest, including significant addition of cage-free hens, pullets, and facilities to strengthen presence in Texas Southwest Specialty Venture •Investments to enhance distribution and warehousing capabilities across California, Ariz ona, and Nevada *Does not include Fassio cage-free acquisition closed October 2023. CAL-MAINE FOODS | INVESTOR PRESENTATION | NOVEMBER 2023 26
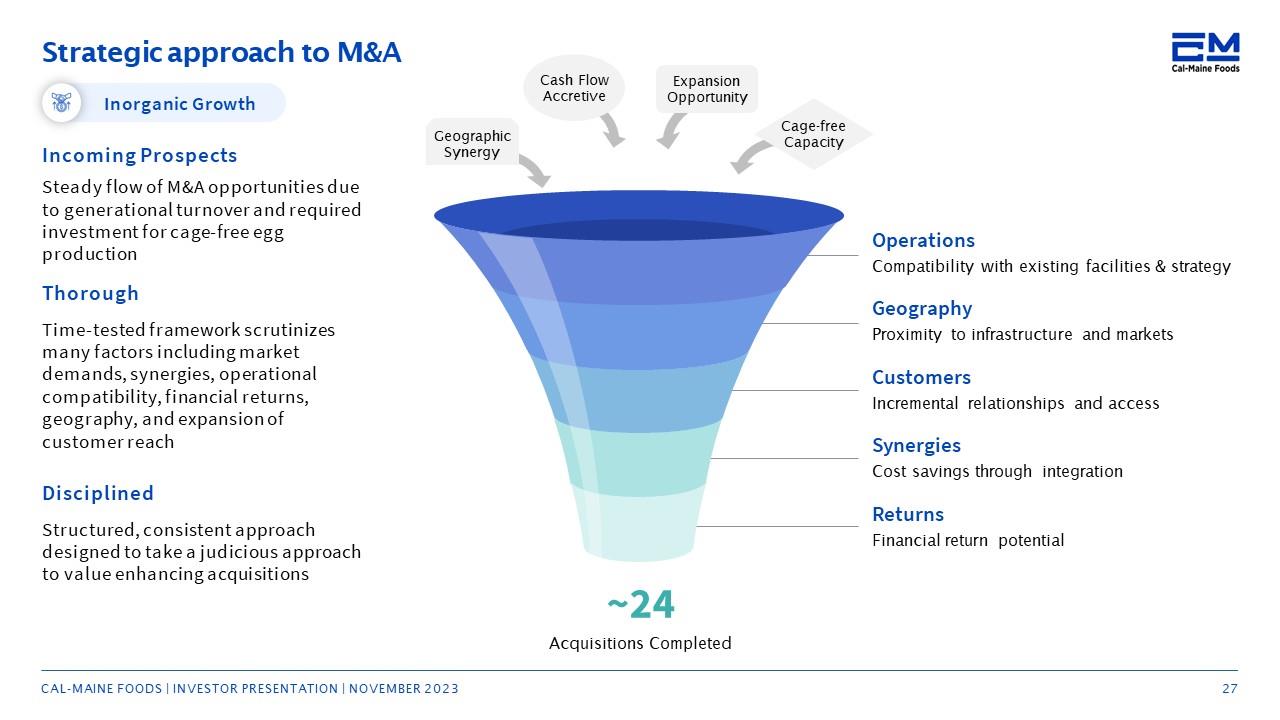
Cal-Maine Foods Strategic approach to M&A Inorganic Growth Incoming Prospects Steady flow of M&A opportunities due to generational turnover and required investment for cage-free egg production Thorough Time-tested framework scrutinizes many factors including market demands, synergies, operational compatibility, financial returns, geography, and expansion of customer reach Disciplined Structured, consistent approach designed to take a judicious approach to value enhancing acquisitions Geographic Synergy Cash Flow Accretive Expansion Opportunity Cage-free Capacity ~24 Acquisitions Completed Operations Compatibility with existing facilities & strategy Geography Proximity to infrastructure and markets Customers Incremental relationships and access Synergies Cost savings through integration Returns Financial return potential CAL-MAINE FOODS | INVESTOR PRESENTATION | NOVEMBER 2023 27
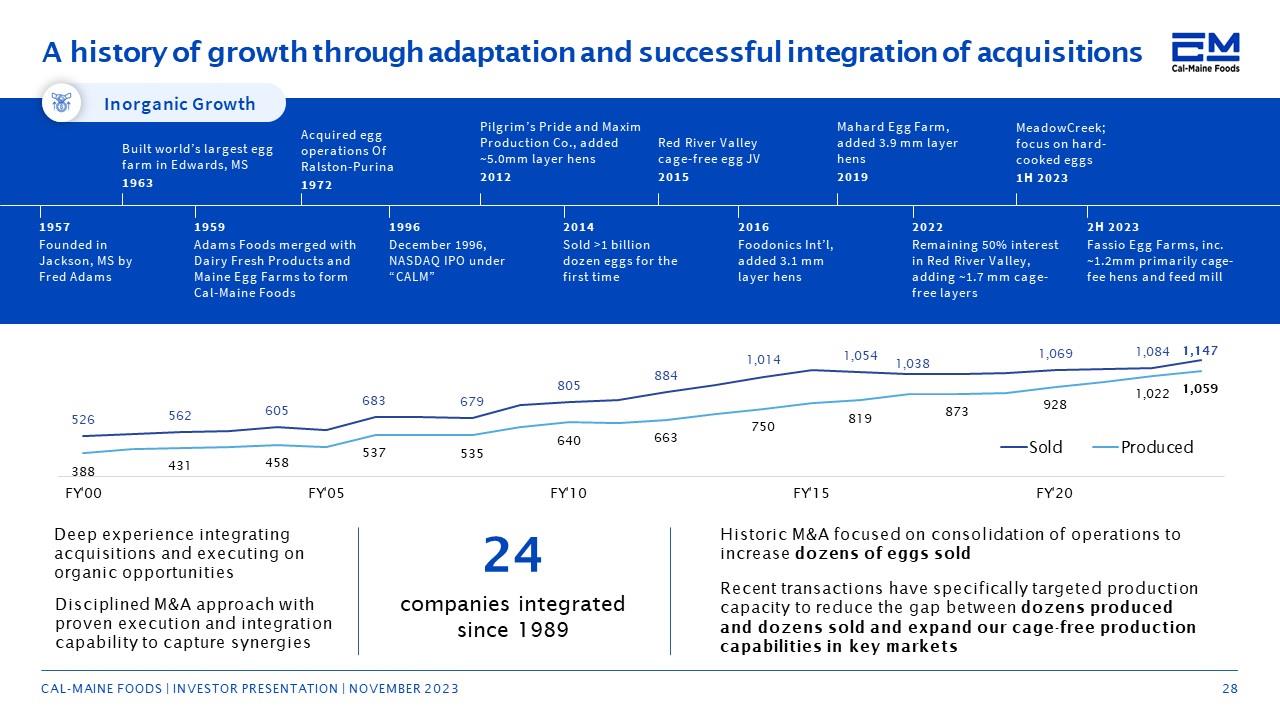
Cal-Maine Foods A history of growth through adaptation and successful integration of acquisitions Inorganic Growth Built world’s largest egg farm in Edwards, MS 1963 Acquired egg operations Of Ralston‐Purina 1972 Pilgrim’s Pride and Maxim Production Co., added ~5.0mm layer hens 2012 Red River Valley cage-free egg JV 2015 Mahard Egg Farm, added 3.9 mm layer hens 2019 MeadowCreek; focus on hard-cooked eggs 1H 2023 1957 Founded in Jackson, MS by Fred Adams 1959 Adams Foods merged with Dairy Fresh Products and Maine Egg Farms to form Cal‐Maine Foods 1996 December 1996, NASDAQ IPO under “CALM” 2014 Sold >1 billion dozen eggs for the first time 2016 Foodonics Int’l, added 3.1 mm layer hens 2022 Remaining 50% interest in Red River Valley, adding ~1.7 mm cage-free layers 2H 2023 Fassio Egg Farms, inc. ~1.2mm primarily cage-fee hens and feed mill 526 562 605 683 679 805 884 1,014 1,054 1,038 1,069 1,084 1,147 388 431 458 537 535 640 663 750 819 873 928 1,022 1,059 Sold Produced FY'00 FY'05 FY'10 FY'15 FY'20 Deep experience integrating acquisitions and executing on organic opportunities Disciplined M&A approach with proven execution and integration capability to capture synergies 24 companies integrated since 1989 Historic M&A focused on consolidation of operations to increase dozens of eggs sold Recent transactions have specifically targeted production capacity to reduce the gap between dozens produced and dozens sold and expand our cage-free production capabilities in key markets CAL-MAINE FOODS | INVESTOR PRESENTATION | NOVEMBER 2023 28
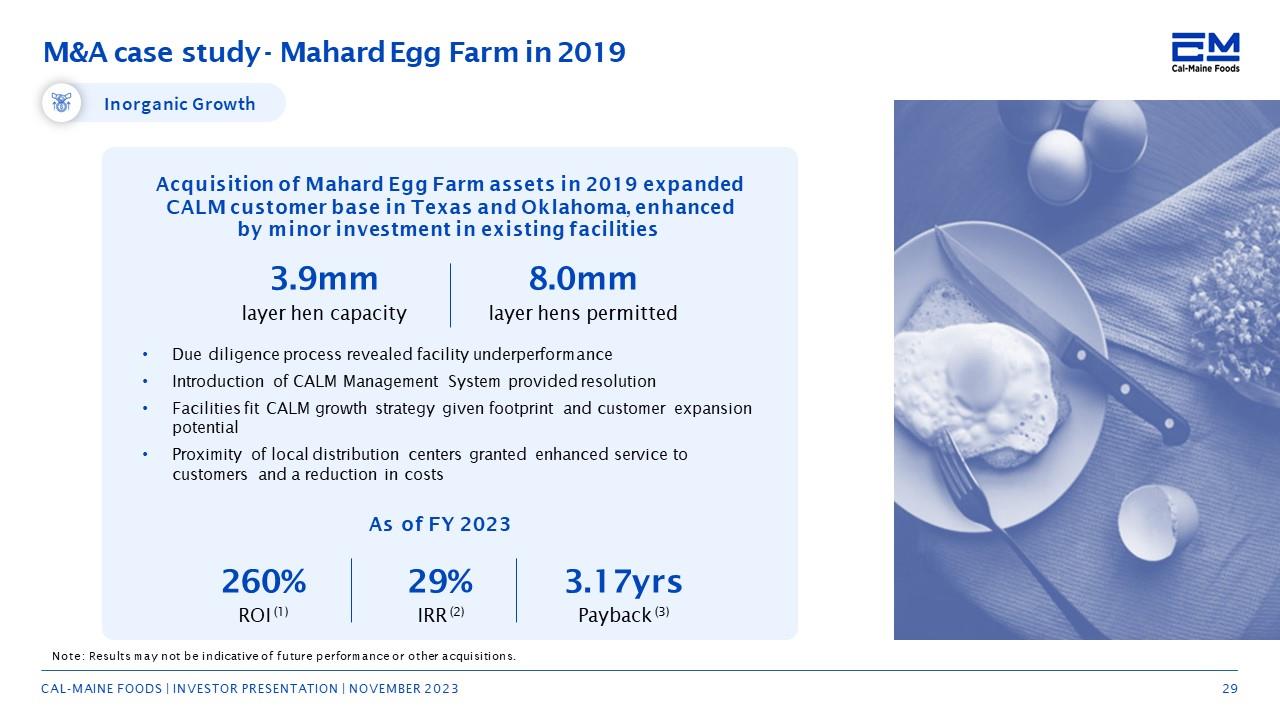
Cal-Maine Foods M&A case study - Mahard Egg Farm in 2019 Inorganic Growth Acquisition of Mahard Egg Farm assets in 2019 expanded CALM customer base in Texas and Oklahoma, enhanced by minor investment in existing facilities 3.9mm layer hen capacity 8.0mm layer hens permitted Due diligence process revealed facility underperformance •Introduction of CALM Management System provided resolution •Facilities fit CALM growth strategy given footprint and customer expansion potential •Proximity of local distribution centers granted enhanced service to customers and a reduction in costs As of FY 2023 260% ROI (1) 29% IRR (2) 3.17yrs Payback (3) Note: Results may not be indicative of performance or other acquisitions. CAL-MAINE FOODS | INVESTOR PRESENTATION | NOVEMBER 2023 29
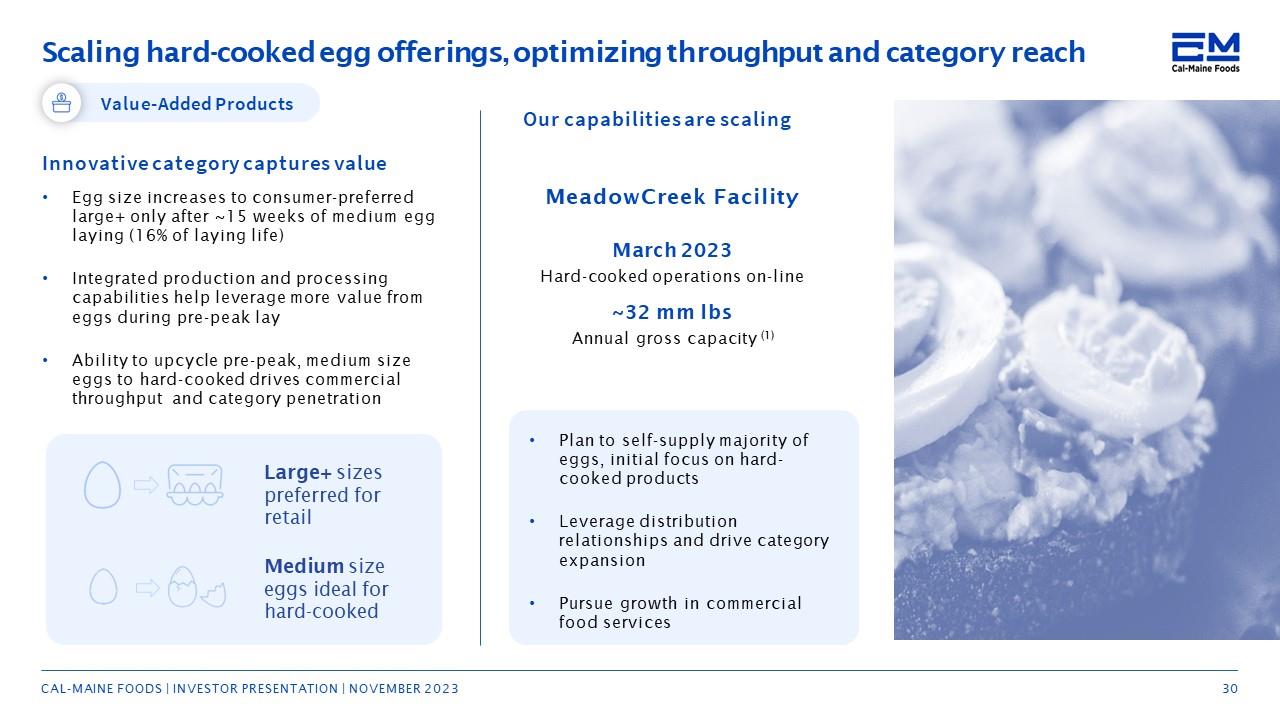
Cal-Maine Foods Scaling hard-cooked egg offerings, optimizing throughput and category reach Value-Added Products Innovative category captures value Egg size increases to consumer-preferred large+ only after ~15 weeks of medium egg laying (16% of laying life) •Integrated production and processing capabilities help leverage more value from eggs during pre-peak lay •Ability to upcycle pre-peak, medium size eggs to hard-cooked drives commercial throughput and category penetration Large+ sizes preferred for retail Medium size eggs ideal for hard-cooked Our capabilities are scaling MeadowCreek Facility March 2023 Hard-cooked operations on-line ~32 mm lbs Annual gross capacity (1) Plan to self-supply majority of eggs, initial focus on hard-cooked products •Leverage distribution relationships and drive category expansion •Pursue growth in commercial food services CAL-MAINE FOODS | INVESTOR PRESENTATION | NOVEMBER 2023 30
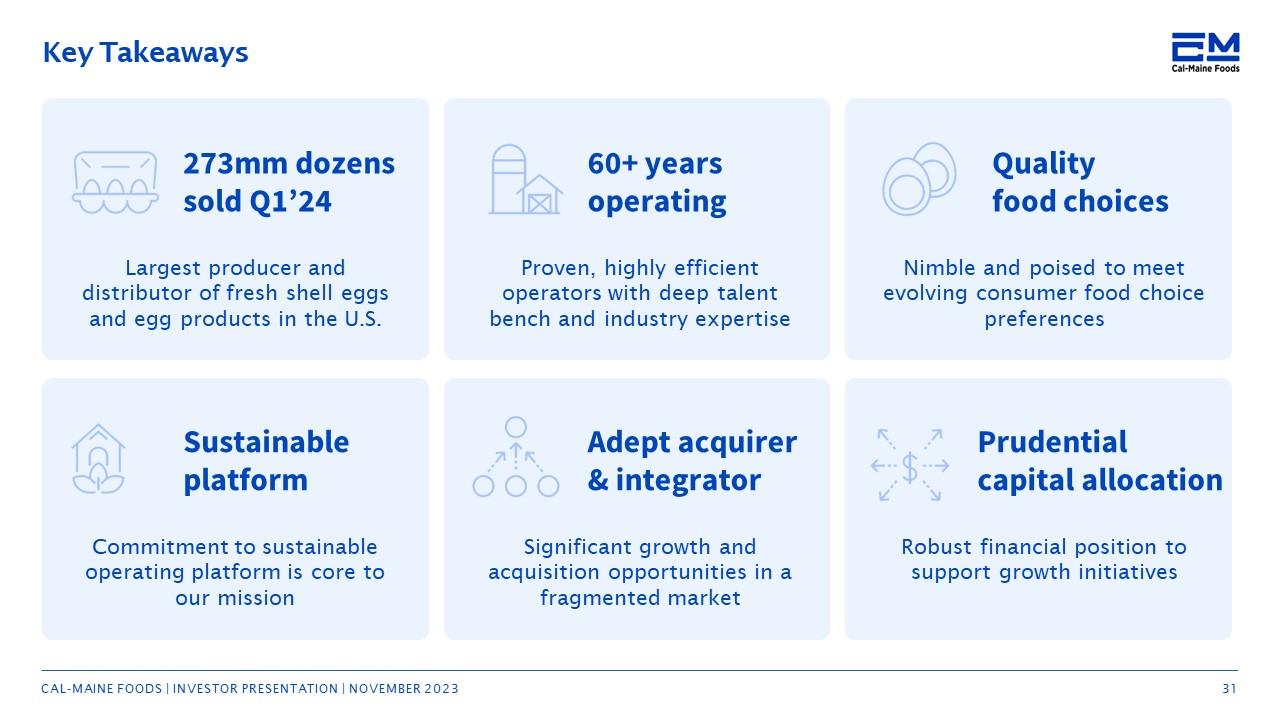
Cal-Maine Foods Key Takeaways 273mm dozens sold Q1’24 Largest producer and distributor of fresh shell eggs and egg products in the U.S. 60+ years operating Proven, highly efficient operators with deep talent bench and industry expertise Quality food choices Nimble and poised to meet evolving consumer food choice preferences Sustainable platform Commitment to sustainable operating platform is core to our mission Adept acquirer & integrator Significant growth and acquisition opportunities in a fragmented market Prudential capital allocation Robust financial position to support growth initiatives CAL-MAINE FOODS | INVESTOR PRESENTATION | NOVEMBER 2023 31
Cal-Maine Foods SECTION 4 Appendix CAL-MAINE FOODS | INVESTOR PRESENTATION | NOVEMBER 2023 32
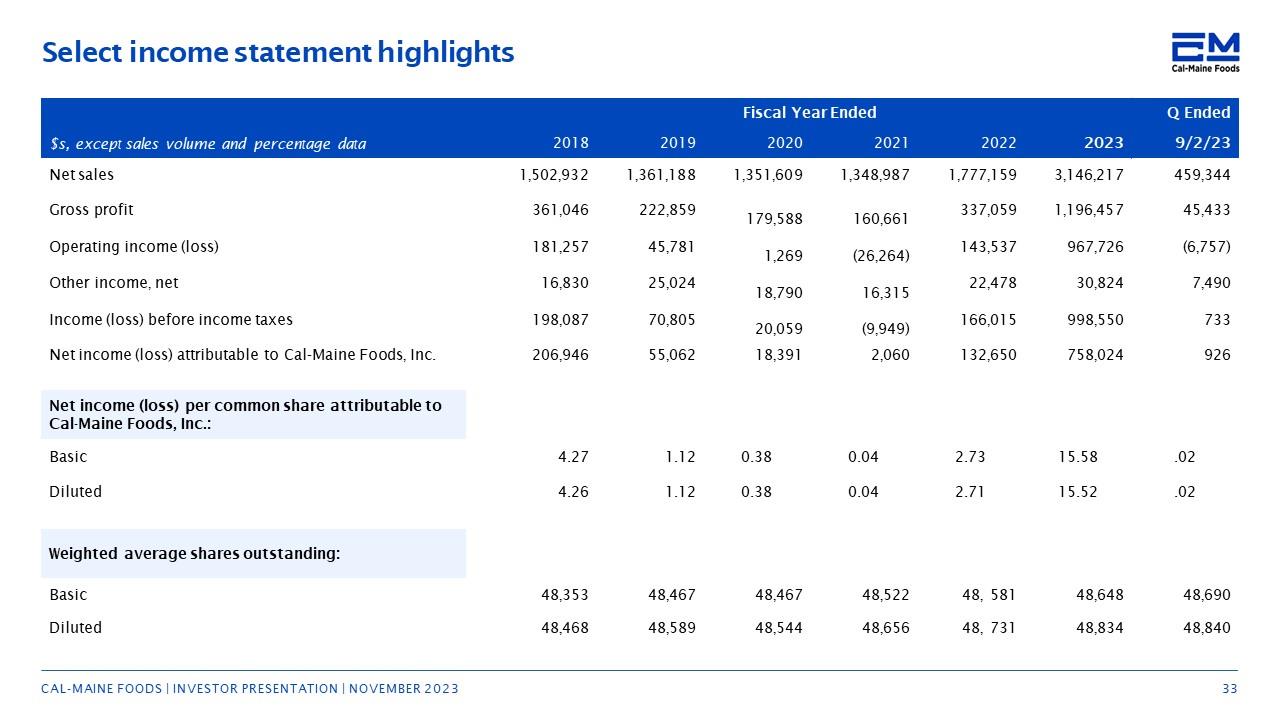
Cal-Maine Foods Select income statement highlights Fiscal Year Ended Q Ended $s, except sales volume and percentage data 2018 2019 2020 2021 2022 2023 9/2/23 Net sales 1,502,932 1,361,188 1,351,609 1,348,987 1,777,159 3,146,217 459,344 Gross profit 361,046 222,859 179,588 160,661 337,059 1,196,457 45,433 Operating income (loss) 181,257 45,781 1,269 (26,264) 143,537 967,726 (6,757) Other income, net 16,830 25,024 18,790 16,315 22,478 30,824 7,490 Income (loss) before income taxes 198,087 70,805 20,059 (9,949) 166,015 998,5 50 733 Net income (loss) attributable to Cal-Maine Foods, Inc. 206,946 55,062 18,391 2,060 132,650 758,024 926 Net income (loss) per common share attributable to Cal-Maine Foods, Inc.: Basic 4.27 1.12 0.38 0.04 2.73 15.58 .02 Diluted 4.26 1.12 0.38 0.04 2. 71 15.52 .02 Weighted average shares outstanding: Basic 48,353 48,467 48,467 48,522 48, 581 48,648 48,690 Diluted 48,468 48,589 48,544 48,656 48, 731 48,834 48,840 CAL-MAINE FOODS | INVESTOR PRESENTATION | NOVEMBER 2023 33
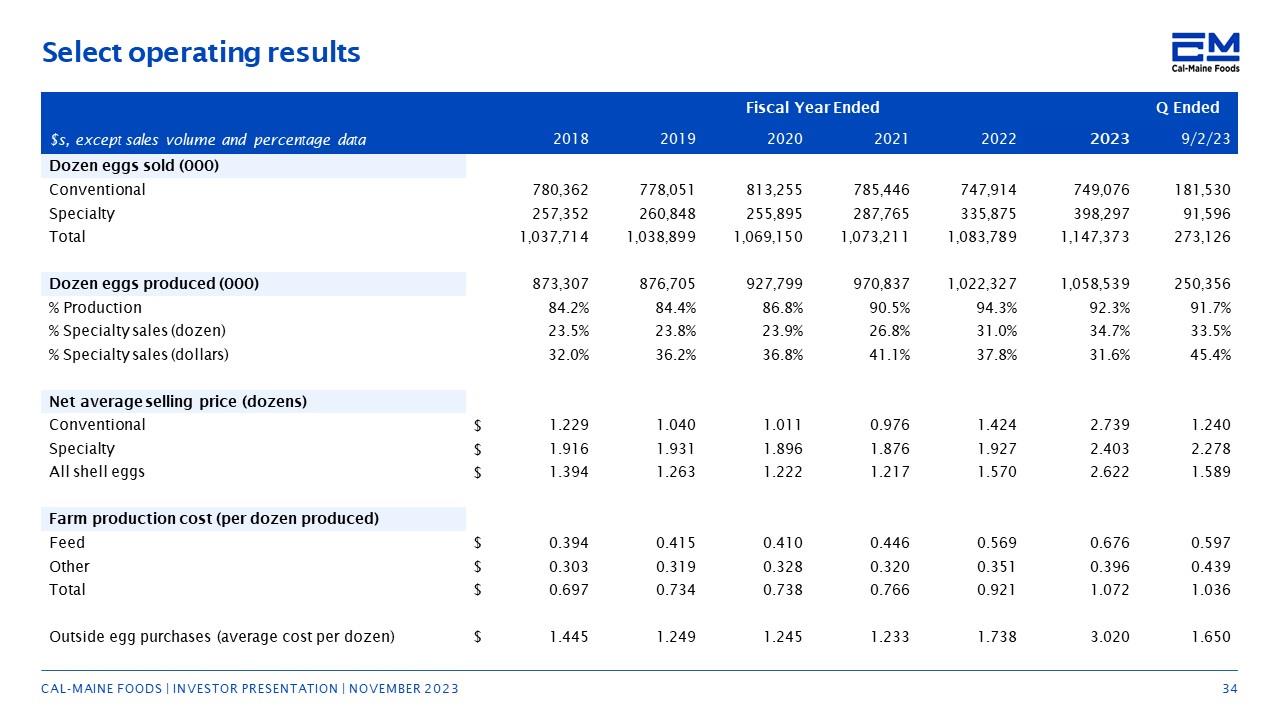
Cal-Maine Foods Select operating results Fiscal Year Ended Q Ended $s, except sales volume and percentage data 2018 2019 2020 2021 2022 2023 9/2/23 Dozen eggs sold (000) Conventional 780,362 778,051 813,255 785,446 747,914 749,076 181,530 Specialty 257,352 260,848 255,895 287,765 335,875 398,297 91,596 Total 1,037,714 1,038,899 1,069,150 1,073,211 1,083,789 1,147,373 273,126 Dozen eggs produced (000) 873,307 876,705 927,799 970,837 1,022,327 1,058,539 250,356 % Production 84.2% 84.4% 86.8% 90.5% 94.3% 92.3% 91.7% % Specialty sales (dozen) 23.5% 23.8% 23.9% 26.8% 31.0% 34.7% 33.5% % Specialty sales (dollars) 32.0% 36.2% 36.8% 41.1% 37.8% 31.6% 45.4% Net average selling price (dozens) Conventional $ 1.229 1.040 1.011 0.976 1.424 2.739 1.240 Specialty $ 1.916 1.931 1.896 1.876 1.927 2.403 2.278 All shell eggs $ 1.394 1.263 1.222 1.217 1.570 2.622 1.589 Farm production cost (per dozen produced) Feed $ 0.394 0.415 0.410 0.446 0.569 0.676 0.597 Other $ 0.303 0.319 0.328 0.320 0.351 0.396 0.439 Total $ 0.697 0.734 0.738 0.766 0.921 1.072 1.036 Outside egg purchases (average cost per dozen) $ 1.445 1.249 1.245 1.233 1.738 3.020 1.650 CAL-MAINE FOODS | INVESTOR PRESENTATION | NOVEMBER 2023 34
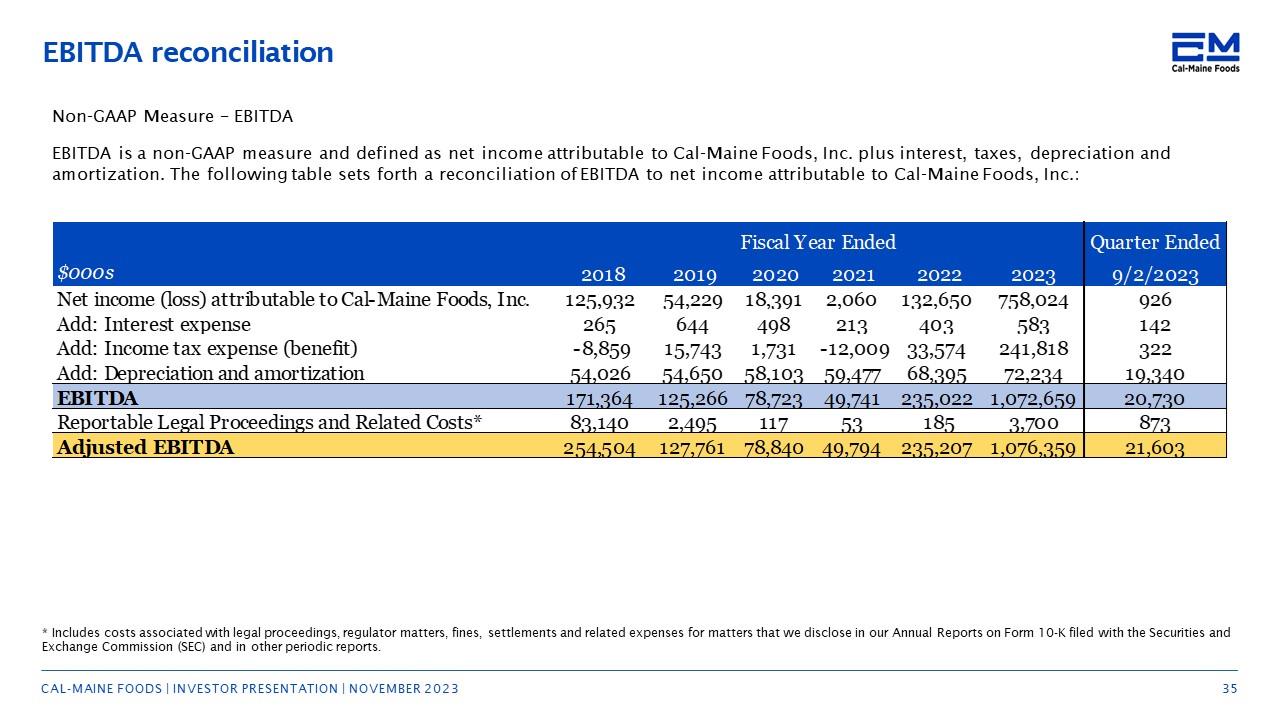
Cal-Maine Foods EBITDA reconciliation 35 Non-GAAP Measure – EBITDA EBITDA is a non-GAAP measure and defined as net income attributable to Cal-Maine Foods, Inc. plus interest, taxes, depreciation and amortization. The following table sets forth a reconciliation of EBITDA to net income attributable to Cal-Maine Foods, Inc.: Quarter Ended$000s2018201920202021202220239/2/2023Net income (loss) attributable to Cal-Maine Foods, Inc.125,932 54,229 18,391 2,060 132,650 758,024926Add: Interest expense265 644 498 213 403 583142Add: Income tax expense (benefit)-8,85915,743 1,731 -12,00933,574 241,818322Add: Depreciation and amortization54,026 54,650 58,103 59,477 68,395 72,23419,340EBITDA 171,364 125,266 78,723 49,741 235,022 1,072,659 20,730Reportable Legal Proceedings and Related Costs*83,140 2,495 117 53 185 3,700873 Adjusted EBITDA254,504 127,761 78,840 49,794 235,207 1,076,359 21,603Fiscal * Includes costs associated with legal proceedings, regulator matters, fines, settlements and related expenses for matters that we disclose in our Annual Reports on Form 10-K filed with the Securities and Exchange Commission (SEC) and in other periodic reports. CAL-MAINE FOODS | INVESTOR PRESENTATION | NOVEMBER 2023 35
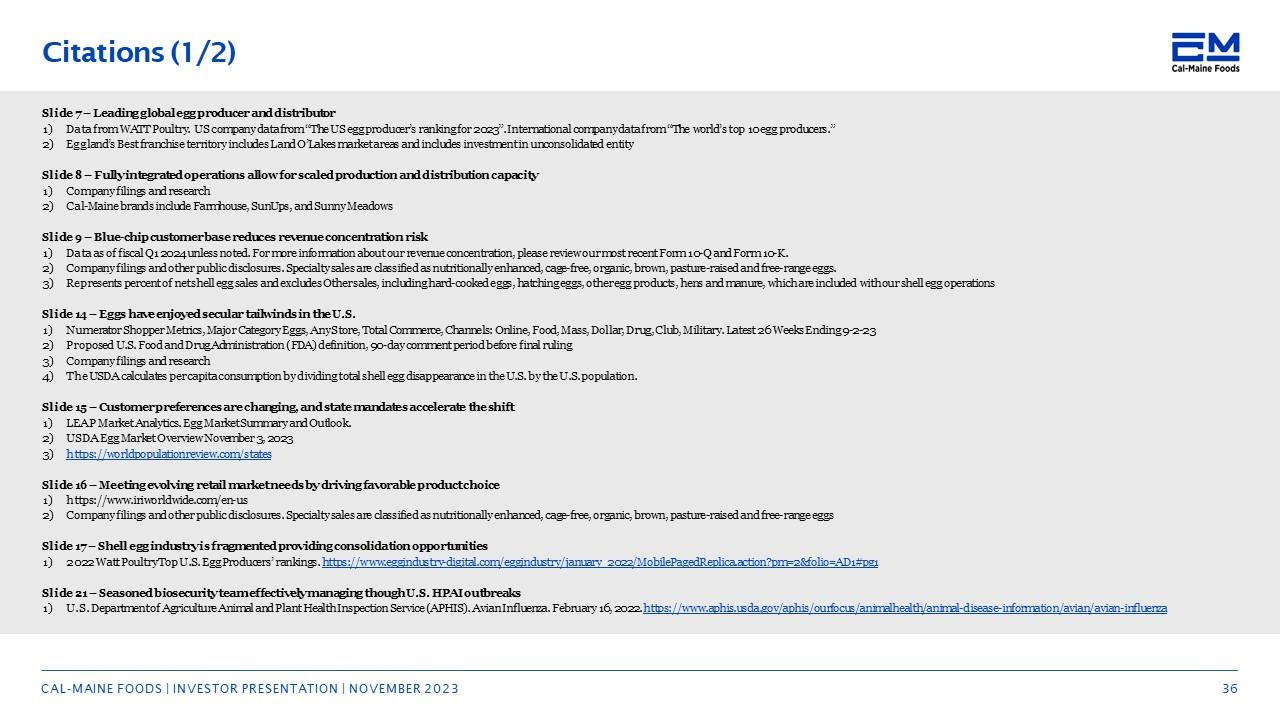
Cal-Maine Foods Citations (1/2) Slide 7 – Leading global egg producer and distributor 1) Data from WATT Poultry. US company data from “The US egg producer’s ranking for 2023”. International company data from “The world’s top 10 egg producers.” 2) Eggland’s Best franchise territory includes Land O’Lakes market areas and includes investment in unconsolidated entity Slide 8 – Fully integrated operations allow for scaled production and distribution capacity 1) Company filings and research 2) Cal-Maine brands include Farmhouse, SunUps, and Sunny Meadows Slide 9 – Blue-chip customer base reduces revenue concentration risk 1) Data as of fiscal Q1 2024 unless noted. For more information about our revenue concentration, please review our most recent Form 10-Q and Form 10-K. 2) Company filings and other public disclosures. Specialty sales are classified as nutritionally enhanced, cage-free, organic, brown, pasture-raised and free-range eggs. 3) Represents percent of net shell egg sales and excludes Other sales, including hard-cooked eggs, hatching eggs, other egg products, hens and manure, which are included with our shell egg operations Slide 14 – Eggs have enjoyed secular tailwinds in the U.S. 1) Numerator Shopper Metrics, Major Category Eggs, Any Store, Total Commerce, Channels: Online, Food, Mass, Dollar, Drug, Club, Military. Latest 26 Weeks Ending 9-2-23 2) Proposed U.S. Food and Drug Administration (FDA) definition, 90-day comment period before final ruling 3) Company filings and research 4) The USDA calculates per capita consumption by dividing total shell egg disappearance in the U.S. by the U.S. population. Slide 15 – Customer preferences are changing, and state mandat es accelerate the shift 1) LEAP Market Analytics. Egg Market Summary and Outlook. 2) USDA Egg Market Overview November 3, 2023 3) https://worldpopulationreview.com/states Slide 16
– Meeting evolving retail market needs by driving favorable product choice 1) https://www.iriworldwide.com/en-us 2) Company filings and other public disclosures. Specialty sales are classified as nutritionally enhanced, cage-free, organic, brown, pasture-raised and free-range eggs Slide 17 – Shell egg industry is fragmented providing consolidation opportunities 1) 2022 Watt Poultry Top U.S. Egg Producers’ rankings. https://www.eggindustry-digital.com/eggindustry/january_2022/MobilePagedReplica.action?pm=2&folio=AD1#pg1 Slide 21 – Seasoned biosecurity team effectively managing though U.S. HPAI outbreaks 1) U.S. Department of Agriculture Animal and Plant Health Inspection Service (APHIS). Avian Influenza. February 16, 2022. https://www.aphis.usda.gov/aphis/ourfocus/animalhealth/animal -disease-information/avian/avian-influenza CAL-MAINE FOODS | INVESTOR PRESENTATION | NOVEMBER 2023 36
Cal-Maine Foods Citations (2/2) Slide 22 – Scaling production to manage costs and reduce purchase dependency 1) Company data for fiscal year 2023 2) Company filings Slide 24 – Committed to sustainable returns through cycle 1) Company filings 2) Dividends Payable: We accrue dividends at the end of each quarter according to the Company’s dividend policy adopted by its Board of Directors. The Company pays a dividend to shareholders of its Common Stock and Class A Common Stock on a quarterly basis for each quarter for which the Company reports net income attributable to Cal-Maine Foods, Inc. computed in accordance with GAAP in an amount equal to one-third (1/3) of such quarterly income. Dividends are paid to shareholders of record as of the 60th day following the last day of such quarter, except for the fourth fiscal quarter. For the fourth quarter, the Company pays dividends to shareholders of record on the 65th day after the quarter end. Dividends are payable on the 15th day following the record date. Following a quarter for which the Company does not report net income attributable to Cal-Maine Foods, Inc., the Company will not pay a dividend for a subsequent profitable quarter until the Company is profitable on a cumulative basis computed from the date of the most recent quarter for which a dividend was paid. The dividend policy is subject to periodic review by the Board of Directors. Slide 29 – M&A case study - Mahard Egg Farm in 2019 1) ROI is determined by dividing cumulative net cash flows from acquisition through FY 2023 by the total investment, encompassing the initial purchase price and subsequent investments. Cash flows are based on actual sales volumes and customer prices at Mahard locations, deducting production costs, SG&A and delivery expenses. Tax savings from depreciation are factored in, but synergies from the acquisition are not included in the cash
flow calculation. 2) IRR is computed by discounting estimated cash flows from acquisition to FY 2023. Cash flows include initial and subsequent investments, actual volumes sold, and customer prices from Mahard locations, minus production costs and SG&A expenses. Tax savings from depreciation are considered, but synergies from the acquisition are excluded from the cash flow calculation. 3) Payback Period calculated using cumulative, non-discounted cash flows. Slide 30 – Scaling hard-cooked egg offerings, optimizing throughput and category reach 1) As of Q1 2024, facility has the capacity to produce approximately 615 thousand pounds of weekly hard-cooked egg products. CAL-MAINE FOODS | INVESTOR PRESENTATION | NOVEMBER 2023 37
Cal-Maine Foods November 2023 © Cal-Maine Foods. All rights reserved.