Operator
Welcome, and thank you for standing by. All participants will be on a listen-only mode until the question-and-answer session of today's call. At that time to ask a question, please press star 1. Today's conference is being recorded. I would now like to turn the conference over to Kristen Silverberg. Thank you. You may begin.
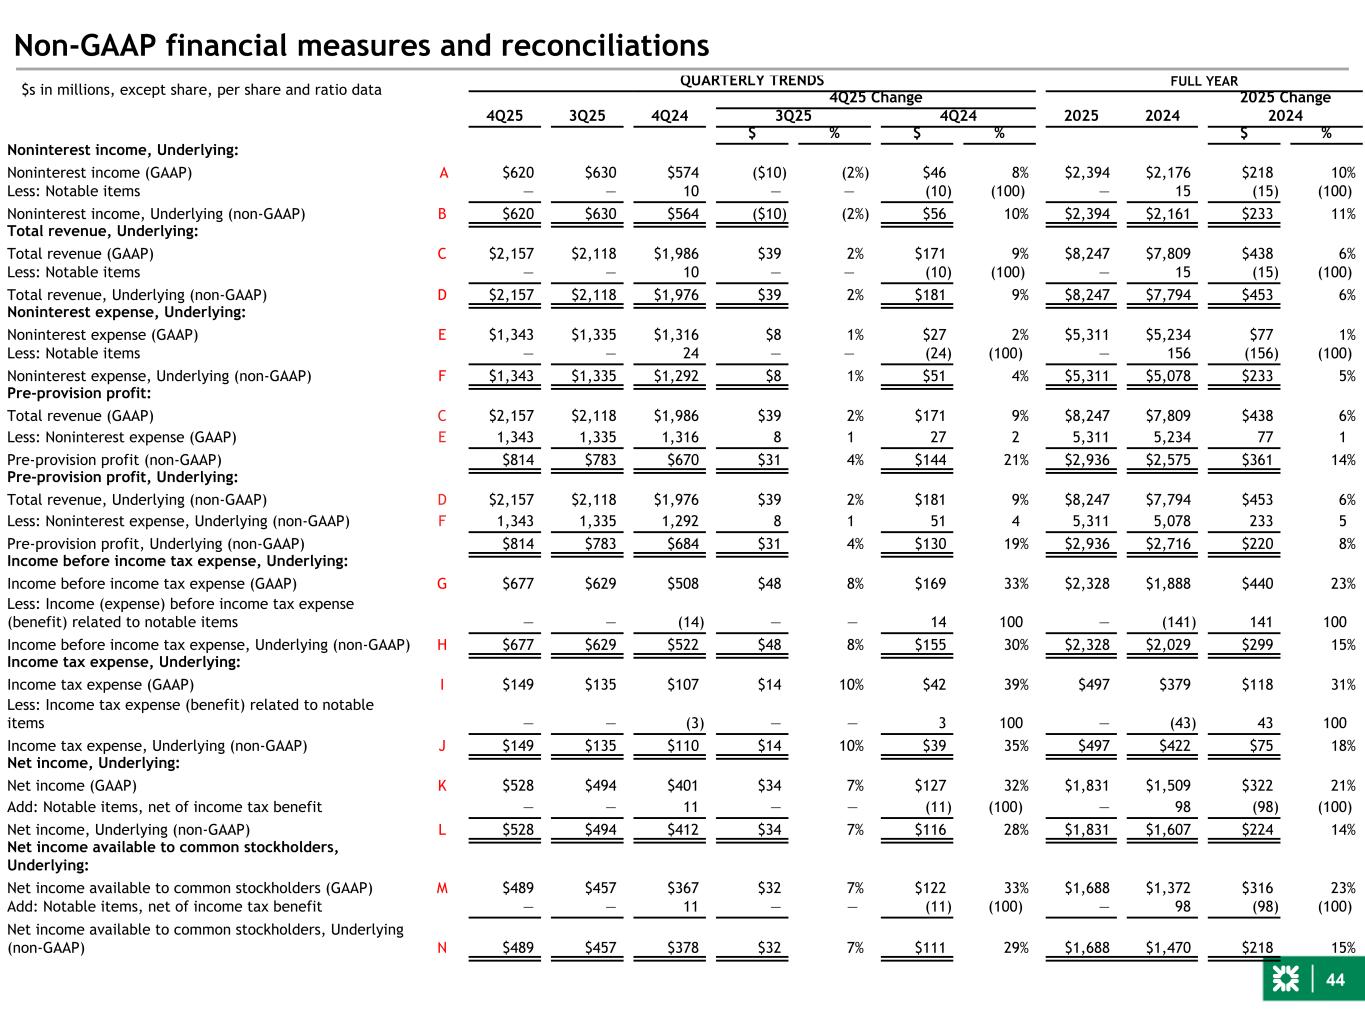
Thanks, Julie. Good morning, everyone, and thank you for joining us. First this morning, our Chairman and CEO, Bruce Van Saan, and CFO, Annoi Banerjee, will provide an overview of our fourth quarter and full year results. Brendan Coughlin, our President, and Don McCree, our Chair of Commercial Banking, are also here to provide additional colour. We will be referencing our fourth quarter and full year presentation located on our investor relations website after the presentation we will be happy to take questions our comments today will include forward-looking statements which are subject to risks and uncertainties that may cause our results to differ materially from expectations these are outlined for your review in the presentation we also reference non-GAAP financial measures so it's important to review our GAAP results in the presentation and the reconciliations in the appendix. And with that, I will hand it over to Bruce.
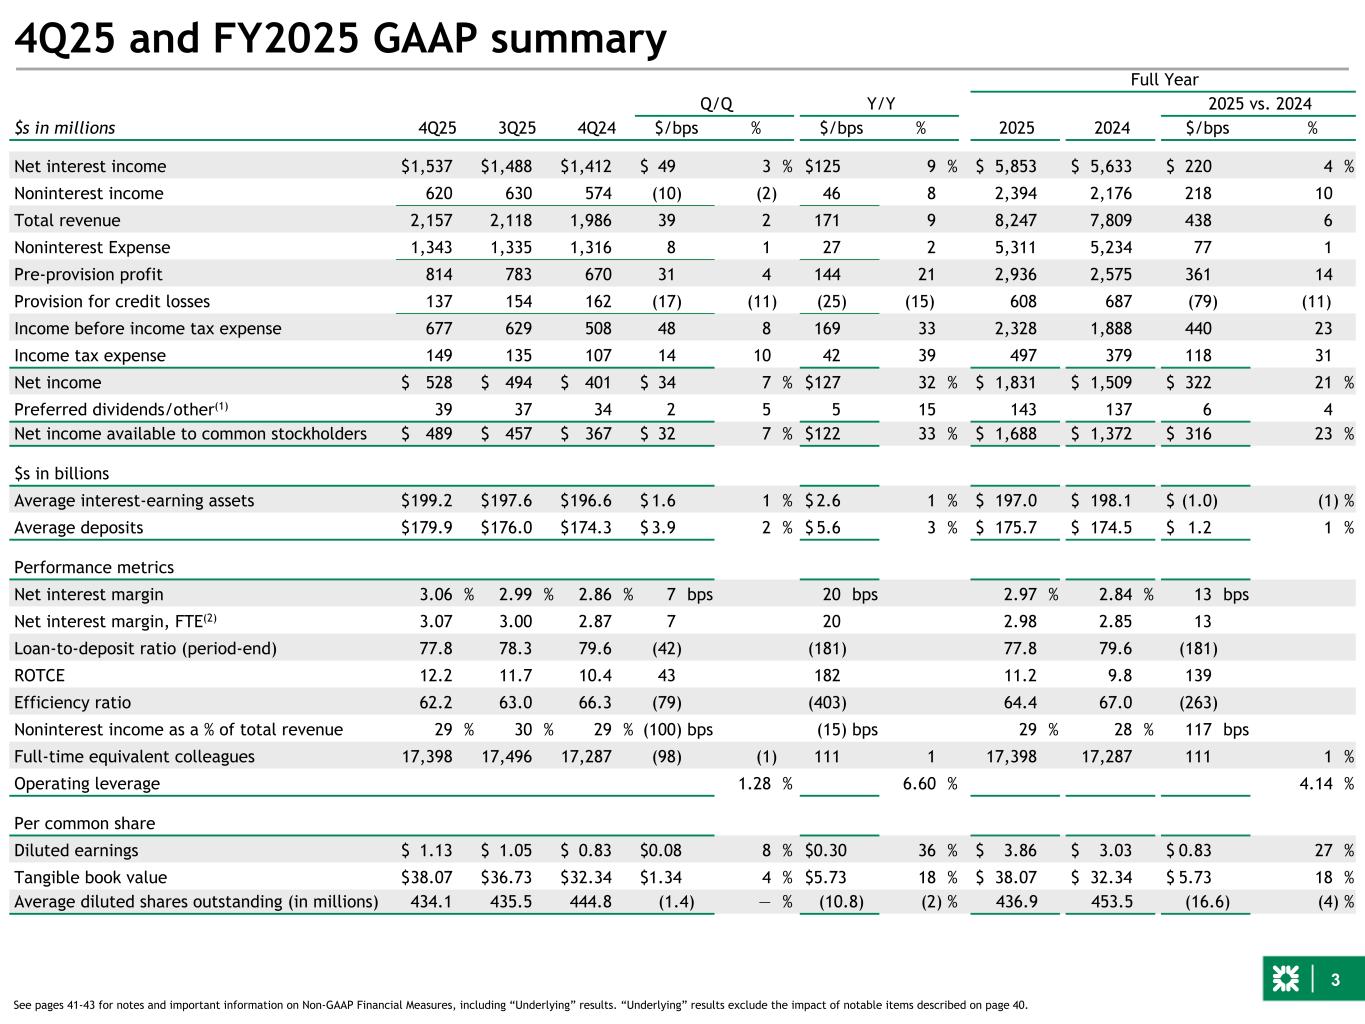
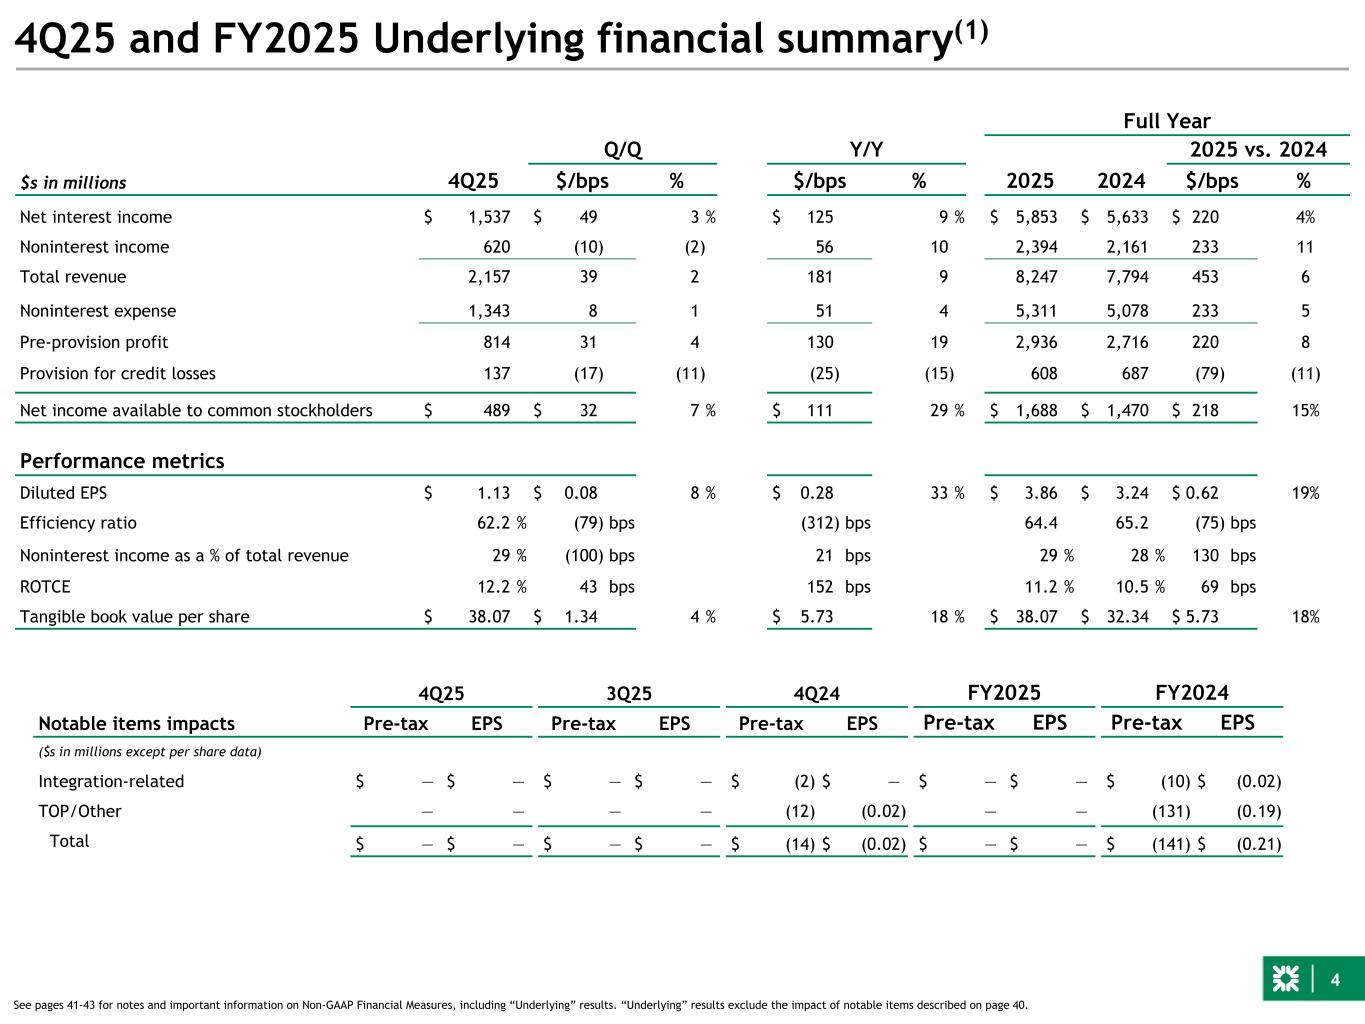
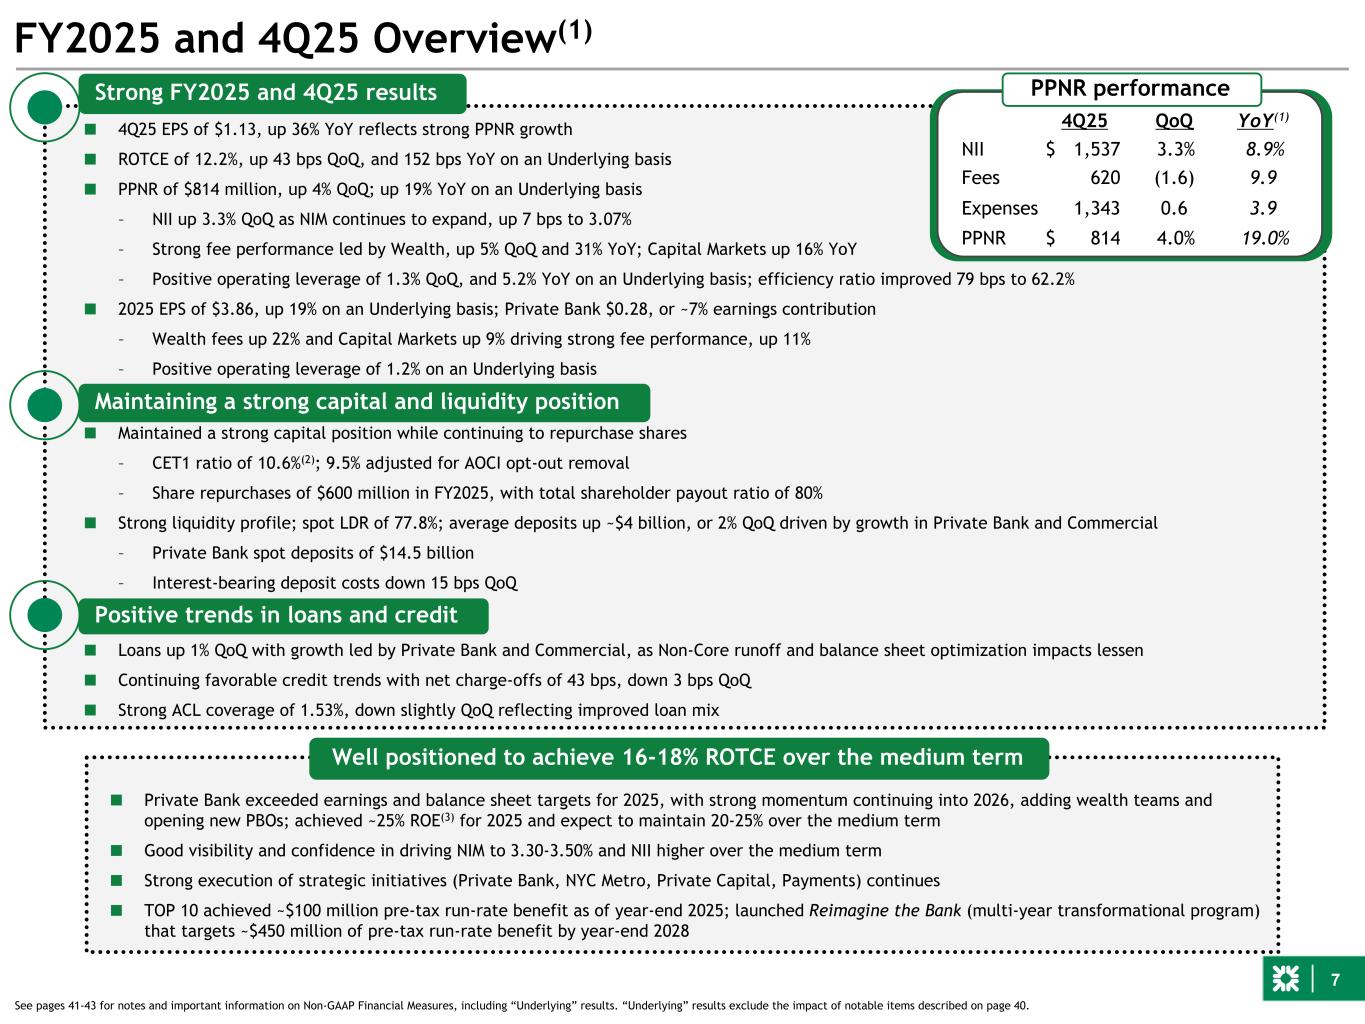
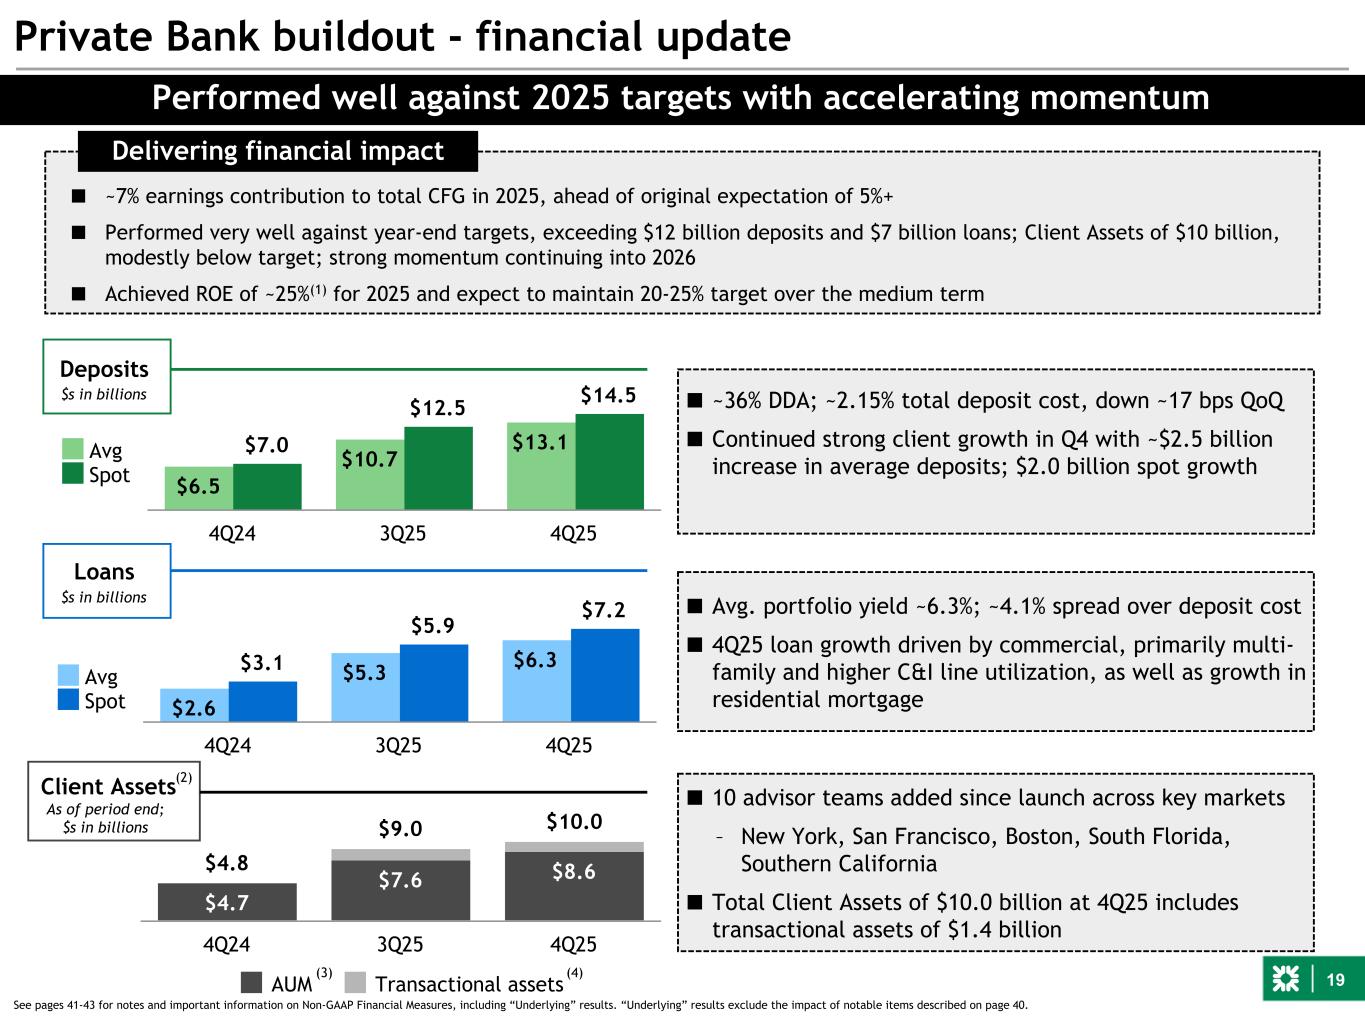
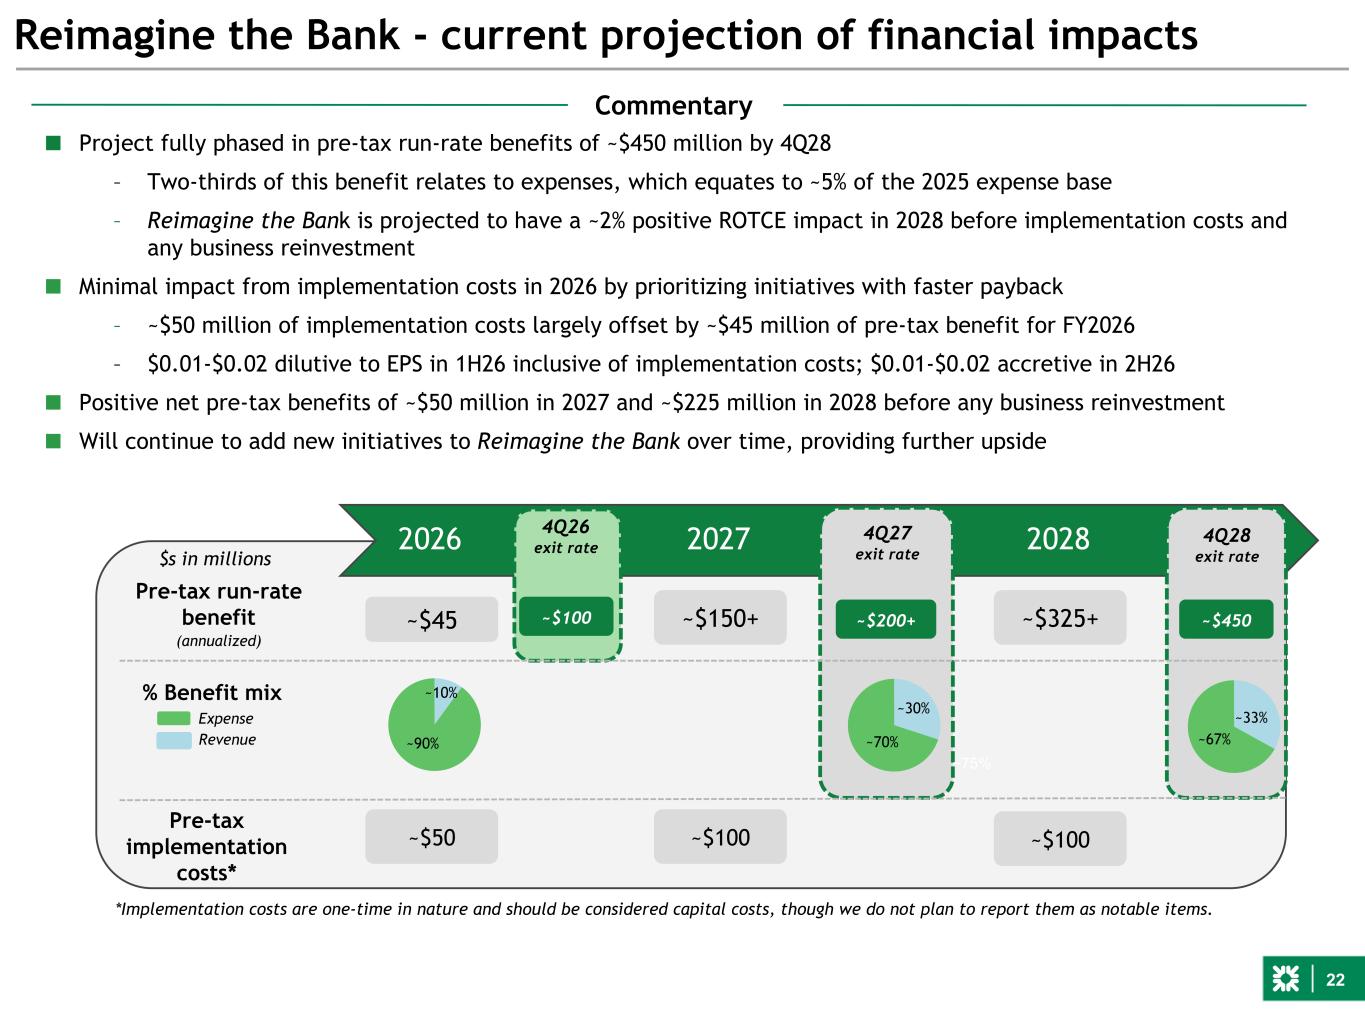
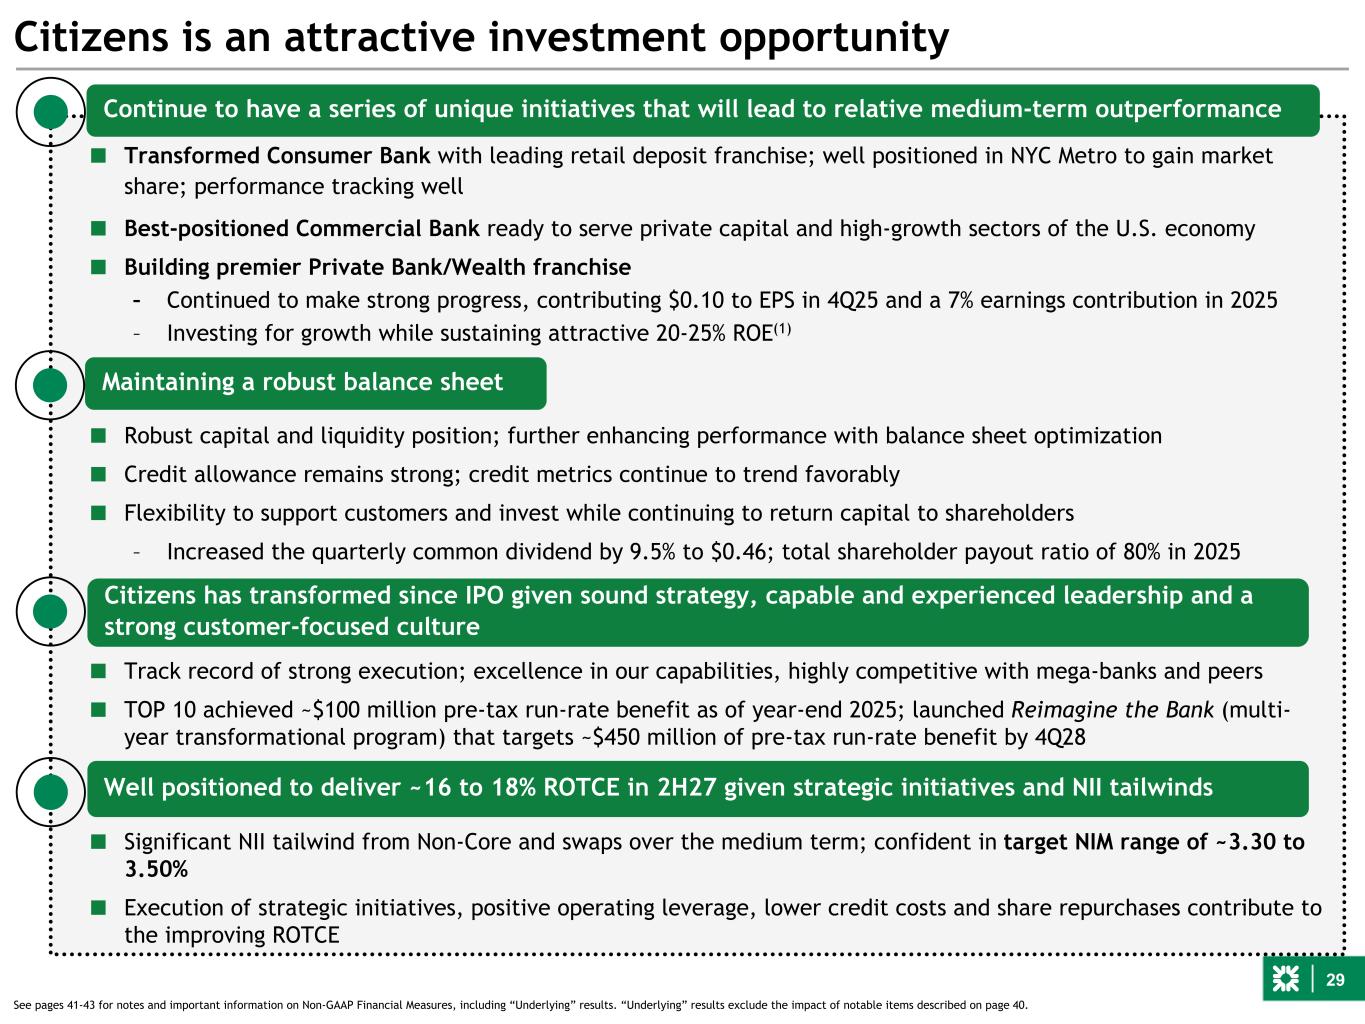
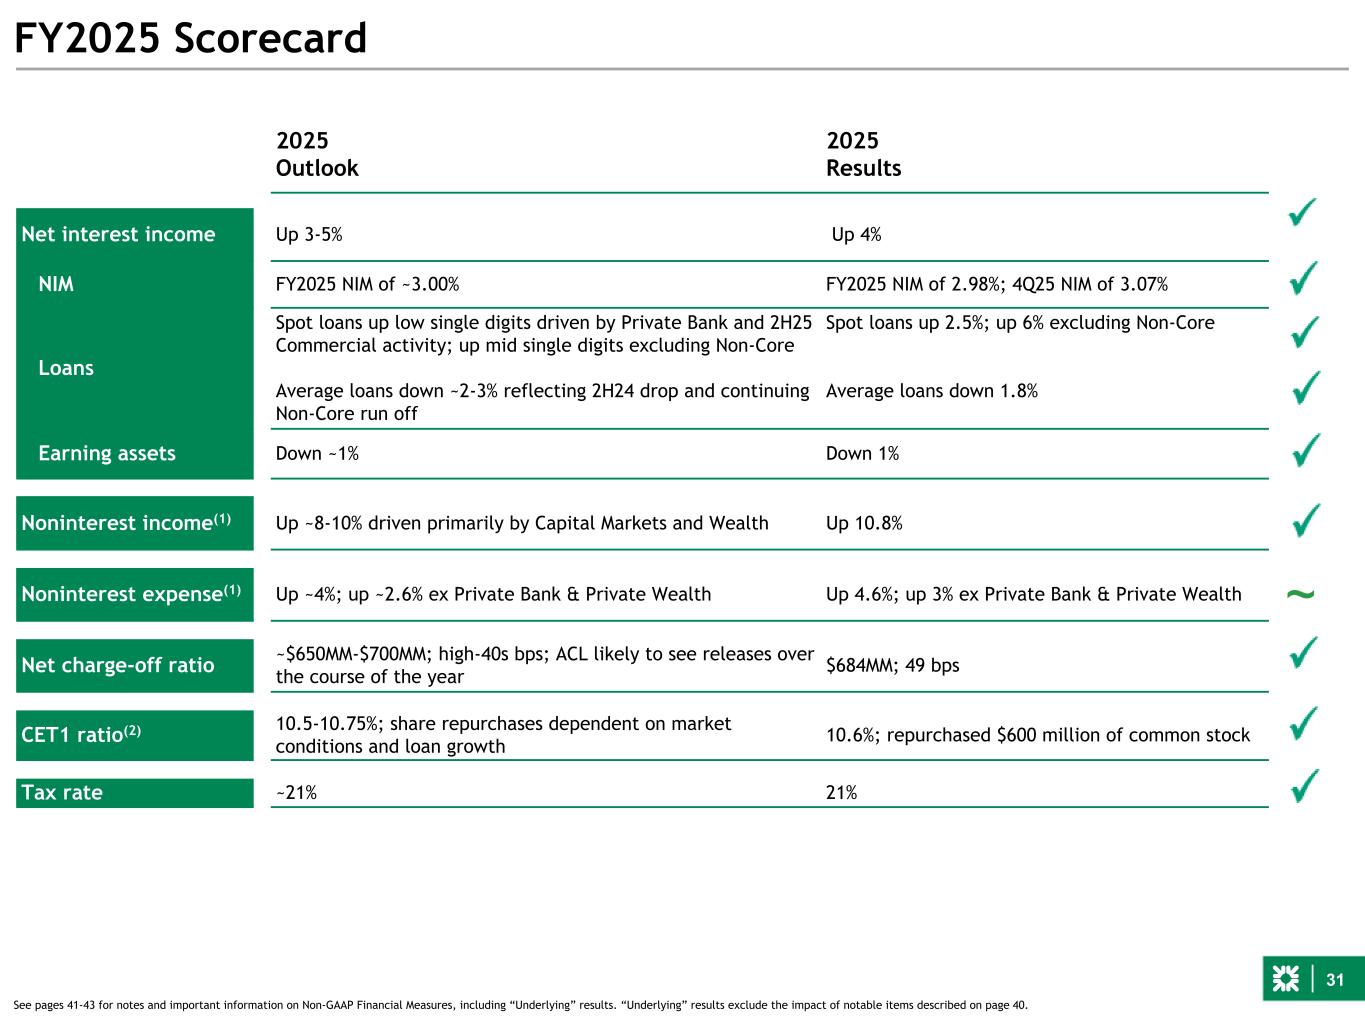
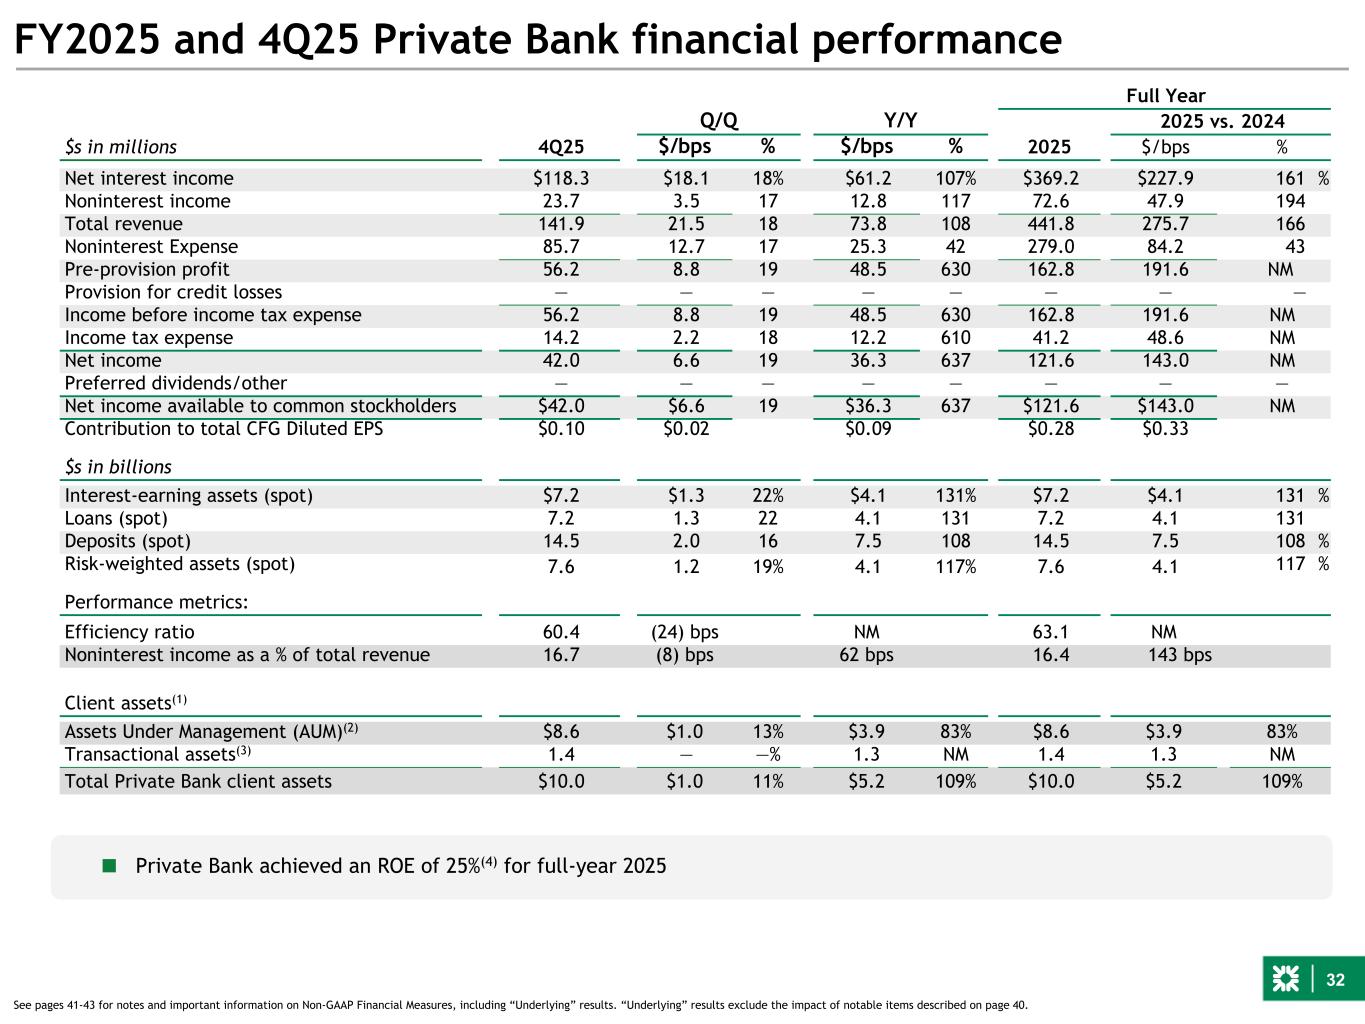
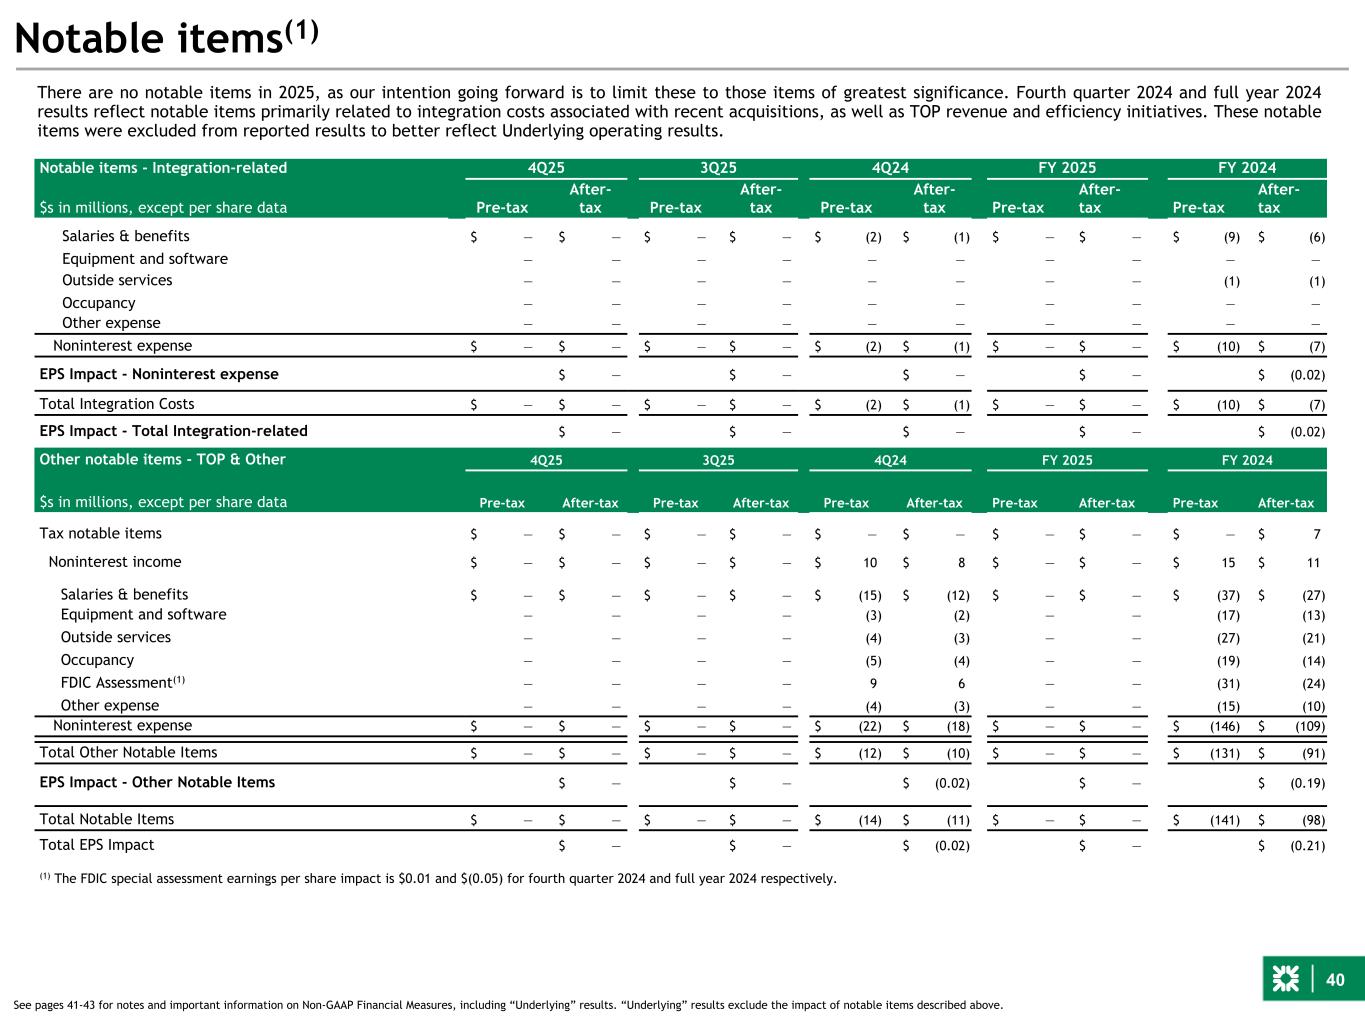
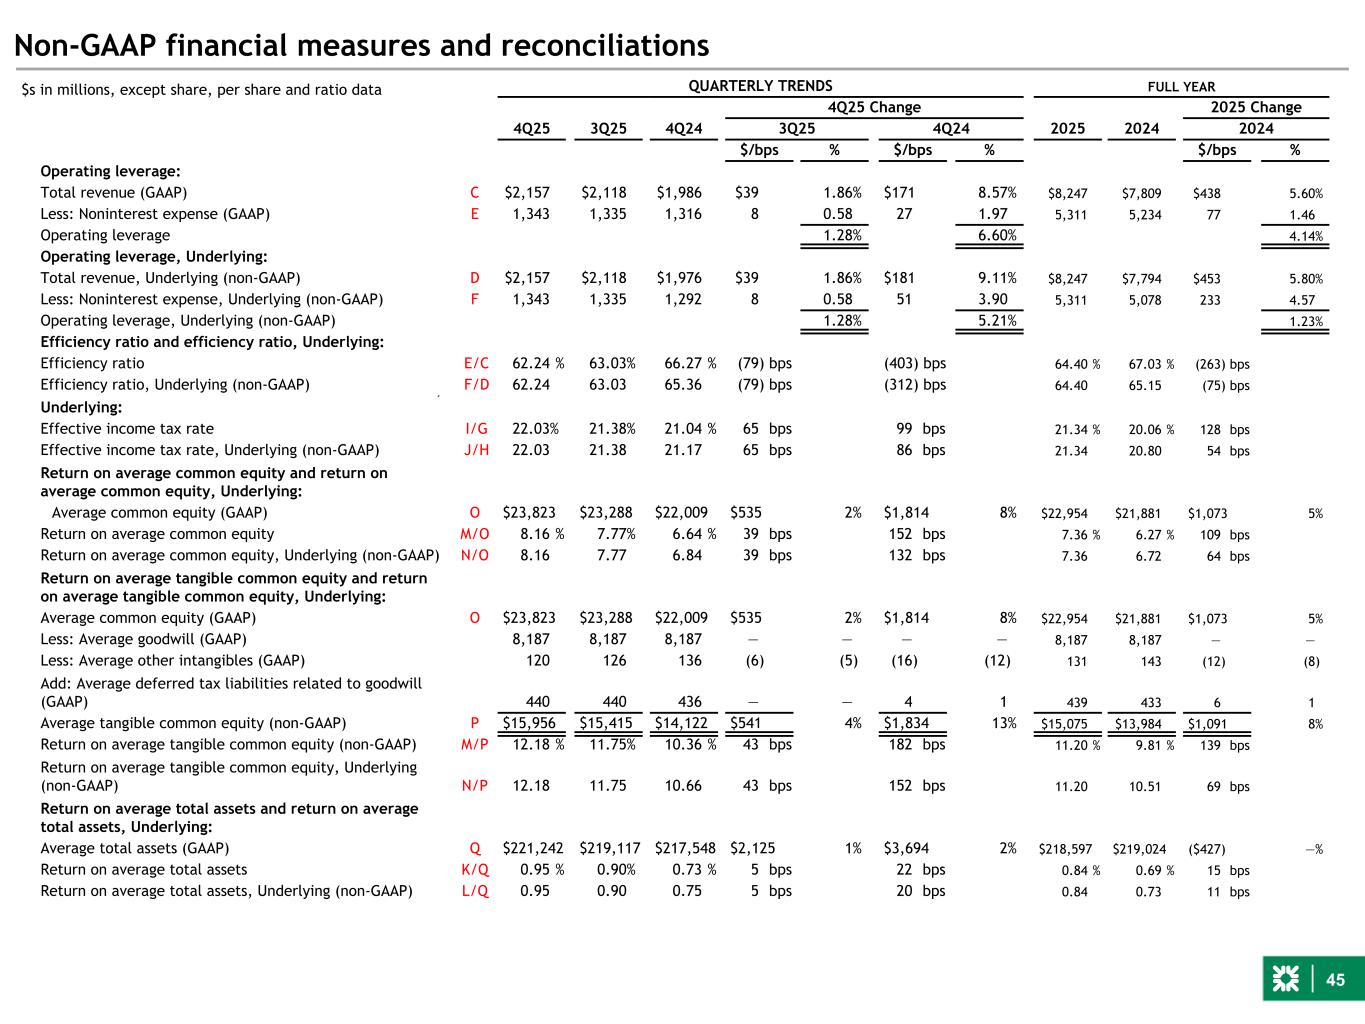
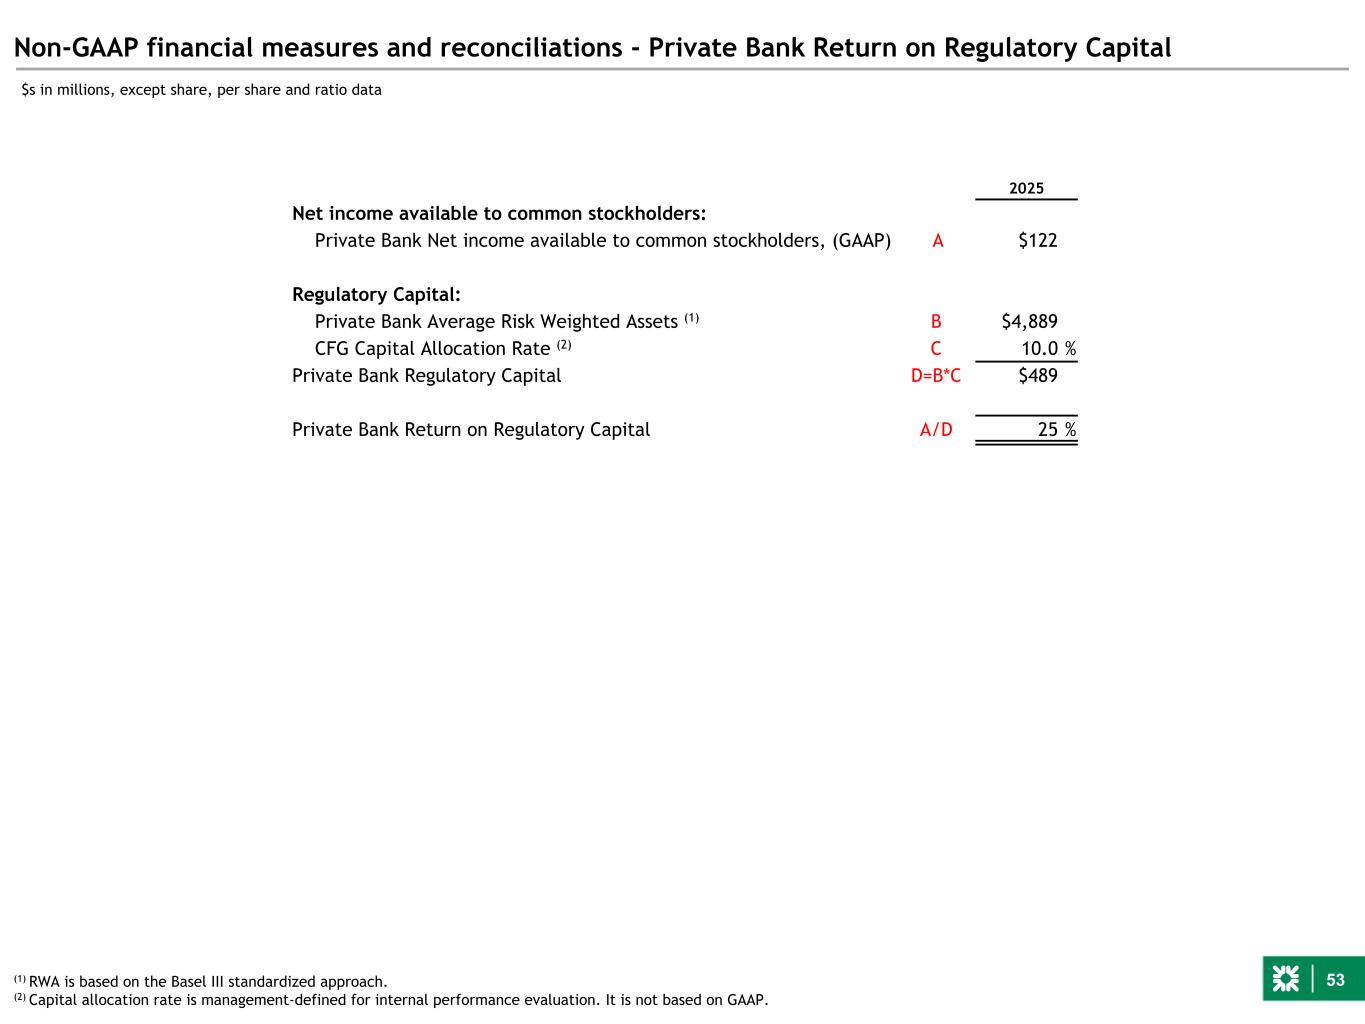
Okay, thanks, Kristen, and good morning, everyone. Thanks for joining our call today. We were pleased to finish the year with another strong quarter. Our financial results were paced by net interest margin expansion of seven basis points, strong wealth and capital markets fees, positive operating leverage of 1.3% sequential and 5.2% year-on-year, favorable credit trends, and a robust balance sheet across capital, liquidity, and funding. We are executing well on our strategic initiatives. Our private bank finished the year with $14.5 billion in deposits, $10 billion in client assets, and $7.2 billion in loans. The business was 7% accretive to pre-tax income in 2025, ahead of our 5% target. Importantly, we managed this business to a 25% ROE for the year. We continue to grow nicely in New York City metro, and our corporate banking expansion into new geographies, verticals, and sponsors is delivering good results. We made significant progress in running down non-core assets from $6.9 billion at the beginning of the year to $2.5 billion at the end, which included a sale of a student loan portfolio. Our top 10 program hit the mark with $100 million plus run rate benefits in Q4. Our EPS was up 8% sequentially and 36% year-over-year. NII is up 9% year-on-year as net interest margin is up 20 basis points, and spot loans grew 3%. Fees are up 8% year-on-year, paced by capital markets and wealth. The provision is down $25 million year-on-year as losses reduce on CRE office and credit in general looks good. We retired 3% of our shares in 2025 and delivered an 80% return of capital to shareholders. For the full year, our EPS of $3.86 was up 19% relative to 2024. We hit most of our line items in the beginning of year guide, which is included on slide 31. Our expenses were up 4.6% versus the guide of 4% given the fee performance beat and associated incentive compensation and our desire to keep building out private bank and wealth. We delivered positive operating leverage of around 1.25% for the year. As we think about 2026, our focus will continue to be strong execution of our strategic initiatives. The biggest new addition will be Reimagine the Bank, which has been launched and is creating real excitement at citizens. We've included a couple of slides in our presentation on this program. What I'd like to call out is that the deployment of new technologies and approaches under Reimagine the Bank will deliver meaningful enhancements to customer experience. This will drive some real revenue benefits in addition to the targeted expense efficiency improvements from the program. This program has around 50 initiatives at the outset, but we will add to this over time, providing further upside. Looking ahead, the macro environment for 2026 should be favorable. We see solid GDP growth, stable unemployment, and inflation falling by the end of the year. We project two more Fed rate cuts with the yield curve steepening as the 10-year stays anchored around 4.25%. We anticipate the regulatory environment to stay positive. We will look to take some basic steps on stablecoins, but we do not see a big liftoff and impact in 2026. Notwithstanding several of our peers gauging on acquisitions, our focus for the foreseeable future remains on our attractive organic growth agenda. With respect to the 2026 outlook, we expect very strong revenue performance, controlled expenses, significant positive operating leverage, and lower credit costs. NII growth of 10% to 12% will be paced by strong continuing NIM expansion and solid loan growth led by private bank and C&I. Fees will continue to grow off a strong year in 2025. The capital market's backdrop is highly favorable, and Citizens is well-positioned. Our wealth business is in a great position to grow, both with private bank customers as well as branch-based customers. This wealth is projected to be comparable to this year as we seek to maintain the growth rate of the private bank. We have been disciplined in ensuring that the private bank achieves sustainable growth with attractive returns. The Reimagine the Bank impact in 2026 will deliver one-time costs of around $50 million versus benefits of $45 million, which are incorporated in this guidance. We do not intend to break out the one-time costs as notables as we've done in the past. Credit costs should continue to improve as the CRE office portfolio continues to be worked out. We continue to see mixed improvements delivering benefits to the charge-off and provision rates over time. We will manage our SET-1 ratio to 10.5% to 10.6% throughout 2026. We envision share repurchases of approximately $700 to $850 million. We also are hopeful that the Fed modeling improvements will meaningfully lower our SCB. We've included some slides on our medium-term outlook and how the drag from our legacy swap portfolio will dissipate with time. We remain confident in our ability to achieve our medium-term 16% to 18% ROTC target. To sum up, we are feeling very good about our positioning for the future. Our strategy rests on a transformed consumer bank, the best-positioned super-regional commercial bank, and the aspiration to have the premier bank-owned private bank. We continue to make steady progress and will continue to execute with the financial and operating discipline that you've come to expect from us. I'd like to end my remarks by thanking our colleagues for rising to the occasion and delivering a great effort in 2025. We know we can count on you again this year. With that, let me turn it over to Annoi for his debut performance. Thanks, Bruce.
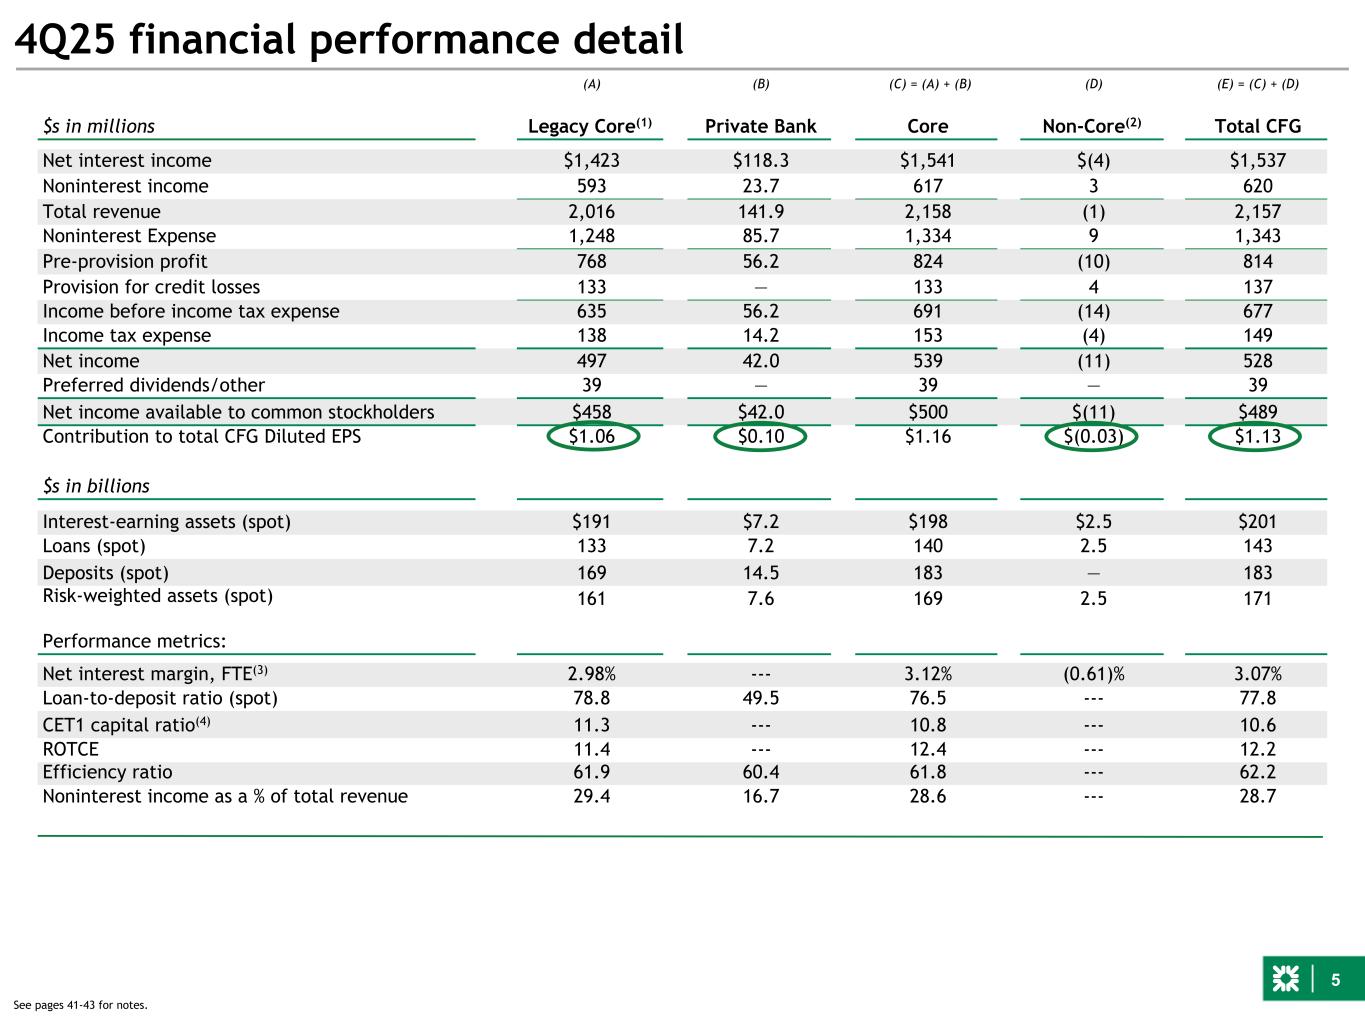
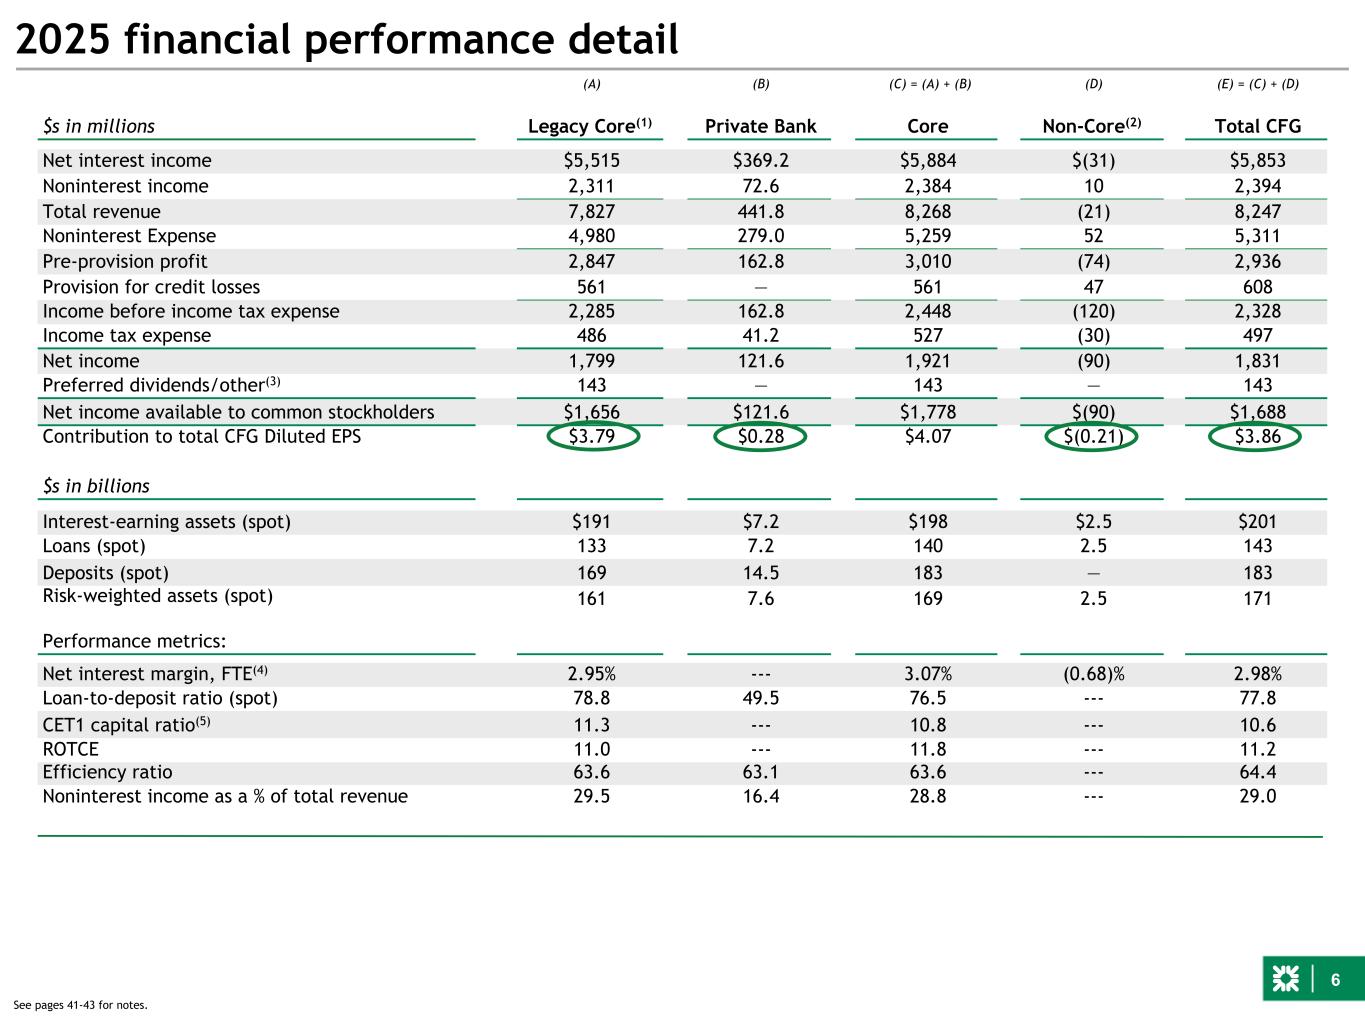
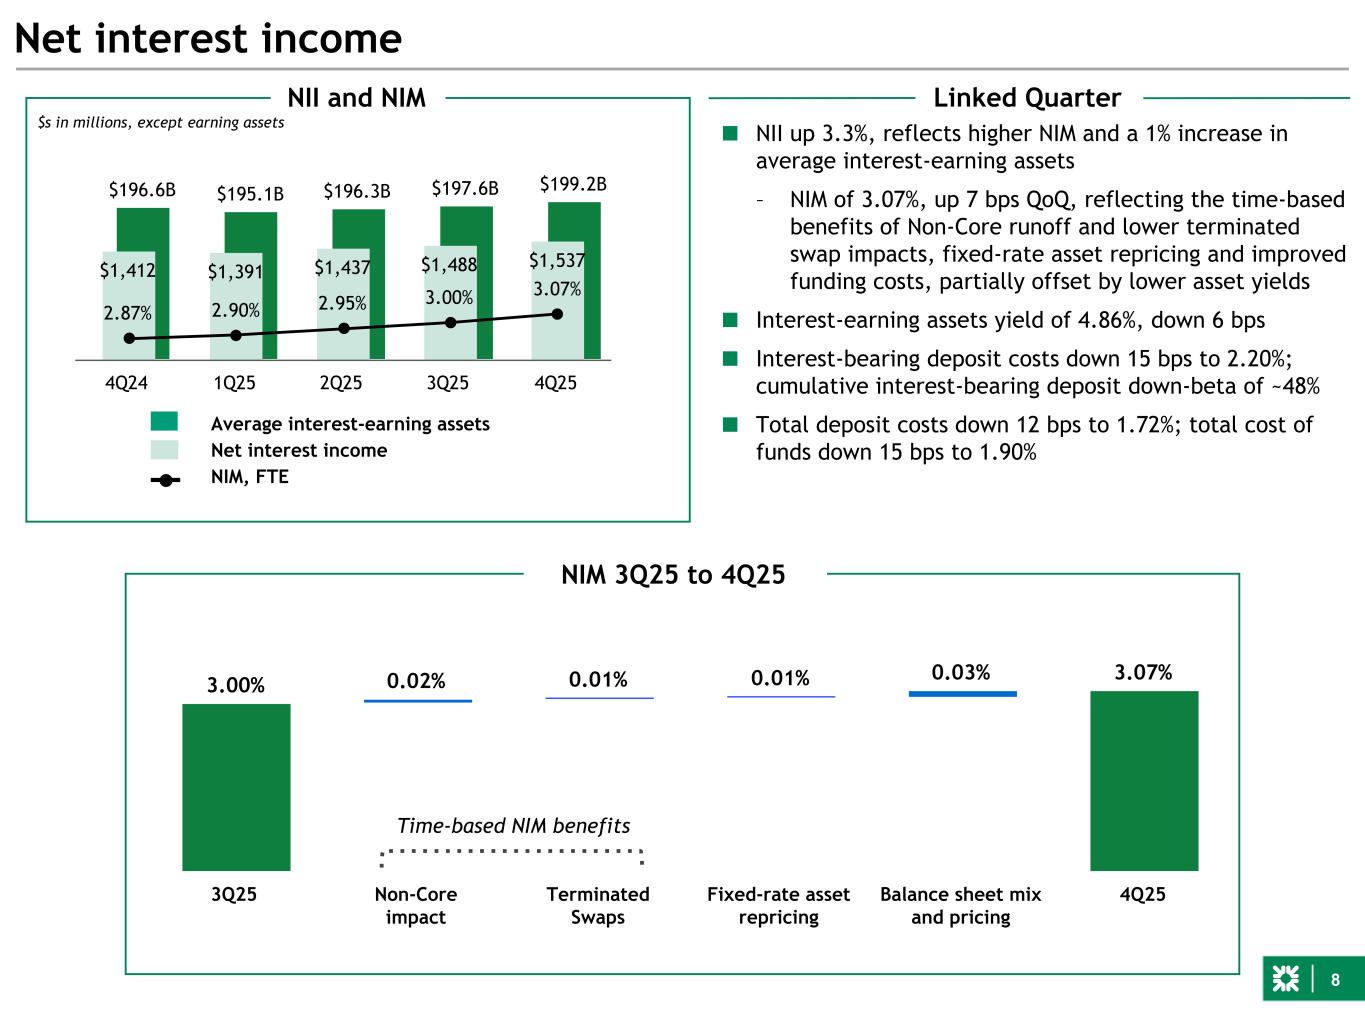
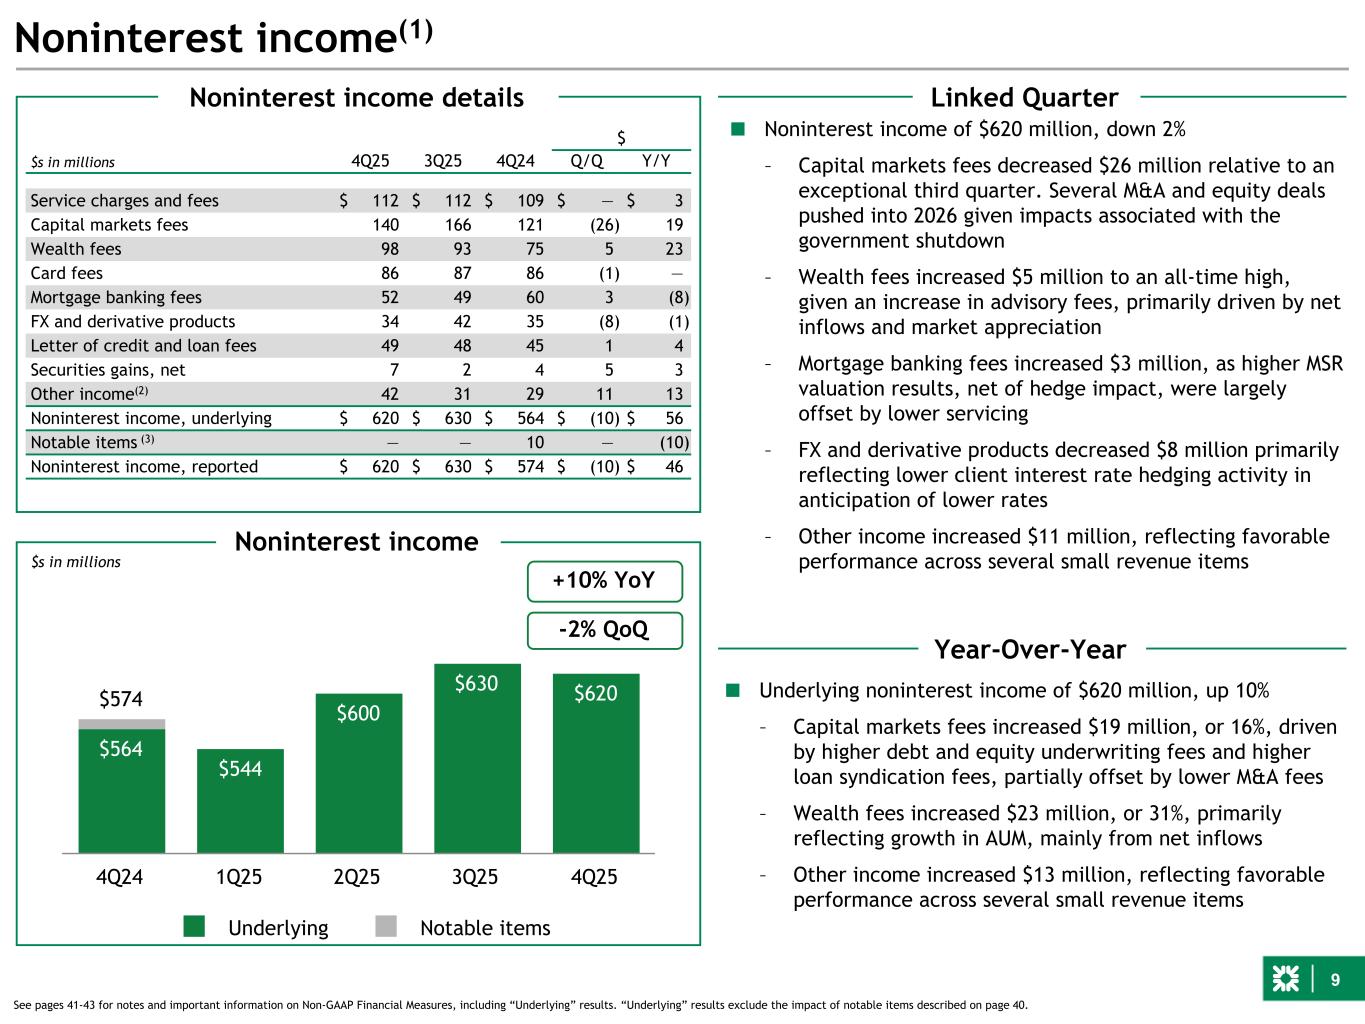
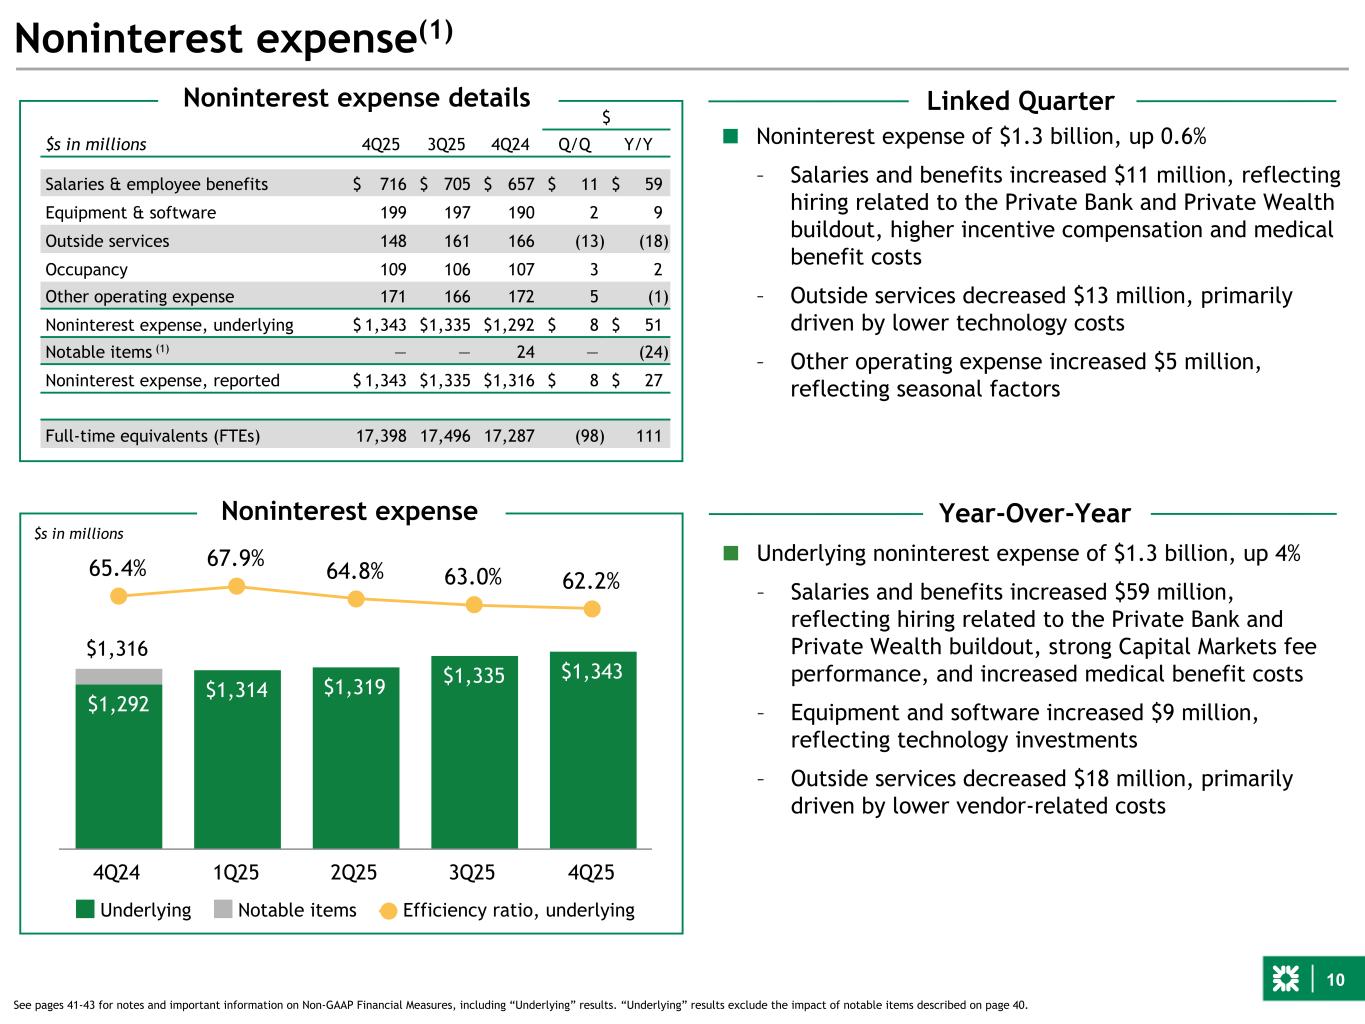
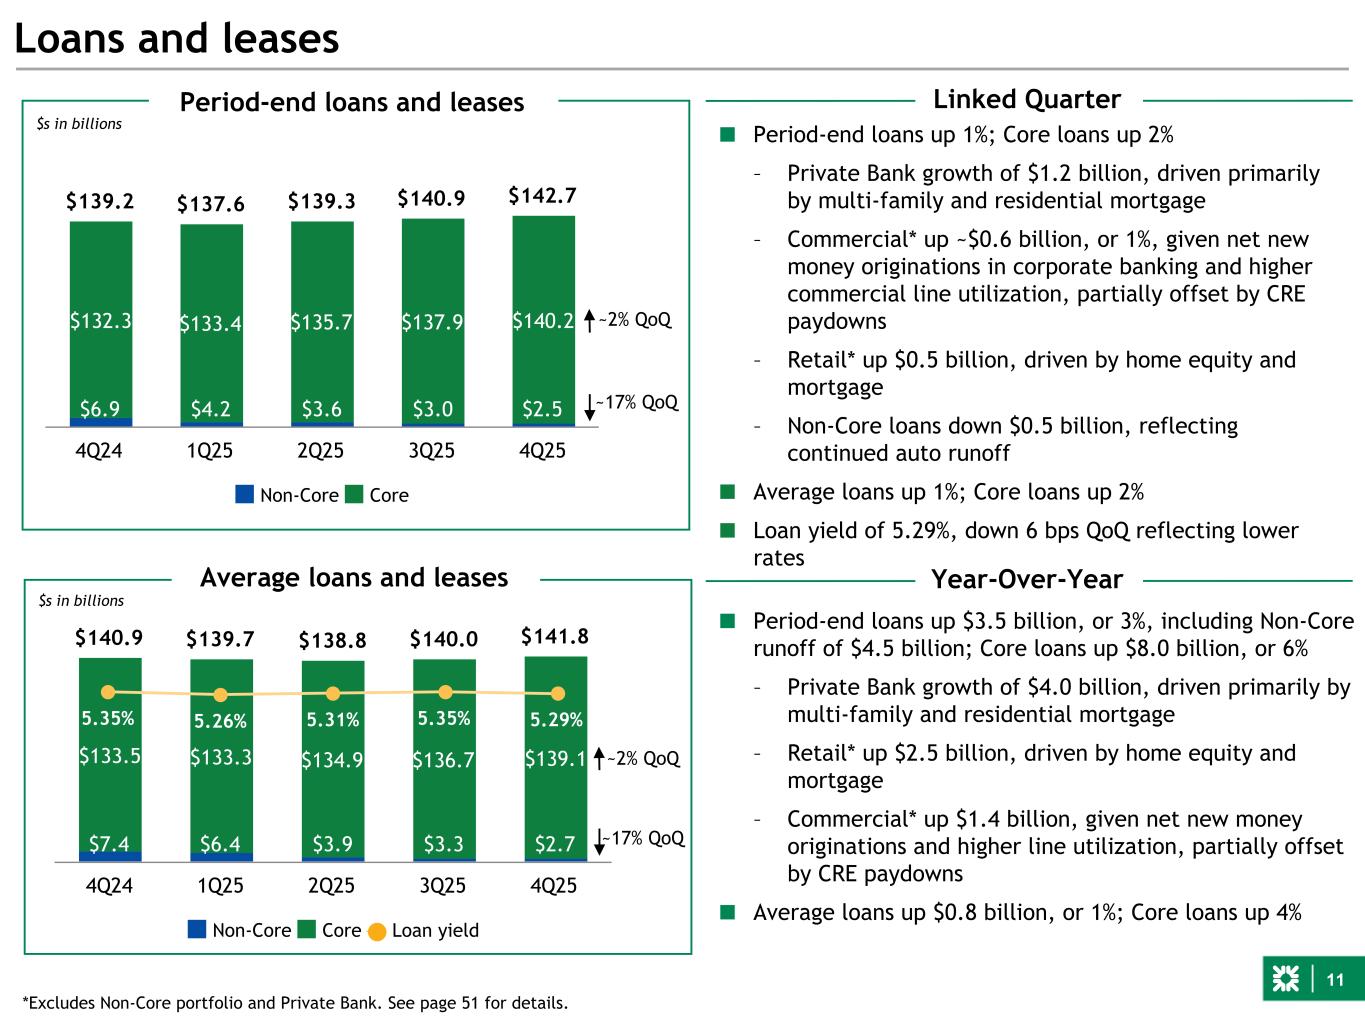
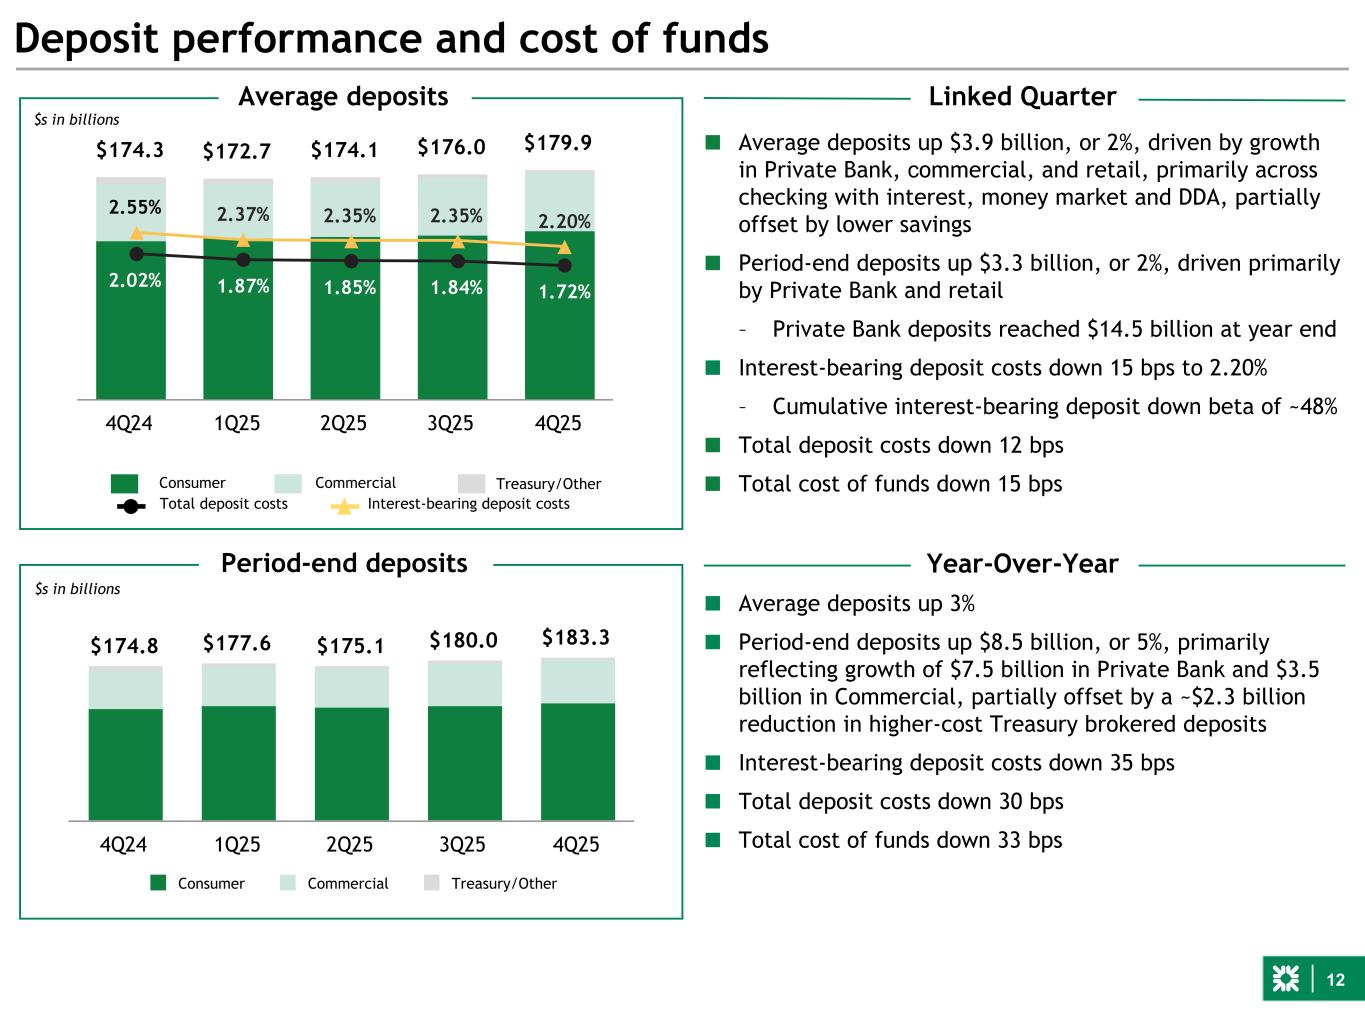
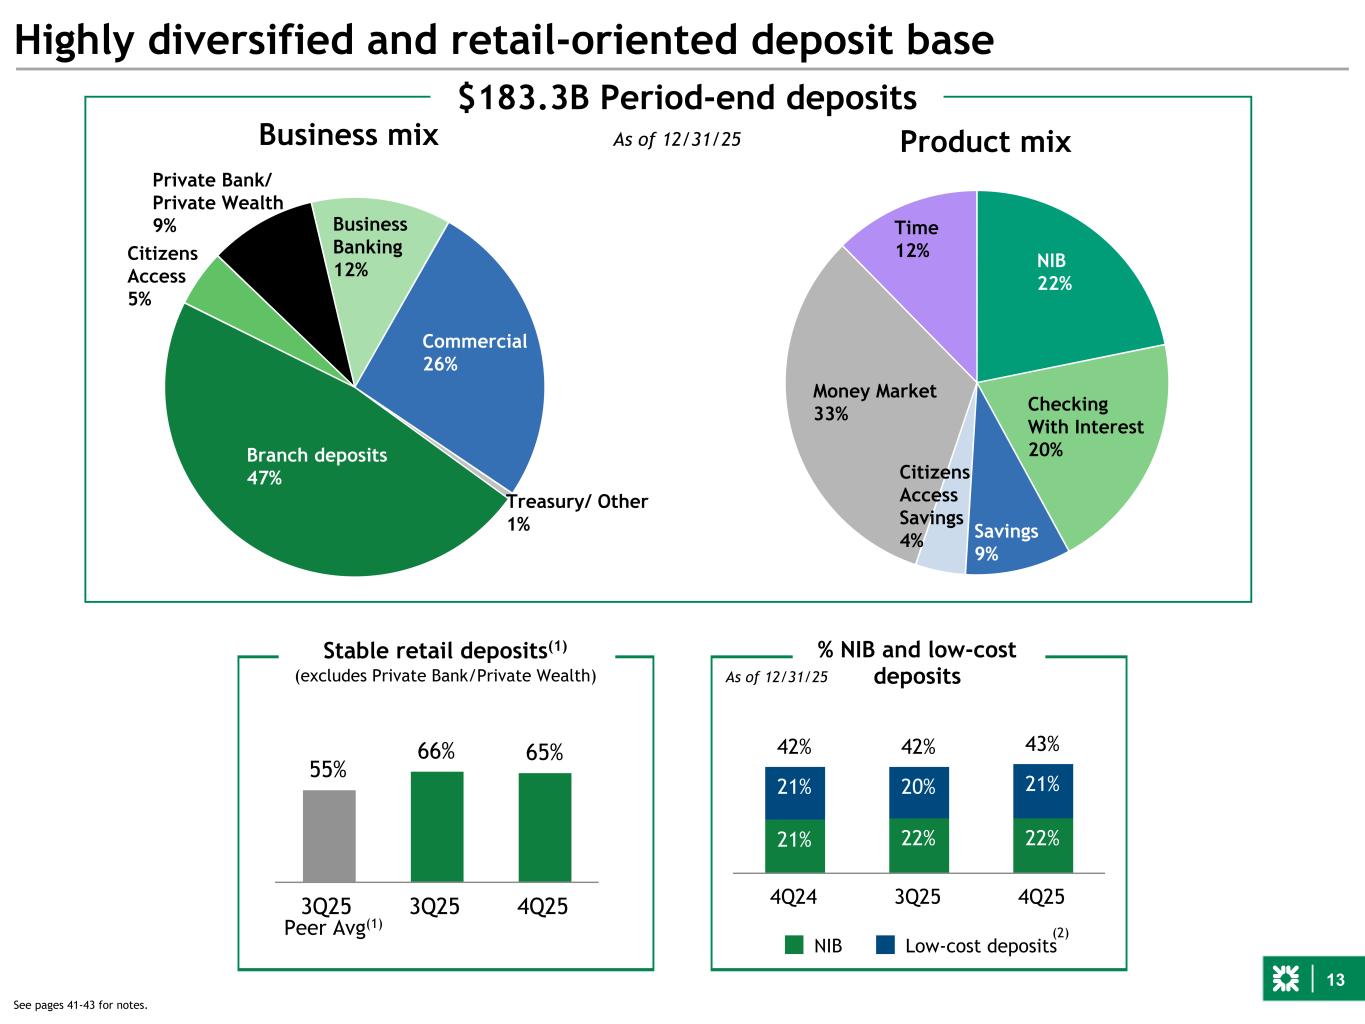
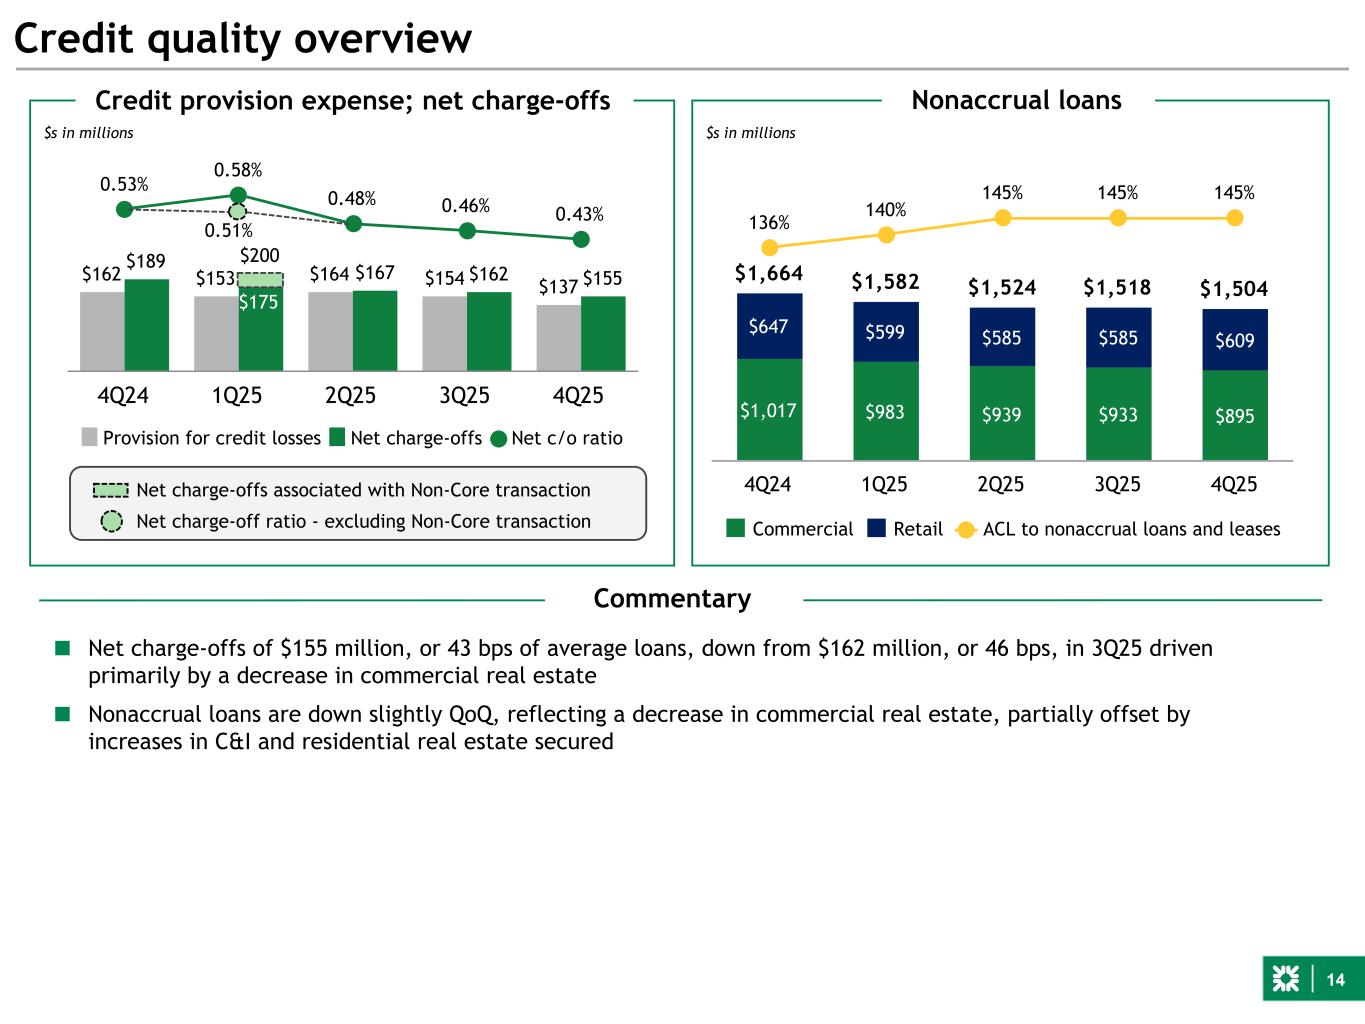
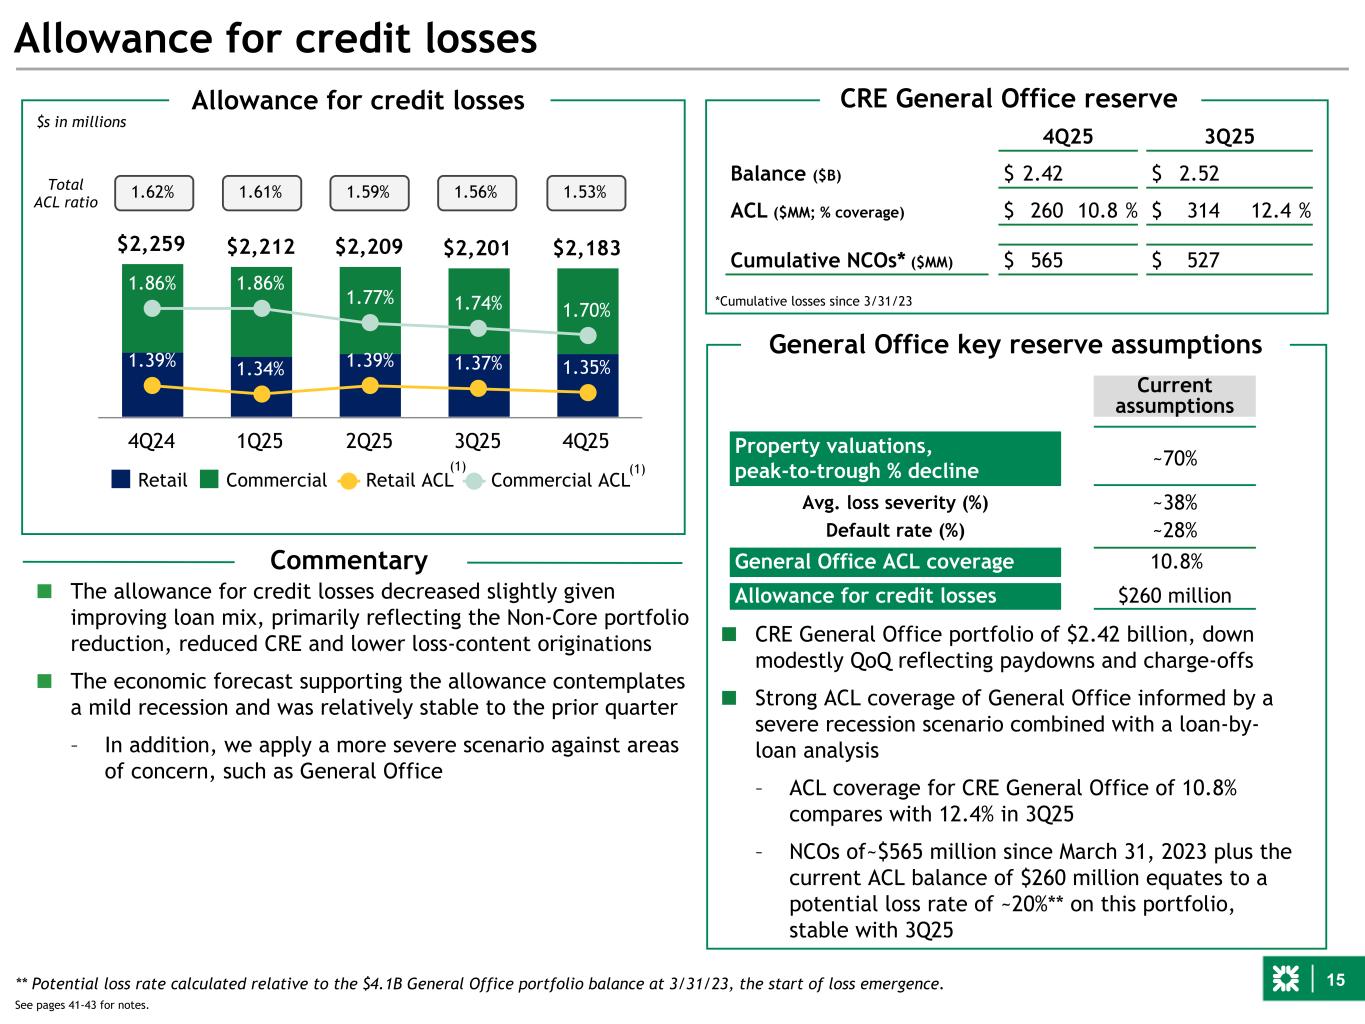
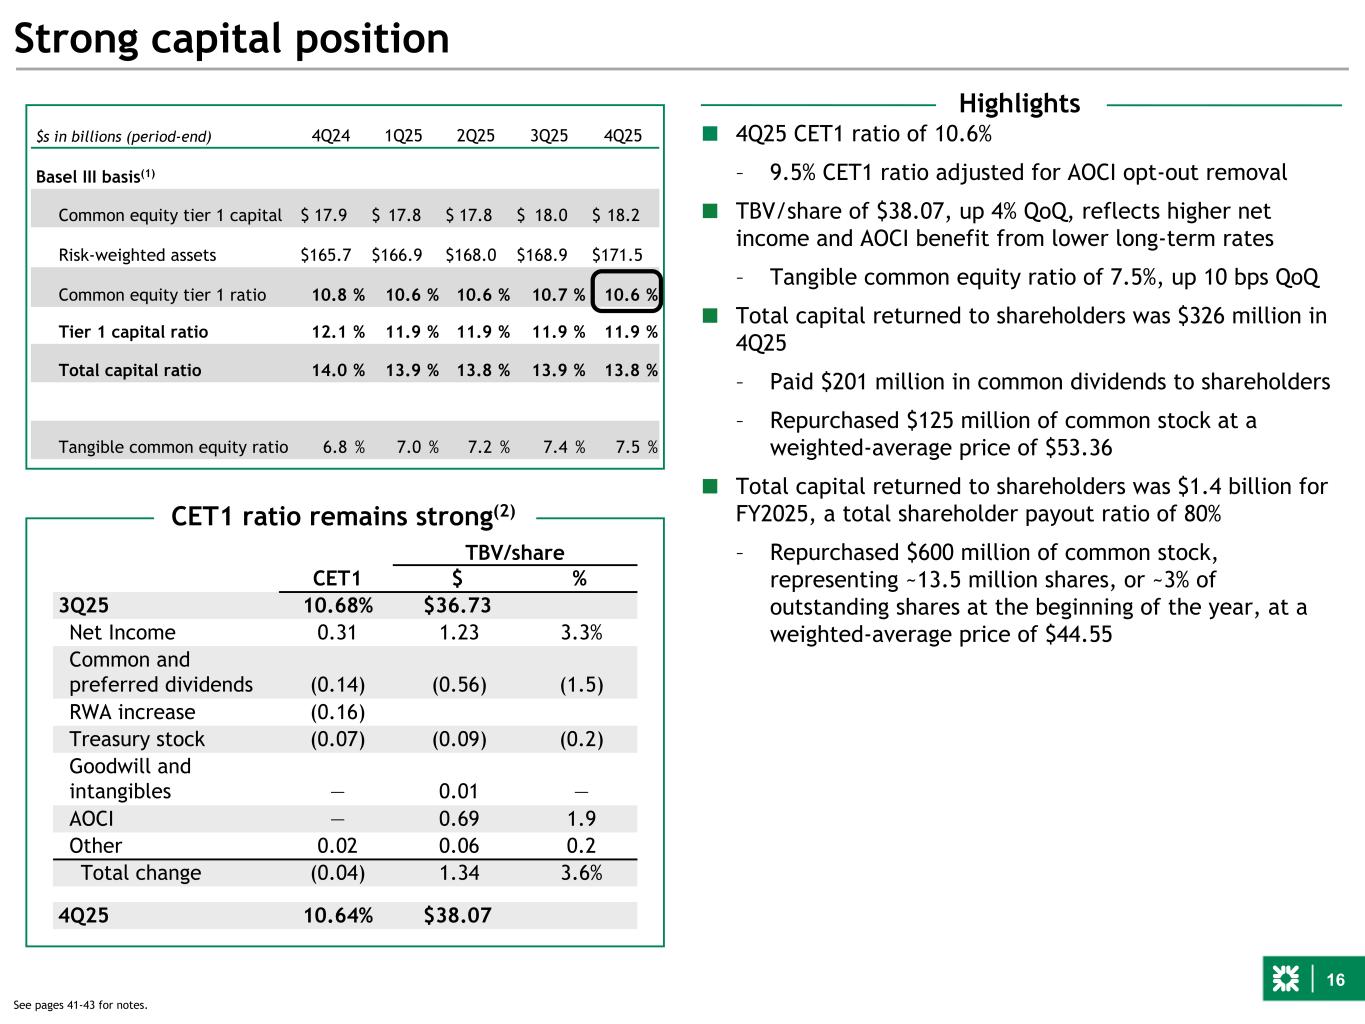
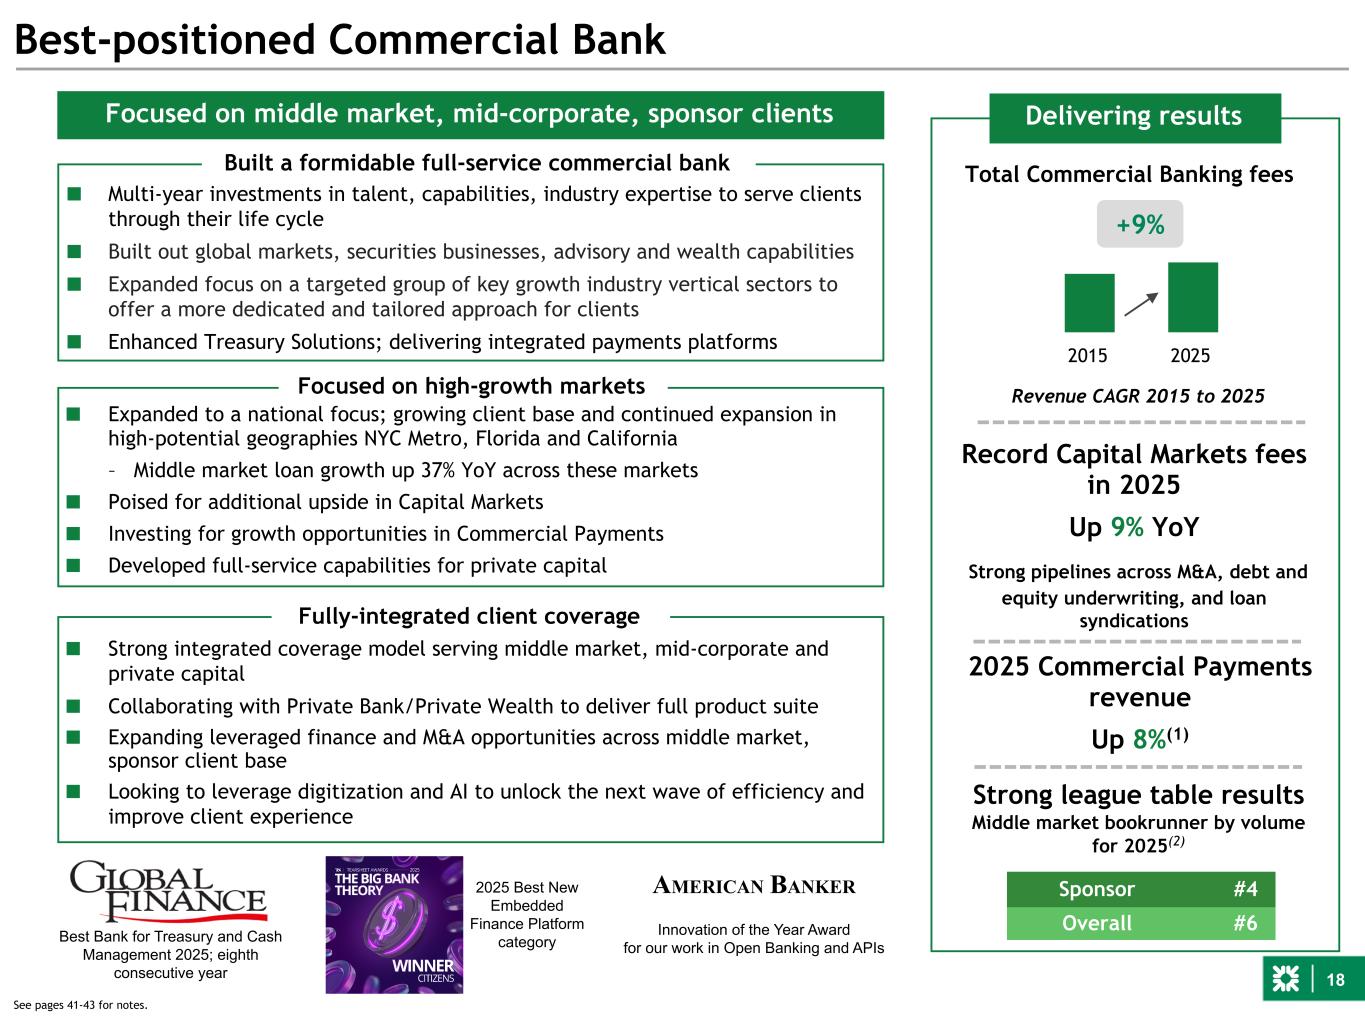
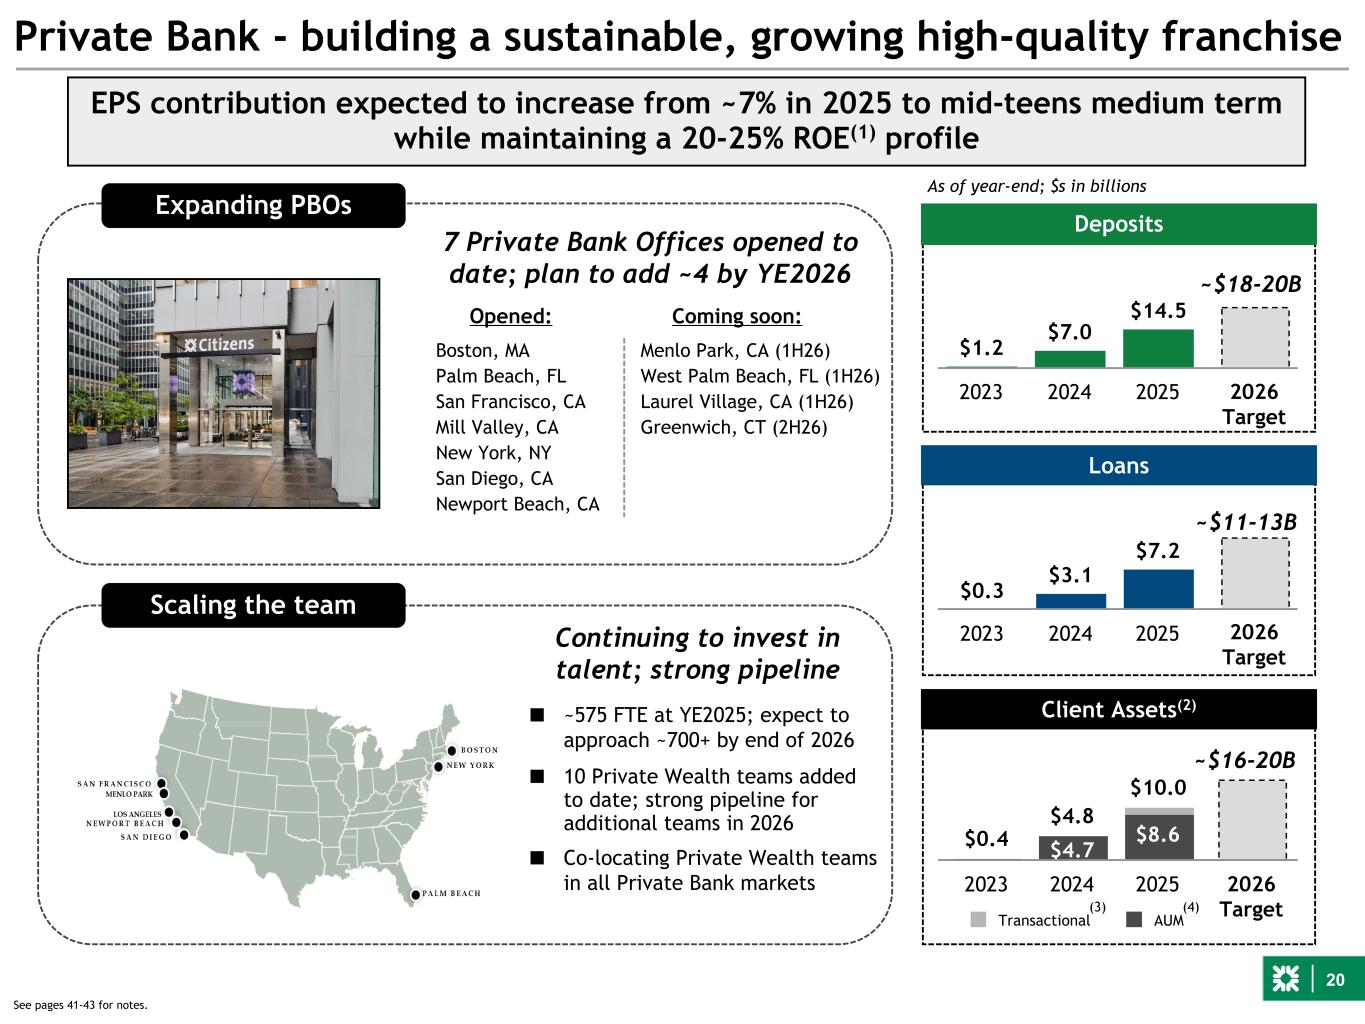
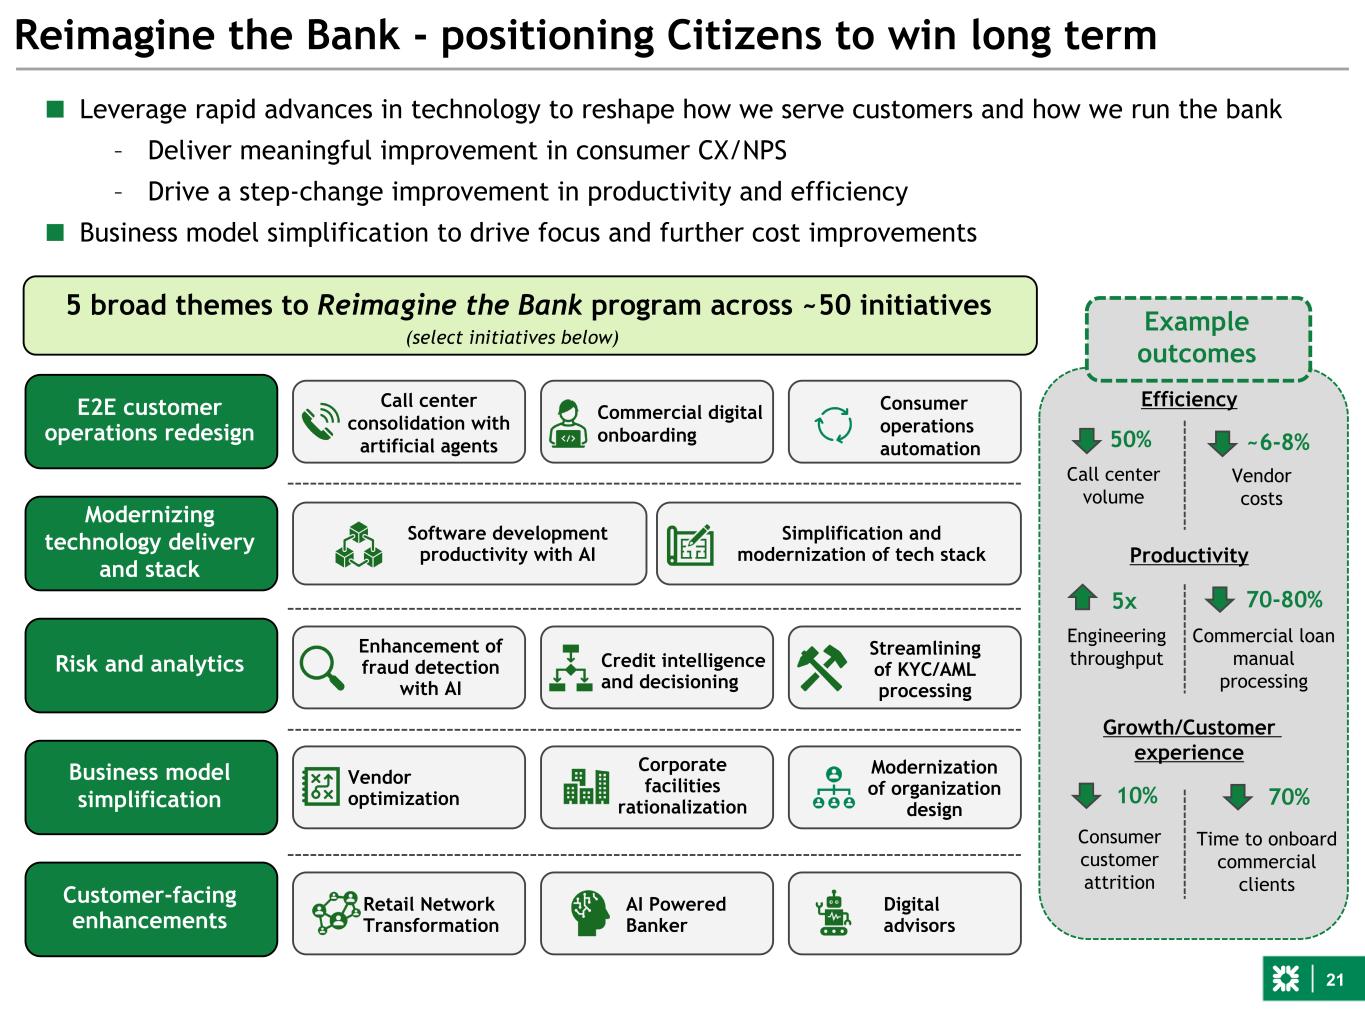
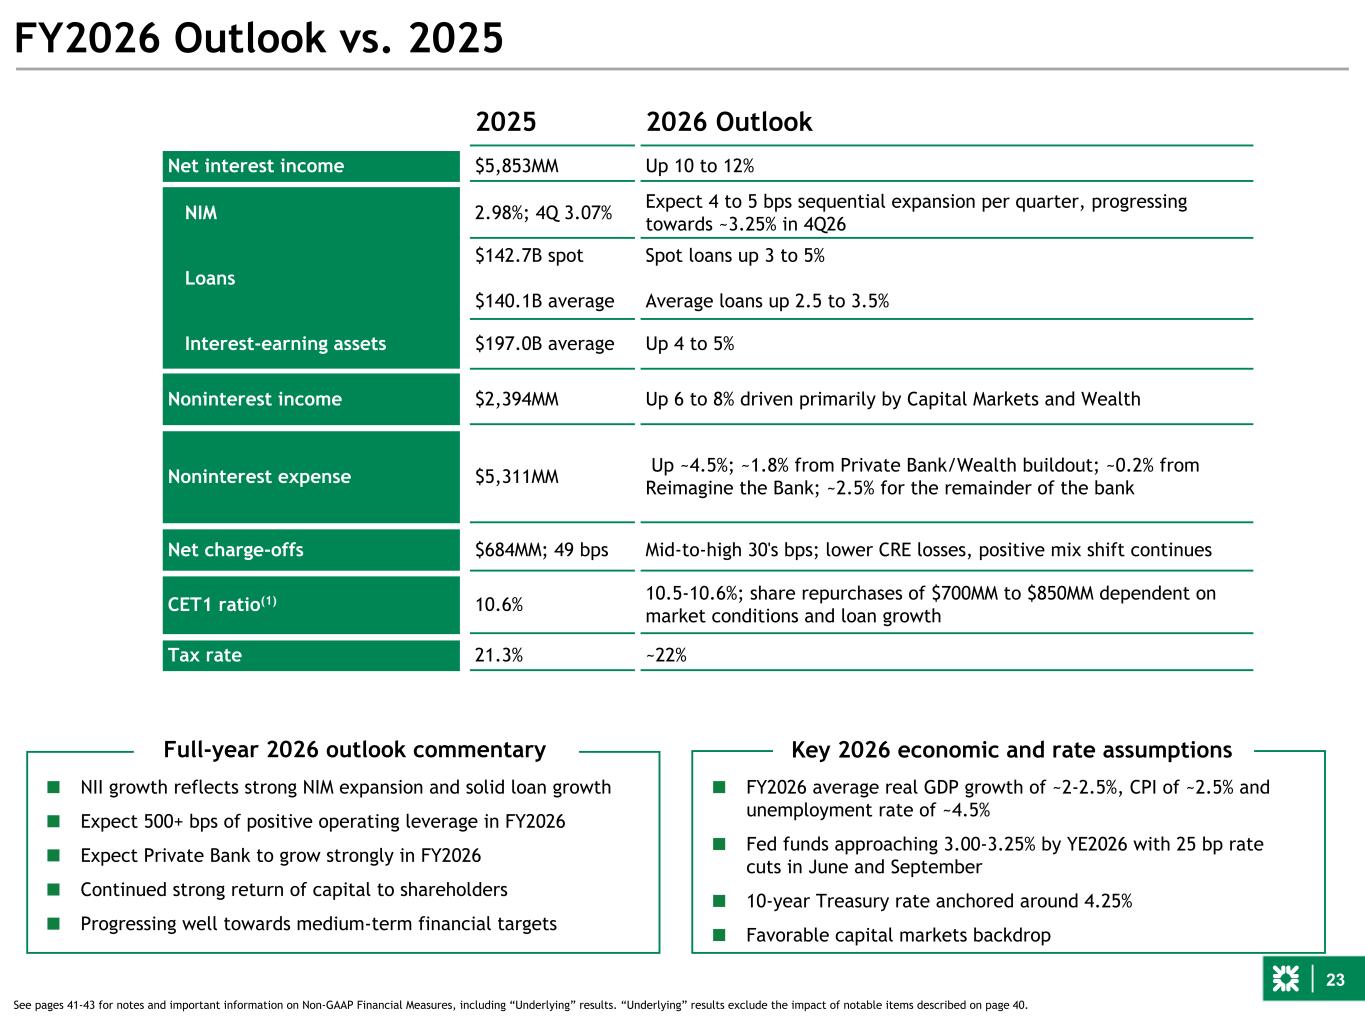
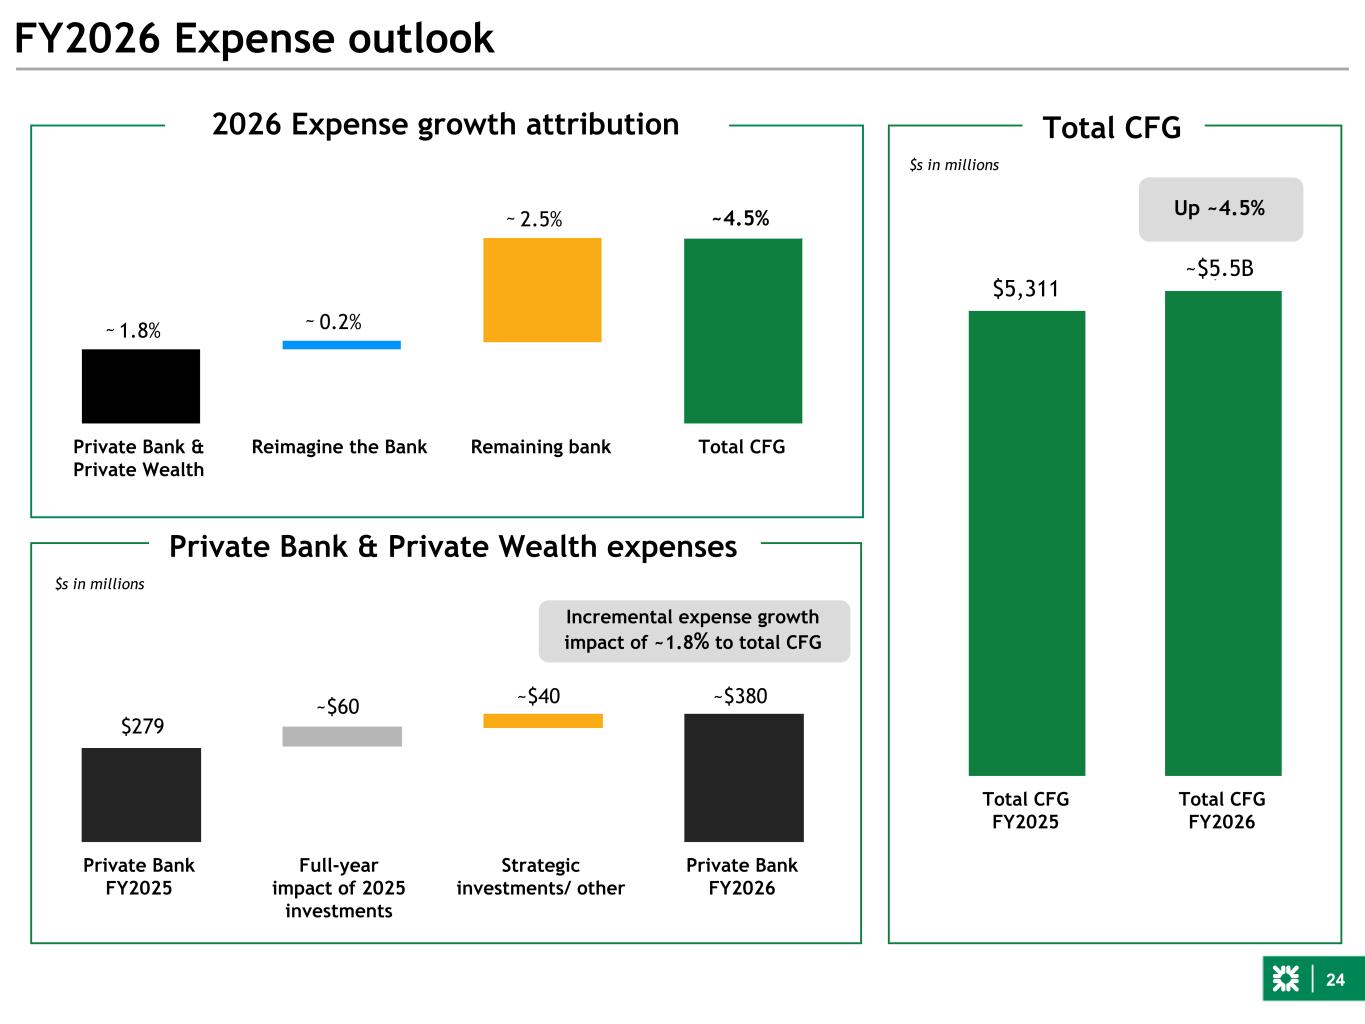
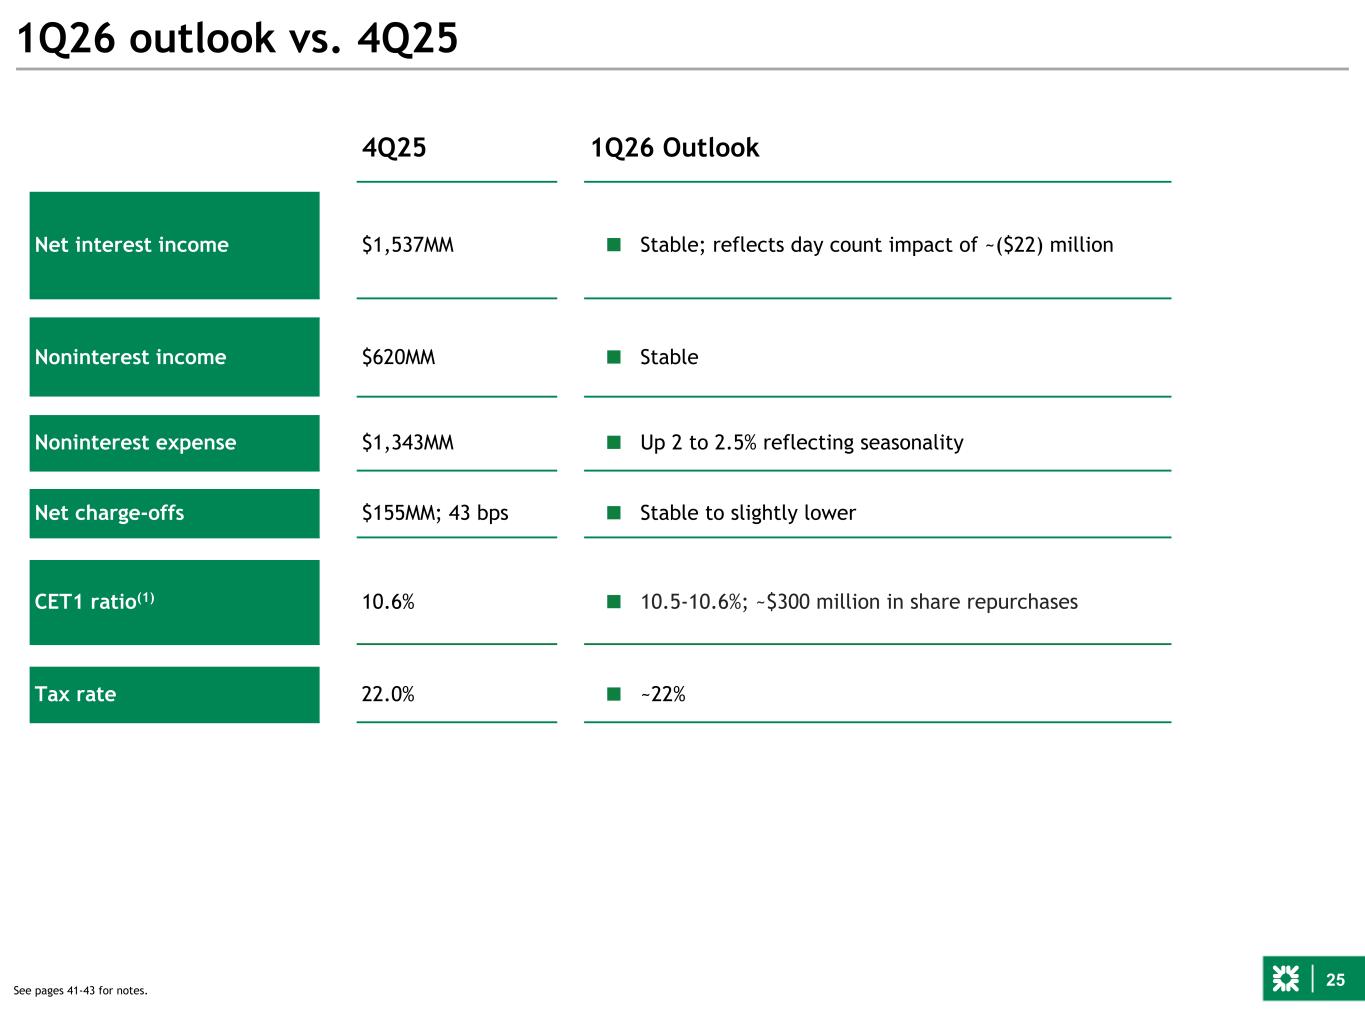
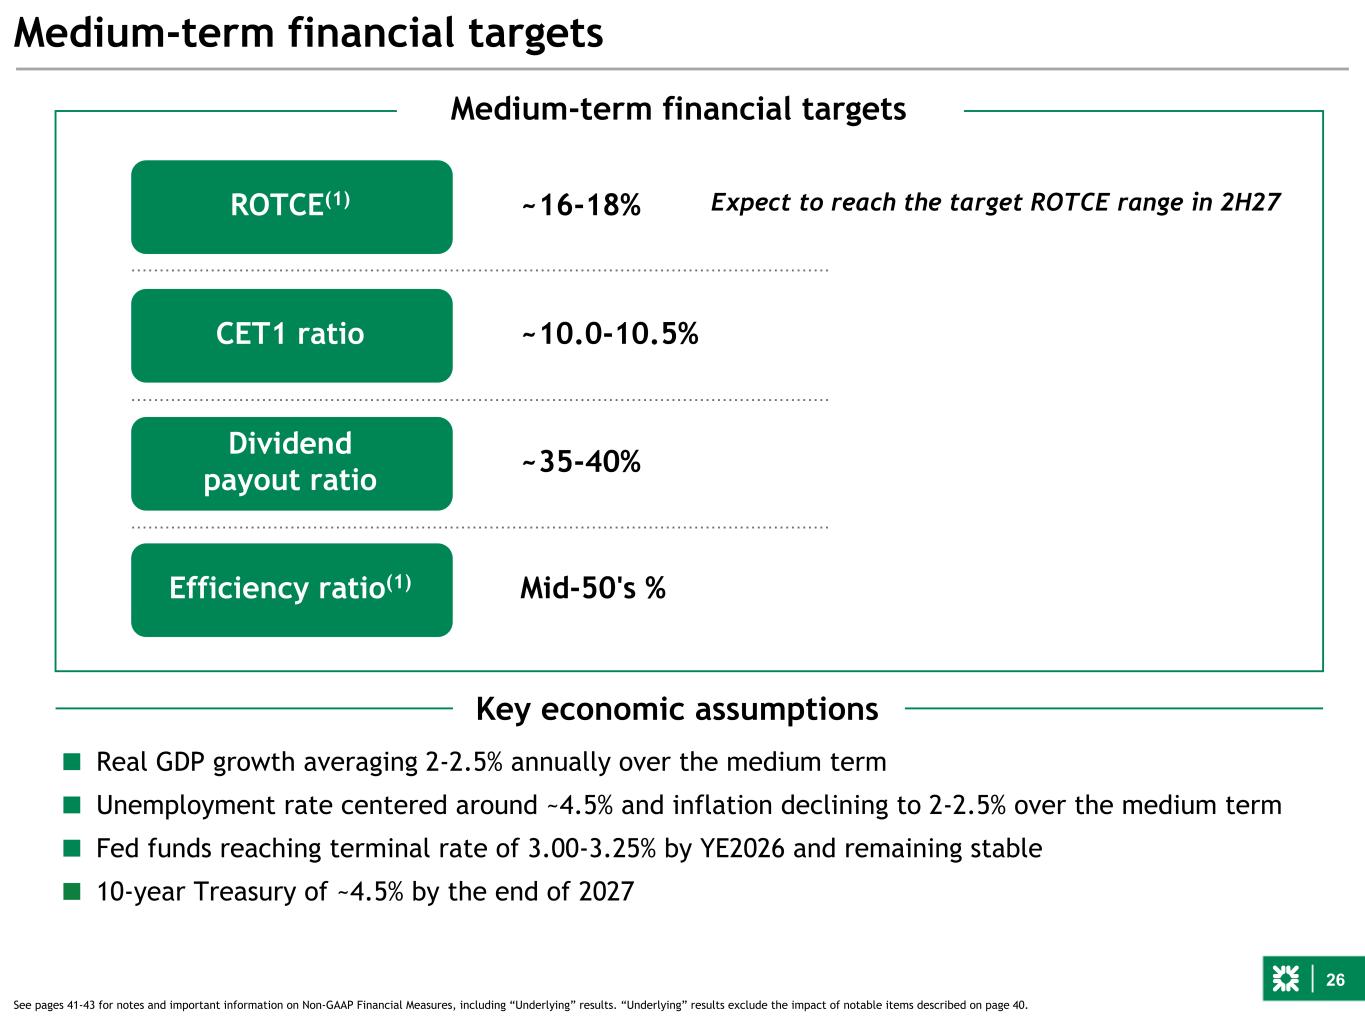
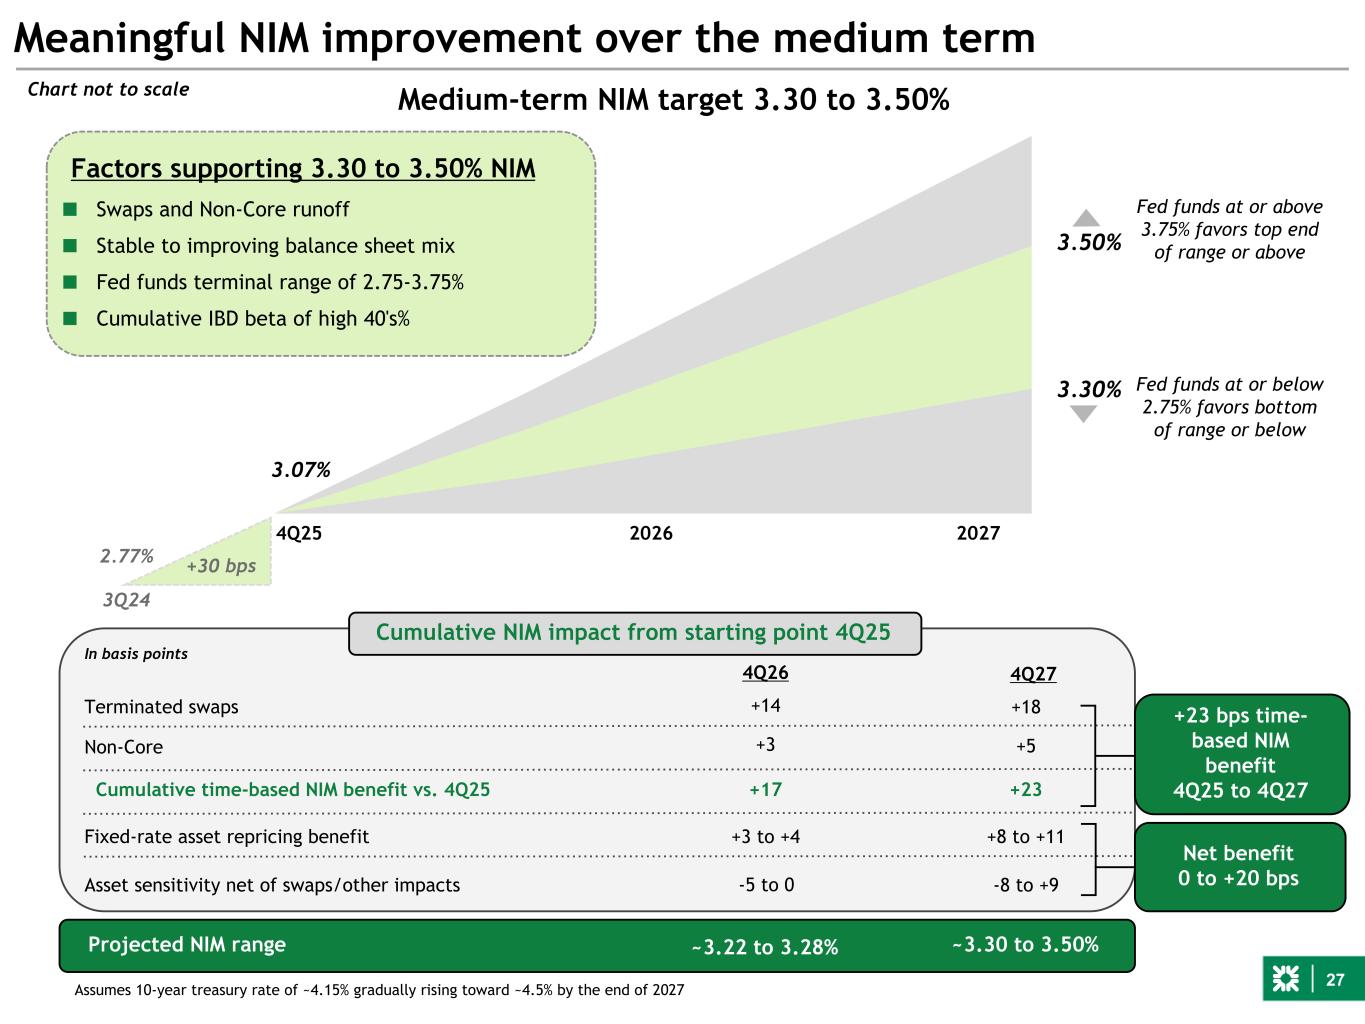
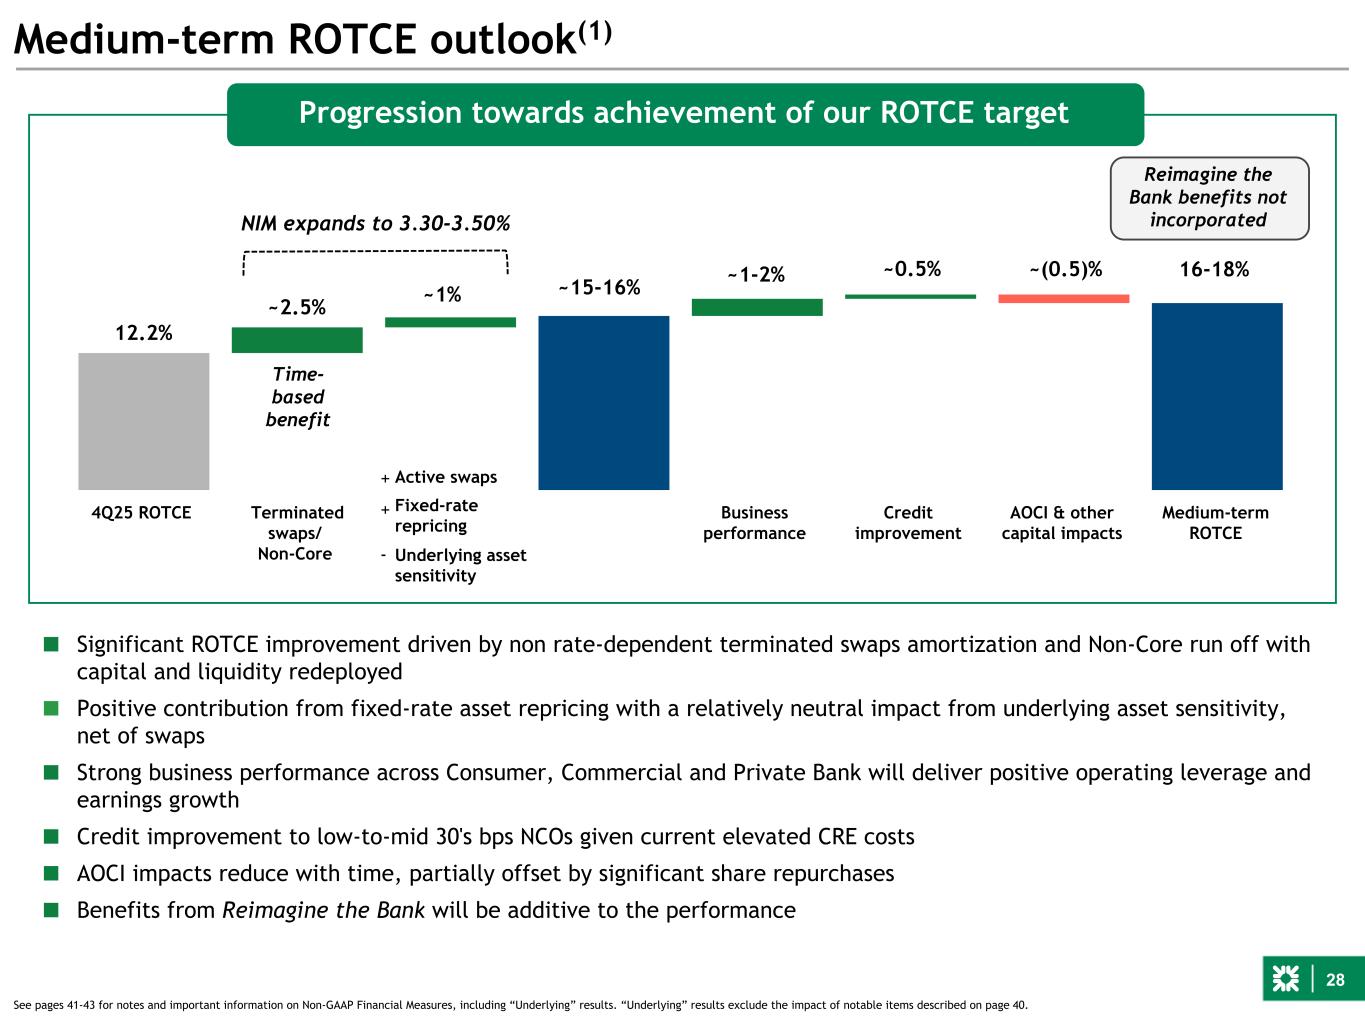
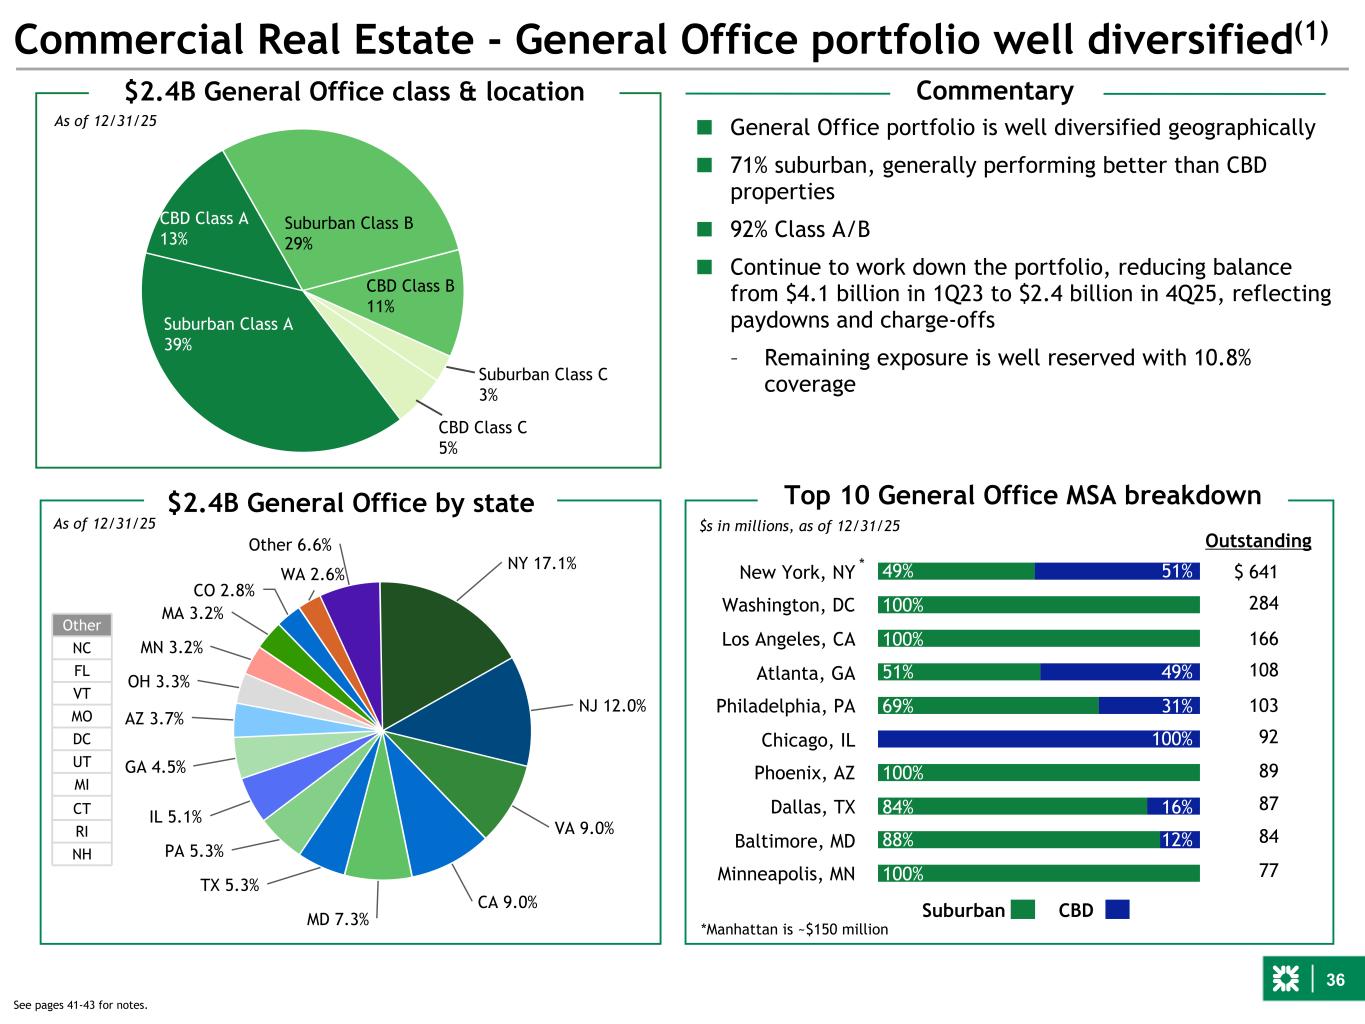
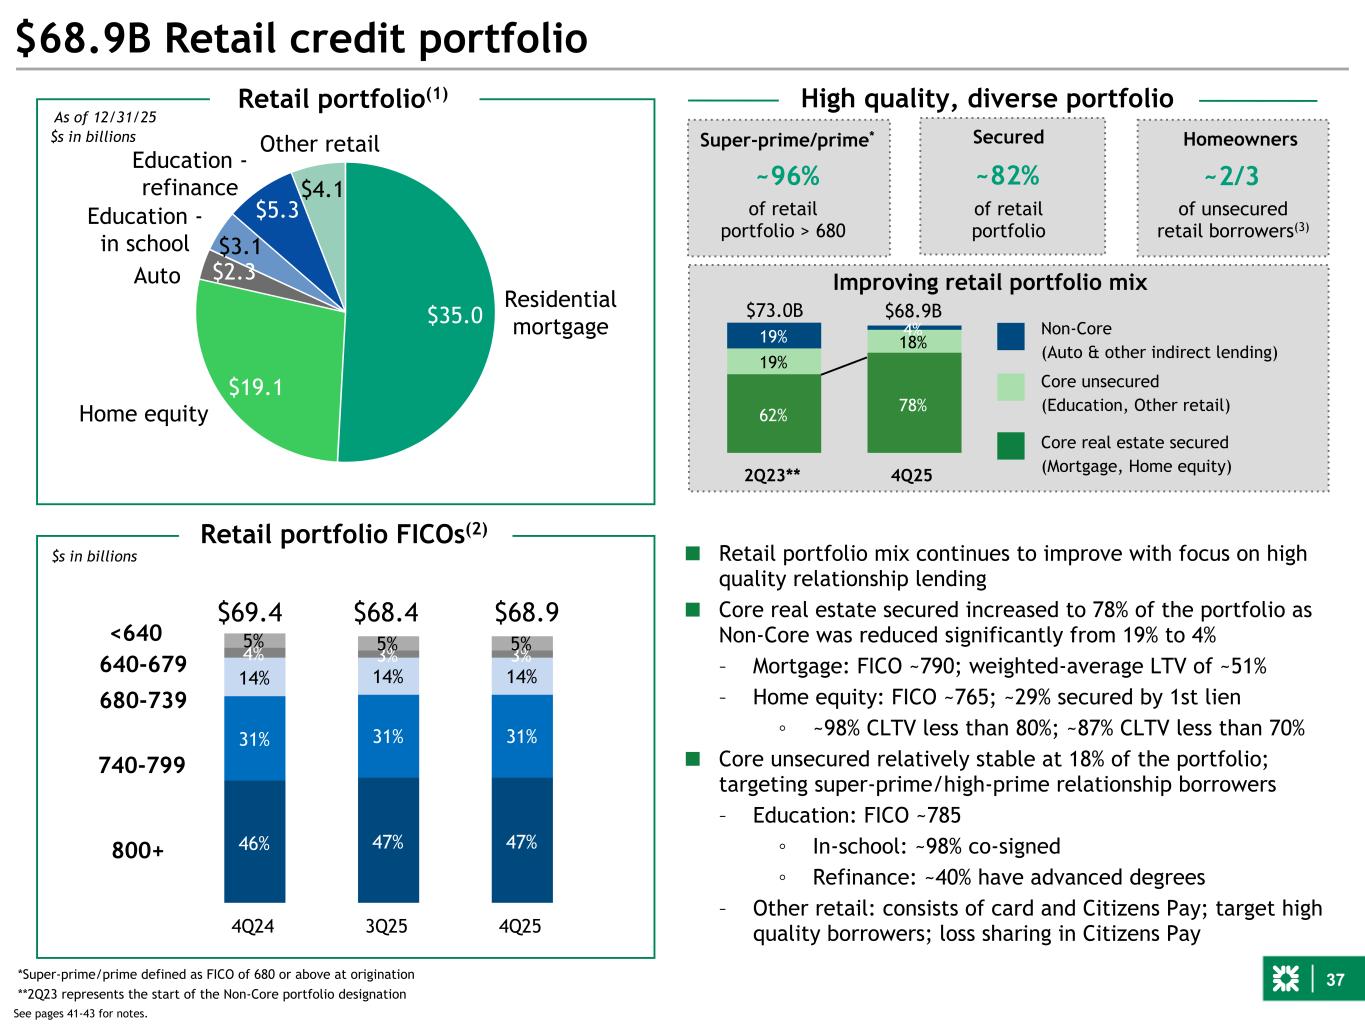
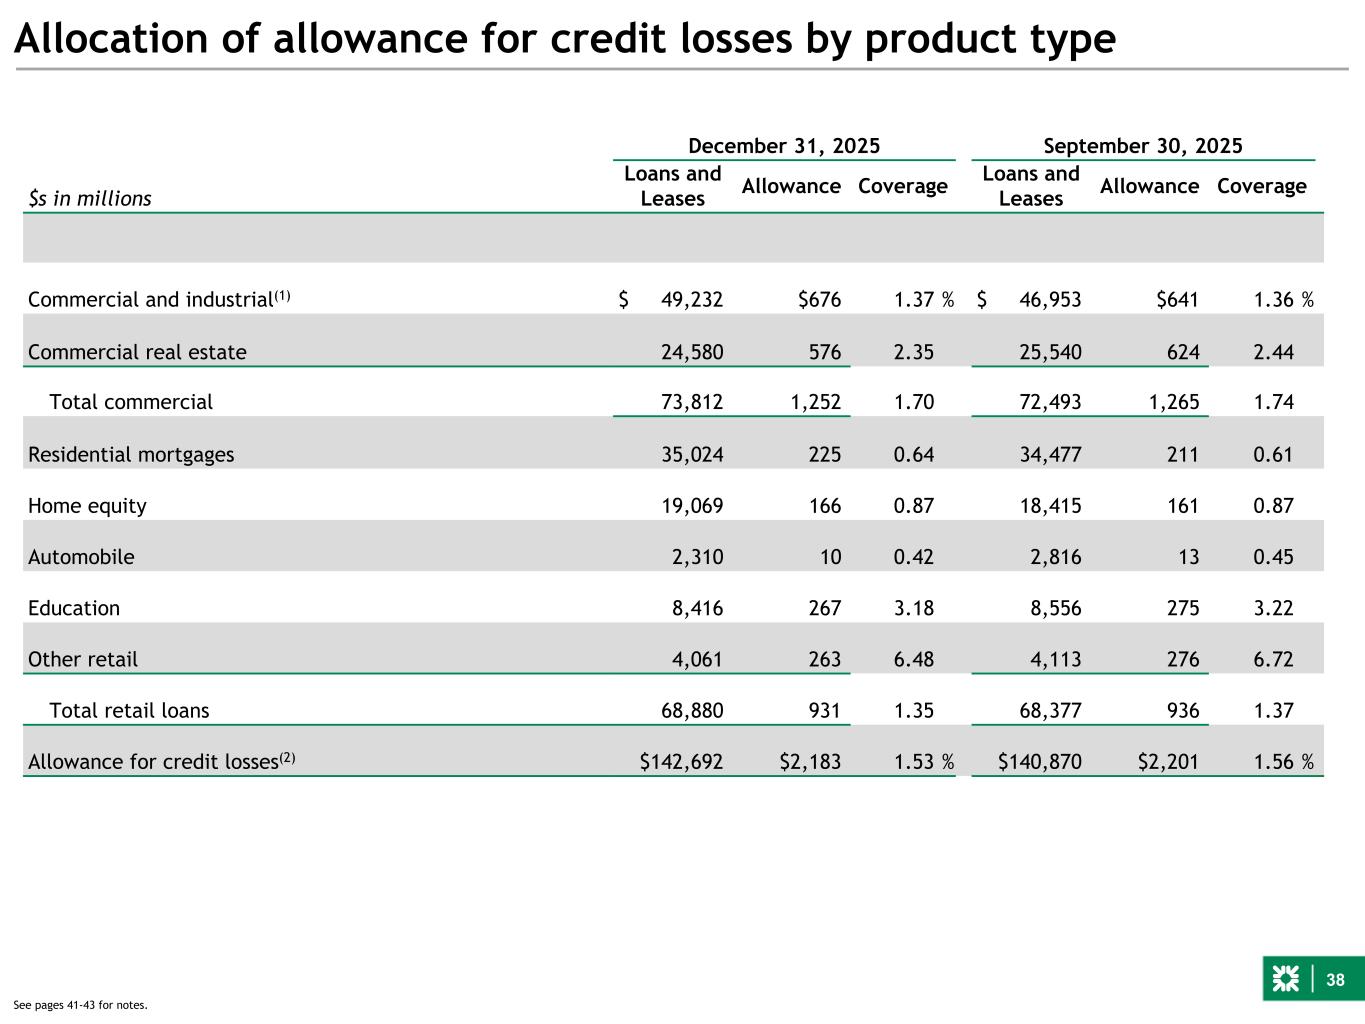
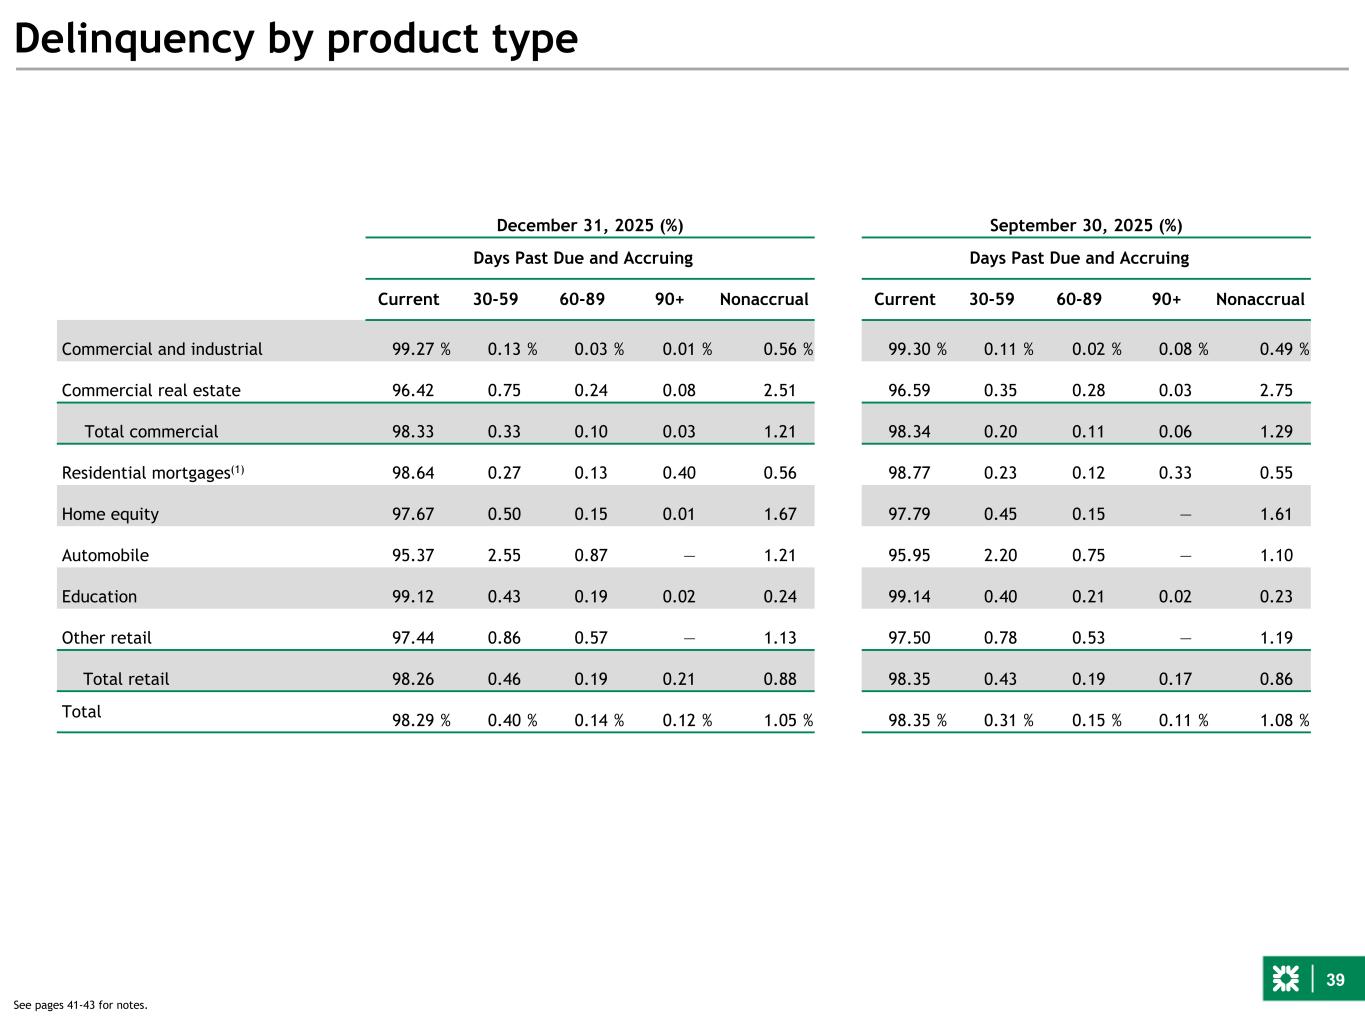
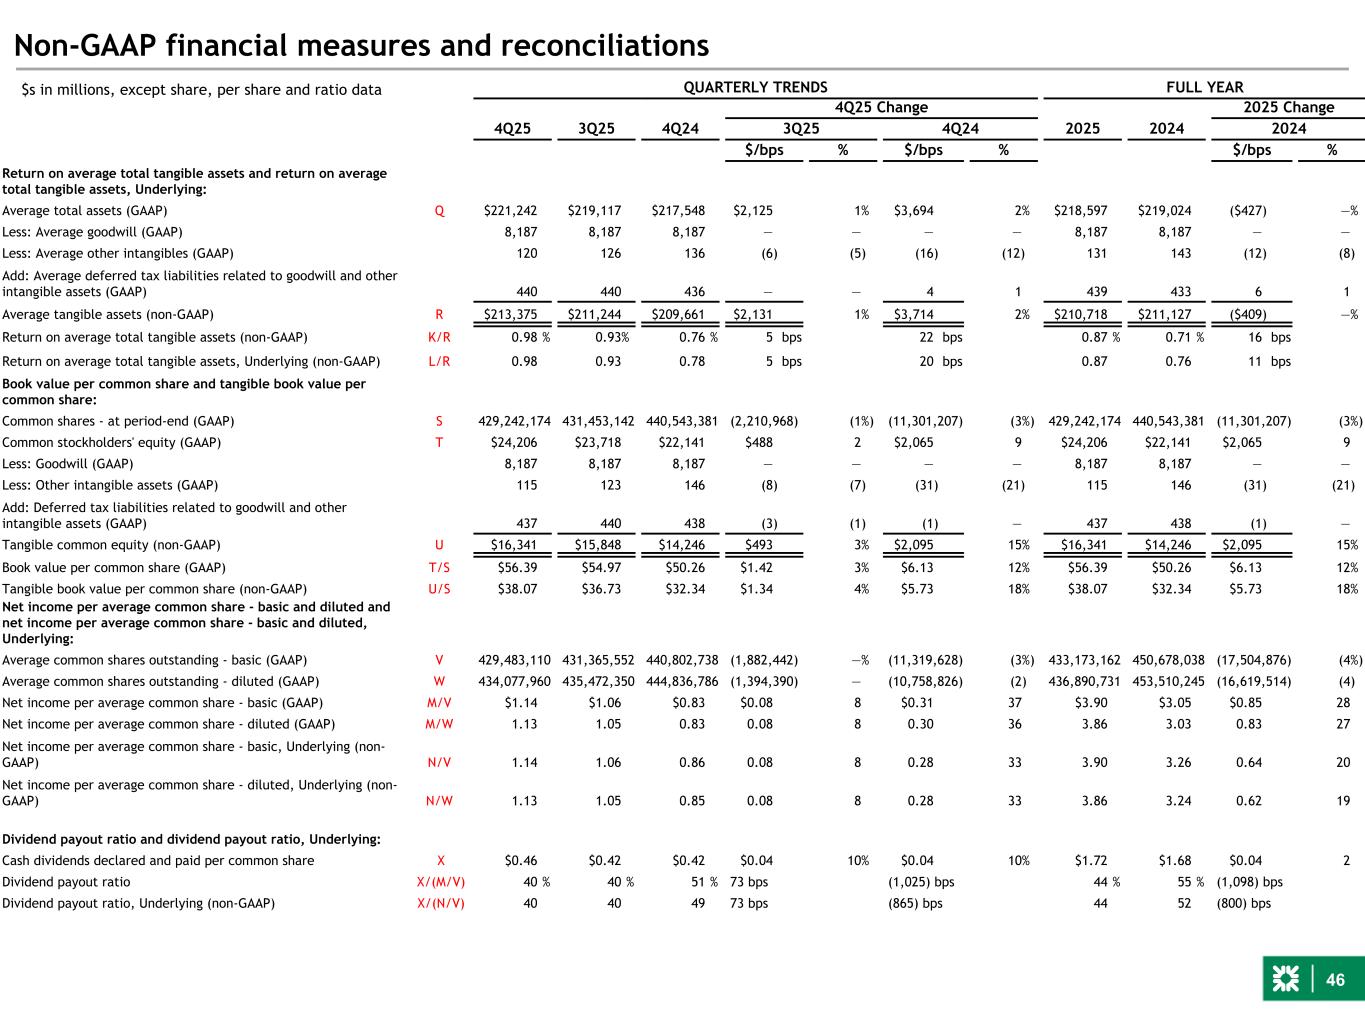
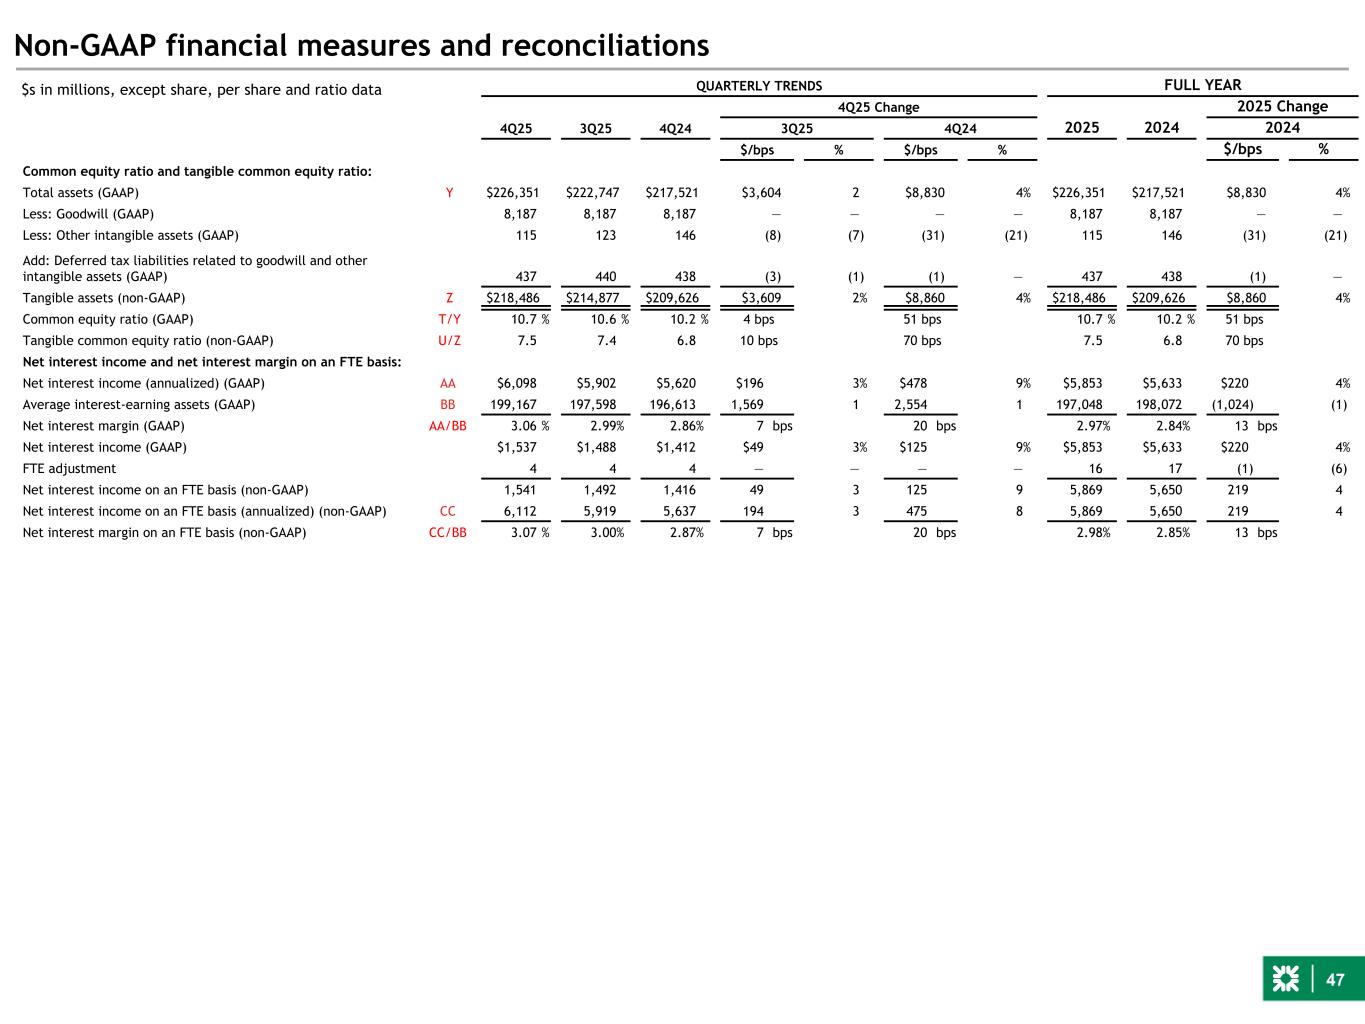
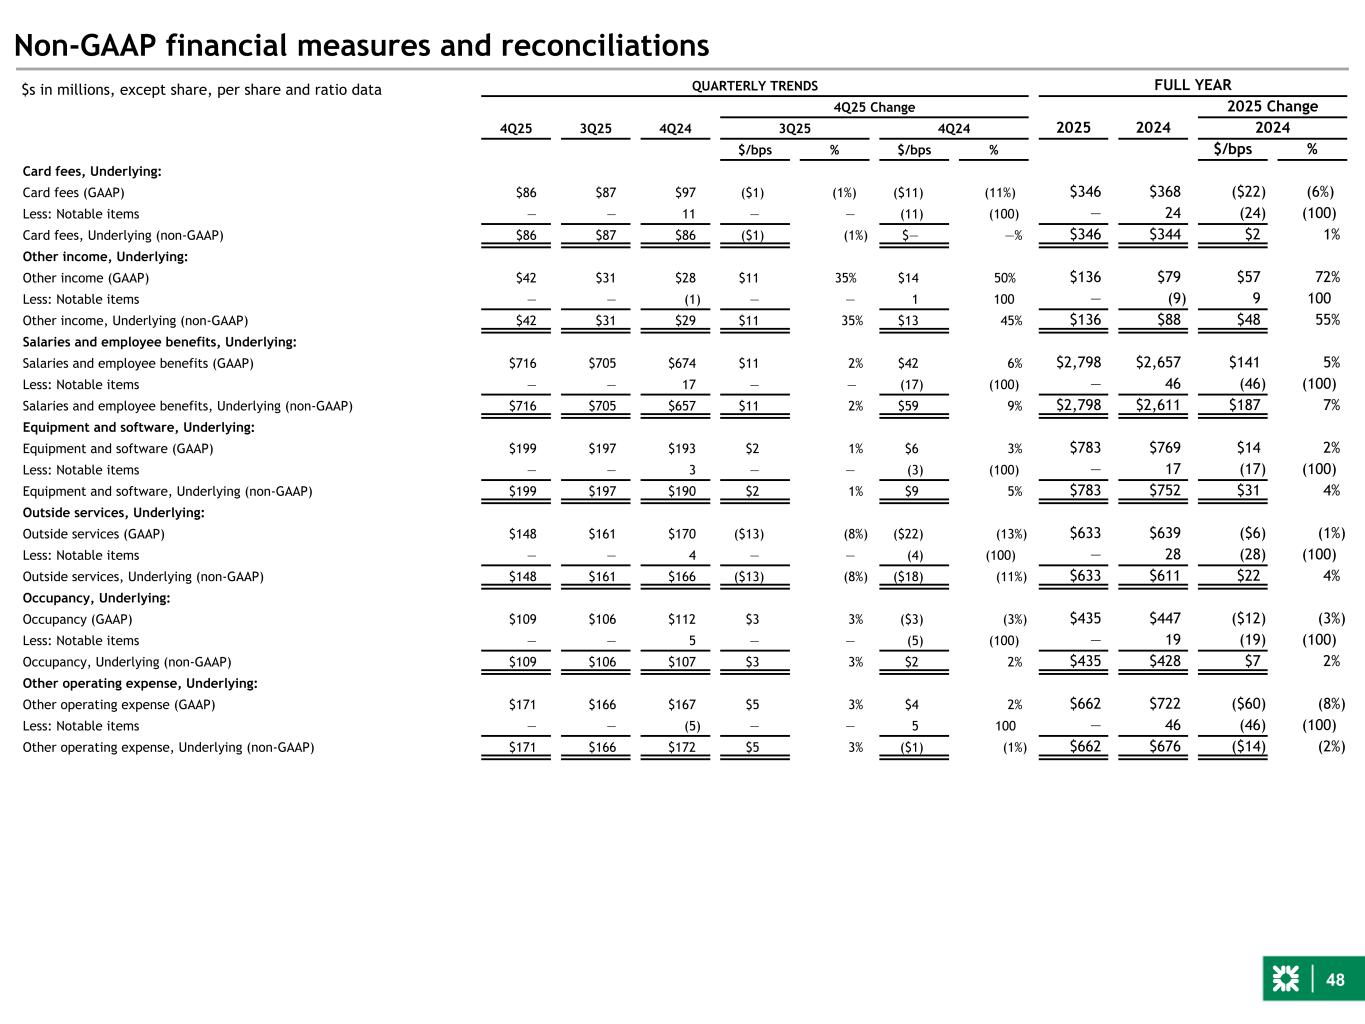
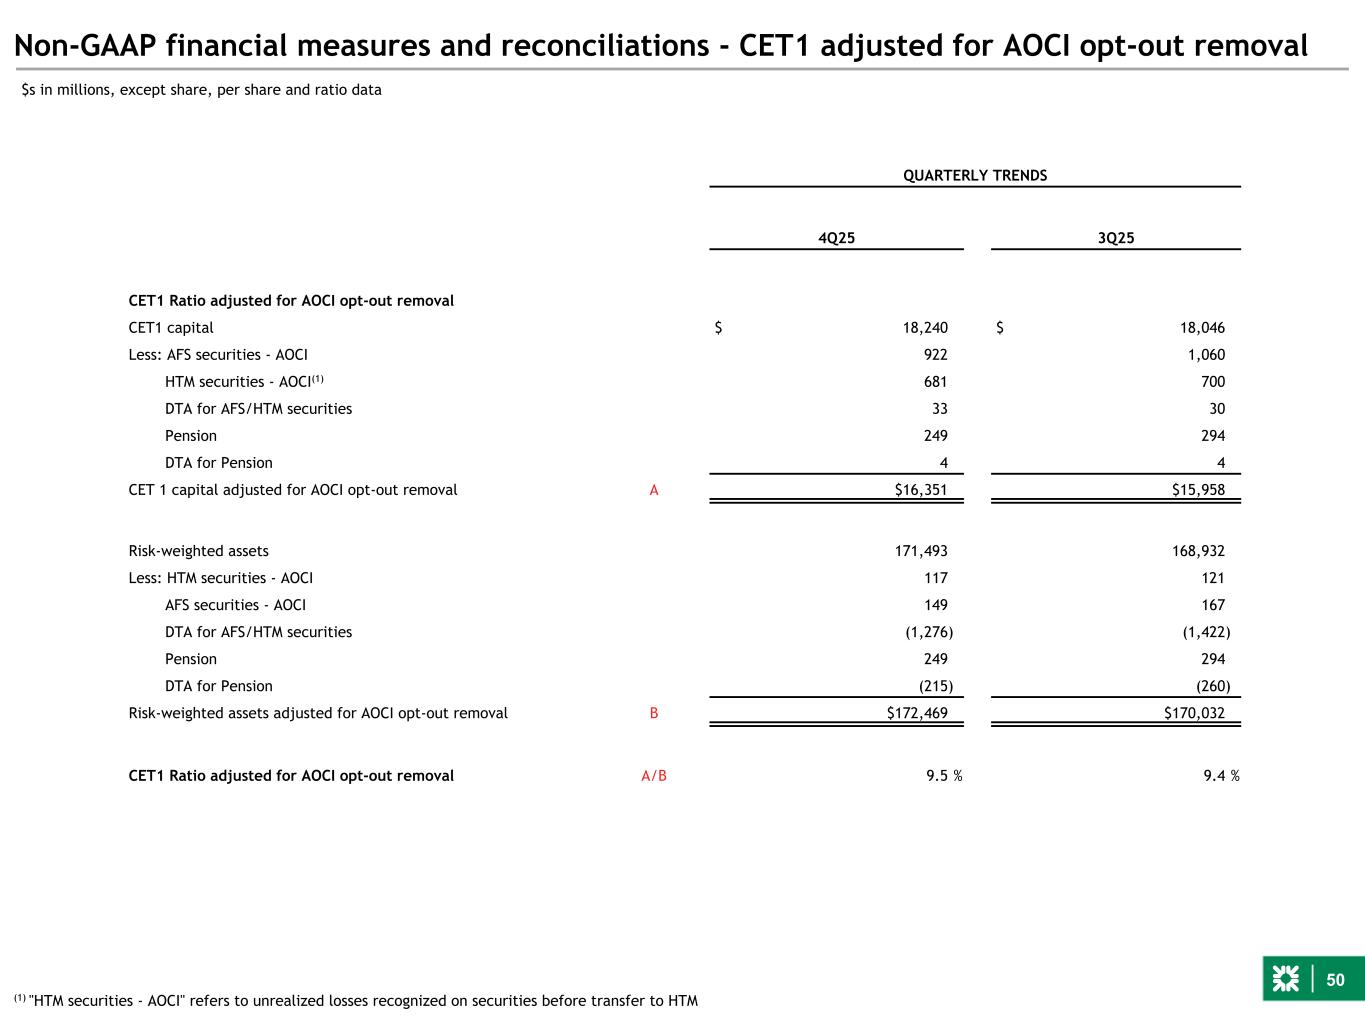
Good morning, everyone. I am excited to be part of Team Citizens and to help execute our well-planned strategy. Now, turning to our performance, as Bruce indicated, we delivered strong results in 2025 that were in line with our expectations at the beginning of the year. The fourth quarter delivered continued good performance, and we are well positioned for 2026. Referencing slides three to seven, I will provide some highlights for the full year and the fourth quarter. First, spending a moment on the full year results. We delivered EPS of $3.86 for 2025, up 19% on an underlying basis, and that includes a $0.28 or just over 7% contribution from the private bank. Importantly, we also achieved full-year positive operating leverage of approximately 125 basis points on an underlying basis. Net interest income was up 4% as we delivered 13 basis points of margin expansion. Fees were up a strong 11% on an underlying basis, led by record results in both wealth, up 22%, and capital markets, which had a nice pickup in the second half, up 9% year-over-year. Expenses were managed well, up 4.6% on an underlying basis, reflecting the continued investment in the build-out of the private bank and wealth. We also managed credit wealth, maintaining strong reserve coverage levels with credit losses coming in line with our expectations at the start of the year. We ended the year in a very strong balance sheet position, maintaining robust capital, strong liquidity levels, and a healthy credit reserve. For the fourth quarter, we generated EPS of $1.13, cents, up 8% linked quarter and 36% year-on-year, and delivered a 12.2% proxy. The private bank continues to steadily grow its earnings contribution, adding 10 cents to EPS in Q4, up 2 cents linked quarter. Now, I will talk through the fourth quarter results in more detail, starting with net interest income on slide 8. Net interest income increased 3% linked quarters, driven by a strong expansion of our net interest margin and a 1% increase in average interest earning assets. Our net interest margin continues to steadily expand, up 7 basis points this quarter to 3 or 7%. Three basis points of the margin expansion was driven by the benefits of non-core runoff and reduced impact from the terminated swaps. what we refer to as time-based benefits. The rest was a combination of fixed-rate asset repricing and lower funding costs, which was partially observed by lower asset yields. We continue to do a good job optimizing deposits in a competitive environment. Interest-bearing deposit costs were down 15 basis points, while total deposit costs were down 12 basis points. Our cumulative interest-bearing deposit beta is about 48% to the end of the year. Moving to slide 9, fees are down 2% linked quarter, but up 10% year-over-year on an underlying basis. Our wealth business delivered another record quarter driven by continued progress in the private bank and strength in the retail network. Up 5% linked quarter and 31% year-over-year. These results reflected higher advisory fees with continued positive momentum in fee-based AUM growth, including strong inflows from the conversion of private wealth liftoffs as well as market appreciation. Capital markets delivered its third best quarter ever, up 16% year-over-year, though down 16% compared with the exceptionally strong third quarter. Several M&A and equity deals were pushed into 26, given the impacts associated with the government shutdown. As a result, we expect roughly $20 million of related fees to be recognized in the first quarter. Despite deals pushing into 26, our equity underwriting performance was still up nicely linked quarter and up significantly year over year. Loan syndication fees were very strong this quarter, driven by refinance activity, and bond underwriting fees were solid, although lower than the very strong third quarter. We continued to perform well in the league tables, ranking second in the fourth quarter and fourth for the full year on both volume and number of deals for middle market sponsor loan syndications, and our deal pipeline across M&A, debt, and equity capital markets remains strong. On slide 10, expenses are up 0.6% on a sequential basis, largely reflecting continued investment in the build-out of the private bank and private wealth and higher incentive compensation. Disciplined expense management and strong revenues resulted in approximately 79 basis points of improvement in our efficiency ratio to 62 percent our top 10 program achieved 100 million dollars of pre-tax run rate benefit exiting the year and we have launched our reimagine the bank initiative which i will discuss in more detail shortly on slide 11 average and period and loans were up one percent or up two percent excluding the non-core portfolio runoff of roughly 500 million in the quarter. We saw solid loan growth across each of the businesses as non-core runoff and balance sheet optimization impacts lessens. The private bank delivered solid loan growth again this quarter with period end loans up about $1.2 billion driven by a pickup in sponsor line utilization along with growth in multifamily and residential mortgage. Commercial loans were up slightly on a spot basis, driven by net new money originations in corporate banking and higher commercial line utilization, partially offset by CRE paydowns. We continued to reduce CRE balances, which were down about 4% this quarter and 10% for the year. And retail loans saw some nice growth driven by home equity and mortgage. Next, on slides 12 and 13, we continue to do a good job on deposits with non-interest bearing balances up 2%, maintaining a steady mix at 22% of the book, even as our total spot deposits increased approximately 2% to $183 billion. Average deposits were also up 2% or $3.9 billion, driven by growth in the private bank, commercial, and retail. Private bank deposits reached $14.5 billion at the end of the year, including some larger flows towards the end of the quarter. We continue to focus on optimizing our deposit funding costs, reducing the average rate paid across all businesses, driving interest-bearing deposit costs down 15 basis points linked water. This combined with the growth in non-interest-bearing deposits helped to drive our total deposit cost down 12 basis points. And importantly, our non-interest-bearing and low-cost deposit mix increased to 43%, and our stable retail deposits are 65% of our total deposits which compares to a peer average of above 55 percent moving to credit on slide 14 credit continues to trend favorably with net charge-offs coming in at 43 basis point down from 46 basis points in the prior quarter non-accrual loans are down slightly linked quarter driven by a decrease in commercial real estate criticized balances also continue to decline Turning to the allowance for credit losses on slide 15, the allowance was down slightly to 1.53% this quarter as the portfolio mix continues to improve due to non-core runoff, the reduction in the CRE portfolio, and lower loss content front book originations across CNI and retail real estate secured. The economic forecast supporting the allowance is relatively stable with the prior quarter And as we look broadly across the portfolio, the credit outlook looks good. The general office portfolio continues to work out as expected, and we maintain a robust allowance of 10.8% coverage. Importantly, the cumulative charge-off plus the current reserve translates to a total expected lifetime loss rate of about 20% against the March 23 loan balance. And that level has been consistent with our view for the past year. Moving to slide 16, we maintained excellent balance sheet strength. Our CET1 ratio is 10.6%, and adjusting for the AOCI opt-out removal, our CET1 ratio increased to 9.5%. We returned a total of $326 million to shareholders in the fourth quarter. with $201 million in common dividends and $125 million of share repurchases. For 2025, we returned $1.4 billion, or 80% of our 2025 earnings to shareholders. We repurchased $600 million of common stock at an average price of $44.55, cents, representing about 3% of outstanding shares at the beginning of the year. Our tangible book value per share increased to $38.07, up $1.34, or 4% sequentially, with full-year growth of $5.73 per share, or 18% year-over-year. Moving to slides 17 through 20, we are well positioned to drive strong performance over the medium term with our overall focused strategy, a transformed consumer bank, the best positioned super regional commercial bank, and our aspiration to build the premier bank-owned private bank and private wealth franchise. The private bank continues to make excellent progress as you see on slides 19 and 20. We exceeded our balance sheet targets and delivered full-year earnings of $0.28, contributing a little over 7% to EPS in 2025, well ahead of our original projection of 5%. The private bank delivered strong deposit growth again this quarter, ending the year at $14.5 billion. Importantly, the overall deposit mix continues to be very attractive, with a 36% in non-interest bearing at the end of the year. We also delivered strong loan growth in the quarter, adding roughly $1 billion of loans to end the year at $7.2 billion. Since the launch of the private bank in 2023, we have added 10 wealth teams to our platform, with more in the pipeline. We ended the year with $10 billion of total client assets, reflecting the continued strong conversion rates of the wealth hires. We have more runway here, and we plan to continue adding top quality teams in key geographies. Given the investments we have made and our plans to further expand the private bank in 26, we think deposits can grow to $18 to $20 billion, loans in the range of $11 to $13 billion, and client assets $16 to $20 billion. We expect this growth will help drive an increase in private banks' earnings contribution to mid-teens in the medium term, while maintaining a 20% to 25% ROE profile. Moving to slides 21 and 22, we have launched our firm-wide Reimagine the Bank initiative. The objective is to position citizens for long-term success by embracing a host of new innovative technologies across the bank and simplifying our business model, which will reshape our customer experience and drive a meaningful improvement in productivity and efficiency. Slide 21 will give you a sense for the scope of the effort, which spans nearly every part of the bank. Slide 22 lays out our financial targets for the program. For 2026, we expect to minimize the EPS impact of one-time cost and capital investments by prioritizing initiatives with faster paybacks. There will be about $50 million of front-loaded one-time cost that will be effectively offset by $45 million of benefits to be realized later in the year. The program will drive positive net benefits in 27, that we expect will accelerate in 28 and we are targeting fully phased in pre-tax run rate benefits of approximately $450 million as we exit 2028. Roughly two-thirds of these benefits are tied to expense efficiencies, which equate to about 5% of our full year 2025 expense base. Importantly, we are confident that the financial benefits of Reimagine the Bank will be additive to the 16 to 18 percent Roxy targets we expect to achieve in the second half of 2017. Moving to slide 23, I will take you through our full year 26 outlook, which contemplates a forward curve with two 25 basis point Fed cards, one in June and other in September, ending the year with Fed funds approaching 3% to 3.25%, and a 10-year Treasury rate anchored around 4.25%. We expect NII to be up 10% to 12%, with NIM expanding about 4 to 5 basis points a quarter, towards 3.25% in 4Q26. Loan growth is expected to pick up this year, with part loans up 3% to 5%, average loans up 2.5% to 3.5%, and overall earning assets up 4% to 5%. Non-interest income is expected to be up 6% to 8%, driven primarily by wealth and capital markets. We are projecting expenses to be up 4.5% as we are confident in our revenue outlook and we plan to maintain our investments in growth initiatives. This translates to a 2026 full year operating leverage in excess of 500 basis points. We have provided a walk showing the key components of our 26 expense growth on slide 24. Credit is projected to continue to improve through the year with our outlook for net charge-offs in the mid to high 30s basis points. Along with this credit trend, the improving credit trend, the portfolio mix will also continue to improve. And finally, we expect to end the year with strong CET1 ratio of 10.5 to 10.6%. We expect to generate a substantial amount of capital, which will put us in an excellent position to push forward with our strategic priorities while returning a substantial amount of capital to shareholders. Notwithstanding anticipated strong loan growth, we expect to repurchase $700 to $850 million in shares this year. Full year 2026 earnings incorporates a nice lift from the continued growth of the private bank. On slide 25, we provide the guide for the first quarter. Note that the first quarter has seasonal impacts on revenue with lower day count impacting net interest income. Taxes on the FICA reset and compensation payouts impacting expenses. Fees are normally softer in the first quarter, but we are expecting a strong performance from capital markets after incorporating the deals that were pushed from the fourth quarter. Moving to slides 26 to 28, looking out over the medium term, we see a clear path to achieving our 16 to 18% ROCSI target in the second half of 27, with further momentum in 2028. Reimagine the bank benefits will be additive to returns. Expanding our net interest margin is a key driver, which we project to be in the range of 330 to 350 percent in 2027, along with the impact of successful execution of our strategic initiatives, improving credit performance, and delivering a strong capital return to shareholders. To wrap up, we delivered a good performance in 2025 in line with our expectations. We have a strong outlook for 2026 with significant margin expansion, good momentum in wealth as we continue to grow the private bank, and we see our shift coming in on capital markets given the capabilities that we have built over the years. All of this puts us in a very good position to hit our medium-term 16% to 18% ROCSI target in the second half of 2017. With that, I will hand it back over to Bruce.
Thanks, Inouye. And I think, operator, we're ready to open it up for Q&A.
Operator
Thank you. If you would like to ask a question, please press star 1.
Operator
To withdraw your question, press star 2. once again to ask a question please press star 1 our first question comes from Ryan Nash with Goldman Sachs your line is open good morning everyone morning you know appreciate all the details on the reimagining the bank I think you noted in the slides that this should add you know two percent on ROTC first maybe just talk about how much of this hits the bottom line versus gets reinvested and if it is reinvested what are the areas that you will invest in And then second, you know, the slide 28 says that you're not incorporating any of these benefits. Does this increase your confidence in getting to the high end, or do you think this serves more as a hedge in case other parts of the business don't perform? Thank you, and I have a follow-up.
Garner the space for that follow-up.
So, you know, I would say that at this point, the program has taken shape. And we have about 50 work streams, and it's all signed out into a transformation office and people that are running with the ball on those streams. And Brendan's kind of leading the overall effort. He can comment as well. So I think at this point we have kind of quarter-by-quarter visibility into each of those work streams and how the kind of implementation costs flow and then how the benefits start to flow. One thing you'll notice there is that over time, the kind of revenue benefits, as we'll see improved customer experience resulting in less customer attrition, better usage of our products by the customer base. And we think that's really solid in terms of our ability to forecast that. So anyway, the program has taken shape. were executing it well as to the question of you know what do we expect to flow through I think the first thing is you've got to look at the gross number excluding the implementation costs because implementation costs really are just kind of one-time capital costs in our view so the run rate will benefit by the full amount and then I think it's still a bit of an open question as to how much of that flows through. And it kind of depends on kind of where we are at that point in time and what our investment needs and priorities could be. So do we keep investing at the same pace in the private bank? And is it worth investing to keep on that trajectory and to generate more medium-term revenue growth? I think that's a TBD. So at this point, we're kind of just flagging, here's the numbers, here's what we think is possible. We have a lot of wood to chop to actually execute this program, but we'll be reporting on it all along. And then we'll have, I think, more visibility into the flow through as time goes by. If you look historically at all of our top programs, Ryan, we've had a significant flow through. And so we tend to be very disciplined on the remaining expense base. We have this mindset of continuous improvement. if we want to invest new dollars try to figure out where to pinch the expense base to self-fund that so i would i would expect that the flow through should be high but we're not going to make that call at this point we're just going to give you the contours of what the program could deliver got it um and then if i look on slide 27 you know your prior nimwalk had deposit betas in the low to mid-50s.
Operator
I think now you're saying high 40s. Maybe just talk about what is driving the change. Is it competition or a change in your strategy? And what are some of the offsets that are allowing the NIMP to still reach slightly higher levels versus the prior expectation? Thank you.
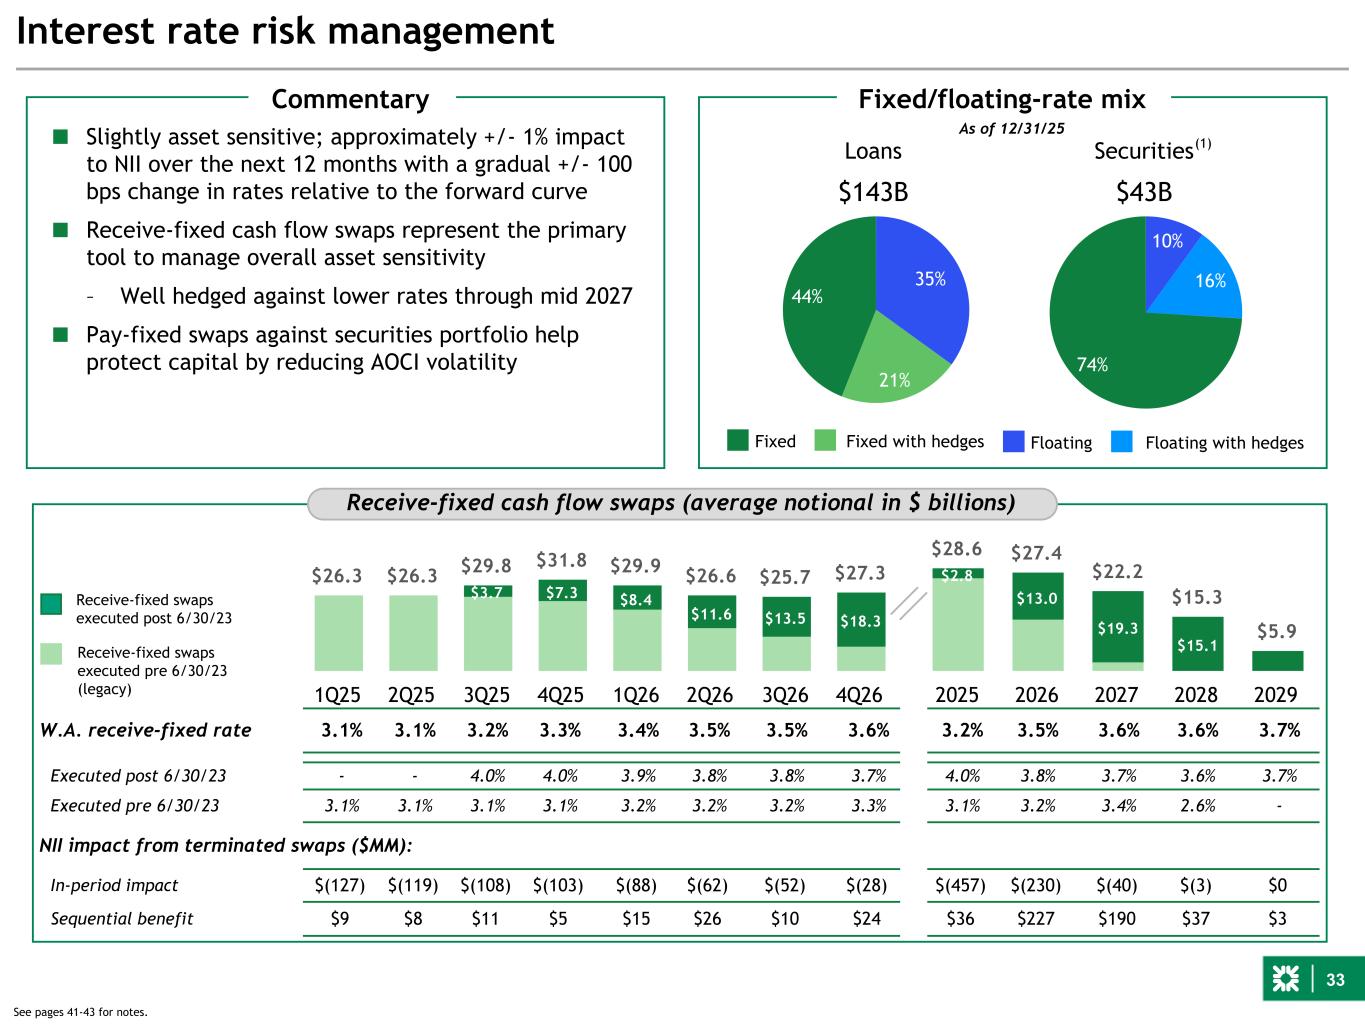
Yeah. So what I would say is that when the rates first started to fall, the market was very aggressive in trying to recoup some of what happened on the way up. And what's happened since then, I think, is that the market is kind of less aggressive in its pricing actions at this point. And so, you know, you could call that maybe a little more competition or you could just say kind of a decision to share kind of some of those benefits with the customer and not be as aggressive. And so that high 40s to us is really the market. So we're not – if we move down from low to mid-50s to high 40s, I think that's consistent with what we're seeing in the market. And the reason that I still think we're in a very good position to deliver on that NIM walk are several factors contributing to that. But one is our confidence in our net interest, our non-interest-bearing balanced growth, which has stayed robust in the private bank and in the consumer bank in particular and stable in the commercial bank. And so we, I think, score well on that dimension. You know that we're also, you know, slightly asset sensitive, and I view is that rates will come down, but maybe not as much as feared initially. So I think that is a helpful fact for us as well. And then over time, we've continued to, I think, be very disciplined in our hedging actions. and so we've been adding in hedges at attractive rates so I think it's a combination of those three things the kind of non-interest balances the higher little bit of asset sensitivity and a higher rate outlook and then addition these attractive hedging actions that we've taken would offset that beta dropping from where it was to the high 40s thanks for the colors thank you our next question comes
from Erica Najarian with UPS your line is open hi good morning just wanted to ask about the puts and takes on the loan growth guide you know it feels like a bit of a you know sort of best in class relative to peers maybe remind us Bruce in terms of where you are in your balance sheet optimization journey, and as we come to a point where rates may come down, talk to us about, you know, the push-pull in terms of optimizing CRE versus taking advantage of potential refinancing opportunities.
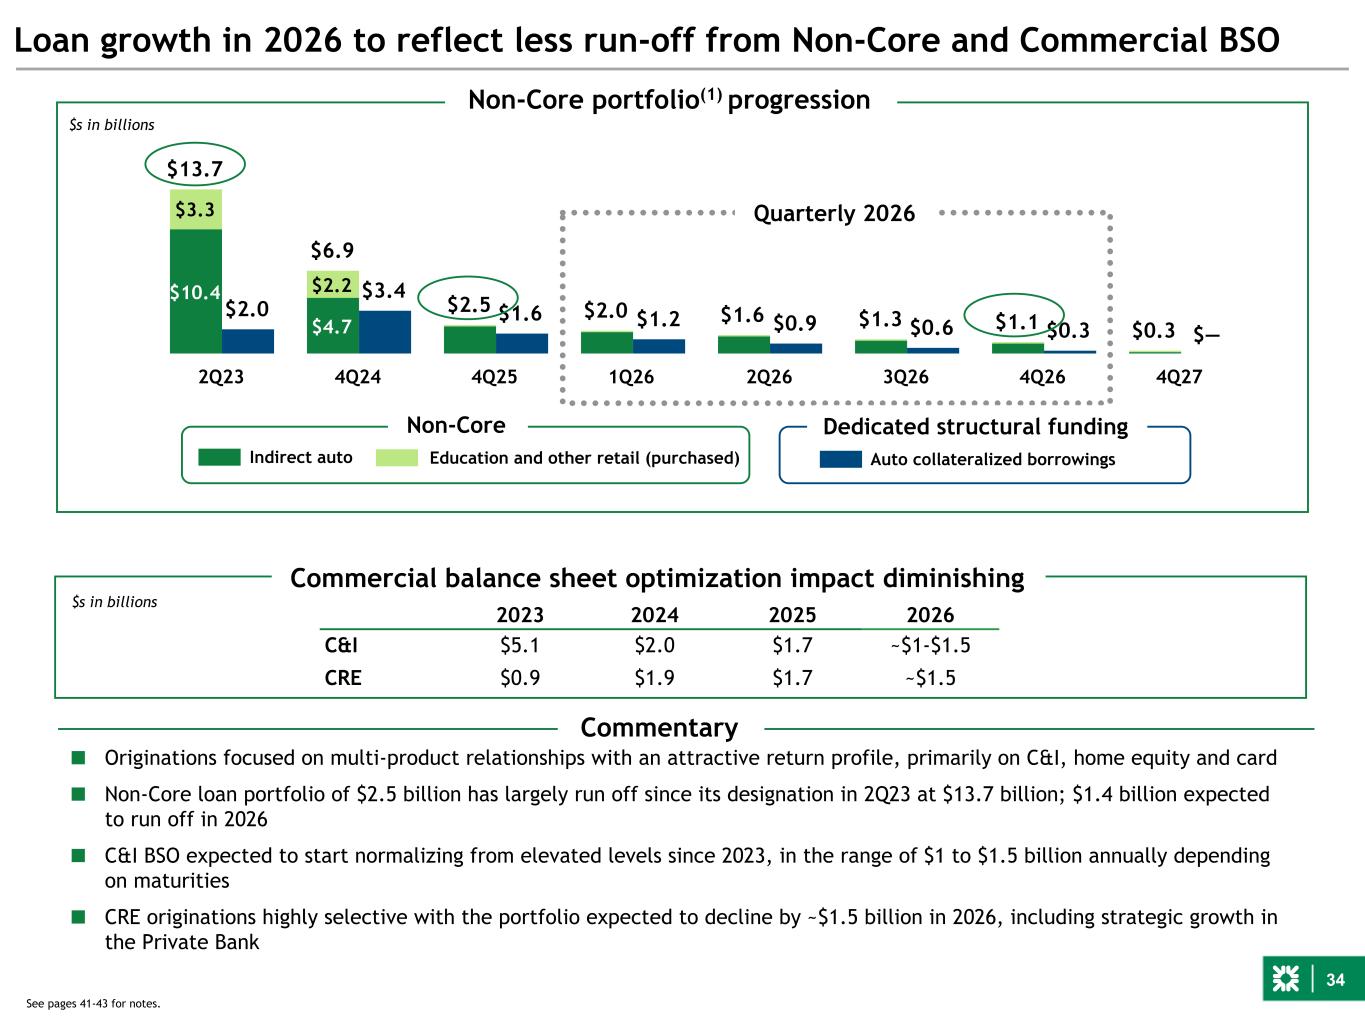
So, you know, I'd say our confidence in that loan outlook stems from actually what we're seeing and what we delivered in the second half of the year. So we have an idiosyncratic growth driver in the private bank as they scale up their business. That's something our peer banks don't have, and so that continues at a good clip. And then I think the focus of the commercial bank in terms of the middle market and our expansion markets plus some of the kind of private capital and sponsor lines also has been an area of opportunity for us. And then kind of in the consumer bank, we have the market-leading HELOC product and also mortgage. And so we've seen growth across all three of those areas in Q3 and in Q4, And we think that will continue. In kind of prior years, that growth was offset by the accelerated rundown of non-core. But now we have non-core kind of almost at a stub at this point from $14 billion down to like $2.5. And then we've done a lot of work already on the commercial BSO and on the commercial real estate kind of rundown after the investor's acquisition. And so there's a slide in the back, Erica, which you may have seen or may not have seen, but kind of lays down some of the reductions in the drag from those efforts, which also contributes to positive sentiment on loan growth. So those are the kind of big things. I'll just maybe flip it over first to Don to talk a little bit about commercial, and then Brendan to talk about the private bank and consumer.
Yeah, I'll start, Erica, by just talking about the environment. I mean, across the board, we're seeing positive sentiment from the client base. So Bruce mentioned the expansion markets, they're growing. So I think New York, California, Florida, they're growing extremely quickly. Those are core middle market relationships with full wallet realization. So not only is loan growth materializing, but we're also seeing it from an ROE standpoint, being a very attractive business. We're seeing, remember, for most of the last two or three years, the market has been really a refinancing market. I think Annoi mentioned that. We're seeing new money demand, both in our core client base, which is translating into utilization growth, and we're seeing it powerfully in the sponsor business, where the sponsors finally seem to be coming alive. And that will impact not only our capital markets businesses, but also our NBFI lending as we engage with the private capital community, both on the PE capital call lines and private capital leveraging lines. So across the board, a pretty strong environment to be operating in, and that should drive higher levels of loan growth as we look into 26 and beyond. We were probably running close to a billion dollars of C&I BSO over the last few years. That really is down to BAU. We're pretty much done with that. If it was going to be half a billion, I'd be surprised, but it will be just a continuous kind of rhythm of cleaning out under returning relationships and replacing them with new relationships. And then the change in real estate, we're going to continue to trim the real estate exposures, but we're beginning to turn on the origination engine, and that's both private bank and commercial bank. And we will be replacing some of the BSO that's happening with some attractive opportunities, you know, as we see them in the marketplace. So what was a pure drag in the past will be a little bit less of a drag in the future, although we'll continue to kind of trend that down. But BSO will become less of a drag in the overall loan growth.
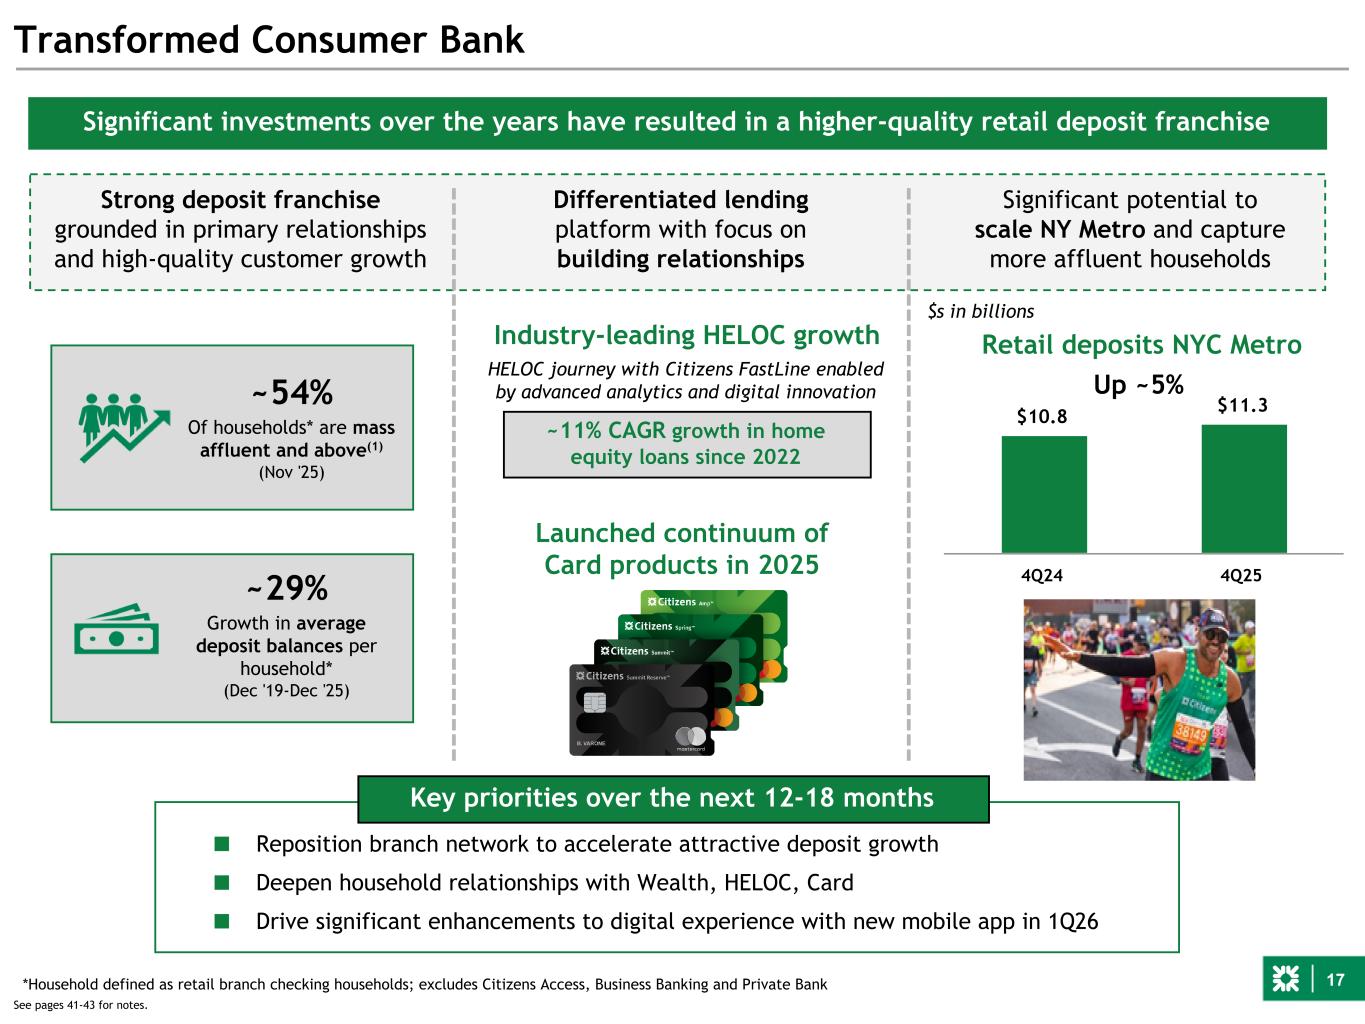
On my side, maybe three points here. One, similar to Don, the headwind on non-core is reducing. So just to give you some numbers around it, six, seven quarters ago, we were dealing with a billion, a billion one in quarter-on-quarter rundown of non-core. that exited Q4 at a half a billion, and that's going to continue to minimize as we look forward into 2026. So that's a real positive to see that wrap through the cycle. We've seen really strong growth in private banking, kind of point number two, and it's been really balanced across private equity, residential lending, and multifamily granular high-quality commercial real estate where we have access to full relationships with wealth management. One of the dynamics we were facing early in 2025 is with rates high there's a lot of cash out in the system with this client base and they were hesitant to go in and finance things with debt with rates as high as they were that is starting to change and as the rates ease a bit we expect loan growth demand to pick up in the private bank and our run rate to improve further so we've got you know confidence there that the pace of growth in the private bank will continue to accelerate as we look into 2026 and And then in consumer, as Bruce mentioned, we're getting $700 to $800 million in quarter-on-quarter growth in HELOC. We're number one in net balance sheet growth in the United States, number one in originations in the United States in HELOC, in a very high credit quality book with 95% plus of the customers coming with DDA and deep relationship-based banking. We expect that to continue. And candidly, with rates pulling back, but not so far to crater through a 5% mortgage rate, at least in the forward outlook, it's really a perfect time period for HELOC where there's not going to be a ton of mortgage refinancing activity, but huge amounts of equity built up with consumers. So we're very, very well positioned to continue to monetize the HELOC capability we've put in place. And of course, in the second half of last year, we launched a credit card portfolio, which we expect will start to pay some dividends as we get into the, you know, 2026 first half and second half with higher yielding, higher quality balances. So for all those reasons, I feel really good about continued pickup and net loan growth. The other thing I would just mention wrapping up here is it's important to look at the net loan growth number, but under the covers, there's a quality story that you need to pay attention to of the balance sheet remixing to deep relationship-based customer lending, higher yielding, higher profitability, both on the balance sheet, but also the net customers we're bringing in, moving away from single service to a really, really deep relationship-based bank. So, yeah, I think we've got confidence on winning on both dimensions, quantity plus quality.
Thank you. I'll step aside and let my peers ask questions.
Operator
Our next question comes from Manan Gosali with Morgan Stanley. Your line is open.
Hey. Good morning, all, and welcome, Manoy. I wanted to start on the fee side. Can you expand a little bit on the underlying assumptions of the fees? I mean, it feels like the private bank is doing well, capital markets are doing well, pipelines are strong. You had a survey out recently talking about M&A expanding on the middle market side. There's also been some push-out from the fourth quarter into 2026. Just given all of that, it feels like the fee guide is a little conservative. So can you help us with some of the underlying assumptions, sir?
I'll start, and others can chime in. But, you know, we had a very strong fee year in 2025. So we'll start with that. We were up 11%. And then, you know, to guide up next year, 6% to 8% is still kind of good growth on top of very strong growth that we had in 2025. I'd say the outlook for 26% is led by the capital markets, where not only do we have strong pipelines, we have several things going for us one is the carryover so we have about 20 million of fees that carries over that will close in the first quarter and then in the first half of 2025 we had kind of soft comparisons I would say because of the uncertainty in liberation day tariffs there's a lot of pent-up demand to do deals that started to flow again in the second half of the year. So again, I think capital markets should have a strong relative year. And again, who knows about the uncertainty in the tariffs? And it seems like Groundhog Day, we might be in that same movie replaying. But I think that's one of the reasons why overall, it's good to have a little bit of caution in that guide of 6% to 8%. You just don't know. But at this point, capital markets look like it'll have an extremely strong year wealth has been having record quarter after record quarter and that's a two-fold benefit it's not only kind of getting the teams in place of recruiting these lift outs and then connecting them to the private bank relationships and the corporate bank relationships which creates its own growth dynamic but then also in the branch-based system we've got great leadership there great products that we're really hitting our stride so i think wealth would be the other shining star. Across the rest of the patch, we don't see significant growth in many of the other areas, like service charges on deposit accounts, mortgage. Our other income was flattered. We had the moon and the stars aligned for a couple quarters that might not repeat in 2026. I think just having a level of conservatism there seems like the way to play it.
Very helpful. And then maybe pivoting over to the capital side, it looks like your buyback guide is a little more front-end loaded. And then you spoke about the fact that you're hopeful that the SED will come down this year. I guess the question is, how important is the stress test in terms of your comfort level in bringing the CET1 ratio closer to your medium-term targets of like 10% to 10.5%? How quickly can you do that, and where would getting into that range put you in terms of buybacks as you get into the back half of the year?
Sure. Again, I'll take this one. I've been living it on this SCB frustration for years. But, you know, we are reasonably optimistic that there's some changes afoot down in Washington with the Fed. And so based on what we know, we think we'll get a better outcome. It remains to be seen the timing of that implementation. But to me, it's less of an impact directly on where we set our capital targets. It's just been almost a scarlet letter that we have this outsized SCB when our business model is the same as most of our peers. And it just has been mismodeled. And I won't get into all of it, but we've made those points clear to the new folks that are going to be in charge of the stress test. So in any case, just falling back into the pack is good for us reputationally, even if it doesn't affect exactly how we're going to manage the capital. I would say the reason that we're still on the high end of that 10 to 10.5 range is just still the amount of uncertainty that's in the environment. We have an upsurge in our profitability projected, but making sure that we get there and that we get the CRE worked out when we feel the environment is in a better place and we've accomplished some of those aspects, then I think we could be in a position to start to migrate down within that range. But anyway, that's how we think about it.
Operator
Our next question comes from John Pankeri with Evercore ISI. Your line is open.
Hi, this is Gerard Sweeney on for John. Just want to revisit the private bank build out specifically. In that 11 to 13 billion private bank related loans in 2026, can you break down what loan categories within the private bank you're seeing growth and you put some takes there?
And then longer term, how should we think about the loan to deposit ratio trending in the private bank? thank you yes Brenda I can take that it's it's pretty balanced growth so about a third of it I'd say is coming from CNI private equity based lending we have yeah about half of the balance sheet is I'd say residential residential and real estate so mortgage and granular multifamily commercial real estate as I mentioned before tied into deep wealth management based clients and then And there's a smaller portion in sort of other consumers. So our HELOC capabilities are making their way over to these clients, some small credit cards, some specialty unsecured lending loans in the private banking portfolio, the PLP partner loans that we're leveraging to convert our private equity community into personal private banking relationships. So it's pretty broad-based, but the largest categories are C&I, granular, multifamily, CREE, and residential lending mortgage. We expect that to continue as rates to pull back. The traditional personal private banking should pick up. That's, again, the portfolio will benefit from HELOC and continued residential lending. And as our card portfolio picks up, we have optimism that that can be a more meaningful player in the private bank over time.
Yeah, I would just add to that that, you know, we've been in business now for a couple of years. We haven't had one – I'm going to touch wood here when I say this – we haven't had $1 of credit losses, and that historically was the track record of these bankers when they operated on the First Republic platform. So very strong credit discipline, very deep relationships lending to people that we know well and getting good credit results.
You asked about the LDR, too. Sorry, I didn't answer that. Our 25% ROE is certainly benefiting from a little bit wider loan-to-deposit ratio than we probably would expect in a steady state. But you can also see in our guide, we don't expect dramatic, meaningful changes in the short term. We're going to expect pretty balanced growth across deposits and lending. So we expect a self-funding mechanism here where not only is the LDR led with deposits, but the lendable deposits also fully self-fund the loan growth that we're getting. Having said that, over the medium-term outlook, I would expect the LDR to tighten, maybe from in the 60s where we are today into the 80% range potentially.
But if rates pull back, right now we still think it will be in this range of 60% to 70%. for the next you know year to six quarters thank you very helpful our next question comes from matt o'connor with deutsche bank your line is open uh good morning um a bit of a follow-up to uh some comments you just made i want to ask about the uh deposit growth assumption um i found it interesting i think it's what's driving the higher net ii outlook but your earning asset growth is actually a bit above the long growth on slide 23 so just trying to get a sense of deposit growth
assumptions and obviously give us a private bank which is the one piece but just the overall assumptions there and the confidence in that level yeah well we don't have a deposit guide here but I think the expectation Matt is that the LDR will stay relatively stable over the course of the year so we brought it down you may recall we were operating back in 23 kind of in the high 80s and we brought it down in 24 into the low 80s and we now have it down into the high 70s which is a place that I think we can sustain that and feel good about kind of the liquidity position there and you know so so that's that's kind of the overall forecast I don't know annoy if Do you want to add anything to that?
Yeah, I think it was the only other thing to add would be probably lower on interest-bearing deposit growth has been very steady as well, both coming from the private bank and as well as the consumer bank. We expect that 22% to be in the zone as we go through.
Two points I'd add on the non-interest-bearing would be what we've gone through a period post-COVID three years of consistent headwinds on spending out the excess surplus. 2025 was a year of that kind of running its course and flattening out. we started to see some very modest DDA growth in most benchmarks in the consumer bank. We were number one in our peer set on relative DDA performance versus peer banks. We expect that relative position to continue and move from a flattening to starting to see some very modest DDA growth. And then the private bank, you can see our DDA percentage in the high 30s, but it's important to also look at checking with interest. The entirety of the personal banking deposits in the private bank are in checking with interest, which is de minimis interest, when you add that in, our actual low-cost mix is in the mid-40s. And we expect that range to continue, the combination of DDA plus checking with interest. So healthy, healthy growth in the private bank in non-interest bearing or low interest bearing and continued number one performance or top quartile performance in the consumer bank on relative DDA.
And then just on the interest earning asset growth, it's kind of 1% to 2% of both loan growth and maybe deposit growth. Anything else driving that? You know, I think we've seen more banks point to kind of less earning asset growth and loan growth and yours is the opposite. So I was just wondering if there's something else kind of driving that. I think you've expanded your swap business for customers. So I don't know if there's something with trading assets or or a rethinking of how you hedge the balance?
I would say, you know, the spot loans is three to five and earning assets kind of four to five. So there may be a little build in liquidity we may be adding to the securities books. Part of that is looking at the lendable deposits and kind of what we see is growth in the private bank deposits, which have a little lower lendability than the consumer deposits do. And so it's really probably just a little mix in where we're building a bit of our liquidity to go match what we're doing in terms of the deposit composition growth.
Okay. All right. Thank you.
Operator
Our next question comes from Ibram Poonawalla with Bank of America. Your line is open.
Hey, good morning. I guess just a couple of quick follow-ups. As we think about the 16% to 18% return Roth C exiting 27, it implies the margin probably being somewhere between around that 340 to 350, am I thinking about that correctly?
Yes, I would say think of that in that zone, yep.
And then beyond that, as we think about the new growth that's coming on the balance sheet, On slide 19 for private banks, you call out the 4.1% spread on that growth. I'm just wondering if you had to have a similar number for the entire balance sheet in terms of growth, where would you say that new growth is coming? Is it close to 4%, close to 3%? I would love any color there.
Yeah, that's an interesting question. I guess I would say the spread in the private bank and the consumer bank are relatively higher. The spread in commercial is relatively lower. Commercial, you're extending credit to build relationships and do the cross-sell to your fee-based complex. So that's a little bit of the dynamics there.
Got it. And just one more, Bruce, on the private bank, seven offices, four more to go. So why is that number not larger, like is there only so much that you can do from a management bandwidth standpoint, or do you think once you have these 10 to 15 private bank offices, you've saturated the opportunity?
Well, I'll start and flip it to Brendan, but you know, I'd say from a bandwidth standpoint, you want to make sure that these offices are really premium locations and premium fit out and premium high-quality people as staffing them and so we've done a lot and we have another big agenda for this year but we're certainly not done when you get to exhaust the list that we have in front of us for 27 we have a couple more in the pipeline that are straddling between 26 and 27 and then we have densification of some of our East Coast locations in Florida still in front of us when we look out into 27. So I think ultimately you could see this number get up to something like 25 or 30 when we've kind of reached maturity with the private banking locations that we have before we would think about potentially other geographic expansion. But Brendan, I'll flip it to you.
Yeah, our confidence is clearly increasing every quarter that gets behind us on our ability to drive sustainable growth and high quality. But if you kind of rewind the clock back to, you know, four quarters ago, we were very committed to make sure we deliver the profitability profile that we shared with you all before we got too far out over our skis. So we've been very thoughtful in terms of where to put these locations. It's a very connected business model. I call it first floor, second floor. First floor being kind of retail banking for private banking, customer second floor being senior RMs and wealth teams that are not necessarily working the retail branch, but they're bringing in clients. We've got to grow that in a connected way. And we're keeping a very, very high bar on quality. We don't want to grow so fast that we compromise on having a best-in-market team. So we've got aspirations for more sites. We'll continue to add them as we get the right teams, as we get the right locations. We're starting to think about geographic expansion. We also have to think about filling in the rest of our citizens' footprint. You've got plenty of markets that we have high net worth individuals in today where we don't yet offer the full private banking package. And so in addition to adding more sites, you may see a handful of very targeted either conversions or dual branded sites with retail and private banking coming online where we can offer the full service of the bank the full one citizens in the same market so with commercial partnering as well so a lot to do we expect a steady diet of continued openings and opportunistically refined talent in good locations will will upsize our ambition that's good thank you okay our next question comes from david chivarini with jeffries your line is open Hi, thanks for taking the question.
So I wanted to ask about the efficiency ratio outlook. It looks, you know, very strong, mid-50s, medium term versus the 62% in the fourth quarter. Can you talk about what could drive the high end versus the low end of the mid-50s outlook?
Well, there's a couple dynamics here that right off the bat, if you overlay the kind of termination of these swaps and look at some of the built-in kind of active swaps and fixed asset repricing that we think is pretty assured you can get from 62 into the high 50s and if you overlay the RTB that can further take you down into the mid 50s and then all along we're trying to run with positive operating leverage even if you strip out the benefit of the NIM expansion so So those are really the three things that are kind of driving you back down to something in the mid-50s. So I think it's a very realistic target.
Thanks for that. And my follow-up is on AI. You've been front-footed on AI versus some of your peers. Can you talk about your AI spend and some of the use cases you're seeing?
Our AI spend has, I would call it backwards looking in 2025, has been a combination of very small targeted pilots and learnings and building the right control infrastructure to get ourselves ready for this, including moving completely to the cloud in 2025 and big investments in data. So to actually take the AI capabilities and commercialize it, a lot of foundational things need to be true. So some of this happened in 2025. Candidly, some of this started back in 2020, 2021, where we're really getting some bigger investments in broadening our data capabilities, modernizing the tech stack to put us in a position for this. So enabling investments has been high, very specific kind of last mile. AI investments, I think, have been relatively modest. But as we turn the page to 2026, the dial turns a little bit. So a couple of the use cases, of course, we highlight them on page, I guess it's 21 in the deck, and you can look at that, but I'll maybe highlight two or three of them. The call center, as an example, we think that the combination of modernizing the tech stack for the call center front to back plus introducing voice AI and other mechanisms, we can get in the range over the medium-term outlook 50% of our call center calls out of a human answering them. That is something we're very excited about. It's not hopes and dreams. We've seen this in development and in action in smaller firms, banks and otherwise. So we're leaning in heavily there. Technology development, accelerating productivity of an engineer is a use case that we also have high confidence in, that through leveraging AI, we can have, you know, a 5 to 10x of productivity with our engineers, that the AI is taking the first crack at writing the code where developers are now QA, QC-ing the code, adding the last mile, and then ultimately having the AI also work on the first round of testing and quality assurance of the code. And then maybe lastly are just analytics, fraud, credit risk. These are tried and true AI use cases that with, particularly in the consumer bank relative to fraud and credit analytics where you're underwriting and decisioning on a cohort basis, leveraging AI to re-engineer front tobacco. We think about credit analytics, portfolio monitoring, fraud detection, model enhancement. These are all very real use cases that are practical in our sites, and we've got reasonable confidence that we can go at them. So you'll start to see in the Reimagine the Bank effort, there's an overlay of tech spend in addition to our run rate tech spend we're spending on the franchise that will be principally pointed at AI deployment for re-imagine the bank. So we're carving out a meaningful chunk of overlay for tech spend that will wind up in our depreciation line over time, which is incorporated in our guide relative to the net benefits of re-imagine the bank.
Operator
Our next question comes from Gerard Cassidy with RBC. Your line is open.
But, Bruce, since going public, you've done a very good job of delivering on growing this organization that you head up, and clearly you've done it in this wealth management area most recently, the private bank. Can you guys share with us the growth that you're planning for this year, the $16 to $20 billion of client assets? That's how much is that, excuse me, coming from, you know, existing customers of their portfolios versus just new customers coming in with, you know, you're going to maybe hire more teams. And then I don't know if you can parse, how much of a benefit has this three-year bull market been on this business?
Yeah, I'm going to flip this to Brendan quickly. But what I would say is that what you're seeing on that private bank slide is simply the growth of $6 to $10 billion in kind of this kind of lift-out venue that's serving their private bank partners. And, you know, some of that comes from the continued acquisition of new teams. But the majority is going to come from just the kind of people that are on the platform kind of getting their full book converted in and then growing as they start to serve the private bank and private wealth. So that's part of the story. Beyond that, not shown on this page, we have our branch-based business that is going exceptionally well. And then we have Klarfeld, which was a legacy RIA that we acquired, which is working closely with the private bank at this point. But when you add that all together, the kind of AUM kind of assets that we have, what we refer to as client assets, which includes transactional balances, is about $60 billion. And the kind of core AUM of that is about half of that. And so that now is a number that's growing very nicely across kind of all those three sectors. So we have the private bank growing. We're finding an ability to rejuvenate Klarfeld growth. And then the branch business is running very, very nicely and achieving strong growth. So we're excited that that wealth fee line can continue to hit new records kind of quarter after quarter, as it did in 2025. five. Brendan, you can provide more color.
Yeah, sounds good. On the privates, I'll unpack both of them very quickly. On the private banking side, you just want strategic point to make. It's hard to totally separate the adding of new talent from the referrals coming from the banking teams that we hired because you need them both in place for either of them to happen. And once you get the new talent in, it is true that 80 to 90 percent of their previous book will follow them over. And we have seen that. We've actually seen better performance than that on most of our teams that we've lifted out. But they also have new productivity, they're bringing in their own clients on the wealth side, but then they're referring them back to the bank. So this is a bi-directional referral model. On the banking side, we have seen an acceleration of referrals as we've got high-quality wealth teams on through 2025. We expect that to continue into 2026 at a healthy clip. So as the business gets more granular, as we convert some of the business banking clients into personal banking, have the right wealth teams. We expect a continued acceleration of new business flow coming from that into these new wealth teams. And we expect, you know, we've been doing one to two teams a quarter of new liftouts. I would expect us to be in that range over the course of 2026 as well. So a supplement of accelerating referrals, adding new teams, new teams bringing their back books, plus new teams bringing new business and hitting the market hard. On the mass affluent front, But about 55% of our fee income, or our AUM, I should say, is actually in the branch-based business, and about 60% of our fee income is from the mass affluent business. So that business grew in 2025 by 15% on the AUM side and 25% on the fee income side. And the effective rate of revenue on the mass affluent business is roughly twice of that of the private bank. So you're getting significant profitability jaws by growing that business as well. We had record referrals coming from our retail bank. We've had an overhaul of talent in our advisors that sit in the branches. We've grown that advisor base by about 50 advisors in 2025. We expect that to continue. So we're seeing sort of all boats rise with a rising tide. The wealth brand that we're building and the capabilities that we're building are coming through in all the client segments. segments. We're getting a real strong uptick from Don's business as the commercial team has more confidence in the teams that we bring on. Your comment about the bull market, it is true. Bull market helps. Market betas help. About a third of our private banking revenue uplift was driven by market betas. But you can't capture that market beta unless you acquire the customers to begin with. So there's a bit of a virtuous circle here that's happening here as we're getting outsized new customer growth, outsized talent growth, and catching the market beta as it moves from whatever firm they exited over to Citizen. So we feel really pleased with where we're at, and we expect continued positive momentum across all sectors. Do you have another question, Gerard?
Yeah, as a follow-up, taking a step back, Bruce, for a second, obviously you've grown the company and you've painted a very strong organic growth picture for this year, but you've grown successfully through timely acquisitions whether it was investors in 2022 of the HSBC branches as well as JMP when you cut it with the regulatory environment being very supportive of consolidation can you give us your big picture view of how you think shaping up in opportunities for citizens over the next couple years yeah I'd say and I said this in my opening prepared remarks that right now we have such great organic growth opportunities that that's our focus and so
we're not going to run out and knee jerk up the windows open it might close we should try to hunt around and find a deal to do I think the better course of action here is make sure that you know the private bank stays on its trajectory and we really make that a sustainable great business that in effect was our acquisition when you look at the accretion that's coming from it We took a risk and spent some startup capital, and it's working out spectacularly well. And then reimagined the bank is another big effort that is involving many of our top talent across the bank to make that work. And so just from a pure bandwidth standpoint, we want to make sure that these things are hardening and maturing and on their way to success before we kind of step back and think about anything that would be inorganic. There might still be opportunities to do kind of some of the little kind of business line ads that we've done in the past, such as an M&A boutique. We have these lift outs that we're doing, but that's pretty much where our focus will be this year.
Operator
Our next question comes from Chris McGrady with KBW. Your line is open.
Oh, great. Thanks for having me in. The 16% to 18% back half of next year's ROE guide, looking at our numbers of consensus, we call it a little bit closer to 15%. I hear you on the SCB, that maybe gets you to 50 basis points, and the combination of revenues, credit expenses, probably gets you to the low end. Interested in kind of a gut check on our math and also, you know, to get firmly into the range, is it about the expense growth rate from reimagining the bank moderating, or is it something else?
No, I'd say, again, we think we can get into that low end of that range kind of by the end of the year. It's not a full-year forecast for 27, just to be clear. And then when we look out to the next year in 28, that's when we can fully deliver that. So we're on the journey. We think, you know, we made some strides this year. I think the acceleration, again, you know, do the math on what the EPS growth is, and it's very significant based on this guide. That'll make another big step forward in 26 in that ROTC performance. And then we tend to peak in the fourth quarter of every year. It tends to be a very seasonally high year. So just like this year, we were above the year average with a 12-2 exit rate in 26. We'll end up – the fourth quarter will be a higher number than our year average, and then 27, kind of the same thing. So we see a path to getting there, and I think it's really just driving these initiatives, having the NIM continue to expand everything that we put in our guide.
Great. And then just a quick follow-up on reserves. I hear you on the moderating credit costs. If you compare the reserves adjusted for the balance sheet optimization, I guess where are we relative to CECL Daywon?
Yeah, there's a number of things. We had the non-core rundown. We had some loan sales within student, and then we did the investor's acquisition. So like there's a whole series and then a lot of BSO, but I think, Anoyi, correct me me if I'm wrong, I think it's about 110-ish, would be the CECL Day 1. So it actually was one mid-40s, 45 or so, the original CECL Day 1. But the things that we talk about is really having a very disciplined risk appetite and continuing to improve the overall credit risk profile. We've brought that 145 back down to about 110. And so to have to be in the low 150s at this point still shows a fair amount of conservatism and a very healthy level of reserves. Great.
Very helpful. Thanks, Bruce.
Operator
Our last question comes from Ken Usden with Autonomous Research. Your line is open.
I apologize for just one quick one. Just bringing everything together on the private bank, you guys continue to point out slide 24, the impact of the private bank on overall expense growth. So, you know, 1.8 percent of the four and a half-ish this year. To your points about where growth is and where growth comes from, do we get through this year and get to kind of a lower natural growth incremental rate from the private bank? Or do you just kind of see what the opportunity set is as you look further out and potentially then move that to other potential investments?
I think there's still more build, you know, for the private bank. And the other thing I would say, Ken, is not only do we have a very robust total revenue growth outlook for 26, we have a similarly robust outlook for 27. So when you think about if you're growing your top line around 10% and you grow your expenses at, you know, four and a half, You're delivering massive positive operating leverage, and the good news there is these are very prudent, targeted investments in terms of building a great private banking franchise, continuing to strengthen and invest in the commercial bank in these expansion markets and how we're covering private capital. And so, you know, that seems appropriate to us, that we can kind of have our cake and eat it, too, as long as this really strong revenue outlook continues and you can deliver big positive operating leverage, big growth in EPS every year, big improvement in ROTC, and you're not shorting the pot and playing small ball. You're actually continuing to think about ways to grow your business and grow your franchises so that you have a medium term that continues to have a very positive outlook, so that's how we think about it.
All right. I think that's all the questions that we have in the queue, so thanks for dialing in today. We really appreciate your interest and your support. Go out and have a great day.
Operator
Thank you for your participation. Participants, you may disconnect at this time.