Operator
Hello, and welcome to Columbia Banking System's first quarter 2026 Earnings Conference Call. At this time, all participants are in a listen-only mode. After the speaker's presentation, there will be a question and answer session. To ask a question during the session, you will need to press star 11 on your telephone. You will then hear an automated message advising your hand is raised. To withdraw your question, please press star 11 again. Please be advised that today's conference is being recorded. I would now like to turn the conference over to Jackie Bolin, Investor Relations Director, to begin the call. You may begin.
Thank you, Deedee. Good afternoon, everyone. Thank you for joining us as we review our first quarter results. The earnings release and corresponding presentation are available on our website at columbiabankingsystem.com. During today's call, we will make forward-looking statements which are subject to risks and uncertainties and are intended to be covered by the safe harbor provisions of the Federal Securities Law. For a list of factors that may cause actual results to differ materially from expectations, please refer to the disclosures contained within our SEC filings. We will also reference non-GAAP financial measures, and I encourage you to review the non-GAAP reconciliations provided in our earnings materials. We'll now hand the call over to Columbia's Chair, Chief Executive Officer, and President Clint Stein.
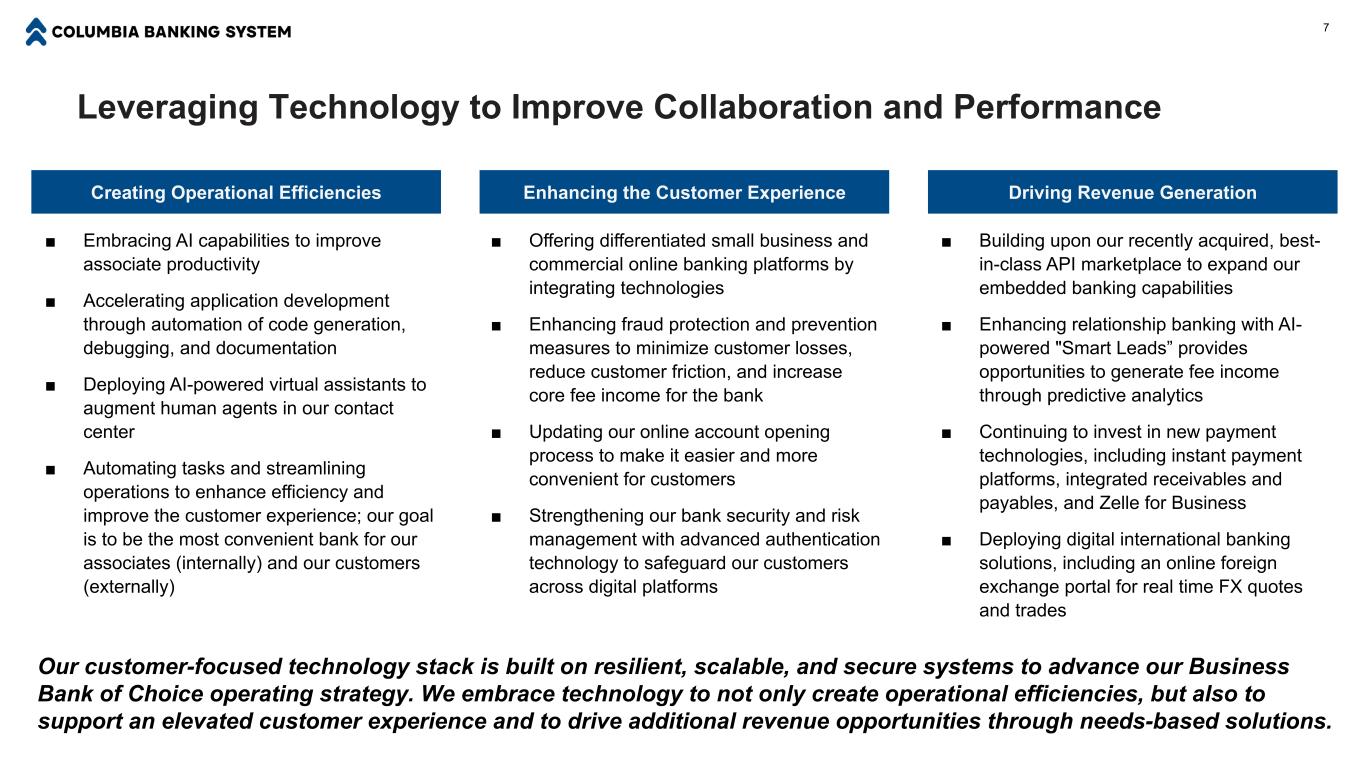
Thank you, Jackie. Good afternoon, everyone. Our first quarter results reflected continued execution against the same core priorities we have previously outlined, delivering consistent, repeatable results, optimizing our balance sheet, and returning excess capital to shareholders. We also completed the PAC Premier Systems conversion and consolidated nine branches during the quarter, putting us on track for full realization of all acquisition-related cost savings by the end of this quarter. I want to thank our highly experienced team of associates for their months of meticulous planning and the seamless execution of this key integration milestone. Our operating results for the first quarter reflect the continuation of momentum established late last year, as solid C&I production offset a decline in below-market-rate transactional loan balances. We also reduced our reliance on wholesale funding as customer deposit balances expanded despite seasonal pressure typical during the first quarter. The resulting mixed shift in both assets and liabilities fortifies and positions our balance sheet for sustained, attractive returns over time. Our bankers' proven ability to generate balanced, relationship-centric growth in deposits, loans, and quality fee income is driving sustainable earnings growth. We do not need to produce net balance sheet growth to achieve our EPS and ROTCE objectives. Columbia's cost-conscious culture further enhances our top quartile profitability profile. Beyond savings associated with the PAC Premier acquisition, our expense base reflects continuous fine-tuning. We remain disciplined in identifying offsets that create reinvestment dollars for initiatives that drive revenue and enhance efficiency. AI is becoming an important tool for driving efficiency across Columbia. During our Pacific Premier core systems conversion, we used AI to automate work that traditionally would be completed manually. Historically, time-consuming conversion tasks, such as reviewing and validating thousands of data fields, were automated and completed in a fraction of the time historically required. Instead of relying on manual checks and custom coding, AI helped us move faster and reduce complexity, which shortened review timelines and improved execution. it. More broadly, AI is helping our technology teams work more efficiently. It allows our developers to move faster, test changes more quickly, and write software that is more secure. The result is higher productivity and better outcomes without adding incremental resources. We also enhanced our customer support experience with an AI-powered virtual assistant. Our ratio of human calls to AI-powered agent chats moved from two to one in favor of humans to three to one in favor of AI agents, as many routine administrative questions are now handled by the virtual assistant. Macroeconomic headlines continue to dominate the industry narrative, often driving outsized stock price reactions and unilaterally treating all banks as the same. We are not all the same, and Columbia's fundamentals warrant differentiation. Over my tenure at Columbia Bank, we have repeatedly demonstrated the ability to withstand industry stress as we consistently turn disruption into opportunity. During the global financial crisis, Columbia delivered strong credit performance while leveraging FDIC-assisted transactions to grow and strengthen our franchise. Since then, we have continued to expand our customer base through both organic growth and strategic acquisitions. Our best-in-class, low-cost core deposit franchise consistently ranks in the top quartile when measured on both cost and mix of non-interest-bearing balances. More recently, we successfully navigated the banking sector volatility of March 2023. Again, another point in time where many regional banks were treated as one. The Columbia team navigated this volatility without a discernible adverse impact to our business while simultaneously executing a successful systems conversion just three weeks after closing the Umpqua acquisition. Our credit fundamentals remain sound. Our office portfolio continues to perform. The modest uptick in our CRE exposure, which is attributable to acquired portfolios, continues to decline. turning to another closely watched area our ndfi exposure is minimal well below peer averages and underwritten with the same conservative and consistent rigor we apply across our broader loan portfolio our first quarter results mark the beginning of our third consecutive year of stable operational performance and strong organic capital creation given our current capital position and strong forward outlook, we increased our pace of buybacks during the first quarter, returning $200 million to our shareholders, underscoring our belief that the best investment we can make at this time is in the stock of our own company. Looking forward, we will continue to execute on our established priorities, optimizing performance, driving new business growth, supporting the evolving needs of existing customers, and consistently delivering superior returns to our shareholders. I'll now turn the call over to Ivan.
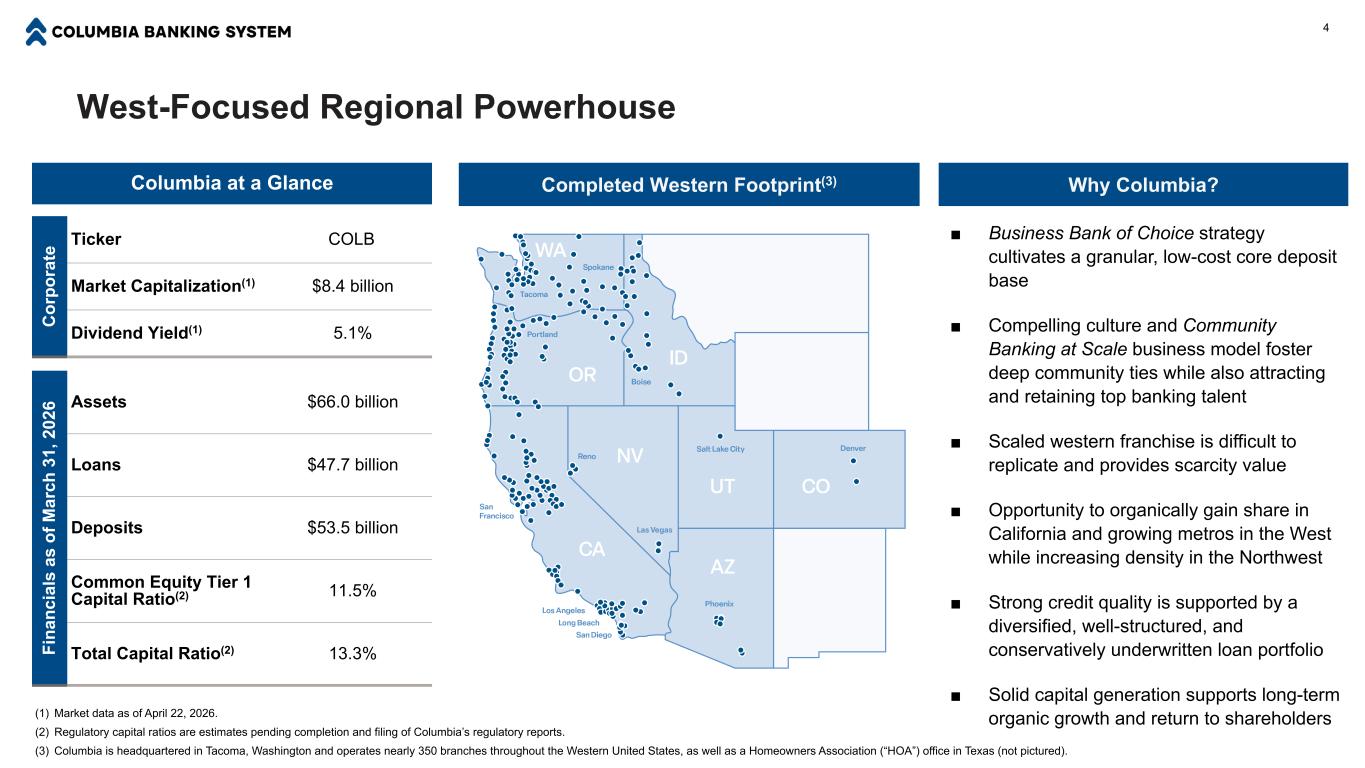
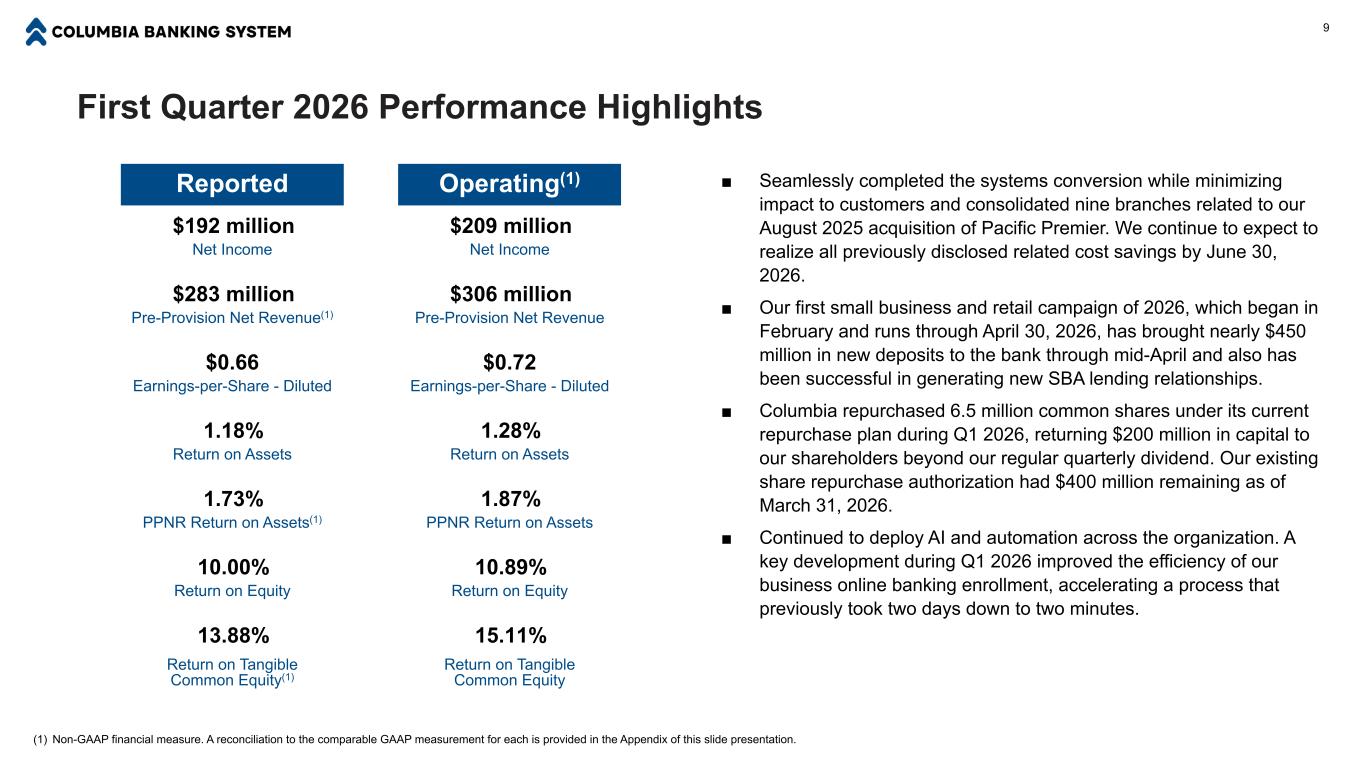
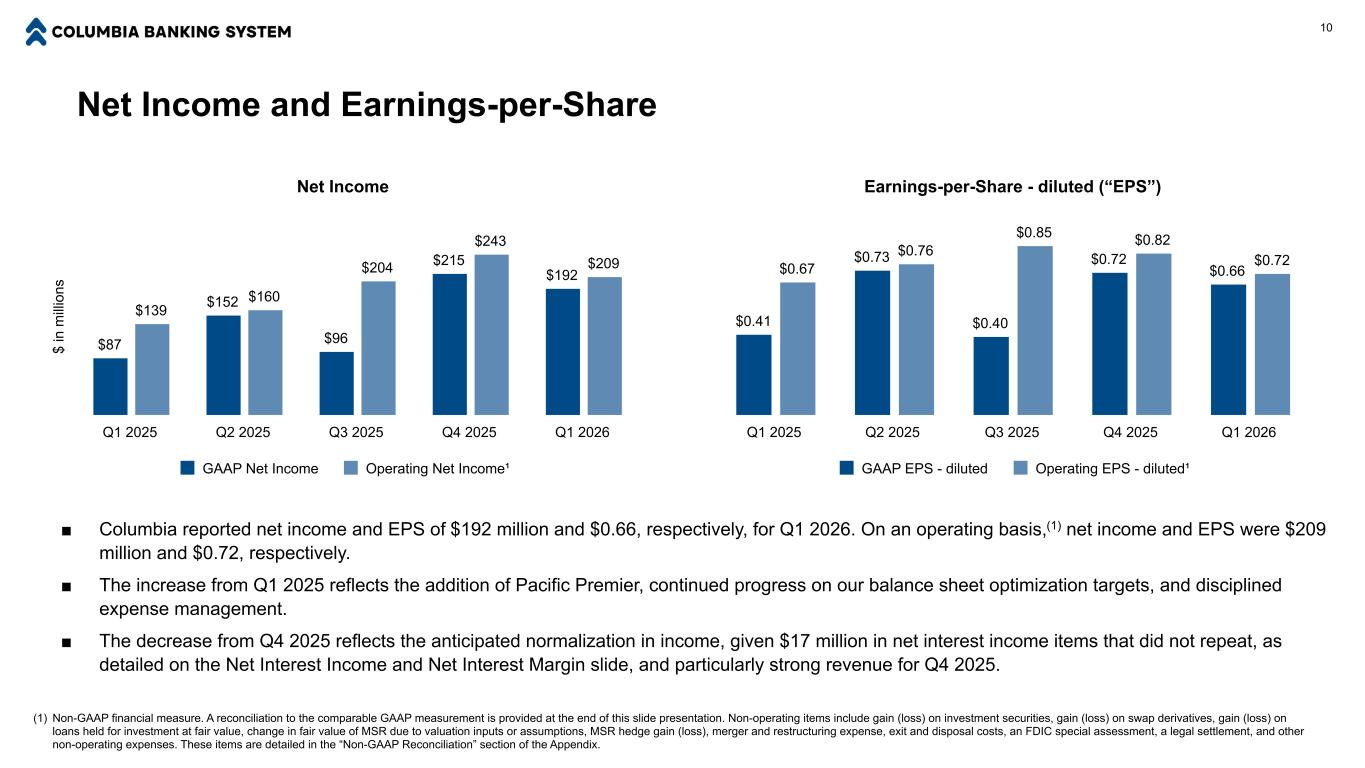
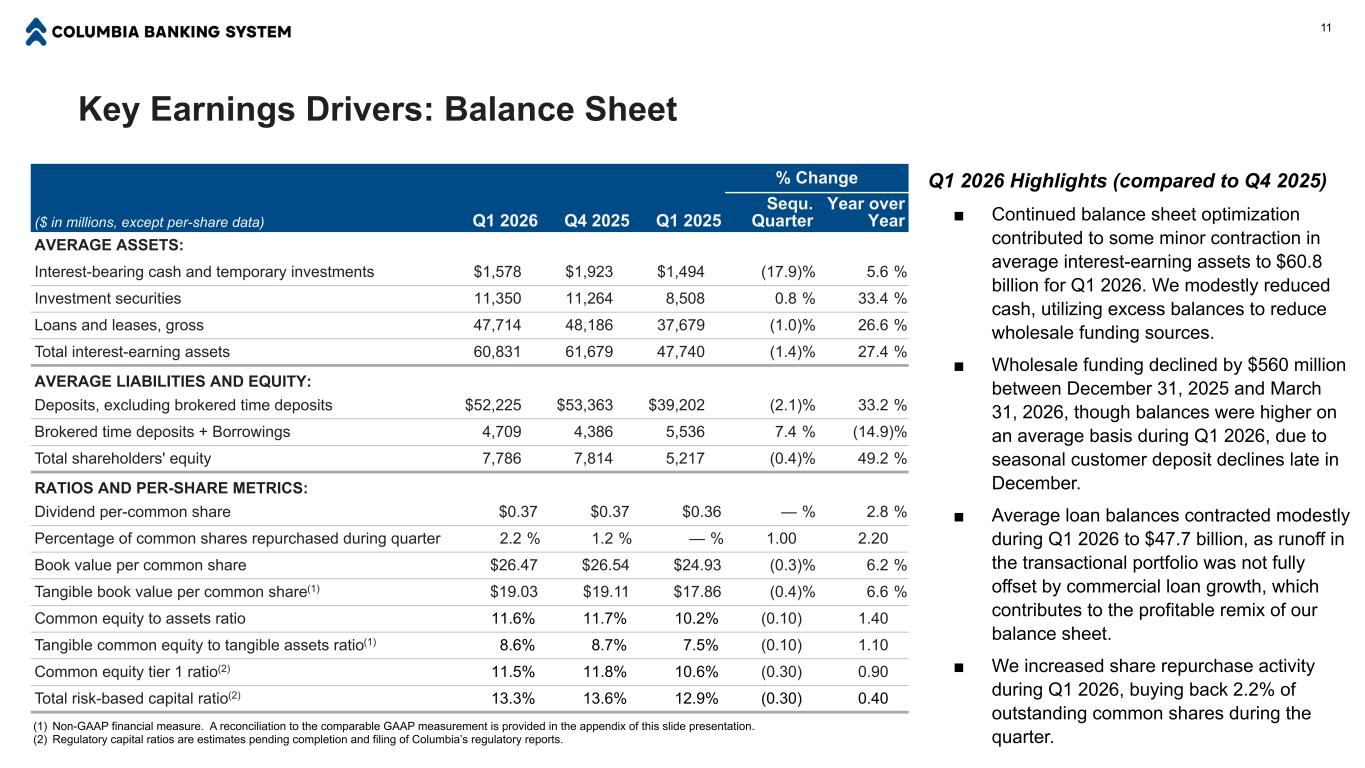
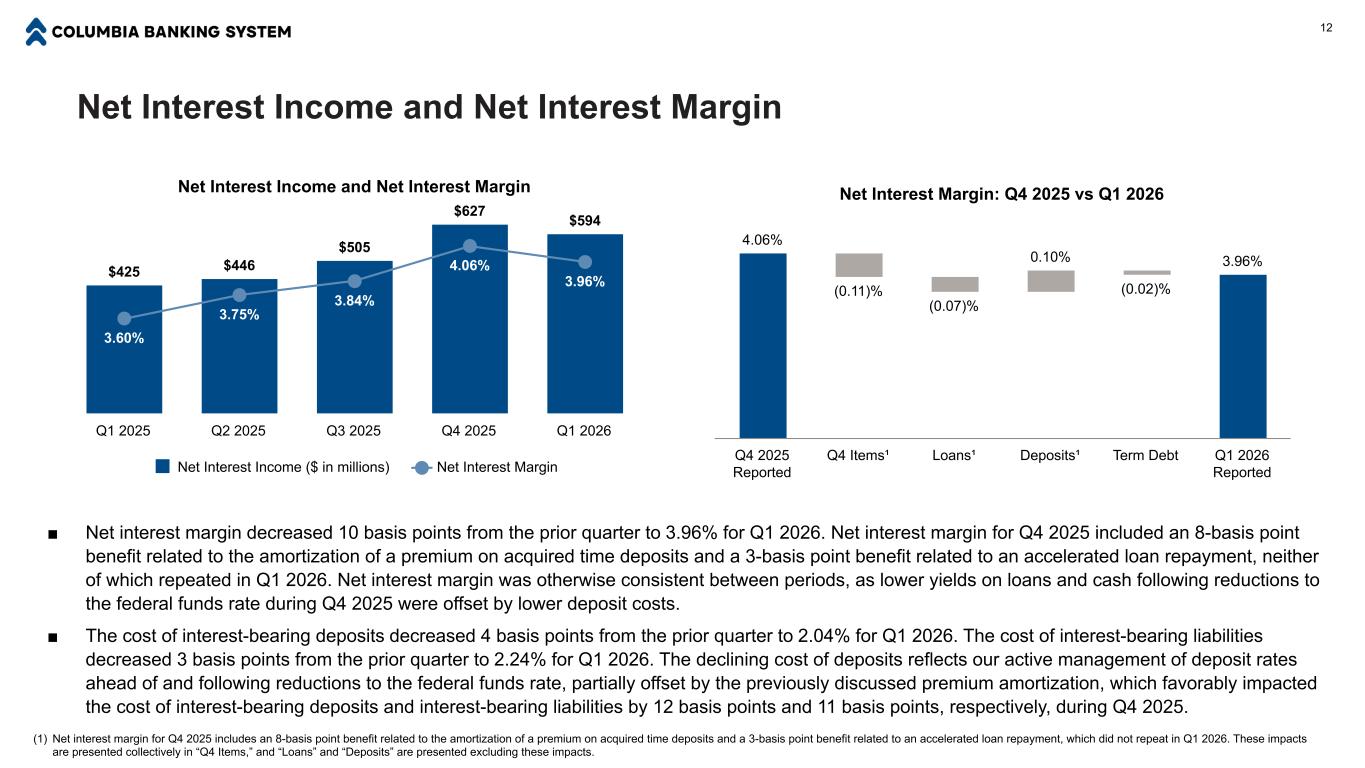
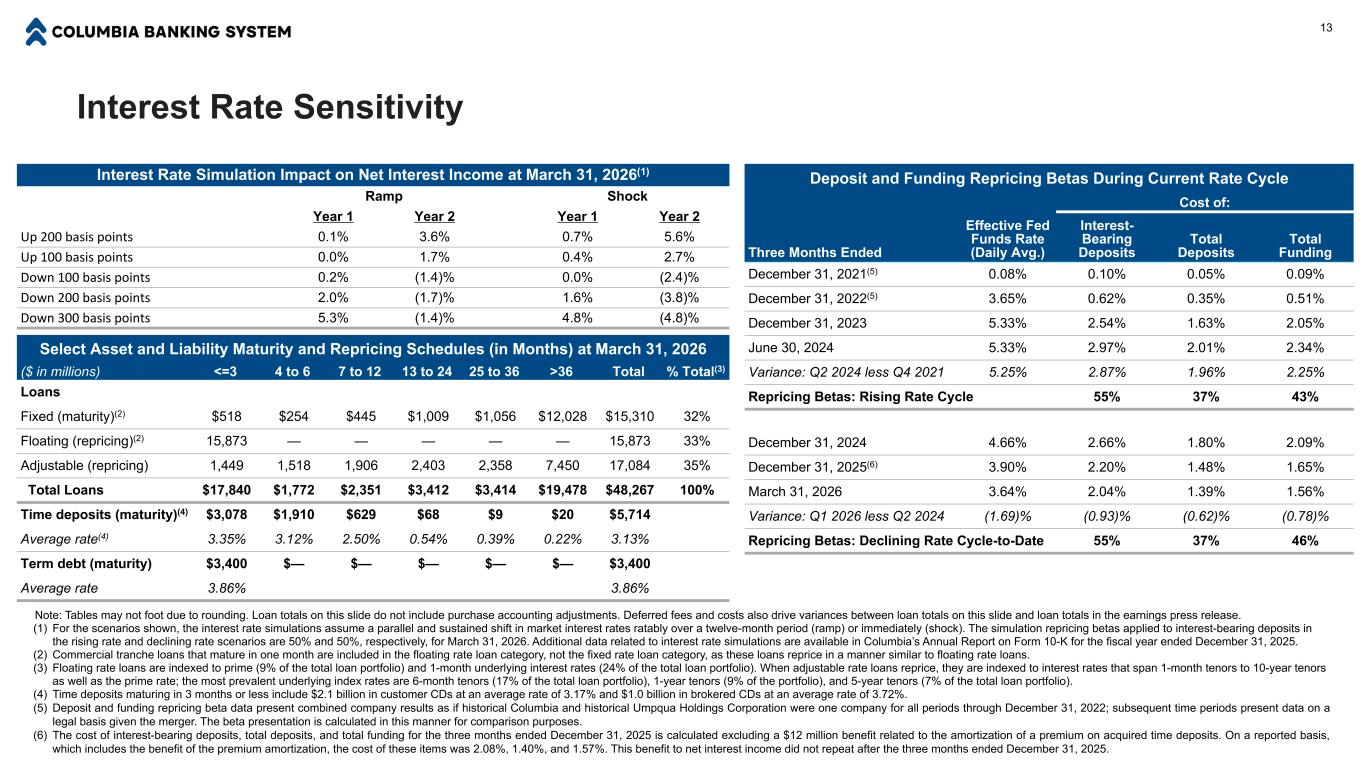
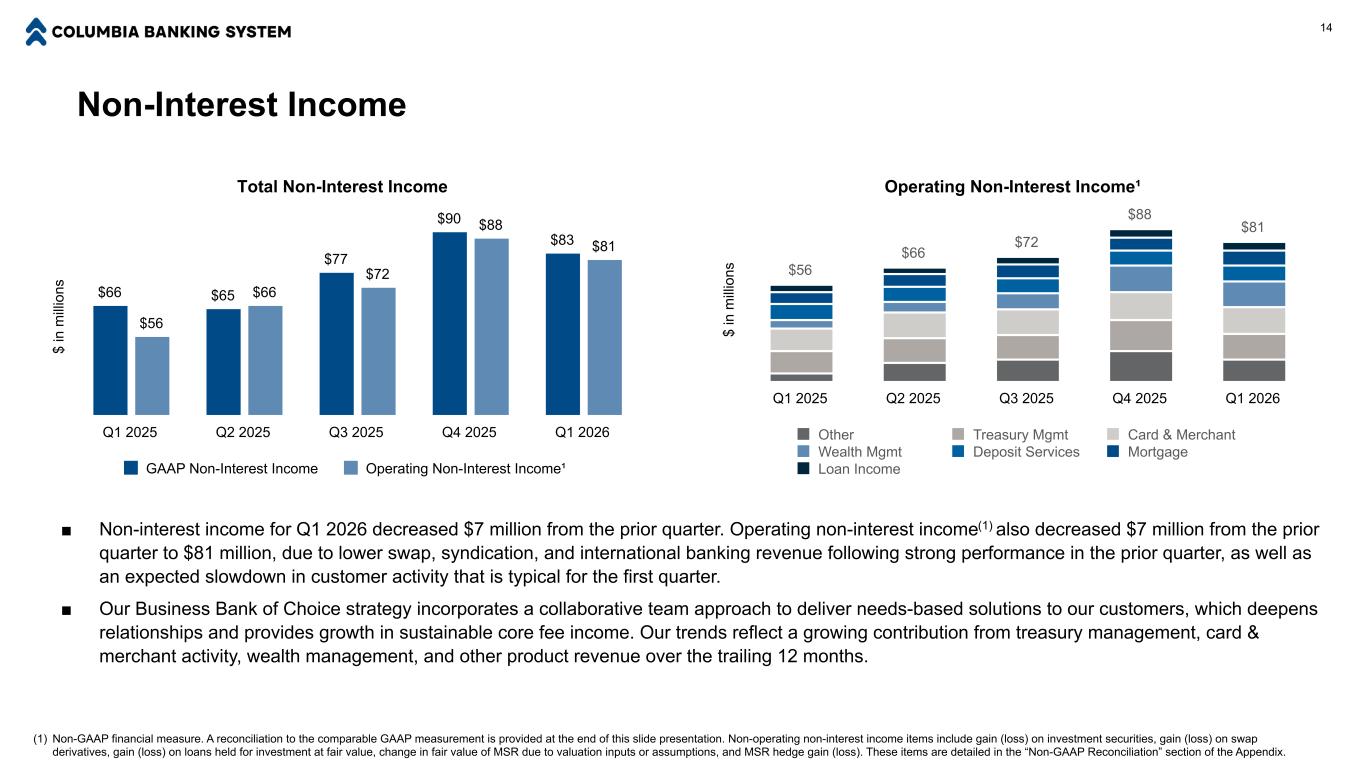
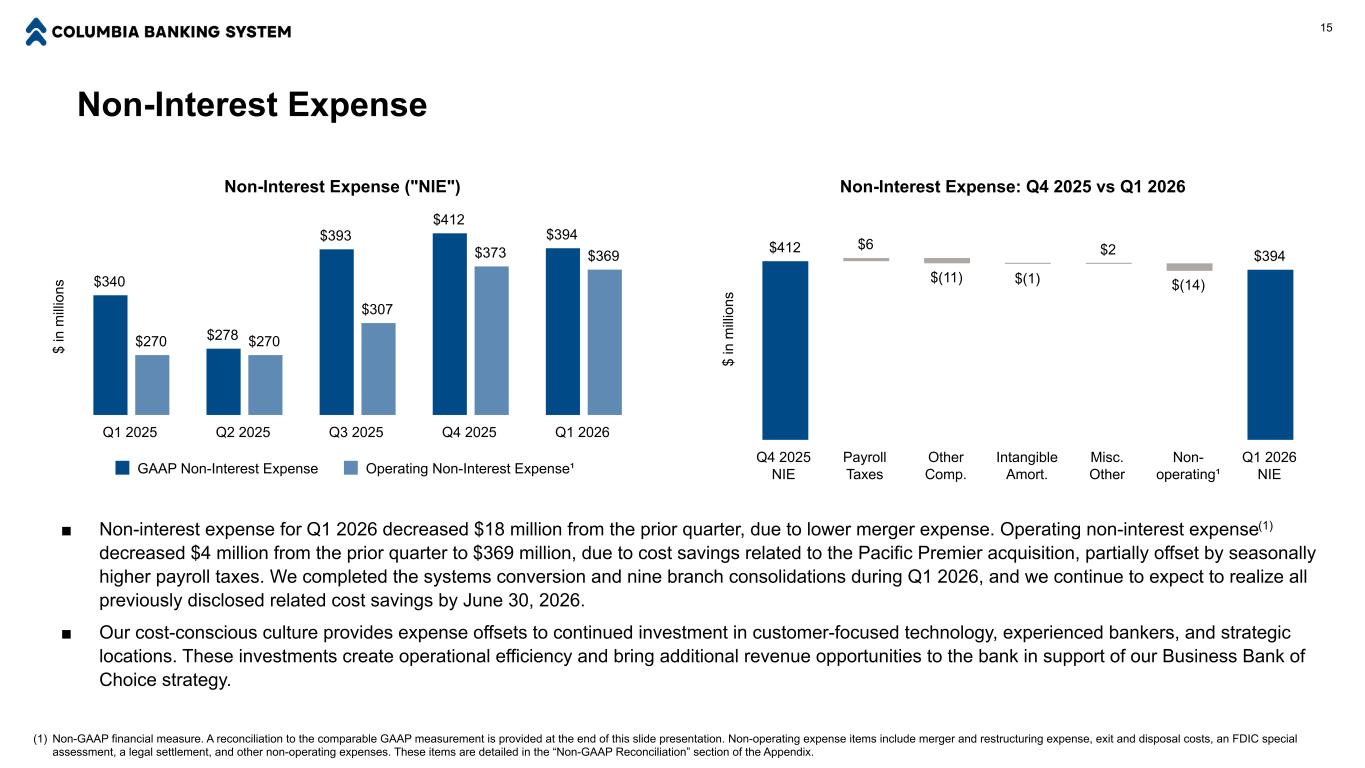
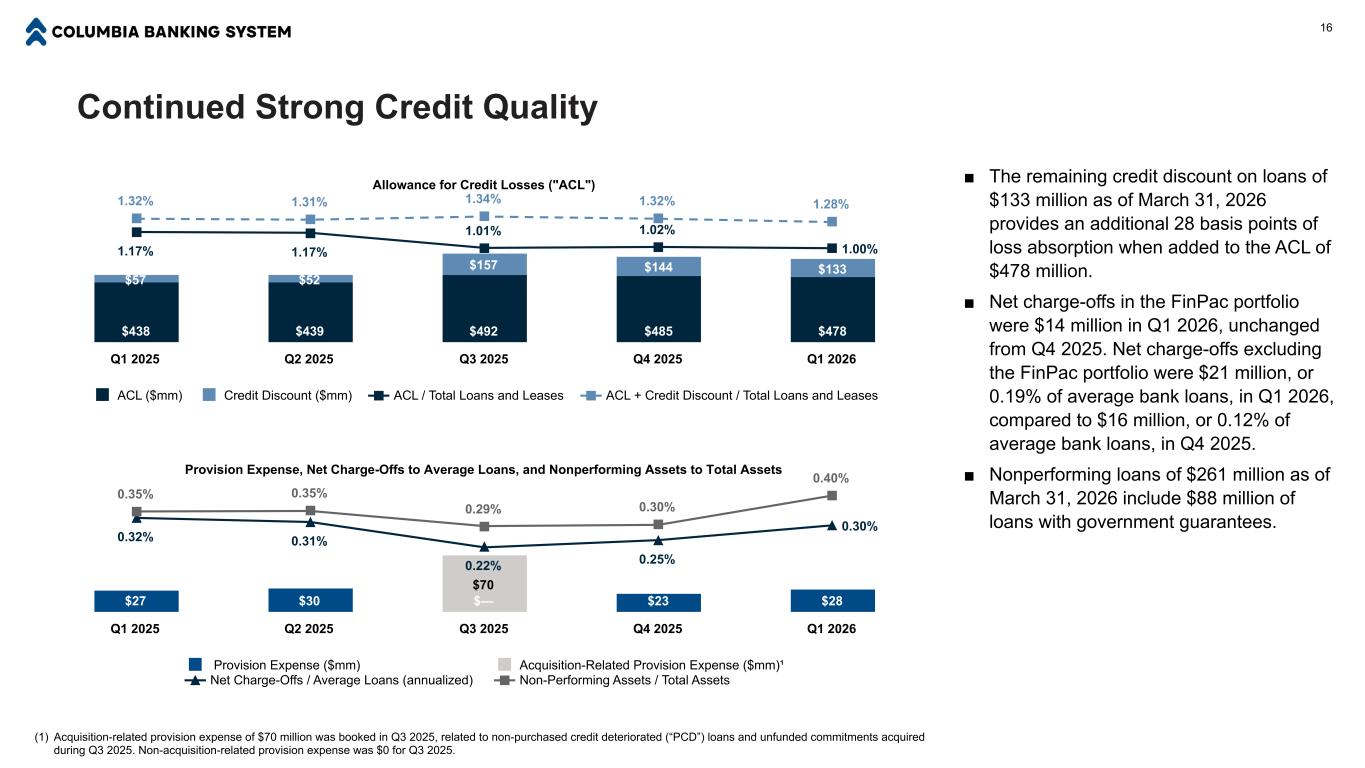
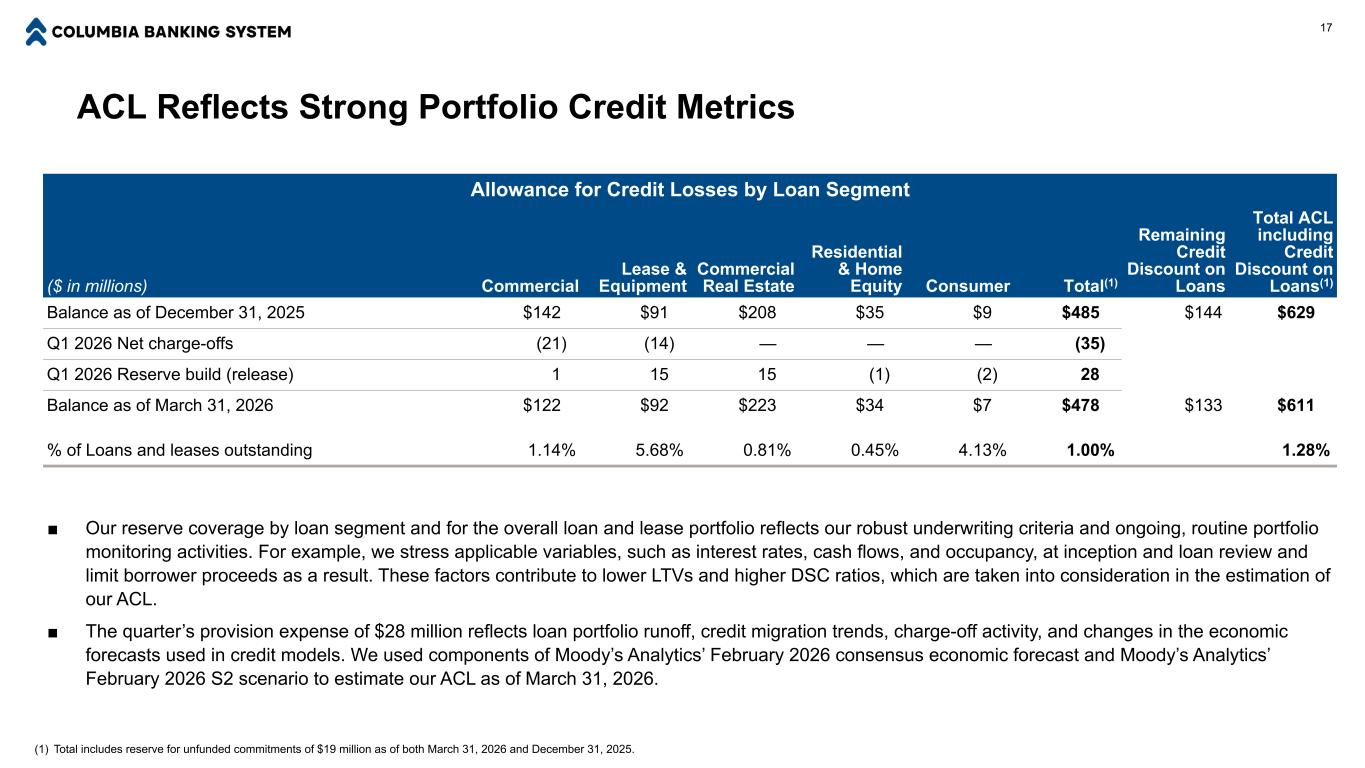
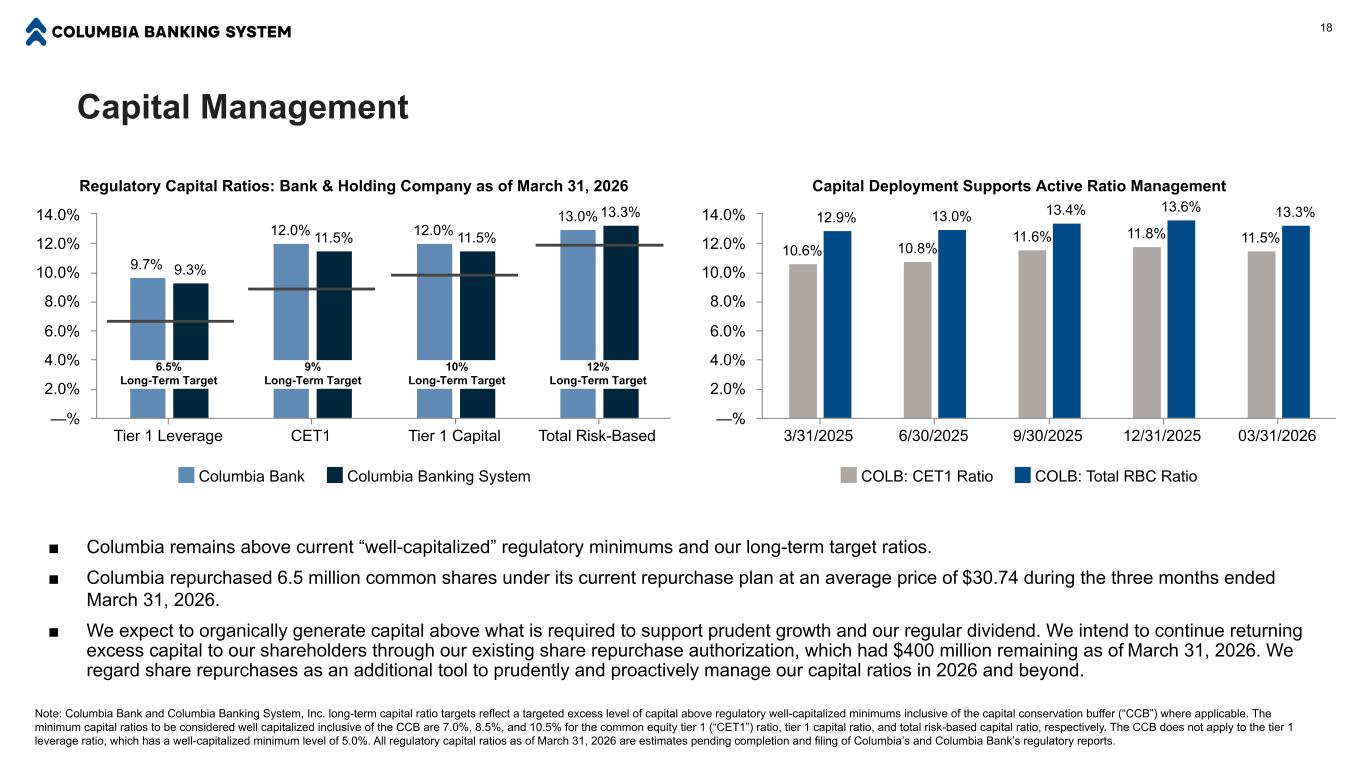
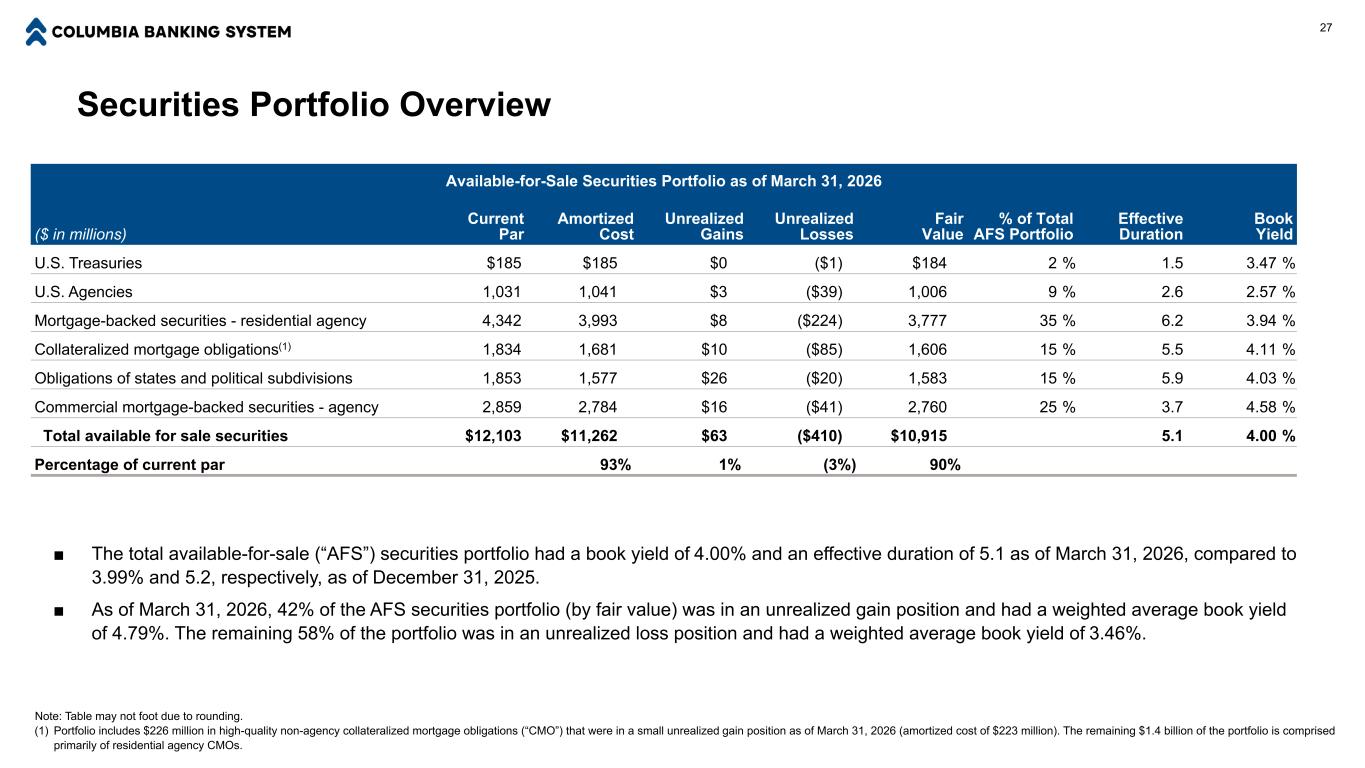
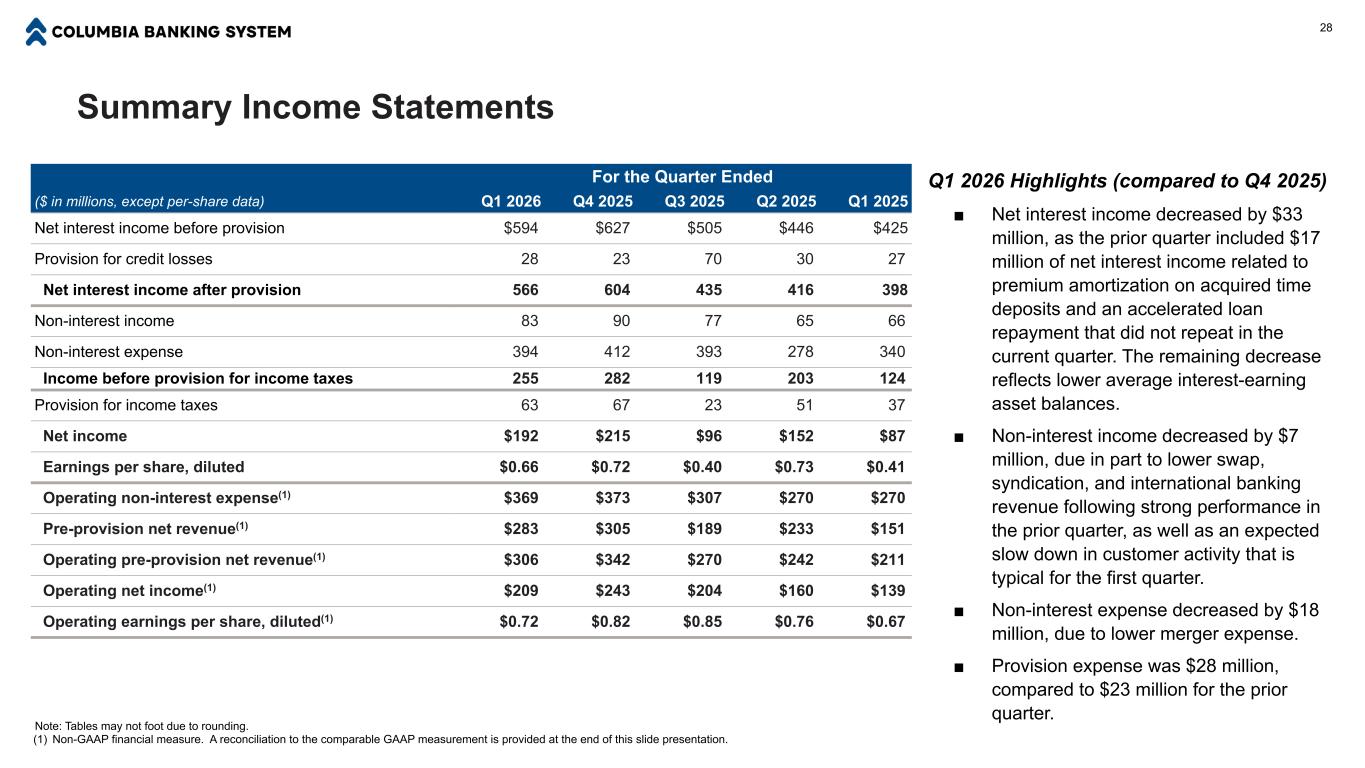
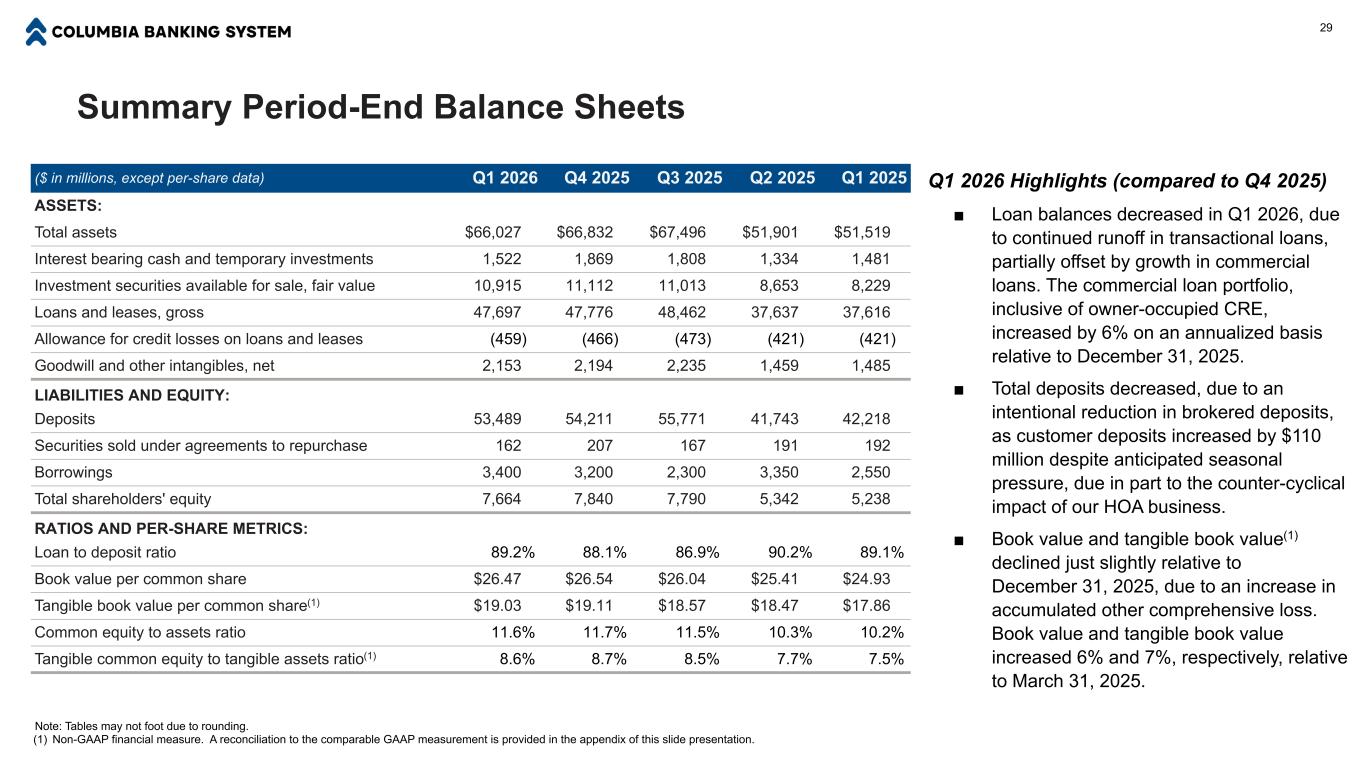
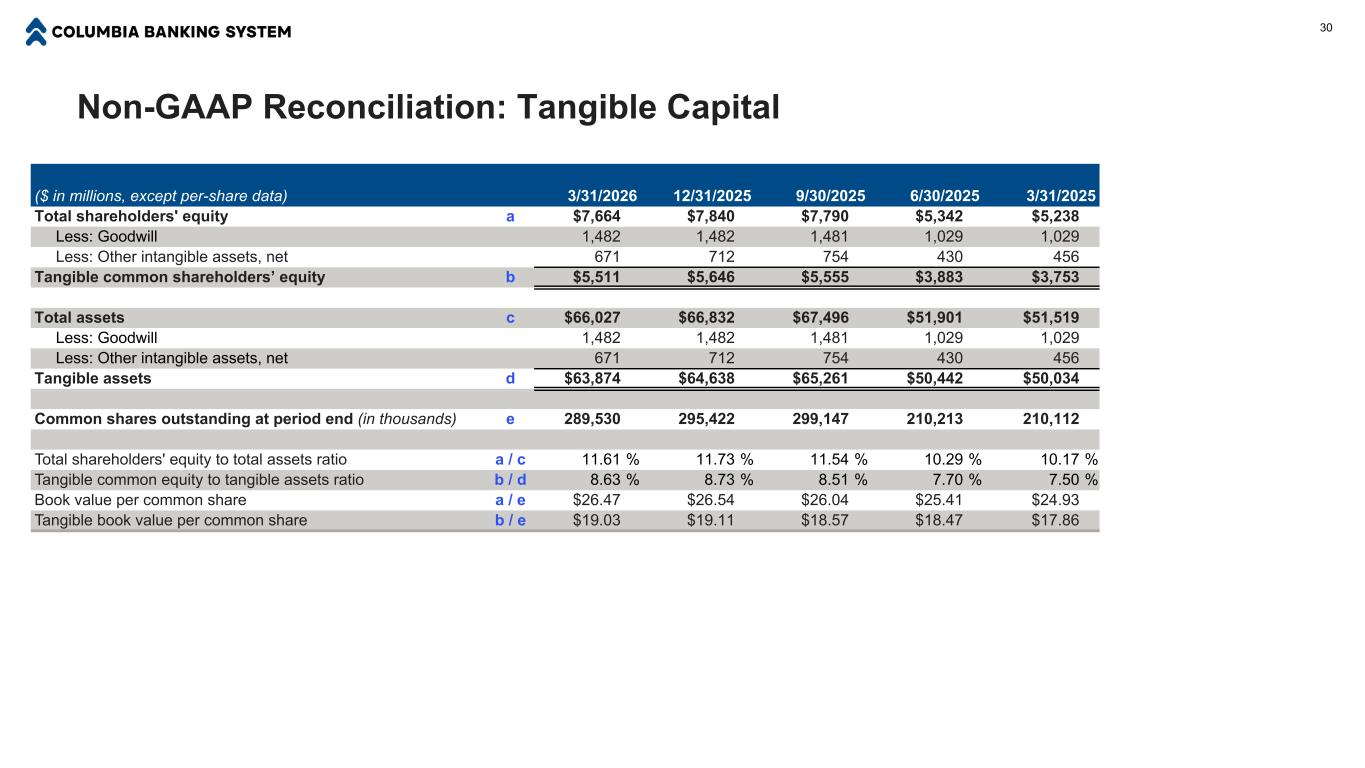
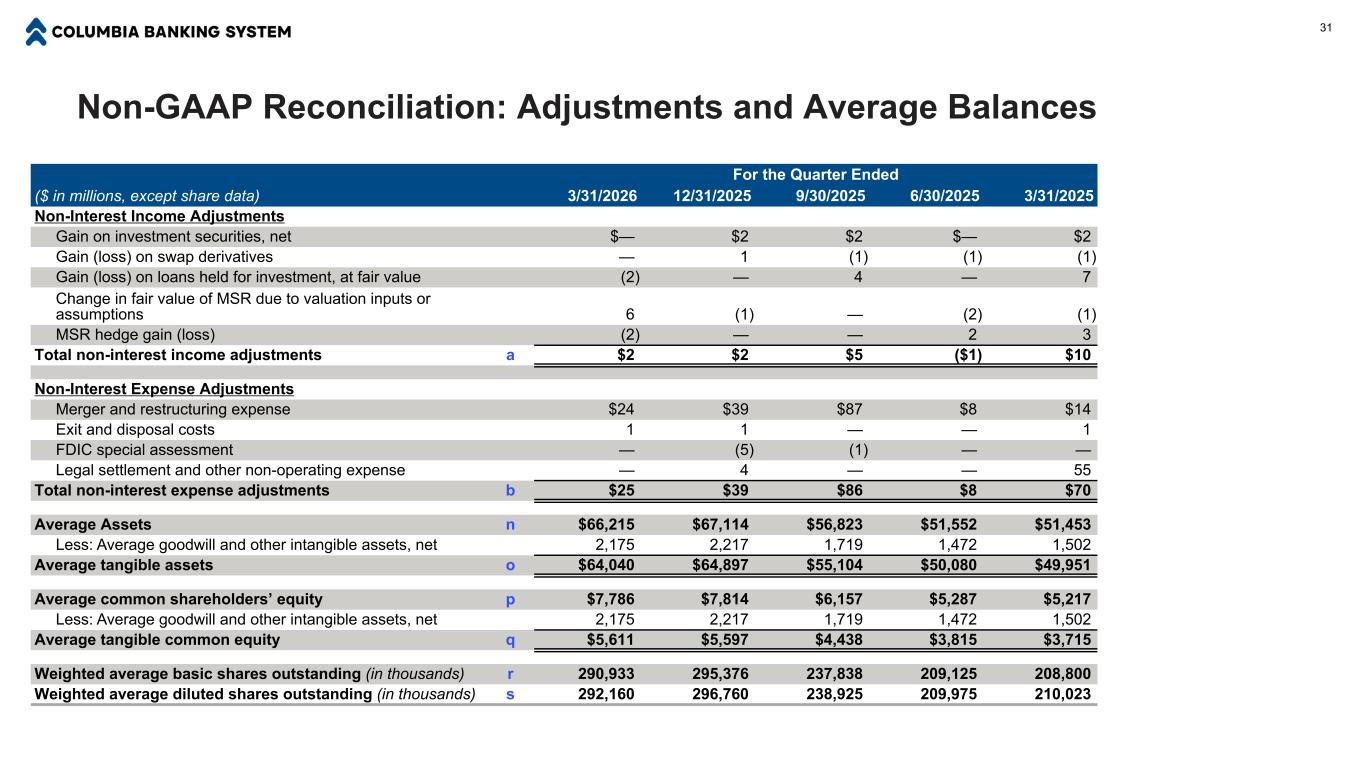
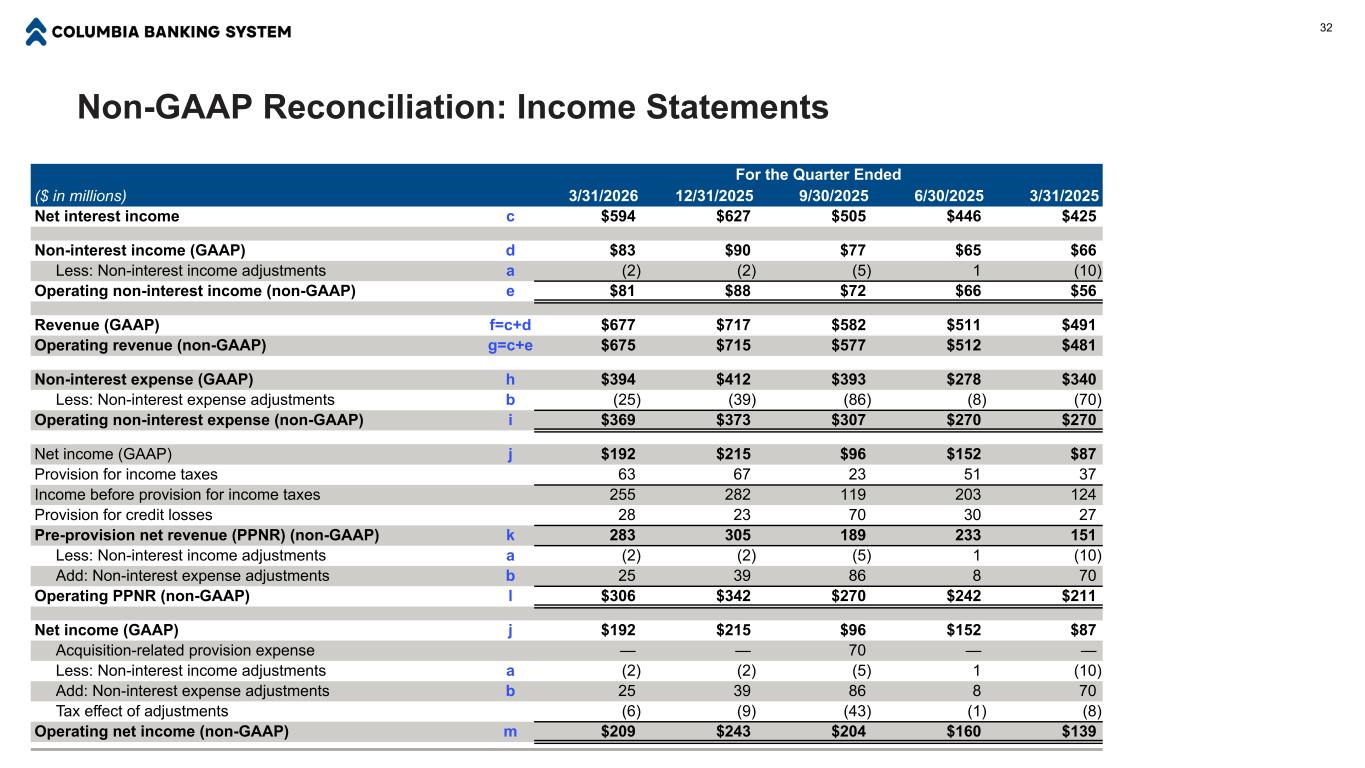
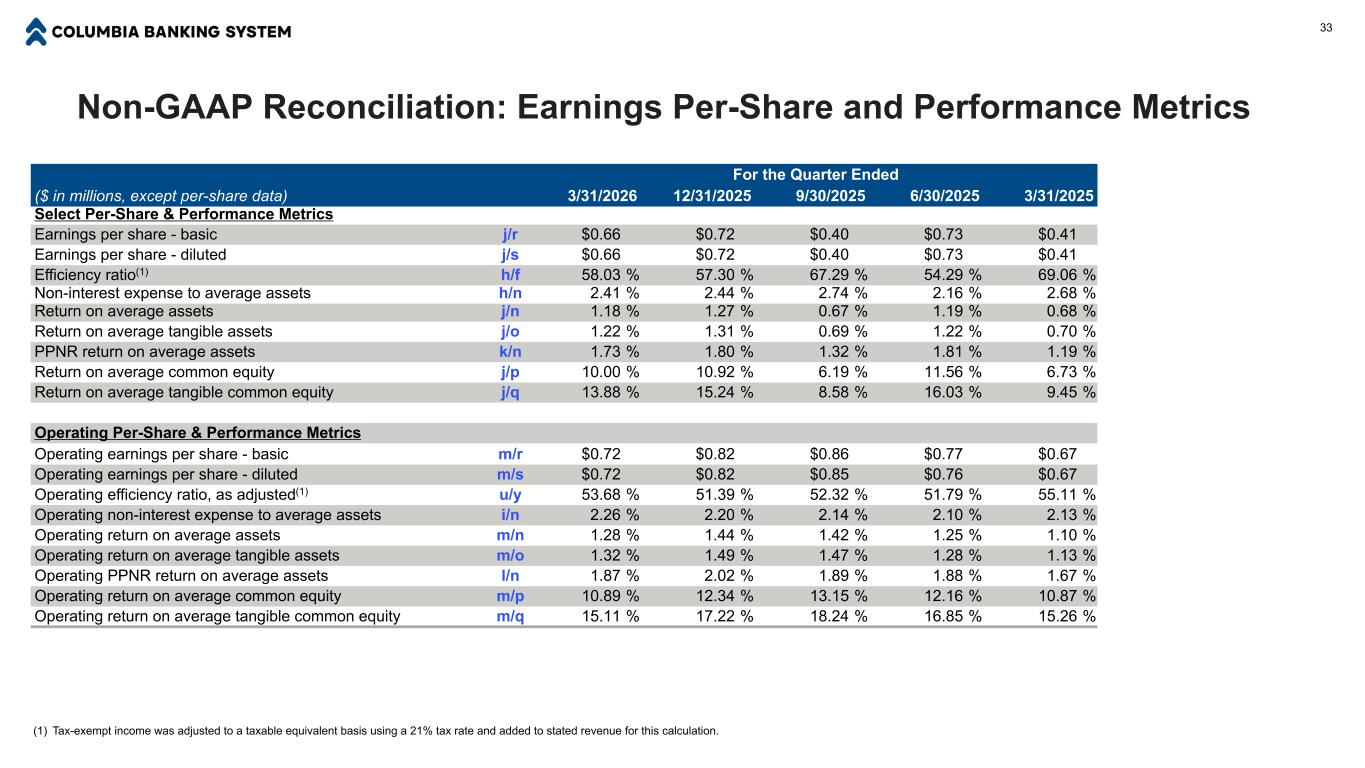
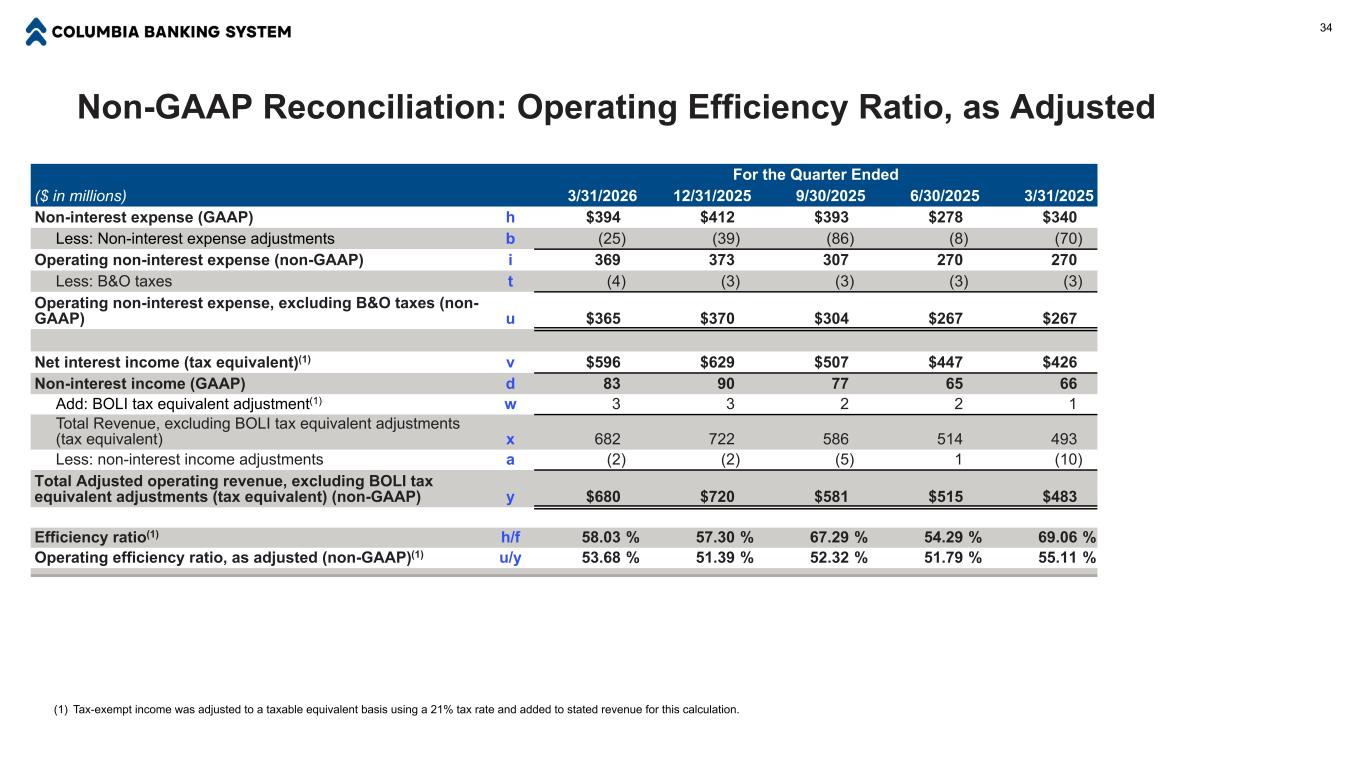
Thank you, Clint, and good afternoon, everyone. As Clint highlighted, our first quarter results reflect continued execution of our strategic priorities. Turning to slide 10, we reported earnings per share of 66 cents and operating earnings per share of 72 cents for the first quarter. On an operating basis, which excludes merger expense and other items detailed in our non-GAAP disclosure, first quarter pre-provision net revenue and operating net income increased 45% and 50% respectively compared to the first quarter of 2025 due to the addition of Pacific Premier, continued progress on our balance sheet optimization targets, and disciplined expense management. Turning to slide 11, average earning assets were $60.8 billion during the first quarter, coming in at the midpoint of the range that I outlined in January, as continued balance sheet optimization contributed to modest contraction relative to the prior quarter. We modestly reduced cash as planned during the first quarter, utilizing excess balances to reduce wholesale funding sources, which declined by $560 million from December 31st. Although wholesale funding declined as of March 31st, balances were higher on an average basis during the first quarter due to typical seasonal customer deposit flows. Overall, the results were as anticipated, reflecting a stable balance sheet outlook and a remix in our loan portfolio out of transactional and into relationship-based lending. Following the modest earning asset contraction during the first quarter, we expect the balance sheet size to remain relatively stable with commercial loan growth offset by contraction in the transactional portfolio. Slide 12 outlines contributors to the sequential quarter change in net interest margin. Net interest margin was 3.96 for the first quarter, right at the top end of the range that I outlined in our last call. While the headline net interest margin is down from 4.06 last quarter, recall that our net interest margin in Q4 benefited from an 11-basis point impact of the amortization of a premium on acquired time deposits and an accelerated loan repayment. Pro forma for those factors, we were roughly flat quarter over quarter. And relative to the first quarter of 2025, net interest margin has expanded by 36 basis points, reflecting the impact of our balance sheet optimization strategy. We exited the first quarter with an improved funding mix relative to the fourth quarter and expect ongoing balance sheet optimization to drive net interest income growth and net interest margin expansion, with the first quarter setting the low-water mark for 2026. As I outlined in our last call, we anticipate our net interest margin to grow modestly in Q2, crossing over 4% at some point in the quarter. Our latest interest rate modeling continues to show that our balance sheet remains neutrally positioned to interest rates on slide 13, and you'll note that we have over $6 billion in fixed and adjustable loans set to reprice over the next 12 months. Not interest income in the first quarter was $83 million on a gap basis and $81 million on an operating basis, as detailed on slide 14, within our guided $80 to $85 million range. The sequential quarter decrease was driven by lower swap, syndication, and international banking revenues following a strong performance in the prior quarter. Despite that, operating non-interest income is up $25 million, or 44%, relative to the first quarter of 2025, from the impact of Pacific Premier alongside strong growth in fee income streams, as Tori will highlight later. We continue to expect non-interest revenues in the low to mid $80 million range for Q2. Slide 15 outlines non-interest expense, which was $369 million on an operating basis. Excluding a tangible amortization of $41 million, the first quarter's $328 million run rate was below our guided range due to the earlier realization of cost savings following January's system conversion, as well as some planned investments which fell back into Q2. As of March 31st, we achieved $102 million of the targeted $127 million in synergies, although these savings were not fully run-rated in the first quarter's results. Excluding CDI amortization, we expect non-interest expense in the $335 to $345 million range for the second quarter before declining in the third quarter as we realize all cost savings related to the transaction by June 30th. CDI amortization will average around $40 million per quarter. Moving on to slide 16, provision expense was $28 million for the first quarter, reflecting loan portfolio runoff, credit migration trends, and changes in the economic forecast used in the credit models. The relationship in the agricultural industry drove a modest increase in net charge-offs and non-performing assets relative to the fourth quarter, with our overall credit metrics remaining stable and healthy. Slide 17 details our allowance for credit losses by portfolio with coverage of total loans at 1% at quarter end and 1.28% when credit discount on acquired loans is included. Turning to capital, slide 18 highlights our regulatory ratios at quarter end. Our CET1 and total risk-based capital ratios declined modestly to 11.5% and 13.3%, respectively, down approximately 30 basis points from the prior quarter end, as our regular dividend and increased buyback activity outpaced capital generation during the quarter. During the first quarter, we repurchased 6.5 million common shares, returning $200 million to our shareholders. As of March 31st, our capital ratios remain comfortably above well-capitalized regulatory minimums and our long-term target ratios. We have excess capital of approximately $500 million, and $400 million remains in our current repurchase authorization. Tangible book value declined slightly to $19.03 from $19.11 as of December 31st, reflecting a higher accumulated other comprehensive loss on our securities portfolio given interest rate changes between periods. We expect share repurchases to remain in the $150 to $200 million range per quarter through our current authorization. Overall, we are very pleased with the financial results for the first quarter, driving a 1.3% ROAA and over 15% ROTCE. We feel well positioned to drive strong profitability through the remainder of 2026 as our balance sheet optimization activity and continued share repurchases enhance long-term value creation. With that, I will hand the call over to Tori.
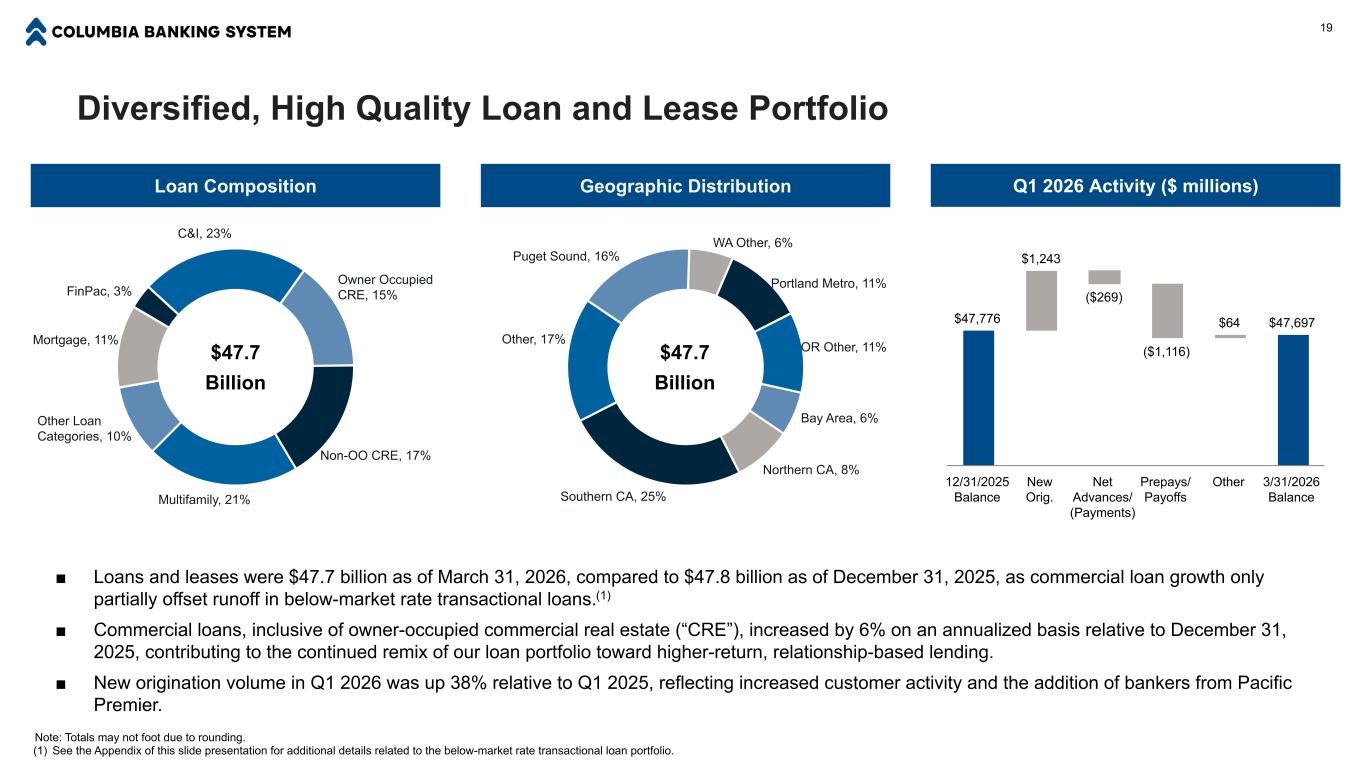
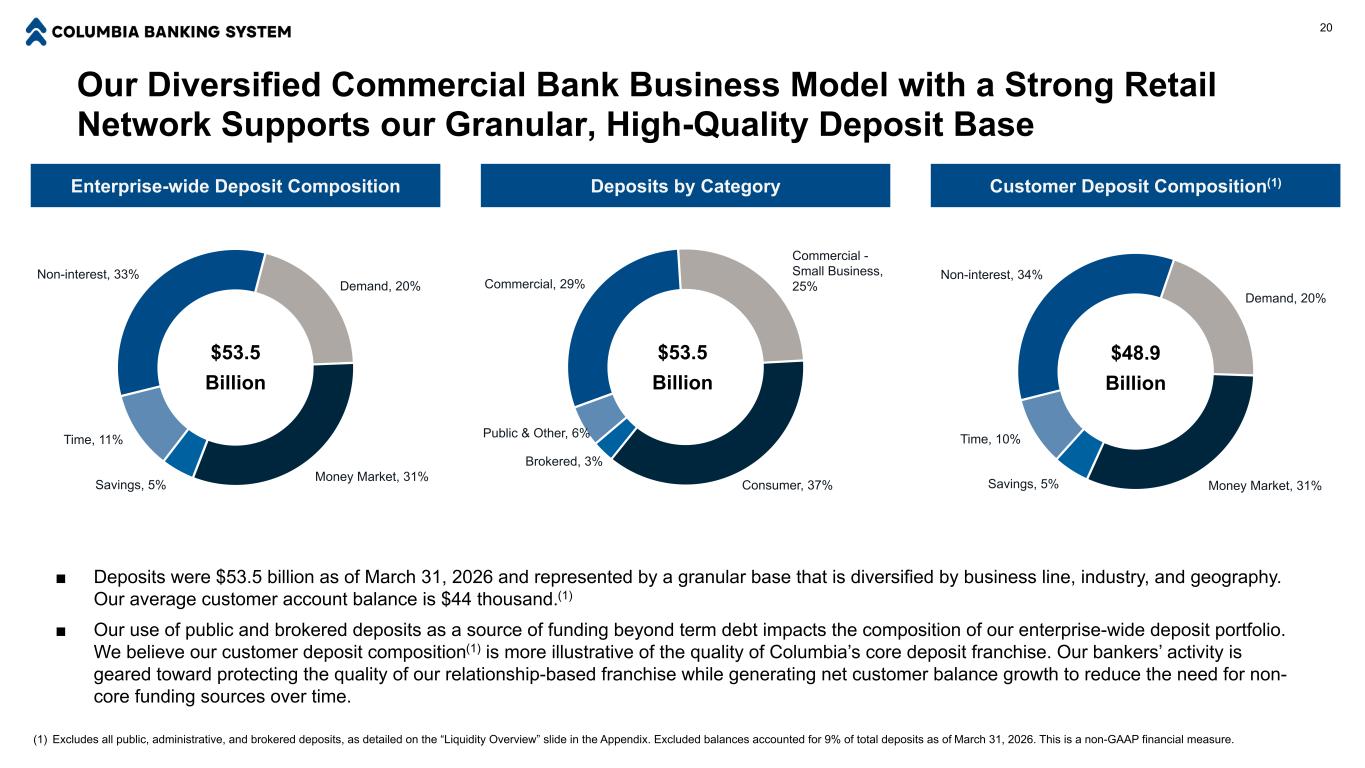
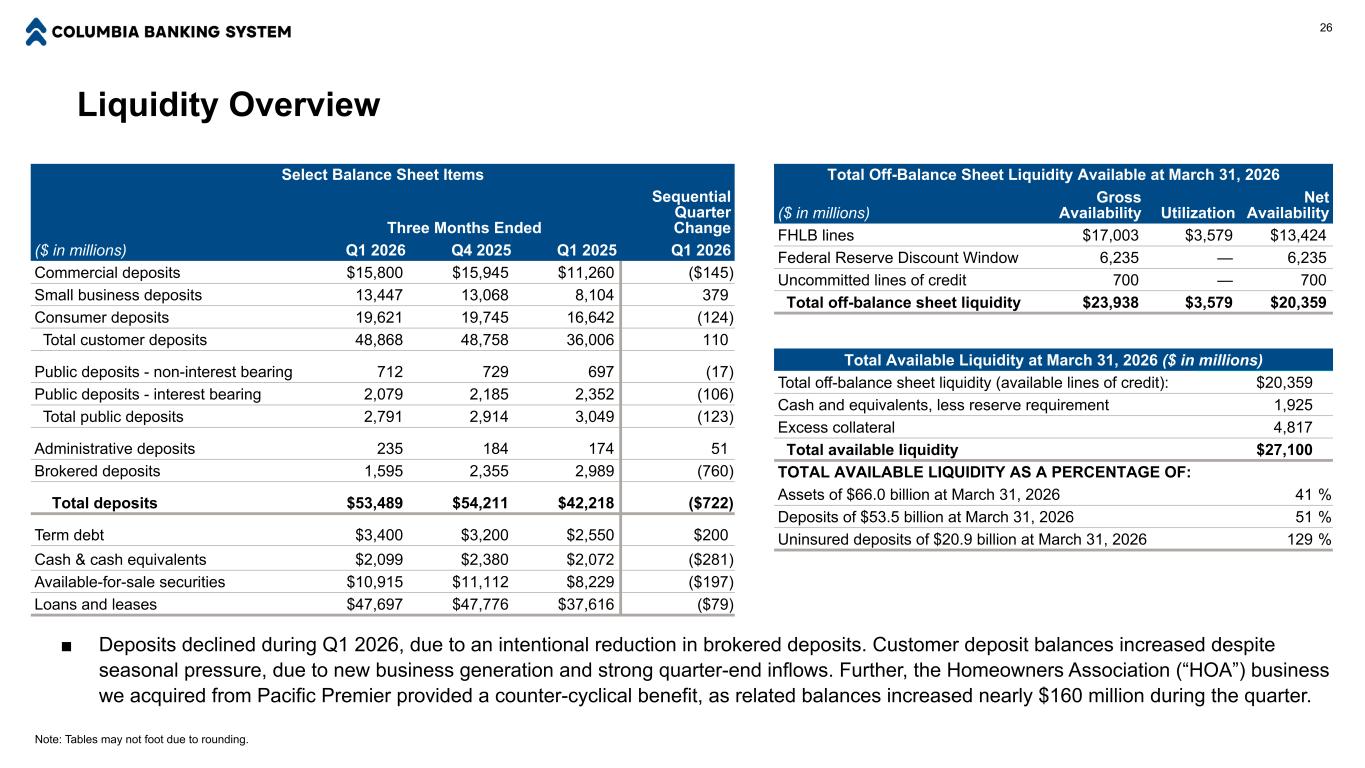
Thank you, Ivan. Our team's had another strong quarter of business generation, as new loan origination volume of $1.2 billion was up 38% from the year-ago quarter. As a result, Columbia's commercial loan portfolio, inclusive of owner-occupied commercial real estate, increased 6% on an annualized basis, contributing to the continued remix of our loan portfolio toward higher return relationship-based lending as transactional loan balances continue to decline. Although payoff and prepayment activity in the first quarter slowed relative to the fourth quarter's elevated level, declining balances in the transactional portfolio contributed to slight overall loan portfolio contraction to $47.7 billion from $47.8 billion as of December 31st. We continue to expect relatively stable net loan portfolio balances in 2026 as we optimize our balance sheet for sustainable profitability improvement. Turning to customer deposits, our team's ability to generate new business and strong quarter-end inflows offset seasonal deposit pressure during the first quarter, resulting in $110 million of increase in customer balances as of March 31st. Our small business and retail deposit campaigns continue to bolster our deposit generation, and our current campaign has generated nearly $450 million in new balances to Columbia through mid-April. Further, the HOA business we acquired from Pacific Premier provided a counter-cyclical benefit during the first quarter as balances seasonally expanded, increasing nearly $160 million since year-end. Customer balance growth and the cash deployment Ivan discussed contributed to a $760 million reduction in broker deposit balances as of quarter end, accounting for the decline in total deposits to $53.5 billion from $54.2 billion as of December 31st. Although customer fee income decreased following our strong fourth quarter performance, our results highlight the notable progress we have made over the past year. driven by the addition of Pacific Premier and our continued efforts to expand the contribution of core fee income to total revenue. As Ivan discussed, operating non-interest income increased significantly between the first quarters of 2025 and 2026, with an exceptional growth in financial services and trust revenue, treasury management, commercial card, merchant income, and other recurring customer fee business. Our core fee income pipeline remains healthy, as do our loan and deposit pipelines, and we remain outwardly focused on generating business in a disciplined manner. I will now hand the call back over to Clint.
Thanks, Tori. I want to take a moment to thank our team of talented associates for their hard work and contribution to our ninth consecutive quarter of solid financial performance and consistent results. Relationship-driven loan and deposit growth, and our balance sheet optimization efforts are creating tangible earnings results as evidenced by our net interest margin expansion over the past year. This concludes our prepared remarks. Chris, Tori, Ivan, and Frank are with me. We're happy to take your questions now. DeeDee, please open the call for Q&A.
Operator
Thank you. As a reminder, to ask a question, please press star 11 on your telephone and wait for your name to be announced. To withdraw your question, please press star 11 again. Please stand by while we compile the Q&A roster. And our first question comes from John Arfstrom of RBC Capital Markets. Your line is open.
Thanks. Good afternoon, everyone. This all looks good, but maybe loans and margin, I guess. Can Can you guys talk a little bit about the billion two plus and originations, kind of where that's coming from in general trends? It seems maybe a little better than a typical first quarter, but just give us an idea of what you're seeing there and what the drivers are.
Yes, sure, John. This is Torrey. I would say it's quite a bit better than kind of year over year, Q1, 2025, I think combined of a billion two in the commercial space is about a billion dollars. about a 40, roughly almost about 35% growth from Q1 2025. And I think that we've talked about this previously. I mean, there's been a lot of progress made in the company in an outbound effort to just deploy our resources to bring new relationships into the bank. I think we've been very successful. We watch pipelines all the time. You know, it's not coming from one particular part of the company. It's spread throughout the organization. We're seeing growth certainly in our historical Pacific Northwest markets, seeing some growth out of Southern California, seeing some nice growth in our de novo markets. So it's kind of been spread throughout the company. And I think it's a combination of just a significant effort on the part of our bankers to tell the story of Columbia Bank. And it's a great story and we're having a lot of success with it.
Okay. Um, good. And then, uh, Ivan, maybe for you, um, can you give us a little more on what you're thinking on the margin? I know you, it, it seems like it's trajecting the trajectories higher. Maybe it's a little better than you thought, but can you talk a little bit about maybe medium term expectations and then touch on what you're seeing in terms of deposit pricing competition?
Yeah, that sounds great. Uh, I'll start us off and then, and then, And I'll maybe look to Chris to talk a little bit about what we're seeing in the marketplace regarding deposits. I mean, I think you kind of nailed it. This quarter, we landed right at the top end of the rail that we provided last quarter. And to unpack that a little bit, I think that there's two counteracting effects that we saw in Q1 when I think about our margin quarter over quarter. The headwind that we deal with in Q1, and it's the headwind that we deal with every year in Q1 is the seasonality in which, you know, we see those deposit outflows and a heavier reliance upon the wholesale funding channels. And so while our ending wholesale funding point to point was down, on average, we had a 7% increase in average reliance on brokered and FHLV relative to Q4. And we see that pretty much every year. I think what counteracted that and what allowed us to stay stable this year relative to past years is the tailwind. And what we're benefiting from is the continued optimization of the balance sheet and specifically the loan portfolio in terms of the repricing of low coupon, low duration transactional loans. During Q1, we saw an additional roughly $230 million of that portfolio run down. That stuff's coming off of the low to mid 4% range, and we continue to replace it with core relationship lending with a six handle on it. And that is a very positive continued engine for us that we expect to continue going forward. I think last 90 days ago, I hedged and said that sometime in the spring or summer, we'll cross over the 4% level. I said just moments ago, I think we will be roughly at that 4% marker here in Q2 of this year, and then we will continue to step up from there and move upwards north of 4% into the second half of the year. From a deposit perspective, you know, there was a bit of noise in Q4, as you'll recall, associated with some one-time kind of tail event items with the PPBI deal, the premier on acquired deposits. But if you adjust for that, our Q4 cost of interest bearing was 220. For Q1, it was 2.04, so 16 basis points down spot to spot end of last quarter versus end of this quarter. We saw an additional eight basis point decrease without any Fed funds actions, obviously, in Q1. And I think that continues to point to the discipline that we bring to the table, back book CD pricing, as well as just evaluating on a relationship basis the deposits that we have. And so I was really pleased to see continued momentum in that arena as well. I'll hand it over to Chris.
Yeah, John, that disciplined approach that Ivan's outlining there, it's always been there. Tori and myself constantly are looking through the exception requests. We're working with our bankers on each and every one of them, monitoring the competition that's out there for RAC rates. We like where we're positioned there, but we continue to look for opportunities to trim a few basis points here and there where we can. And I think our bankers have really grabbed a hold of that and are moving forward. And then, you know, if we do get a Fed cut later on in the year, you know, obviously we've shown a playbook and a real nice system to deal with that in a large volume. But trust me, Tori and I are looking at this every single day as those things come due. And I think the results are speaking for themselves. Okay. All right.
Thank you very much, guys.
Operator
Thank you. And our next question comes from David Feaster of Raymond James. Your line is open.
Hi. Good afternoon, everybody. Hey, David. I wanted to start on just kind of following up on Pacific Premier. Well, it sounds like the deal's gone pretty well so far. but I specifically wanted to talk about the conversion and the integration. How did that go relative to expectations? How was feedback from clients? Have you seen any attrition? And just post-conversion, how is the team doing? And has their go-to-market shifted at all, just integrated and we're all heading in the right direction?
Yeah, great question, David. And as usual, you pack a lot into what appears to be one single question. So we'll attempt to hit all those points, and if we miss one, just redirect us. But, you know, I've said since the very first set of town halls we had on this a year ago with the team that packed Premier that it was different. Their reaction was different. the enthusiasm they showed for the combination and becoming part of Columbia and our market position throughout the West. And that carried through all the way to the systems conversion. And I'll probably offend a couple hundred people in our organization when I say that it went so smooth that I almost forgot that we did a conversion in the first quarter because there was no drama that's typically associated with it, no customer disruption, and I think it was probably out of all the ones we've done, the best that we've ever had. And that's not only attributed to the talent that Columbia had, but also the talent and experience that PAC Premier brought to the table as well. So in terms of where things have been since the January conversion, for me, my perspective is, and how I term it is, is pretty much business as usual, you know, and I think that if anybody thought that we got distracted or inwardly focused, I mean, look at the performance that we had during what is typically our seasonally weakest quarter and the production and momentum we had on the CNI side actually growing customer deposits during the first quarter. I mean, that's definitely something that I'm pleased with, even though it was a nominal amount. But, you know, Chris and Tori live this every single day and are much closer to the frontline associates and team members. So I'm going to step back and let them give you a little more perspective on what they're hearing and seeing at the customer level?
Sure. David's story. I'll start, and Chris has a couple things I want to say as well. I would say I'm incredibly impressed and proud of the Pacific Premier folks and just how excited they've been from day one to be a part of Columbia, how they've kind of gone through the conversion, and it went extraordinarily well. I mean, we've got a ton of momentum in Southern California. The teams that we've had down there, you know, prior to the acquisition, they've all kind of folded in and become one very unified, strong presence and strong team in Southern California. We haven't really lost anybody of note at all from an associate standpoint. So we've got high retention of people, very high retention of customers. as we continue to find a lot of opportunity in the existing PAC Premier Book to grow relationships. And we're kind of seeing that every day. And their momentum is very strong. And I think they feel very good about being a part of our company and the opportunity that's in front of them. So it's been all good. And they've done an exceptional job. And I think Chris wants to say something.
Yeah, David, as we try to write down everything you packed into that, you asked about feedback from clients. And during the conversion itself, you always have the chance when people are reaching out and using the contact center that they can leave comments afterwards. We had numerous comments where they raved about the conversion, that they had personally been through them before, how this was the best, how they loved the bank. And there were so many of them that at one point accused the contact center of planting them and doing them themselves, but they were real customers and it was flat out phenomenal. And what that really does is happy customers, they lead to happy bankers. And as Tori was talking about, they get some back into the market. We've got the new capabilities that came from putting both organizations together and our bankers are taking advantage of that. And we're starting to see bankers in our markets reaching out to us and asking what it's like and what are we doing and can they possibly come on board?
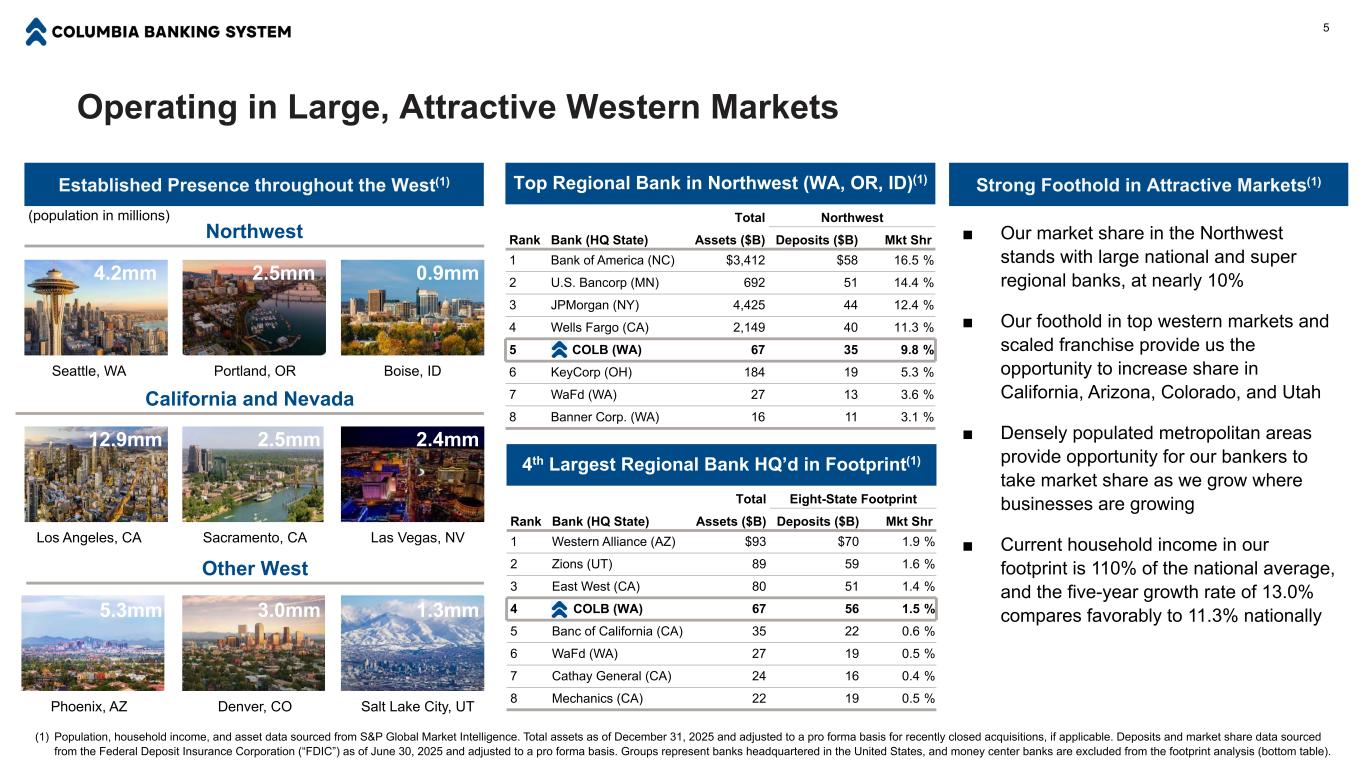
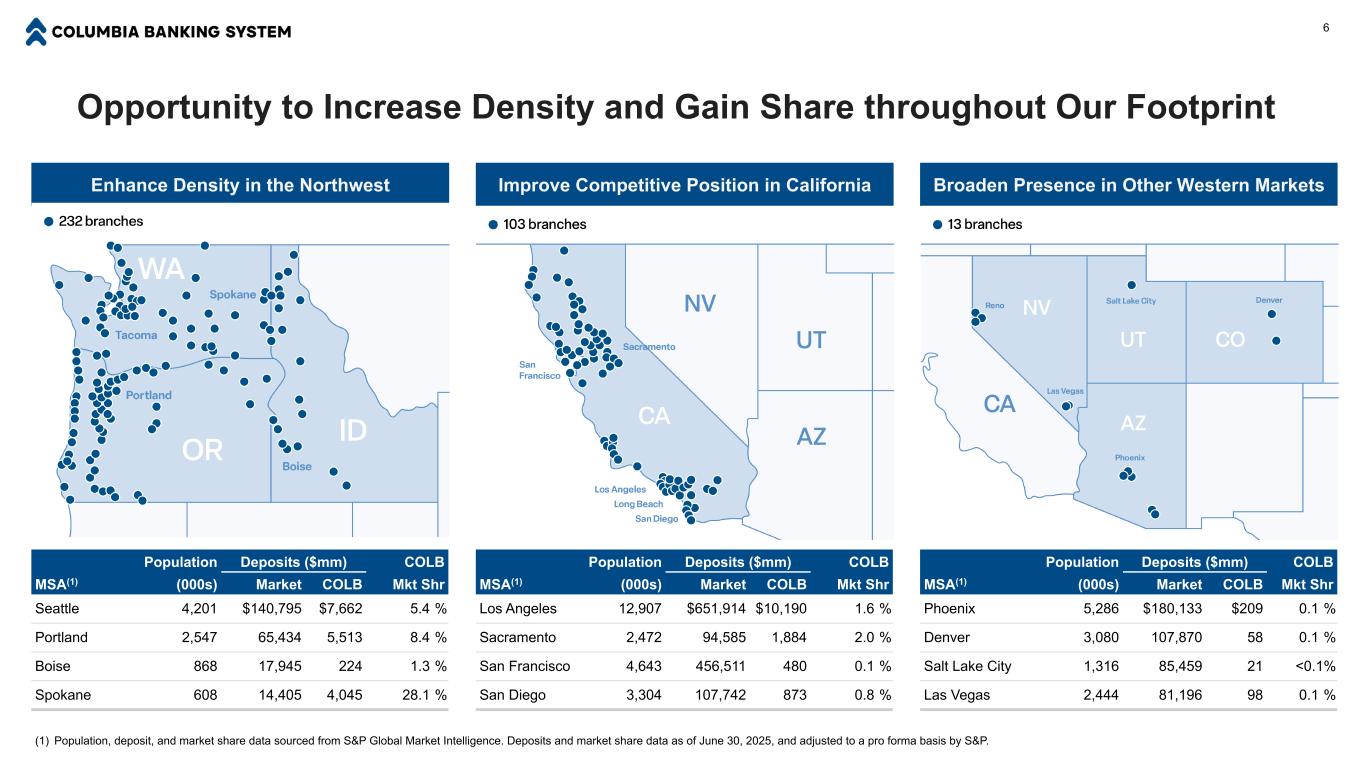
That's great. That's great. That's extremely encouraging. You got a slide in here that's talking about the opportunity that you have to increase density and gain share across your footprint. So I wanted to ask you on the hiring front, I think that's an underappreciated aspect of what you guys have been doing. I know you don't put out press releases on everything that you do, but curious if you could discuss how active that you've been on the hiring front, your appetite for additional hires and maybe what geographies or segments that you're looking to add to or business lines to expand.
Yeah, David, it's Chris. I would tell you that we're always interested and active. You never know when the best bankers in a market are gonna decide that it's time for them to make a move And so we're always oars in the water, looking at what we can and being ready. And we've always had the philosophy of if it's the right bankers and they can bring value to us, we'll create a position. So it's not by putting job postings out there and things of that nature. We're looking at expanding our wealth management operation, obviously looking at that Southern California footprint and building that out with trust folks, financial advisors, private bankers, and folks that focus on health care as well. I know Torrey has some of the same parts of it, and so I'll let him chime in as well.
Yeah, just to give you a couple geographies. I mean, I'm looking at a list of just over the last six months we've hired commercial bankers in Scottsdale, in Denver, probably three or four in Utah, in eastern Washington, in Seattle, in Portland, in Los Angeles, in Orange County. As Chris said, we just have a ton of bankers in the marketplace that, you know, really appreciate, understand the story of Columbia Bank and what we're doing and the success that we're having. And they want to be a part of the company. So it's a great place to be. And, you know, we're bringing them in and putting to work and they're kind of hitting the ground running. So it's really spread throughout, I think, the different business lines in the bank and the various geographies that we are in. Perfect.
And maybe just last one, you know, you've got a lot of excess capital as it is you're continuing to generate a lot of organic capital but you know given the regulatory relief that we've seen and the potential capital relief with that have you done any work around what that could mean for y'all just especially given the treatment of MSRs and does that change any of your capital priorities or or is buybacks it's you know it sounds like that's still the focus for now but just wanted to get your thoughts on that, if you've done any work around it yet.
Yeah, David, we have. And I'll step back in a moment and Ivan can give you the details on what that looks like. But from shifting our capital priorities, the short answer is no, it doesn't. I was intentional in my prepared remarks where I said that we still firmly believe the best investment we can make is in our company, our own company stock. And, you know, and I think that's why you see that, you know, we announced the big buyback last fall. And, you know, we're almost halfway through that allotment. And so hopefully folks take that as a sign that we're very serious about executing on that full amount. But in terms of, you know, what the MSR treatment does and things for our capital ratios. I'll leave those details to Ivan.
Thanks for the question. Like pretty much everyone else, I think we're still evaluating and putting a finer point on the exact impacts of the proposed rulemaking. Obviously, we're still in a comment period, so we're holding off our excitement at this point. But what's very clear from our perspective is that there is meaningful capital benefit under the proposed rules. Our current back-of-the-napkin analysis that we've done on the NPR shows that we'd have a benefit of potentially up to the ballpark of 100 basis points of CET1, which obviously would provide for some interesting optionality to consider going forward, but a lot more work to be done to fully unpack that going forward. That's helpful.
Operator
Thank you. And our next question comes from Jeff Rulis of DA Davidson. Your line is open.
Thanks. Good afternoon. Maybe, Frank, on the credit side, wanted to get a little more color on the not accrual ads and some of the net charge-offs there within the ag book, particularly if you could walk us through a little detail. Thanks.
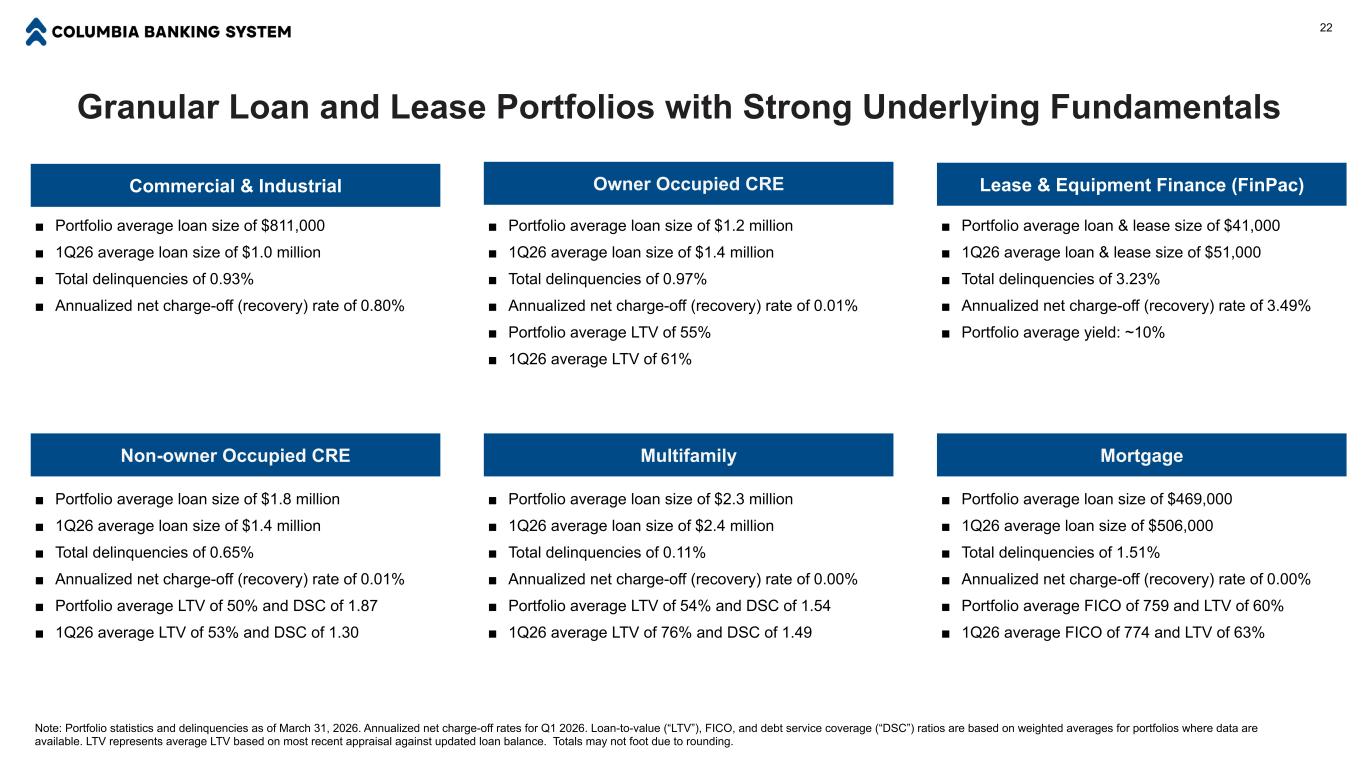
Yeah, Jeff, it's really centered in one customer relationship that's just a casualty of what's going on in the ag industry right now with cost inputs being extremely high and margins extremely tight. Those that have a little higher leverage have a more difficult time with it. And that's kind of what happened in this case. I mean, it's unfortunate, but, you know, as well as we do underwrite ag, I mean, there's inevitably going to be a casualty, and this is one of them. And the charge-off – go ahead.
I was just going to – you know, the type of ag that that was. Do you think it's systemic or, like you said, just one – systemic in the frame of margins are tight, but maybe just the industry that that was in?
Not systemic, Jeff. This particular one was in the hop industry, if you will. So, I mean, I think most of us know that, I mean, hops and grapes, so beer, wine, spirits even. I mean, going through really what I would call a kind of a generational shift in demand. And, you know, that only compounded what was going on in this situation. So, you know, I think it's pretty well explained in that.
Okay. And you were going to talk about the charge-off. Was it interrelated, at least? Interrelated. Exactly.
Appreciate it. And maybe just one other one, if I could, got to commentary on a pretty flattish loan growth year, understanding the growth versus transactional. Is that a pretty straight line over the course of the year? I guess as I try to think about 27 and potentially a return to net growth, is the back half potentially have a little bit of uptick there? And if you have a crystal ball to look at 27 and think about, hey, we think we could scratch out low single digit. Any commentary on the trajectory of that flattish for the year? Thanks.
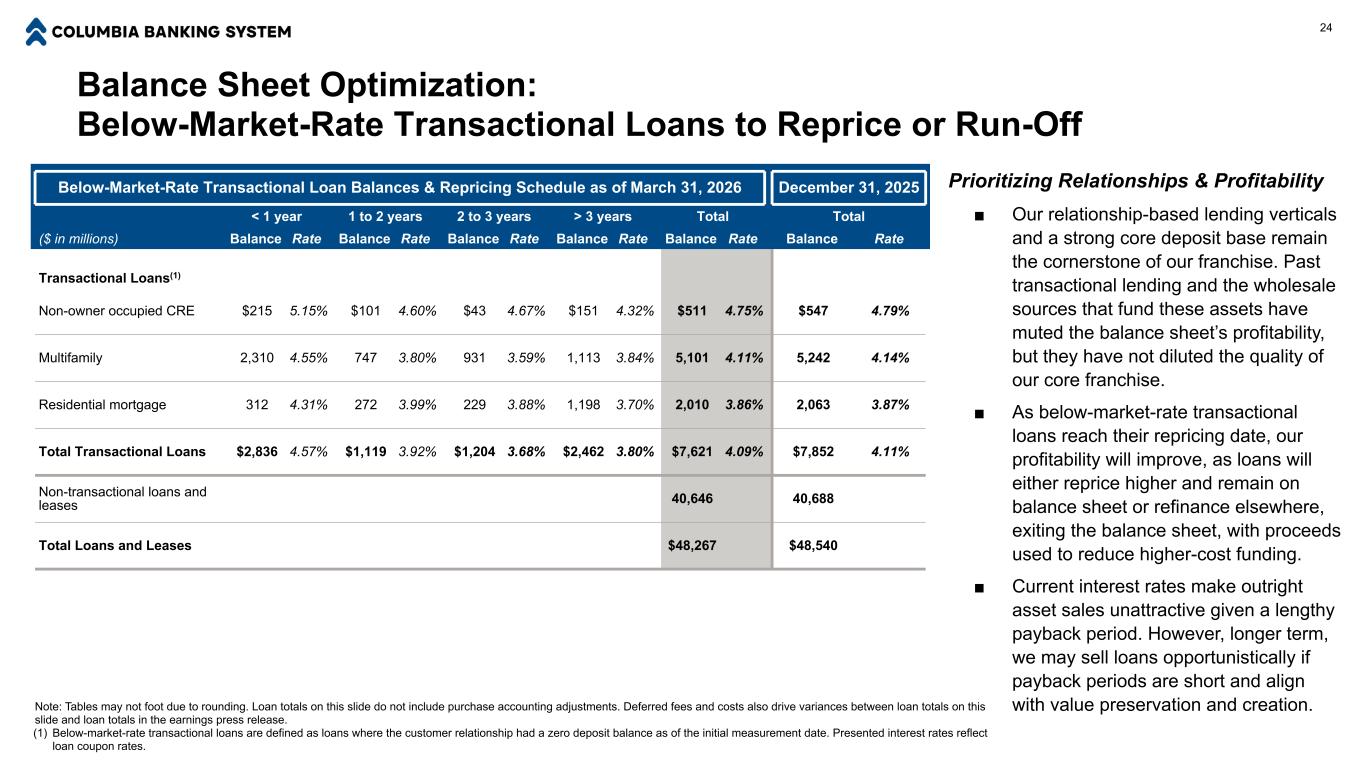
Yeah, it's a great question. I think any given quarter we'll see a little bit of movement up and down in the loan portfolio. This quarter, obviously, we had about a $100 million reduction. Our general expectation for the next three or four quarters is that portfolio will stay relatively flat. In the last two quarters, we've seen almost a half a billion dollars of that transactional portfolio run down. And like we talked about earlier, we're replacing that actively with strong growth in CNI, owner-occupied real estate portfolios. So any given quarter, we could see a little bit of movement up or down, but generally throughout the course of 2026, we're expecting roughly flat. I'll hand it to Tori for some color commentary on the pipeline.
Yeah, maybe I'll just talk a little bit, Jeff, on pipeline. So our combined commercial pipeline as of the end of March was about $3.3 billion, which was up about $600 or so million from the end of the year. So a lot of really good activity. And that's even with the production that we had over the quarter. I mean, it's up about 50% from a year ago. So a lot of activity, a lot of good stuff happening. Feel very optimistic on our ability to generate C&I loan growth, owner-occupied loan growth, relationship growth in the company for sure. And I think to Ivan's point, I think we'll have a really, really good shot at being stable throughout the year. And I think as the momentum picks up, I think that kind of moves into 2027, should be a good year for us.
And I failed to mention this earlier, but over the course of a year, out of that transactional, we're expecting a billion to a billion and a quarter, that book to run down. And so for us to stay flat on that, it does require 4% or 5% loan growth out of that core relationship portfolio. So that is very real in terms of the core loan growth we're seeing there just to stay even in terms of the size of that total portfolio.
Operator
Thank you. And our next question comes from Matthew Clark of Piper Sandler. Your line is open.
Yeah, good afternoon, everyone. just a few cleanup credit questions the uptick in 30 to 89 days past due I know it's not a big number on a percentage basis but just some color there where FinPAC delinquencies stood at the end of the quarter versus the fourth and then classified balances you know this quarter versus the end of last year.
All right, Matt. So, your first question with regards to the 31-day to 9-day delinquencies, really, the uptick was centered in one commercial real estate loan that is really in the process of being paid off, and that really accounted for the entire difference between fourth quarter and first quarter difference fin pack fin pack is is is exactly where we thought they would be there their delinquencies are down from the from the fourth quarter as were there as where their charge ops looking forward you know they've been they've been kind of bouncing along the bottom, and they continue to bounce along the bottom of their charge-offs. And so at about a 3.4, 3.45 net charge-off clip, I mean, that's a great number for that business, and that's what they're doing. So where their non-performing are at the end of the first quarter, I would expect next quarter to come in pretty close, maybe a little bit higher than they are. But, you know, that's to be seen. Like I said on previous calls, you can kind of figure about 80% of non-accruals roll to net charge-offs. And what was the last question?
You had another Oh, just classified balances. I didn't see it in the deck. I was just curious.
Classifieds held pretty flat quarter over quarter. Special mention were significantly improved quarter over quarter, really due to we've had some good luck in resolution of some of these, special mention as well as had a couple of them pay off.
Okay, great. And then the other question I had was around expenses. I think you maintained your adjusted expense run rate guide at $335 to $345. But I believe you have some additional cost saves from PBBI. And then just thinking through kind of all-in core expenses for the year, I think the prior guide was a billion and a half. But again, it seems like you're tracking below that, at least in the first quarter. or just help us understand maybe, you know, why you maintained it and what we should expect to see, I guess, in the run rate going forward?
Yeah, that's a great question. This is Ivan. We did have a couple of things on Q1 just in terms of where we landed. It did come in lower than we had, I'd say, planned for in Q1. You know, there's always a few smaller one-off items, just business as usual stuff. And those things amounted to $1 or $2 million worth of benefit to us in Q1 that that was a positive. I'd say from a strategic perspective, you know, just the strong execution on our, you know, with synergies and happening a little bit earlier than we'd anticipated was a meaningful factor. And then we did talk earlier about some of the investments that we're making that you'll see us talk about in future quarters, both in terms of bankers across the entire footprint, as well as expansion in markets like Colorado, Utah, Nevada, as well as in our legacy markets. So, there is reinvestment happening over the next two quarters. All that said, you know, I do expect that we will come within that $1.5 billion expense guide due to, you know, continued expense discipline as we execute on those items. Okay, great. Thank you.
Operator
Thank you. And our next question comes from Christopher McGrady of KBW. Your line is open.
Oh, great. um how you doing uh i've been just going back to math question just make sure they got a finer point on the expenses so xcdi 335 345 and q2 do you do you stay in that range in q3 i haven't fully mapped out the back app but are you inside that range maybe the low end or can you reach below that once everything's fully fully in the run right no we'll come in we'll come in below we'll come in below that in the second half of the year.
So I think if you were to do kind of the math from 90 days ago, it's in the ballpark of 330 to potentially 335 in the second half of the year in Q3 and Q4 as we execute the remaining synergies. I made a mention of it earlier. I think we're 102 million executed out of the 127 million that's been fully identified. There's no question mark around the timing or the impact or the sizing of the remaining cost synergy, that's all known, documented, fully written in pen. So that will happen, and that will start to flow through in Q3. So you'll see a step down kind of into that range as we turn the corner into the second All right.
And then moving, just kind of putting the pieces together with the estimated impact from risk weighted assets. I know you don't have an official public target on CET1, but how important is the TCE ratio? I've heard a few banks talk about, obviously, with the rating agencies, they focus on it, but how do you balance? What's the right balance as you go into the medium term? Basically, think about buybacks after this one's done.
Chris, we've always felt like, from a TCE standpoint that you know we want to be we want to be in the neighborhood of eight percent and and and the reason is is that just gives us you know I guess you call it what you want flexibility comfort capital whatever but but also historically we back out you know the current you know a OCI impacts of bond portfolios and things you know eight percent kind of historically for our balance sheet is tied into what would be roughly 12% total risk-based capital, and that's a target that continues to be our binding constraint in terms of how we're viewing capital deployment.
Okay. Thanks for that. And I guess, too, housekeeping, if you don't mind. Ivan, any help on the tax rate? And then just getting back to the ag loan, that relationship that drove the charge off than not accruals. Has that been your estimate fully addressed, like provision-wise, in terms of the P&L?
Yeah, so I'll take both of those. On the first one, the answer is same as last quarter. I would use a 25% all-in effective tax rate as you model it out. And on the second one, you know, I think the answer is obviously yes, right? We feel very comfortable with the level of allowance that we have, 100 basis points. The modeling and the process that we go through does factor in, obviously, components of a baseline economic scenario, but we have a lot of deep discussion across the institution, and we also incorporate elements of an S2 downside scenario. And as it sits today, we've got 100 basis points of lost content. That's over three and a half years of charge-off content on a run rate basis relative to the last few quarters. and we have an additional 28 basis points of coverage from the credit discounts on the acquired portfolio. So yeah, fully in line and fully contemplating the credit elements that Frank talked about earlier. All right. Awesome. Thank you. Thank you.
Operator
And our next question comes from David Cierverini of Jeffries. Your line is open.
Hi. Thanks for taking the question. So I wanted to swing back to the deposit outlook. You had good success with the $450 million in due deposits from your recent small business and retail campaign. Do you have similar campaigns planned for the spring or summer to continue the deposit momentum?
Yeah, David, this is Chris. The current campaign will end here in the next 10 days or so, end of the month, two weeks. And then we always take a bit of a break in between, clean up, client follow-up, make sure everybody's got everything buttoned up like they need to. And then we'll relaunch in June, and then we'll have another one that goes into the fall as well. So typically three per year. I'll probably reiterate that there's no special products, there's no special pricing. This is all the stuff that we have off the shelf, and it's really a campaign around focusing our retail branches on going out and deepening business and winning business.
Great. And looking at the non-interest-bearing deposits on a period-end basis up modestly, sequentially, average basis was down a bit. But curious on your view in terms of looking at the forward curve and how there's fewer cuts in the forward curve, to what extent this could be a headwind on non-interest-bearing deposit growth?
Oh, on non-interest-bearing deposit growth? Right. Yeah, I don't think that we'll see a big headwind in terms of non-interest-bearing deposit growth relative to 90 days or 180 days ago when we expected two rate cuts. I think it's been a competitive market for the last three years since March Madness and will continue to be. But we talked about the strategies that we're deploying in terms of relationship-based banking, business bank of choice on the commercial side, and then the campaigns that Chris talked about earlier. And we feel like those will continue to drive favorable, positive growth in terms of the core deposit portfolio going forward. And then just in general on the interest rate environment, I think that our balance sheet is incredibly well positioned for neutrality, which is by design. And as we think about various scenarios that could go on as we look forward throughout the rest of the year, most of the things that will drive us upwards and forwards are going to be things that we control in terms of the execution of our strategy instead of whether we get one cut late in the year or not doesn't really move the needle as much as kind of our strategic execution plan. So those would be my comments on that.
Operator
Thank you. And our next question comes from Janet Lee of TD Callen. Your line is open.
For the second quarter, just making sure that this math is reasonably correct, for NII, can we assume flattish average earning assets from here going into the second quarter? And then, Ivan, you talked about getting to that 4% NIM. So does that get us to about $605 million-ish NIM for this – sorry, NII for the second quarter? Am I thinking about this correctly, or is there a timing issue on when you reach the 4%?
No, I think you're thinking about it correctly.
Okay, got it. Thank you. And on your slide 12, I believe on the NIMS slide, you said the net interest margin outside of the two one-off impacts in the fourth quarter was fairly consistent and stable. If you strip out the entire PAA on a core coordinate basis, can you comment on how that has trended and if there has been any change in PAA forecast given the change in environment?
No. We view the discount accretion on the acquired loans as well as any discount accretion, whether it's through a bank acquisition or through regular bond purchases that we do each month, we view that to be core. Obviously, in unique circumstances like in Q4, if a large credit with a large mark pays off early, there can be some short-term volatility, but in general, we don't disclose a breakout of PAA in regard to that. Was there a second question that I didn't touch on there?
Operator
Thank you. And our next question comes from Anthony Ilion of JPMorgan. Your line is open.
Hi, everyone. Ivan, you saw deposits contract in 1Q as expected, but can you give us some color on what you expect for 2Q deposits and the magnitude of the headwind you expect from tax payments here in April?
Yeah, I'll start and then Chris can jump in if he wants to correct anything here. But generally what we see is that deposit contraction begins happening in kind of the latter part of Q4, which is what we saw and disclosed in our Q4 results late last year, kind of as we enter the holiday season. From a balance sheet perspective, I talked earlier about the ending versus average nuances on wholesale funding, and that Q4 contraction that we talked about last quarter resulted in about $500 million of draws in the latter days of December. And then generally, obviously, as we go through tax season here in April, we kind of reach a low point kind of in the mid to late April timeframe and then return to a rebound. through May and through June. So, you know, Q1 being one of our historically weaker seasonal quarters, Q2 being a bit of a mixed bag. So, you have kind of a V pattern in terms of how that goes. And so, and then Q3 and Q4, you know, Q3 being strong and Q4, like I talked about. So, that's generally how we think about the seasonal deposit flows.
Thank you. And then slide 17 on the ACL. Does this 1% feel like a good level, just given your earlier comments, that you expect stable loan balances for the rest of this year? Thank you.
Yeah, I think I mentioned a few things earlier. You know, I feel very comfortable with 1% allowance on loans. You'll note on the right side there that as you factor in the credit discount on acquired components for up to almost 1.3%. You know, we looked at that from every which way and feel very well-reserved for the level of risk that's in our portfolio and the macroeconomic outlook going forward.
Operator
Thank you. And our next question comes from Samuel Varga of UBS. Your line is open.
Good afternoon. I just wanted to turn back to long growth for one more question. If we look at the payoffs on the traditional sort of relationship-oriented portfolio, the payoffs still seem relatively elevated after 3Q, 4Q and now 1Q as well. I'm just curious as we sort of look into conceptually into 2027, do you need to see these payoffs moderate to start producing loan growth or do you think that the production volume on its own is able to push balances higher without the payoffs moderating? Thank you.
Samuel, this is Tori. I'll start. I think Ivan will probably chime in a bit. I think payoffs, paydowns, the typical flow within the commercial loan book is about where it would normally land. We had production on the CNI side that far out-exceeded and out-stripped that. So we've got some, I think, nice CNI growth for this quarter. I feel really good about the pipeline and the CNI growth in Q2 and beyond through 2026, and then in 2027, we've got a lot of great momentum going on with the company. The payoffs on the real estate side, much of that is, I think, as we've talked about, is just transactional loans that we're just letting go out the door because they're not going to be a relationship in the company. For those that are transactions, that we feel like we can bring in deposits and bring in core operating accounts and make them relationships, and we are doing that. So I think we're kind of on pace of where we are at this point. And then you'll probably see in 2027 and 2028, you see less of the transactional runoff and continued growth on the production side.
And, you know, from my seat, one area that we remain laser focused is on that transactional portfolio. We've been talking about it for several quarters in a row. And as you'll see in the disclosure back on page 24, we've got nearly $3 billion of transactional loans that are sitting there that are priced in the mid 4% range that will either mature or hit a repricing date over the next 12 months. And then the volume of that begins to slow down meaningfully as you get into the latter part, call it mid-2027. So that's where I think you've got the potential for an elevated level of prepayment volumes as those loans come back into the market at rates that are markedly different than the ones that they've been enjoying for the last several years. So there is that potential there. Whether or not we fully replace 100% of that volume, however, we're very confident in our ability to drive positive operating leverage and continue to drive growth in top-line revenues, as Clint alluded to and mentioned earlier, we don't need to see net loan growth or balance sheet growth to drive positive operating leverage. And so that's one of the positive dynamics that we have is the optionality that that affords us. Plan A, replace it with core relationship-based loan volume. But if we don't fully replace it, we've got opportunity to continue to optimize our funding stack as well. And that as well will be accretive to net interest margins. So we feel very positively about driving positive operating leverage going forward.
Great. Thanks for that. And just a quick follow-up. Do you happen to have the retention number on the transactional loans that can't do this quarter and stay on balance sheet?
Don't have the number in front of us. I would say that with rates being elevated, uh we're we're having a lot of success in in those that are going from fixed to floating and and retaining them at this point at a reprice which is uh very positive for the bank but also in it with generating some deposits and operating accounts from those uh transactional uh loans and and making them full relationship customers of the bank so a lot of good things my question with that.
Operator
Thank you. I'm showing no further questions this time. I'd now like to turn it back to Jackie Baldwin for closing remarks.
Thank you, DeeDee. Thank you for joining this afternoon's call. Please contact me if you have any questions or would like to schedule a follow-up discussion with members of management. Have a good rest of the day. This concludes today's conference call.
Operator
Thank you for participating, and you may now disconnect.