Operator
Hello, everyone. Thank you for joining us and welcome to the CubeSmart first quarter 2026 earnings call. After today's prepared remarks, we will host a question and answer session. If you would like to ask a question, please press star one on your telephone keypad. To withdraw your question, press star one again. I will now hand the call over to Josh Schutzer, Senior Vice President of Finance. Josh, please go ahead.
Thank you, Paige. Good morning, everyone. Welcome to QSmart's first quarter 2026 earnings call. Participants on today's call include Chris Maher, President and Chief Executive Officer, and Tim Martin, Chief Financial Officer. Our prepared remarks will be followed by a Q&A session. In addition to our earnings relief, which was issued yesterday evening, supplemental operating and financial data is available under the Investor Relations section of the company's website at www.cubesmart.com. The company's remarks will include certain forward-looking statements regarding earnings and strategies that involve risk, uncertainties, and other factors that may cause the actual results to differ materially from these forward-looking statements. The risks and factors that cause our actual results to differ materially from forward-looking statements are provided in documents the company furnishes to or files with the Securities and Exchange Commission. Specifically, the Form 8K we filed this morning, together with our earnings release filed with the Form 8-K and the risk factor section of the company's annual report on Form 10-K. In addition, the company's remarks include reference to non-GAAP measures. A reconciliation between GAAP and non-GAAP measures can be found on the first quarter financial supplement posted on the company's website at www.cubesmart.com. I will now turn the call over to Greg.
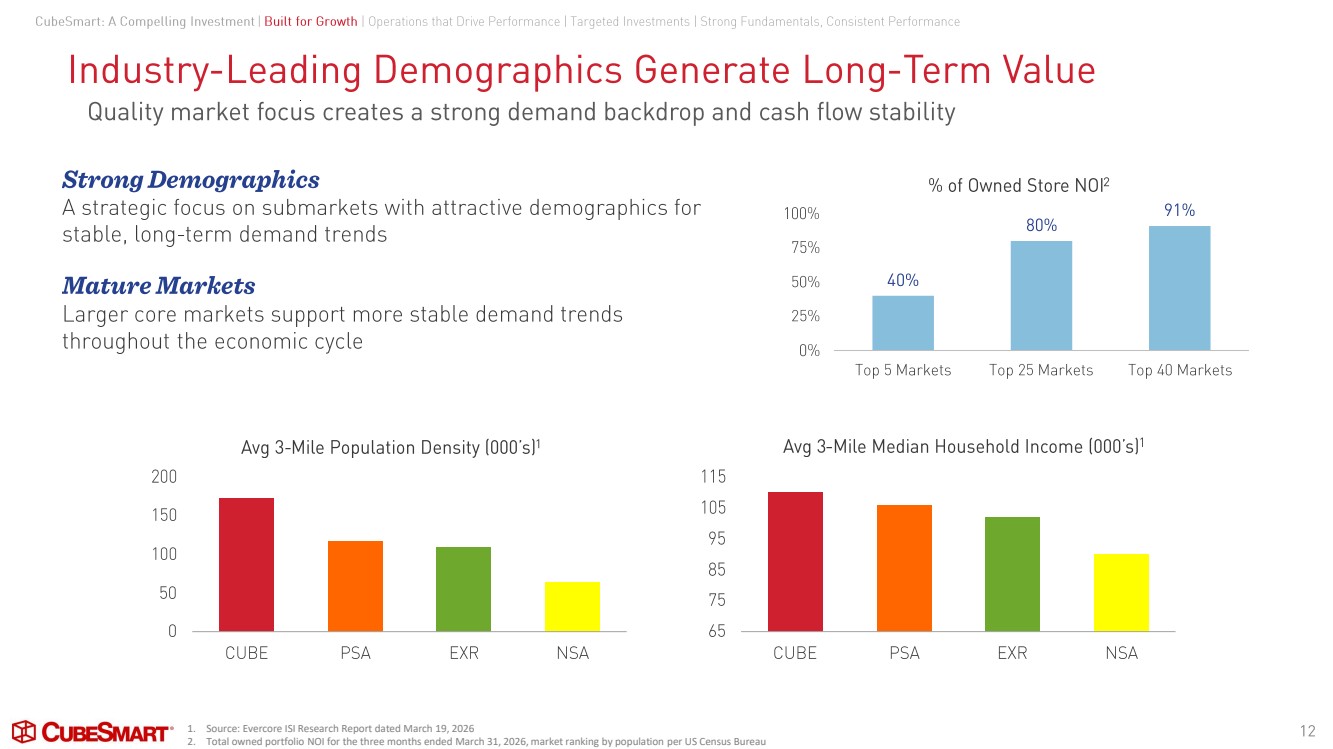
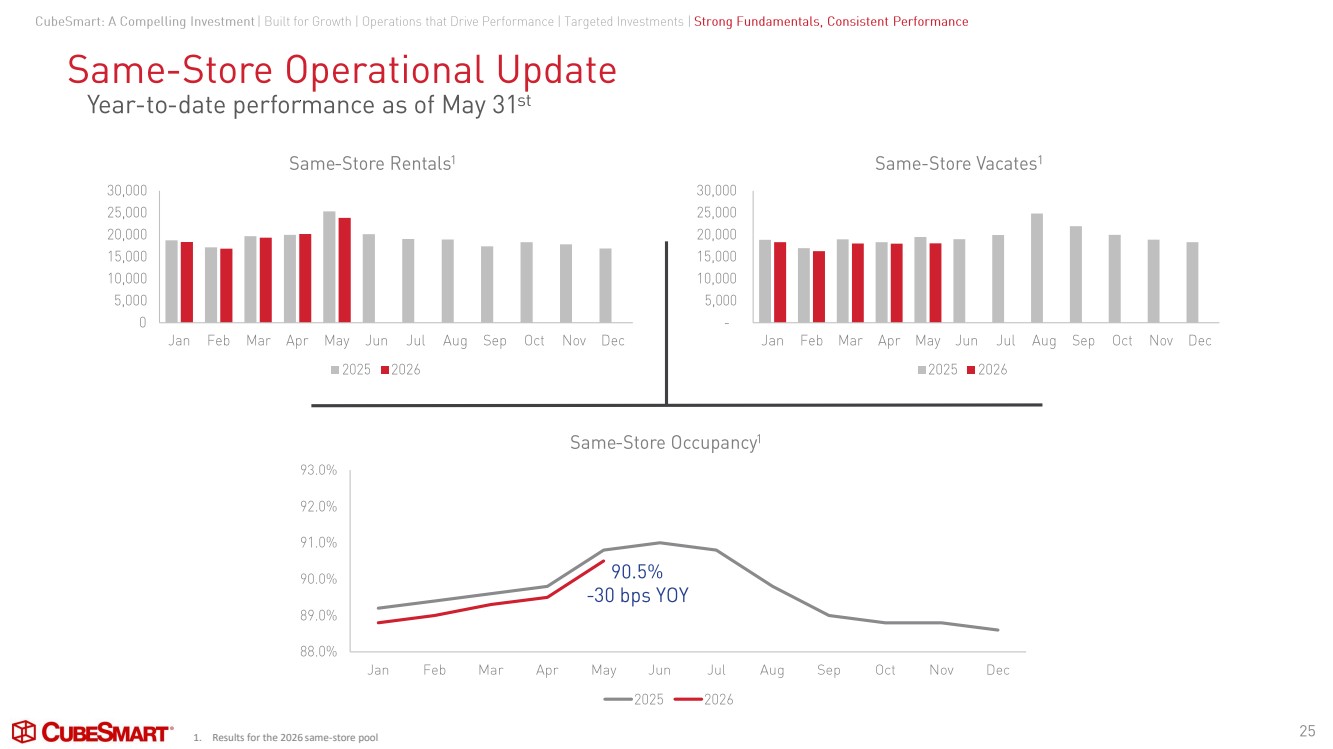
Thank you, Josh. Good morning. The first quarter showed a continuation of trends from late last year with results that were in line with our expectations. We are encouraged to finally see the inflection in same-store revenue growth this quarter, as the stabilization and operating trends we experienced in late 2025 is flowing through the financial metrics. We expect continued gradual improvement throughout 2026, albeit without a projected catalyst coming from the macro environment positive move-in rates and same store revenues were supported by steady demand trends and lessening headwinds from new supply we are encouraged that the wave of new stores from the last couple of years continues to lease up while the forward pipeline remains lighter this environment continues to showcase the strength of our quality focus strategy with primary markets outperforming and showcasing their lower beta characteristics. Steady demand when combined with fewer vacates resulted in a 240% increase in net rentals for the quarter, helping to narrow the year-over-year occupancy gap to now 20 basis points by the end of April and putting us in a good position entering the spring-summer busy season. More stable urban markets in the Northeast and Midwest continue to outperform, while our more transient supply-impacted markets across the Sun Belt and the West Coast are beginning to see green shoots in the form of second derivative improvement. We are also encouraged by pricing trends. Last year, we began seasonally pushing rates a little earlier, which for us created a tougher March comp, but move-in rates have improved throughout the month. They ended the quarter up 2%, and that plus 2% spread held through the month of April. Across all markets, our existing customer metrics remain strong, with no change to attrition rates or credit. Our pricing and operating strategies, when combined with our best-in-class portfolio are attracting a high-quality customer who is remaining in the portfolio longer. Looking at performance across markets, 21 of our top 25 MSAs saw sequential improvement in same-store revenue growth during the quarter. The Acela Corridor continues its outperformance led by New York, Austin, and Washington, D.C. MSAs. Midwest markets led by chicago maintain their steady pace of improvement major sunbelt markets showed encouraging signs with miami swinging to positive same store revenue growth and phoenix and atlanta making meaningful progress in their recovery from the influx of new supply we are proud of the work our operations team has done to have us well positioned to capitalize on the opportunities presented as we transition into our busiest time of the year. We remain committed to our strategy of building the highest quality portfolio in the storage sector. Through cycles, our target markets and their strong demographics produce the best long-term risk-adjusted returns. The strength of our portfolio demographics and density of populations around our stores ensures stability of demand, and insulates our portfolio from some of the cyclicality faced by more transient and supply-impacted markets. We are confident that our focus on building the highest quality portfolio in the self-storied sector by acquiring high-quality assets in top markets will create meaningful value for our shareholders over the long term. Thank you, and I'll now turn the call over to our Chief Financial Officer, Tim Martin, for his comments.
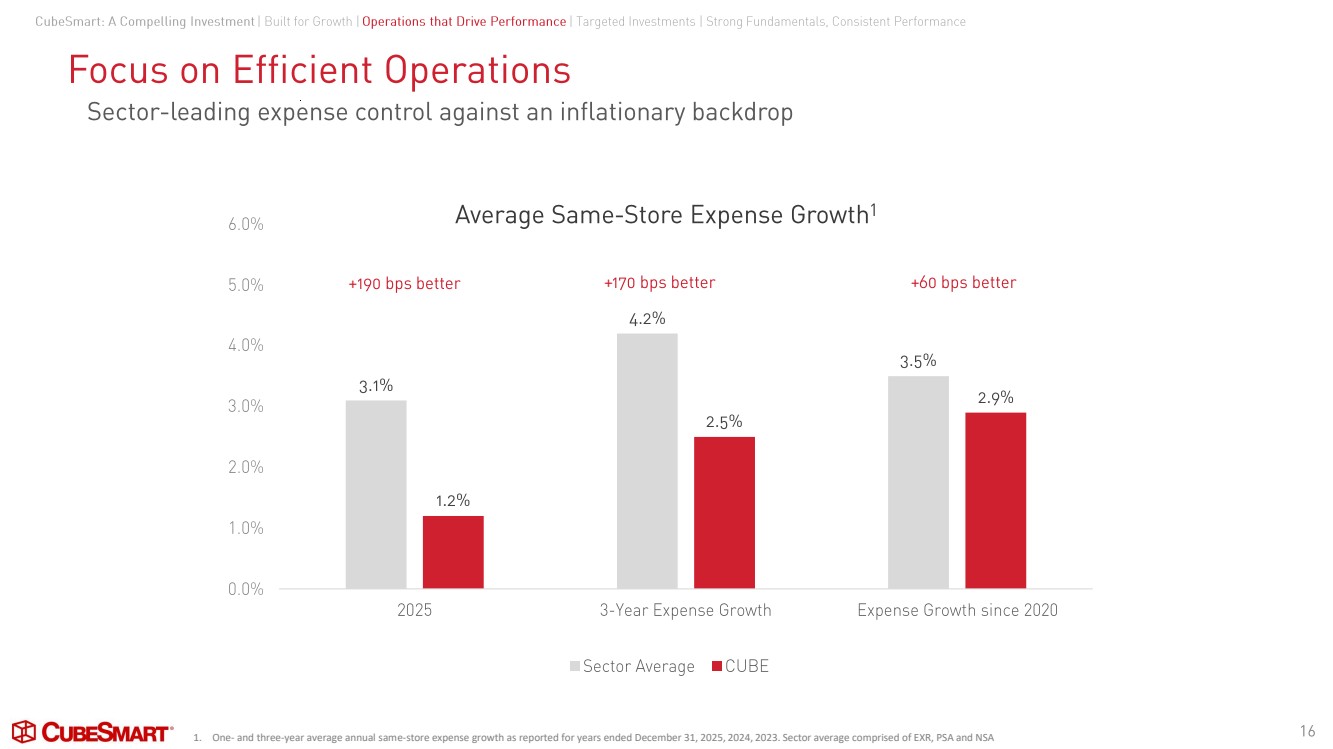
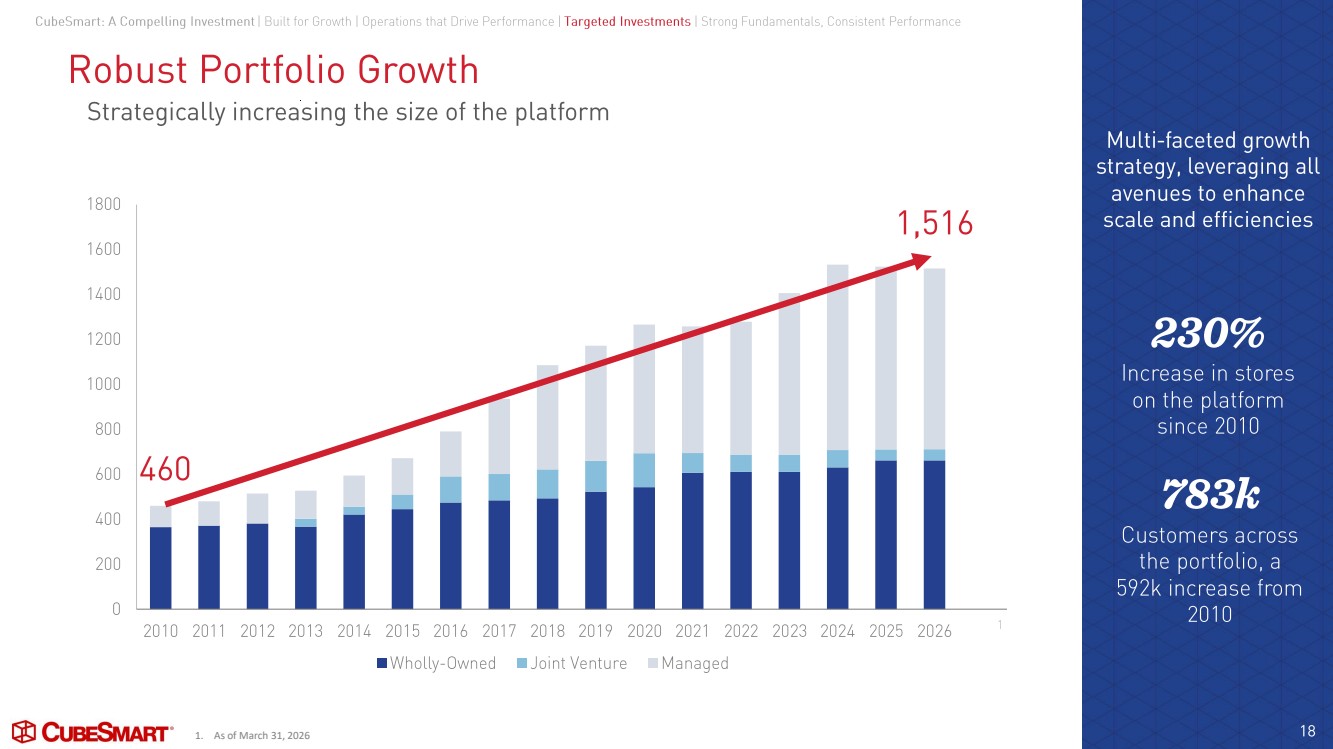
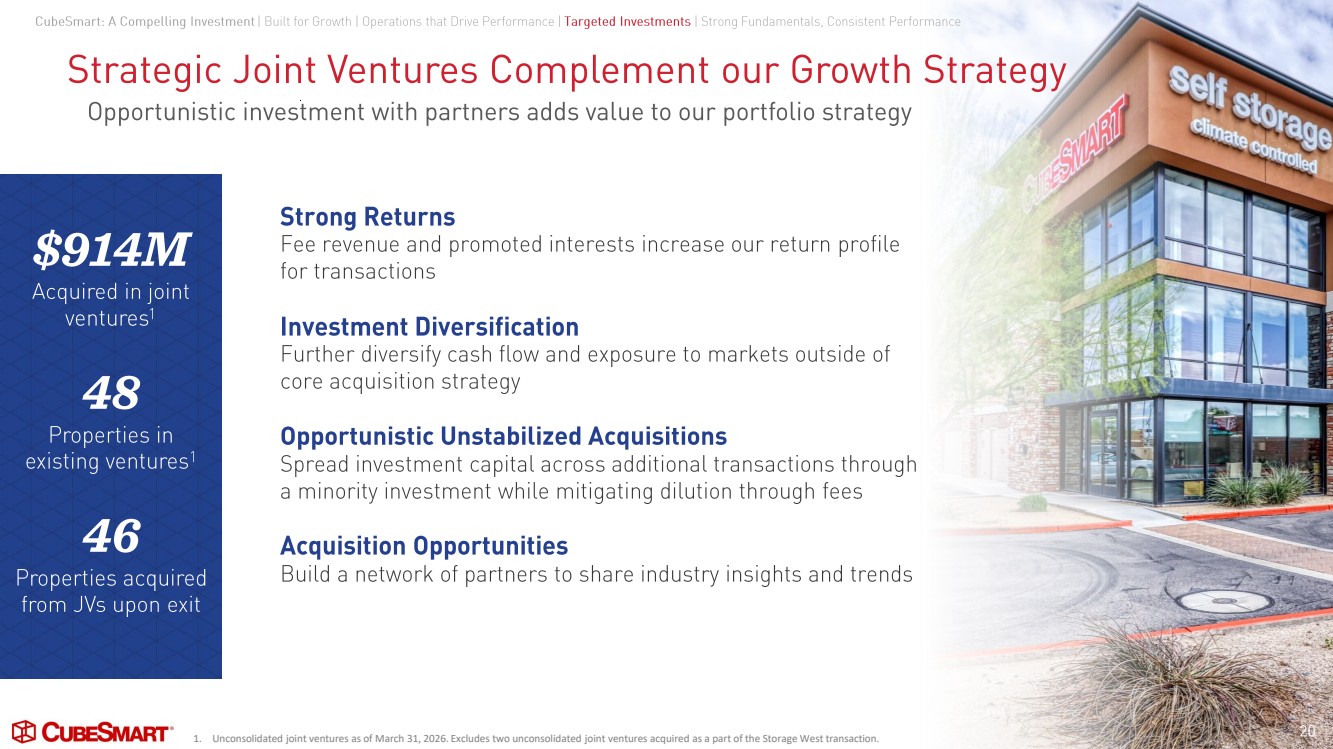
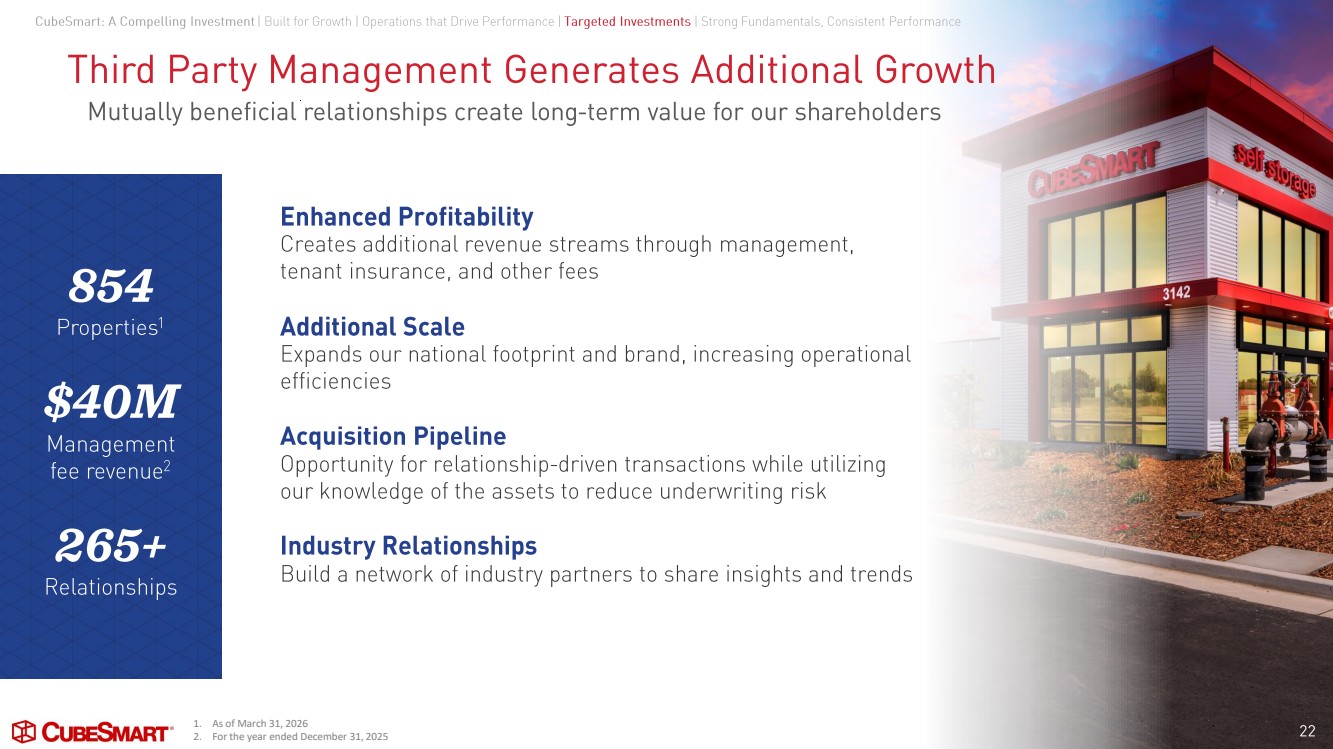
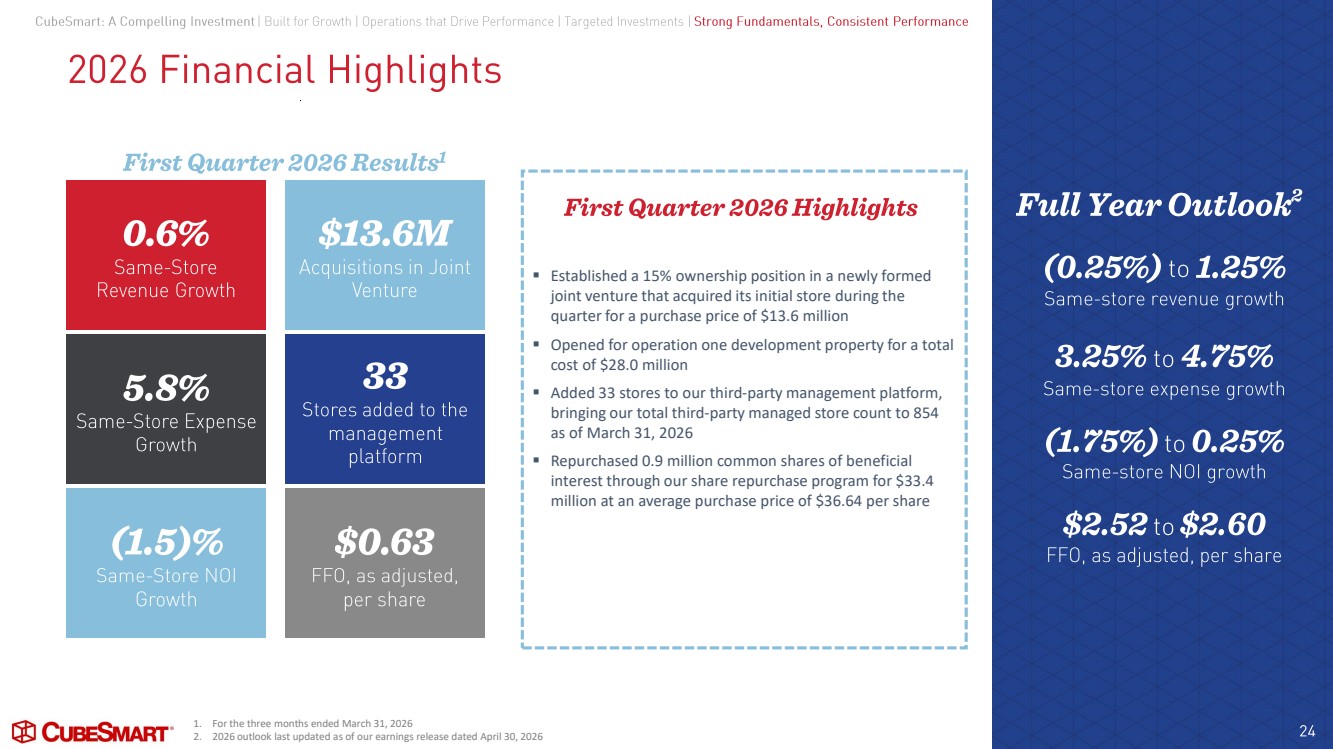
Thanks, Chris. Good morning, everyone. Thanks for taking a few minutes out of your day to spend it with us. First quarter results were encouraging, coming in at the high end of our expectations, giving us a nice positive start to the year. Same-store revenue growth was 0.6% over last year, and as Chris mentioned, nice to see top-line growth flip to positive for the first time since mid-2024. move-in rates remain positive year over year while the occupancy gap further narrowed to down 30 basis points from down 70 basis points at year end the early months of 2026 were a continuation of trends from last year with generally stable overall levels of demand demand does vary across markets and sub markets and and with a continued bifurcation and performance between the outperforming core urban markets in the northeast and midwest and the more volatile performance across the more supply impacted markets throughout the Sun Belt and Southwest. However, we have seen second derivative improvement across most markets. Same-store operating expenses grew 5.8% over last year in line with our expectations. After four straight years leading the industry in expense control, our expectation is for more inflationary type growth this year, with some particularly tough comps early in the year to outsize growth in the quarter. We knew snow removal costs were going to be elevated over the prior year, and those elevated costs accounted for about 120 basis points of our overall quarterly same-store expense growth. We entered the year with attractive return opportunities across our primary marketing channels and a plan to front load some of our spending to take advantage. When combined with a tough comparison, as we had historically low spending in the first quarter of 2025, the year-over-year growth was robust. We expect that for the full year, marketing as a percentage of revenues will align with historical trends. Personnel expense growth reflects our continued focus on delivering the experience our customers tell us they desire. Two-thirds of our customers tell us they want some level of in-person service. As we continue to fine-tune staffing based on our data-driven prediction models, as well as our first-person customer feedback. We expect personnel expense to grow at current levels throughout the first half of the year, tapering a bit in the back half as year-over-year comparisons ease. Revenue growth of 0.6% combined with 5.8% expense growth yielded negative 1.5% same-story NOI growth for the quarter. We reported FFO per share as adjusted of 63 cents for the quarter, which was at the high end of our guidance entering the quarter. On the external growth front, we continue to execute on our disciplined capital allocation strategy, looking for creative avenues to attractive risk-adjusted returns in this environment where the disconnect between public and private market valuations persisted. We again repurchased shares in the quarter as the relative value of our portfolio made it our most attractive investment option. We own the highest quality portfolio of self-storage assets, and at the low valuation levels during the quarter, the best risk-adjusted return we had was investing in our existing high-quality portfolio rather than the relatively higher private market valuations for what were ultimately inferior assets. Year-to-date, this has been our most attractive avenue for capital deployment. We also closed on the first store in our recently announced new joint venture with CBRE-IM with a $250 million mandate to invest in high-growth markets, allowing us to continue to grow the portfolio with enhanced returns. In the current environment and our current cost of capital, joint ventures such as the CBRE Venture are a good investment option for us to pursue. On the third-party management front, we added 33 stores to the platform in the first quarter and ended the quarter with 854 third-party stores under management. Our balance sheet remains well positioned with conservative leverage and access to a wide range of capital sources to fund potential growth. We have a bond maturity late in the year that we will address with existing capacity or through accessing the debt markets opportunistically in the coming quarters. Details of our 2026 earnings guidance and related assumptions were included in our release last night. As I opened with, performance in the first quarter was encouraging and in line with our expectations, resulting in no change in our guidance range and underlying assumptions, with the small exception of a slightly lower share count resulting from our share repurchase activity. Thanks again for joining us on the call this morning. At this time, Paige, why don't we open up the call for some questions?
Operator
All right, we will now begin the question and answer session. Please limit yourself to one question and one follow-up. If you would like to ask a question, please press star 1 on your telephone keypad. To withdraw your question, press star one again. Please pick up your handset when asking a question. If you're muted locally, please remember to unmute your device. Please stand by while we compile the Q&A roster. Our first question comes from Samir Kanaal with Bank of America. Your line is open. Please go ahead.
Thank you. Good morning, everyone. Hey, Chris, looking at your advertising expense, Growth was up year over year. I guess when do we start to see the impact of that come through? Average occupancy was up slightly, sequentially. Just help us understand kind of how to think about occupancy with the spend you're doing. Should we expect a bit of a ramp up in 2Q? And maybe you can unpack that for us.
Thanks for the question. As Tim touched on, there was a lot of variables that marketing growth in Q1, obviously starting with relatively, by historical standards, low spend in the first quarter of 2025, so a very difficult comp we knew we had. We were experiencing late last year and going into the beginning of this year, good ROI on channels. Continue to see some good opportunities through not only paid search, interesting opportunities there. Whereas spend, in terms of a translation, it's always going to be that balance between occupancy and rate. So certainly, as we think about the ROI on that spend, it's a combination of those two. Are we getting more customers into the top of the funnel? As you've seen in the trends in asking rates, and as I mentioned, that continued to be in positive territory, up about 2% in April. That occupancy gap, as I said, continued to contract, was 20 basis point to continue. Again, that being said, this is a weekly decision. For the full year, our marketing will...
Thank you for that. And I guess just my second question is on New York, certainly holding up well. Maybe talk about kind of the demand trends you're seeing in New York, and certainly anything on supply would be great as well.
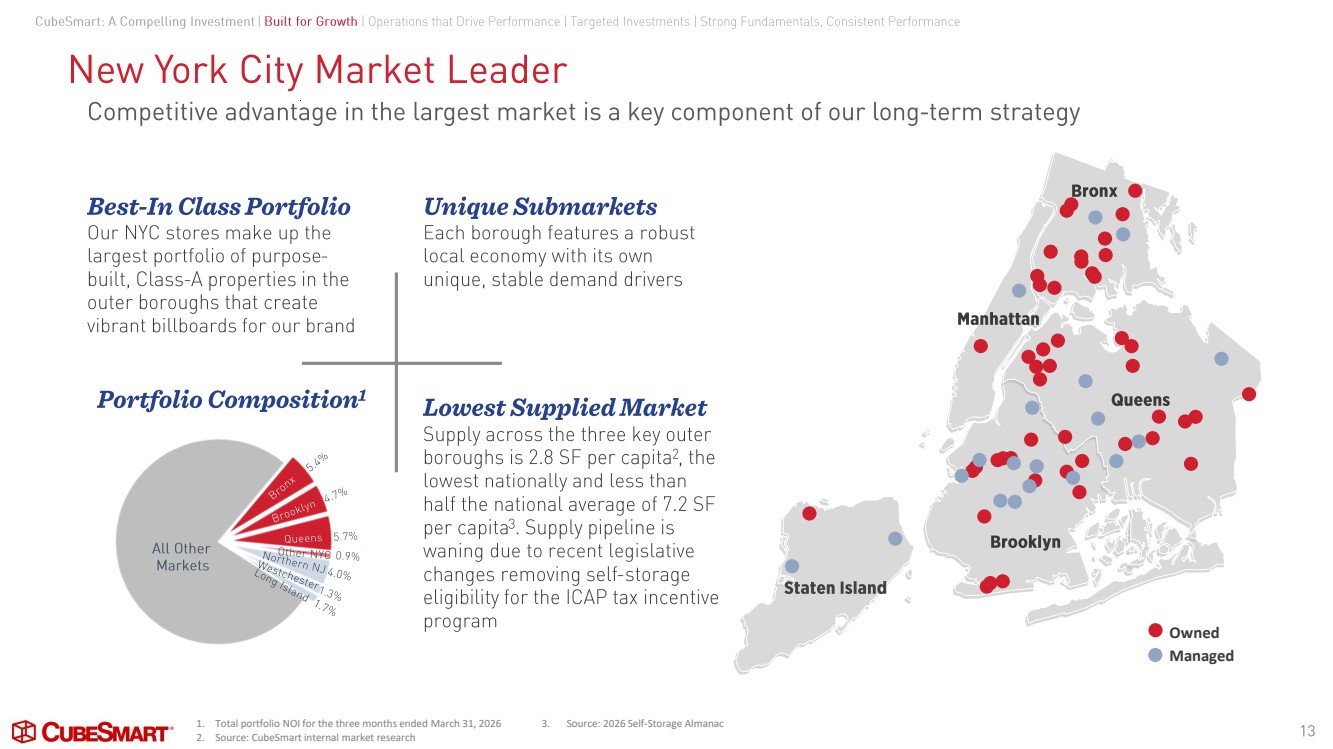
Yeah, I think New York continues to be a star performer for us. It's why we love the market, incredibly resilient through cycles. What we're seeing is, you know, almost a complete absence of new supply in the outer burn, an existing cube, that sharp decline in supply that we've seen now over the last couple of years is to be productive in Manhattan.
Operator
Our next question comes from the line of Michael Goldsmith. Goldsmith, my apologies. with UBS. Your line is now open.
Good morning. Thanks a lot for taking my questions. Chris, in your prepared remarks, you noted a 240% increase in net rentals in the quarter. Maybe you can break that number down a bit, both the steady demand and fewer vacations and what that could mean for trends going forward.
Yeah, I think the trend in the quarter is pretty consistent with what we had seen historically over the last bit. We disclosed it on page 16 of the supplemental package. So rentals in the first quarter were down 1.8%. Here in April, we actually had rentals that were up about 1% year over year. So good top funnel demand in April at good price to start off the second quarter. vacates were down 3.9% in the quarter. Again, that's just what I think we're seeing a little bit across the industry, particularly sticky staying longer than that.
Thanks for that. And my follow-up question relates to the guidance reaffirmation. Regarding that, Is that just a function of it's early in the year and the peak leasing season is really going to determine the trajectory of the annual results, or is there just a level of – is there a level of conservative of just trying to get an understanding of the thought process behind reiterating the guidance?
Thanks, Tim. Tim Stenzel Thanks. Thanks, Michael. So, we just provided the annual guidance not all that long ago, and the first quarter played out, as we mentioned, very consistently with our expectations on both revenue and expenses, and overall, from an FFO standpoint, just ending up at the high end of our guidance for the quarter. So, nothing has really changed. Nothing happened in the first quarter that would cause us to re-evaluate the impact for the full year. And as we sit here getting ready for our primary leasing season, we're in the same place as we were 60 days ago, ready to go and looking to capitalize on all the opportunities that will present themselves. But nothing has happened in the last 60 days that has had an impact or a change on our overall view for the year.
Thank you very much. Good luck in the second quarter. Appreciate it. Thanks.
Operator
Our next question comes from the line of Ravy Vaidya with Muzohu. Your line is now open. Please go ahead.
Thank you. Good morning. I wanted to ask about your thoughts about broader regulation and maybe price moratoriums that may be in New York and maybe a couple other markets. Have you had discussions regarding any sort of pricing restrictions or policy shift or moratorium that you could be anticipating from the current administration here in New York?
Good morning. We have not engaged directly in those conversations. You know, as we've seen across a variety of different, as well as other industries, varying factors affecting the consumers. And, you know, we believe in seeing a need to put they're valuable in a in a self-storage facility for a period of time that they define and we think we provide a good value for that service continue to to be keenly focused on that customer service element and providing a good value and a solution for their need uh as you know varying things ebb and flow will continue to continue to be involved as a program.
Thank you. That's really helpful. I wanted to ask also about the fee income realized in the quarter. It was elevated this quarter, but also the elevated last quarter. What's driving that? Thank you.
Yeah, so on the other property income line item, we have, there are a variety of things that are in that line item they include merchandise sales locks as boxes fees as you mentioned truck rental income we're always looking at ways to enhance and grow our cash flows in those areas we and we've had some success in that in that line item if you think about the level of growth in that line item in the first quarter we would expect the first quarter to be a little bit higher than where we would land for the full year as it relates to growth on that line item but But, you know, we always continue to look for ways to provide many services to our customers, and some of them show up in that line item.
Operator
Our next question comes from the line of Juan Sanabria with BMO Capital Markets. Your line is open. Please go ahead.
Hi, good morning. Just hoping you could talk a little bit about the 26 earnings guidance implies a bit of an acceleration but flat on same-store revenues. Just hoping you could talk through the dichotomy and the acceleration versus flat between earnings and same-store revenues.
I'm trying to understand your question. Certainly our guidance implies that there is—within the range there is an opportunity for top line to grow throughout the year, and that's going to be the result of all the trends that Chris touched on, a narrowing gap in occupancy, some better rates to new customers. And so looking at top line growth that could accelerate a little bit, we talked about the expense, somewhat of an anomaly of some really difficult comps, the snow being part of it, marketing expense year over year. And so the first quarter had an expense growth that's higher than the range. So if you're looking at accelerating NOI growth, then throughout the year would be the expectation that's embedded in the guidance. Was there another portion of your question that I missed?
No, that's helpful. Thanks, Tim. And then just switching gears on the third-party management, you guys have had some success on the gross side, growing the relationships with the net number has seemed a little bit of shrinkage. So just curious on how we should think about the net number going forward and the different pushes and pulls in that business.
It's a little bit analogous to our customers and their length of stay. We continue to add stores to the third-party management platform. Again, 33 more this quarter. We have a great pipeline that looks pretty similar to what it would look like this time of year over the past few years. And so our team in the business development side is focused on finding owners or expanding our relationship with existing owners. And what we can control is having an attractive offering and providing great services to our third party owners and adding stores to the platform. what we can't control is when they decide to transact and sell their assets. There are times where we are the acquirer of those assets. We've bought over $2 billion worth of assets from stores that we had previously managed. But in an environment where we are today, we oftentimes are not the buyer. And so the majority of the stores that leave our platform are because of because of a transaction and they sell to somebody who self-manages or they choose to to you know they have an existing other relationship that they use to manage their stores for so very difficult to predict but it ultimately when stores leave leave our platform in large part it means that we've you know job well done because we've we've managed a store for somebody helped to create that value to put them in a position to be able to seek liquidity and they tend to do pretty well as we create a lot of value for them.
Appreciate that. Thank you.
Operator
Our next question comes from the line of Todd Thomas with T-Bank. Your line is open. Please go ahead.
Yeah, hi, thanks. First, I just wanted to follow up on April. I think, Chris, you said April rentals were up 1% year over year. How did that look on a net rentable square foot basis And can you discuss occupancy through April and sort of, you know, quantify the move in rents that you discussed a little bit? You said that rentals were at good prices. Can you just elaborate on that a little bit?
Yeah. Thanks, Todd. So, you know, through the month, we continued to see nice demand in April and a little bit shy of 1% throughout the month. And you combine that with the continued trend in lower vacates to confuse these two 20 basis Occupancy from March through April grew sequentially about 20 basis points, and that occupancy gap then at the end of April to April of last year was also negative .2, negative 20 BIFs. The rent through April, as I mentioned early on, at the end of March, that last few days of the month, we saw average rent rate on rentals for those last couple of days. March, those trends continued throughout April.
Okay, that's great. That's helpful. And then I just wanted to see if you could speak a little bit more around the improvement that you're seeing in some of the Sunbelt markets, some of the more challenged or supply challenged markets, I guess, that you've discussed. You know, do you see that trend improving and continuing as you move through the year?
Does it, you know, remain sort of choppy in the near term in your view i think i think as it relates to uh miami um does feel as if the the wave of supply albeit we saw coming out of of 21 22 23 the velocity of inbound folks into the greater Miami is reduced a bit, but still pretty healthy. So feeling pretty good about MSA. Phoenix and Atlanta, if you think about some good positive momentum in those two markets in terms of starting to chew into the negative same store revenue results that we've seen over the last year or so, too. We'd like to see another quarter or so of that momentum continuing.
Okay. So it doesn't sound like you would continue to expect the Accela corridor to be outperforming at year-end, or do you see potential for there to be sort of a handoff uh during the year or late in the year as we start to think about 27 yeah maybe a little premature given uh you know as we're starting to get here into the into the busier season um certainly uh would not be surprised if the acela corridor from from an overall growth for the the year okay thank you our next question comes from the line of eric wolf with city
Operator
Your line is open. Please go ahead.
Thanks. It's Nick Joseph here with Eric. So we continue to see consolidation within the storage sector. So just curious if you think there are benefits to being kind of larger or at a certain point, does it kind of diminish? And once you're large enough, there's not incremental benefits to getting even bigger.
I think we think about there is the opportunities on both the pricing and the expense markets and submarkets to be proven to be a good strategy. I think when you think about scale on a national, I think those benefits diminish.
And then just on the buybacks, as you think about funding continued buybacks, where are you willing to take leverage, assuming your stock stays at these levels? hey good morning so you know what we talked about when we when we executed on the share repurchases last quarter for the first time is that we generate roughly 100 million dollars in free cash flow and kind of the first level of analysis for us when thinking about the share repurchases is has the valuation been disconnected enough for long enough and when we got to the fourth quarter the you know both of those boxes were checked and so we started to execute on the share repurchases and so a little bit more than 30 million of those purchases in the fourth quarter another a little bit more than 30 million in the first quarter and so you kind of think about that tracking towards utilizing that free cash flow that we generate to repurchase the shares plus or minus and so to this point we've been repurchasing shares effectively with no impact on leverage if you were then thinking about how you would execute on share repurchases above and beyond that 100 million ish for us on an annual basis then you're getting into uh your question which is how much leverage would you be willing to use and i think for us then that goes up another level. Not only would the disconnect between public and private market valuations have to be big enough for long enough, you're then also then taking a view on for how long do you think going into the future because our equity capital is precious to us. We need to raise equity capital to support our growth over time. And so we don't take executing on our share repurchases lightly from that perspective. So we talked last quarter about how could we then continue to navigate through an environment where there's this disconnect. And that's where we started looking at and continue to look at opportunities where perhaps we take some assets that we could contribute to a co-ownership vehicle and take some of the proceeds from that to support additional share repurchases above and beyond kind of that $100 million level. And that would be a way to, for us to continue to navigate and create shareholder value consistent with our long-term strategic objectives of having the highest quality portfolio so we could improve the quality of our portfolio through contributing some of those assets and take advantage of the arbitrage then between public and private market valuations. It's not super appealing for us to just lever up the balance sheet to repurchase shares for the reasons that I mentioned earlier.
Thank you very much. Thank you.
Operator
Our next question comes from the line of Michael Griffin with Evercore ISI. Your line is open. Please go ahead.
It seems like existing customer trends continue to be strong, but Chris, I'm curious if you can either quantify or give us some color on the rate increases that are going out now versus maybe this time last year are you getting more aggressive trying to push on those ecris and have you seen any your customer push back when it comes to getting those rate increases are they still generally pretty willing to swallow them morning the uh the magnitude and the um and the pace increases to the existing customers is generally unchanged from what we would have seen
of 25 inherent to really no fundamental change. And this starts with broadly credit and units falling into arrears, receiving, et cetera. I have not seen all of those metrics quite carefully, particularly given some of the macro.
Thanks, Chris. Appreciate the color there. And then on the transaction market, I realized that just given where deals are trading right now, maybe relative to your cost of capital on balance sheet acquisitions might not make sense right now. But can you give us a sense of the deal volume, how investors are receptive to self-storage product out in the market? And is there any way for you to compete on wholly owned acquisitions or are JV deals probably the more opportune avenue to go down at this juncture?
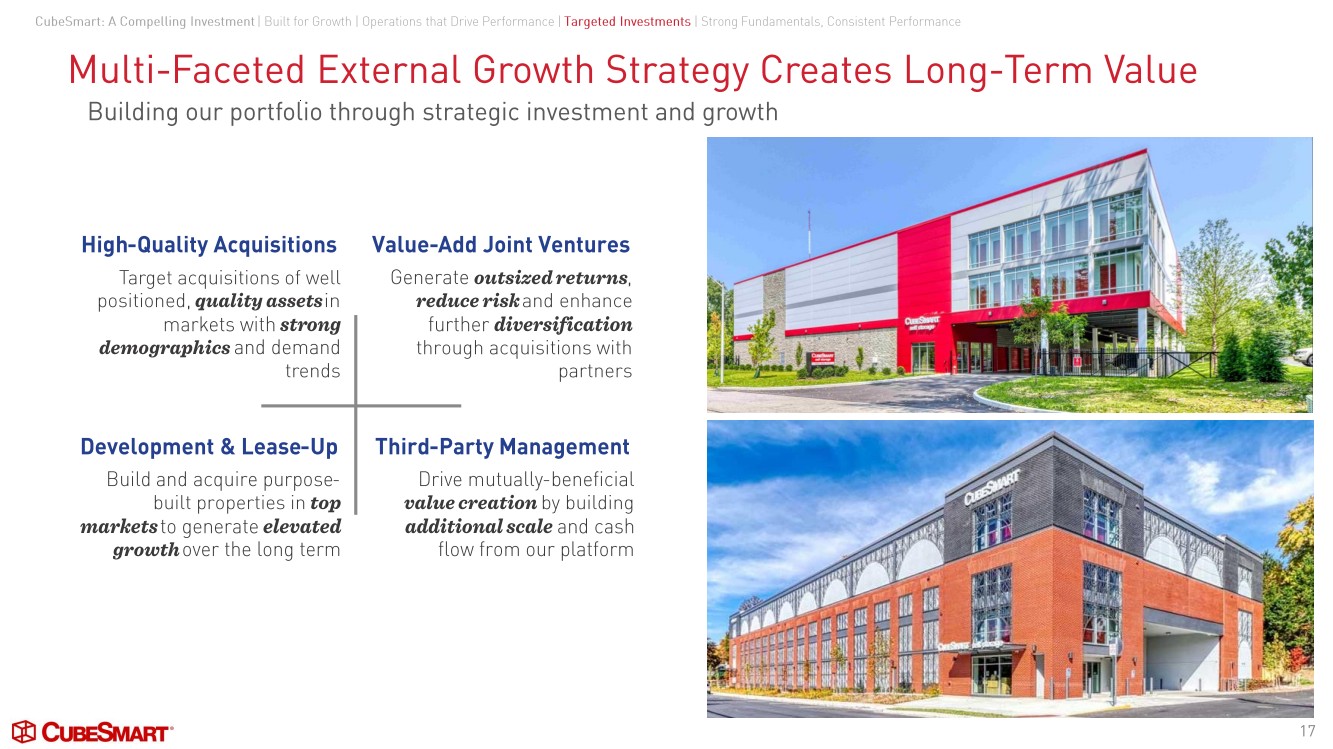
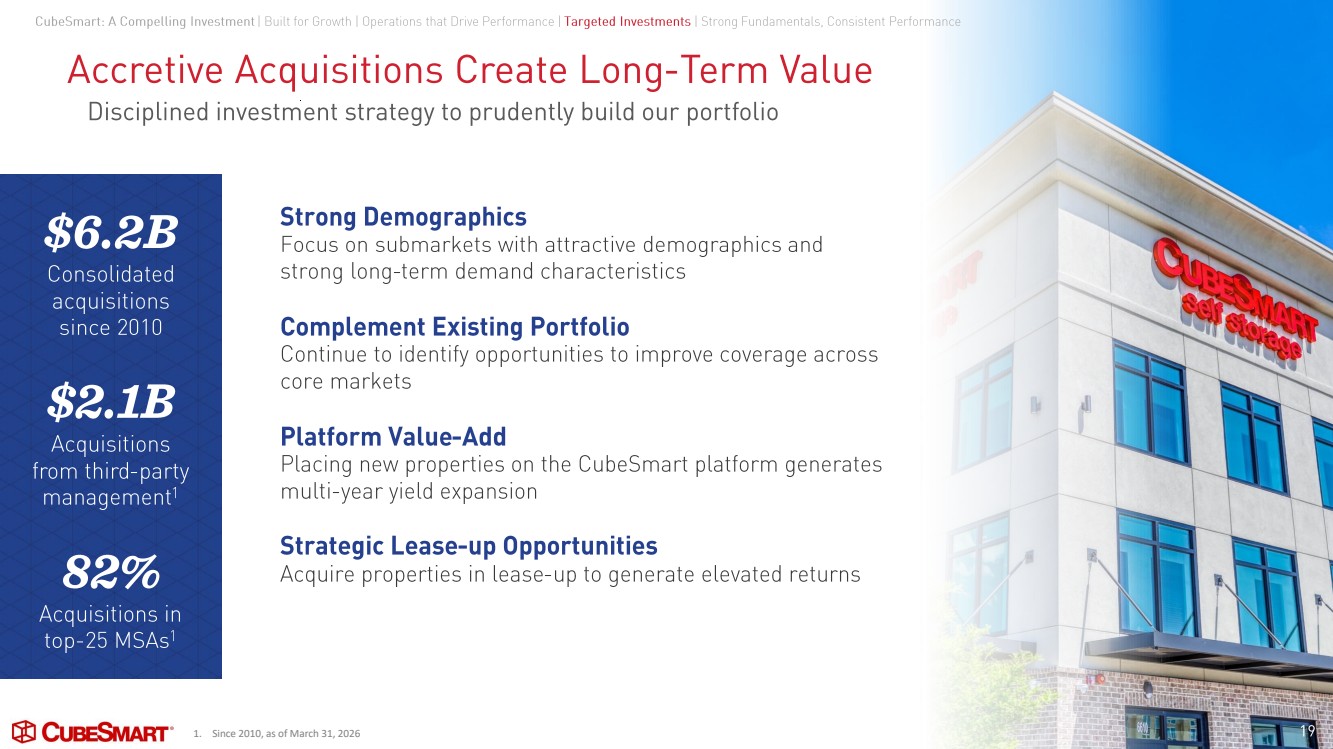
Yeah, thanks, Michael. So the transaction market hasn't really changed all that much. There are still a pretty healthy number of assets that are out there, and brokers are representing a lot of potential sellers. I would say the environment has been very similar now for several quarters in that many of the assets that are on the market will trade if they get to the seller's targeted price. Many of them don't. So I would say the hit rate on transactions closing remains lighter than certainly at historical levels. You know, our cost of capital, just back to the share repurchase conversation, when you just think about choices for us and different items on our capital allocation venue, year-to-date year, share repurchases have been more attractive given the quality of our portfolio versus the quality of an opportunity that we see out there. Our investments team continues to be very active and very busy underwriting a ton of opportunities. It's just the clearing price on where things are trading or where a seller desires them to trade versus a valuation that makes sense for us to acquire that in a creative way, both short, medium, and long term, just doesn't work right now. On the joint venture side, what I was alluding to is we can make our dollar go a lot further in this market by being a piece of a joint venture. And then from our standpoint, we can get some enhanced returns given the fee structures and management fees and the like in our invested dollar in a joint venture investment. So I would say that the result of what you've seen for us for the past many quarters is that there are assets that are trading, there is a strong desire from many, many pockets of capital to be in the storage space, just not evaluations that are attractive to sellers at the moment.
That's it for me. Thanks for the time. Thank you. Appreciate it.
Operator
Our next question comes from the line of Victor Fediv with Scotiabank. Your line is open. Please go ahead.
Thank you. Good morning, everyone. So you mentioned that you'll be addressing the September 2026, note maturity is potentially like existing capacity or opportunistic issue. And so given where credit spreads are today, either a timeline or tenor you're targeting.
So we have a nice gap in our maturity schedule seven years out. And then anything 10 years or longer is wide open on our maturity schedule. So, you know, likely paths for us are to evaluate from a tenor perspective, likely either a seven or a 10 year bond. we do have amounts drawn on our line as we started the year. I think we saw a possibility that maybe we would go twice this year, and we still could, and perhaps do a chunk of sevens and a chunk of tens. Obviously, the world has been pretty volatile here in the beginning part of the year, and so, you know, we look at, for us, pricing if we were to go today on a seven-year would be right around five, just a little bit higher. And then on a 10, we would be in the low to pushing mid five range for a 10 year bond. So we'll continue to monitor the markets and be opportunistic. And we're in a great position that if we don't feel and if we don't see an attractive window to access that market, we have capacity to address that maturity and we'll be patient and opportunistic.
Understood. And then second question, but just a quick follow-up on your churn. Because obviously first quarter was impacted by weather conditions, so you saw decline in both move-ins and more substantial on vacates front. And you mentioned that so far second quarter is the positive territory for move-ins, but still down year-to-year on vacates. just trying to understand whether we can expect some acceleration in vacates as a kind of flowing through Q1 being slower, or you don't see that in the most recent data.
So as it relates to the weather, you know, I think the reality in the storage business is that it impacts both the move in and the move out. If you're in tension on a miserably vacate, you likely defer, but eventually you're done with the process. When the weather clears and it's comfortable to access, you depart. Similarly, for the most case, on the move-in side, it's more of a deferral. Now there, if it was a move-in from someone who's in transition from point A to point B, if it was into another problem, some variability to your need, then perhaps that doesn't come back. So, it has a little bit of an impact in the near term, but over the course of time. So, I think the trends we've seen are very consistent occurring over the last year. You know, the impact of certainly been felt, customers have more options. I think, as we said on the earlier remarks, that impact continues to decline and a bit now more of a helpful tailwind than a headwind. On the vacate side, I just think we're seeing a customer base, particularly in the more urban stores for whom we are a more semi-permanent.
Operator
Our next question comes from the line of Brendan Lynch with Barclays. Your line is open. Please go ahead.
Great. Good morning. Thanks for taking the questions. Chris, you mentioned large language models in the context of advertising spending. Can you just give us an update on how CUBE is using large language models and how it's changing dynamics for acquiring clients?
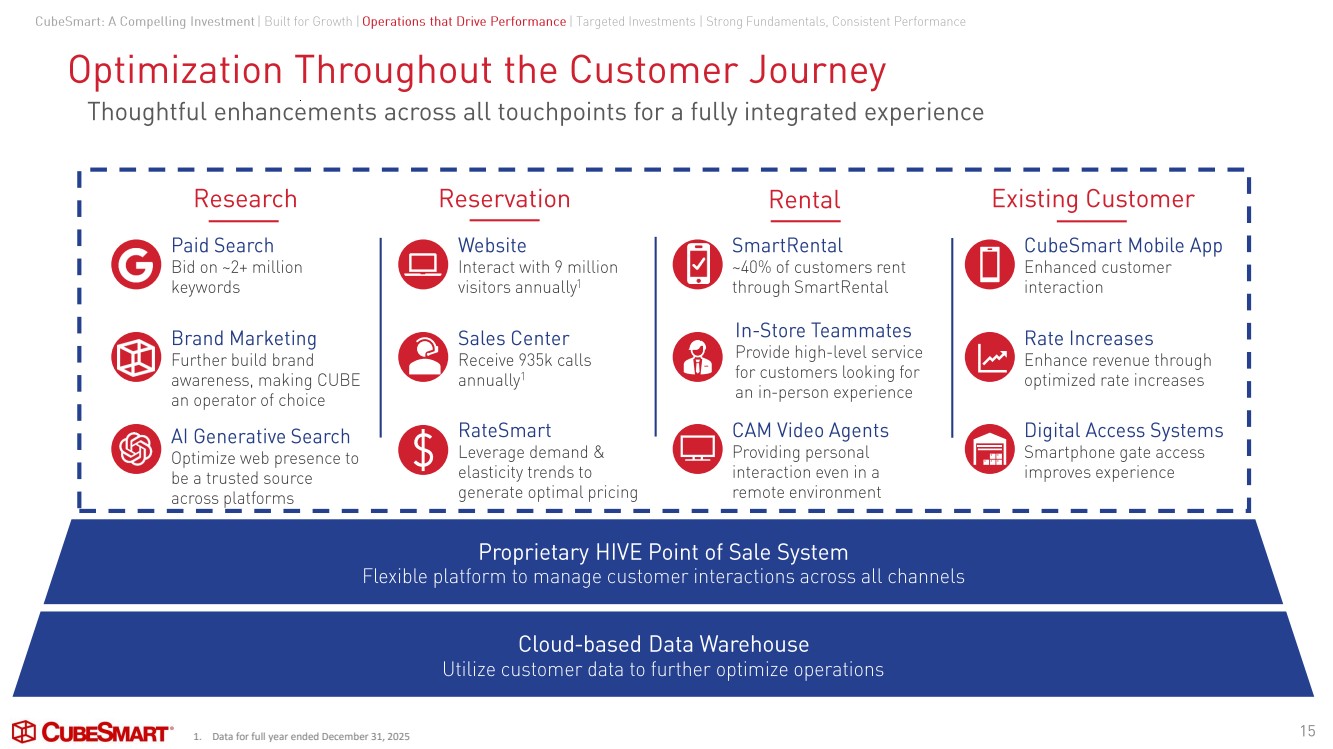
So very early stages, only about one or two conversions to a rental coming through search channels, but increasing gradually. And again, I think it's interesting because it's creating an opportunity for a disparate, As an example, looking not only for geographic convenience, so again, self-storage near me continues to be the most searched term, but also bringing in the more qualitative convenience, but high-quality service, good value. It's creating an opportunity to begin to have a bit more of a space to help me understand how to store all the possessions in my one-bedroom apartment. And what feeds into that, though, as we, the geography is the geography that your store continues to evolve. And then some of these LLMs ultimately going to monetize the, make sure that we are well.
Maybe a follow up on that. Are you finding that customers who are using the large language models can be more efficient in the amount of space that they take? I'd imagine if you didn't have the capability to assess really what amount of space you needed for, say, a one-bedroom apartment, if you ask a large language model and it says you need a 10 by 10, you might have otherwise taken a 10 by 20. So just kind of walk through those considerations about how the customer might be benefiting as well.
Yeah, so again, very, very early in this whole journey, so not at a point to draw any conclusions, but one of the headaches, frankly, in our industry is that our customers in general are not always the most spatially aware. It's sometimes difficult to understand how all the contents of your one-bedroom apartment may fit into a 10 by 10 storage cube. So to the extent that the LLMs and the various inputs help the customer make the right decision on the front end, I think that's very helpful to us because having to have them begin the journey and then discover that they either went too large or too small and they need to relocate to another cube is an operationally frictional cost to it.
Okay, great. Thanks for the color. Thanks.
Operator
Our next question comes from the line of Eric Liebchow with Wells Fargo. Your line is open. Please go ahead.
Great. Thanks for taking the question. Tim, I know you talked a little bit about potential co-ownership or JV structure to contribute some assets. I guess, as you think about that potential structure, would you focus more on your core urban assets in the Midwest and Northeast that have been more stable the last couple of years or potentially look at more sunbelt markets where trends have been a little choppier?
Yeah, I appreciate the question. Overall, what we would hope to do is to, again, be consistent with our long-term objective to have the highest quality portfolio. So, most likely what we would do is look for assets that we could contribute that are in, you know, perhaps outside of top 40 MSAs or assets within top 40 MSAs that are more on the outer ring of that particular MSA versus, you know, kind of a core inside. side, then, you know, you go through that analysis to say, do you want to target assets that have – markets that have been, you know, underperforming or under pressure from supply and the like, and would you be, you know, potentially, you know, leaving some meat on the bone for some of those assets as those markets inevitably recover and start to outperform? All those things are – you know, all of those things are considerations. So it's complicated, but we continue to work through that because, you know, at the moment within the current environment, we think it potentially could be a pretty attractive path for us.
Great. Appreciate that. And I guess just rough numbers, are you still seeing, you know, acquisition cap rates kind of in the lower five range for Class A or have those kind of moved at all year to date?
I think that's a safe characterization. I'm always seeing some things that trade even tighter than that. But I would say very low fives tends to be where things are trading. Sometimes you get into the mid fives. A lot of sellers, based on what they're looking for, would imply something very, very tight even inside some of those numbers.
Operator
Our next question comes from the line of Mike Mueller with J.P. Morgan. Your line is open. Please go ahead.
Yeah. Hi. Just a quick one. Are you seeing any pockets of opportunity where starting to see development make more sense at some point and where we could see activity pick up in the next few years for you?
Good morning. No, is the short answer. I think there are always going to be a unique opportunity in a market where you don't have supply in the trade ring, whether that be ground up or a conversion of an existing asset. So it's not zero, but I think the inputs in terms of – and then the ultimate underwriting of rental rate for the new customers to fill up the new store continue to make development quite challenging.
And then maybe just something on ECRI. I know you talked about the consumer being good and accepting ECRI. But if you look at the move outs that tend to happen, do you have a sense as to what portion leaves in conjunction with ECRI versus they just don't need storage anymore? And maybe how that compares to the split compares to, I don't know, what you've seen in normal times over the past?
Yeah, to the best that we can get at that, again, we are, you know, we're observing that customer that gets a rate increase and then their behavior in the weeks and months following that and comparing that to, you know, our expectations based on historical data over a long period of time. And we have the stated reason, the overwhelming amount of time for why a customer chooses to leave the portfolio is because they no longer have the need for it.
Got it. Okay. Thank you. Thanks.
Operator
Our next question comes from the line of Spencer Glimcher with Green Street. Your line is open. Please go ahead. Thank you.
I appreciate all the color you provided on the third-party management business. I'm just curious if you think that over time your more sophisticated AI usage or machine learning will bring a greater portion of smaller operators to your platform?
I think you put that in a laundry list or a bucket of a lot of things that we and a handful of sophisticated operators bring to the table. I think that's one of those areas where you know chris chris touched on a little while ago we're early stages but as as the as the search for the product evolves from an ai perspective opportunities to improve operational efficiencies pricing systems the larger players are going to most likely be you know be the winners and be on the on the front edge of of a lot of that evolution and And I would think that if I were an owner of a store and looked at how challenging of an operating business that we're in, that those large players like us have those tools, have those advantages. So I would just put that in the bucket with a whole bunch of other things that have us stand out as to why our platform is going to help create the most value for their self-storage asset.
Yeah, that's fair. Do you think it'll be incumbent upon you and the team to go out and make that point, like, very clear to smaller operators as part of just kind of like an outreach and trying to have others see the growing value of your platform? Or do you think that that will just naturally bring smaller operators to you without kind of additional work on your end?
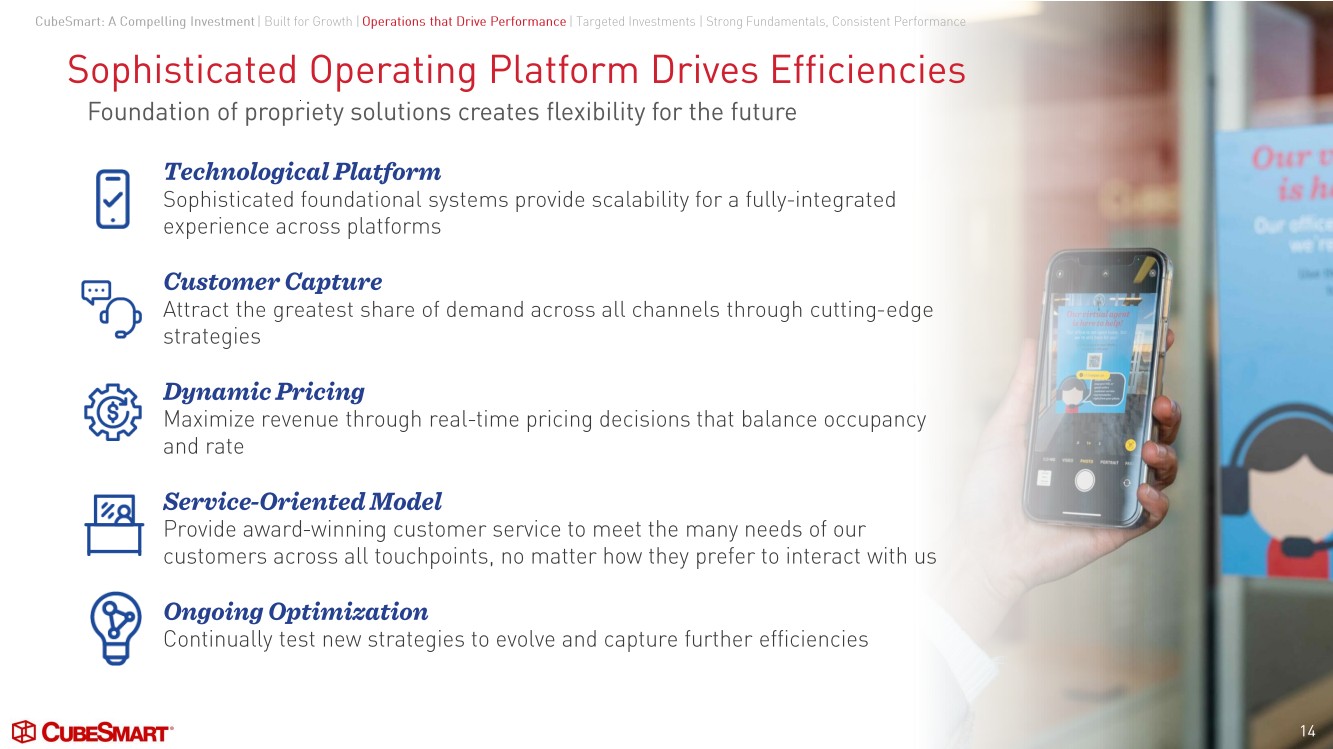
I think it would be a combination of those things. Certainly our business development team and, you know, we're at trade shows and a lot of our third party opportunities come from referrals. And so we need to we need to do a good job and continue to do a good job for our existing owners because their referral is one of our most important contributors to adding stores to the platform. But at trade shows and our, you know, our quote unquote dog and pony show, certainly we need to do a good job to explain all the things that we do and how we do them in ways that we believe are superior to the way that others do them. And so that, you know, again, that's another piece of that story. And that's another piece of our sophisticated platform that we need to both perform on and do a good job of explaining to potential customers of ours.
Operator
There are no further questions at this time. I will now turn the call back to Josh for closing remarks.
Hey there, to me. But thank you all for listening. We're very enthusiastic by how the spring has started here for our business and our company. We're quite excited by all of the things we're working on internally, which I think will continue to create value over time and continue to create a great customer, the users of our product. So looking forward to the quarter and seeing how the busy season unfolds here. And we'll be excited to report back to you in a few months.
Operator
This concludes today's call. Thank you for attending. You may now disconnect.