Operator
Good morning and welcome to the Hyatt First Quarter 2026 Earnings Conference Call. All lines have been placed on mute to prevent any background noise. After the speaker's remarks, there will be a question and answer session. If you would like to ask a question during this time, simply press star followed by the number 1 on your telephone keypad. If you would like to withdraw your question, again, press star and 1. As a reminder, this conference call is being recorded. I would now like to turn the call over to Adam Roman, Senior Vice President of Investor Relations and Global FP&A. Thank you. Please go ahead.
Thank you, and welcome to Hyatt's first quarter 2026 earnings conference. Today's call are Markov Joan Botterini. Before we start, I would like to remind everyone that our comments today will include forward-looking statements. These statements are subject to numerous risks and uncertainties, as described in our annual report on Form 10-K. quarterly reports on Form 10Q, and these risks could cause our actual results to be materially different from those expressed in or implied by our comments. Forward-looking statements in the earnings, along with the comments on this call, are made only as of today and will not be updated as actual events unfold. In addition, you can find a reconciliation of non-GAAP financial measures referred to in today's remarks under the Financials section of our Investor Relations website and in this morning's earnings release. An archive of this call will be available on our website for 90 days. Additionally, we posted an investor presentation on our Investor Relations website this morning. Please note that unless otherwise stated, references to occupancy, average daily rate, and REVPAR reflect comparable system-wide hotels on a constant currency basis, and closed hotels in Jamaica are excluded from comparable metrics in 2026. Percentage changes disclosed during the call are on a year-over-year basis unless otherwise noted. With that, I will now turn the call over to Mark.
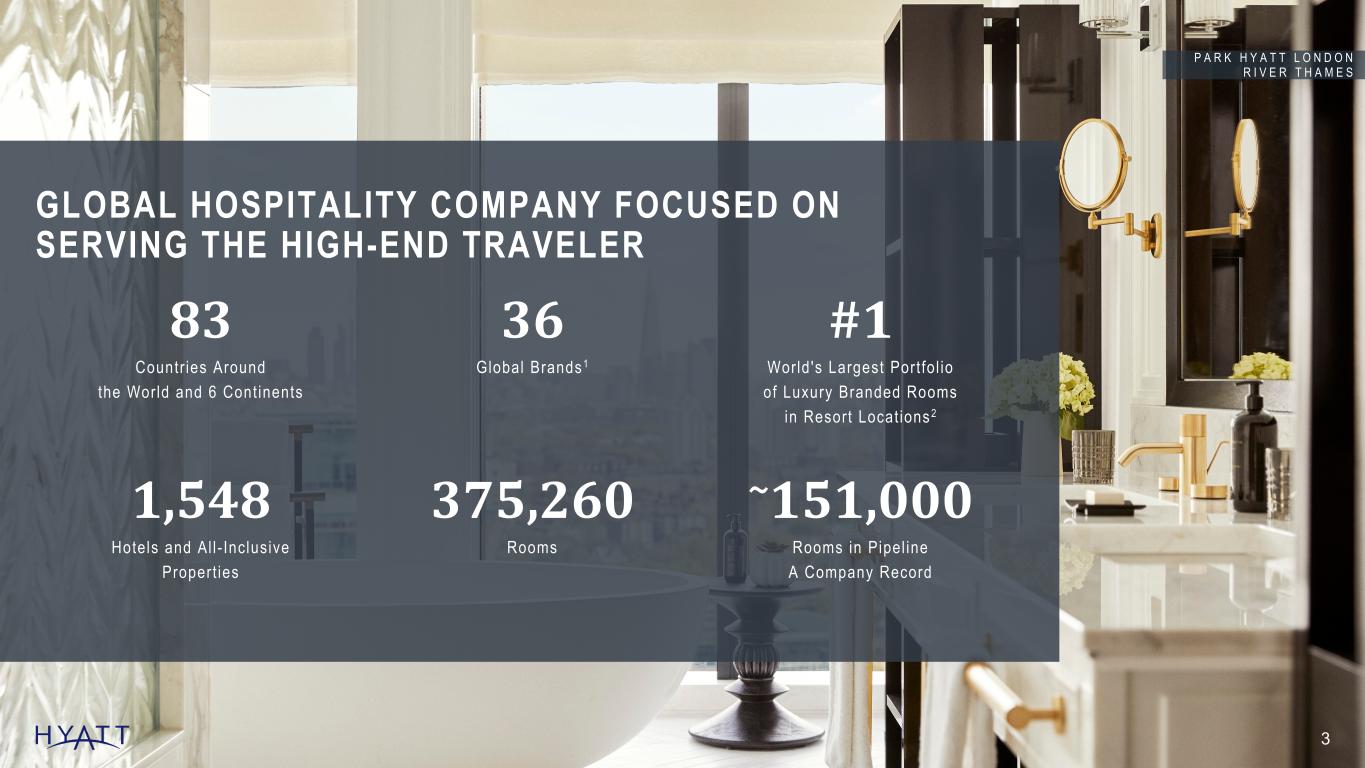
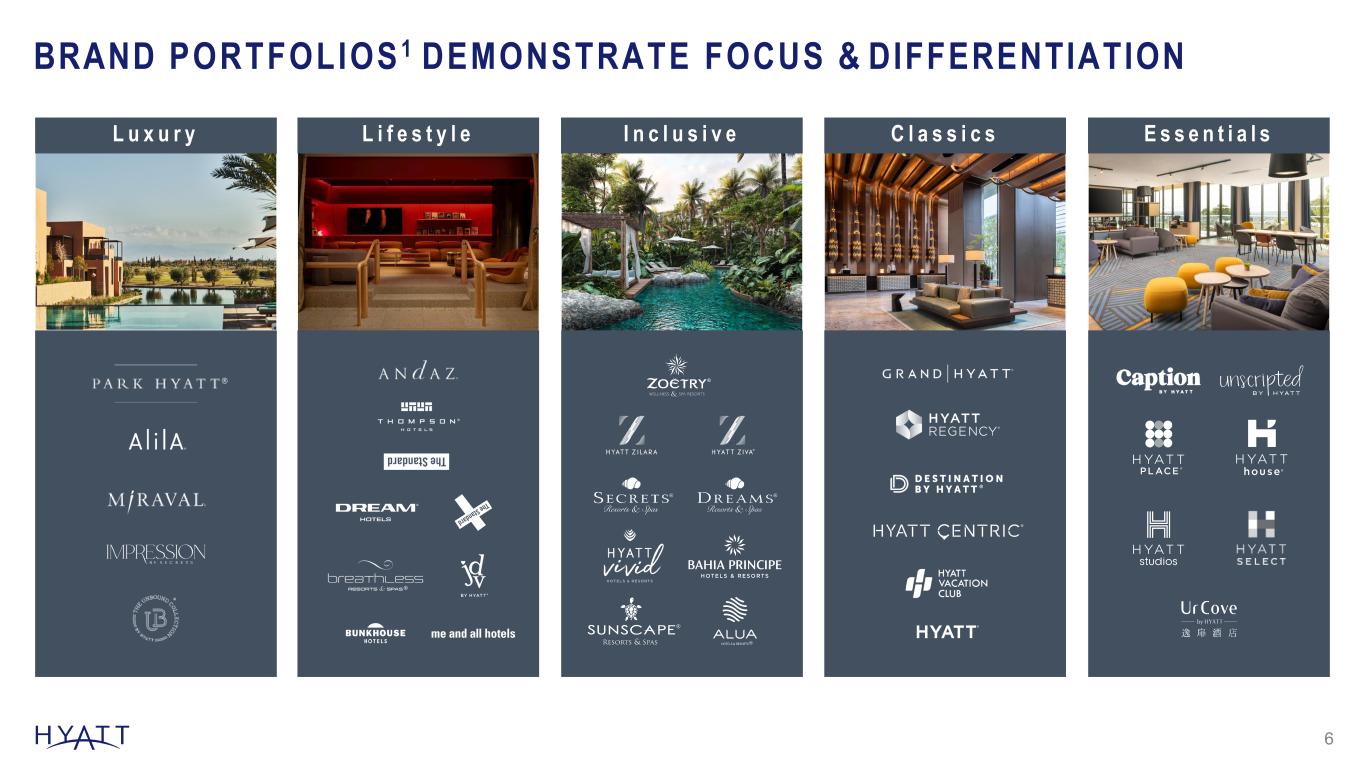
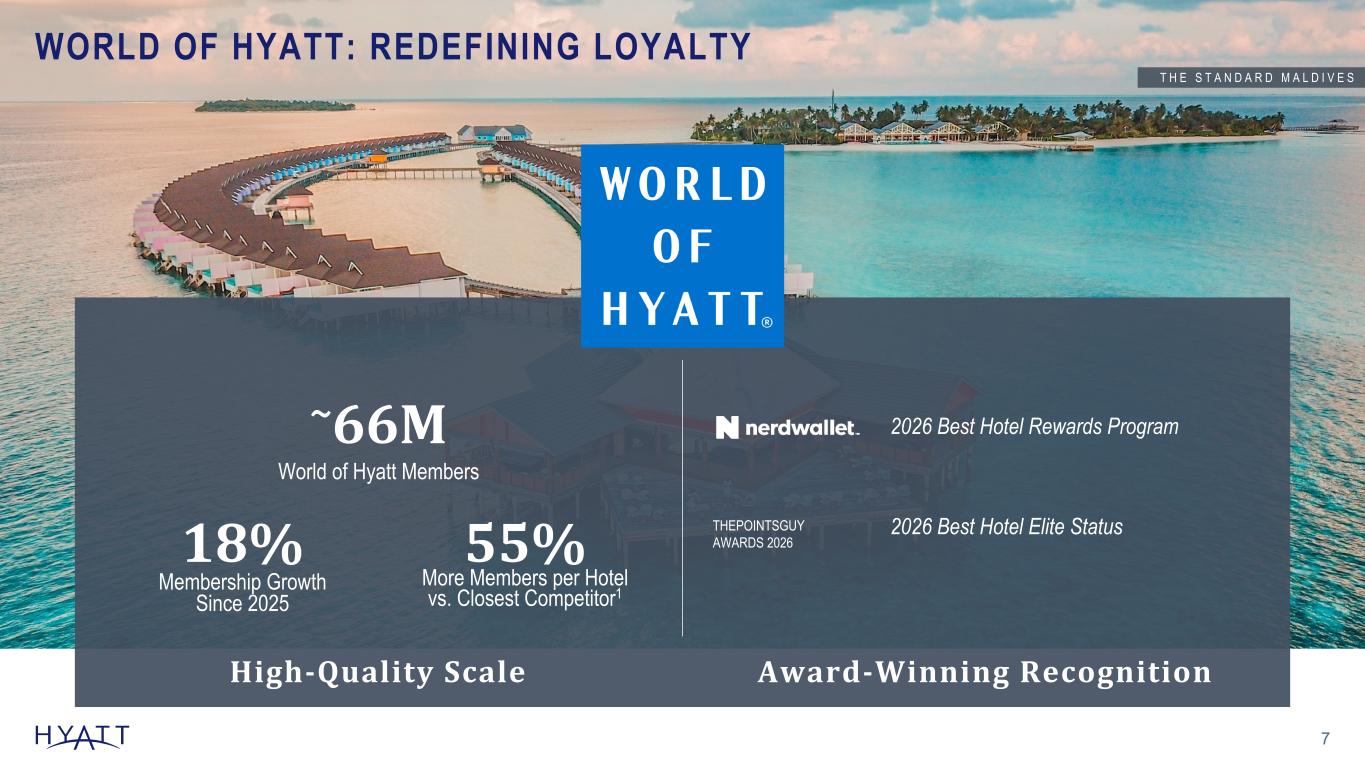
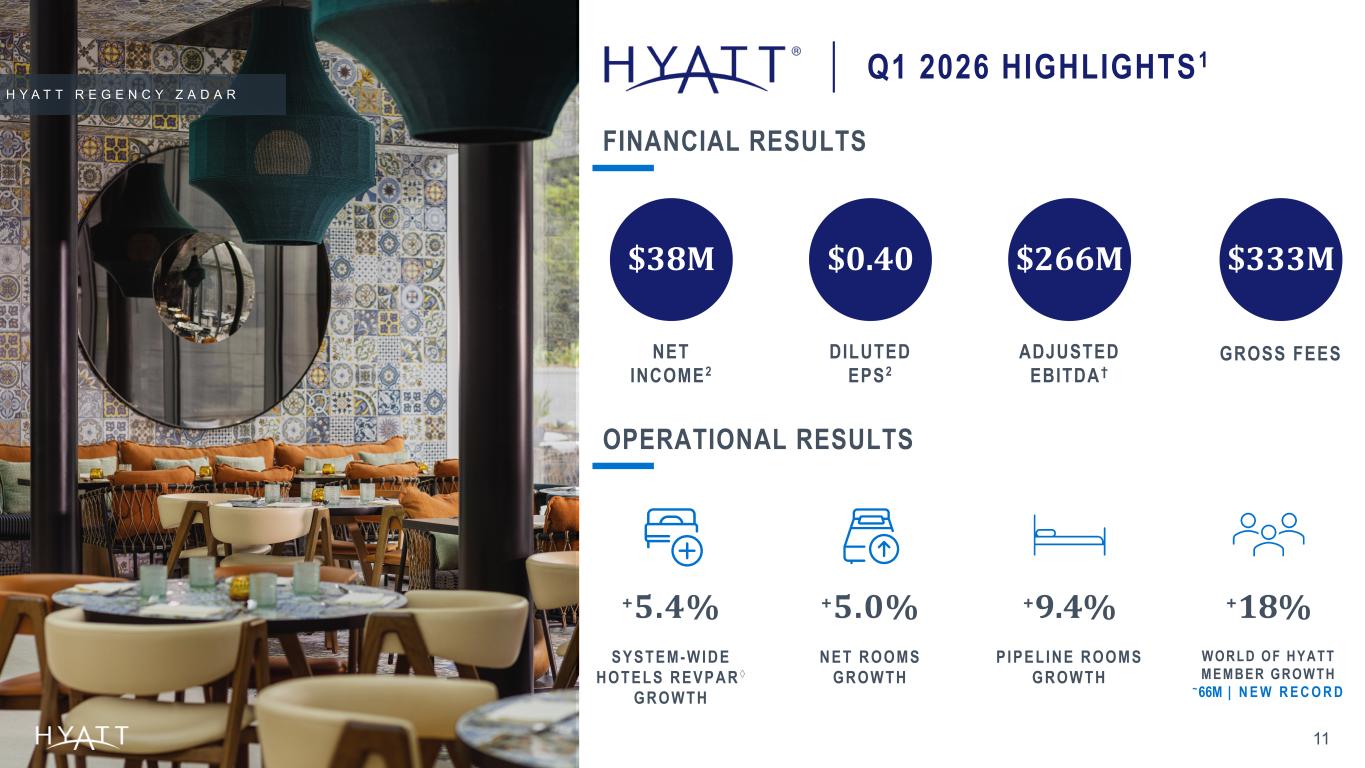
Thank you, Adam, and good morning, everyone. We appreciate you joining us today. Before I begin, I want to acknowledge recent events in the Middle East. We are closely monitoring the evolving situation and remain in regular contact with our hotel teams who have done a remarkable job of managing operations during trying times, and I am extremely grateful for the professionalism and care with which my colleagues have conducted themselves throughout. The quarter also saw isolated security concerns in Mexico, and Hyatt colleagues, guests, and our hotels were thankful. The safety of our guests and colleagues remains our top priority, and I'm proud of the care and resilience that our teams continue to demonstrate. At times like these, our purpose, to care for people so they can be their best, continues to guide our actions. Turning to operating results, this morning we reported first quarter system-wide RevPAR growth 4%. Performance exceeded our expectations, driven by continued strength in our luxury brands globally. RevPAR growth in the United States was ahead of expectations, and we saw strong growth. Leisure demand from premium customers was exceptionally strong in the quarter, increasing approximately 7% compared to last year, with the strongest demand realized by our luxury brands. Business and group travel was also solid, with business transient rev par up 2.4% in the first quarter and group rev par up nearly 4% compared to last year. Our core fee business remains durable, and our diverse global portfolio has proven resilient in the face of demand fluctuations, including certain macro and geopolitical disruptions. Our differentiated brands continue to deliver results over the long term and reinforce our position as a preferred brand portfolio. We continue to see this preference reflected in our World of Hyatt loyalty program. We ended the first quarter with approximately 66 million members, an increase of 18% compared to the first quarter of last year. And World of Hyatt members accounted for nearly half of total occupied rooms globally during the quarter. The world of Hyatt's success goes beyond scale. We are focused on generating higher value demand. When our members stay with us, they spend nearly twice as much compared to a non-member, highlighting the engagement from our premium customer base. The value proposition of our loyalty program continues to resonate with our members, enhancing Hyatt's attractiveness to owners and developers. Development activity during the quarter was very strong. The end of the first quarter with a record development pipeline of approximately 151,000 rooms, up more than 9% compared to the first quarter last year. We continue to see strong interest in our newest brands with owners recognizing the value of our brands and the strength of our commercial engine. In the first quarter, we signed a number of new franchise agreements across Hyatt Studios, Hyatt Select, and Unscripted by Hyatt brands in the United States, and have many more in discussion. In total, the pipeline for new hotels in our Essentials brand group increased nearly 25% compared to the first quarter of 2025. Outside the United States, our development engine is strong, with significant signings activity during the quarter. We're seeing broad interest across our brand portfolios throughout the world, reinforcing our confidence in our ability to drive durable, capital-efficient fee growth over the long term. We achieved net rooms growth of 5% for the first quarter of 2026 in line with our expectations as we lapped a quarter of outsized openings last year. We had several notable openings in our lifestyle brands, including the Andaz Lisbon, which strengthens our lifestyle brand presence in Europe, the Andaz Shanghai ITC, a luxurious and modern addition to our already strong brand presence in greater China, and the Livingston, our first hotel in Brooklyn, New York. These openings reflect our continued focus on expanding our portfolio in high-demand markets with differentiated offerings. With many exciting additions to our lifestyle portfolio slated to open in 2026, further strengthening our position as a leader in lifestyle offerings, we also continue to see strong momentum in our Essentials brands, entering seven new markets during the quarter. This included the expansion of our upper mid-scale portfolio, with several Yercove by Hyatt openings, as well as the Third Heights Studios property in the U.S. These brands are an important driver of our growth strategy, allowing us to expand our brand footprint in markets where we have significant white space, while also offering attractive economic returns to owners. We expect our net runes growth to accelerate over the course of the year as we benefit from meaningful opportunities to convert hotels into our system, along with openings from our pipeline. Now, shifting to an update on transactions, we continue to make progress on the plan to sell Hyatt Grand Central New York and could be in a position to close that transaction in the fourth quarter of 2026 if various closing conditions are satisfied. We will continue to provide updates on this transaction as we reach key milestones. During the quarter, we elected to terminate the purchase and sale agreement for the sale of the undead London Liverpool Street. And separately, we are no longer under contract for two other properties that were previously signed. Our decisions not to move forward were specific to the individual transactions and reflect our continued discipline around pricing and terms. To be clear, our broader plans for additional asset sales and our confidence in the transactions market remain unchanged. We remain active in the market and are in discussions regarding certain assets to further realize value from our own. Our approach remains consistent with our previous track record, ensuring we realize attractive values when we sell hotels, and ensuring we execute transactions in a disciplined manner that retains the sold properties within our portfolio and increases sure. As we look forward into 2026 and beyond, I'm confident about our future. We have significant competitive advantages that drove the strength in our core business in the first quarter. We are focused on elevating Hyatt so we can respond faster, innovate more, and perform at a higher level in an increasingly dynamic environment. At its core, elevating Hyatt and maximizing our potential comes down to three integrated areas working together. Our brands, our talent, increasing brand equity is a key component, our sharpened brand focus for long-term growth, and growing free cash flow. Brands create the most value when they are executed consistently, and that comes down to our people. We are focused on developing leaders who can execute at a high level while continuing to innovate as enabled by our culture. We've built an organization grounded in quality, responsiveness, performance, and continuous improvement. Strong brands and great teams perform best when enabled by the right data and the right technology that we are leveraging to uncover deeper insights. These insights will allow us to better engage with our guests. We navigated a very dynamic quarter with several events requiring speed and responsiveness that our colleagues around the world who live our purpose every day, which I truly believe allowed us to deliver such strong quarterly results. I'll now turn the call over to Joan to provide more details on the quarter. Joan, over to you.
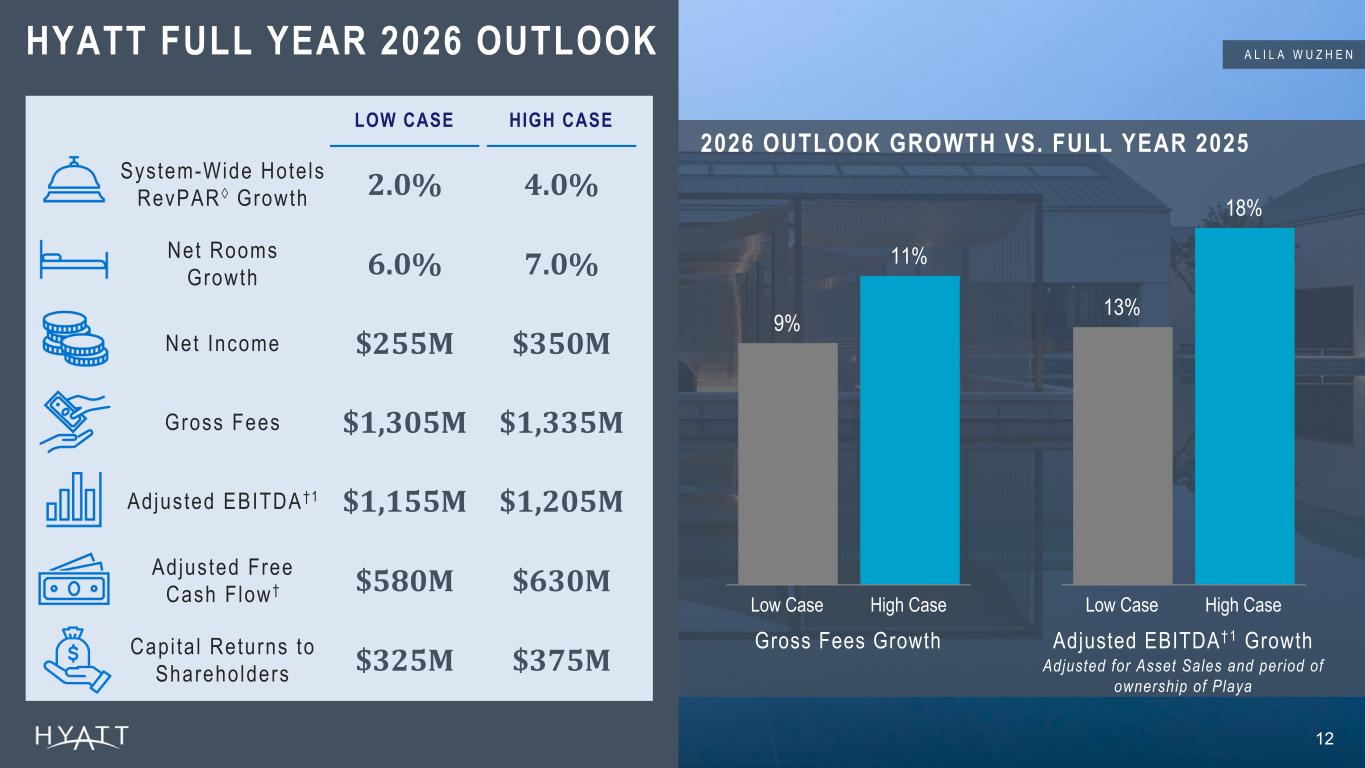
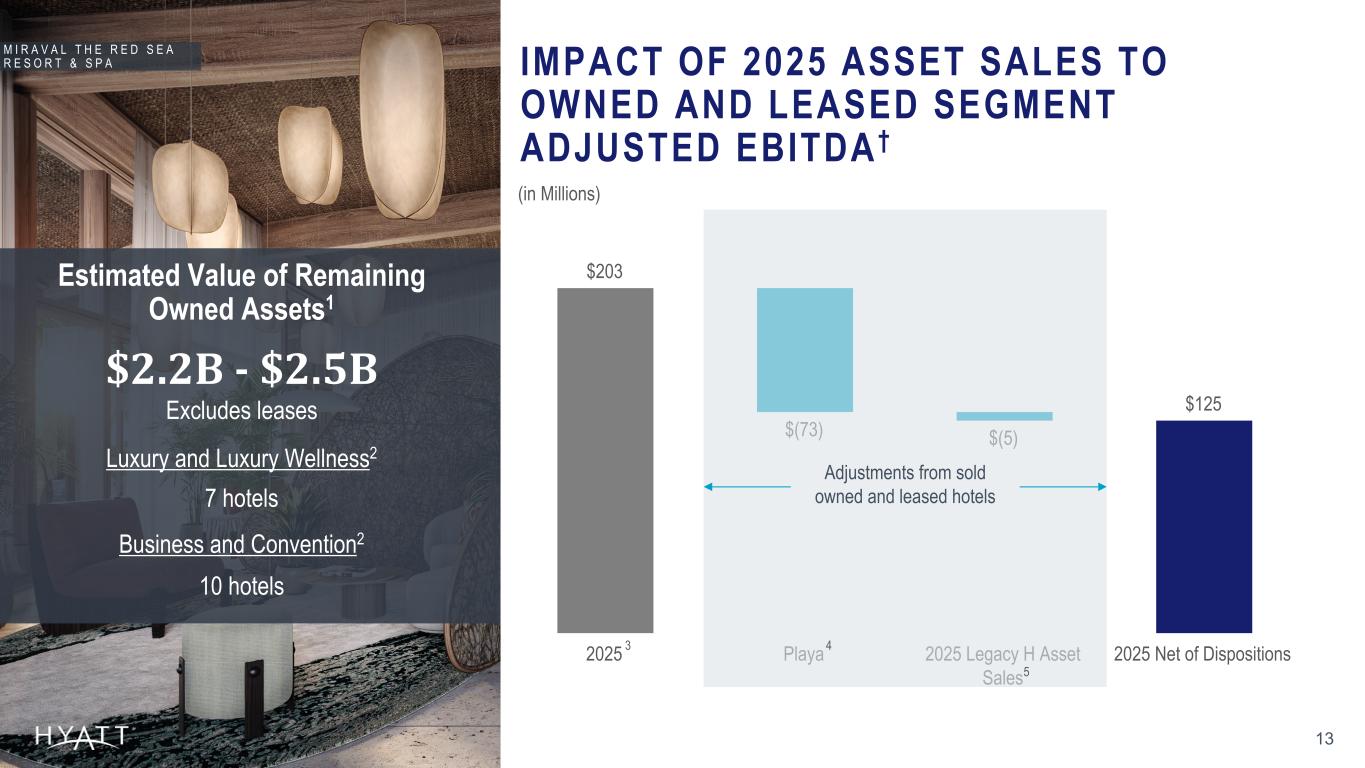
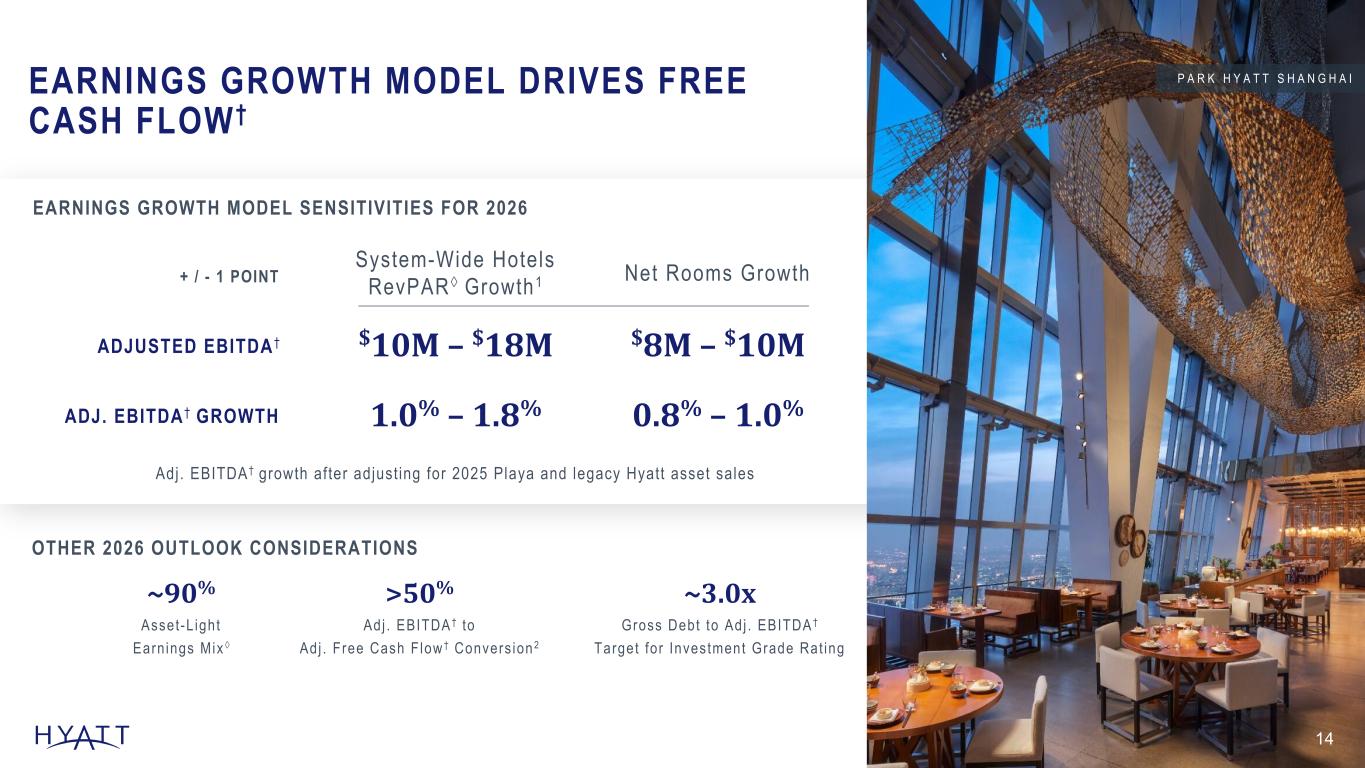
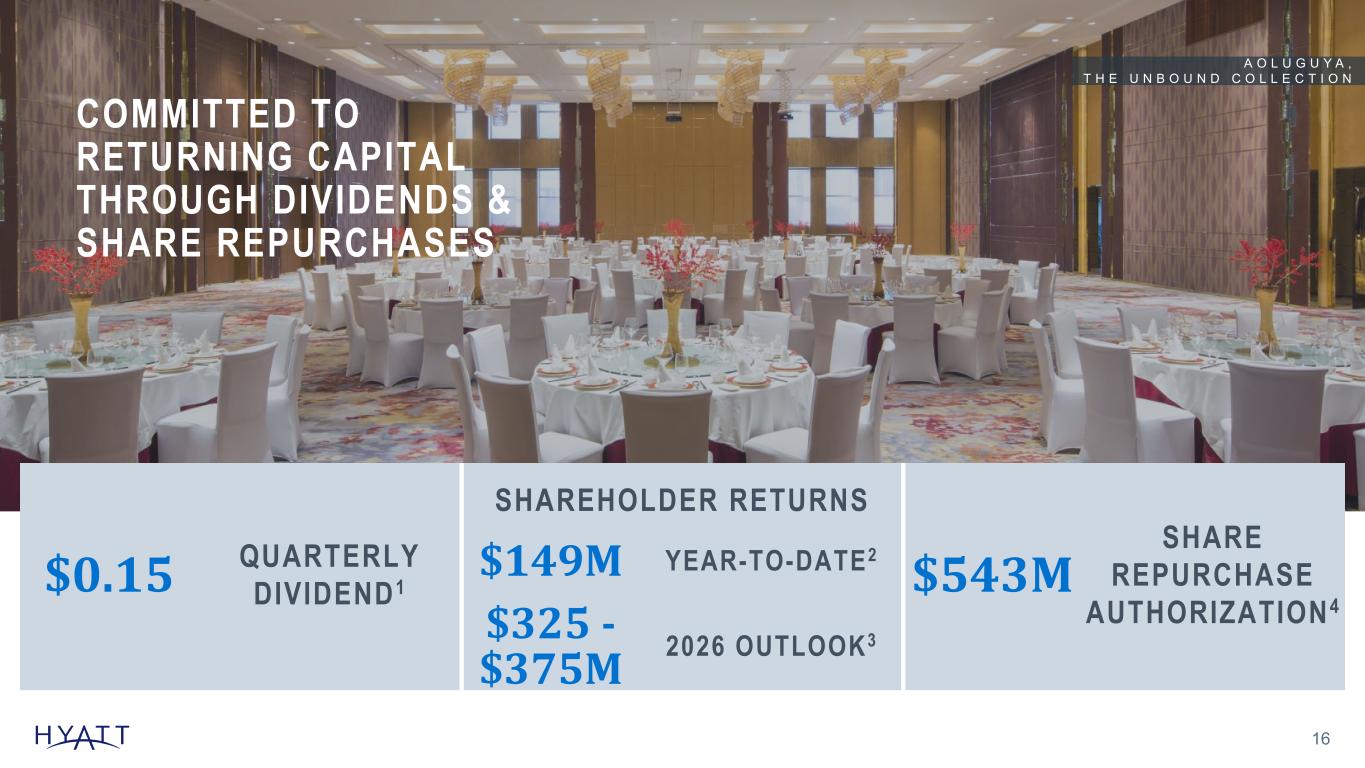
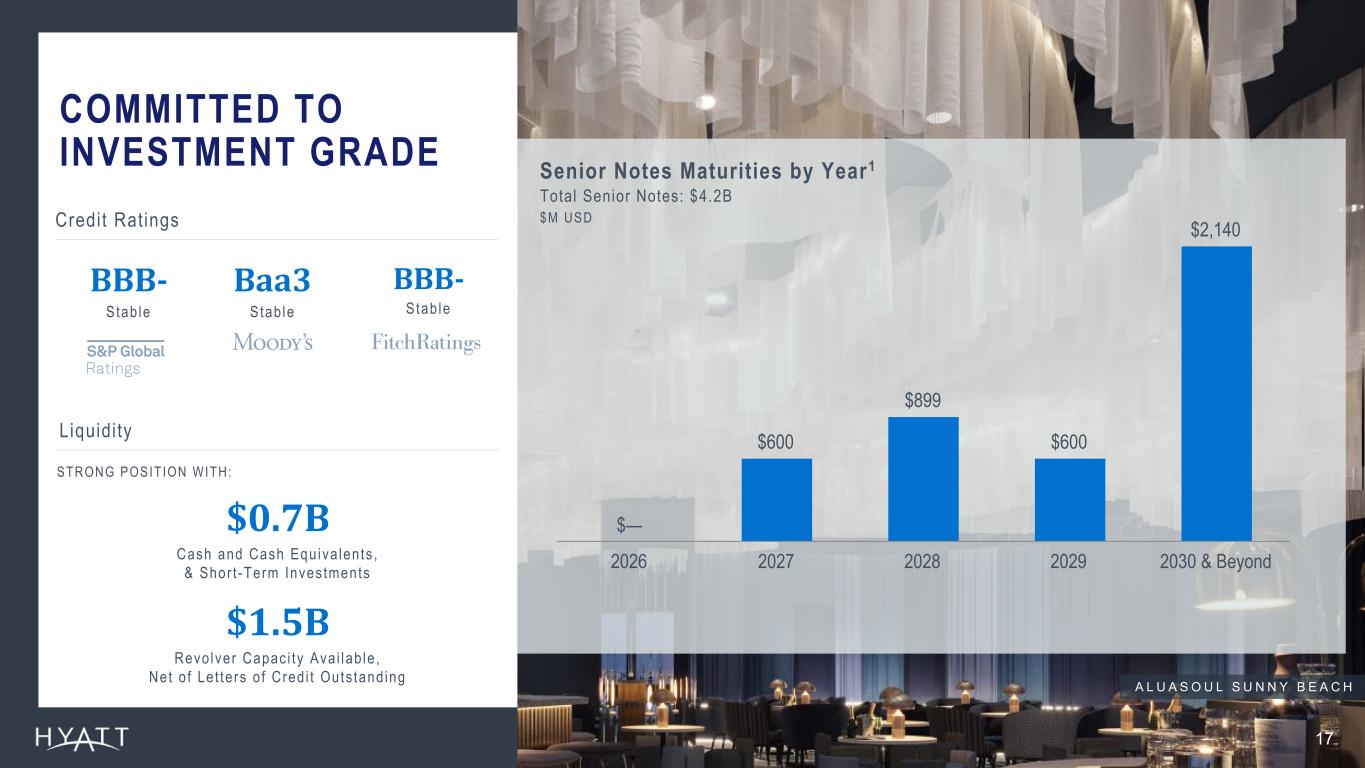
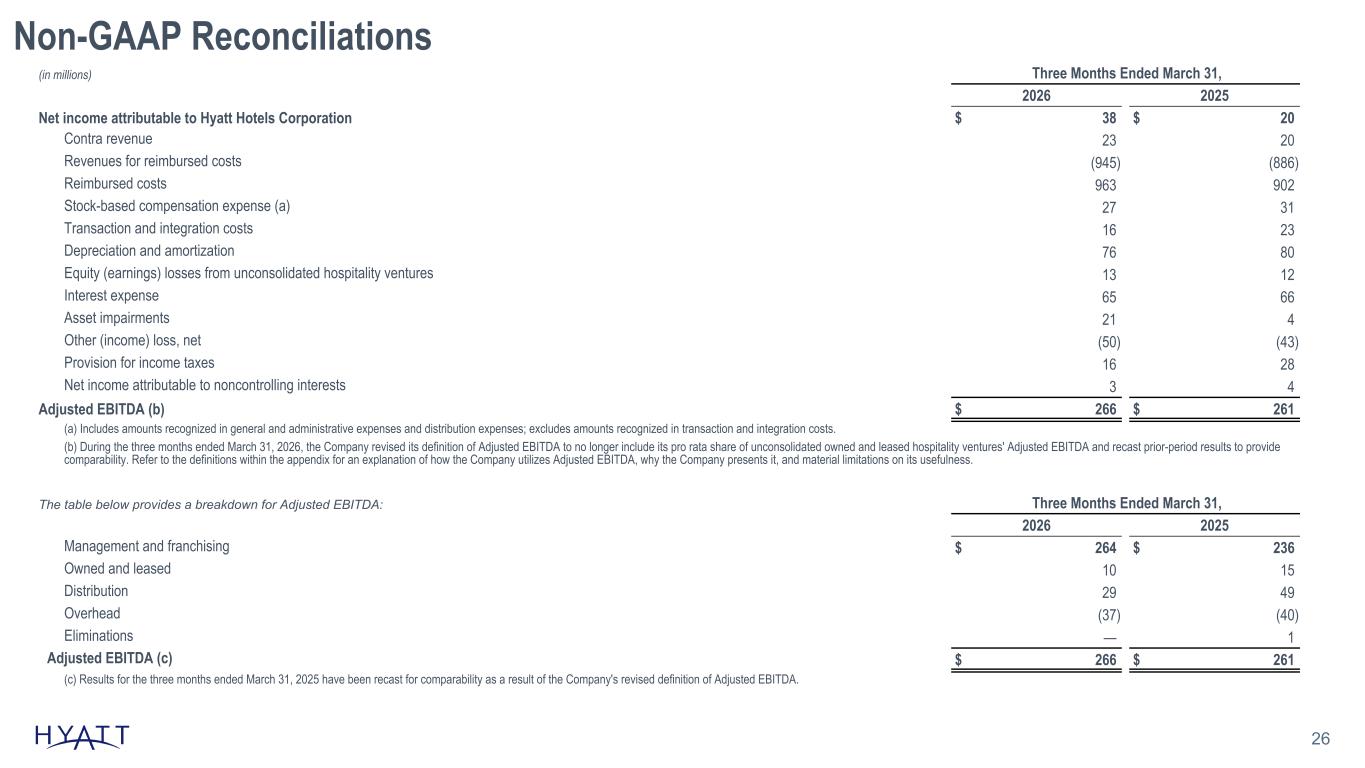
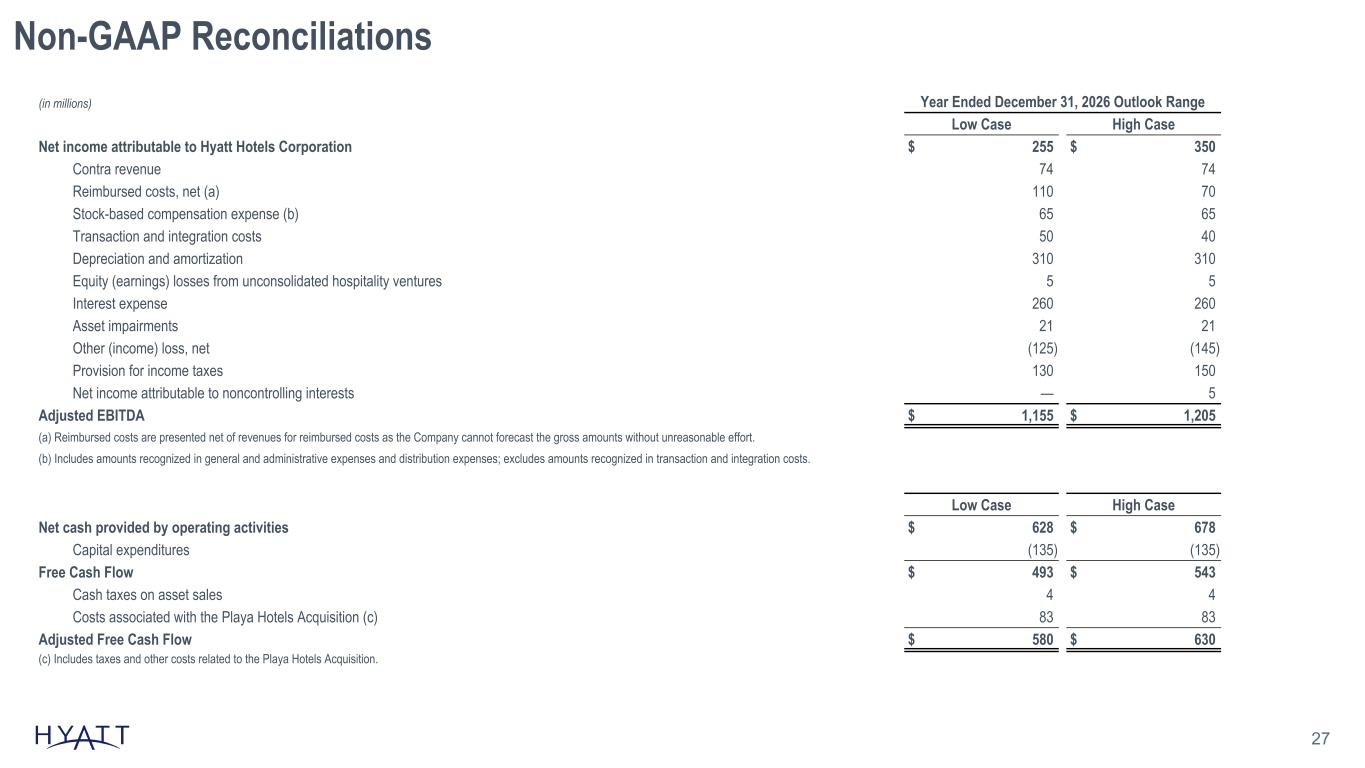
Thank you, Mark, and good morning, everyone. In the first quarter, RevPAR exceeded our expectations, increasing 5.4 percent compared to last year, driven by strong demand across our global portfolio and continued strength of the high-end traveler. In the United States, RevPAR increased 3.3 percent compared to last year. Performance was led by our full-service hotels, which benefited from strong leisure demand, including at our resorts, which had a particularly strong march. Group RevPAR was up 1.2% in the face of more difficult comparisons in Washington, D.C. due to the January 2025 presidential inauguration. We also saw improvements in select-service RevPAR, which increased 1.8%, led by business transient demand. Outside the United States, REVPAR growth was even stronger, increasing over 8%, reflecting robust international travel demand. Greater China grew REVPAR over 12% in the quarter, supported by improved domestic leisure demand, particularly during the Lunar New Year holiday in February, along with improved international inbound travel, including from the United States. Asia-Pacific, excluding Greater China, REVPAR, increased over 11%, driven by strong inbound travel and demand across key markets. Europe continued to perform well, with REVPAR growth of 7.5%, supported by strong leisure travel and solid group demand, benefiting from the Olympics in Milan. REVPAR in the Middle East and Africa declined by approximately 4%, compared to last year due to the conflict in the Middle East. Net package rev part in our all-inclusive portfolio increased 7.4% compared to last year despite the security concerns in Mexico beginning in late February. Overall, our first quarter results reflect strong demand for premium leisure travel globally and a healthy commercial travel backdrop. Turning to our financial results, our core fee business continued to perform well in the first quarter, supported by our top-line performance, hotel-level profitability, increasing scale, and the quality of our portfolio. Growth fees increased approximately 9% to $333 million, driven by strong performance across our managed portfolio, fees from newly opened hotels, and the newly structured management agreements from the Playa portfolio. We also grew incentive fees approximately 14%, reflecting solid hotel-level profitability, particularly in international markets. In the first quarter, owned and leased segment-adjusted EBITDA declined by approximately $2 million adjusted for the impact of asset sales. Distribution segment-adjusted EBITDA declined versus the prior year due to temporary factors including the closure of hotels in Jamaica because of Hurricane Melissa, and lower demand in Mexico due to security concerns. The distribution segment was also impacted by lower demand for four-star properties, a dynamic we have shared that will take time to return to previous levels as travel spend improves for this consumer segment. Overall, adjusted EBITDA for the quarter reflects the strength of our core fee business. As of March 31st, we had total liquidity of approximately $2.2 billion, dollars including 1.5 billion dollars of capacity on our revolving credit facility in the first quarter we repurchased 135 million dollars of class a common stock returning approximately 149 million dollars to shareholders through share repurchases and dividends we ended the quarter with 543 million dollars remaining under our share repurchase authorization we remain committed to our investment grade profile and our balance sheet is strong. Looking ahead to the rest of 2026, we are operating in a dynamic environment that varies from region to region. RevPAR in the Middle East is expected to be down significantly compared to last year, impacting fees by approximately $10 million for the balance of the year. Pace for our all-inclusive resorts in the Americas is up in the low single digits in the second quarter due to lower demand in Mexico. While While we expect positive net package REVPAR growth in the Americas, we do not expect to see the same level of growth for the remainder of the year compared to the first quarter due to the disruptions from the security concerns in February. Overall these disruptions are expected to have a modest impact to results. We are increasingly positive about the outlook for the United States. Forward booking trends in the United States are strong for the balance of 2026 with group pace for full-service hotels up in the mid-single digits for the remainder of the year. We continue to hear positive feedback from our group and corporate customers about their intent to travel this year, and we expect the strong leisure trends to continue. We are also seeing improved select service trends as we lap easier comparisons starting in the second quarter. Outside of the United States, we also expect performance in greater China and the rest of Asia to be very strong in the balance of 2026. We believe the improved performance in the United States supports increasing our full-year system-wide REVPAR growth outlook to between 2 to 4 percent. REVPAR in the United States could grow between 2 and 3 percent for the full year, reflecting the improved trends I just reviewed. We expect moderately higher growth in international markets compared to the United States overall, but growth will be lower compared to our expectations last quarter, primarily due to the impact of the conflict in the Middle East. We expect net rooms growth of 6% to 7% for the full year with continued momentum behind our new brands, driving another year of strong organic growth. We are raising our gross fees outlook for the full year and expect fees to grow between 9% to 11% in the range of $1.305 to $1.335 billion. We are maintaining our full-year adjusted EBITDA outlook range, and we expect adjusted EBITDA to grow at a strong rate of 13% to 18%, in the range of $1.155 to $1.205 billion. This outlook reflects stronger performance in our core fee business, offset by revised expectations for the distribution segment, which we believe will decline by approximately $25 million for the full year compared to 2025, including $15 million in the second quarter from the impact of the security concerns in Mexico. We are maintaining our adjusted free cash flow outlook for the full year in the range of $580 to $630 million, an increase of between 20 to 30%. This reflects a conversion of adjusted EBITDA to adjusted free cash flow of at least 50% for the full year. Finally, we expect to return between $325 million and $375 million of capital to shareholders for the full year through share repurchases and dividends. For the second quarter of 2026, we expect global REVPAR growth of around 3%, which reflects solid growth in the United States, including the start of the FIFA World Cup in June and continued strength in international markets except for the Middle East. Gross fees could grow in the mid-single-digit range in the second quarter compared to last year. We expect adjusted EBITDA for the second quarter to be up in the mid-single digits compared to what we reported in the second quarter of 2025 after removing $17 million of pro-rata JV EBITDA consistent with our updated definition and $14 million of owned and leased adjusted EBITDA for the period of ownership of the Playa portfolio. Please refer to Schedule A9 in this morning's earnings release for the 2025 adjusted EBITDA baseline by quarter, which excludes pro rata share of JV EBITDA and asset sales that were completed last year. In closing, our first quarter results reflect the strength of our core fee-driven earnings. Our results demonstrate the performance of our brands and the resilience of our premium customer base across brands and geographies in the face of a dynamic operating environment. As we look ahead, we remain confident in our ability to deliver continued growth, supported by our strong pipeline, differentiated brand portfolio, and disciplined approach to capital allocation. We believe we are well positioned to navigate a dynamic environment while continuing to deliver meaningful long-term value for our shareholders. This concludes our prepared remarks, and we're now happy to answer your questions.
Operator
Thank you. We will now begin our Q&A session. If you would like to ask a question during this time, simply press star followed by the number one on your telephone keypad. If you would like to withdraw your question, again, press star and one. Please limit questions to one per analyst. Our first question comes from Lizzie Dove with Goldman Sachs. Your line is open.
Hi, good morning. Thanks for taking the question. So we've seen, obviously, this really meaningful positive shift in the U.S. demand dynamic. You know, there's been some talk of the C-shaped economy, but it also seems like your higher-end customer is still doing very, very well. And so maybe you could just unpack a little more about what you're seeing real time, what's embedded in that 2% to 3% you raised at 2% in the U.S. in terms of business and leisure, and how you expect that to kind of shape up throughout the year.
Sure, Lizzie. Yeah, we had a result in the first quarter that exceeded our expectations. And leisure transient in the quarter in the U.S. alone was up 4%. And group REVPAR being up 1.2 with the, you know, comparison we had to the inauguration last year was a strong result. And even probably more, I guess, in excess of our expectations was select service REVPAR was strong. And that was driven by business transient improving. So all of those trend expectations, we're looking at the second quarter and the rest of the year and factoring that into our outlook. I mentioned that we expect the U.S. in the second quarter to be between 2% to 3% growth. And that's going to be helped in part, too, by the group business that we're seeing from FIFA in June. And that will carry over into July a bit, too. So for the full year, we believe we have a strong and reasonable expectation given what we're seeing. I mentioned group up in the mid-single digits for the remainder of the year in the U.S. And business transient and leisure transient, the booking windows are still modest, but we feel really confident about our outlook now for the U.S.
I'll just add a couple of comments, Lizzie. Thanks for the question. We have the quality. Secondly, whether you look at STR chain scales or you look at the luxury brand group that we've defined first, if you look at our brand, we also had almost five of increase in first quarter. So we really have a weakness in terms of the high-end customer. We have not seen it.
Operator
We find the game differently and also the clients that we serve and how we – Your next question comes from the line of Stephen Grambling with Morgan Stanley. Your line is open.
Hey, thank you. Wanted to turn to the distribution segment a little bit. Recognize that you had some kind of one-off things that are impacting it, but how should investors think about the drivers of this segment longer term? And separately, do you still see synergies from this business within the overall Hyatt portfolio, if you will, or is this more of kind of a standalone at this point?
Thank you, Stephen. First of all, the way we think about the businesses, it has been a couple of isolated issues, and you heard what our outlook is for the year, and then secondly, the Mexican security concerns. I would say that we view both of those things is we see actually more, if I had to say, do we see more opportunities than risks? In the same way that we have revamped how we go to market in relation to ALG vacations, and I think drive more volume. And the platform itself is highly enabled to be a white-label basis. And we see growing opportunities in that domain because there are a lot of larger bases that are looking to one key area. So we see a revenue generator, and it strategically serves a purpose of being able to use visibility into things like we buy. I would hazard a guess that it's in excess of a billion seats every year, as we ships with all the carriers as well as how we forecast. So I would say there is a strategic rationale. It does fit with the inclusive collection. If that were not true, I'm not sure that we would own this business, but it is true, so we own it. It happens that we are not looking at this as sort of, you know, just a cog in the wheel. We're looking at it as a real business with real opportunity in the future.
And the only thing I would add to what Mark just said is structurally about half of the business serves five-star locations. and half of the business serves four-star locations. So when you think about the performance of our portfolio and the demand that we saw despite the security concerns in Mexico, that there was redirection of a lot of that business into other locations. So that is something that has benefited our portfolio. But on the temporary side with respect to four-star, we're seeing actually after the disruption late February and into March, that pick up stabilize and grow so when we look at the second half of the year that's where we're seeing the impact from the first year excuse me from the first quarter in the second quarter to get much better and particularly into the third and fourth quarters of this year so while we're on this topic I do want to provide a couple of pieces of data that I think will provide context first in terms of gross fees Mexico represents a gross fees the Dominican in the Republic, it's about 1%.
So as we talk about these, secondly, we were positive. The Hyatt Inclusive Collection had positive red part growth across each of those markets. Sorry, not Jamaica. Jamaica is still 3% in Mexico, up 11%. Really where you saw the massive change was March. So 16%. And that is a direct reflection of the channel shift that we actually played a big role in because we cascade business. So that's for you to actually strategic value.
Operator
Your next question comes from the line of Michael Bellisario with Bayard. Your line is open.
Good morning, everyone. Morning. Mark, on the demand front and sort of your big picture outlooks and kind of taking those together just how are you thinking about or maybe sensitizing just the whole potential range of outcomes with all the macro uncertainties out there just like higher gasoline higher airline ticket prices reduced flight capacity just how are you thinking about that are you seeing anything yet in the booking pace that maybe gives you any pause thanks not at the moment i think quite a lot
And that keeps going. That's where the pain will be felt. I think airfares have already gone up. And depending on what market you're looking at, they've gone up between 5% and 10%, maybe a little higher than that in certain markets. and also households. We don't see any significant, some level ever-escalating oil prices and inflation will have an impact.
Operator
Your next question comes from the line of Richard Clark with Bernstein. Your line is open.
Hi, thanks for taking my questions. Just want to follow up a little bit more on some of the Caribbean dynamics. I think at the four-year results, you would have expected the Jamaica hotels to reopen by the end of this year. I think it looks like that's going to move to early 27. So what impact does that have on this year's numbers? And just on Mexico, are you seeing demand there now normalizing? Is that what you're saying for the second half, that Mexico will be back to normal levels of demand beyond the same quarter?
Richard, I think you were referring to Jamaica, and we have removed Jamaica for this year. So impact of this year is nothing greater than what we've presented in our EBITDA and fee outlook. And we provided a walk during our investor presentation, in our investor presentation in the fourth quarter on that specifically. So that's the story with Jamaica, and we'll keep you posted as far as reopening and our expectations in 2027. With respect to Mexico, we are seeing moderating of the impact that I mentioned that we saw in late February and into March. so we feel good about what we're seeing in the last couple of weeks so week on week you know we're actually seeing pace getting better and as Mark mentioned you know airline capacity has has not gotten larger but airlines are actually managing this with load capacity so there's still quite a bit of demand that's going into these markets as we look out into future quarters so the second half of the year we feel good about that we'll be able to pick up. And our outlook overall is positive for the Caribbean and for our net package rev par in the Americas. Part of that is due to the improvement in Mexico, and part of that is due to some of this redirection of travel into other markets where we have hotels.
Operator
Your next question comes from the line of Sean Kelly with Bank of America. Your line is open.
Hi, good morning, everyone. Thanks for taking my question. I just wanted to ask about some of your global expectations. Could you just give us a little bit more color on how you're thinking about Middle East and Africa trending through the balance of the year and then just maybe some of the offsets globally as I don't know if Asia is seeing any redirected businesses now staying more in that market and not kind of crossing over to Europe or just how you see some of those kind of global puts and takes. Thanks.
So I'll start with what our outlook includes, Sean, and then maybe Mark will want to add as well. Middle East, right now what's built into our outlook is a, which is embedded in our EBITDA outlook that we, that I shared. So we expect demand in the second quarter to be more impacted and then to improve in the second half of the year sequentially quarter over quarter. So kind of by the end of the year, getting closer to maybe flat, but we'll see, because it evolves over the coming quarters. But that's what's embedded within our outlook. And the one region that has been exceptionally strong is China. I mentioned the Revcar growth in the quarter of 12. The region overall, excluding greater China, is up 11%. We're seeing strong results into April on a preliminary basis. So that has also been a region that has exceeded our expectations. In China, this is, we had the Lunar New Year holiday in the quarter, which always gives a boost of seeing groups slightly up and BT about flat. So, you know, across all demand segments, China looks like a region that we can continue to rely on growth for the remainder of the year?
The only region I would add a little commentary to about is Europe, which was up 7.5% more than we anticipated. There are fragility. Again, this is between how economy, budget, it's full service and luxury. So we actually have a positive outlook in Europe for the remainder. 23 would be Europe could be good. I believe it is a mistake.
Operator
Your next question comes from the line of Smooth Throws with Citi. Your line is open.
Hi, thanks. Appreciate all the color around Mexico and the Middle East. Maybe just kind of switching gears a little bit, I was just curious as to your comments at the beginning of the call about terminating your sale of the Andaz in London and not moving forward with a couple of other asset sales. Could you maybe just, I don't know if you can provide any more color around what sort of broke those deals, that would certainly be of interest. But then also, how are you just thinking about the transaction environment overall? Is it getting more favorable relative to, you know, your last call or maybe at this time a year ago? And any kind of, I don't know, would you like to be able to complete additional asset sales, I guess, as we move through the balance of the year?
Thank you for the question. For those of you who don't know the national, that we, the MTA from Hong Kong, to redevelop the entirety of a number of conditions, including approvals. We don't believe the opportunity is dead. We believe that the deal that we had signed up, that means that there won't be a redevelopment. I believe it will take a different shape. It's involved in that project unfold. Secondly, we will not do the redevelopment by way of selling the product. The other hotels actually were relatively small deals. We would put in the category of portfolio cleanup. They happen to be on leased property, so it's a ground lease that the hotels operate on. So they're not material. We ended up with market-specific reasons why we elected not to proceed properties with two properties that we had previously had signed. And we believe that we'll get paid to wait. And finally, yes, we are working on other opportunities to have additional asset sales. So when I mentioned our transaction market remains unchanged, what that means is our intention to continue to sell properties. And I do think that the market for property sales is much more constructive this year than it was last year.
Operator
Your next question comes from the line of Dwayne Fittigworth with Evercore. Your line is open.
Thanks for taking the question. So just low singles EBITDA growth in the first quarter. It sounds like mid-singles in the second quarter. Can you just big picture walk us through the building blocks of why we would get so much acceleration in the back half?
Sure. As we look at the core business, we've been talking about how strong we have been performing and how we anticipate continuing to perform, including our net rooms growth expectations. So when you look at the total year RevPAR, total year net rooms growth, that's going to lead to very strong fee growth for the year. And in the second half, I mentioned that the distribution segment will recover. There will be better performance experiencing easier comps in that quarter. So there's a couple of factors in half of the year. There's also structurally, if you'll recall, we renegotiated the playa contracts. And in the second half of the year, we don't have the headwinds from the franchise fees that we had in the first quarter. So that helps us on the fee growth into the second half of the year. So there's a couple of structural items. There's improvement in the distribution business that we're confident in, and the core fee business will remain strong going into the second half of the year. Also, I would mention, Duane, the G&A that we posted in the first quarter was a little bit higher than our expectations, mostly due to timing. So as we look at the last three quarters of the year, we'll have lower G&A expense as well.
Operator
Your next question comes from the line of Dan Poulser with J.P. Morgan. Your line is open.
Hey, good morning, everyone. Thanks for the question. I think you spoke a little bit about general drivers of demand, but something that I think came into the year hearing a lot about was World Cup, America's 250th, things of that nature. So, I mean, has there been any change in kind of the outlook there as it impacts your business, especially in kind of the peak summer season?
Excuse me. No, I think there's been no change in the outlook. It's positive to the cities that are we New York as I think those will be. So the July pace for New York is really inherently shorter term. And so our visibility to how much transient we actually pick up between now and the time that we in the teens in terms of group group pace um so i i would say we thought it was going to be strong in those particular cities and we continue to feel that way your next question comes from the line of david kapp jeffries your line is open hi good morning everyone thanks for taking my question um i i wanted to just uh go back to technology and ai in particular it's obviously a growing topic across the industry
Um, you know, Mark, I'd love your perspectives on sort of where you're at, you know, where you'd like to get to, uh, and, you know, how you see it evolving for, for Hyatt and the Um, sure.
We say, uh, don't believe that any particular platform or tool is, we become the level of expertise and, frankly, reps, you know, repetitions of creating great tools and being able to pivot and continuously models, even as the model is of the adoption of regular use. Every IT meeting, I hear new and different hotel teams have come up, and I think the adoption rate and level of expertise, we've heard about some really remarkable advancements, And I think it's the combination of that enablement at the center with a special focus on the local level, the combination of those two things is really where we continue to see revenue, our number one focus, has also resulted in what do you do with that? we redeploy those resources we've derived over this period of time. And I think it's one key driver of that is the opportunity to see the big opportunities to actually emanate in the end of taking a lot of administrative work out of the system entirely. And that's really a powerful...
Operator
Your next question comes from the line of Chad Bainon with McQuarrie. Your line is open.
Thanks for taking my question. Great to see the increased pipeline of executed MNF contracts that you announced in the print. Just with respect to the Middle East conflict, should we expect any type of construction start delays or overall activity delays? Or do you think this pipeline should be executed kind of as planned?
Given the nature of what we've got in the region, we don't see any impact.
Operator
Your next question comes from the line of Trey Bowers with Wells Fargo. Your line is open.
Hi, this is Nick Weichel on for Trey. I just want to dig in a bit more on Nug and try to figure out, like, you know, which brands you're seeing the most uptake in, maybe the mix between, like, conversions and new builds for the year. And you just hit on the impact or potential impact from the Middle East. So any color would be great. Thanks.
Yeah, super encouraging. When we look at the pipe year over year, the activity level, 25%, say, this year, being in the year for the year. In the year for the year, we already have 60%, but we feel really good. Yes, the activity in the U.S. in the studios, quite a few, if I count them correctly, probably 30% of the conversions that we see already planned for the year. I'm encouraged across the board, but I have to say in the U.S., which will really help us fill in a lot of markets in which we have no representation whatsoever, we opened seven new markets in the first quarter, and I think we're going to end up opening a huge number of new markets this year.
Operator
And the final question will come from Meredith Jensen with HSBC. Your line is open.
Good morning. I was hoping you might speak a little bit more about the loyalty program. I know you gave the membership and the strong growth, but I was hoping if you might dig into a little bit more about spend redemption behavior, how that's evolving kind of over regions and customer cohorts, and perhaps add in any insights you might be getting from your credit card partnerships, that kind of thing, that would be great.
Sure. First of all, in terms of the nature of the space, 65% of the, actually, the, and we see our members are increasing. The other thing that we have really been intrigued with is as we work closely with partners of ours and sponsorship initiatives that we've undertaken, And we're seeing not only high engagement, but all that is really attracted, is represented by the travelers. And we play primarily in the top 20% of the travelers. So we're going to be able to add value primarily through experience. I think that's some comments I made about experience versus transit. I didn't mean that the transit is most valuable for our members. It's really about the emotional connectivity we can establish, the care that we can extend, not only through well-being and other experiences, but also in just how we approach our members. So that's our approach. We are small enough and differentiated enough to really make this model. And I think that's why you're seeing such persistent, significant growth in the membership base, which will continue to devolve to our benefit. So thank you for that. I want to thank everybody for all your time this morning. We're incredibly excited about where we stand, strategies that have left us in a very strong position. I do want to remind everyone that we have an investor. If any of you who are coming, secondly, please sign up. Many benefits will for already World of Hyatt members. We'll do a great rest of the day.
Operator
This concludes today's conference call. Thank you for participating and have a wonderful day. You may all disconnect.