Operator
Good morning ladies and gentlemen and welcome to the HomeBancorp's fourth quarter 2025 earnings conference call. All participants will be in a listen-only mode. Should you need assistance, please signal a conference specialist by pressing the star key followed by zero. After today's presentation, there will be an opportunity to ask questions. Please note that this event is being recorded. I would now like to turn the conference over to HomeBancorp's Chairman, President, and CEO, Don Portalone, and Chief Financial Officer, David Kirkley. Please go ahead Mr. Kirkley.
Thank you. Good morning and welcome to Home Bank's fourth quarter 2025 earnings call. Our earnings release and investor presentation are available on our website. I ask that everyone please refer to the disclaimer of our forward looking statements in the investor presentation and our SEC filings. Now I'll hand it over to John to make a few comments about the quarter and the year. John.
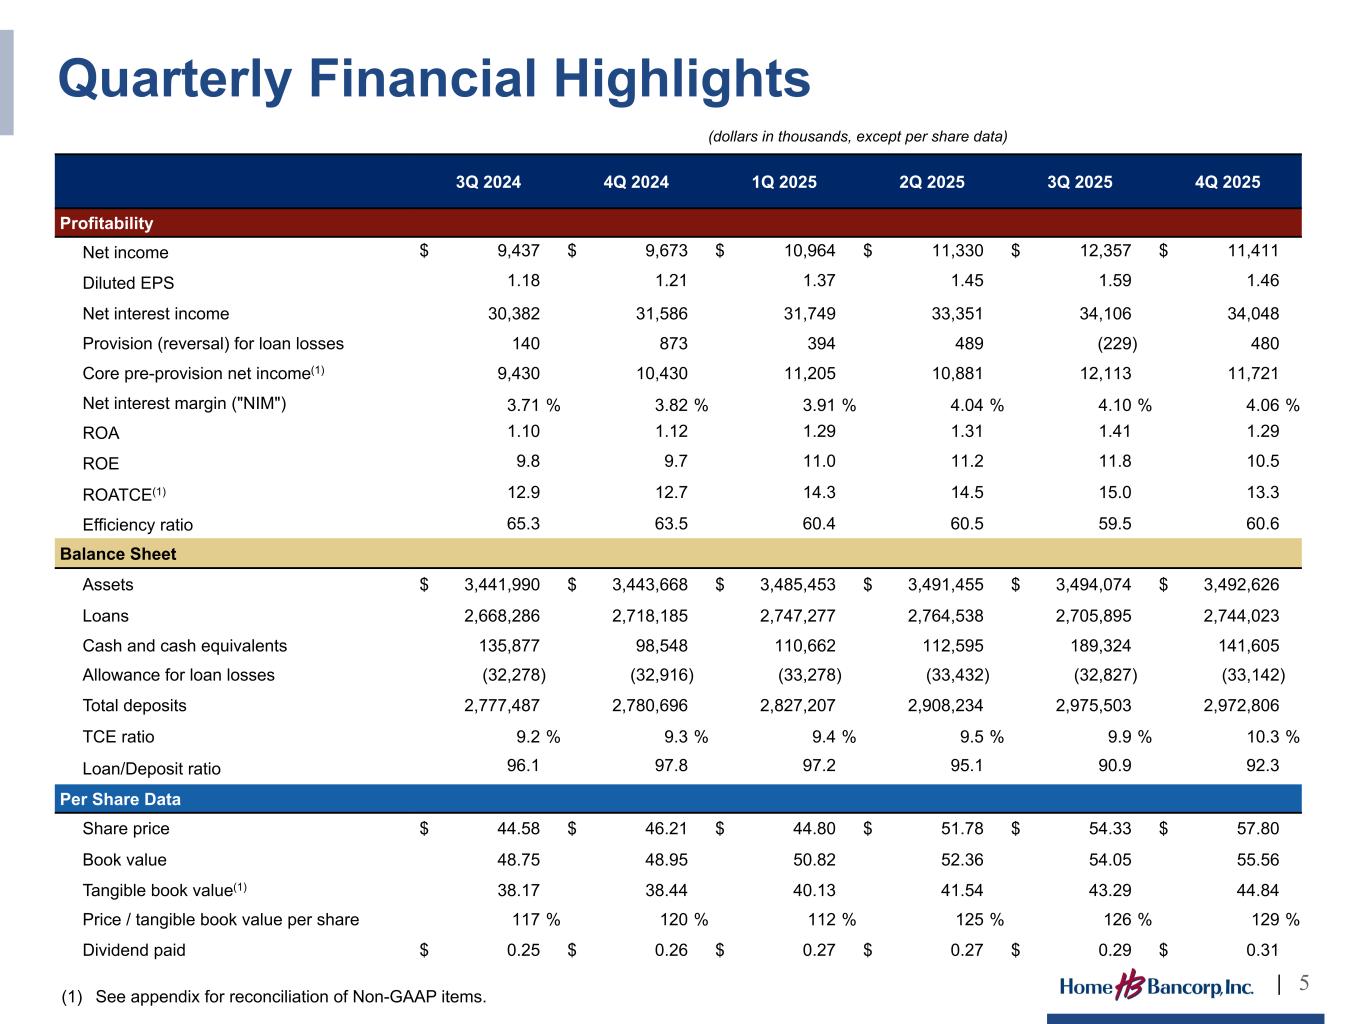
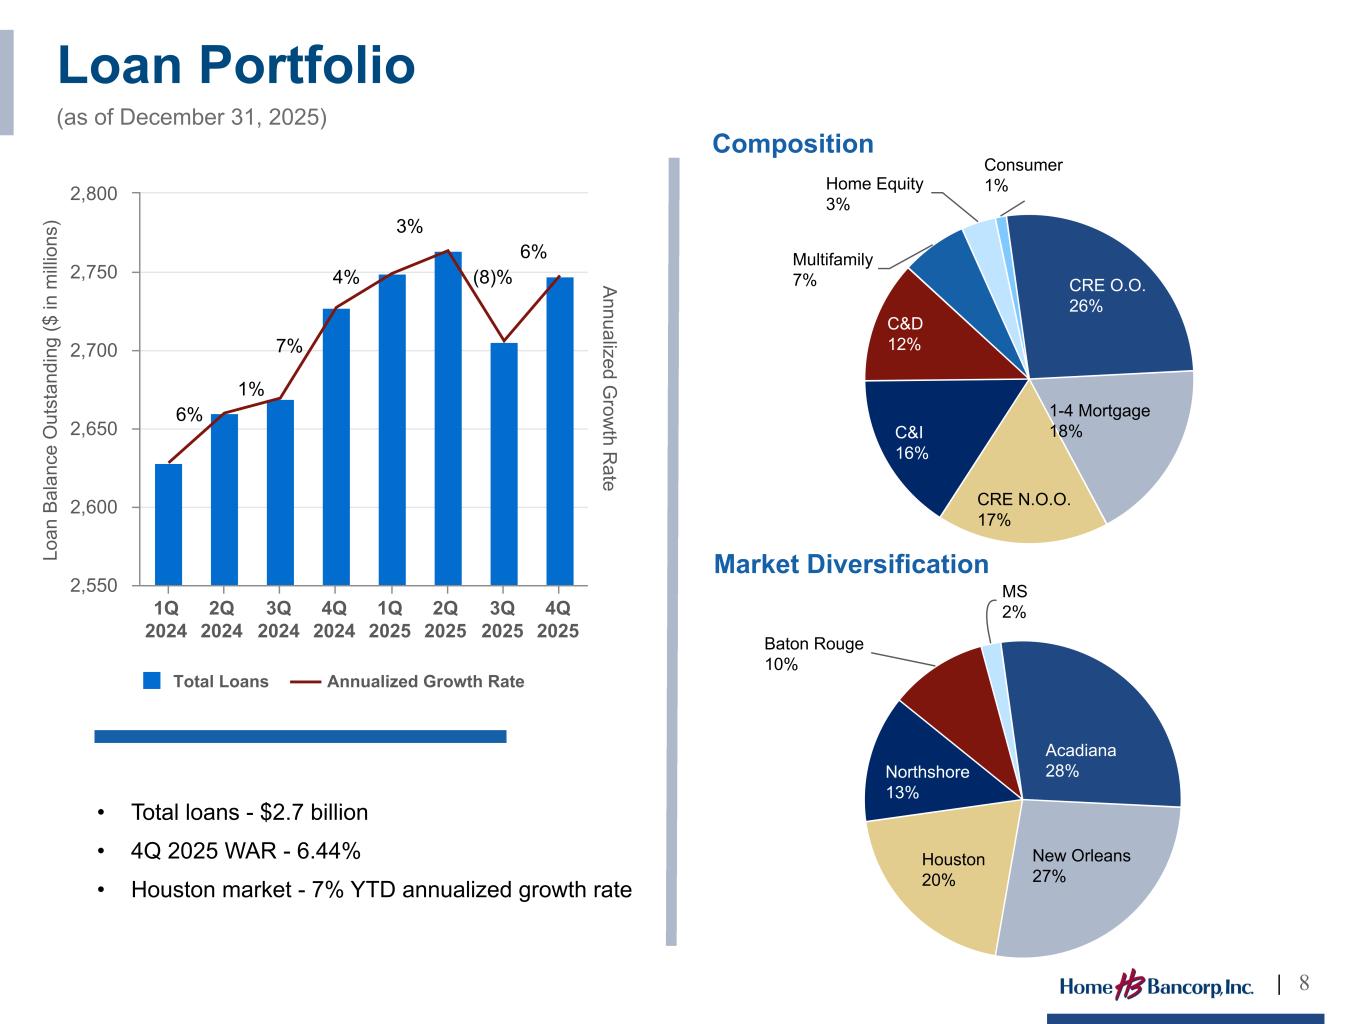
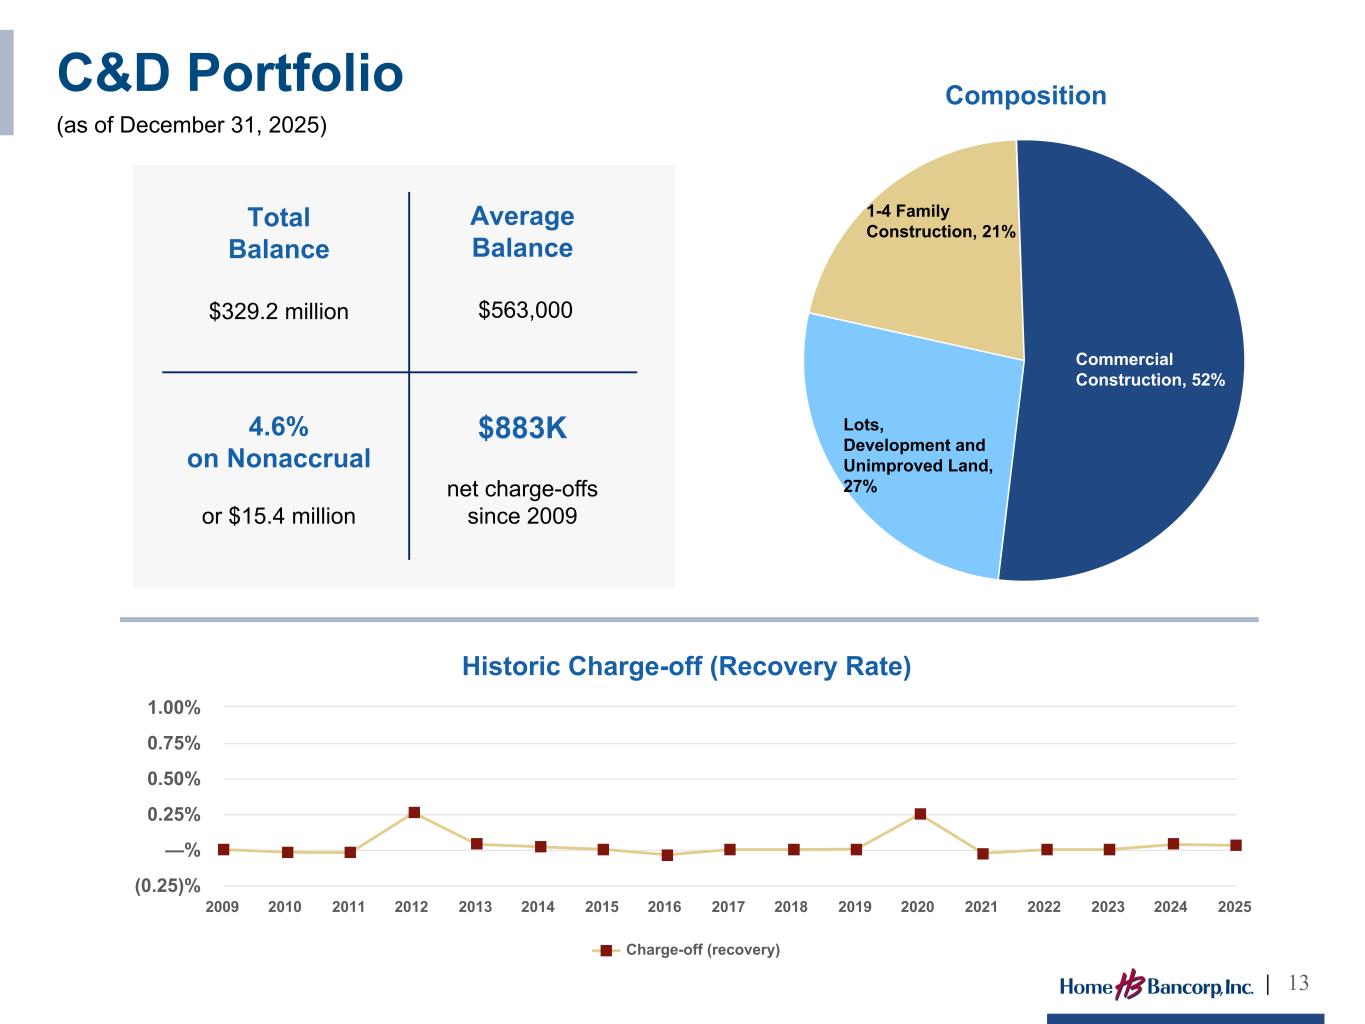
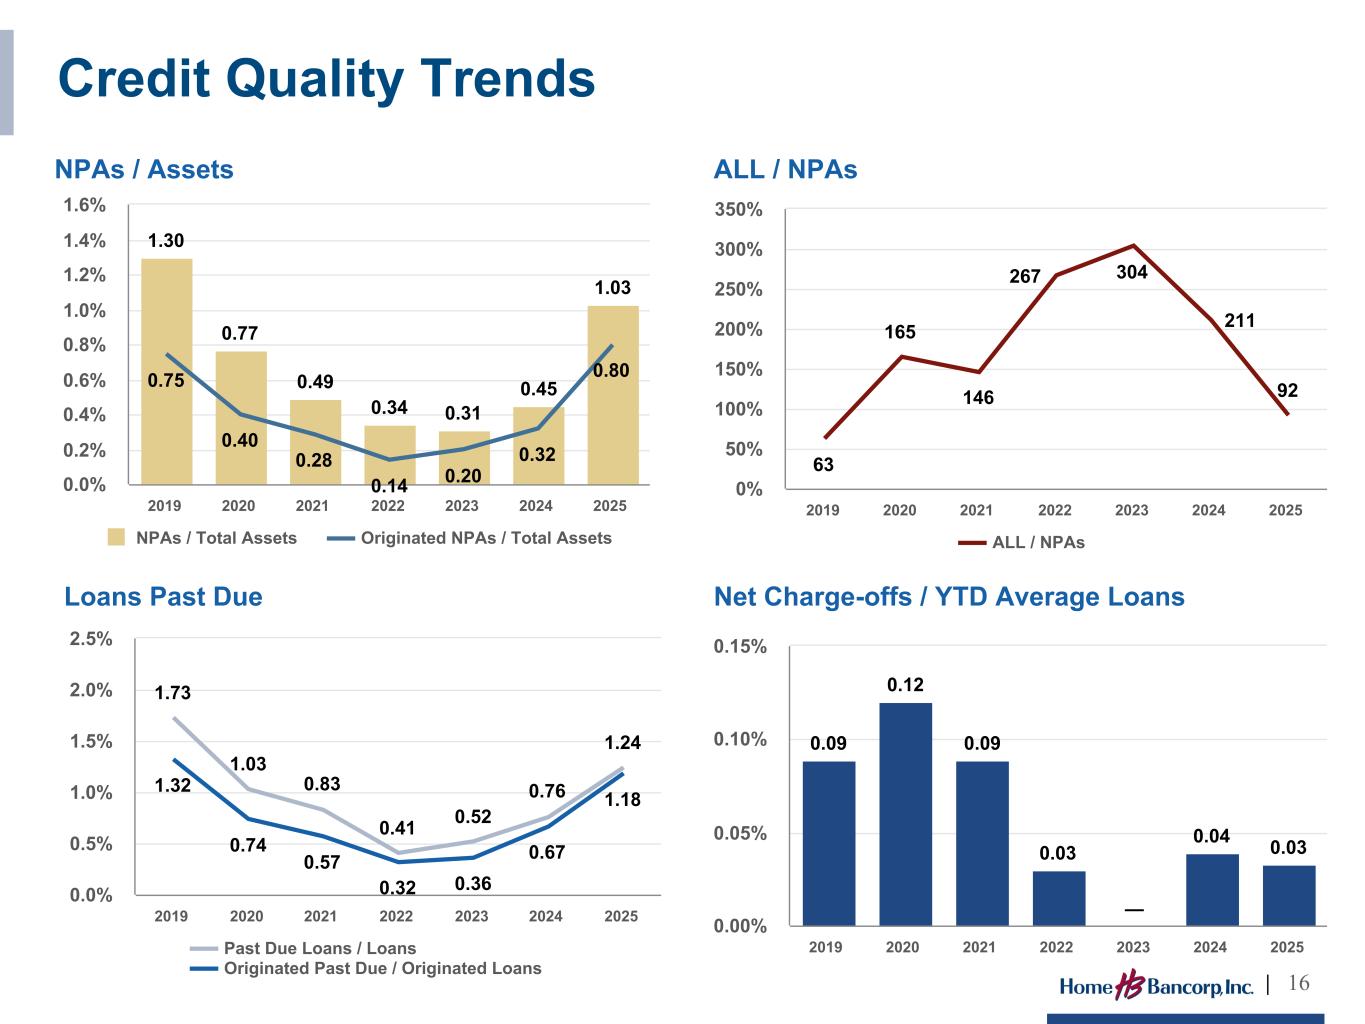
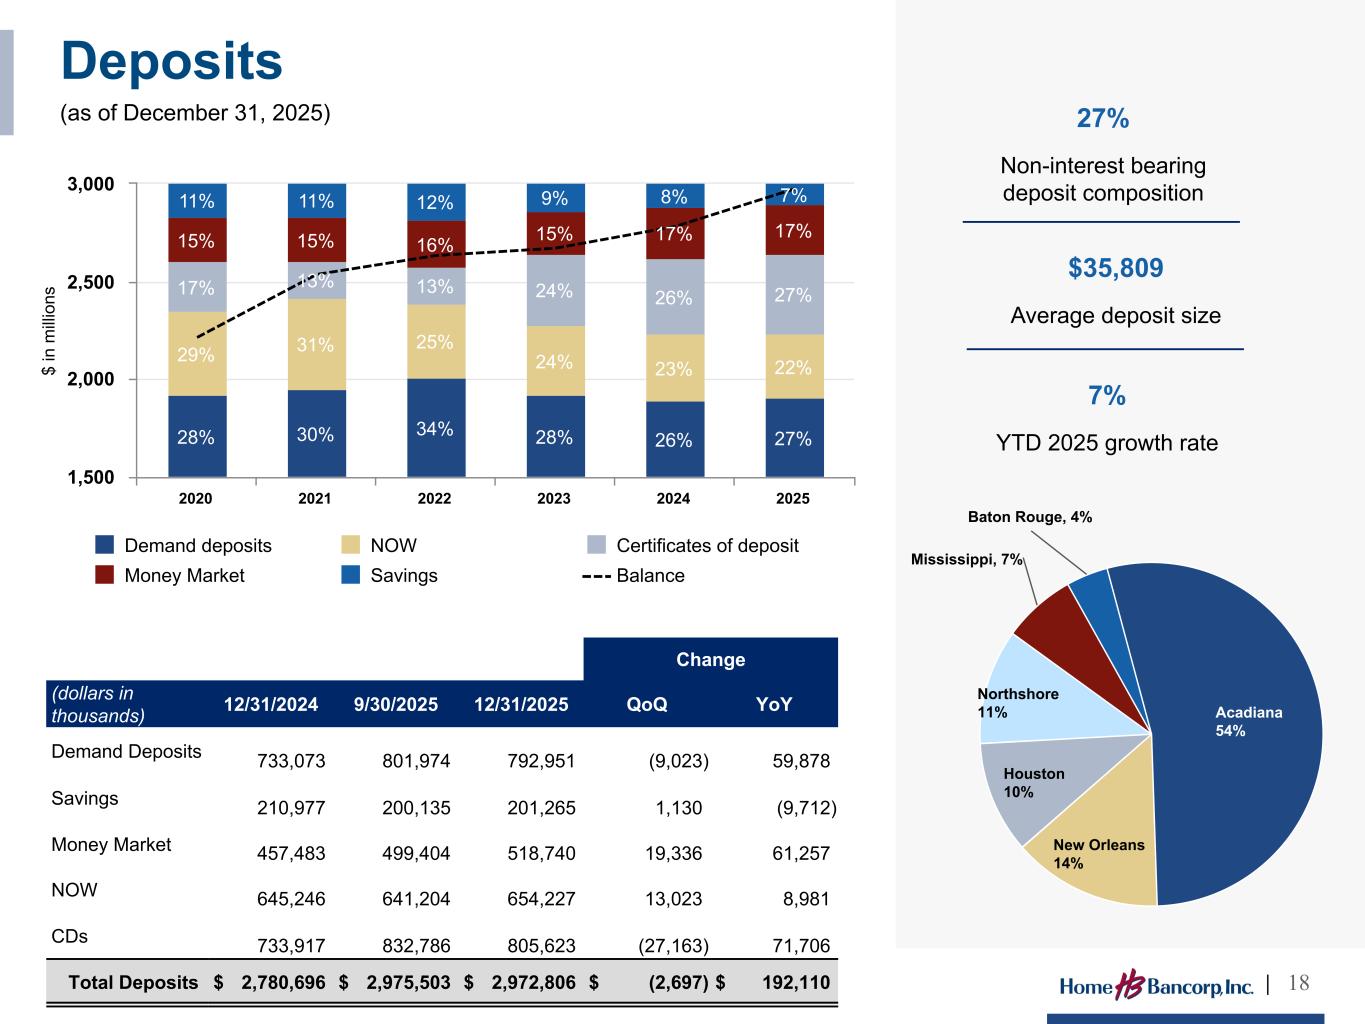
Thank you David. Good morning and Thank you for joining our earnings call today. We appreciate your interest in HomeBank as we discuss our results, our expectations for the future, and our approach to creating long-term referral or value. We're proud of everything we accomplished in 2025 and believe we are well positioned to continue the outstanding performance you've come to respect from HomeBank. Yesterday afternoon, we reported fourth quarter net income of $11.4 million, or $1.46 per For the full year, 2025, net income was $46 million, or $5.87 per share, which is a record for Home Bank, and 29% higher than our 2024 earnings per share. Fourth quarter net interest margin was 4.06%, and the ROA was 1.29%, which was sharply higher than the fourth quarter of 2024. That NIM was 3.82% and the ROA of 1.12. Loans grew by 38 main in the fourth quarter, or 6% annualized, as strong December originations exceeded still elevated payoffs and paydowns. Our pipeline is building and paydowns appear to be slowing, so we expect growth in 2026 to be in the mid single digits. While loan growth in 2025 was not up to our historical trends, deposits grew by 7% or $192 million with strong growth in demand deposits and in relatively low cost money market accounts. As a result of our success attracting deposits, we were able to reduce our loan-to-deposit ratio to 92% in the fourth quarter from 98% a year ago. We intend to continue to focus on deposits which will build franchise value and position us for increased profitability when we return to our historical rate of loan growth. We continue to have success with our Texas franchise which is now in its fourth year of operation. We now have 15 commercial bankers in five branches and one loan production office in the Houston market and expect to open a new full service branch and close the loan production office in the first quarter. We expect the lending team we hired in late 2023 will be even more productive than they have been. Since entering the Texas market in 2022, loans have grown at a 15% annual rate and now represent 20% of our loan portfolio. Non-performing loans increased in 2025, but our charge-offs remain very low and we don't expect that to change due to our conservative underwriting standards and proactive credit management. As you can see on slide 16, our net charge-offs have averaged about six basis points over the last six years. We continue to perform at a level above our peer banks and expect this trend to continue. We are confident in the whole bank's future and our ability to meet our higher standards in all economic climes. With that, I'll turn it back over to David, our key money at 12.
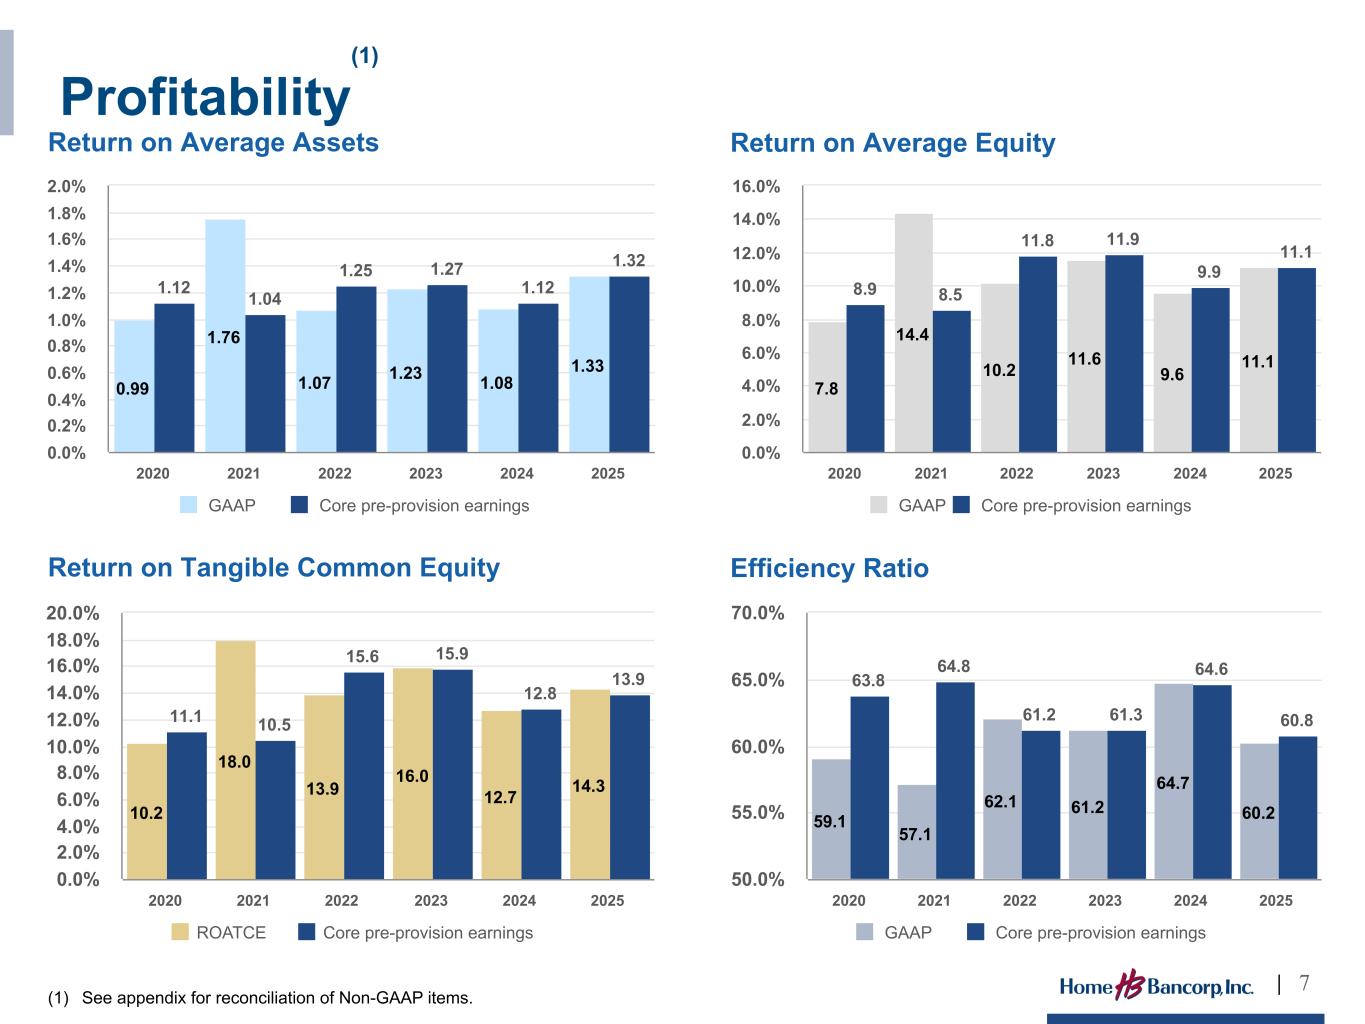
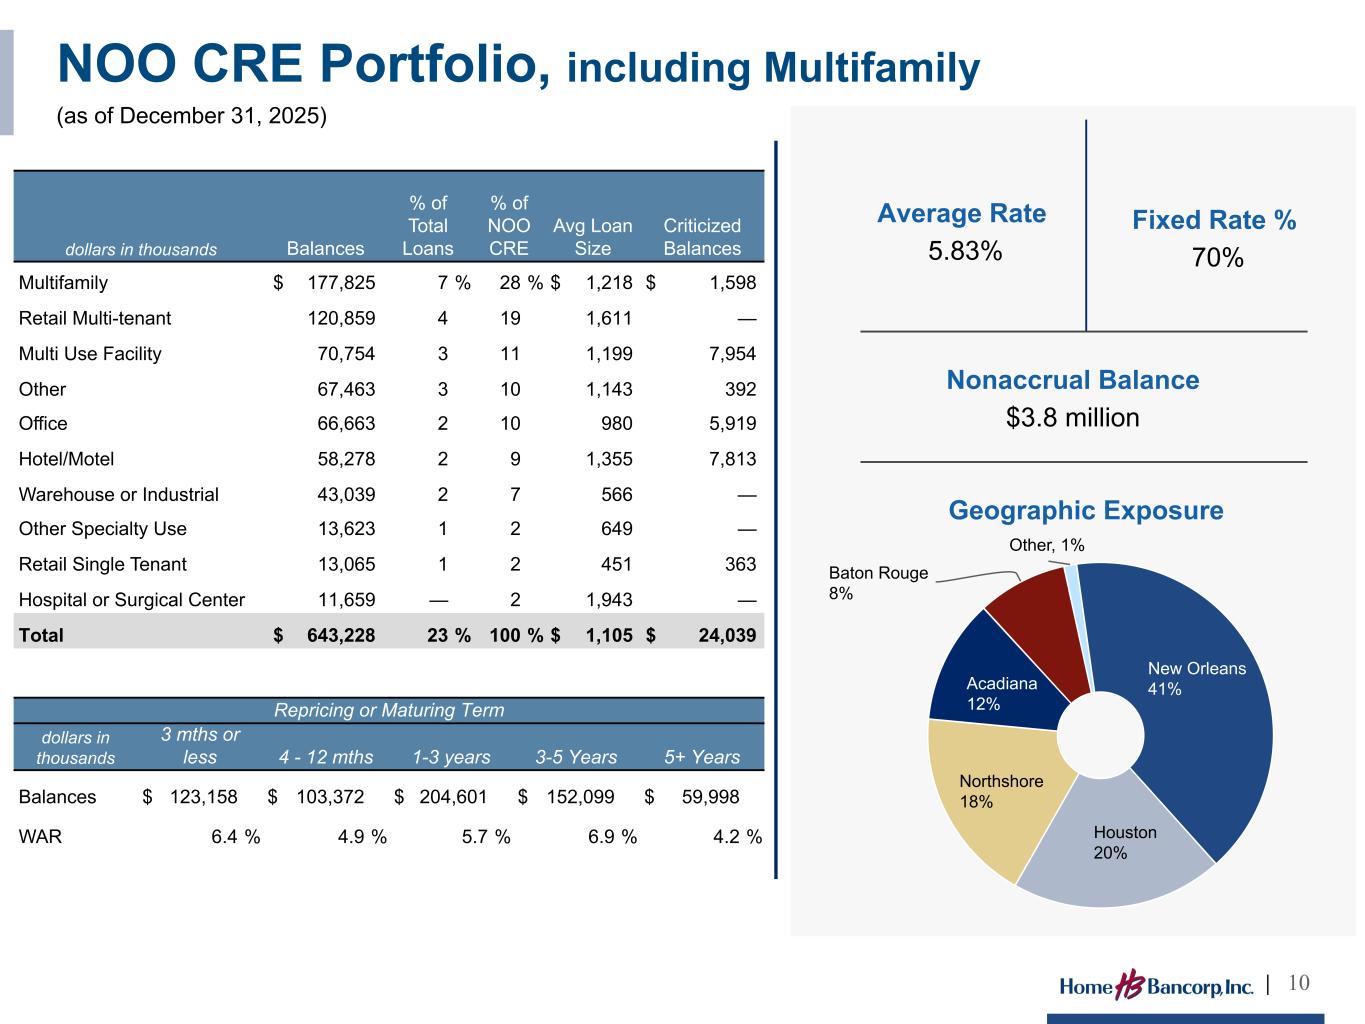
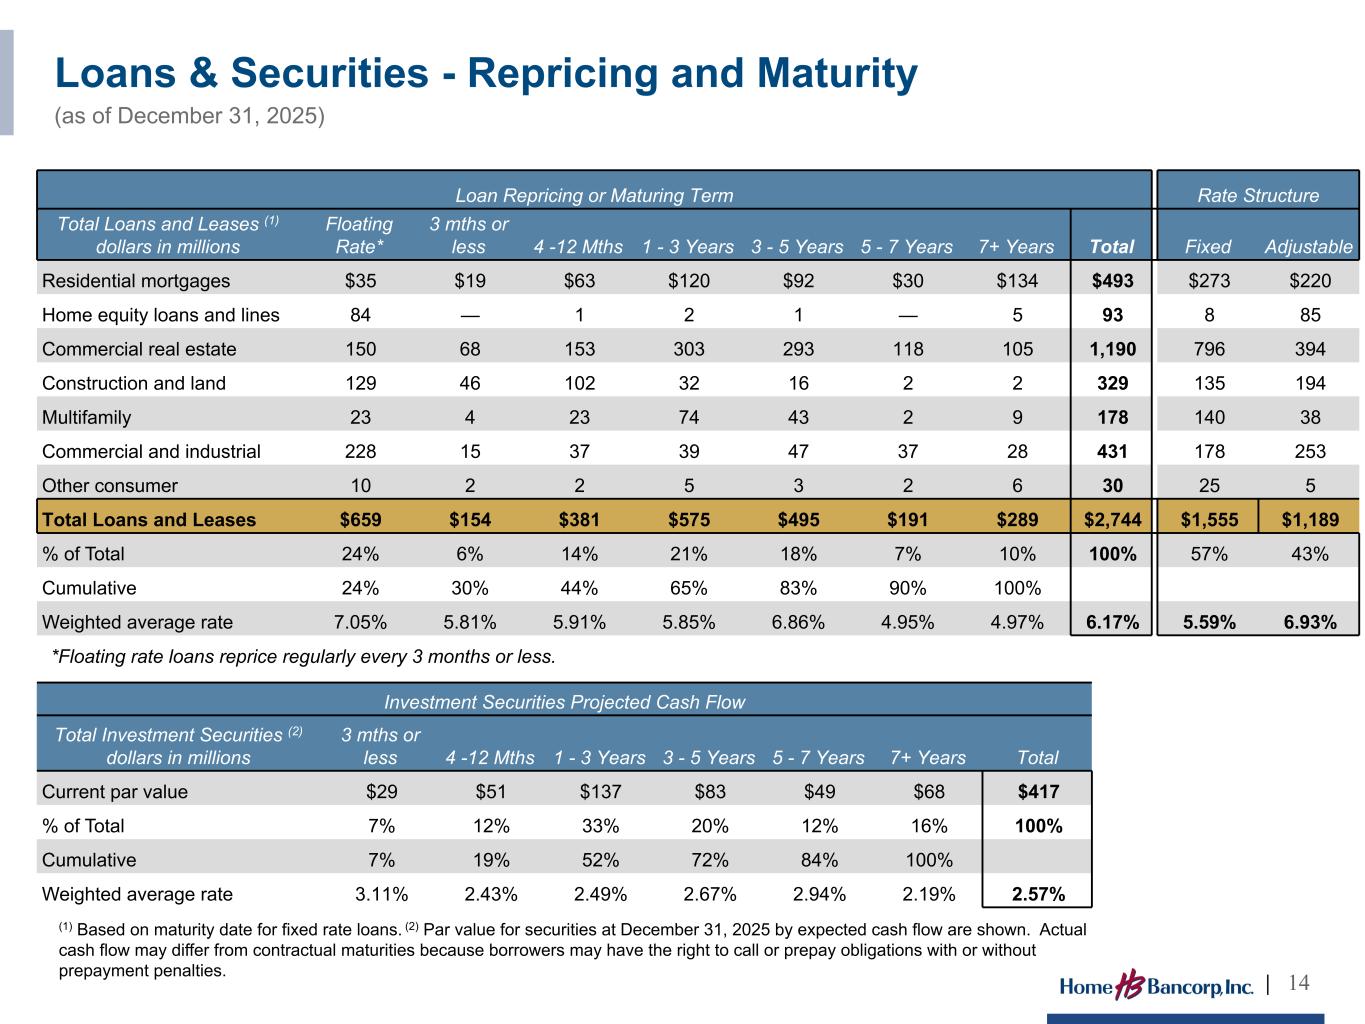
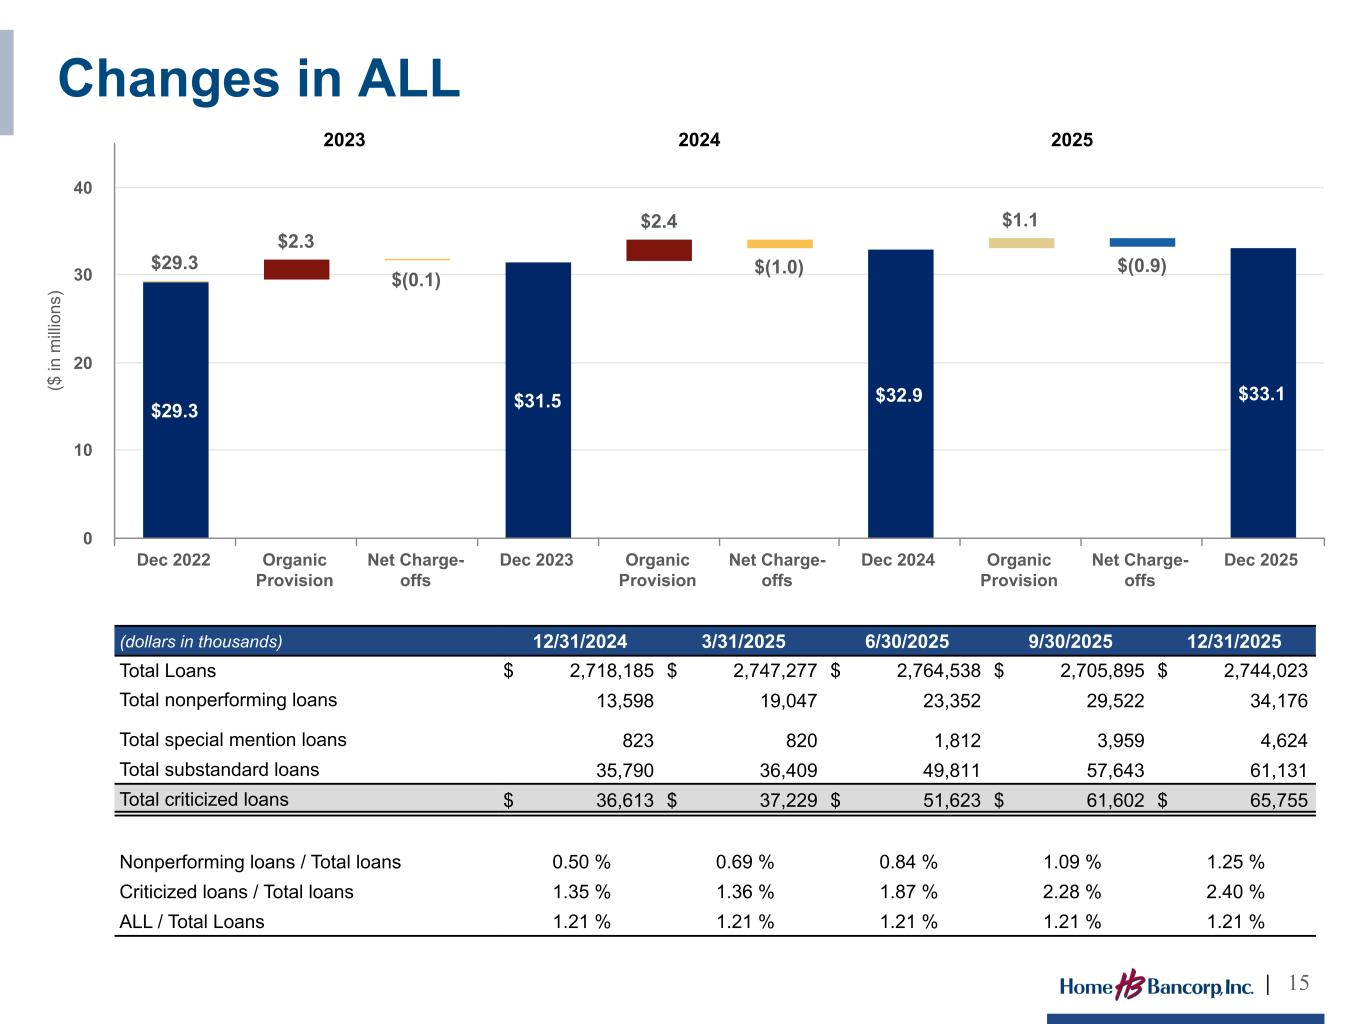
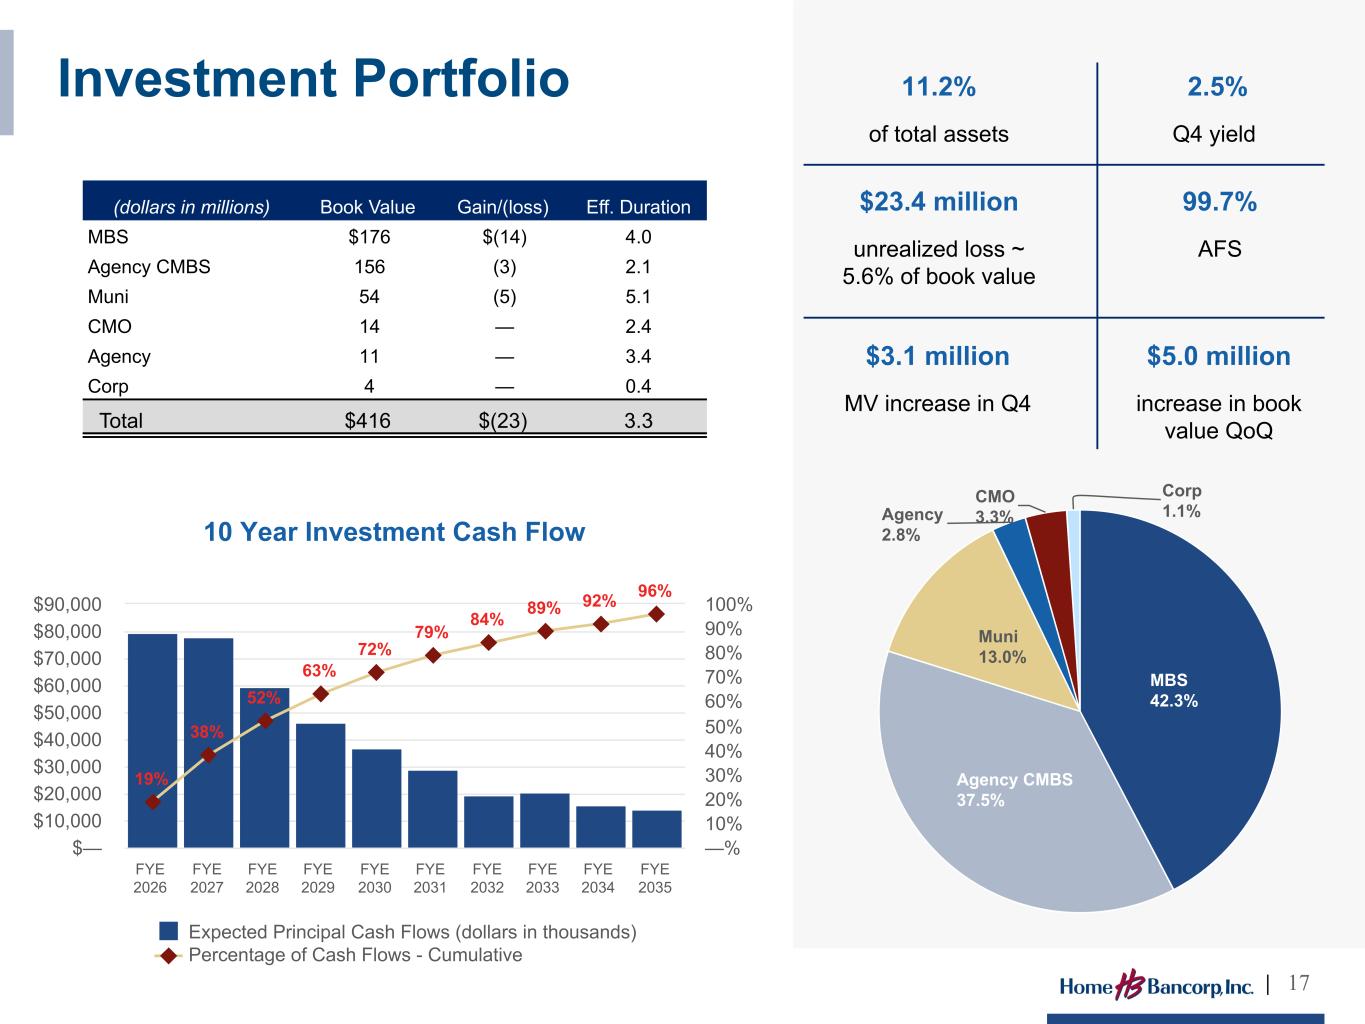
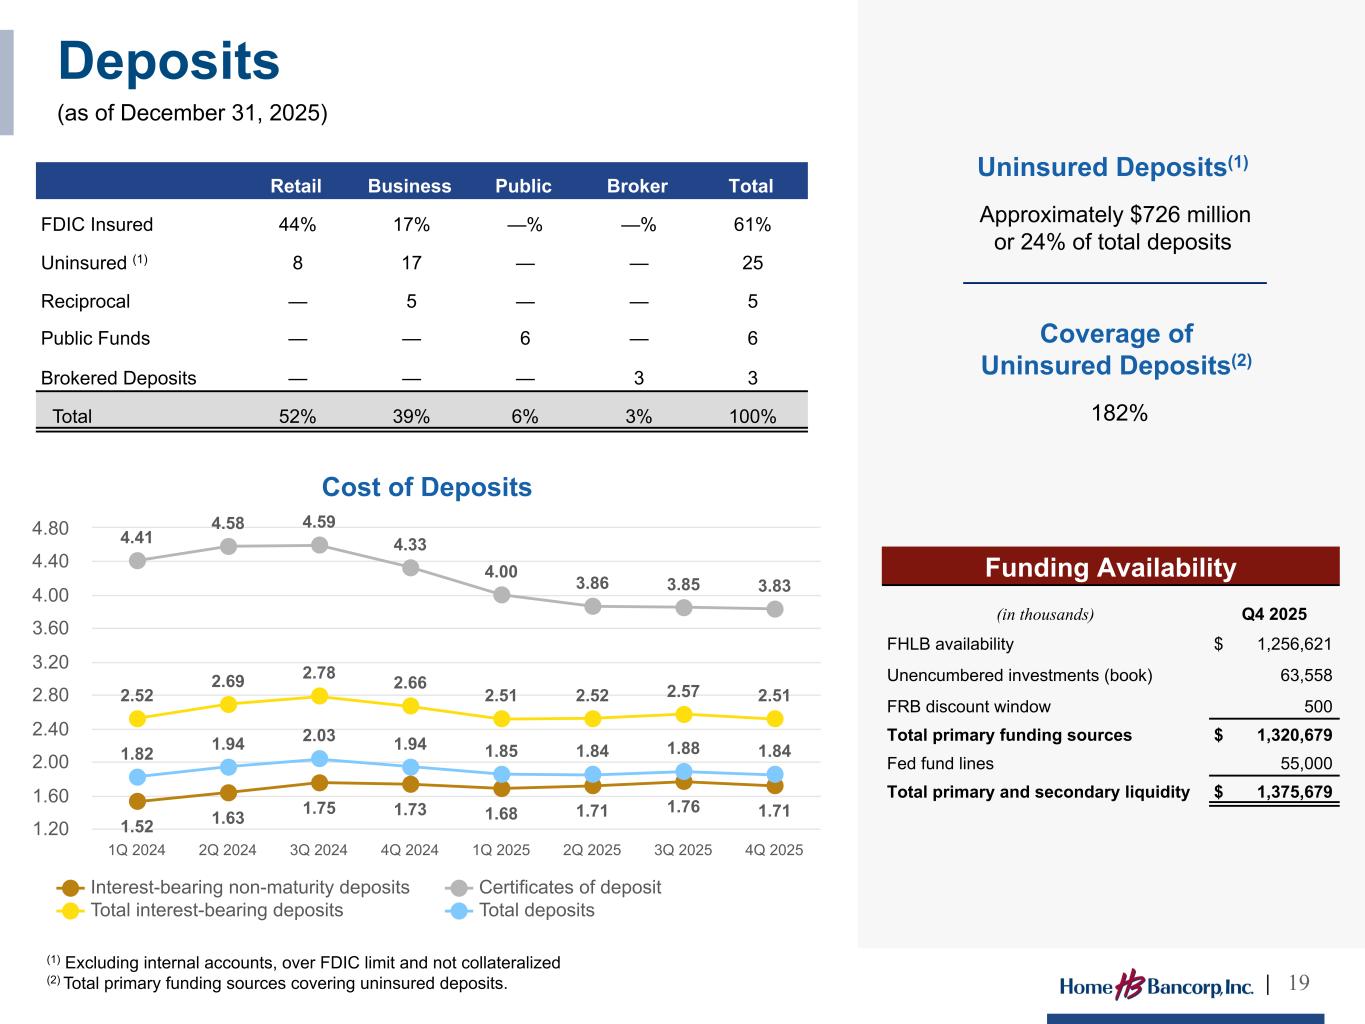
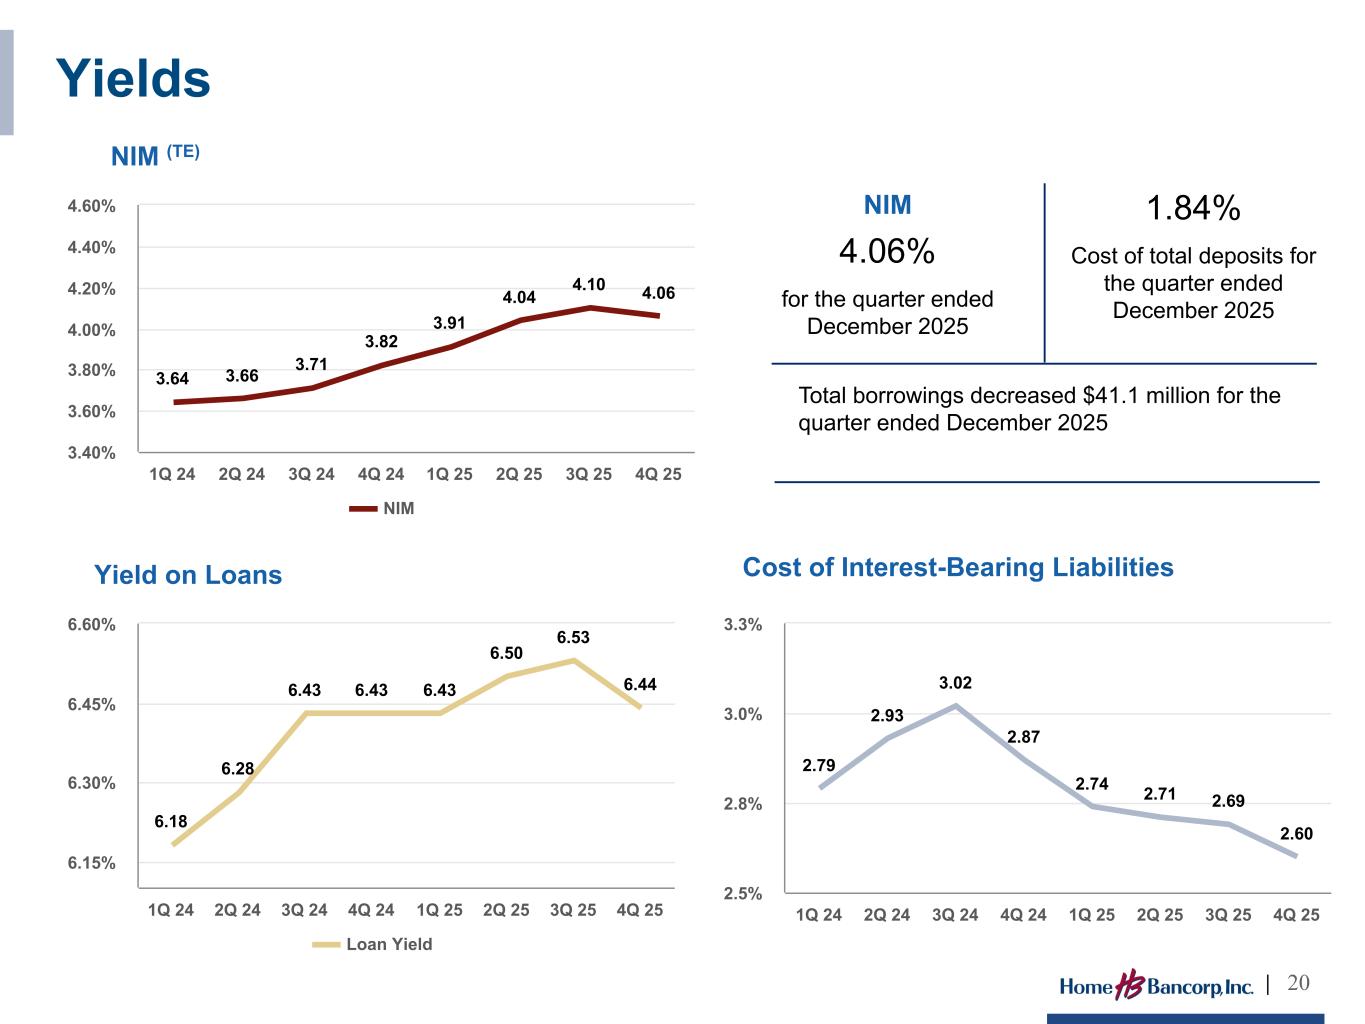
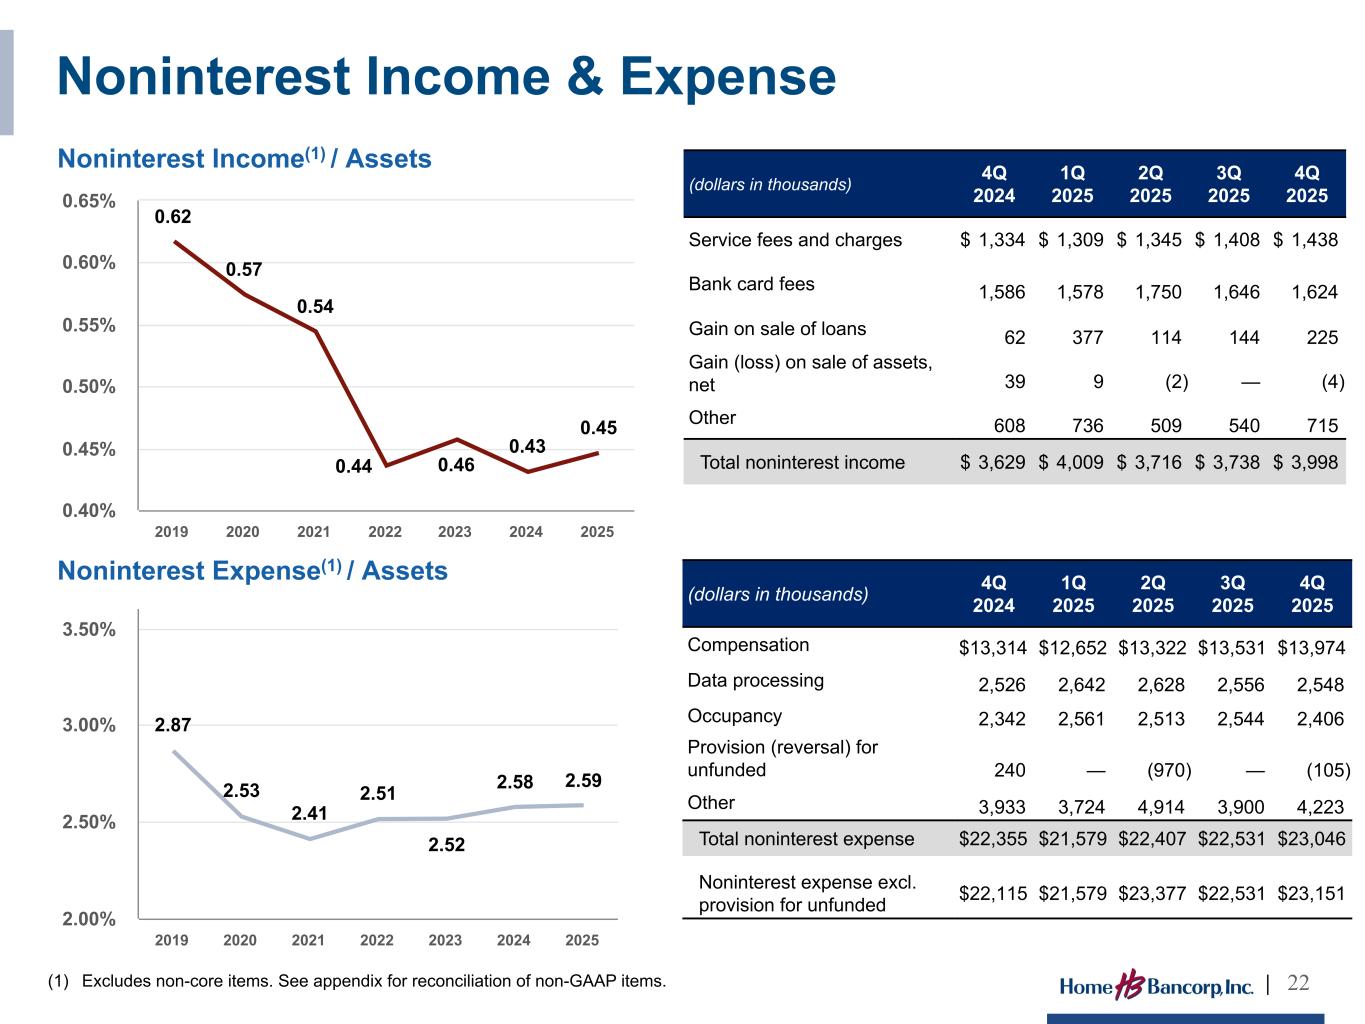
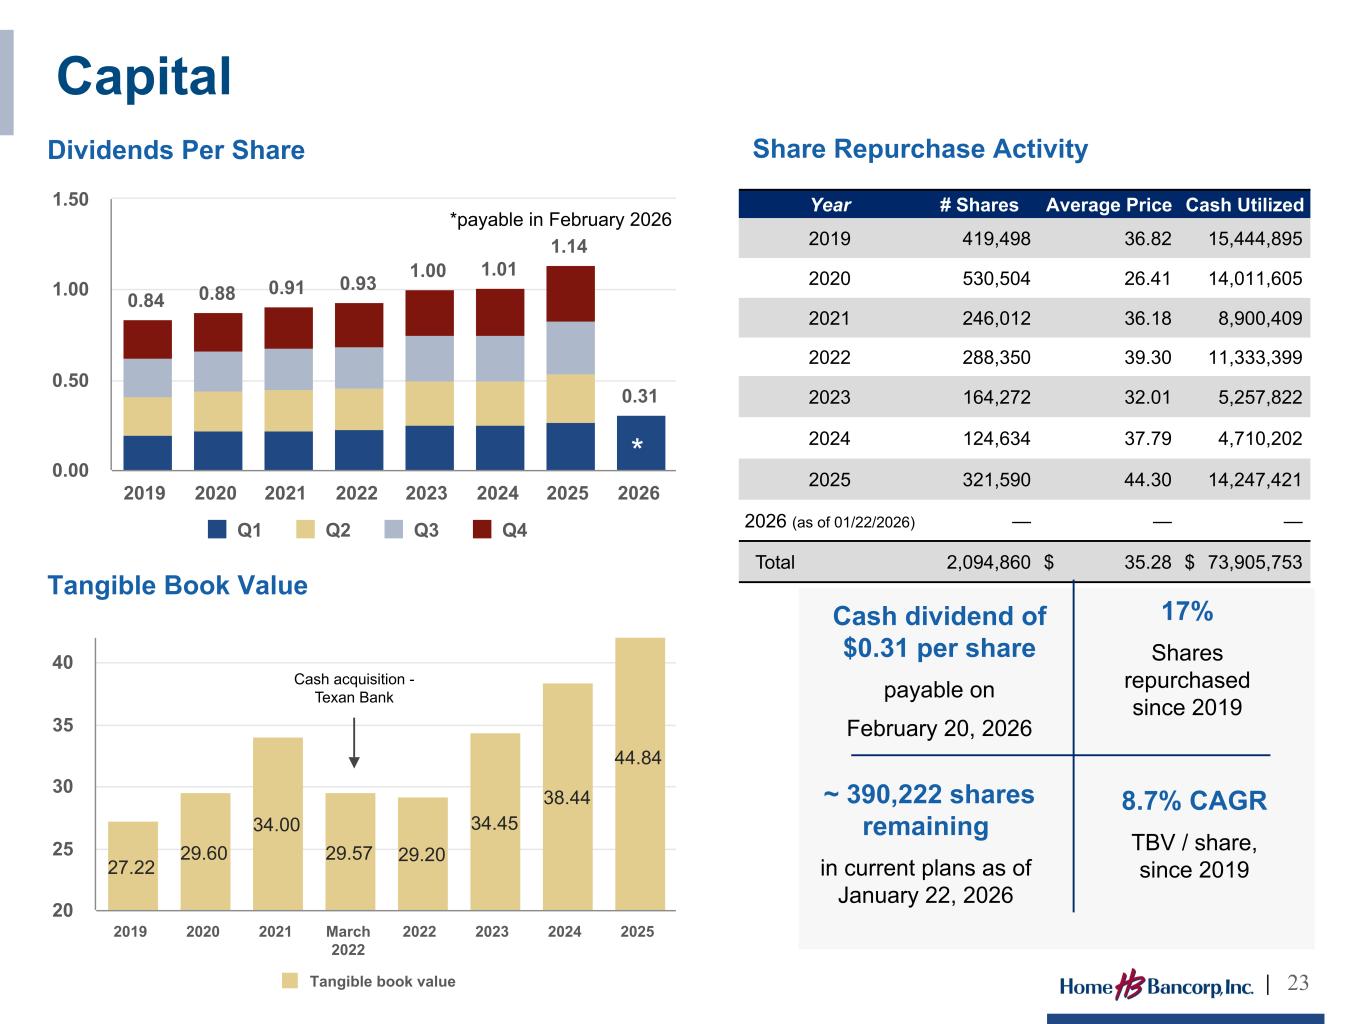
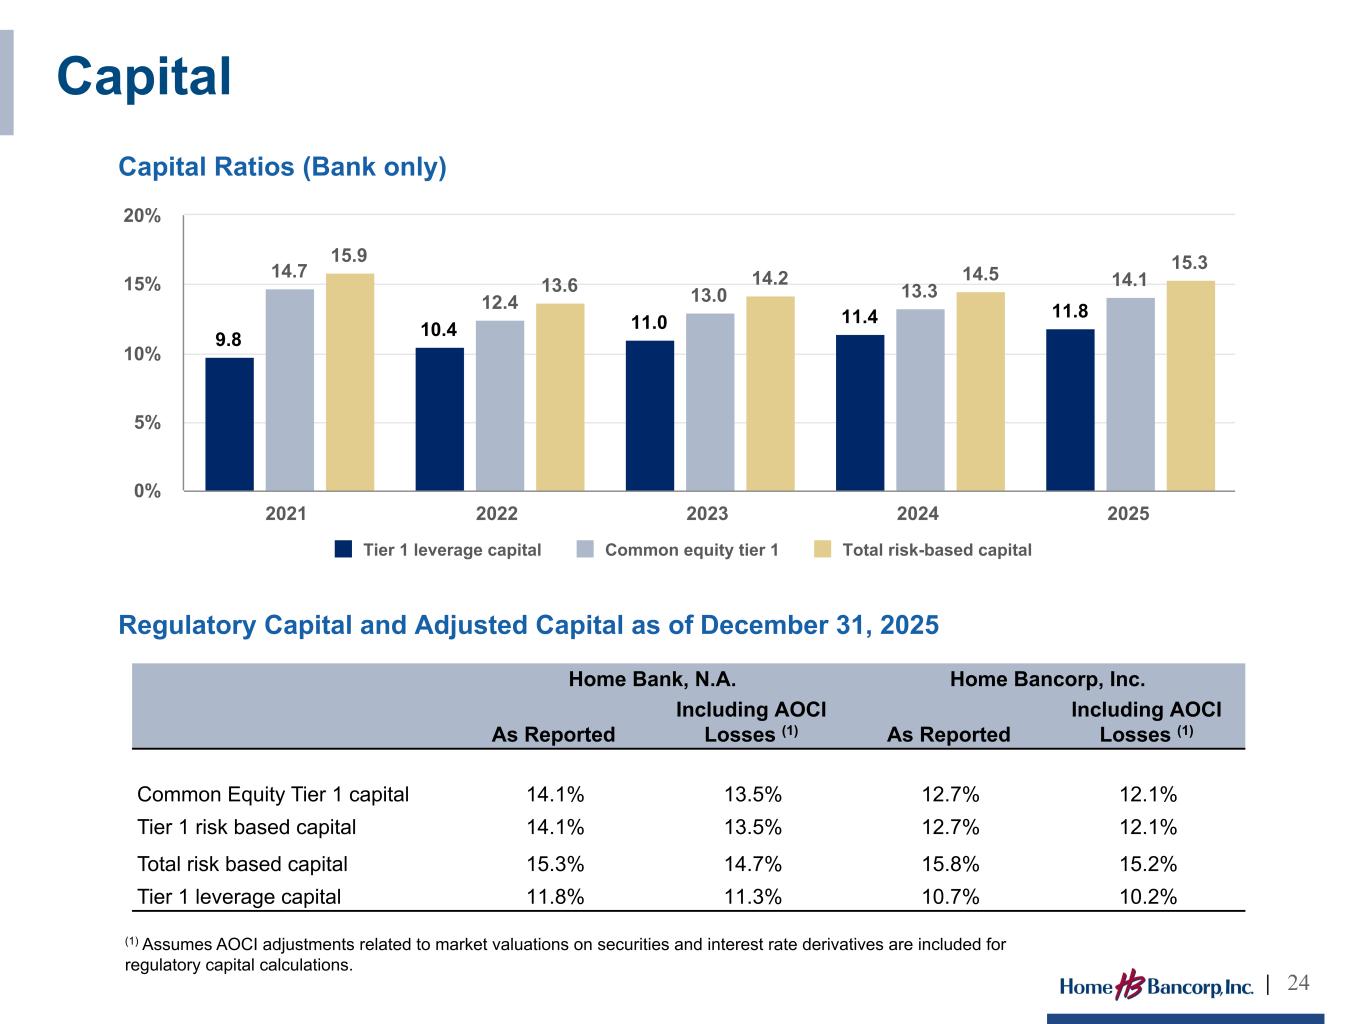
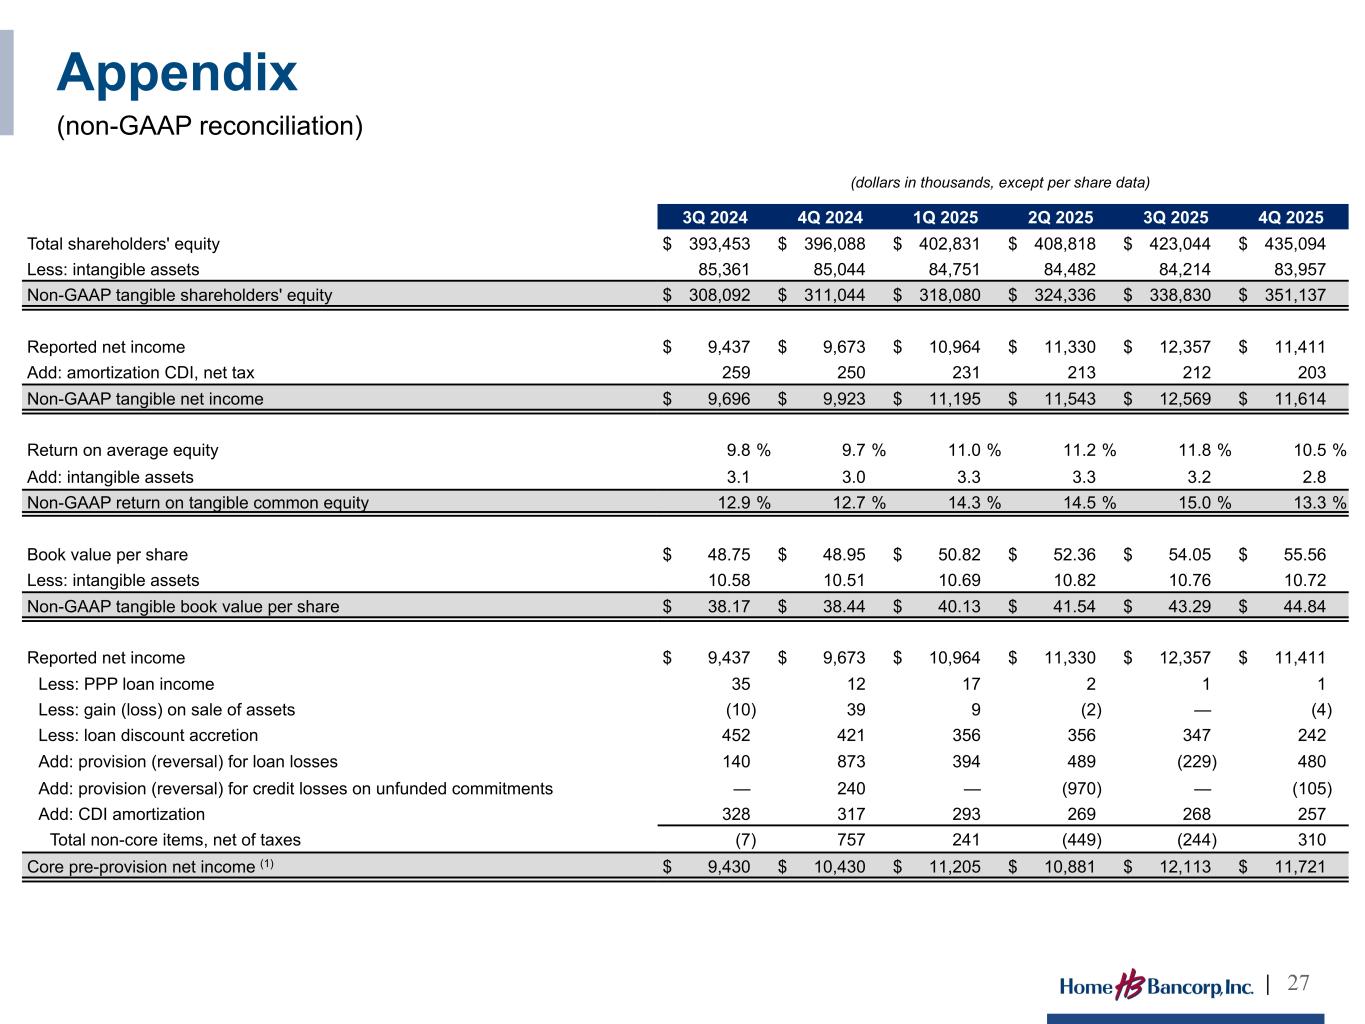
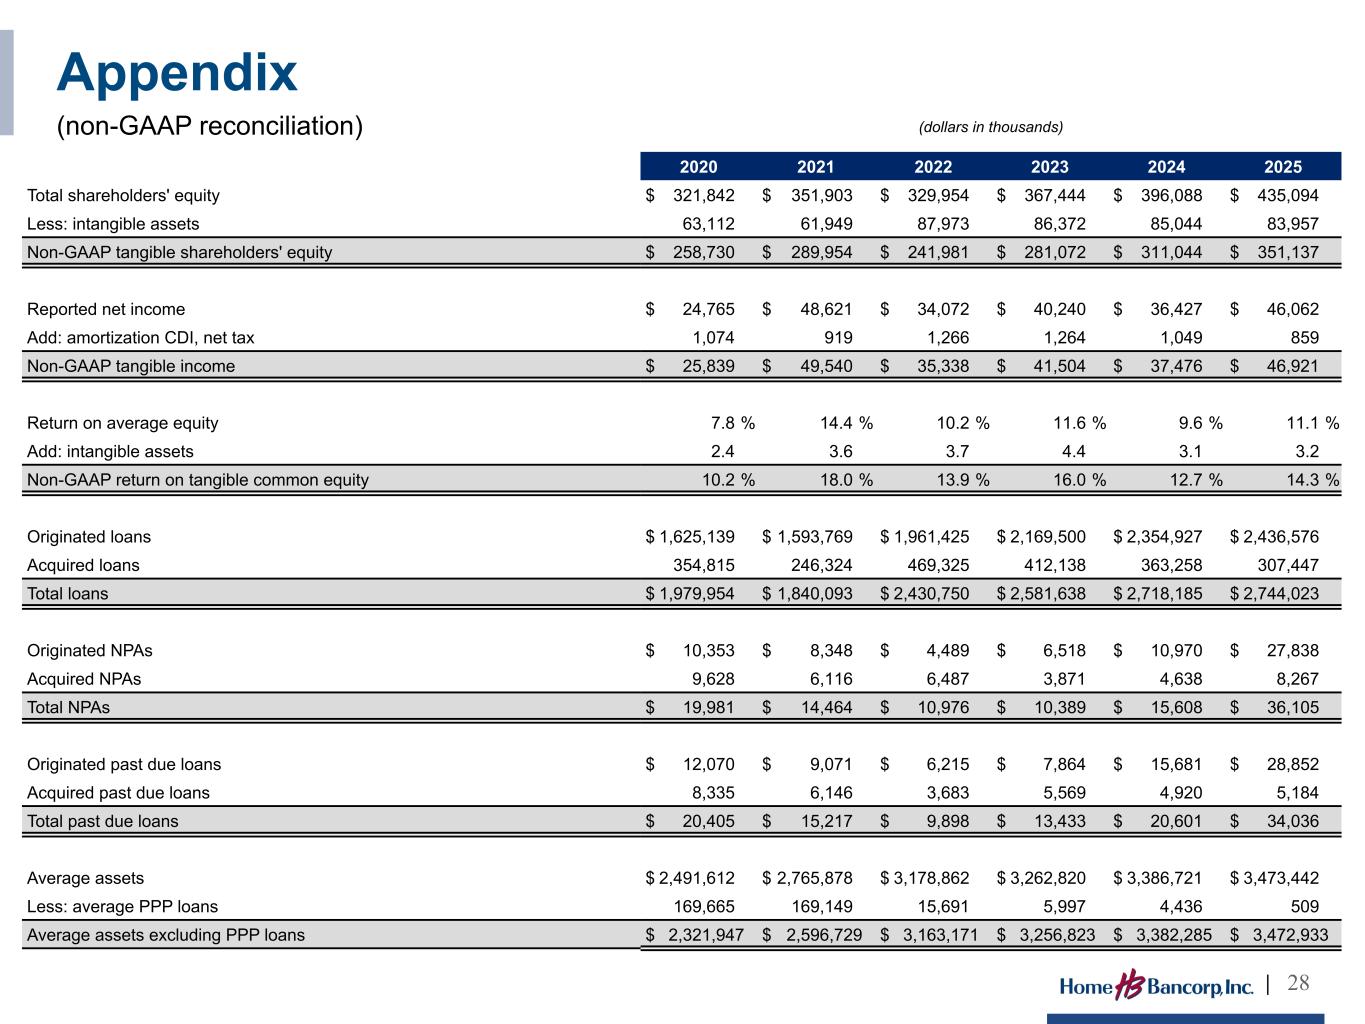
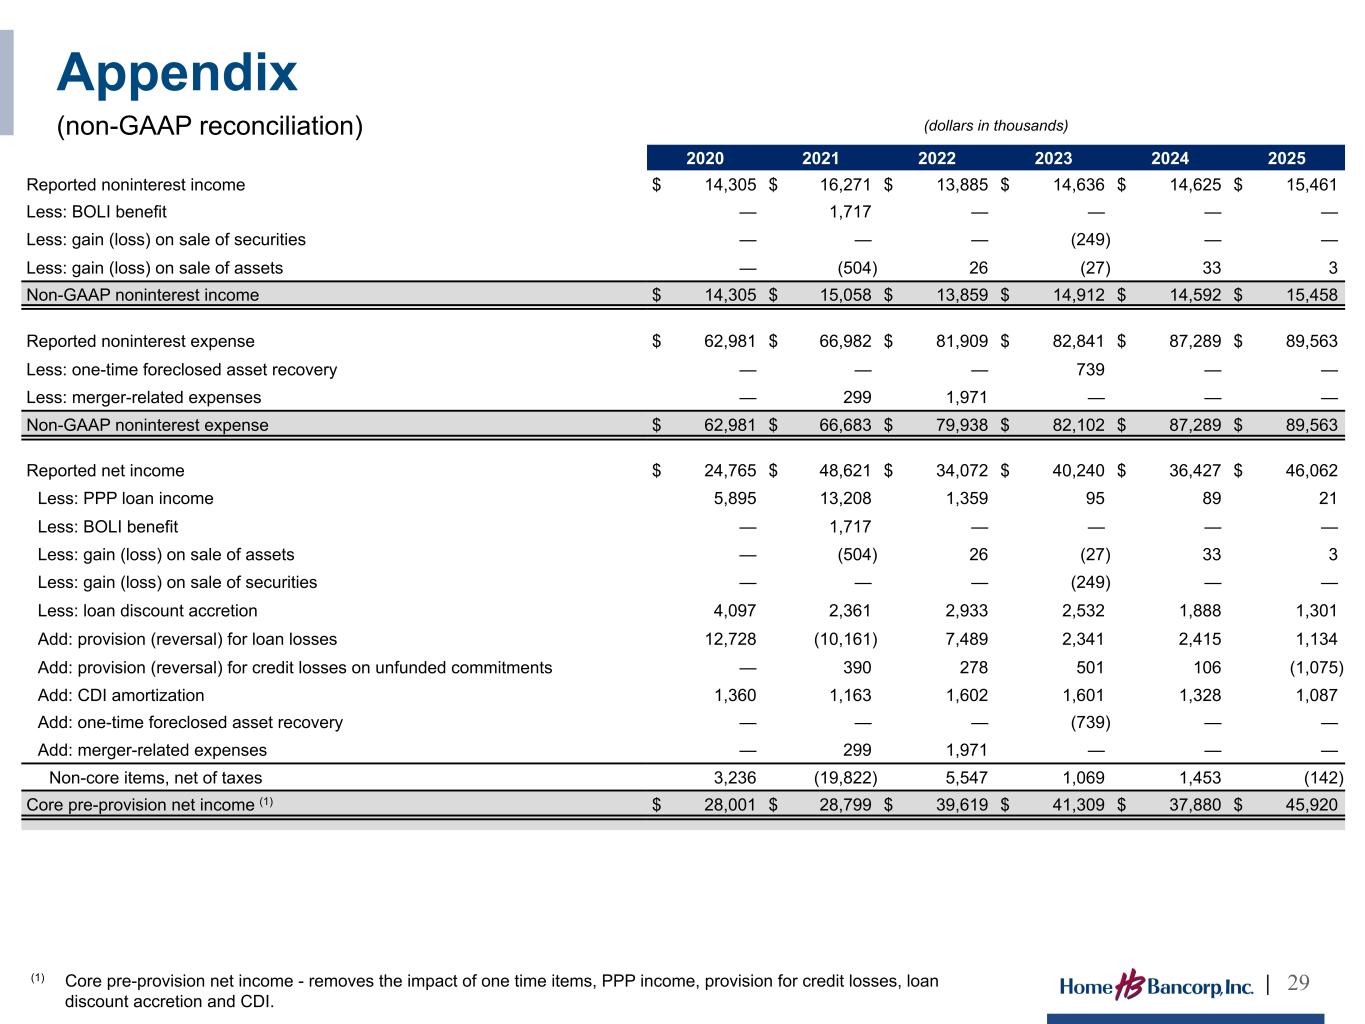
Thanks, John. Slide 5 in our investment presentation has a summary of the last six quarters. As John mentioned, fourth quarter net income totaled $11.4 million, an 8% decrease from the prior quarter, but a 21% increase from a year ago. The decline in net income was primarily due to an increase in provision expense related to loan growth during the quarter. Net interest income was stable when compared to third quarter, decreasing $58,000, while NIM decreased four basis points to 4.06%. Year-over-year, 2025 NIM increased 32 basis points to 4.03%, while ROA increased 25 basis points to 1.33%. Yield on loans decreased nine basis points quarter-over-quarter due to repricing of variable rate loans after the three Fed rate cuts in September. The contractual rate on new loan originations during the quarter was 7%. Despite recent rate cuts, our yield and interest-earning assets increased 14 basis points to 5.88% in 2025. Slide 14 and 17 provide additional details of cash flows from our loan and investment securities portfolio that should support NAMM expansion in 2026. Excluding floating rate loans repricing in the next three months, 41% of loans with a a blended rate of 5.7% are expected to reprice or refinance over the next three years. Over that same time period, half of our investment portfolio is expected to mature with a roll-off yield of 2.56%, which is well below current available yields. Slides 15 and 16 of our investor presentation provide some additional detail on credit. We had $165,000 in net charge off in the fourth quarter and $908,000 of net charge-offs in 2025, which was only three basis points of total loans and $128,000 less than 2024. Fourth quarter non-performing assets increased $5.2 million to $36.1 million or 1.03% of total assets. The increase was primarily due to the downgrade of two relationships and partially offset by paydowns the largest was a 4.1 million relationship with two separate townhome development loans in houston we feel that between the loan values on these properties and the guarantor strength there will be no material losses on this relationship we recorded a 480 000 provision expense related to loan growth during the quarter which was an increase of 709 000 from the prior quarter. We feel very confident in reserves as our allowance for loan loss ratio was stable from the third quarter at 1.21%. Average deposits increased by $58 million in the fourth quarter and by $187 million or 7% in 2025. Average non-interest bearing deposits, which represent 27% of total deposits, increased by $3 million in the fourth quarter and $40 million in 2025. 2025's deposit growth helped us reduce more expensive FHLB advances by $173 million to just $3 million at the end of the fourth quarter. The cost of interest-bearing deposits decreased six basis points in the fourth quarter and decreased 15 basis points since the fourth quarter of 2024. Our overall cost of deposits in the fourth quarter was an attractive 1.84%, and we expect additional reductions in the first quarter as recent Fed rate cuts are reflected in our deposit pricing. Slide 22 of the additional details on non-interest income and expenses. Non-interest income was four million dollars, which was slightly above fourth quarter expectations of 3.6 to 3.8 million. Going forward, we expect non-interest income to increase to between 3.8 and 4 million over the next several quarters. Non-interest expenses increased by $515,000 to $23 million and was in line with expectations. Non-interest expenses are expected to be between $22.5 and $23 million in the first quarter and then increased to between $23.3 and $23.7 million from there as annual raises take effect and new projects kick off. Slides 23 and 24 summarize the impact our capital management strategy has had on Home Bank. Since 2019, we grew per share tangible book value adjusted for AOCI at a 9.6% annualized rate. Over that same time period, we also increased EPS at 11.5% annualized growth rate. We've increased our quarterly dividends per share by 55% to $0.31 per share and repurchased 17% of our shares. We've done this while maintaining robust capital ratios.
Operator
This positions us to be successful in varying economic environments and to take advantage of any opportunities as they arise with that operator please open the line for q a thank you we will now begin the question and answer session to ask a question you may press star then one on your touchtone phone if you are using a speakerphone please pick up your handset before pressing the keys to withdraw your question please press star then two at this time we will I'll pause momentarily to assemble the roster. The first question comes from Fetty Strickland at Hothday Group. Please go ahead.
Hey, good morning, John. Good morning, Fetty. I just wanted to start on the credit side. You know, I hear you on the limited loss history here and the fact that, you know, chart-offs really haven't been that high the last couple quarters or for a while here. But when do you think we might see a shift in the trajectory of the classifieds and MPAs since you've worked through some of these credits?
Yeah, you know, it's disheartening a little bit that sometimes it takes a little bit longer, especially those credits in Louisiana and Mississippi. Texas credits typically move a little bit faster, finding a foreclosure date there is usually about 60 days or less. So we are working through a lot of these. A couple of the newer ones we had were not on our radar and then they just kind of popped up a little bit. So we do believe that the two subdivision properties in Texas, we should be getting back out of foreclosure or they should be sold by February 3rd. We think there's a lot of equity still in that property, very good locations. We have another facility in Texas that the tenant moved out and the landlord is looking to sell the property. He has some interested parties, just hasn't gotten there yet. So, he's actually waiting to file some lawsuits to be able to give back rent that the tenant had, and we'll see about that, but for the most part, it's a good facility that he should not have trouble selling, but once again, it just takes a little bit of time. So there are a lot of one-off circumstances, we don't see this as an economic driven downturn. We just see different scenarios where people aren't able to maintain the rental property or in the case of the two subdivisions, the person never started the development of those subdivisions.
One of the properties that John was talking about in February, that's about $5.5 million that once again will either be paid off, refinanced out, or we'll foreclose on and move to sale We could see NPAs come down by $5.5 million if nothing else comes on, is that a fair assumption?
We hope so. We think the properties, if we do take them back, should be able to sell relatively quickly. It does take a little bit of time in Texas to get permits and things of that nature. That would be the only thing that would slow it up, we think.
In shifting here to the loan pipeline, does the makeup look any meaningfully different from, you know, what's on the books today? Or I guess, in other words, do you expect any sort of longer-term shift in the portfolio? I know in the past you talked about more C&I.
Well, you know, all of 25, we had some payoffs. First and second quarter, they weren't as large as they were in the third quarter. But we did have payoffs and paydowns throughout our portfolio. So I think it's just maybe because of higher rates or people selling their businesses for profits and such and the loans get paid off. But we didn't have much of that at all, a little bit, but not much in fourth quarter. We're thinking hopefully we have less of that in 2026. So the loan growth is there if we don't have the payoffs.
And just the last question, just an update on what you're hearing from customers who are at different parts of the footprint, you know, how are things new in New Orleans versus Houston, just curious where you might see a little bit more versus a little bit less growth incrementally.
We're not hearing anything negative in any of our markets, especially with rates coming down, yield curve coming down a little bit. So I think it's probably leaning a little more towards the positive side. Obviously the national scene is always a concern, what happens with interest rates, what happens with the economy and such. But for the most part, we have not heard any negative comments.
All right. Thanks for taking my questions.
Operator
Thank you. The next question comes from Joe Yanchunis at Raymond James. Please go ahead.
Morning, gentlemen. Morning, Joe. So I was hoping you could talk a little about the SBA business as we entered in 2026. Yeah. As it currently stands, do you think the business will be a driver of growth, or will it take some more investments to really grow the business?
You know, that's a great question. We got into the SBA business after the Texan bank acquisition, and we kind of have been slow to develop it, but as rates went up, the requests were much smaller and few and far between. So, we do anticipate that with the lower interest rates, that should pick up. I don't think we're low enough yet where it's going to be tremendous, but it should be much better than it has been the last two years.
Got it. And just quick clarification, all my questions are great questions. So, capital levels continue to build. You throttle down, you know, the buyback, you know, with current levels where the stock price is. You know, would you characterize M&A as one of the top capital deployment priorities? And if that's the case, you know, can you talk about how the pace of conversations changed in recent months?
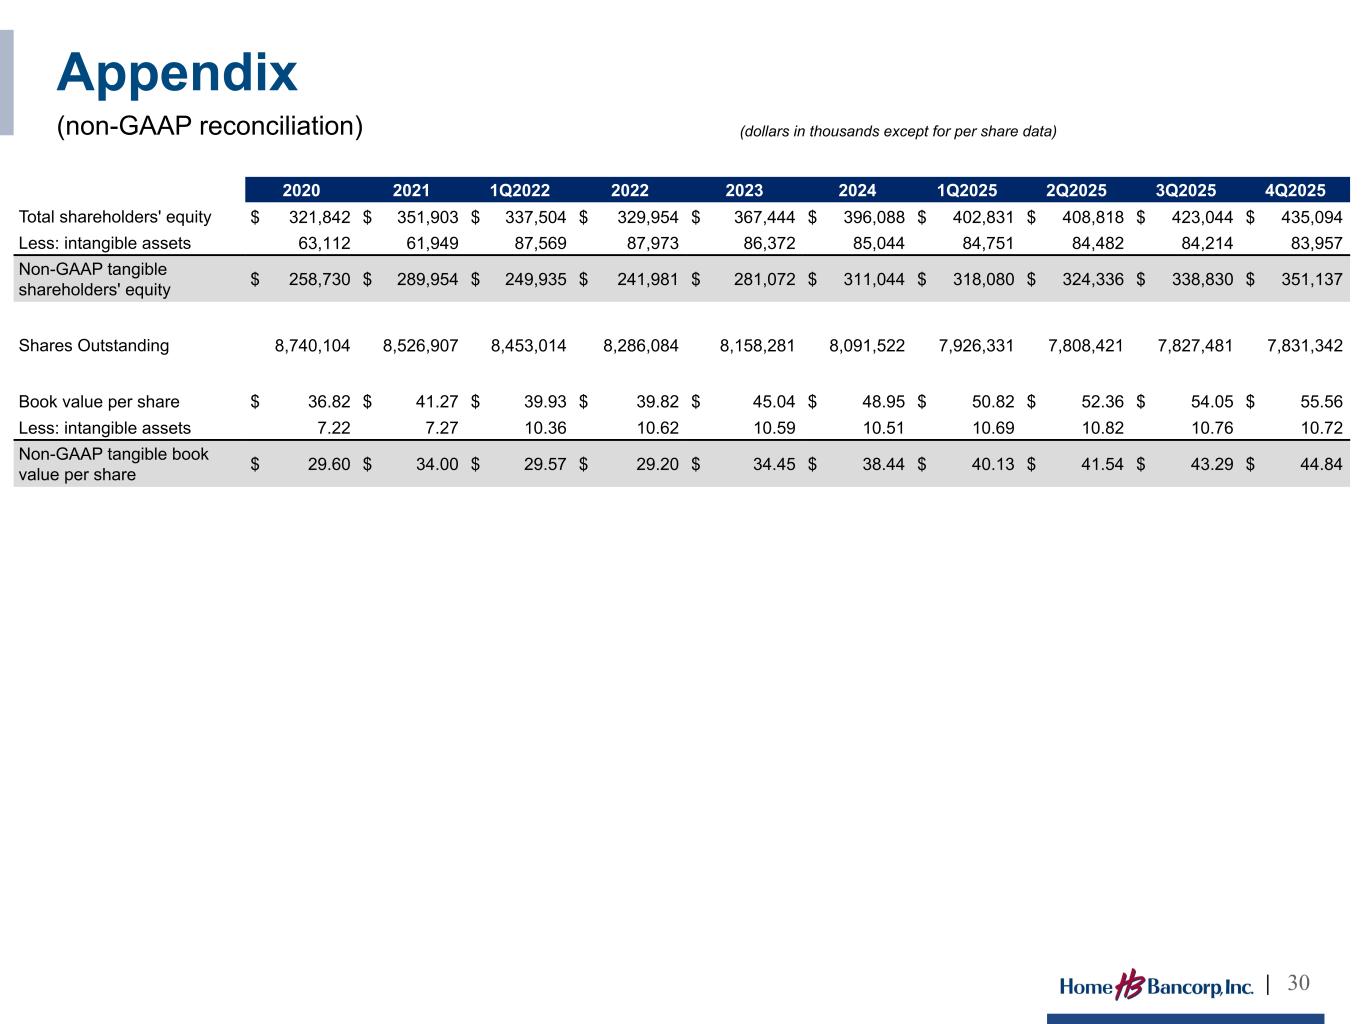
Well, a couple of important factors, I think. David and I have been speaking to people, opportunities that have been out there for the last three years, of course, with the high interest rates and some of the balance sheets being a little upside down, it was not very attractive. The other important component there was we did not have a commodity that we thought we could use, so we looked at smaller deals that we could pay cash for. So now that our stock price is getting closer to 140 of tangible or so, we feel as though we have the power to go out and maybe look for a little bit larger banks that we feel very comfortable with. So we're very optimistic about 2026 M&A.
And what would a larger deal look like? Just in terms of size or, you know, if you want to talk some geography as well.
I mean, we're probably not looking at anything over a billion and a half, I mean, half our size or less.
I appreciate that. That kind of last one for me here, you know, in the back half of 25, you purchased nearly $20 million of securities. Now, how do you think about the size of the bond portfolio as you move throughout 26?
I think it's going to be relatively in the same percentage of assets to 11 to 12%. We expect loan growth, we expect our balance sheet to increase a little bit. So I expect the investment portfolio to increase on a par basis by about 15 to $20 million. And then whatever happens on AOCI as it comes back.
Well, thanks for having me questions. There you go.
Operator
Thank you. Again, if you have a question, please press star, then one. The next question comes from Steven Scalton at Piper Sandler. Please go ahead.
Hey, good morning, guys. I appreciate the time. I'm curious, you know, John, I heard you say you feel pretty good about that team you have in Texas from 2013. Sorry, 2023. Do you feel like there's opportunities with all the M&A we've seen in that environment to continue to add to that team?
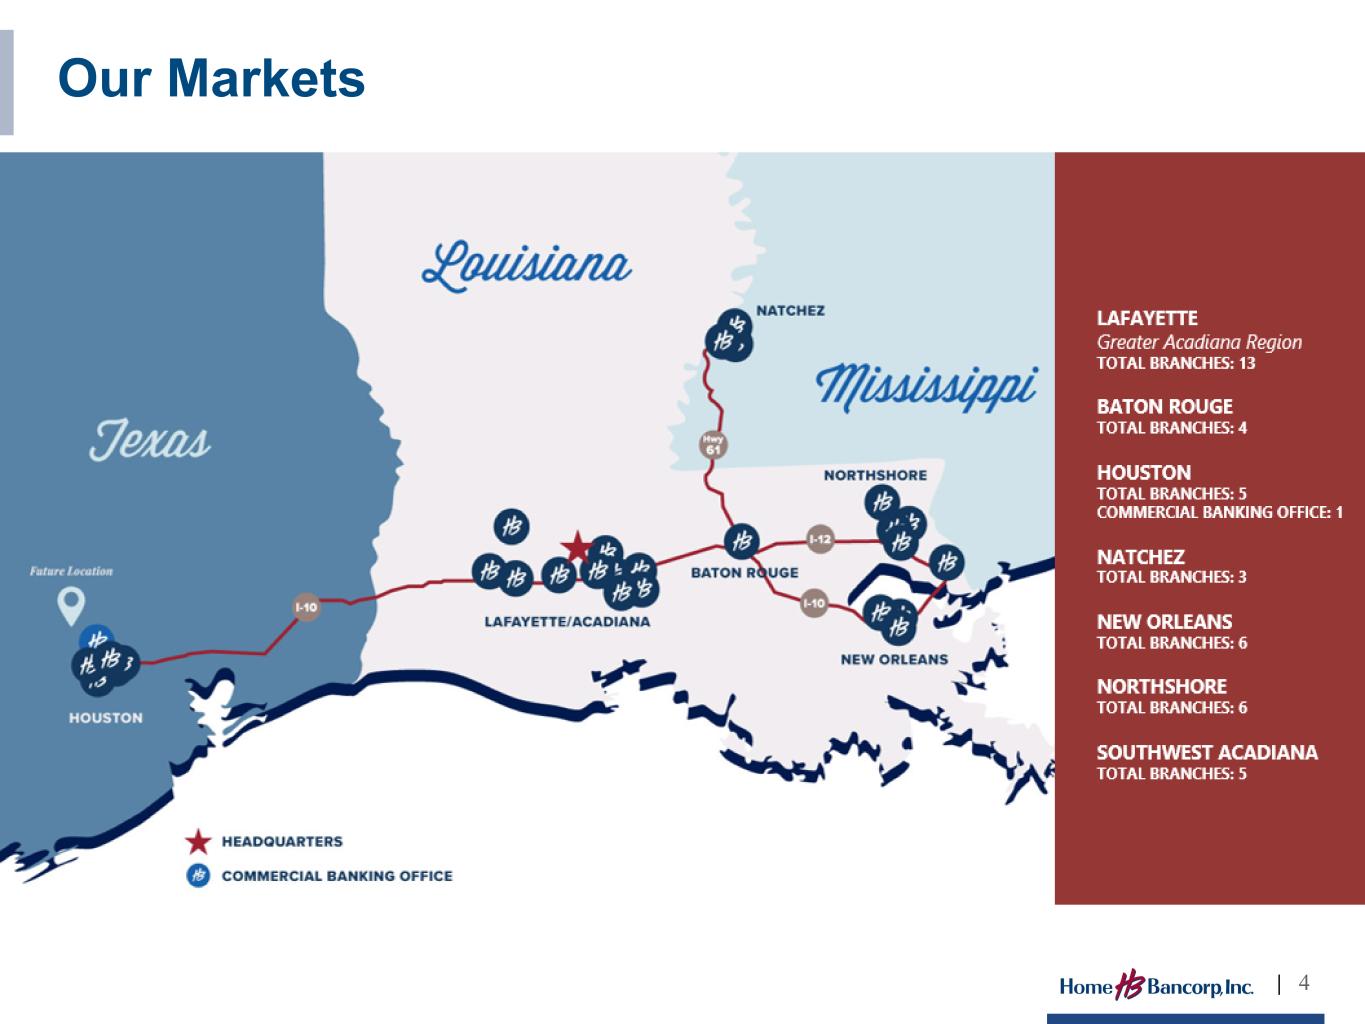
Or is there, you know, kind of plenty of capacity there now to grow at the pace you want to Well, we never lost anybody in the Texan acquisition, and we added about three other people to that. And then we did a pullout two years ago, I guess it is now, of a three person team, actually a four person team with three relationship managers. So that's where we're building a new branch in Northwest Houston, and that's going to give them full branch capabilities. It's been very difficult as a loan production office for the last two years for them to grow as much, especially on the deposit side. So we're very excited about that team and hope to continue to grow in that market. Absolutely.
Okay. Got it. And then when you think about kind of overall loan growth capacity for the franchise as we look at 26, is kind of mid single digits the right way to think about it or do you have aspirations for more given what you're seeing in the Houston MFA?
I think the only thing that's going to push it past the single digits is potentially lower interest rates. That may spur the economy a little bit more. I don't know that we're going to see that until maybe mid-year or second half of the It's anybody's guess, right, where interest rates go, but it looks like the low end is staying up a little bit, so potentially it may be better in the second half of the year than the first half of the year. But I still think, you know, based upon the pipeline that we had in fourth quarter, I think first half of the year is still going to be mid single digits.
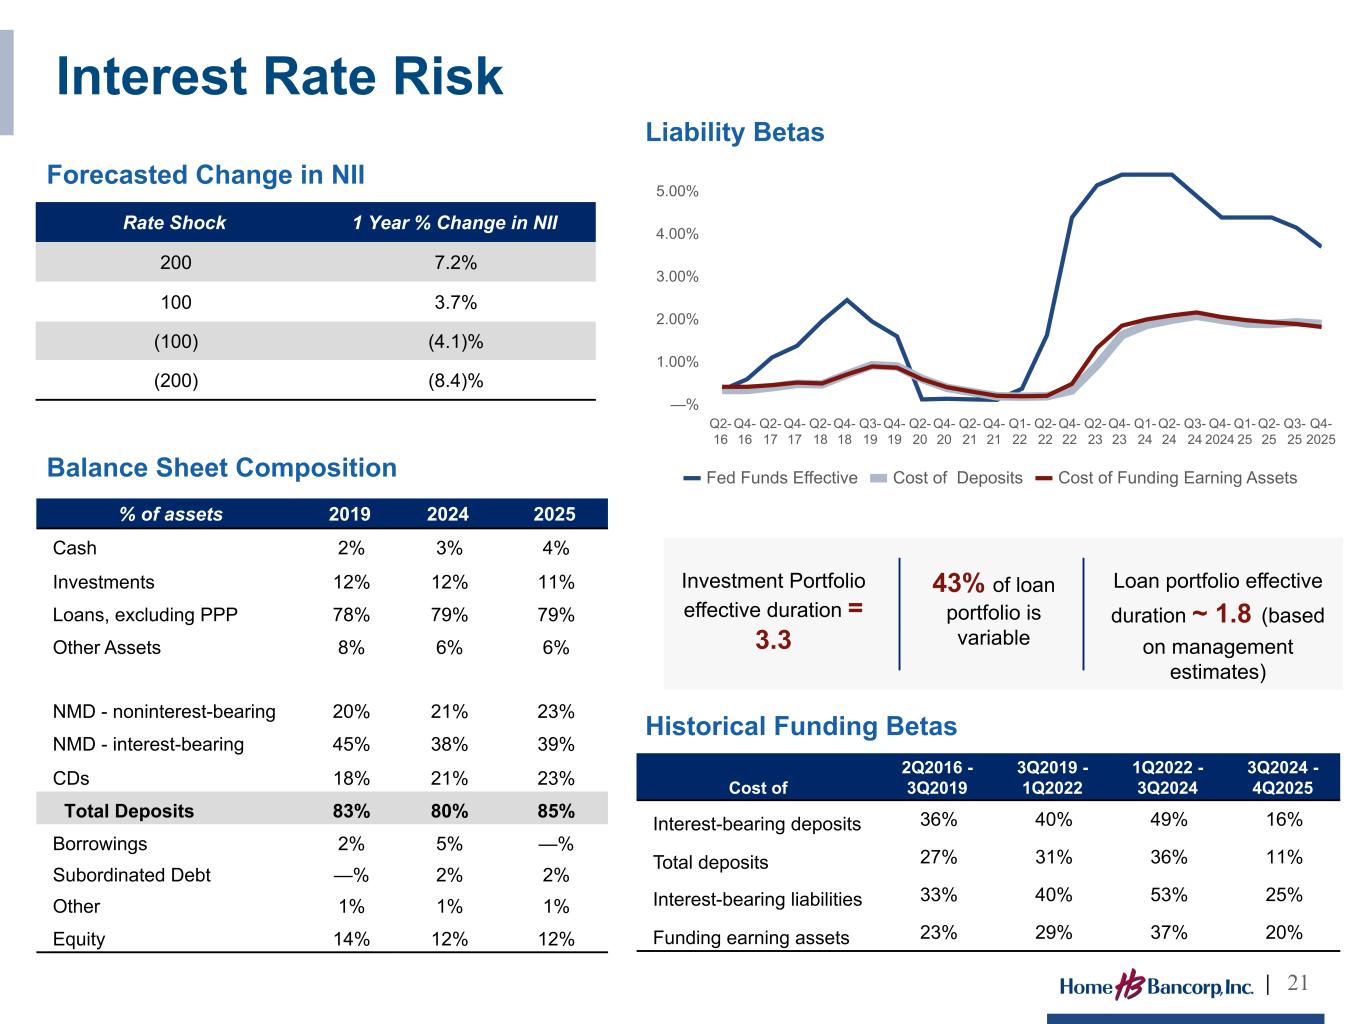
Okay, great. And then just maybe last thing for me, kind of thinking about the trajectory, the NIM, and then David, I heard you obviously say you think there's some expansion opportunities there. I guess kind of two parts of that. What do you think the scale of that central upside could be. And then two, can you kind of help me reconcile, you know, the obviously on page was at 21 of your presentation, what would show is kind of a liability sensitive, I mean, excuse me, like an asset sensitive appearance and the balance sheet versus what, you know, what we've kind of seen in practice and kind of how I think about your balance sheet and the upside from lower rates.
So we had a rate rate cut since mid-September. And so that impacts the loan portfolio immediately and you saw that as a nine-day split decline in loan yields. We have a very short deposit portfolio, but it does take a couple months to realize the impact of rate cuts through CD repricing. Our NIM in December was $4.08 and that's due to, you know, seeing our deposit cuts actually playing out on the income statement and you're going to see more of that come through in Q1 as a lot of the CDs are repricing. So we took the impact of the rate cuts and that reduced our loan portfolio by nine basis points. We've been originating in the seven percent range and we have roll off yields, a pretty healthy roll off yield. So in the base case scenario, you know, So we see NIM ticking back up to 4.1% and 4.15% throughout the year. So that answers one of your questions, I believe. As far as rate sensitivity goes, change in net interest income, you got to remember that this projection is based off of the next 12 months. It's not saying, oh, my NIM was 405 and then down 100 basis points, I'm going to lose 4.1% of my NIM. It's my NIM is projected to increase in the base case to 4.1, 4.15. In the base case, not from the 406 we just reported, it's a 4.1% or a live asset sensitive bank from that base case. And so even if we go down 100 basis points in yields, we still think that our NIM is going to be relatively stable to what we just reported.
The biggest headwinds we have right now in regards to NIMM are some outliers on the deposit side, throwing some really high CD rates out there. So we're having to compete a little bit for that. That hasn't been the issue pretty much. A lot of banks were all in the same general vicinity rate wise, but there are some outliers in the four and a quarter range. Yeah.
But generally, I guess this is kind of a shock scenario, but it sounds like you have a lag that's actually beneficial as those CDs repriced over time from each sub-twin cost. It theoretically could impact them negatively, you know, for the first 30 days, but then probably, you know, there's some strength after the fact as deposits repriced. Is that maybe the best way to think about it?
Yes, that is, yes. But I'm glad John did bring that up. We are seeing a much wider range of deposit pricing in some of our markets than we had over the last, I guess, probably year and a half with the spread between the high and the average.
Yeah, makes sense. People are seeing loans out there that they want to fund up. So, yeah, I would imagine it all gets a little bit more competitive. But to your point, hopefully that means we got better economic strength. So we shall see. I appreciate all the color, guys.
Operator
Thank you. this concludes our question and answer session i would like to turn the conference back over to john for any closing remarks thank you once again thank you all for joining us today we look forward to speaking to many of you in the coming days and weeks and thank you for your interest in home bank board have a great day the conference has now concluded thank you for attending today's presentation, you may now disconnect.