
HON 8-K
Honeywell International Inc (HON)
8-K
2025-12-22
For: 2025-12-22
View Original
Added on
April 10, 2026
UNITED STATES
SECURITIES AND EXCHANGE COMMISSION
WASHINGTON, D.C. 20549
Form 8-K
CURRENT REPORT
PURSUANT TO SECTION 13 OR 15(D) OF THE SECURITIES EXCHANGE ACT OF 1934
DATE OF REPORT – December 22, 2025
(Date of earliest event reported)
(Exact name of Registrant as specified in its Charter)
| (State or other jurisdiction of incorporation) | (Commission File Number) | (I.R.S. Employer Identification Number) | ||||||
......(Address of principal executive offices).................................................(Zip Code)
Registrant’s telephone number, including area code: (704 ) 627-6200
Check the appropriate box below if the Form 8-K filing is intended to simultaneously satisfy the filing obligation of the registrant under any of the following provisions:
| Written communications pursuant to Rule 425 under the Securities Act (17 CFR 230.425) | |||||
| Soliciting material pursuant to Rule 14a-12 under the Exchange Act (17 CFR 240.14a-12) | |||||
| Pre-commencement communications pursuant to Rule 14d-2(b) under the Exchange Act (17 CFR 240.14d-2(b)) | |||||
| Pre-commencement communications pursuant to Rule 13e-4(c) under the Exchange Act (17 CFR 240.13e-4(c)) | |||||
Securities registered pursuant to Section 12(b) of the Act:
| Title of each class | Trading Symbol(s) | Name of each exchange on which registered | ||||||||||||
Indicate by check mark whether the registrant is an emerging growth company as defined in Rule 405 of the Securities Act of 1933 (§230.405 of this chapter) or Rule 12b-2 of the Securities Exchange Act of 1934 (§240.12b-2 of this chapter).
Emerging Growth Company ☐
If an emerging growth company, indicate by check mark if the registrant has elected not to use the extended transition period for complying with any new or revised financial accounting standards provided pursuant to Section 13(a) of the Exchange Act. ☐
Item 2.02 Results of Operations and Financial Condition
As previously announced on October 22, 2025, beginning in the first quarter of 2026, Honeywell International Inc. (the “Company”) intends to realign its business units comprising its Industrial Automation and Energy and Sustainability Solutions reportable business segments. This realignment will result in the formation of a new reportable business segment, Process Automation and Technology, and also result in a new composition of the Industrial Automation reportable business segment. Process Automation and Technology will include the core process solutions of the Honeywell Process Solutions business, which is currently a part of Industrial Automation, and UOP, which is currently reported in Energy and Sustainability Solutions. As a result, the Company will no longer report results for the Energy and Sustainability Solutions segment (the Advanced Materials business, which was formerly reported in Energy and Sustainability Solutions, was spun off on October 30, 2025). Industrial Automation will continue to include the smart energy, thermal solutions, and process measurement and control businesses, currently included in the Honeywell Process Solutions business, Sensing and Safety Technologies, Warehouse and Workflow Solutions, and Productivity Solutions and Services.
Following the realignment, the Company’s four reportable business segments will be Aerospace Technologies, Building Automation, Process Automation and Technology, and Industrial Automation. Other operations will continue to be presented in Corporate and All Other, which is separately reported but is not a reportable business segment. In addition to the realignment, also beginning in 2026, the Company will report its disaggregation of revenue within its Building Automation, Process Automation and Technology, and Industrial Automation segments based on the business models of Products, Projects, Solutions, and Aftermarket. The Company expects to report its financial performance based on this realignment effective with the first quarter of 2026 and will have no impact on the Company's historical consolidated financial position, results of operations, or cash flows.
Additionally, effective October 30, 2025, the Company completed the spin-off of its Advanced Materials business into an independent, publicly traded company, Solstice Advanced Materials (NASDAQ: SOLS). The Advanced Materials business had historically been part of the Energy and Sustainability Systems reportable segment. In connection with the spin-off, the Advanced Materials business will be reported as discontinued operations effective beginning with the fourth quarter of 2025, and retrospectively for all comparative periods reported. Corporate expenses historically allocated to Advanced Materials and not eligible to be part of discontinued operations are now included in Corporate and All Other. Net Sales, Operating Income, and Operating Cash Flows from discontinued operations for the year ended December 31, 2024, were approximately $3.8 billion, $1.0 billion, and $1.0 billion, respectively.
Attached as Exhibit 99.1 is a supplemental schedule containing unaudited segment information for the three months ended March 31, June 30, and September 30, 2025, three months ended March 31, June 30, September 30, and December 31, 2024, and the years ended December 31, 2024 and 2023, recast on the basis of the proposed realignment of the business segments expected to be effective with the quarter ending March 31, 2026 and the presentation of the Advanced Materials business as discontinued operations beginning with the quarter ended December 31, 2025.
To provide supplemental historical information on a basis consistent with its announced new reporting structure and the spin-off of Advanced Materials, the Company has also furnished in the attached Exhibit 99.1 certain non-GAAP supplemental historical business segment information to conform to the announced new reporting structure and retrospective impacts of the Advanced Materials business which will be reported as discontinued operations.
The supplemental unaudited historical business segment information contained in Exhibit 99.1 does not represent a restatement or reissuance of previously issued financial statements. The information furnished pursuant to this Item 2.02, including Exhibit 99.1, should be read in conjunction with the Company's Annual Report on Form 10-K for the year ended December 31, 2024, and the Company's quarterly reports on Form 10-Q for the quarterly periods ended March 31, 2025, June 30, 2025, and September 30, 2025.
The information furnished pursuant to this Item 2.02, including Exhibit 99.1 in Item 9.01, shall not be deemed "filed" for purposes on Section 18 of the Securities and Exchange Act of 1934, as amended (the "Exchange Act"), or otherwise subject to the liabilities of that Section, and shall not be deemed incorporated by reference into any filing of the Company under the Securities Act of 1933, as amended, or the Exchange Act, except as shall be expressly set forth by specific reference in such filing.
Item 8.01 Other Events
As previously disclosed, on March 1, 2023, Flexjet, LLC (“Flexjet”) brought suit against the Company, alleging breach of the parties’ aircraft engine maintenance service agreement and seeking liquidated damages for delayed engine repairs. Flexjet provides private jet services to customers, and the Company maintains aircraft engine maintenance service contracts with Flexjet.
The Company is providing an update with respect to the previously disclosed Flexjet-related litigation matters. The Company is in ongoing settlement negotiations with Flexjet and the other parties to the litigation matters. Based on negotiations to date, the Company expects to record a one-time charge within its Aerospace Technologies segment in the fourth quarter of 2025 that will reduce GAAP sales (due to contra-revenue accounting) and operating income by approximately $310 million and $370 million, respectively. The Company further expects that any comprehensive settlements will include one-time cash payments to the parties to the Flexjet-related litigation matters totaling approximately $470 million in the aggregate. The foregoing expected financial impacts are subject to change based on the final terms of any such settlements with Flexjet and such other parties, and there can be no assurance that any such settlements will be reached.
Cautionary Statement About Forward-Looking Statements
We describe many of the trends and other factors that drive our business and future results in this Current Report on Form 8-K. Such discussions contain forward-looking statements within the meaning of Section 21E of the Exchange Act, including statements related to the proposed separation of Automation and Aerospace Technologies, the realignment of the Company’s reportable business segments, the accounting impact of any potential settlements of the Flexjet-related litigation matters, and the evaluation of strategic alternatives for the Productivity Solutions and Services and Warehouse and Workflow Solutions businesses. Forward-looking statements are those that address activities, events, or developments that we or our management intend, expect, project, believe, or anticipate will or may occur in the future. They are based on management's assumptions and assessments in light of past experience and trends, current economic and industry conditions, expected future developments, and other relevant factors, many of which are difficult to predict and outside of our control, including the Company’s realignment of its reportable business segments, the Company’s current expectations, estimates, and projections regarding the proposed separation of Automation and Aerospace Technologies, the accounting impact of any potential settlements of the Flexjet-related litigation matters, and the evaluation of strategic alternatives for the Productivity Solutions and Services and Warehouse and Workflow Solutions businesses. They are not guarantees of future performance, and actual results, developments, and business decisions may differ significantly from those envisaged by our forward-looking statements. We do not undertake to update or revise any of our forward-looking statements, except as required by applicable securities law. Our forward-looking statements are also subject to material risks and uncertainties, including ongoing macroeconomic and geopolitical risks, such as changes in or application of trade and tax laws and policies, including the impacts of tariffs and other trade barriers and restrictions, lower GDP growth or recession in the U.S. or globally, supply chain disruptions, capital markets volatility, inflation, and certain regional conflicts, that can affect our performance in both the near- and long-term. In addition, no assurance can be given that any plan, initiative, projection, goal, commitment, expectation, or prospect set forth in this Current Report can or will be achieved. These forward-looking statements should be considered in light of the information included in this Current Report on Form 8-K, including the Exhibits attached hereto, our Form 10-K, and other filings with the SEC. Any forward-looking plans described herein are not final and may be modified or abandoned at any time.
Item 9.01 Financial Statements and Exhibits
(d) Exhibits
The following exhibits are filed as part of this report:
Exhibit # | Description | |||||||
| 99.1 | ||||||||
| 104 | Cover Page Interactive Data File (the cover page XBRL tags are embedded within the Inline XBRL document). | |||||||
SIGNATURE
Pursuant to the requirements of the Securities Exchange Act of 1934, as amended, the Registrant has duly caused this report to be signed on its behalf by the undersigned hereunto duly authorized.
| Date: | December 22, 2025 | HONEYWELL INTERNATIONAL INC. | |||||||||||||||
By: /s/ Su Ping Lu | |||||||||||||||||
| Su Ping Lu | |||||||||||||||||
| Senior Vice President, General Counsel and Corporate Secretary | |||||||||||||||||
Exhibit 99.1
HONEYWELL INTERNATIONAL INC.
(Unaudited)
(Dollars in tables in millions)
SUPPLEMENTAL QUARTERLY SEGMENT INFORMATION
| Three Months Ended | ||||||||||||||||||||||||||
| March 31, 2025 | June 30, 2025 | Sept 30, 2025 | March 31, 2024 | June 30, 2024 | Sept 30, 2024 | Dec 31, 2024 | ||||||||||||||||||||
| Net sales | ||||||||||||||||||||||||||
| Aerospace Technologies | $ | 4,172 | $ | 4,307 | $ | 4,511 | $ | 3,669 | $ | 3,891 | $ | 3,912 | $ | 3,986 | ||||||||||||
| Building Automation | 1,692 | 1,826 | 1,878 | 1,426 | 1,571 | 1,745 | 1,798 | |||||||||||||||||||
| Process Automation and Technology | 1,445 | 1,613 | 1,598 | 1,352 | 1,408 | 1,478 | 1,681 | |||||||||||||||||||
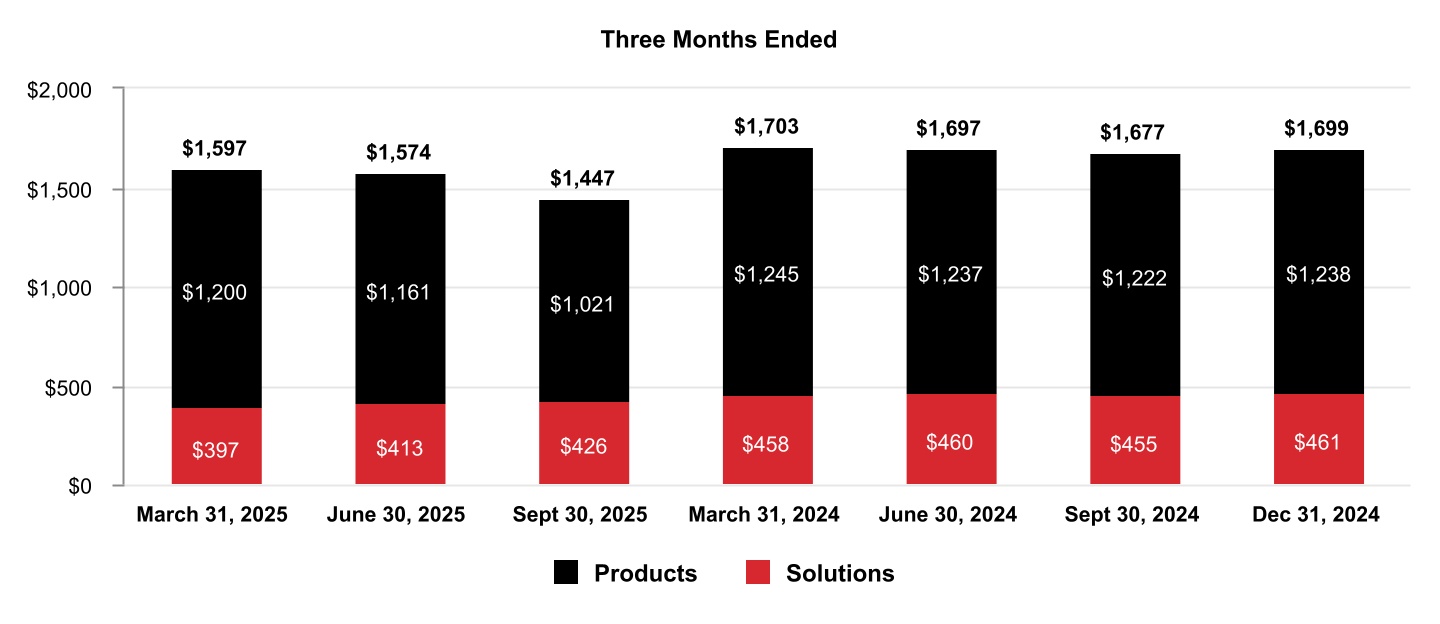
| Industrial Automation | 1,597 | 1,574 | 1,447 | 1,703 | 1,697 | 1,677 | 1,699 | |||||||||||||||||||
| Corporate and All Other | 19 | 2 | 3 | 7 | 5 | 7 | 5 | |||||||||||||||||||
| Total Net sales from continuing operations | $ | 8,925 | $ | 9,322 | $ | 9,437 | $ | 8,157 | $ | 8,572 | $ | 8,819 | $ | 9,169 | ||||||||||||
Total Net sales from discontinued operations1 | $ | 897 | $ | 1,030 | $ | 971 | $ | 948 | $ | 1,005 | $ | 909 | $ | 919 | ||||||||||||
| Segment profit | ||||||||||||||||||||||||||
| Aerospace Technologies | $ | 1,099 | $ | 1,098 | $ | 1,178 | $ | 1,035 | $ | 1,060 | $ | 1,082 | $ | 811 | ||||||||||||
| Building Automation | 440 | 479 | 502 | 350 | 397 | 452 | 482 | |||||||||||||||||||
| Process Automation and Technology | 313 | 386 | 389 | 289 | 346 | 381 | 448 | |||||||||||||||||||
| Industrial Automation | 230 | 256 | 215 | 285 | 270 | 286 | 272 | |||||||||||||||||||
Corporate and All Other2 | (80) | (140) | (157) | (100) | (171) | (162) | (146) | |||||||||||||||||||
| Total segment profit from continuing operations | $ | 2,002 | $ | 2,079 | $ | 2,127 | $ | 1,859 | $ | 1,902 | $ | 2,039 | $ | 1,867 | ||||||||||||
Total segment profit from discontinued operations1 | $ | 256 | $ | 287 | $ | 280 | $ | 235 | $ | 297 | $ | 257 | $ | 243 | ||||||||||||
| Three Months Ended | ||||||||||||||||||||||||||
| March 31, 2025 | June 30, 2025 | Sept 30, 2025 | March 31, 2024 | June 30, 2024 | Sept 30, 2024 | Dec 31, 2024 | ||||||||||||||||||||
| Aerospace Technologies | ||||||||||||||||||||||||||
| Commercial Aviation Original Equipment | $ | 627 | $ | 586 | $ | 632 | $ | 674 | $ | 668 | $ | 617 | $ | 264 | ||||||||||||
| Commercial Aviation Aftermarket | 1,899 | 1,916 | 2,085 | 1,659 | 1,798 | 1,758 | 1,929 | |||||||||||||||||||
| Defense and Space | 1,646 | 1,805 | 1,794 | 1,336 | 1,425 | 1,537 | 1,793 | |||||||||||||||||||
| Total Net Aerospace Technologies sales | 4,172 | 4,307 | 4,511 | 3,669 | 3,891 | 3,912 | 3,986 | |||||||||||||||||||
| Building Automation | ||||||||||||||||||||||||||
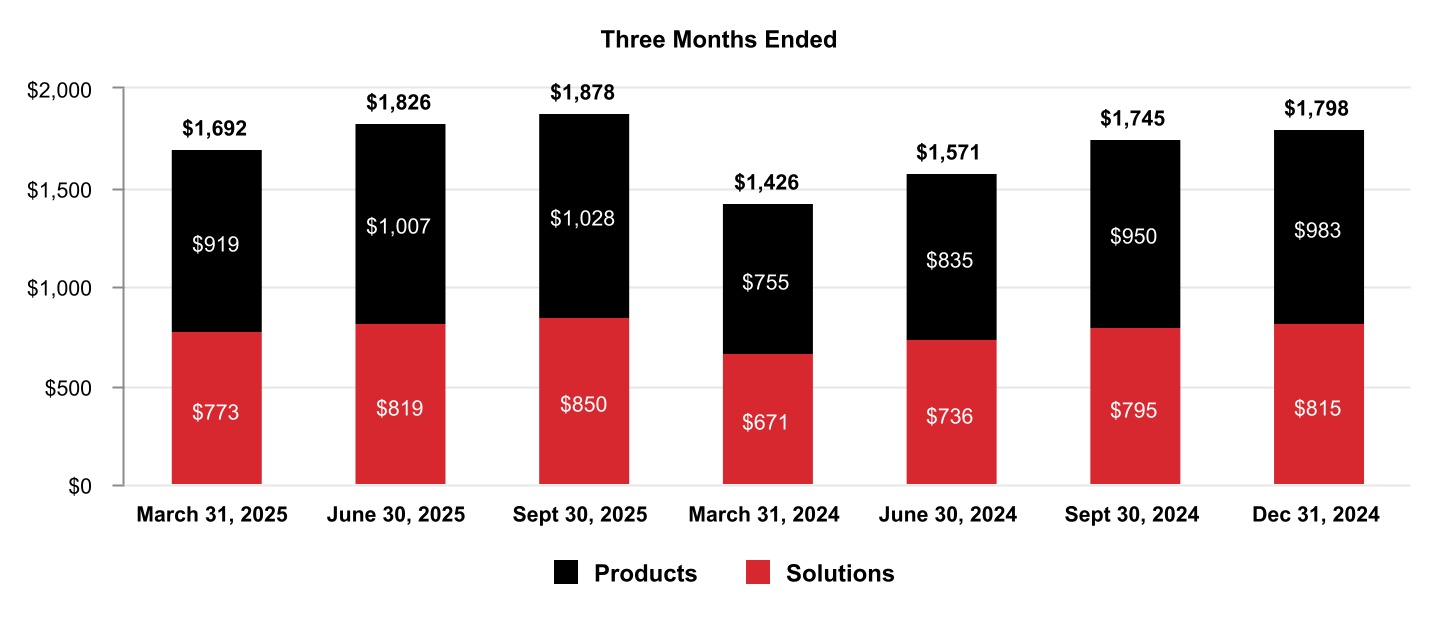
| Products | 919 | 1,007 | 1,028 | 755 | 835 | 950 | 983 | |||||||||||||||||||
| Solutions | 773 | 819 | 850 | 671 | 736 | 795 | 815 | |||||||||||||||||||
| Total Net Building Automation sales | 1,692 | 1,826 | 1,878 | 1,426 | 1,571 | 1,745 | 1,798 | |||||||||||||||||||
| Process Automation and Technology | ||||||||||||||||||||||||||
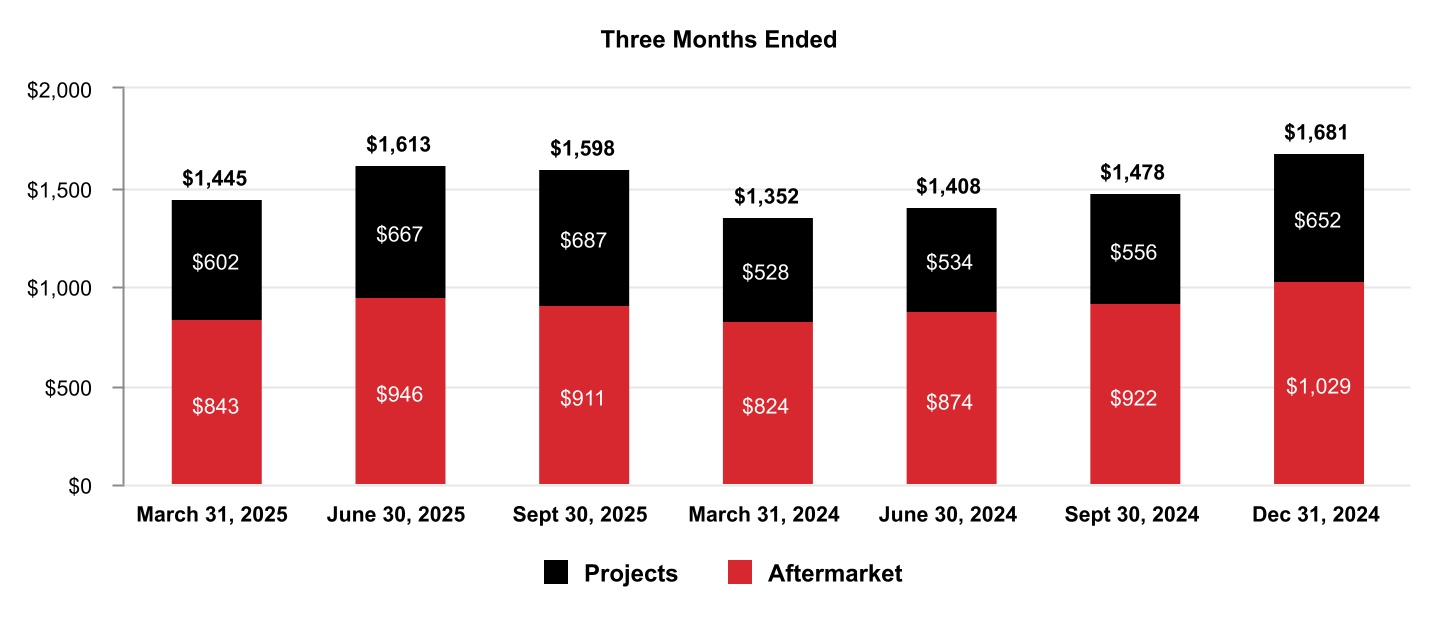
| Projects | 602 | 667 | 687 | 528 | 534 | 556 | 652 | |||||||||||||||||||
| Aftermarket | 843 | 946 | 911 | 824 | 874 | 922 | 1,029 | |||||||||||||||||||
| Total Net Process Automation and Technology sales | 1,445 | 1,613 | 1,598 | 1,352 | 1,408 | 1,478 | 1,681 | |||||||||||||||||||
| Industrial Automation | ||||||||||||||||||||||||||
| Products | 1,200 | 1,161 | 1,021 | 1,245 | 1,237 | 1,222 | 1,238 | |||||||||||||||||||
| Solutions | 397 | 413 | 426 | 458 | 460 | 455 | 461 | |||||||||||||||||||
| Total Net Industrial Automation sales | 1,597 | 1,574 | 1,447 | 1,703 | 1,697 | 1,677 | 1,699 | |||||||||||||||||||
| Corporate and All Other | 19 | 2 | 3 | 7 | 5 | 7 | 5 | |||||||||||||||||||
| Total Net sales from continuing operations | $ | 8,925 | $ | 9,322 | $ | 9,437 | $ | 8,157 | $ | 8,572 | $ | 8,819 | $ | 9,169 | ||||||||||||
Total Net sales from discontinued operations1 | $ | 897 | $ | 1,030 | $ | 971 | $ | 948 | $ | 1,005 | $ | 909 | $ | 919 | ||||||||||||
| 1 | Effective October 30, 2025, Honeywell completed the spin-off of its Advanced Materials (AM) business into an independent, publicly traded company, Solstice Advanced Materials. The AM business had historically been part of the Energy and Sustainability Systems reportable segment. In connection with the spin-off, the AM business is reported as discontinued operations in all periods presented. | |||||||
| 2 | Corporate expenses historically allocated to AM and not eligible to be part of discontinued operations are included in Corporate and All Other. | |||||||
HONEYWELL INTERNATIONAL INC.
(Unaudited)
(Dollars in tables in millions)
SUPPLEMENTAL ANNUAL SEGMENT INFORMATION
| Years Ended Dec 31, | |||||||||||
| 2024 | 2023 | ||||||||||
| Net sales | |||||||||||
| Aerospace Technologies | $ | 15,458 | $ | 13,624 | |||||||
| Building Automation | 6,540 | 6,031 | |||||||||
| Process Automation and Technology | 5,919 | 5,683 | |||||||||
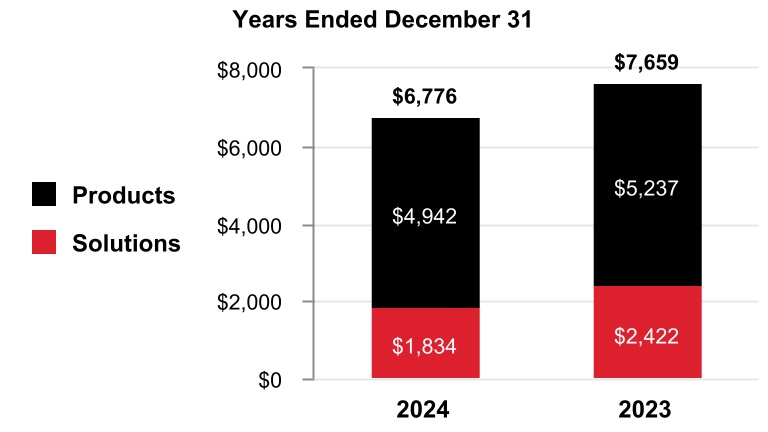
| Industrial Automation | 6,776 | 7,659 | |||||||||
| Corporate and All Other | 24 | 12 | |||||||||
| Total Net sales from continuing operations | $ | 34,717 | $ | 33,009 | |||||||
Total Net sales from discontinued operations1 | $ | 3,781 | $ | 3,653 | |||||||
| Segment profit | |||||||||||
| Aerospace Technologies | $ | 3,988 | $ | 3,760 | |||||||
| Building Automation | 1,681 | 1,529 | |||||||||
| Process Automation and Technology | 1,464 | 1,390 | |||||||||
| Industrial Automation | 1,113 | 1,388 | |||||||||
Corporate and All Other2 | (579) | (504) | |||||||||
| Total segment profit from continuing operations | $ | 7,667 | $ | 7,563 | |||||||
Total segment profit from discontinued operations1 | $ | 1,032 | $ | 1,035 | |||||||
| Years Ended Dec 31, | |||||||||||
| 2024 | 2023 | ||||||||||
| Aerospace Technologies | |||||||||||
| Commercial Aviation Original Equipment | $ | 2,223 | $ | 2,397 | |||||||
| Commercial Aviation Aftermarket | 7,144 | 6,241 | |||||||||
| Defense and Space | 6,091 | 4,986 | |||||||||
| Total Net Aerospace Technologies sales | 15,458 | 13,624 | |||||||||
| Building Automation | |||||||||||
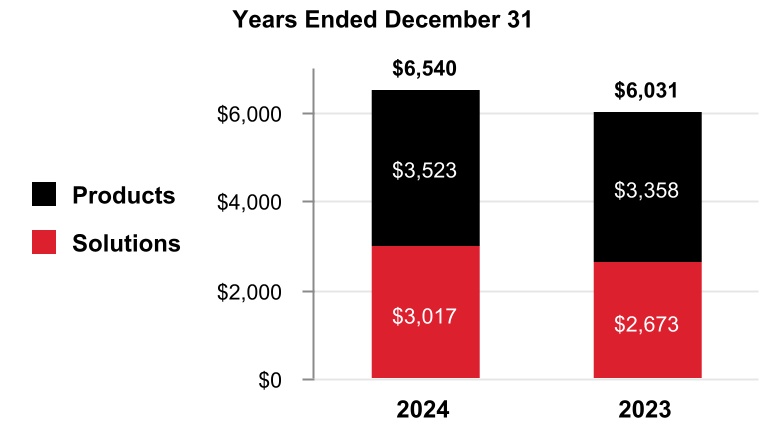
| Products | 3,523 | 3,358 | |||||||||
| Solutions | 3,017 | 2,673 | |||||||||
| Total Net Building Automation sales | 6,540 | 6,031 | |||||||||
| Process Automation & Technology | |||||||||||
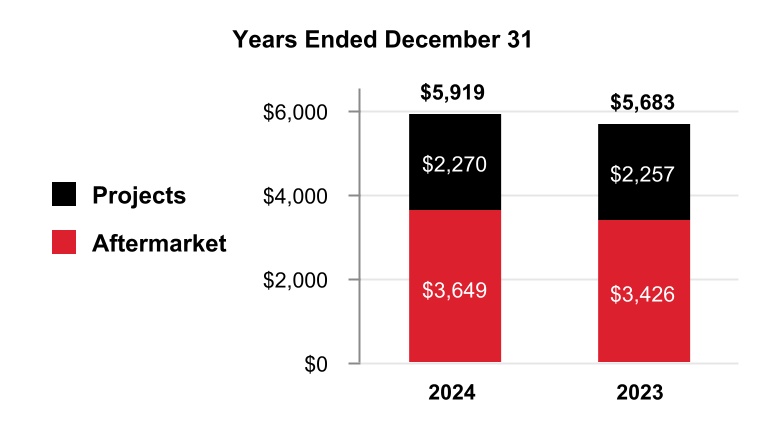
| Projects | 2,270 | 2,257 | |||||||||
| Aftermarket | 3,649 | 3,426 | |||||||||
| Total Net Process Automation and Technology sales | 5,919 | 5,683 | |||||||||
| Industrial Automation | |||||||||||
| Products | 4,942 | 5,237 | |||||||||
| Solutions | 1,834 | 2,422 | |||||||||
| Total Net Industrial Automation sales | 6,776 | 7,659 | |||||||||
| Corporate and All Other | 24 | 12 | |||||||||
| Total Net sales from continuing operations | $ | 34,717 | $ | 33,009 | |||||||
Total Net sales from discontinued operations1 | $ | 3,781 | $ | 3,653 | |||||||
| 1 | Effective October 30, 2025, Honeywell completed the spin-off of its AM business into an independent, publicly traded company, Solstice Advanced Materials. The AM business had historically been part of the Energy and Sustainability Systems reportable segment. In connection with the spin-off, the AM business is reported as discontinued operations in all periods presented. | |||||||
| 2 | Corporate expenses historically allocated to AM and not eligible to be part of discontinued operations are included in Corporate and All Other. | |||||||
HONEYWELL INTERNATIONAL INC.
(Unaudited)
(Dollars in tables in millions)
BUILDING AUTOMATION
Net Sales
| Three Months Ended | |||||||||||||||||||||||||||||||||||||||||
| March 31, 2025 | June 30, 2025 | Sept 30, 2025 | March 31, 2024 | June 30, 2024 | Sept 30, 2024 | Dec 31, 2024 | |||||||||||||||||||||||||||||||||||
| Net sales | $ | 1,692 | $ | 1,826 | $ | 1,878 | $ | 1,426 | $ | 1,571 | $ | 1,745 | $ | 1,798 | |||||||||||||||||||||||||||
| Cost of products and services sold | 868 | 944 | 990 | 764 | 844 | 926 | 948 | ||||||||||||||||||||||||||||||||||
| Selling, general and administrative and other expenses | 384 | 403 | 386 | 312 | 330 | 367 | 368 | ||||||||||||||||||||||||||||||||||
| Segment profit | $ | 440 | $ | 479 | $ | 502 | $ | 350 | $ | 397 | $ | 452 | $ | 482 | |||||||||||||||||||||||||||
| 2024 | 2023 | ||||||||||
| Net sales | $ | 6,540 | $ | 6,031 | |||||||
| Cost of products and services sold | 3,482 | 3,240 | |||||||||
| Selling, general and administrative and other expenses | 1,377 | 1,262 | |||||||||
| Segment profit | $ | 1,681 | $ | 1,529 | |||||||
HONEYWELL INTERNATIONAL INC.
(Unaudited)
(Dollars in tables in millions)
PROCESS AUTOMATION AND TECHNOLOGY
Net Sales
| Three Months Ended | |||||||||||||||||||||||||||||||||||||||||
| March 31, 2025 | June 30, 2025 | Sept 30, 2025 | March 31, 2024 | June 30, 2024 | Sept 30, 2024 | Dec 31, 2024 | |||||||||||||||||||||||||||||||||||
| Net sales | $ | 1,445 | $ | 1,613 | $ | 1,598 | $ | 1,352 | $ | 1,408 | $ | 1,478 | $ | 1,681 | |||||||||||||||||||||||||||
| Cost of products and services sold | 809 | 896 | 896 | 753 | 736 | $ | 792 | $ | 924 | ||||||||||||||||||||||||||||||||
| Selling, general and administrative and other expenses | 323 | 331 | 313 | 310 | 326 | 305 | 309 | ||||||||||||||||||||||||||||||||||
| Segment profit | $ | 313 | $ | 386 | $ | 389 | $ | 289 | $ | 346 | $ | 381 | $ | 448 | |||||||||||||||||||||||||||
| 2024 | 2023 | ||||||||||
| Net sales | $ | 5,919 | $ | 5,683 | |||||||
| Cost of products and services sold | 3,205 | $ | 3,220 | ||||||||
| Selling, general and administrative and other expenses | 1,250 | 1,073 | |||||||||
| Segment profit | $ | 1,464 | $ | 1,390 | |||||||
HONEYWELL INTERNATIONAL INC.
(Unaudited)
(Dollars in tables in millions)
INDUSTRIAL AUTOMATION
Net Sales
| Three Months Ended | |||||||||||||||||||||||||||||||||||||||||
| March 31, 2025 | June 30, 2025 | Sept 30, 2025 | March 31, 2024 | June 30, 2024 | Sept 30, 2024 | Dec 31, 2024 | |||||||||||||||||||||||||||||||||||
| Net sales | $ | 1,597 | $ | 1,574 | $ | 1,447 | $ | 1,703 | $ | 1,697 | $ | 1,677 | $ | 1,699 | |||||||||||||||||||||||||||
| Cost of products and services sold | 989 | 958 | 911 | 1,046 | 1,075 | 1,051 | 1,067 | ||||||||||||||||||||||||||||||||||
| Selling, general and administrative and other expenses | 378 | 360 | 321 | 372 | 352 | 340 | 360 | ||||||||||||||||||||||||||||||||||
| Segment profit | $ | 230 | $ | 256 | $ | 215 | $ | 285 | $ | 270 | $ | 286 | $ | 272 | |||||||||||||||||||||||||||
| 2024 | 2023 | ||||||||||
| Net sales | $ | 6,776 | $ | 7,659 | |||||||
| Cost of products and services sold | 4,239 | 4,758 | |||||||||
| Selling, general and administrative and other expenses | 1,424 | 1,513 | |||||||||
| Segment profit | $ | 1,113 | $ | 1,388 | |||||||
Appendix
Non-GAAP Financial Measures
The following information provides definitions and reconciliations of certain non-GAAP financial measures presented in this supplemental schedule to which this reconciliation is attached to the most directly comparable financial measures calculated and presented in accordance with generally accepted accounting principles (GAAP).
Management believes that, when considered together with reported amounts, these measures are useful to investors and management in understanding our ongoing operations and in the analysis of ongoing operating trends. These measures should be considered in addition to, and not as replacements for, the most comparable GAAP measure. Certain measures presented on a non-GAAP basis represent the impact of adjusting items net of tax. The tax-effect for adjusting items is determined individually and on a case-by-case basis. Other companies may calculate these non-GAAP measures differently, limiting the usefulness of these measures for comparative purposes.
Management does not consider these non-GAAP measures in isolation or as an alternative to financial measures determined in accordance with GAAP. The principal limitations of these non-GAAP financial measures are that they exclude significant expenses and income that are required by GAAP to be recognized in the consolidated financial statements. In addition, they are subject to inherent limitations as they reflect the exercise of judgments by management about which expenses and income are excluded or included in determining these non-GAAP financial measures. Investors are urged to review the reconciliation of the non-GAAP financial measures to the comparable GAAP financial measures and not to rely on any single financial measure to evaluate Honeywell’s business.
Honeywell International Inc.
Reconciliation of Organic Sales % Change
(Unaudited)
| Three Months Ended | Year Ended | ||||||||||||||||||||||
| March 31, 2025 | June 30, 2025 | September 30, 2025 | December 31, 2024 | ||||||||||||||||||||
| Honeywell | |||||||||||||||||||||||
| Reported sales % change | 9% | 9% | 7% | 5% | |||||||||||||||||||
| Less: Foreign currency translation | (1)% | —% | —% | (1)% | |||||||||||||||||||
| Less: Acquisitions, divestitures and other, net | 5% | 4% | 1% | 3% | |||||||||||||||||||
| Organic sales % change | 5% | 5% | 6% | 3% | |||||||||||||||||||
| Aerospace Technologies | |||||||||||||||||||||||
| Reported sales % change | 14% | 11% | 15% | 13% | |||||||||||||||||||
| Less: Foreign currency translation | —% | —% | —% | —% | |||||||||||||||||||
| Less: Acquisitions, divestitures and other, net | 5% | 5% | 3% | 2% | |||||||||||||||||||
| Organic sales % change | 9% | 6% | 12% | 11% | |||||||||||||||||||
| Building Automation | |||||||||||||||||||||||
| Reported sales % change | 19% | 16% | 8% | 8% | |||||||||||||||||||
| Less: Foreign currency translation | (2)% | —% | 1% | (1)% | |||||||||||||||||||
| Less: Acquisitions, divestitures and other, net | 13% | 8% | —% | 7% | |||||||||||||||||||
| Organic sales % change | 8% | 8% | 7% | 2% | |||||||||||||||||||
| Process Automation and Technology | |||||||||||||||||||||||
| Reported sales % change | 7% | 15% | 8% | 4% | |||||||||||||||||||
| Less: Foreign currency translation | (2)% | 1% | —% | (1)% | |||||||||||||||||||
| Less: Acquisitions, divestitures and other, net | 6% | 8% | 14% | 2% | |||||||||||||||||||
| Organic sales % change | 3% | 6% | (6)% | 3% | |||||||||||||||||||
| Industrial Automation | |||||||||||||||||||||||
| Reported sales % change | (6)% | (7)% | (14)% | (12)% | |||||||||||||||||||
| Less: Foreign currency translation | (1)% | 1% | 1% | (1)% | |||||||||||||||||||
| Less: Acquisitions, divestitures and other, net | —% | (8)% | (16)% | —% | |||||||||||||||||||
| Organic sales % change | (5)% | —% | 1% | (11)% | |||||||||||||||||||
We define organic sales percentage as the year-over-year change in reported sales from continuing operations relative to the comparable period, excluding the impact on sales from foreign currency translation and acquisitions, net of divestitures, for the first 12 months following the transaction date. We believe this measure is useful to investors and management in understanding our ongoing operations and in analysis of ongoing operating trends.
Honeywell International Inc.
Reconciliation of Operating Income to Segment Profit
(Unaudited)
(Dollars in millions)
| Three Months Ended March 31, | |||||||||||||||||
| 2025 | 2024 | ||||||||||||||||
| Continuing Operations | Discontinued Operations1 | Continuing Operations | Discontinued Operations1 | ||||||||||||||
| Operating income | $ | 1,721 | $ | 249 | $ | 1,626 | $ | 234 | |||||||||
Stock compensation expense2 | 59 | 2 | 52 | 1 | |||||||||||||
Repositioning, Other3,4 | 59 | 3 | 94 | (2) | |||||||||||||
Pension and other postretirement service costs5 | 13 | 1 | 15 | 1 | |||||||||||||
Amortization of acquisition-related intangibles6 | 135 | 1 | 69 | 1 | |||||||||||||
Acquisition-related costs7 | — | — | 3 | — | |||||||||||||
| Impairment of assets held for sale | 15 | — | — | — | |||||||||||||
| Segment profit | $ | 2,002 | $ | 256 | $ | 1,859 | $ | 235 | |||||||||
| 1 | Effective October 30, 2025, Honeywell completed the spin-off of its AM business into an independent, publicly traded company, Solstice Advanced Materials. The AM business had historically been part of the Energy and Sustainability Systems reportable segment. In connection with the spin-off, the AM business is reported as discontinued operations in all periods presented. | |||||||
| 2 | Included in Selling, general and administrative expenses. | |||||||
| 3 | Includes repositioning, asbestos, environmental expenses, equity income adjustment, and other charges. | |||||||
| 4 | Included in Cost of products and services sold and Selling, general and administrative expenses. | |||||||
| 5 | Included in Cost of products and services sold, Research and development expenses, and Selling, general and administrative expenses. | |||||||
| 6 | Included in Cost of products and services sold. | |||||||
| 7 | Included in Other (income) expense. Includes acquisition-related fair value adjustments to inventory and third-party transaction and integration costs. | |||||||
| Three Months Ended June 30, | |||||||||||||||||
| 2025 | 2024 | ||||||||||||||||
| Continuing Operations | Discontinued Operations1 | Continuing Operations | Discontinued Operations1 | ||||||||||||||
| Operating income | $ | 1,843 | $ | 271 | $ | 1,692 | $ | 286 | |||||||||
Stock compensation expense2 | 55 | 2 | 54 | 1 | |||||||||||||
Repositioning, Other3,4 | 42 | 12 | 50 | 8 | |||||||||||||
Pension and other postretirement service costs5 | 14 | 1 | 15 | 1 | |||||||||||||
Amortization of acquisition-related intangibles6 | 132 | 1 | 84 | 1 | |||||||||||||
Acquisition-related costs7 | (7) | — | 7 | — | |||||||||||||
| Segment profit | $ | 2,079 | $ | 287 | $ | 1,902 | $ | 297 | |||||||||
| 1 | Effective October 30, 2025, Honeywell completed the spin-off of its AM business into an independent, publicly traded company, Solstice Advanced Materials. The AM business had historically been part of the Energy and Sustainability Systems reportable segment. In connection with the spin-off, the AM business is reported as discontinued operations in all periods presented. | |||||||
| 2 | Included in Selling, general and administrative expenses. | |||||||
| 3 | Includes repositioning, asbestos, environmental expenses, equity income adjustment, and other charges. | |||||||
| 4 | Included in Cost of products and services sold and Selling, general and administrative expenses. | |||||||
| 5 | Included in Cost of products and services sold, Research and development expenses, and Selling, general and administrative expenses. | |||||||
| 6 | Included in Cost of products and services sold. | |||||||
| 7 | Included in Other (income) expense. Includes acquisition-related fair value adjustments to inventory and third-party transaction and integration costs. | |||||||
Honeywell International Inc.
Reconciliation of Operating Income to Segment Profit (Continued)
(Unaudited)
(Dollars in millions)
| Three Months Ended September 30, | |||||||||||||||||
| 2025 | 2024 | ||||||||||||||||
| Continuing Operations | Discontinued Operations1 | Continuing Operations | Discontinued Operations1 | ||||||||||||||
| Operating income | $ | 1,484 | $ | 270 | $ | 1,610 | $ | 248 | |||||||||
Stock compensation expense2 | 32 | 4 | 44 | 1 | |||||||||||||
Repositioning, Other3,4 | 444 | 4 | 63 | 6 | |||||||||||||
Pension and other postretirement service costs5 | 18 | 1 | 15 | 1 | |||||||||||||
Amortization of acquisition-related intangibles6 | 140 | 1 | 119 | 1 | |||||||||||||
Acquisition-related costs7 | 9 | — | 15 | — | |||||||||||||
Indefinite-lived intangible asset impairment2 | — | — | 48 | — | |||||||||||||
| Impairment of assets held for sale | — | — | 125 | — | |||||||||||||
| Segment profit | $ | 2,127 | $ | 280 | $ | 2,039 | $ | 257 | |||||||||
| 1 | Effective October 30, 2025, Honeywell completed the spin-off of its AM business into an independent, publicly traded company, Solstice Advanced Materials. The AM business had historically been part of the Energy and Sustainability Systems reportable segment. In connection with the spin-off, the AM business is reported as discontinued operations in all periods presented. | |||||||
| 2 | Included in Selling, general and administrative expenses. | |||||||
| 3 | Includes repositioning, asbestos, environmental expenses, equity income adjustment, and other charges. | |||||||
| 4 | Included in Cost of products and services sold and Selling, general and administrative expenses. | |||||||
| 5 | Included in Cost of products and services sold, Research and development expenses, and Selling, general and administrative expenses. | |||||||
| 6 | Included in Cost of products and services sold. | |||||||
| 7 | Included in Other (income) expense. Includes acquisition-related fair value adjustments to inventory and third-party transaction and integration costs. | |||||||
| Three Months Ended December 31, | ||||||||
| 2024 | ||||||||
| Continuing Operations | Discontinued Operations1 | |||||||
| Operating income | $ | 1,521 | $ | 224 | ||||
Stock compensation expense2 | 39 | 2 | ||||||
Repositioning, Other3,4 | 58 | 15 | ||||||
Pension and other postretirement service costs5 | 16 | 1 | ||||||
Amortization of acquisition-related intangibles6 | 139 | 1 | ||||||
| Impairment of assets held for sale | 94 | — | ||||||
| Segment profit | $ | 1,867 | $ | 243 | ||||
| 1 | Effective October 30, 2025, Honeywell completed the spin-off of its AM business into an independent, publicly traded company, Solstice Advanced Materials. The AM business had historically been part of the Energy and Sustainability Systems reportable segment. In connection with the spin-off, the AM business is reported as discontinued operations in all periods presented. | |||||||
| 2 | Included in Selling, general and administrative expenses. | |||||||
| 3 | Includes repositioning, asbestos, environmental expenses, equity income adjustment, and other charges. | |||||||
| 4 | Included in Cost of products and services sold and Selling, general and administrative expenses. | |||||||
| 5 | Included in Cost of products and services sold, Research and development expenses, and Selling, general and administrative expenses. | |||||||
| 6 | Included in Cost of products and services sold. | |||||||
| Years Ended December 31, | |||||||||||||||||
| 2024 | 2023 | ||||||||||||||||
| Continuing Operations | Discontinued Operations1 | Continuing Operations | Discontinued Operations1 | ||||||||||||||
| Operating income | $ | 6,449 | $ | 992 | $ | 6,110 | $ | 974 | |||||||||
Stock compensation expense2 | 189 | 5 | 197 | 5 | |||||||||||||
Repositioning, Other3,4 | 265 | 27 | 900 | 52 | |||||||||||||
Pension and other postretirement service costs5 | 61 | 4 | 64 | 2 | |||||||||||||
Amortization of acquisition-related intangibles6 | 411 | 4 | 290 | 2 | |||||||||||||
Acquisition-related costs7 | 25 | — | 2 | — | |||||||||||||
Indefinite-lived intangible asset impairment2 | 48 | — | — | — | |||||||||||||
| Impairment of assets held for sale | 219 | — | — | — | |||||||||||||
| Segment profit | $ | 7,667 | $ | 1,032 | $ | 7,563 | $ | 1,035 | |||||||||
| 1 | Effective October 30, 2025, Honeywell completed the spin-off of its AM business into an independent, publicly traded company, Solstice Advanced Materials. The AM business had historically been part of the Energy and Sustainability Systems reportable segment. In connection with the spin-off, the AM business is reported as discontinued operations in all periods presented. | |||||||
| 2 | Included in Selling, general and administrative expenses. | |||||||
| 3 | Includes repositioning, asbestos, environmental expenses, equity income adjustment, and other charges. | |||||||
| 4 | Included in Cost of products and services sold and Selling, general and administrative expenses. | |||||||
| 5 | Included in Cost of products and services sold, Research and development expenses, and Selling, general and administrative expenses. | |||||||
| 6 | Included in Cost of products and services sold. | |||||||
| 7 | Included in Other (income) expense. Includes acquisition-related fair value adjustments to inventory and third-party transaction and integration costs. | |||||||
We define operating income as net sales less total cost of products and services sold, research and development expenses, impairment of assets held for sale, and selling, general and administrative expenses. We define segment profit, on an overall Honeywell basis, as operating income, excluding stock compensation expense, pension and other postretirement service costs, amortization of acquisition-related intangibles, certain acquisition- and divestiture-related costs and impairments, and repositioning and other charges. We believe this measure is useful to investors and management in understanding our ongoing operations and in analysis of ongoing operating trends.