Operator
Good morning, and welcome to Industrial Logistics Properties Trust's First Quarter 2026 Financial Results Conference Call. I would now like to turn the call over to Kevin Barry, Senior Director of Investor Relations. Please go ahead.
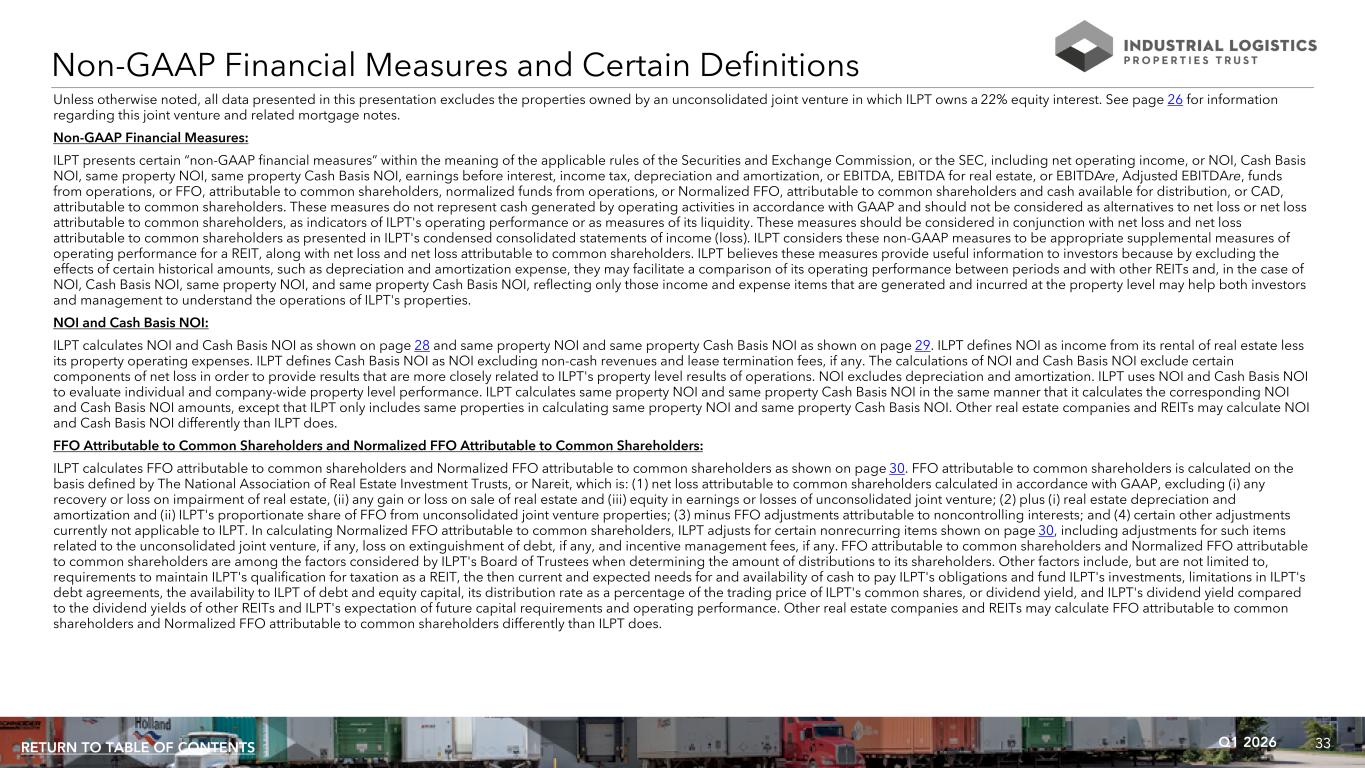
Good morning, and thank you for joining ILPT's first quarter 2026 earnings call. With me on today's call are President and Chief Executive Officer Yael Duffy, Chief Financial Officer and Treasurer Tiffany Tsai, and Vice President Mark Crone. In just a moment, they will provide details about our business and quarterly results, followed by a question and answer session with cell-side analysts. Please note that the recording and retransmission of today's conference call is prohibited without the prior written consent of the company. Also note that today's conference call contains forward-looking statements within the meaning of the Private Securities Litigation Reform Act of 1995 and other securities laws, including guidance with respect a certain second quarter in full year 2026 financial measures. These forward-looking statements are based on ILPT's beliefs and expectations. As of today, April 30th, 2026, and actual results may differ materially from those that we project. The company undertakes no obligation to revise or publicly release the results of any revision to the forward-looking statements made in today's conference call. Additional information concerning factors that could cause those differences is contained in our filings with the Securities Exchange Commission, which can be accessed from our website, ILPTREIT.com. Investors are cautioned not to place undue reliance upon any forward-looking statements. In addition, we will be discussing non-GAAP financial measures during this call, including normalized funds from operations or normalized FFO, adjusted EBITDA RE, net operating income or NOI, and cash basis NOI. A reconciliation of these non-GAAP measures to net income is available in our financial results package, which can be found on our website. Lastly, we will be providing guidance on this call, including estimated normalized FFO and adjusted EBITDA RE. We are not providing a reconciliation of these non-GAAP measures as part of our guidance because certain information required for such reconciliation is not available without unreasonable efforts or at all. I will now turn the call over to Yael.
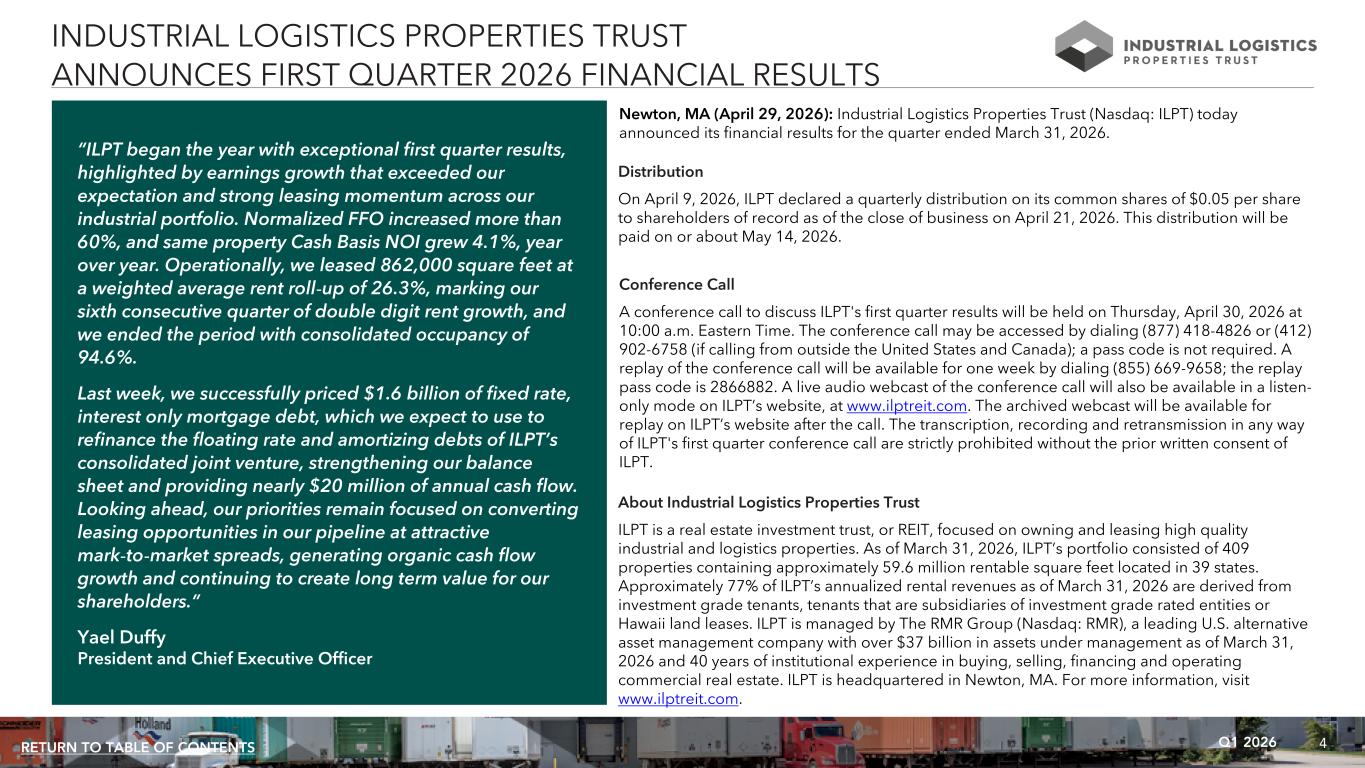
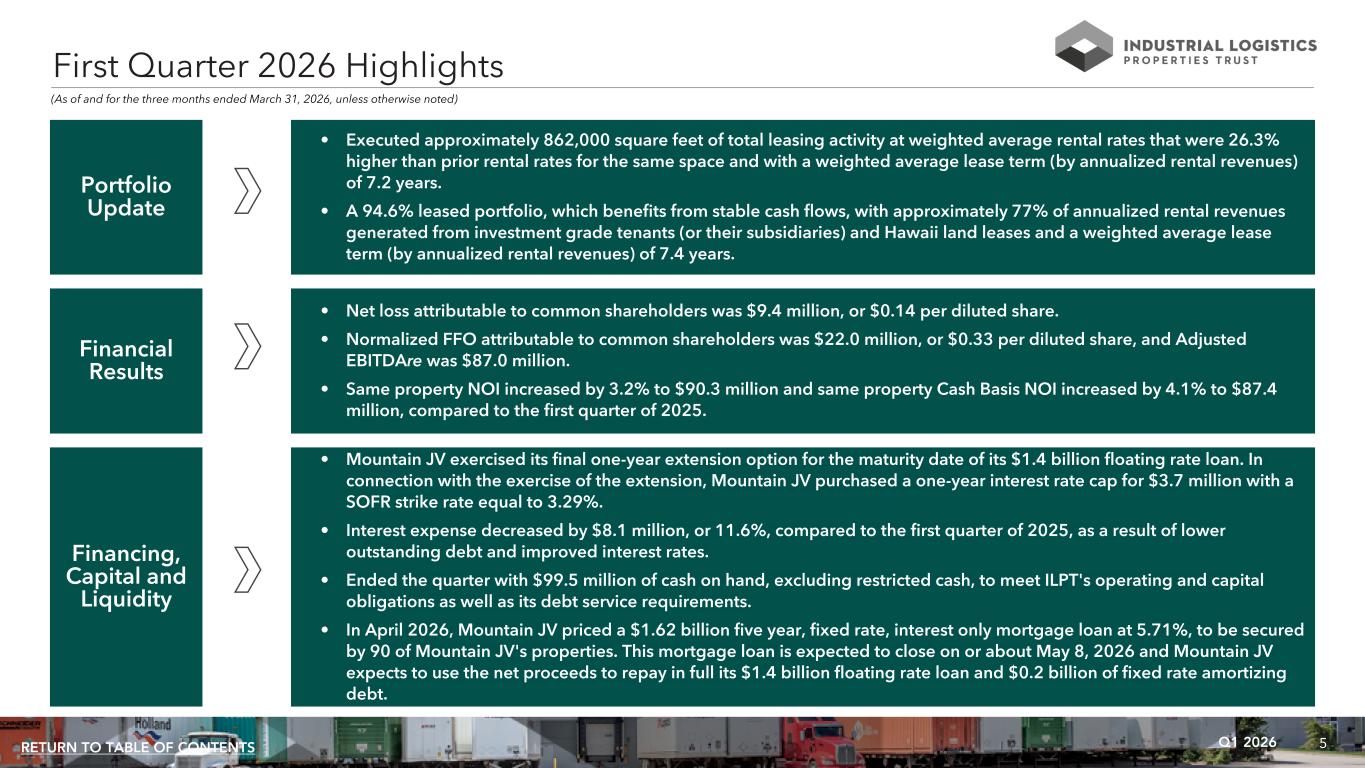
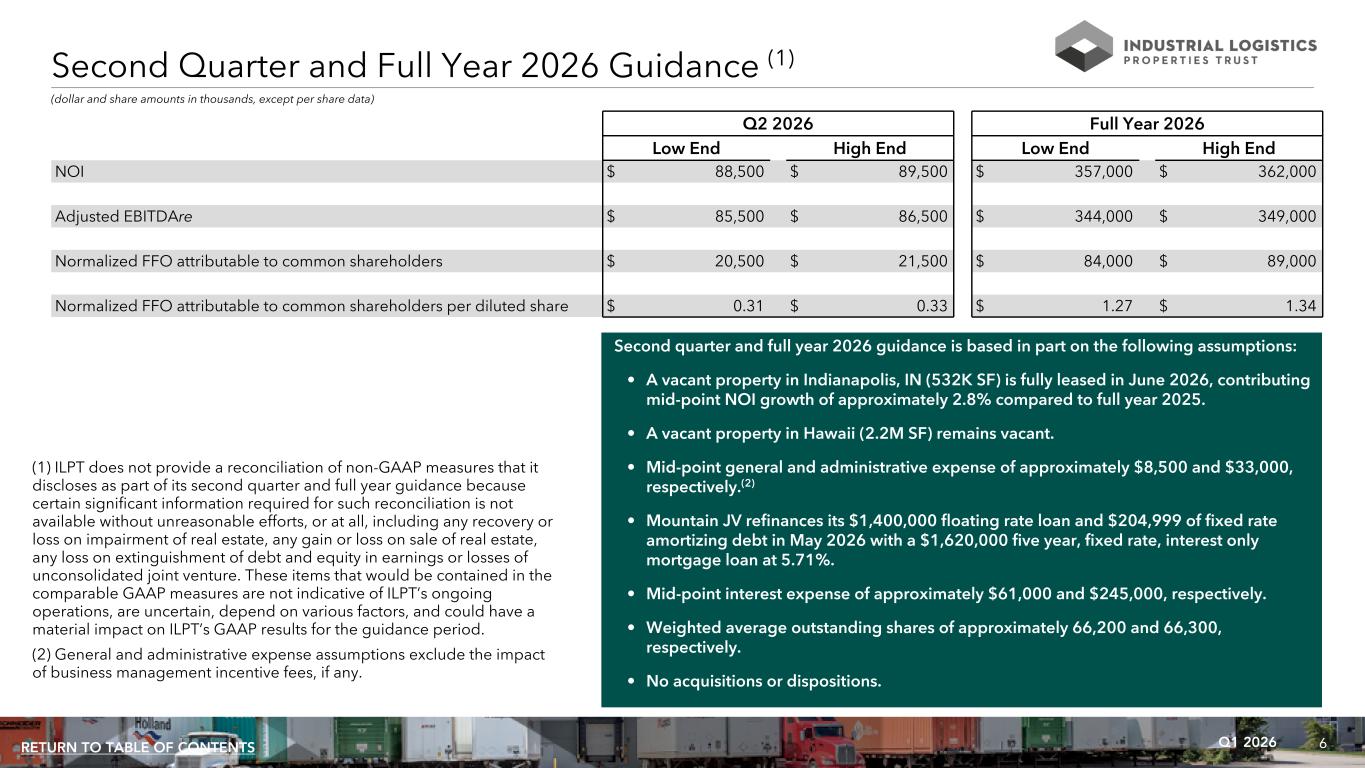
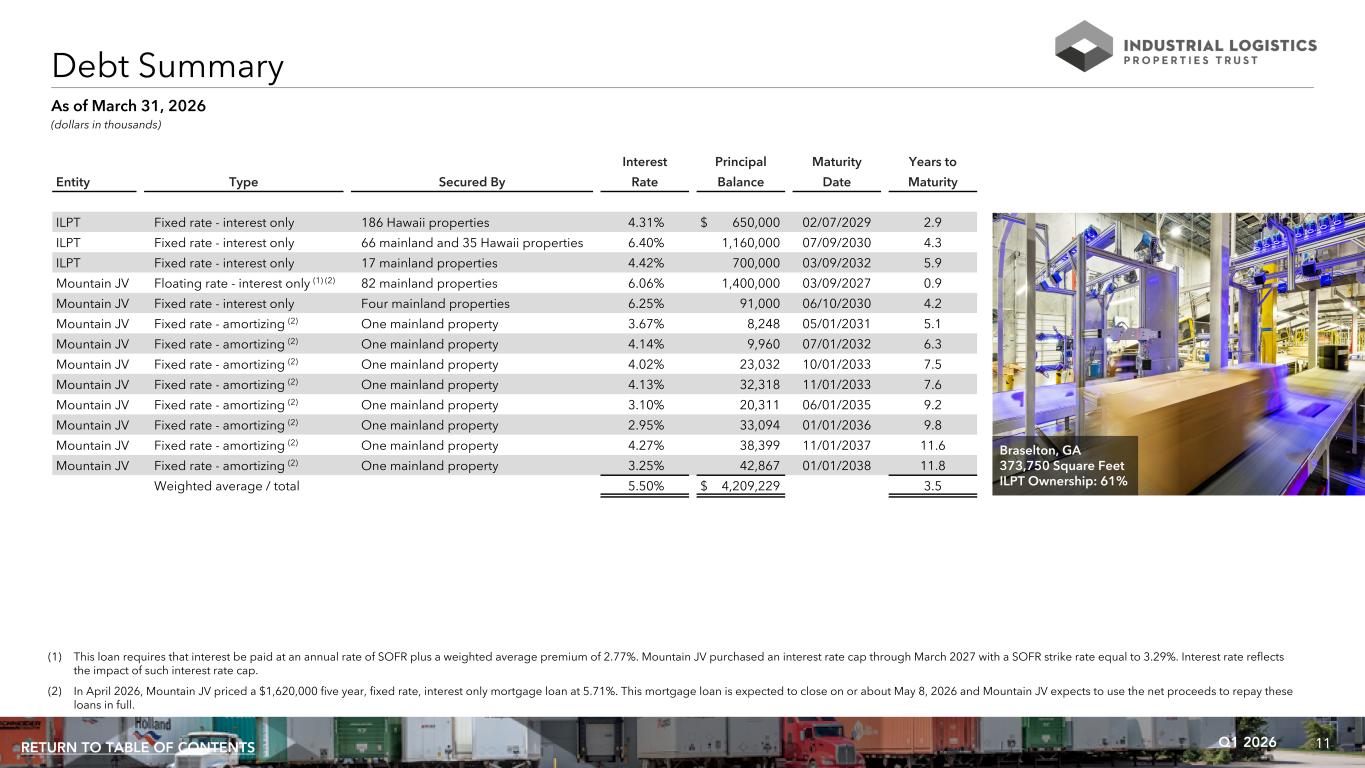
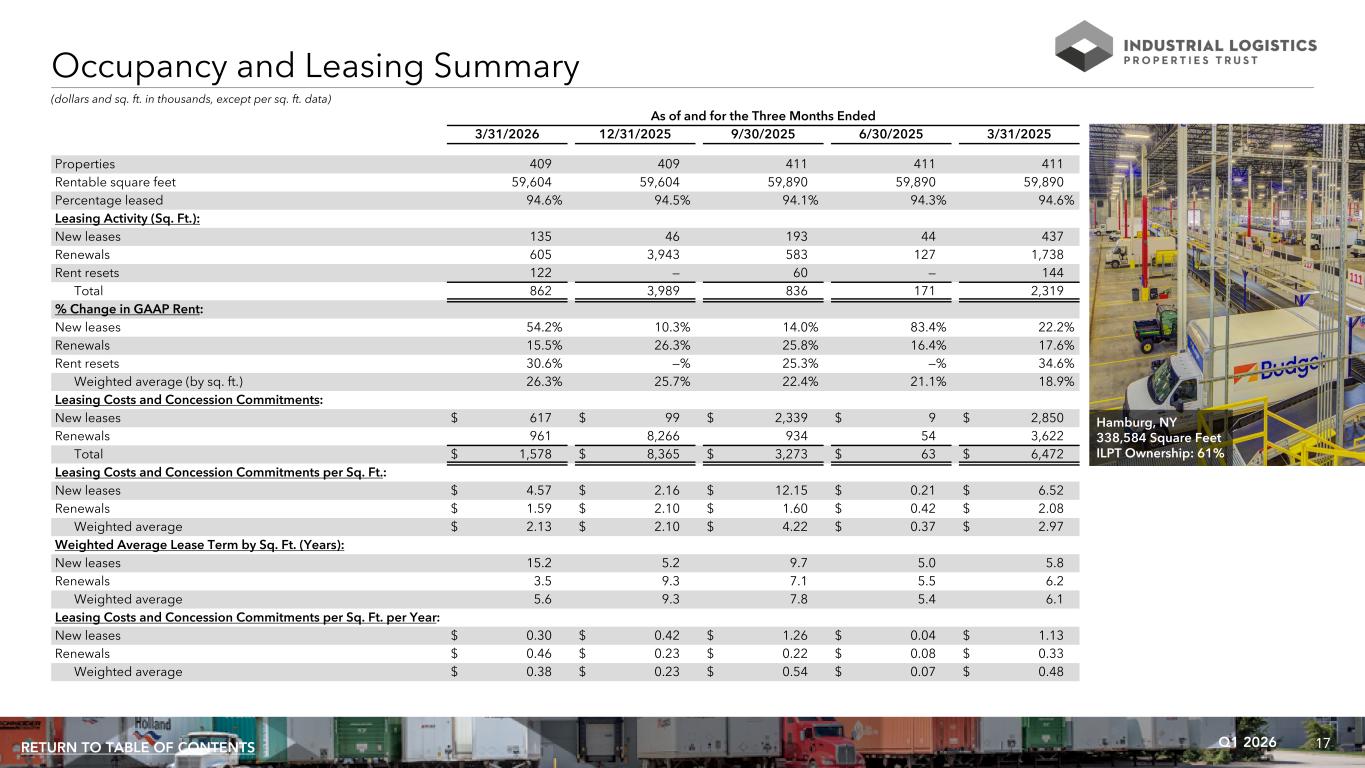
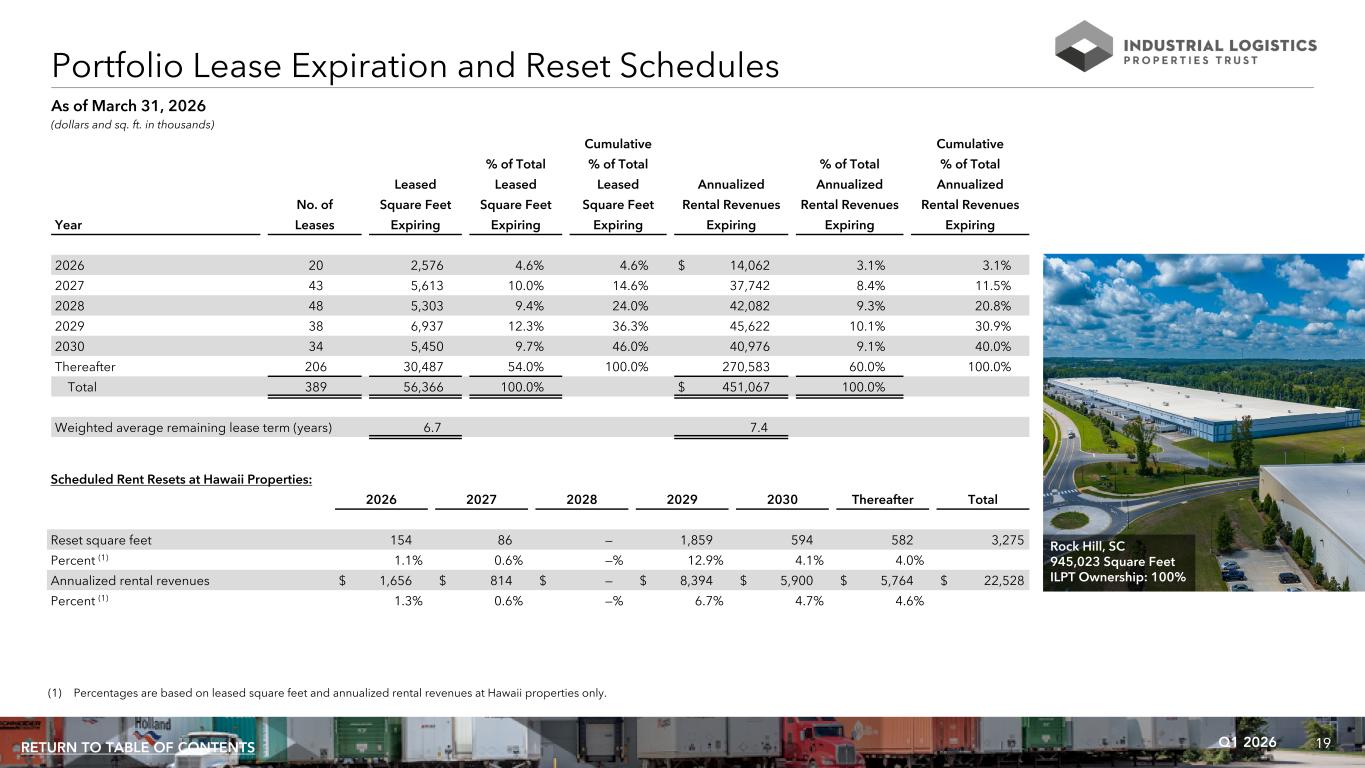
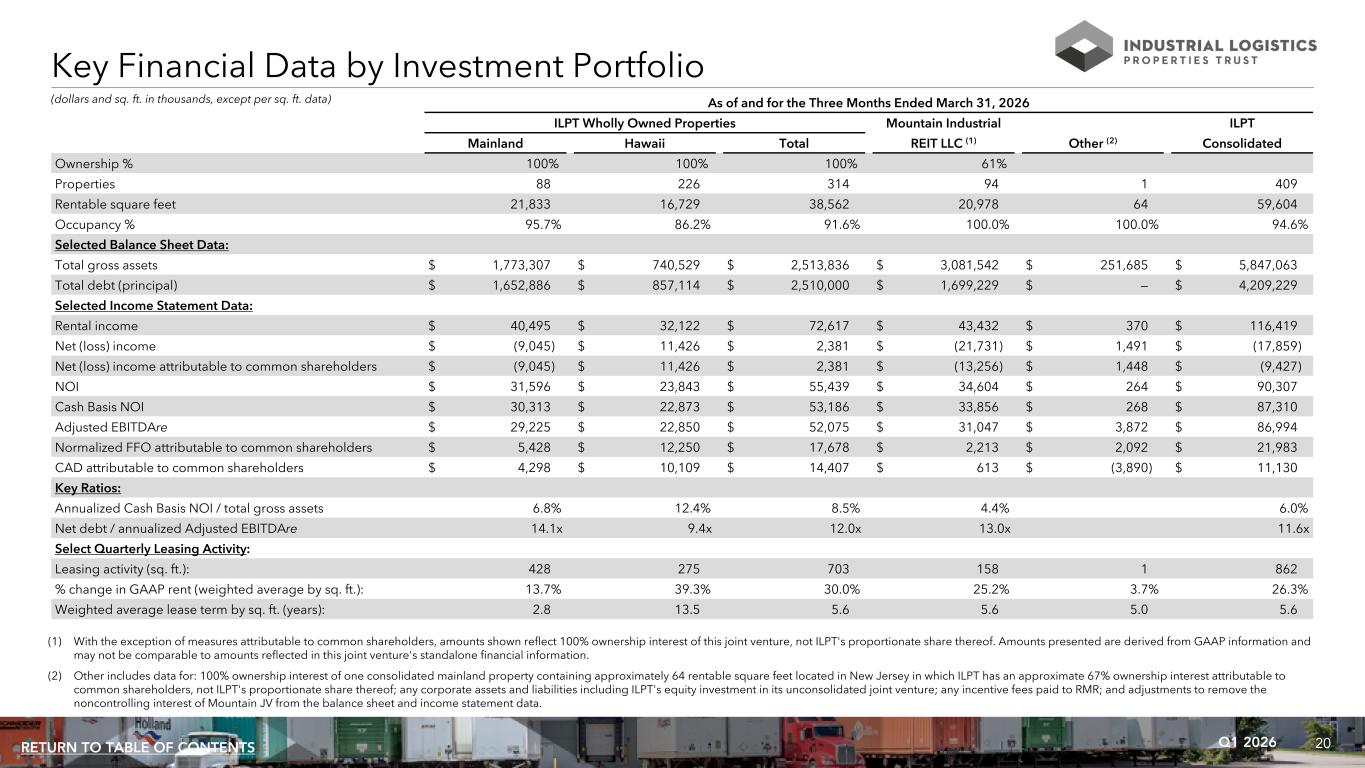
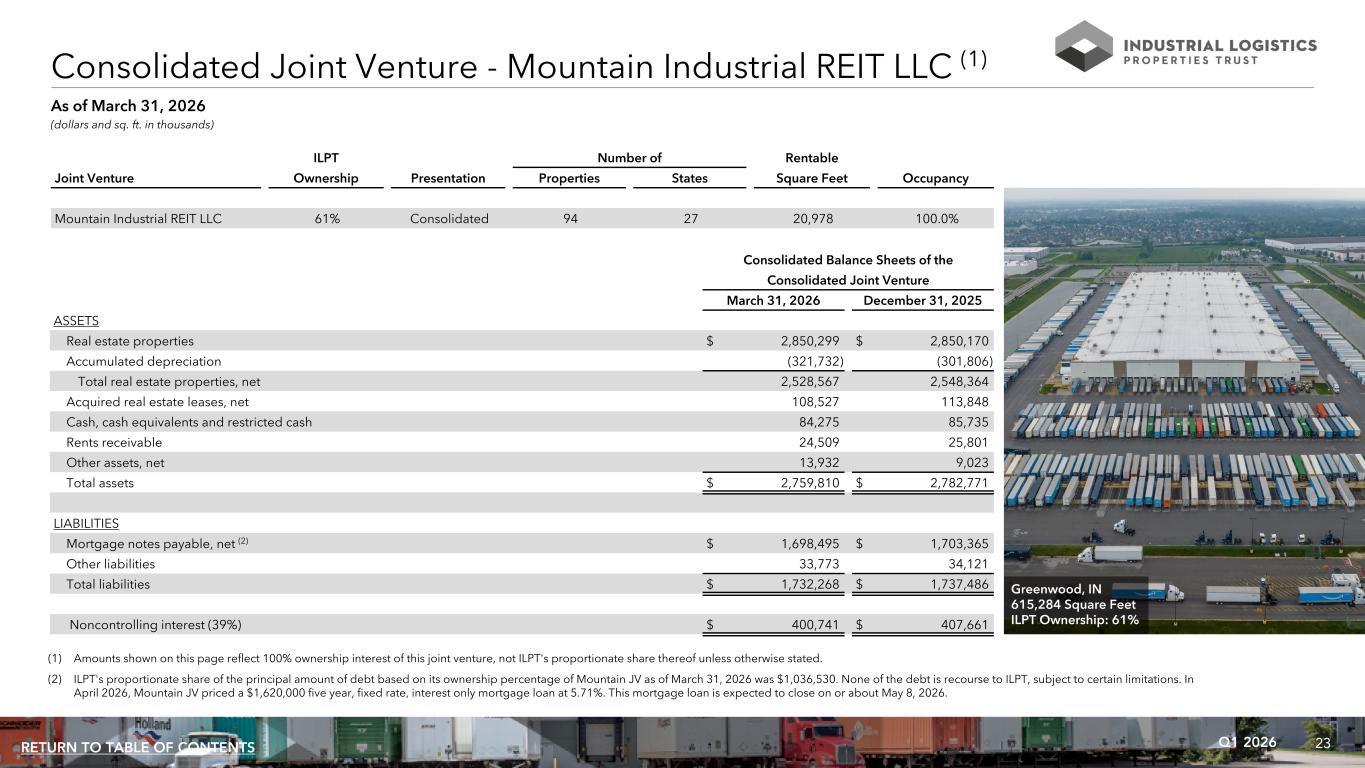
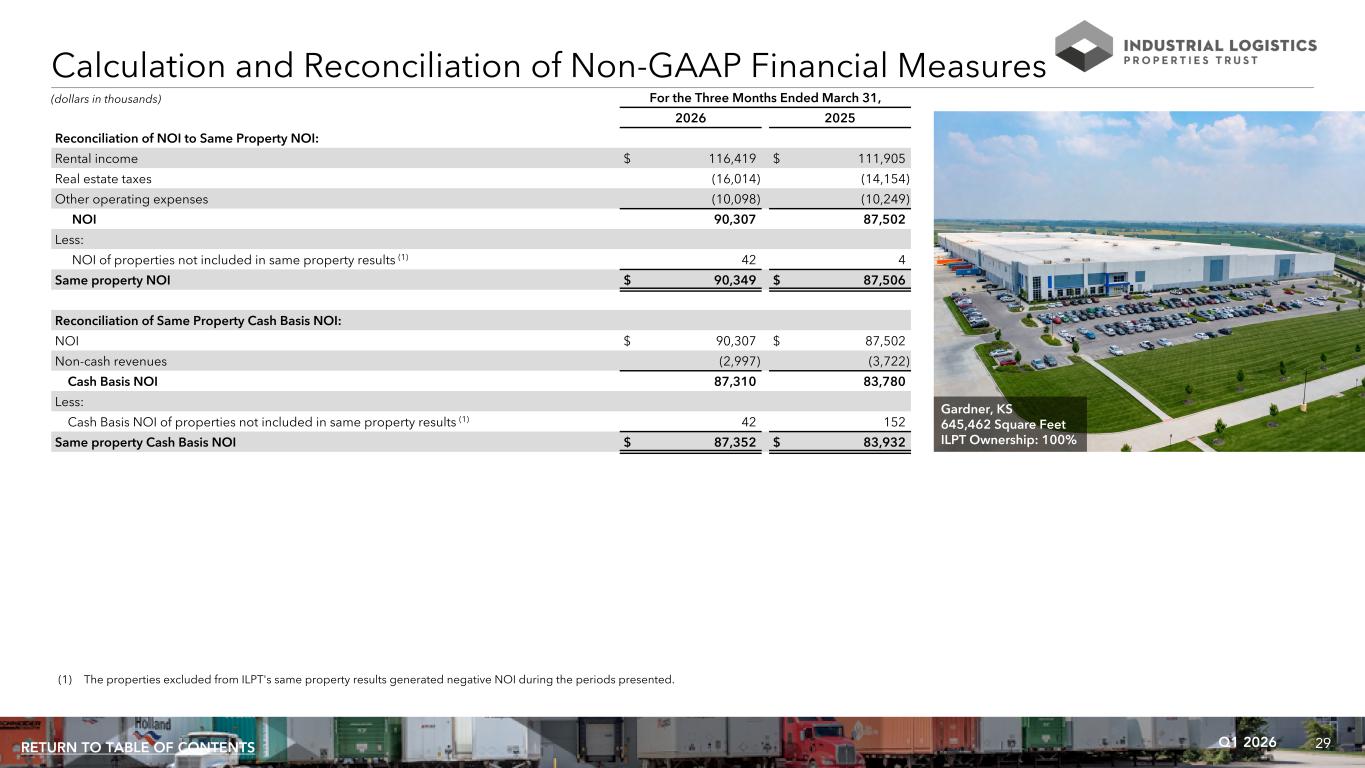
Thank you, Kevin, and good morning. To begin, I would like to highlight the announcement we made last week that our consolidated joint venture successfully priced $1.6 billion of fixed-rate interest-only debt at an attractive interest rate of 5.71%. This outcome was achieved despite geopolitical headwinds and capital markets volatility. It also speaks to the strength of our high-quality industrial portfolio, the creditworthiness of our tenants and the depth of the banking relationships our manager, the RMR group, As Tiffany will cover shortly, this financing takes out the JV's floating rate and amortizing debt, substantially strengthening its capital structure, insulating it from interest rate swings, and driving stronger cash flow. As a result, all of IOPT's consolidated debt will now be fixed rate and non-amortizing. at a weighted average interest rate of less than 5.5%. Turning to our results, we're pleased to report another quarter of strong earnings growth that outpaced our expectations, which was supported by continued leasing momentum across our portfolio. Same Property Cash Basis NOI increased more than 4% year-over-year and normalized FFOs through more than 60 percent, demonstrating the meaningful progress we've made reducing financing costs and driving rent growth. We leased 862,000 square feet at a weighted average rent roll-up of 26.3 percent, marking our sixth consecutive quarter of double-digit rent growth. Renewals accounted for approximately 70% of the activity, reflecting continued strong tenant retention and portfolio stability, with consolidated occupancy of 94.6%. Today, 8.1 million square feet, or 11.5% of ILTT's total annualized revenue, is scheduled to expire by the end of 2027, which provides us a substantial runway to capture embedded rent growth and drive organic cash flow. Currently, our leasing pipeline stands at approximately 6 million square feet, with more than 2 million square feet already in advanced stages of negotiation or lease documentation. We're especially pleased to share that we anticipate fully leasing the 535,000-square-foot vacancy in Indianapolis in June, accomplishing a key 2026 initiative for the company. Before I turn the call over to Tiffany, I want to take a moment to underscore the momentum we have built across three fronts, a meaningfully strengthened capital structure, continued double-digit leasing spreads, and a healthy pipeline of embedded mark-to-market opportunities still available to us. Looking ahead, we believe we have a clear path to continued cash flow growth and delivering value to our shareholders. Tiffany? Thank you, Yael.
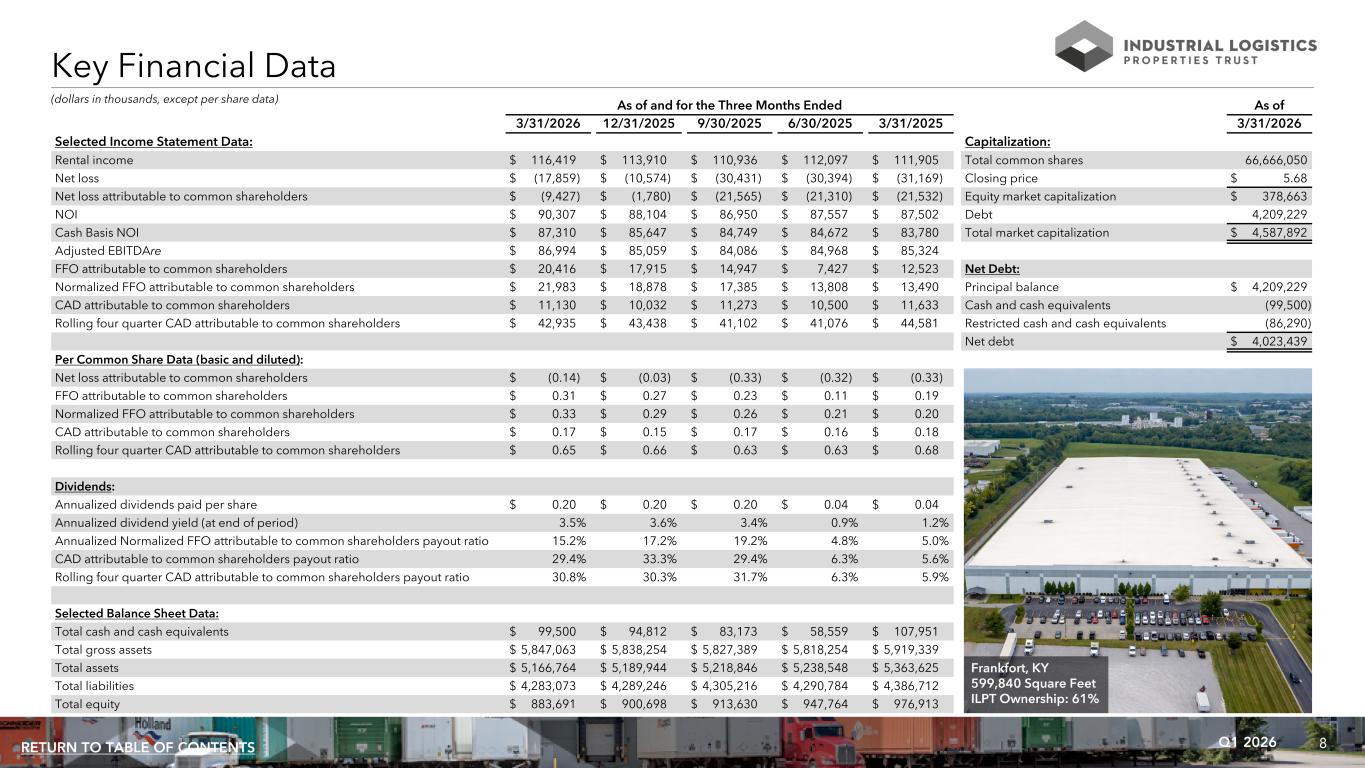
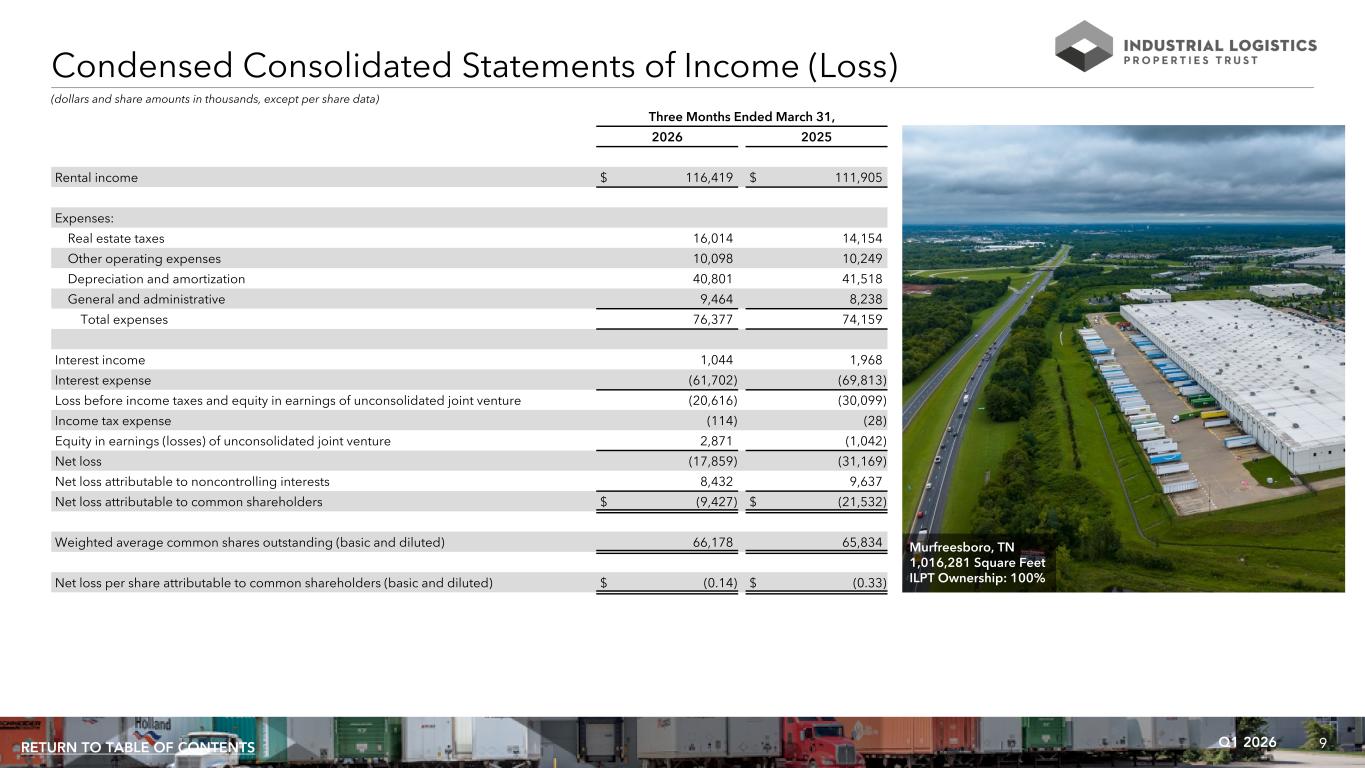
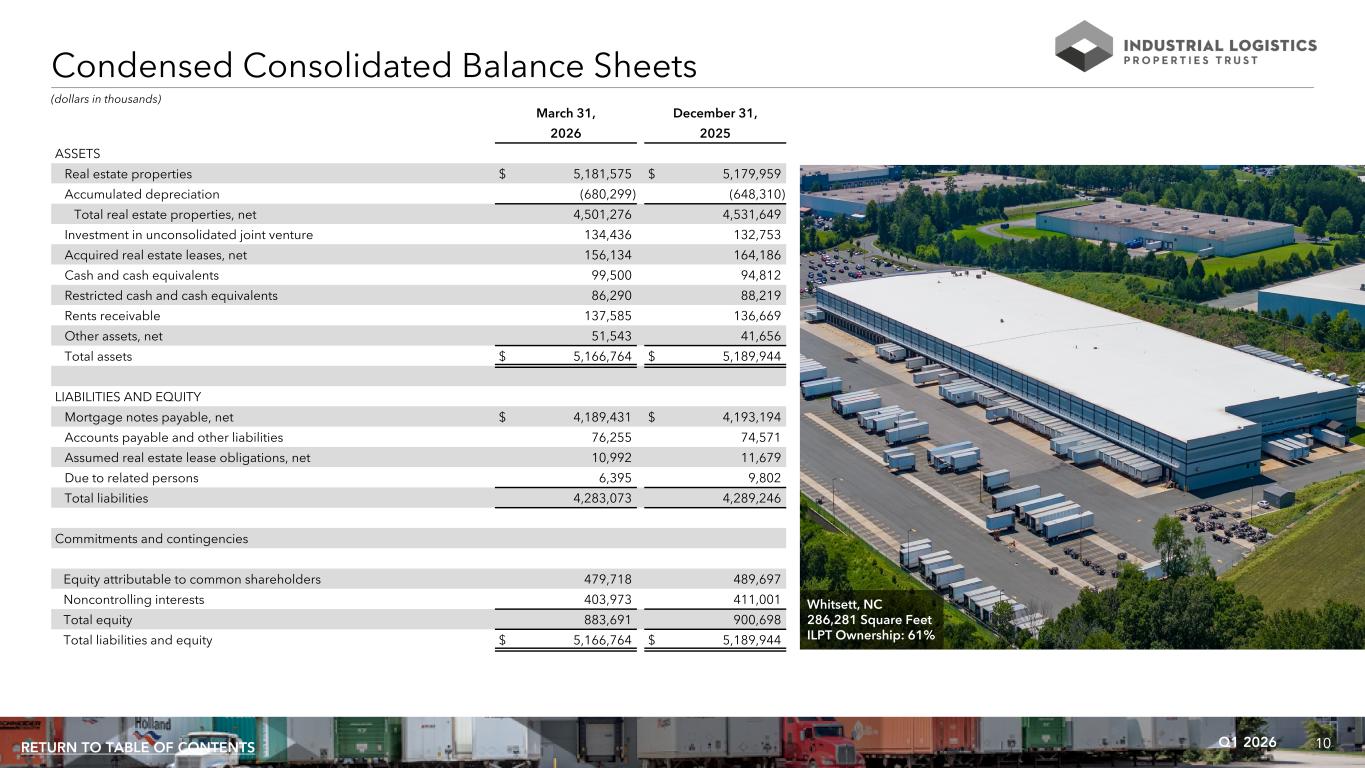
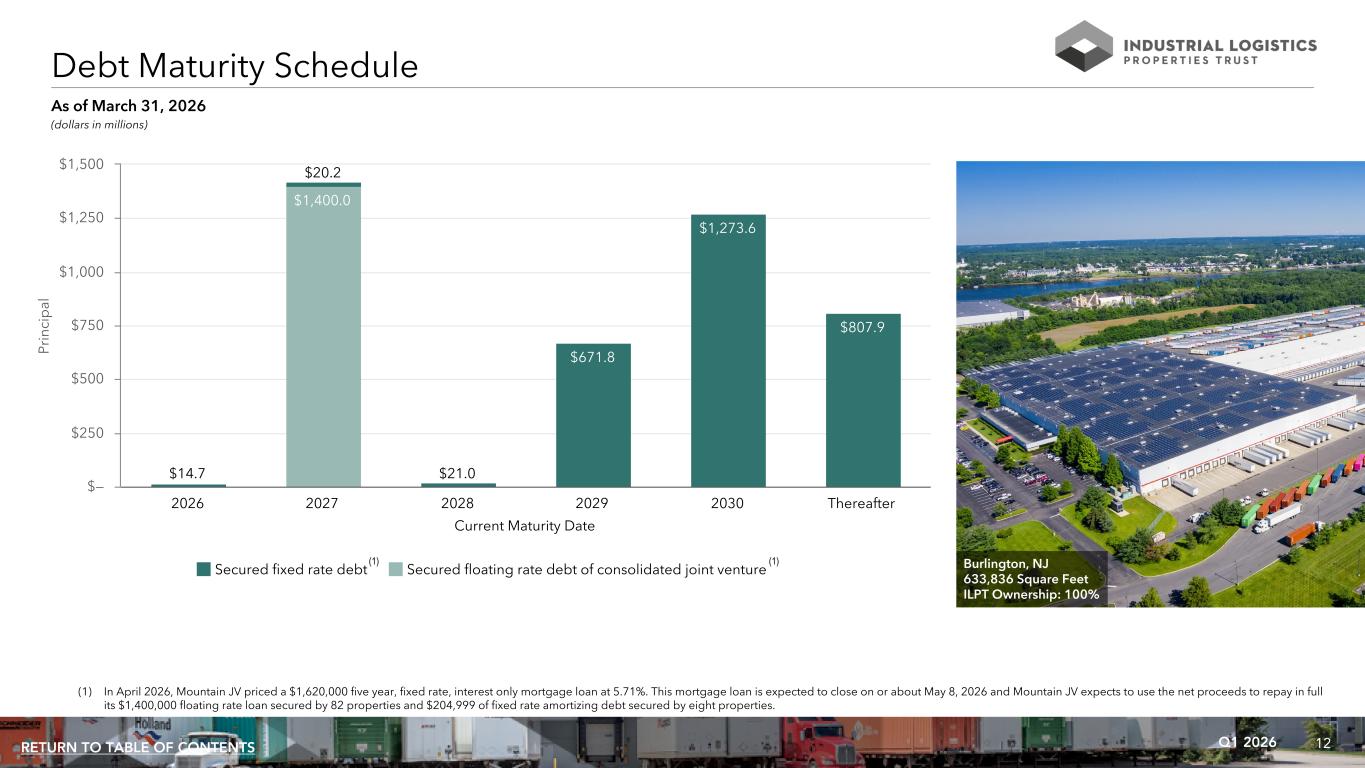
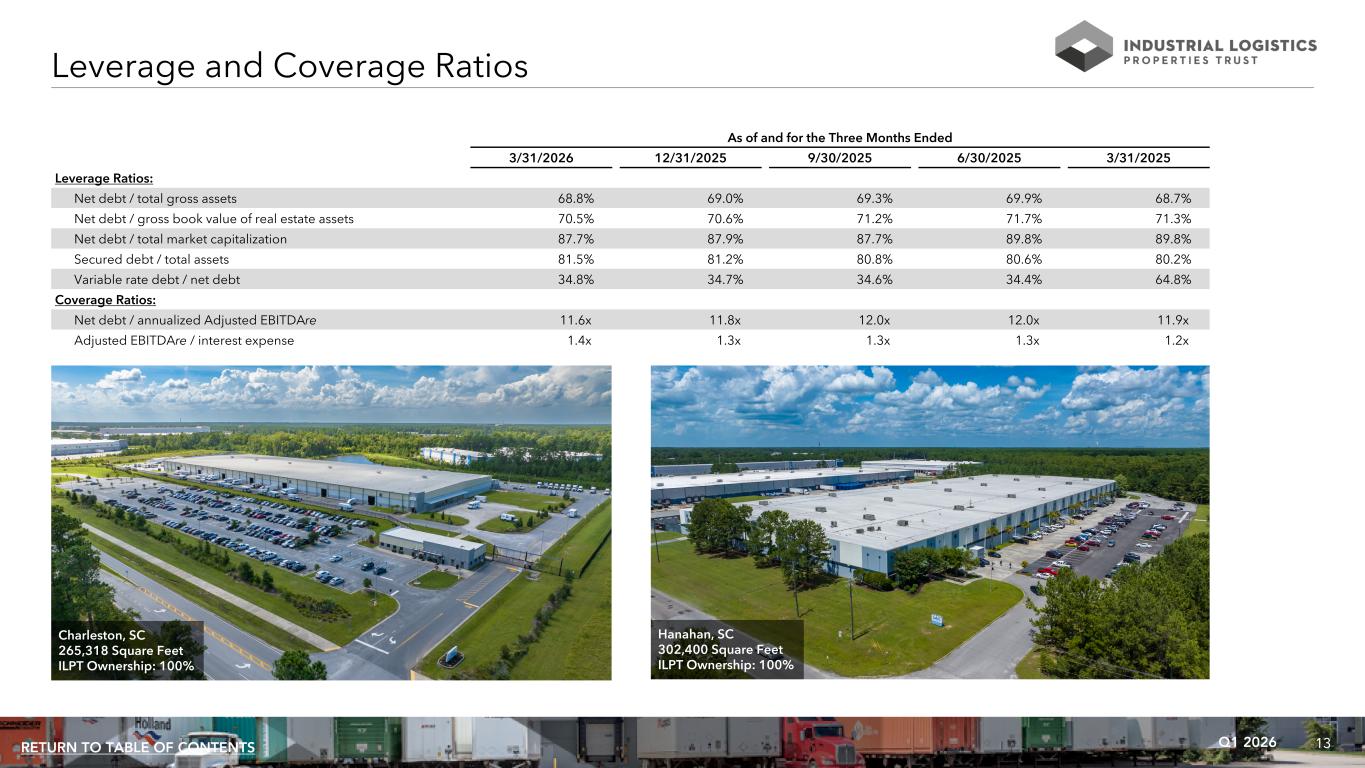
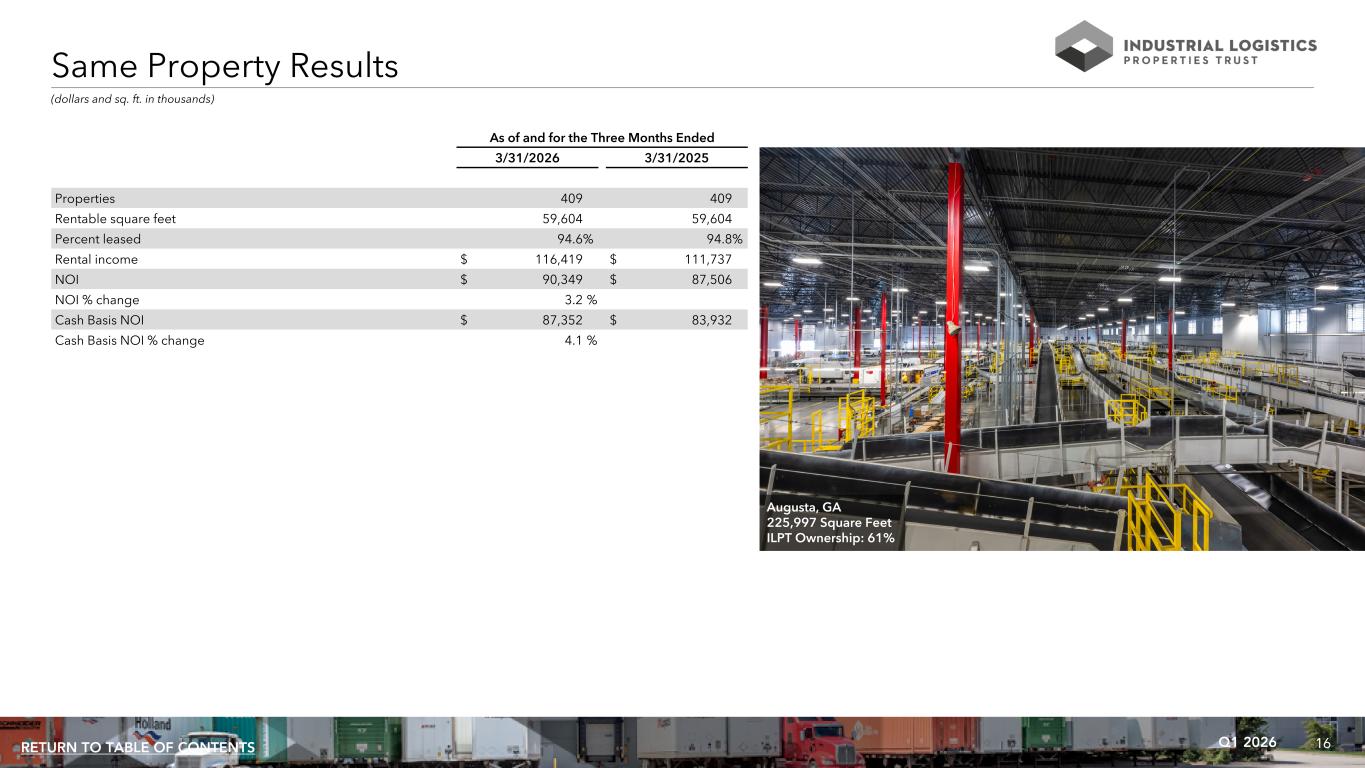
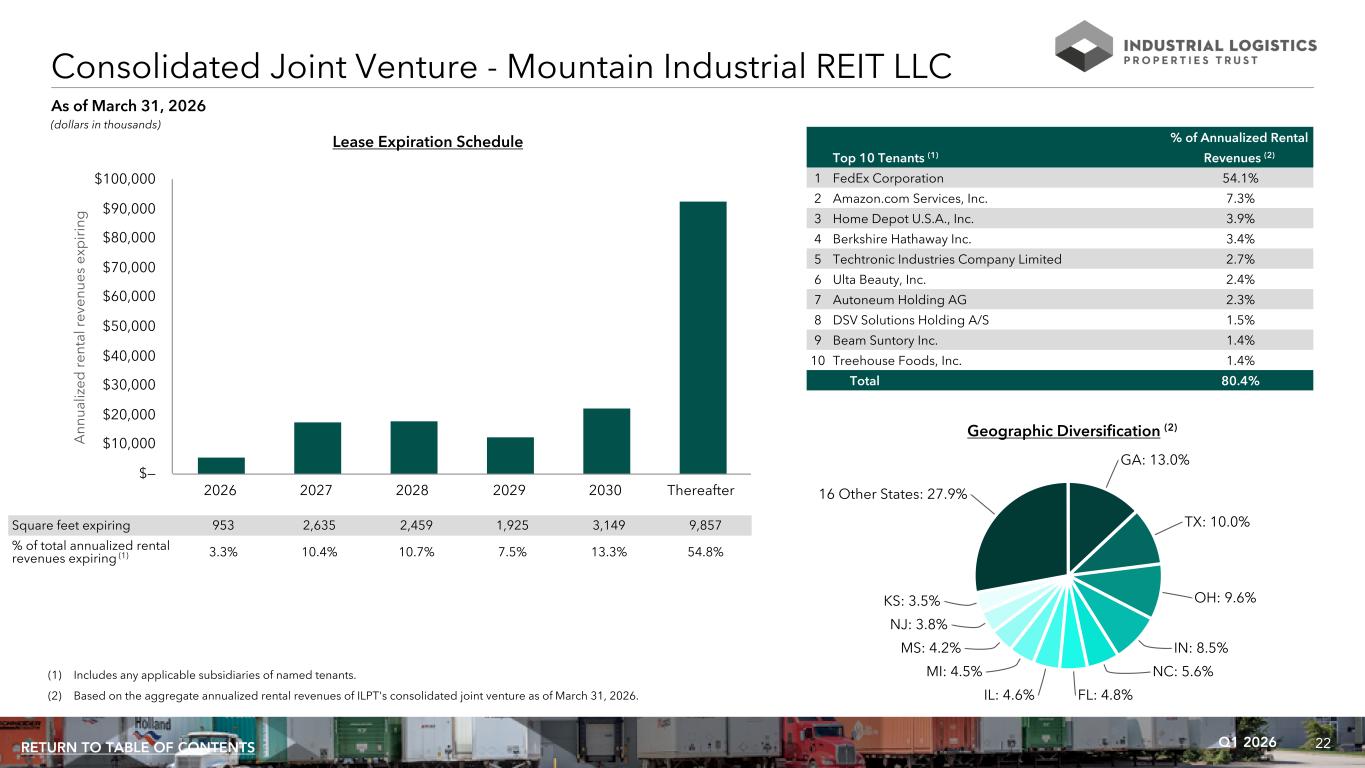
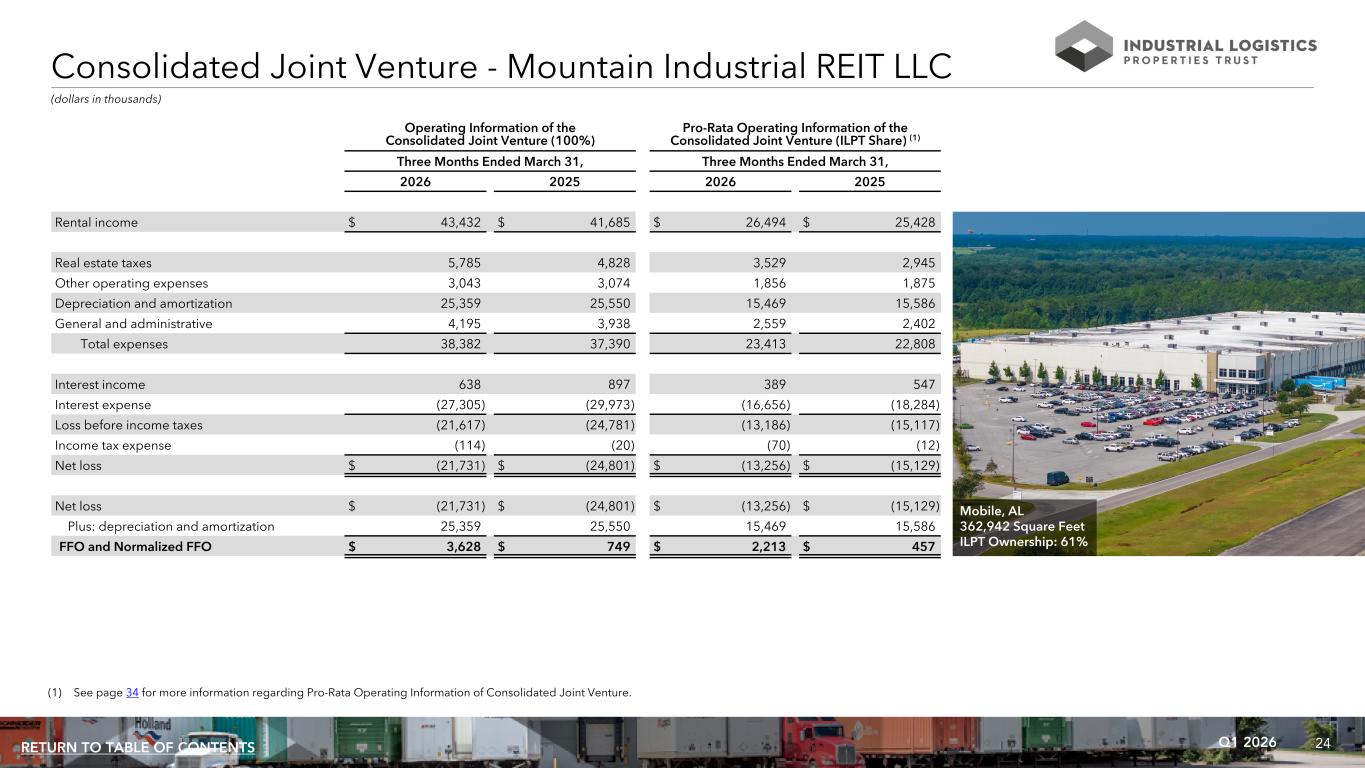
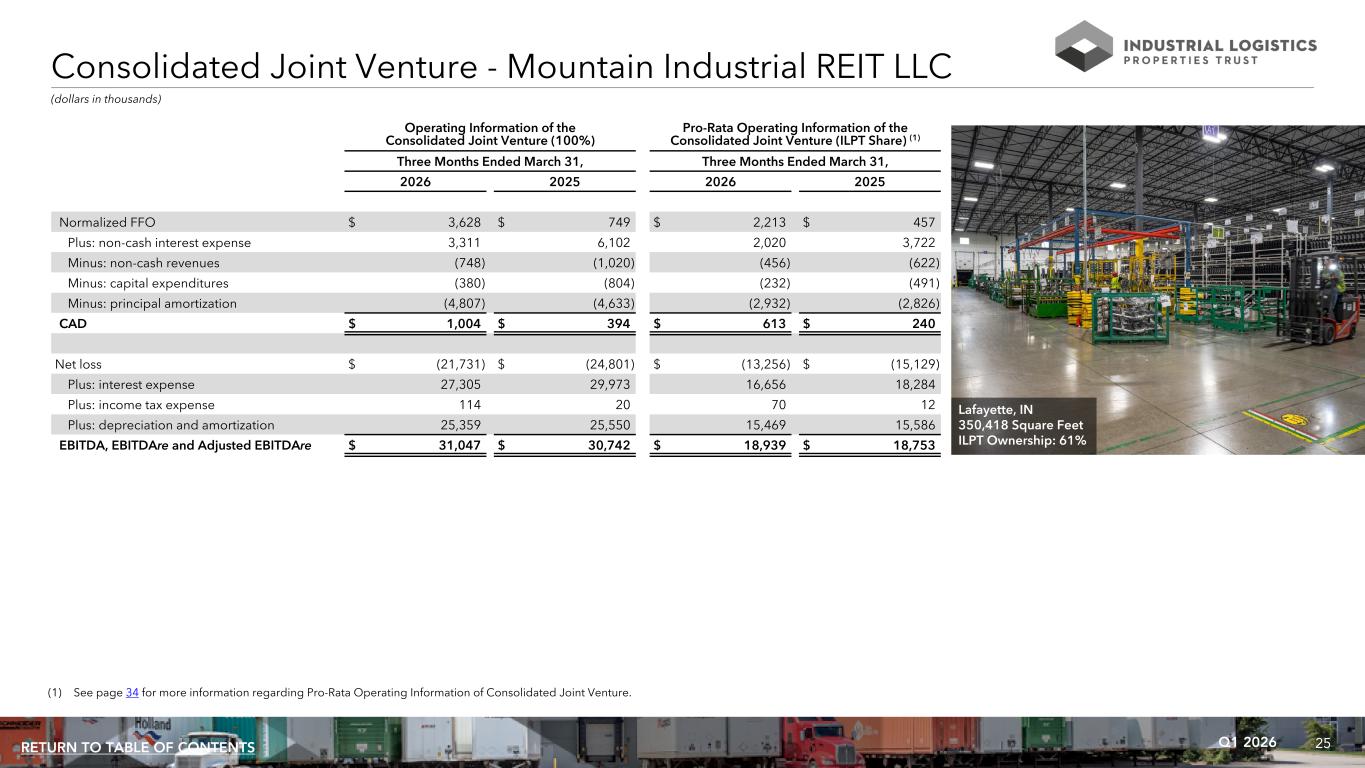
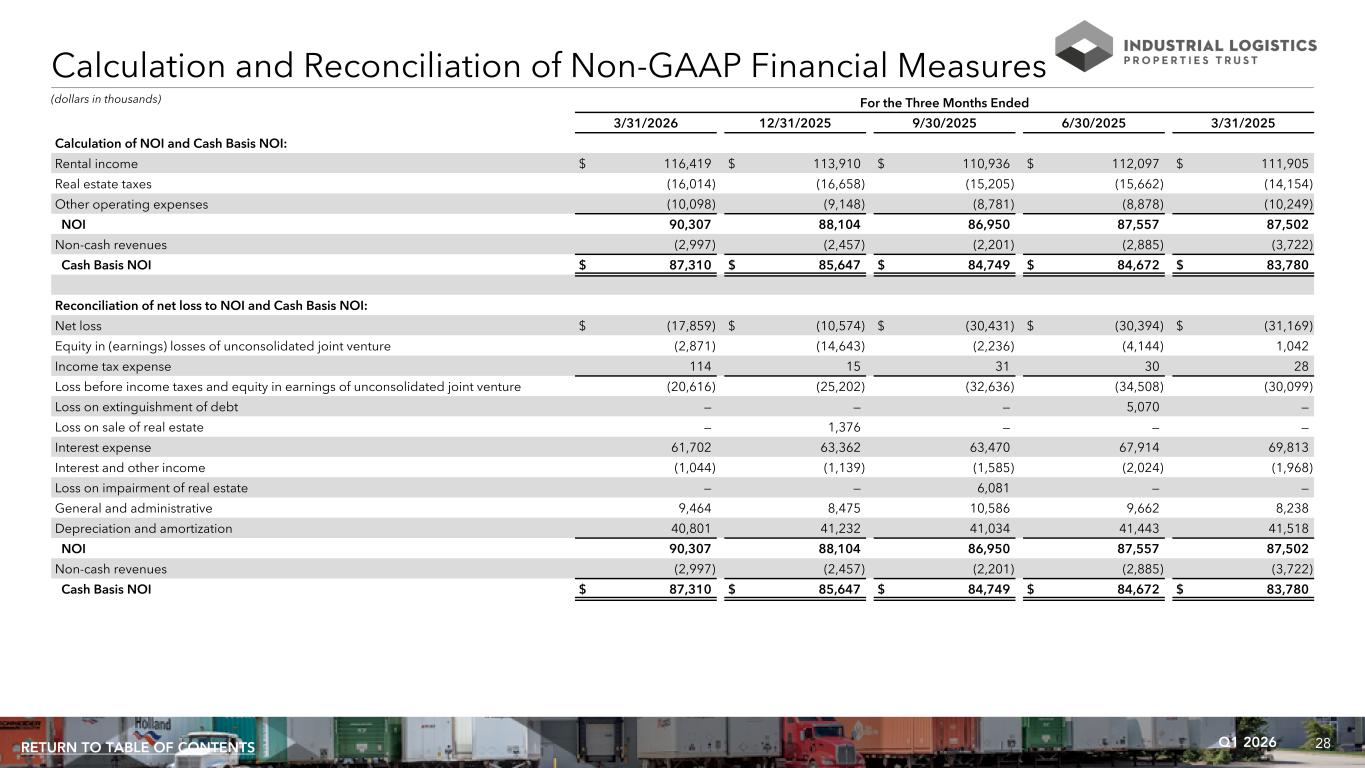
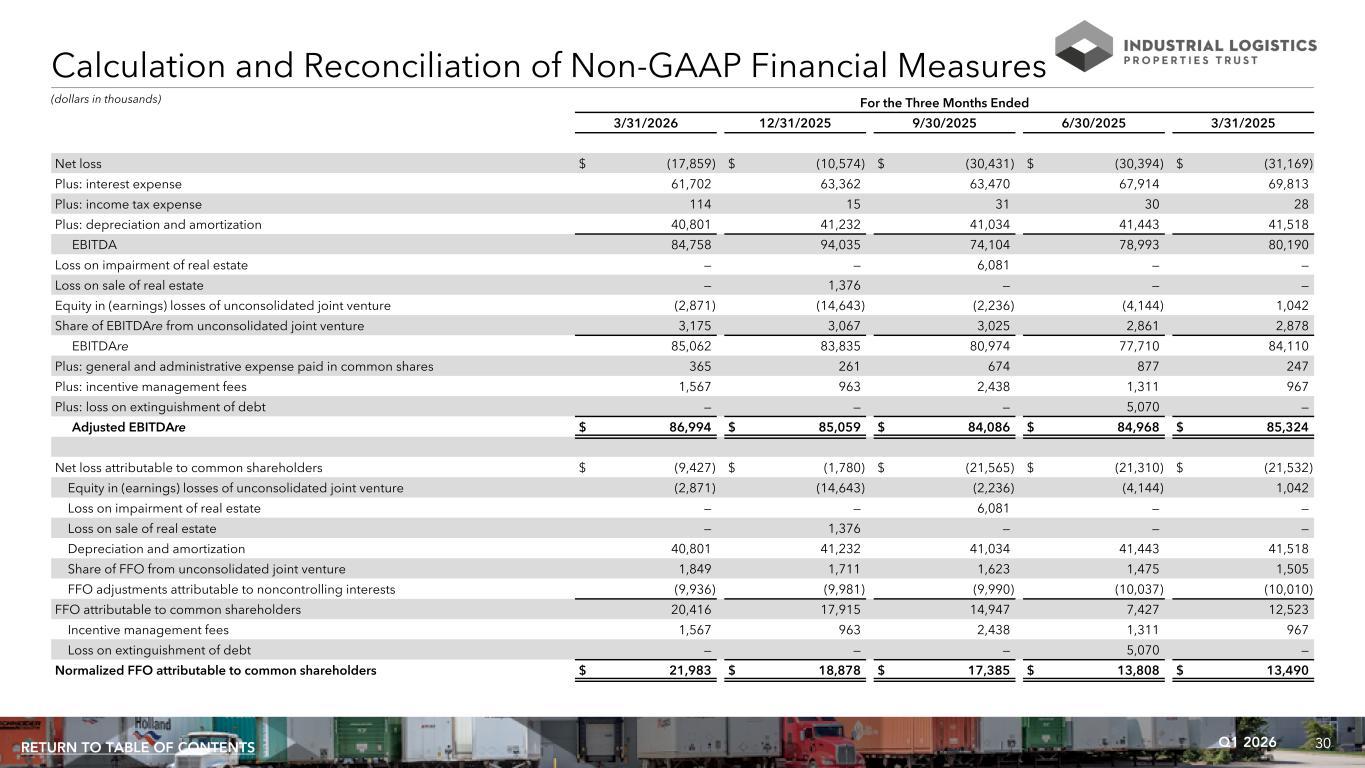
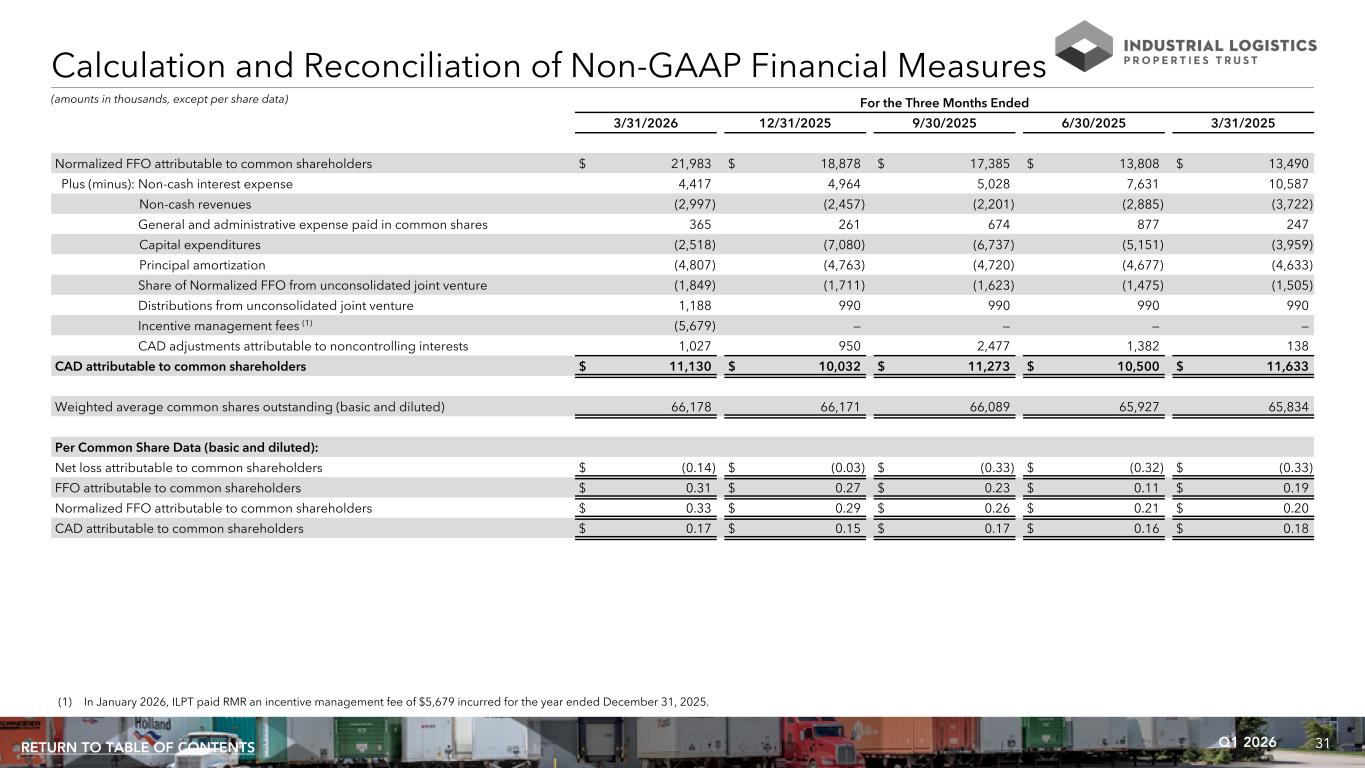
And good morning, everyone. Yesterday, we reported first quarter normalized FFO of $22 million, or $0.33 per share. These results exceeded the high end of our guidance by $0.02 per share, driven by one-time revenues and fees totaling $1.1 million. Normalized FFO grew 16% on a sequential quarter basis and 63% compared to the same quarter a year ago. Same property NOI was $90.3 million. Same property cash basis NOI was $87.4 million, and adjusted EBITDA RE totaled $87 million, each increasing on a year-over-year and sequential quarter basis. Turning to our balance sheet, we ended the quarter with cash on hand of $100 million and restricted cash of $86 million. Our net debt-to-total assets ratio declined modestly to 68.8%, and our net debt leverage ratio improved to 11.6 times from 11.8 times. Last week, we priced $1.6 billion of five-year fixed-rate interest-only mortgage financing for our consolidated joint venture at 5.71%. We expect to close the loan on or about May 8th and plan to use the proceeds to refinance the joint venture's existing $1.4 billion floating-rate loan and $205 million of fixed-rate amortizing debt. The new debt is secured by the same 90 mainland properties as the existing borrowing. With this refinancing, our consolidated joint venture will unlock nearly $20 million in annual cash flow by eliminating its amortizing debt and the need to purchase interest rate caps. Additionally, all of IOPT's consolidated debt will be fixed rate, limiting our exposure to market interest rate volatility with a weighted average interest rate of 5.48% and no debt maturities until 2029. Turning to our outlook, we introduced full-year guidance in our earnings presentation issued last night, in addition to the quarterly guidance we have been providing. For the second quarter of 2026, we expect interest expense of $61.5 million, including $59 million of cash interest expense and $2.5 million of non-cash amortization of deferred financing fees, Adjusted EBIT to RE between $85.5 and $86.5 million. And normalized FFO between 31 to 33 steps per share. For the full year 2026, we are guiding to interest expense of approximately $245 million with cash interest of $234.5 million and non-cash interest of $10.5 million. Adjusted EBITDA RE between $344 and $349 million. And normalized FFO between $1.27 to $1.34 per share. This guidance reflects the impact of our Consolidated Joint Ventures refinance. It also assumes our vacant property in Indianapolis is leased in June 2026 and does not include the lease of our Hawaii land parcel. In closing, we are pleased with the meaningful progress that ILPT has made over the past year, refinancing our floating rate debt and enhancing cash flow. As we look ahead to the remainder of 2026, we are focused on building on this momentum, advancing our growth initiatives, and creating long-term value for our shareholders. That concludes our prepared remarks. Operator, please open the lines for questions.
Operator
Thank you very much. We will now begin the question and answer session. To ask a question, you may press star, then one on your touchstone phone. If you're using a speakerphone, please pick up your handset before pressing the keys. If at any time your question has been addressed and you would like to withdraw your question, please press star, then two. At this time, we will pause momentarily to assemble our roster. Our first question comes from Mitch Germain with Certificance Bank.
Please go ahead. Thank you very much. Can you guys provide some sensitivity from the top to the bottom end of the guidance range, please?
Meaning what will impact the – Exactly.
Like what factors bring you from the bottom and what factors take you to the high end of the range?
Sure. I mean, sometimes we have one-time reimbursement, those types of things, or one-time fees. They're usually not very large. So, that's the accounting for the $1 million range in the guidance.
Gotcha. Okay, that's helpful. Obviously, your interest rate is pretty much fixed at this point. So, maybe provide some perspective on the Indianapolis lease. I know that this has been, you know, a big burden for you guys, a big priority strategically. specifically, do you believe it becomes income-paying, June? How should I think and maybe just provide some perspective on the economics? Are we looking at rents going higher? Maybe if you can provide some details on that, please.
Sure. Hi, Mitch. So, we anticipate the lease to be signed in June. There will be a minimal a free rent of four months. So, we'll start seeing the cash in the back half of the year, and it will be at a roll-up in rent.
Great. And then, last question for me with regards to the recent debt. Does it offer some flexi—more flexibility from the Covenant perspective with regards to your ability to potentially look to sell some assets? And then maybe just broadly speaking, do you think that asset sales might become more of a strategic priority?
So, there is a 24-month lockout period in the new debt.
And then I will add, I think with the leasing of this property in Indianapolis, it does, it will allow us flexibility on the a $1.16 billion debt to be able to look to sell properties in that pool. So, while we might not be able to, in the short term, have dispositions within Mountain, we will have greater flexibility now that we've gotten this Indianapolis lease completed.
Thanks, and appreciate the guidance.
Operator
Thank you. Again, if you have a question, please press star, then one. Our next question comes from John Masoka with B. Reilly. Please go ahead.
Good morning. So, maybe can you walk us through what the 1.1 million of one-time items were in the quarter, and I guess, is that kind of why guidance is calling for, I guess, a step down in 2Q versus 1Q at the midpoint?
Yeah, that's exactly why. So, there was $650,000 of percentage rent that gets trued up that happened this quarter. And then we also had $450,000 of a one-time remediation fee related to a move out that has already been released.
Okay. And the percentage rent kind of true up, is that something that could hit in any given quarter, or is that usually a 1Q item?
It's always a 1Q item. We just never know what the amount will be or even if it will be incremental to us.
And kind of post the debt transaction and now kind of your balance sheet really pretty set, how are you thinking about utilizing the kind of cash balance today? You know, talk a little bit about dispositions, maybe using that in the cash to pay down debt potentially, or would you even potentially look into the acquisition market? I'm just kind of curious how you're thinking of kind of managing the cash outstanding, given there's a little more certainty from a debt out of your balance That's a good question.
I think we're kind of evaluating all of our options right now. You know, we want to make sure that we have cash on the balance sheet to address our tenants' needs. We have a couple of tenants we're in early discussions with who are looking at potential building expansions that they want us to partner with them on. So we want to make sure that we, you know, have half that cash available to us. So I think it's early stages. We'll see where we shake out and then go from there.
And I know those are potentially unique situations, but how do you think about, like, a return threshold if you get back into the market of deploying capital?
I think that we're certainly in a better position today. than we were even a year ago. So I think that's something that, you know, we're always considering with the board.
No, I didn't know if you were asking about property acquisitions specifically.
Well, property acquisitions or even kind of investment. I mean, I know investments with existing tenants, you know, there's other considerations at play there. But if you were to get back into the market, like how would you kind of view the current cap rate environment versus where you'd want to deploy capital? Are there things that are attractive out there today, especially given it would probably be coming from cash on hand rather than newly raised capital?
I think given where our leverage is today, I don't see us looking to acquire any properties, at least in the short term, unless it's a very specific situation or an opportunistic one.
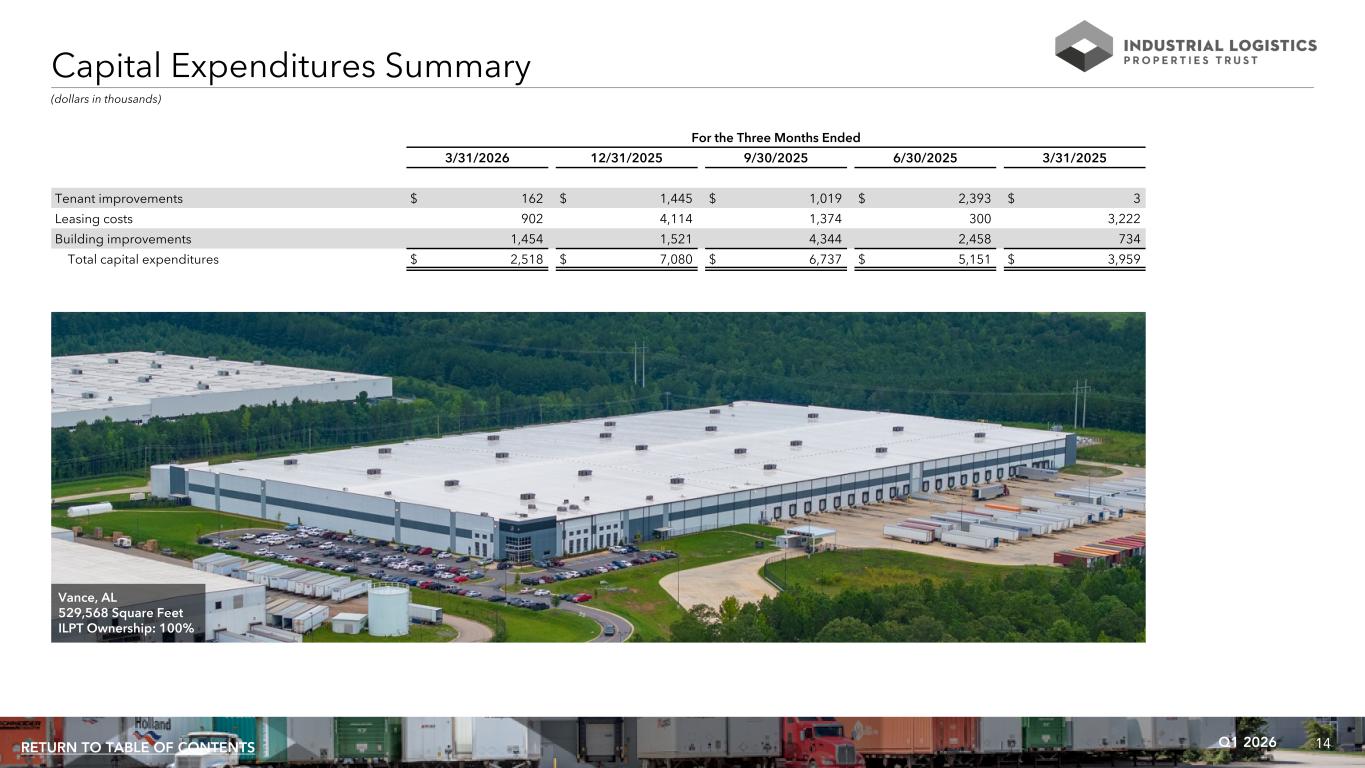
Okay. Okay. And then lastly, the CAPEX spending was down a little bit. I know 1Q can be a relatively weak period seasonally for CAPEX spend, but is that kind of more typical run rate should be, or was the current quarter a little bit of an anomaly?
The current quarter was an anomaly. I think Q1 can be down sometimes. That's not what we are forecasting going forward.
That's it for me. Thank you very much.
Thank you for joining today's call, and we look forward to meeting with many of you at the NAIREE conference in June. Please reach out to Investor Relations if you're interested in scheduling a meeting with ILPT. Operator, that concludes our call.
Operator
Thank you. The conference has now concluded. Thank you for attending today's presentation. You may now disconnect.