Operator
Hello, and welcome to Inseego Corp.'s Third Quarter 2025 Financial Results Conference Call. Please note that today's event is being recorded. On the call today are Juho Sarvikas, Chief Executive Officer; and Steven Gatoff, Chief Financial Officer. During this call, certain non-GAAP financial measures will be discussed. A reconciliation to the most directly comparable GAAP financial measures is included in the earnings release, which is available on the Investors section of the company's website. An audio replay of this call will also be archived there. Please also be advised that today's discussion will contain forward-looking statements. These forward-looking statements are not historical facts, but rather are based on the company's current expectations and beliefs. For a discussion on factors that could cause actual results to differ materially from the expectations, please refer to the risk factors described in the company's Form 10-K, 10-Q and other SEC filings, which are available on the company's website. Please also refer to the cautionary note regarding forward-looking statements section contained in today's press release. With that, I'd like to turn the call over to Juho Sarvikas, Chief Executive Officer. Please go ahead.
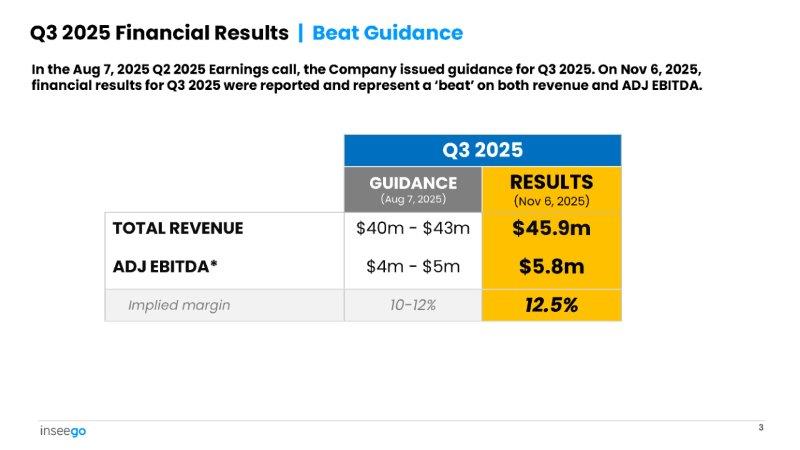
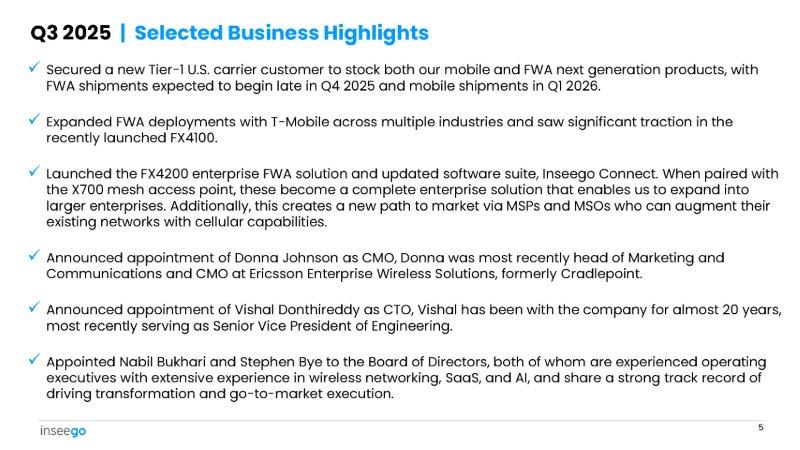
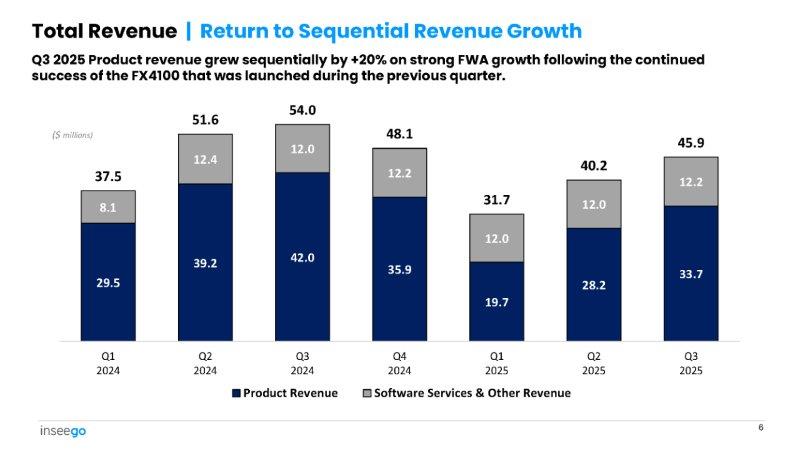
Good afternoon, everyone, and thank you for joining us today. Q3 was another strong quarter for Inseego. We generated revenue of $45.9 million and adjusted EBITDA of $5.8 million, both above guidance and marking our second consecutive quarter of sequential growth in both metrics. Operationally, we continue to execute on the growth strategy I laid out earlier this year. Our strategy focuses on scaling our core FWA and mobile solutions in the enterprise market while also evolving into a solutions company that integrates hardware, network management, and software into a single platform, enabling enterprises, carriers, MSOs, MSPs, and VARs to build their wireless practice on Inseego. Our progress in executing and advancing these strategic value creation goals this quarter is reflected on 3 key accomplishments. First, we extended our FWA leadership while continuing to drive mobile performance. On FWA, we did this by driving growth with the FX4100 and expanding our portfolio with the announcement of our premium FX4200, which extends our TAM. As we announced on our last call, we also added a third Tier 1 U.S. carrier across both FWA and mobile, starting to contribute revenue later in Q4. Second, we advanced the realization of our solution strategy with a major new release of Inseego Connect, expanding our software foundation for growth. And third, we further strengthened our leadership bench with the addition of seasoned C-level executives and 2 new operating experts on our Board of Directors, further enhancing our ability to scale and deliver sustainable, profitable growth. On today's call, I'll walk through these 3 key accomplishments, beginning with FWA. We continue to see strong demand for the FX4100 with T-Mobile, where deployments have scaled meaningfully across key verticals, including retail and utilities. These wins underscore the FX4100's ability to deliver enterprise-grade requirements across a broad spectrum of industries and company sizes. It's clear that our FWA solutions are gaining traction beyond early adopters and becoming a trusted primary option for mission-critical connectivity. In Q3, FWA customer demand exceeded our joint expectations with our partner, T-Mobile. On the supply side, our team executed with precision, ensuring products reach customers quickly and reliably to capture a meaningful amount of upside. This was a direct contributor to our Q3 financial results. Overall, FWA shipment volumes were up more than 50% year-over-year, underscoring the strong and growing enterprise adoption of our FWA solutions and the effectiveness of our go-to-market execution with carriers. Along that line, carrier diversification has also been a key area of progress. As we highlighted on our last call, we secured a new Tier 1 U.S. carrier win during Q3, which will begin selling both our FWA products and soon-to-be-announced new WiFi device. With this addition, Inseego is now aligned with 3 major U.S. Tier 1 carriers, broadening our reach and supporting share gains in both FWA and mobile hotspots. Building on this momentum, last week, we introduced the FX4200, the next phase of our FWA growth story, with shipments beginning in Q4. This premium-tier enterprise-grade product eliminates the traditional trade-off between capability and ease of use, delivering both advanced performance and simplicity. It creates a higher value tier in our portfolio, broadens use cases, and expands our market opportunities while maintaining the reliability and security Inseego is known for. When paired with the X700 mesh access point and our Inseego Connect SaaS platform, the FX4200 becomes a complete enterprise solution, expanding our TAM, creating SaaS attach opportunities, and supporting incremental recurring revenue growth. Importantly, the FX4200 also enables us to move upmarket into larger enterprises and creates a new path to market via MSOs who can augment their existing networks with cellular capabilities. For enterprises, the need is clear: reliable connectivity that is cost-effective and easy to deploy. For carriers, FWA creates new revenue streams and a faster return on network investment. What's been missing is the right solution, one that combines enterprise-grade features with ease of use and strong economics. That's where Inseego comes in. With our FX4200 platform and integrated solution stack, we're uniquely positioned to meet this need and create value for both carriers and enterprises. Together, these factors make FWA a compelling connectivity option, and Inseego is well-positioned to capitalize by expanding our product portfolio, adding new carriers, and deepening our engagement with MSOs, MSPs, and VARs. Moving to our mobile business. In Q3, mobile remained a solid revenue contributor, driven primarily by our largest Tier 1 carrier. We are also refreshing our MiFi product lineup and expect to be in market with all 3 carriers in Q1. Collectively, our FWA and mobile businesses are performing well. FWA is gaining momentum with new products and customer wins, while mobile provides a steady revenue base that will expand as our new Tier 1 carrier ramps. Together, these businesses create a stronger and more diversified growth platform as we head into 2026. On our second topic, solutions. In Q3, we advanced one of the 2 key growth vectors of our strategy with a major new release of Inseego Connect, our cloud-native SaaS platform for Inseego FWA and mobile devices and network management. This release elevates Connect from a supporting tool to a core part of our enterprise offering, tightly integrated with the FX4100 and the new FX4200. With zero-touch provisioning, integrated security, and APIs for large-scale deployments, Inseego Connect enables carriers, MSOs, service providers, MSPs, and enterprises to deploy and manage 5G edge networks more efficiently. Importantly, it also creates SaaS attach opportunities that expand our TAM and support recurring revenue growth. Also on the solutions side, our wireless provider subscriber management platform, Inseego Subscribe, adds further value by enabling carriers and service providers to manage users of wireless networks across any device, from onboarding and authentication to entitlements, policy controls, and billing. In doing so, Subscribe simplifies operations, improves visibility into network usage, and creates new monetization opportunities through subscription-based services to lower service providers' customer acquisition cost and operational costs. This overall progress underscores how we're executing on our strategy to evolve into a solutions company. As we scale these solutions and broaden adoption, having the right leadership in place will be critical to sustain this momentum, which brings me to our third topic, further strengthening our leadership team to support our next phase of growth. Along that line, we recently added a proven leader in marketing and a senior technology promotion on the leadership team. Donna Johnson joined as Chief Marketing Officer, bringing more than 20 years of enterprise marketing and channel experience. She most recently served as CMO of Ericsson Enterprise Wireless Solution following its acquisition of Cradlepoint, where she was a founding leader who helped establish the company as a pioneer in enterprise wireless edge solutions. Vishal Donthireddy was promoted to Chief Technology Officer, reflecting his 2 decades of innovation at Inseego. Since joining in 2005, he has led product development from 2G through 5G advanced, spearheading industry firsts and delivering award-winning hardware and cloud-managed solutions. In addition to these management team adds, I'm thrilled to welcome 2 accomplished operating executives to our Board of Directors. Nabil Bukhari, President, AI Platforms and CTO at Extreme Networks, has led the company's transformation into an AI and SaaS-driven networking leader. Nabil brings deep expertise in product innovation, subscription models, and scaling cloud platforms with a track record of turning advanced technologies into customer-ready solutions. And Stephen Bye, President and CEO of Ookla, who brings more than 30 years of leadership across carriers and broadband providers worldwide, including DISH, EchoStar, Sprint, Cox, AT&T, Telstra, and Optus. Stephen has been at the forefront of connectivity evolution from DISH's 5G build-out to the emerging frontiers of 6G and satellite services with extensive operational and strategic expertise in scaling networks. Both Nabil and Stephen are recognized thought leaders whose operating experience in SaaS, AI, and carrier strategy will be invaluable as we expand our solutions portfolio and accelerate Inseego's transformation. With these leadership additions, combined with the execution we've delivered through 2025, we are well-positioned to build on our momentum as we close the year and move into 2026. Since joining Inseego in January, I've been proud of what the team has accomplished. In less than a year, we've set out a compelling strategy, broadened our customer base, refreshed and expanded our solution portfolio, and strengthened our leadership bench, creating a scalable platform for sustainable growth. Looking ahead, our focus is clear: drive sustainable growth, SaaS-enabled solutions, deeper customer partnerships, and disciplined execution. With that, I'll turn it over to Steven to review our financial results and outlook in more detail. Over to you, Steven.
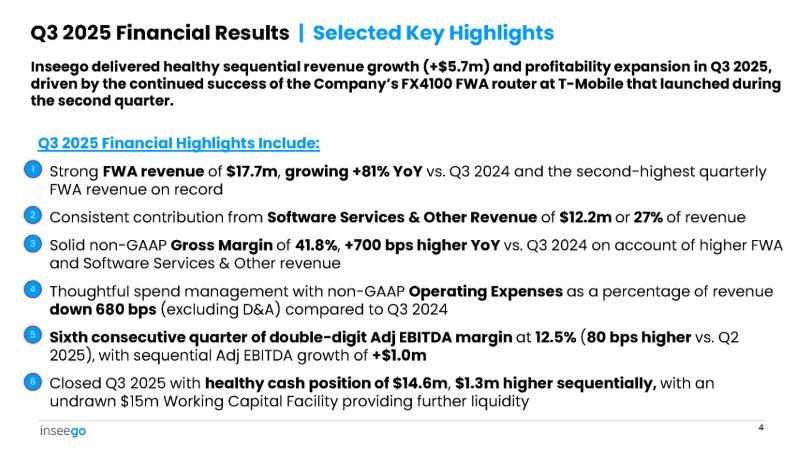
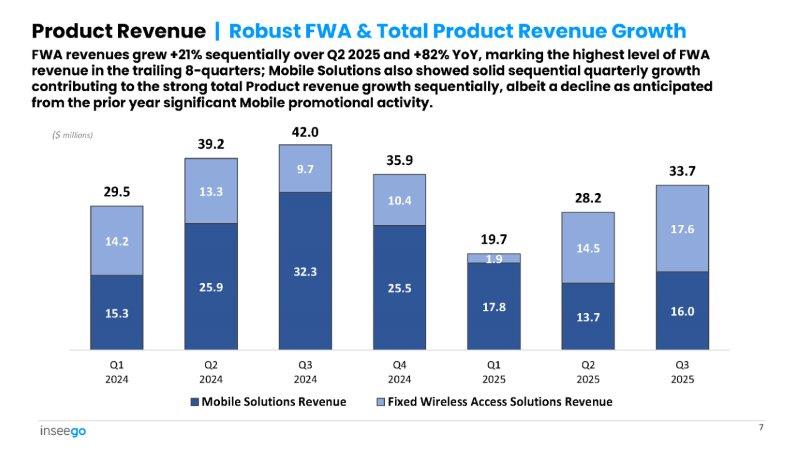
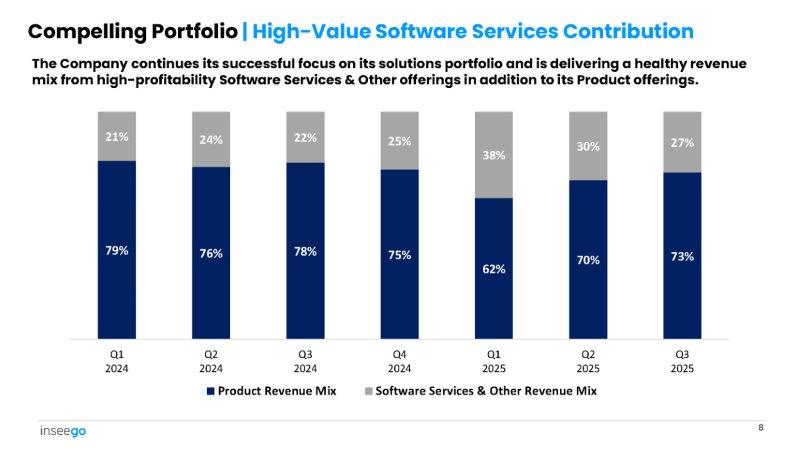
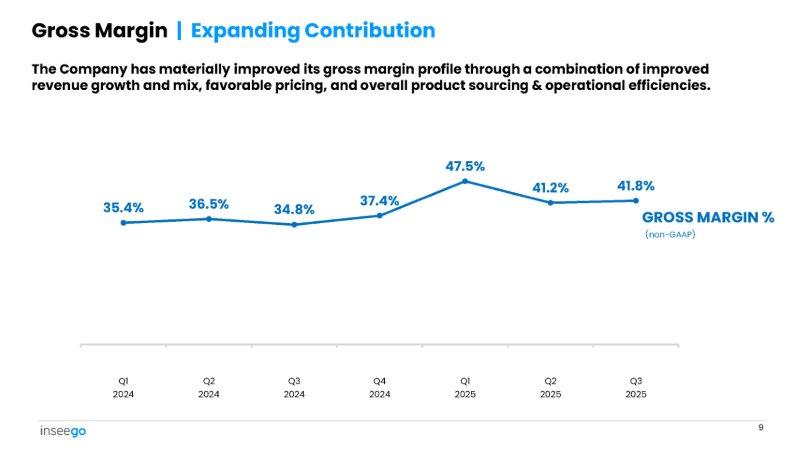
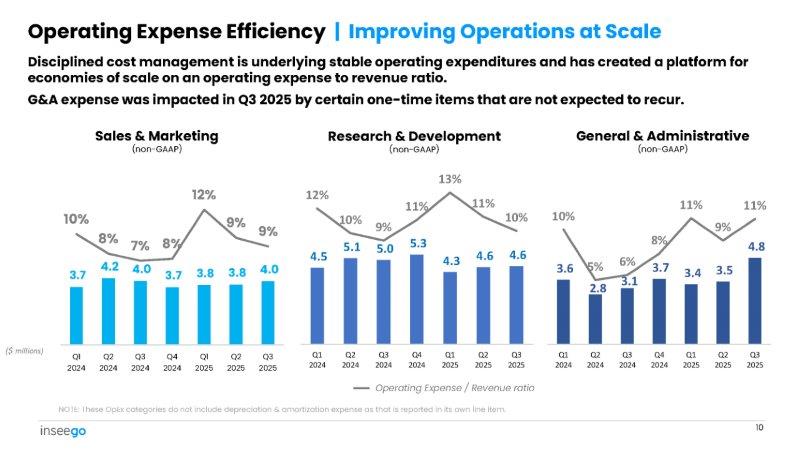
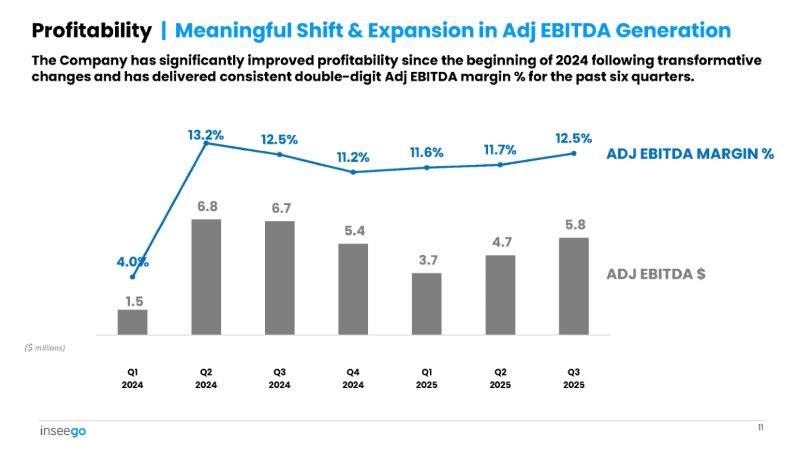
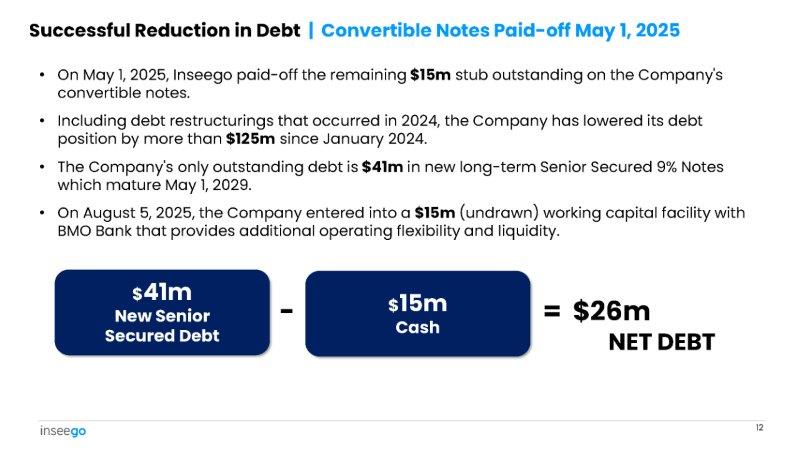
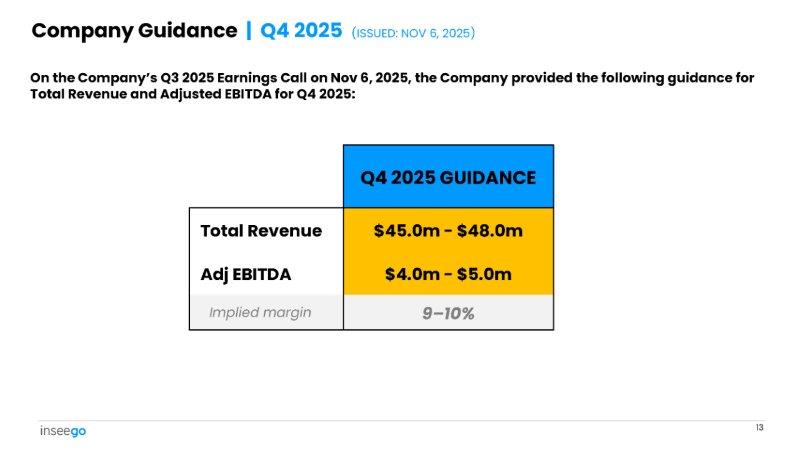
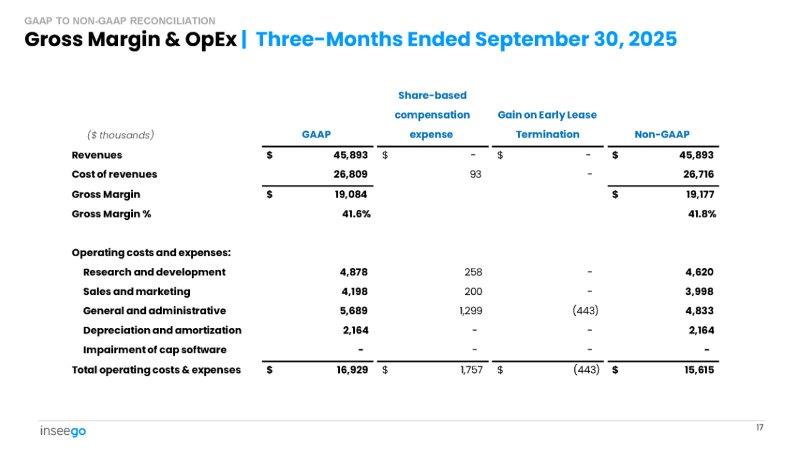
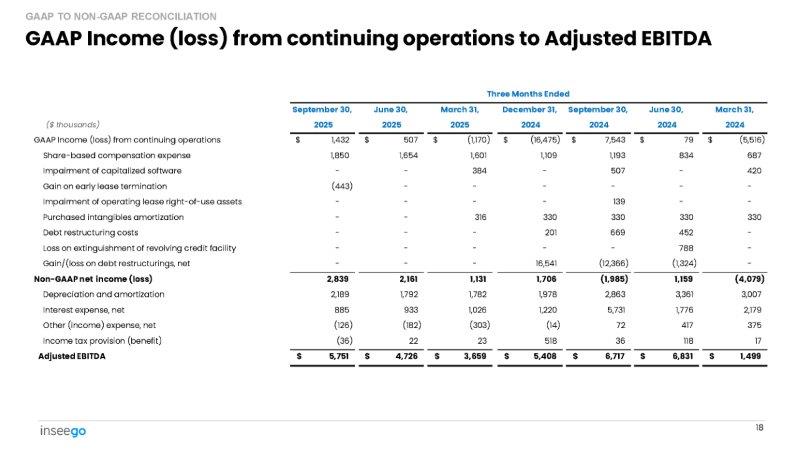
Thanks, Juho. Hi, everyone. Thank you for joining us. I'd like to cover 3 topics today. First, I'll take you through our Q3 2025 financial results. Second, I'll provide a brief update on our capital structure. And third, I'll share some color on the financial profile of the business and provide guidance for Q4 2025. As we always do, we'll wrap up by opening the call to your questions. Let's start with Q3 results. We delivered our second consecutive quarter of sequential revenue growth, as you just heard Juho highlight. That performance was again paired with strong gross margins and with an efficient spend profile, we also delivered meaningful operating leverage and sequential growth in adjusted EBITDA and adjusted EBITDA margin. On the top line, total revenue for Q3 was $45.9 million and was driven by 3 dynamics: one, a particularly strong ramp in our FWA FX4100 product following its Q2 2025 launch, as Juho talked about; two, solid volumes of our MiFi M3100; and three, continued solid contribution from our software services offerings. It's notable to call out that FWA revenue was the second highest in company history and surpassed mobile hotspot revenue again this quarter, which is now the third time that's occurred. That crossover is a tangible data point of our strategy at work, scaling FWA over time, shifting the revenue mix, and positioning the company for durable growth. As we've communicated, mobile revenue came in lower year-over-year as expected, reflecting the record carrier promotion in 2024. As a bit of a preview to our guidance, we see mobile revenue growing sequentially in Q4 2025 from a more fulsome contribution from an expanded customer set and products as new programs launch and our product line refresh begins to hit the market. Our software services revenue, which is comprised of our Inseego Connect MDM cloud offerings for Inseego devices and our Inseego Subscribe SaaS offering for mobile subscriber acquisition and management, came in at a consistent $12 million as expected, providing stable high-margin revenue and profitability. Non-GAAP gross margin was 41.8% in Q3, reflecting a favorable product mix year-over-year and particular strength in FWA. Non-GAAP operating expenses came in at $15.6 million, reflecting some nonrecurring one-time items in G&A and an increase in D&A on our decided investments in new products that are coming to market. Pulling this all together, Q3 2025 adjusted EBITDA was $5.8 million, up sequentially and at a margin of 12.5%, the third highest in more than a decade. We ended Q3 with a solid $14.6 million in cash and healthy working capital, and leverage metrics provide that flexibility as we continue executing on our growth initiatives. We also closed the quarter with a very manageable total debt balance of $40.9 million or approximately 2x LTM adjusted EBITDA. That balance sheet strength is the foundation for how we run the business, and it leads directly to my second topic, our continued capital structure strengthening. Last month, we took the prudent step and filed a universal shelf, a move that we believe enhances our financial flexibility and ensures we remain well positioned to execute on our growth strategy. The shelf complements other actions we've taken to increase financial flexibility, including a $15 million revolving credit facility that we put in place in August and of course, the reduction of more than $130 million in debt over the past year or so. Altogether, these actions strengthen our balance sheet, provide additional flexibility to invest when and where needed to drive growth and support long-term shareholder value. With that context on our capital position, let me now turn to our guidance for Q4 2025. 2025 has been a foundational year as we invested in and scaled new products, advanced our software platforms, and won the third Tier 1 carrier customer on both mobile hotspot and FWA. We're starting to see the business evolve along the strategic lines that Juho set out for Q4 2025, reflecting those initiatives, we're looking to drive continued sequential revenue growth over Q3. That's particularly notable as our business has been somewhat seasonal with Q4 being marginally lower than Q3 for each of the previous 3 years. We expect growth in Q4 2025 despite the fact that Q3 was just a record FWA quarter. Q4 2025 mobile revenue is showing particular strength and is expected to generate solid sequential growth in Q4 2025. We're seeing higher volumes at our carrier customers, a nice reflection of our expanded offerings across our customer base. On FWA, while we expect our offerings to deliver a strong quarter in Q4 2025, we also just saw a record quarter in FWA in Q3, and so we're not expecting that same elevated revenue level in back-to-back quarters. Finally, software services revenue is expected to remain consistent at approximately $12 million. In terms of margins, non-GAAP gross margin is expected to be modestly lower in Q4 2025 on a greater proportion of mobile hotspot revenue, more consistent with historical levels in the high 30s on a percentage basis. One aspect of COGS that we'll talk more about as we move into 2026 is the global dynamic of rising costs in the memory market that is impacting everyone. We don't see a material impact for Q4 2025, but with the large players shifting capacity to cater to AI, along with other buyers across the industry, we're seeing a tightening in the market. We're comfortable with the current dynamics and have fully factored that into our expectations for Q4 2025. We'll keep you posted as we move into 2026. Turning to non-GAAP operating expense. For total OpEx dollars in Q4 2025, we expect an increase in sales and marketing to drive growth and in R&D as we fund new products, as we've discussed. Our robust new product launch is also expected to drive higher levels of capitalized software development costs in Q4. Importantly, we're driving efficiencies across the company and expect G&A to improve as a percentage of revenue going forward. Pulling this all together, we're providing the following guidance for Q4 2025 total revenue in a range of $45 million to $48 million and adjusted EBITDA in a range of $4 million to $5 million. With that, we appreciate your time and support. We're glad to open the call for questions.
Operator
And your first question today will come from Scott Searle with ROTH Capital.
Speaker 3
Nice job on the quarter, guys. Steven, maybe to start on Subscribe and Connect. As you started to make some changes in investment, I'm wondering if you could take us through how the monetization changes and how you go to market and access to the channel, how we should be thinking about how that ramps up in '26 and beyond?
So, maybe I'll start with the Inseego Connect part. Today, we have a strong attach with our FWA together with the lead big carrier partner. What we've done and what's really important to understand with the FX4200 launch is that we've graduated Inseego Connect from what you could look at as a support tool to a core part of the enterprise platform. We're driving usage to the cloud. The FX4200 will do a couple of things for us. It's going to expand our presence with the MSPs and MSOs as well as provide expansion with the carrier channel. So what you can expect to see with the FX4200 and with sequential launches is a richer value capture when it comes to what I would call device cloud.
And then good question. On Subscribe, the counterpart on the software services, it's a piece of the business, Scott, that you know and as others know, we've begun to invest in. It's a really compelling part of the portfolio that complements what we do with our carrier customers and our MSOs and all of the strategic service providers that have similar wireless subscriber models. And so we continue to invest in that. We just onboarded and hired 2 executives in that business. And so they're getting up to speed right now. And so 2026 is what we look to be a growth year in that part of the business on the software side.
Speaker 3
Very helpful. Looking ahead to the first quarter, you mentioned sequential growth in the fourth quarter, noting some typical seasonality as carriers usually reduce their inventory levels. However, with the anticipated new product launches and increasing carrier wins, will the first quarter show different seasonality? Can we expect sequential growth to start a bit higher in the first quarter as we move into 2026?
Yes, a really good point. And also just to clarify a bit, part of the reason that Q4 is 'seasonal' is just fewer selling days and weeks at the risk of stating the obvious with the last 2 weeks of December and the Thanksgiving week is just 3 fewer weeks. And so there's a little bit of math, less so industry dynamics. Whereas what you said in our view, Scott, is that you do see some end-of-year buying and inventory management so that sometimes January is a slower month. Q1, it's been a little bit different year-to-year here, but we are focused on making the most as we go into the year.
And Scott, on your note on this new carrier ramp and broad renewal, I believe we mentioned this in the prepared remarks. But when it comes to MiFi, the new carrier customer will start recurring revenue in Q1. In addition, we're renewing the existing 2 MiFi customers in Q1. What you should expect to see us do is to enter a, I'll call it, a higher velocity price point in the market, drive significant share gains when it comes to volume share and with that, continue to drive MiFi growth. Meanwhile, in FWA, the new carrier, we will start shipping a bit later in Q4. And then, of course, with that, we'll be in full motion with the new carrier with the FX4200 come Q1.
Speaker 3
Got you. And if I could, just one last one, Juho, I guess from a higher level conceptual view of the industry, there's been a lot of different dynamics going on, starting with AT&T buying EchoStar Spectrum. So a couple of things. I'm wondering, how are you seeing that kind of play out into 2026 in terms of investment and growth in FWA in general. With the 4200 as well, you put a stake in the ground with more processing power at the edge. And I'm wondering how that's driving not only adoption cycles from a carrier perspective, but also revenue-generating opportunities for Inseego with recurring and otherwise. And then maybe just some thoughts as well in terms of the competitive landscape. It seems like you guys continue to gain share. Just kind of curious as to your high-level thoughts in terms of what you're seeing on the competitive front.
Scott, excellent set of questions. Let me start with the opportunity when it comes to wireless broadband, you're correct. Like if you look at the addressable market today, I would say that it's heavily constrained by available spectrum, right? Because the carrier needs to make sure that they take care of the high ARPU mobile customers. What happened with the EchoStar transaction with AT&T is that AT&T's mid-band assets dramatically increased. And that's really the sweet spot for FWA deployment. You might have seen there was some new news from the FCC this week that they're looking at releasing more upper C-band, I believe it was 150 megahertz. All of this creates significant opportunity for the carrier to drive more FWA deployment. Why I think that we're extremely well positioned to capture on that opportunity is that we operate in the enterprise or in the business segment of the carrier portfolio, which obviously has a higher ARPU for the carrier than the consumer FWA. In addition, if you look at the business FWA or enterprise FWA, it consumes on average 1/8 of the network resource or bandwidth of a consumer household. I think that trend is going to be extremely favorable for us, and we look forward to being the partner of choice for the carriers with our solution offer, which is really designed to deliver enterprise-grade wireless broadband that's easy to use, easy to deploy, and fits well with the carrier go-to-market motion where we also have significant investment. The opportunity space is huge. And to your point, continues to expand. One of the key things they are becoming spectrum availability. There's competition in the marketplace. But my very simple view here is that I think we have a unique position. On the other end of the spectrum, you have consumer-grade, you could call it white label FWA. And then you have very heavy complex, high cost of ownership solutions. We want to be that partner that's capable of driving mass scale deployment in strong alignment with the carrier and also starting with the MSOs and the MSPs like we mentioned in the prepared remarks.
Operator
And your next question today will come from Christian Schwab with Craig-Hallum Capital Group.
Speaker 4
Congrats on the great quarter. As you look to the new customer ramping on both fixed wireless and mobile, can you give us an idea of the range of potential outcomes over the calendar '26 from revenue from this customer?
If you examine the addition of new customers, the hotspot or MiFi market can be viewed as evenly split among the three carriers. We have now addressed the previously missing portion, which we anticipate will lead to significant growth in volume. Although there is a decline in average selling price in this category, we expect that to be balanced out by an increase in volume, which gives us strong confidence regarding the MiFi segment. Regarding fixed wireless access, we have a distinctive initiative with T-Mobile, one of the major Tier 1 carriers, and we are eager to forge a similar partnership for fixed wireless access with our new carrier customer.
Speaker 4
Great. My second question relates to the software business, particularly regarding the expansion of this customer and some of your other Tier 1 clients. I believe a significant portion of your software revenue comes from T-Mobile. Is there a chance that by calendar '26, T-Mobile or any other Tier 1 customers could start using the same software platform to manage their networks?
Yes, Christian, that's an excellent question and aligns perfectly with our previous discussion. We share your perspective and see significant potential for Subscribe Inseego. Subscribe is a wireless subscriber IoT device management platform that is agnostic to all devices and carriers, operating as a SaaS solution. As I mentioned earlier, we have recently onboarded new leadership roles that did not previously exist at the company. The Board and executive team are dedicated to investing time, resources, and capital to develop this platform, based on the opportunity you've highlighted. We have a strong relationship with a major Tier 1 customer, which is fantastic, and there's no reason we shouldn't expand our customer base further.
And if you look at the Inseego Connect, which is the device attached cloud, obviously, the name of the game is installed base. So I'm very happy with the solution that we've built, and now it's a matter of scaling that in the marketplace with a strong FWA attach. So if you take a longer time horizon a couple of years out, that's going to be a meaningful growth trajectory for us as well.
Speaker 4
Great. And if I could just sneak in one last question regarding Scott's question on the market share gains in the competitive environment. Do you see an opportunity as you roll out new products targeted to the distribution channel and potentially less foreign competition?
I'm sorry, can you repeat the last part? I'm not sure if I heard you.
Speaker 4
But potentially, the competitive front and some competitors might not be able to sell here. Is that an opportunity for you or not really?
Yes, yes, definitely. So we're actually uniquely positioned in that we have our engineering team here in San Diego, critical IP created in San Diego. If you look at the latest movement and everything that's being discussed, should there emerge an environment where for national security or for other reasons, the U.S. and North America would prefer a domestic supplier is a great opportunity for us, absolutely.
Operator
And your next question today will come from Lance Vitanza with Cowen.
Speaker 5
Can you hear me okay?
Speaker 5
So let me start with just sort of to follow up on the Tier 1 carrier contract. You mentioned that the FWA shipments begin over the next month or so versus mobile shipments beginning early in 2026. And I'm wondering, are we supposed to read anything into that staggered timing? Is FWA definitively a bigger priority either for you or with this customer or for the customer in general? And related to that, as you look out 1 to 2 years from now when sort of the dust is sort of settled, so to speak, how should we think about the volume mix in terms of units between FWA and mobile with this new Tier 1 customer?
Lance, great question. You might remember earlier in the year, what I was saying is that the product development and let's call it, design win cycle is 9 to 12 months. It's a simple matter of when we close on the opportunity and how long it took to develop the solution, the right maturity that we're able to ship. So we're equally excited about both hotspot and FWA. From a mobile to FWA mix perspective, mobile, again, because it's a large market controlled by a couple of large carriers, you will see a significant uptake from a volume standpoint of view when we start shipping with the new customer. But mobile is also a fairly confined space. I don't necessarily expect to see significant market growth in mobile. Meanwhile, our thesis is that the FWA enterprise opportunity, whether that is through the carrier MSO or MSP, we are only at the early stages of that. We expect to see market growth and of course, share gains within that market.
Speaker 5
That's helpful. And then one other question. There's been action at the FCC against 'untrustworthy gear' coming from foreign adversaries. And I'm wondering if this is something you're following. It looks like the FCC voted last week to close loopholes, which could cause network operators to actually go ahead and replace components in their networks. Is this something that could favorably bear on results in 2026 for you? And are you contemplating any of that? Or is this just beyond the scale?
Lance, I think this is a really important opportunity space for Inseego. And again, as a North America is U.S. OEM, we're uniquely positioned to capitalize on that. I think it's very good that the focus is in addition to the infrastructure, the macro network, where actions have already been taken. To me, it makes a whole lot of sense that the focus is now moving into the CPE or the broadband devices, whether that's hotspot or FWA and even looking at a level deeper where the IP is designed in U.S. as opposed to perhaps white labeling Chinese design, Chinese software. So I see this as a significant upside opportunity for us as a company.
Operator
And your next question today will come from Nick Rubino with Stifel.
Speaker 6
This is Cam Tierney on behalf of Tore Svanberg at Stifel. Congrats on the quarter. I wanted to explore the Inseego Connect API that you launched last quarter. I'm interested in any early insights you have regarding that. Have you received any feedback from customers about how they're utilizing it or if it's influencing service revenue attach rates?
That's a great question. Thanks for joining us. We had our Channel Advisory council two weeks ago, and one of my biggest takeaways was that the APIs we built this year were a fantastic investment, with overwhelmingly positive feedback. We aim to be the best partner, whether you're an MSP, MSO, or a carrier. There are situations where it makes sense for the service provider to use our Inseego Connect device management as a single pane of glass, allowing us to integrate our solution into a total offering. That's exactly what the APIs accomplish. They are crucial as we expand into MSOs, particularly for MSO cellular failover use cases, and are essential for engaging with the MSP community.
Speaker 6
Okay. Awesome. And then second question is, I just wanted to drill down a little bit more into the FWA sort of longer-term view. Obviously, the last couple of quarters, it's sort of exceeded the mobile business significantly. I'm curious if that's sort of more of a longer-term trend that you guys are seeing? And maybe could we expect then into 2026 and beyond? Or is that sort of more short-term chop in the business?
Yes. No, good question and a very important clarification to get out there for sure for how you're thinking about it, which is FWA is an important growth driver now and going forward. So we don't see it as chop. And if you go backwards in time, it probably was. It was more kind of one-off for various reasons. But the product portfolio, the technology, the customer breadth is much more diverse now and going forward. And so you're seeing a more steady growth CAM going forward. And so we see that contributing to both dollars and growth rate going forward.
Yes. Maybe to double-click on that, the strong Q3 on FWA was driven by our large carrier customer. In Q4, we diversified both in terms of add incremental revenue streams, both in terms of the new product and also in terms of new channels. So you should absolutely expect to see us further expand our portfolio as well as our market reach in terms of channels and market share as we go into 2026.
Operator
This concludes our question-and-answer session. I'd like to turn the call back over to Juho for any closing remarks.
Thank you for the insightful questions and for joining our call this afternoon. Steven and I will be attending a few sell-side conferences this month. We will be at the Craig-Hallum, ROTH, and Needham conferences in New York in 2 weeks. We're particularly proud to be celebrating Inseego's 25th anniversary as a public company, hosting the closing bell on NASDAQ on Monday, December 8, a meaningful milestone for our employees, shareholders, and the company as a whole. Thank you again for your time today, and we look forward to speaking with you soon.
Operator
The conference has now concluded. Thank you for attending today's presentation. You may now disconnect.