Operator
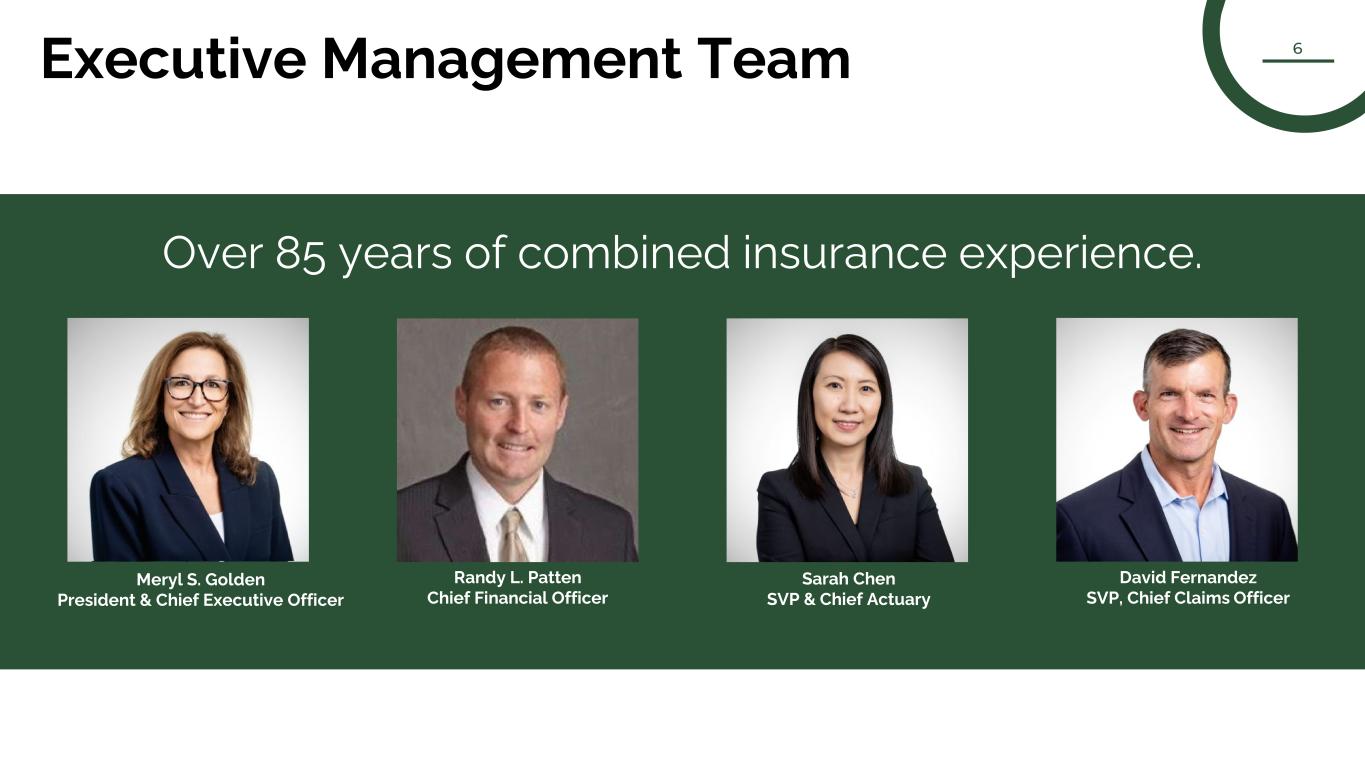
Greetings. Welcome to Kingstone Companies' Third Quarter 2025 Earnings Conference Call. As a reminder, this conference is being recorded. Joining us on today's call will be President and Chief Executive Officer, Meryl Golden; and Chief Financial Officer, Randy Patten. On behalf of the company, I would like to note that this conference call may include forward-looking statements, which involve known and unknown risks and uncertainties and other factors that may cause actual results to differ materially from projected results. Forward-looking statements speak only as of the date on which they are made, and Kingstone undertakes no obligation to update the information discussed. For more information, please refer to section entitled Risk Factors in Part 1 Item 1A of the company's latest Form 10-K. Additionally, today's remarks may include references to non-GAAP measures. For a reconciliation of our non-GAAP measures to GAAP figures, please see the tables in the latest earnings release available on the company's website. With that, it is my pleasure to turn the call over to Meryl Golden. Meryl?
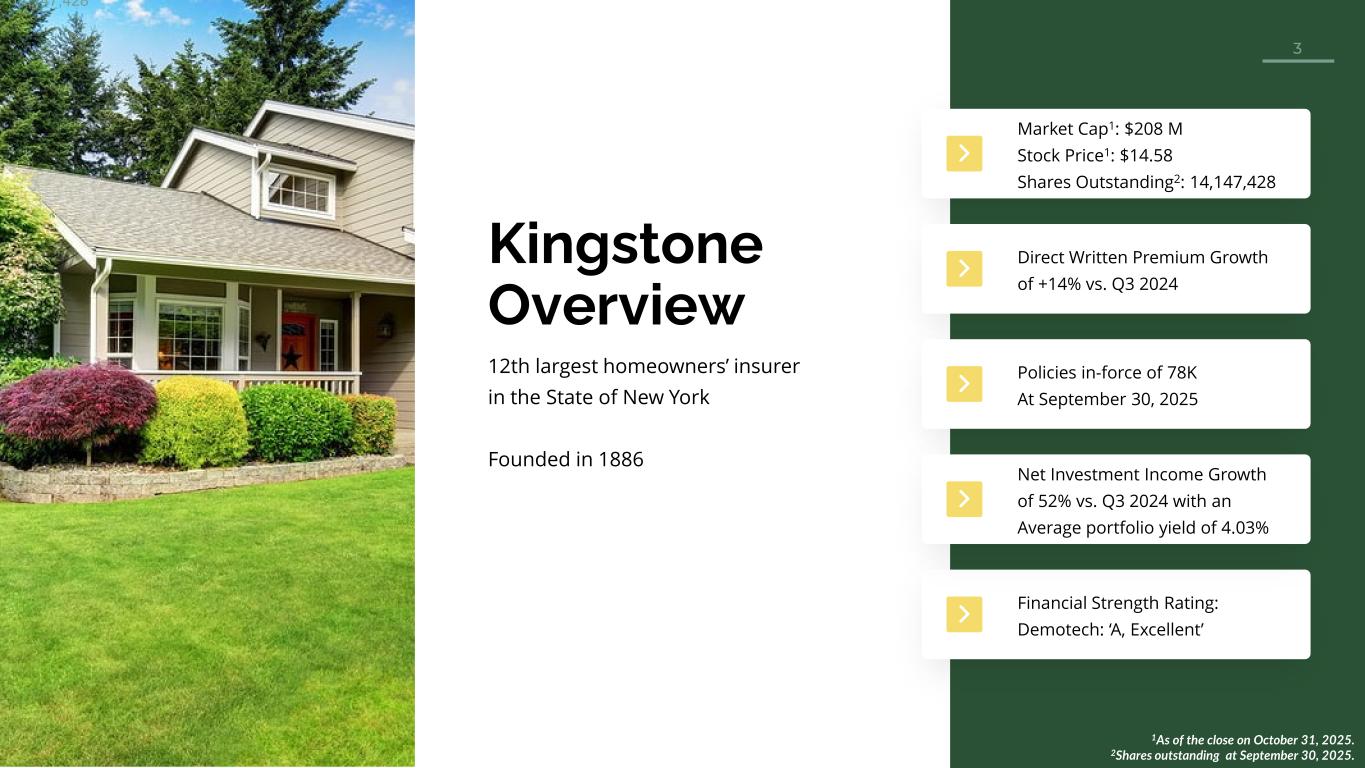
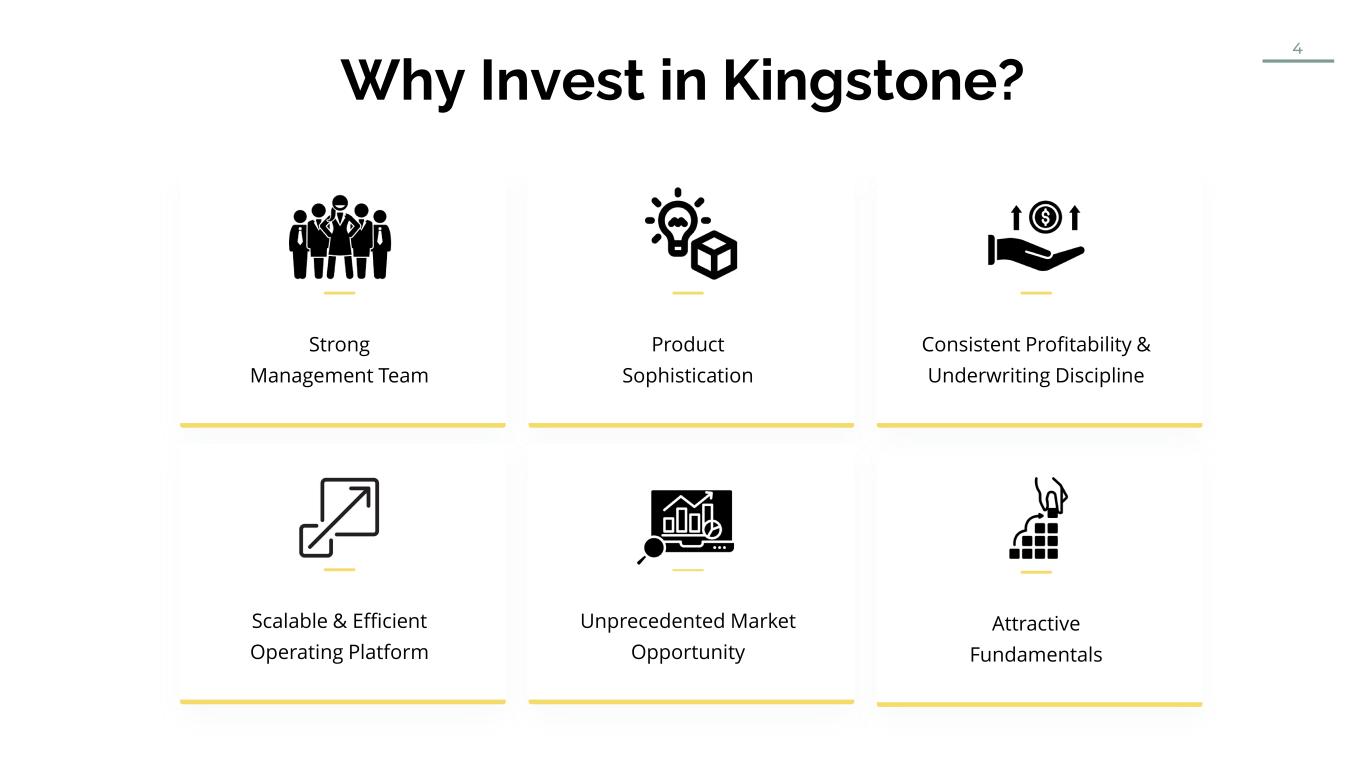
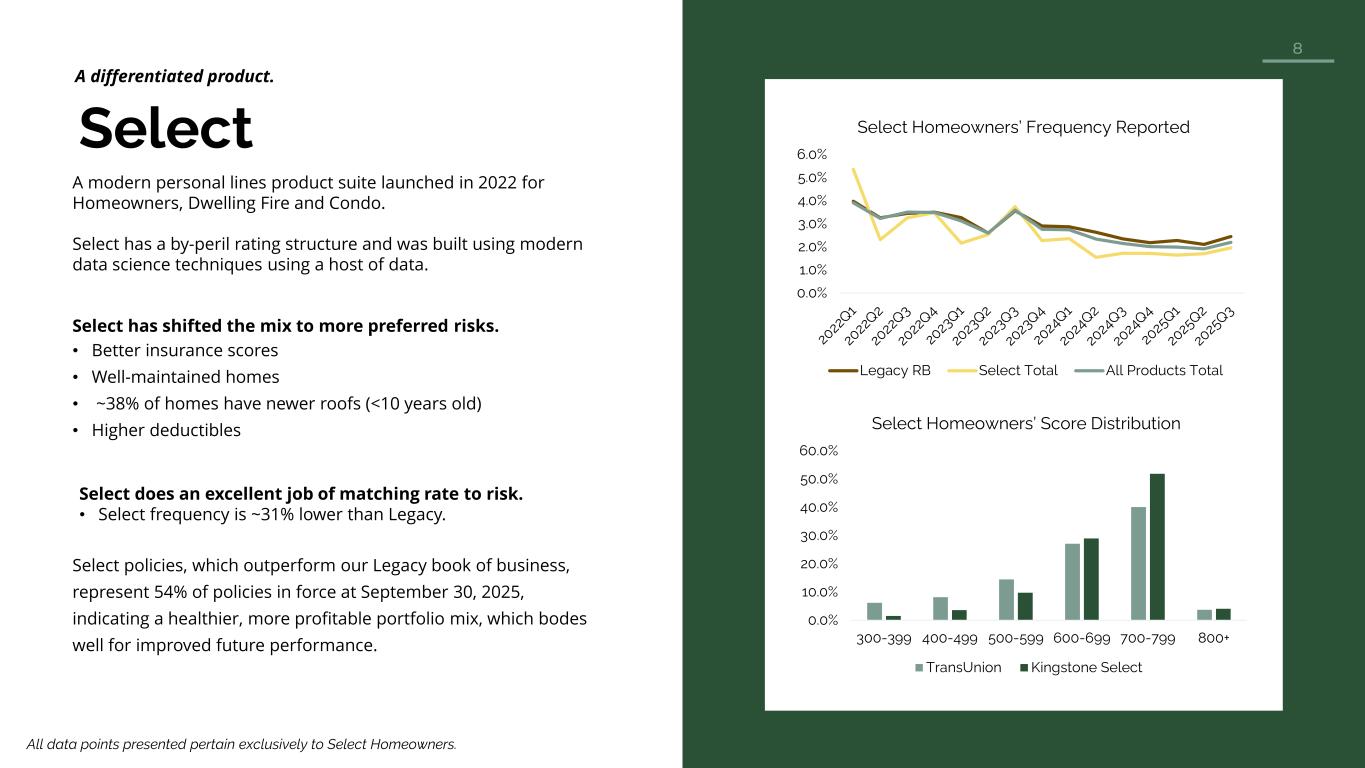
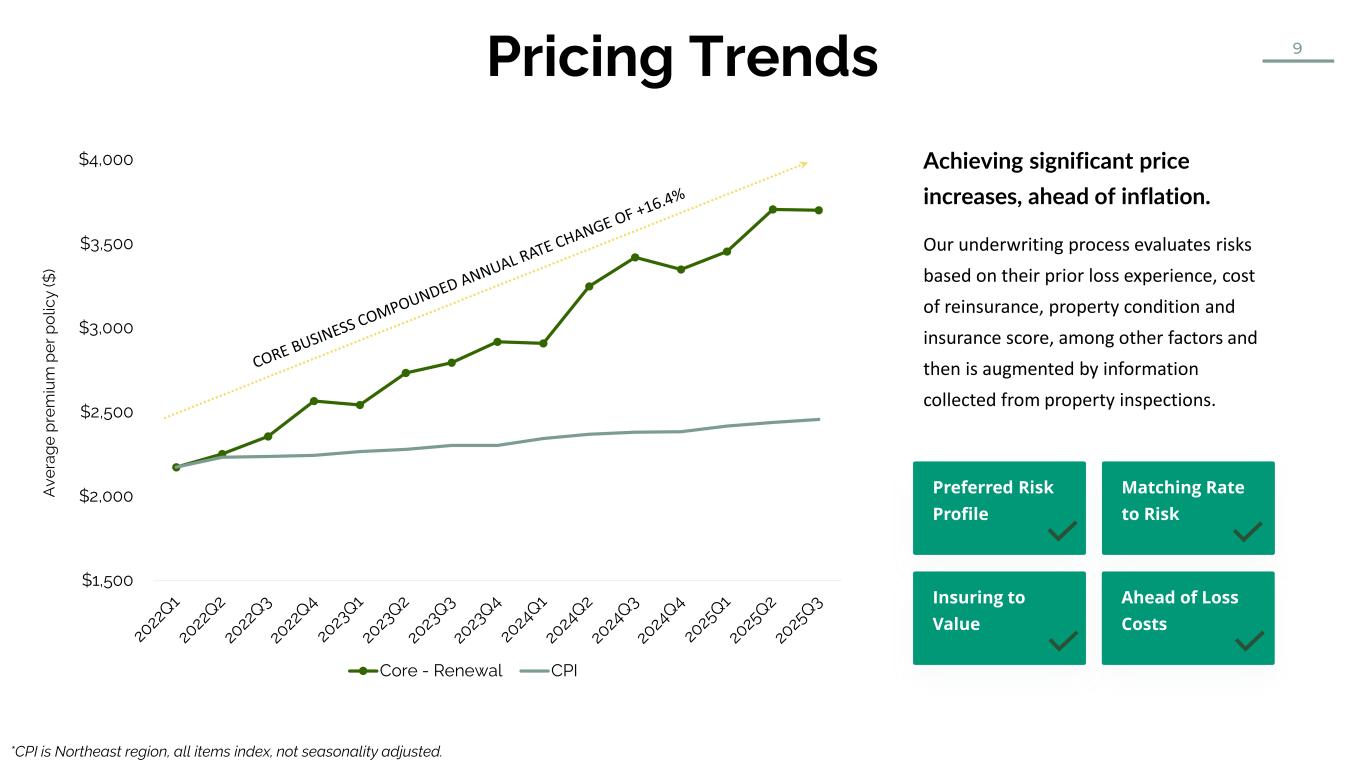
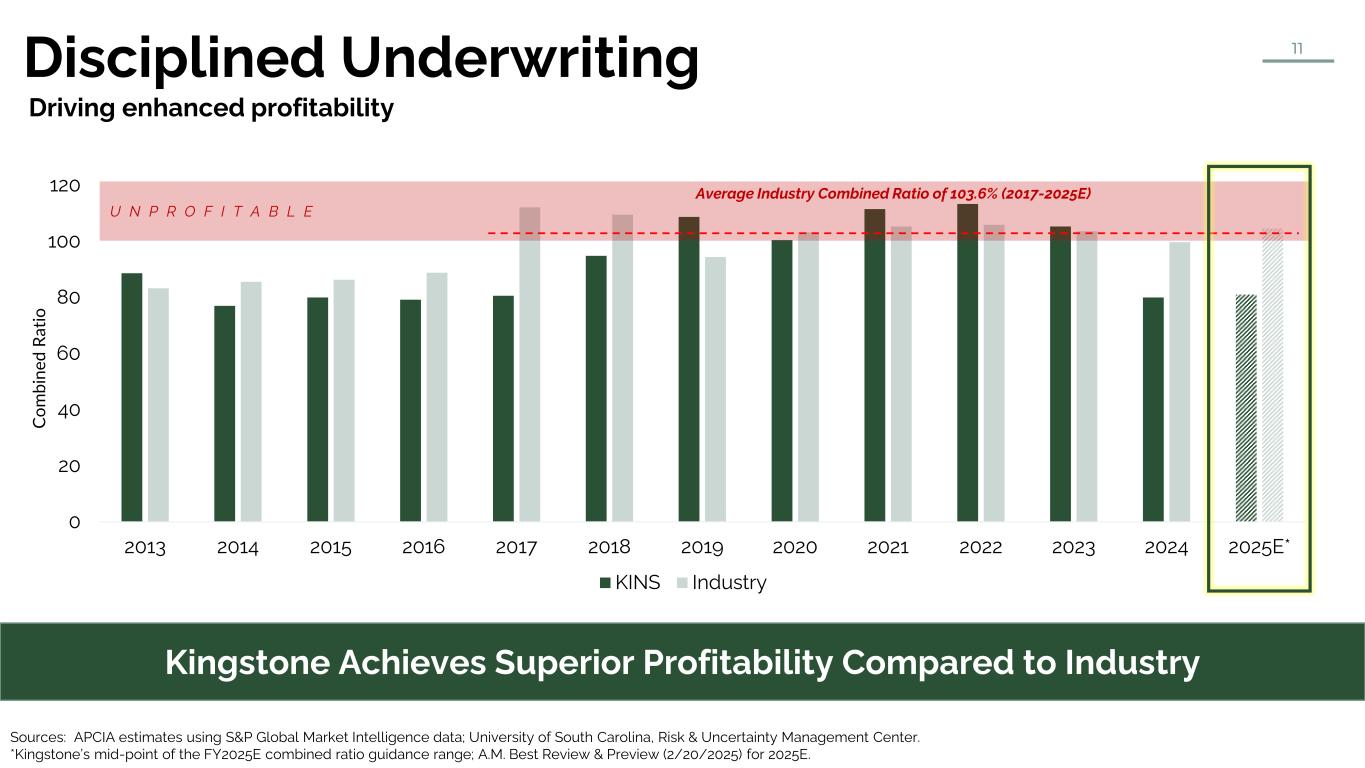
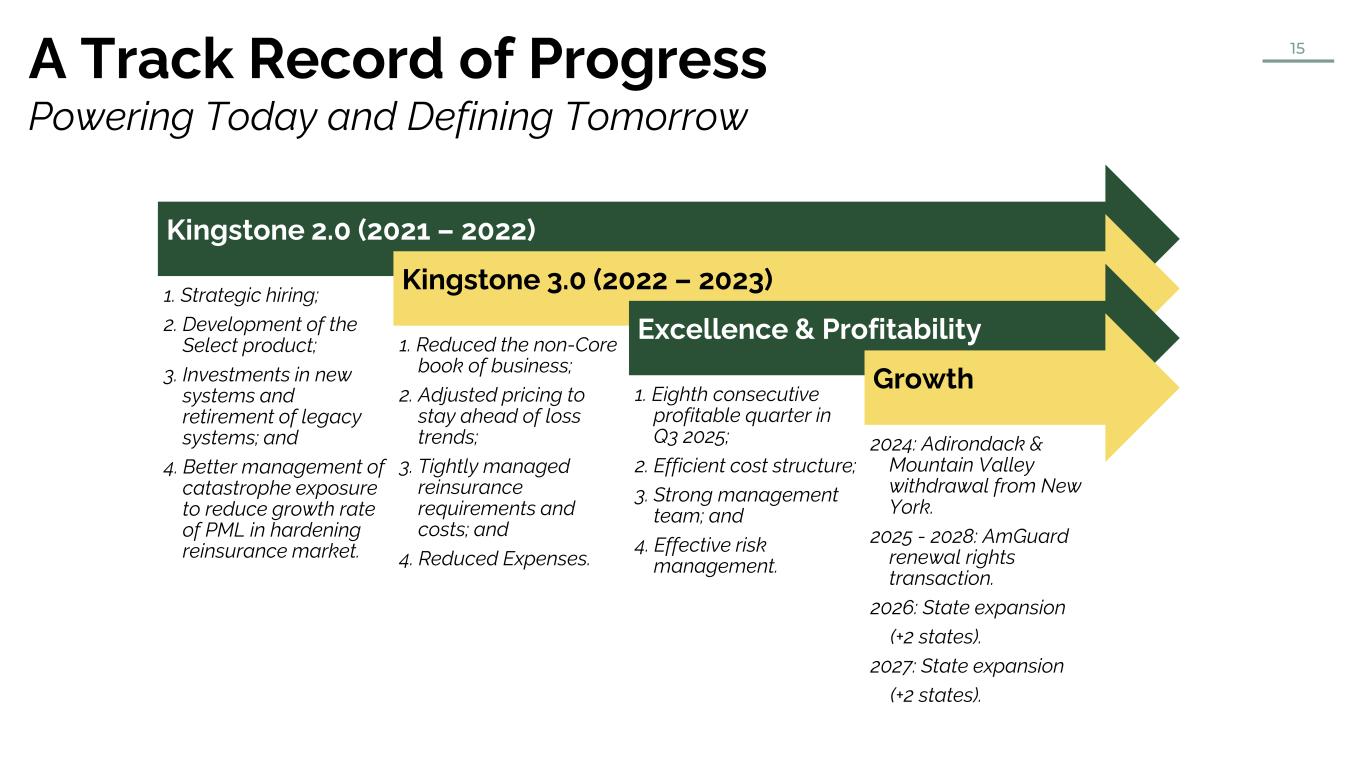
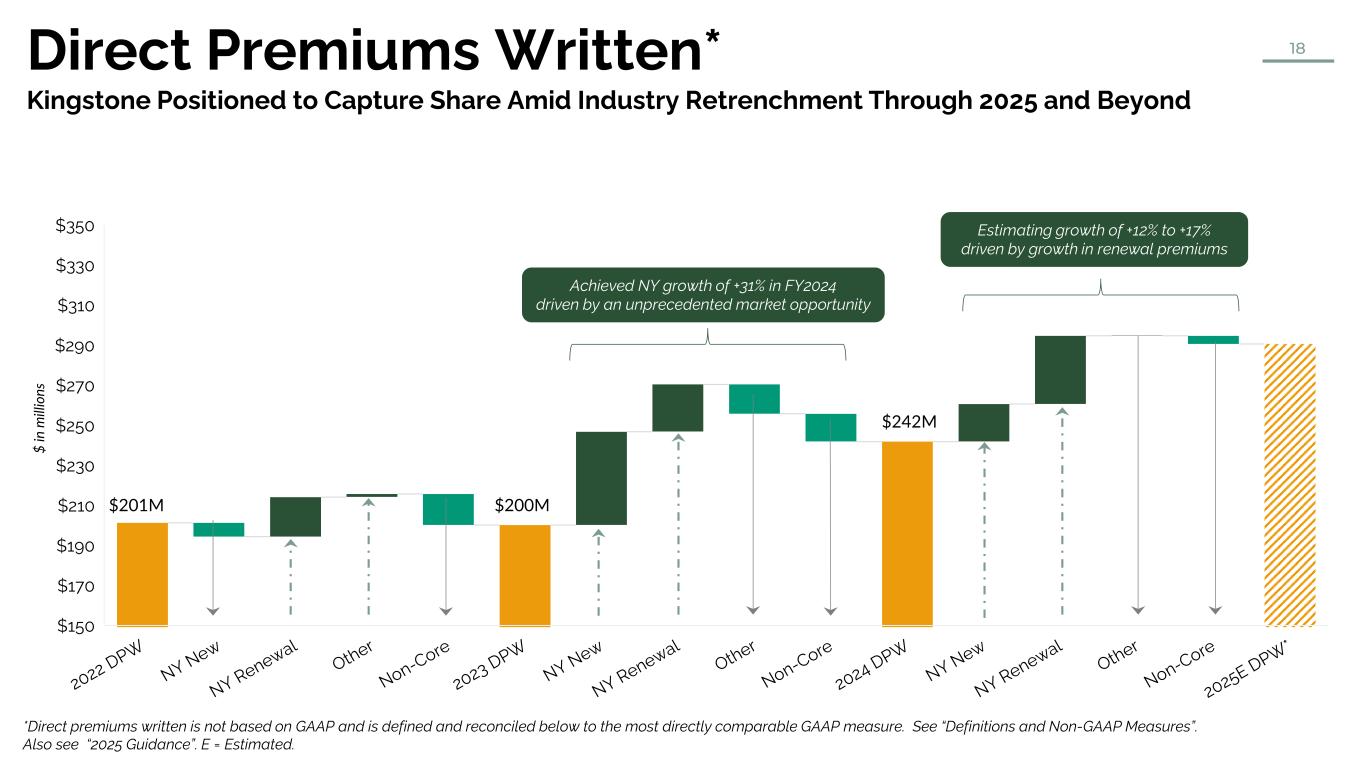
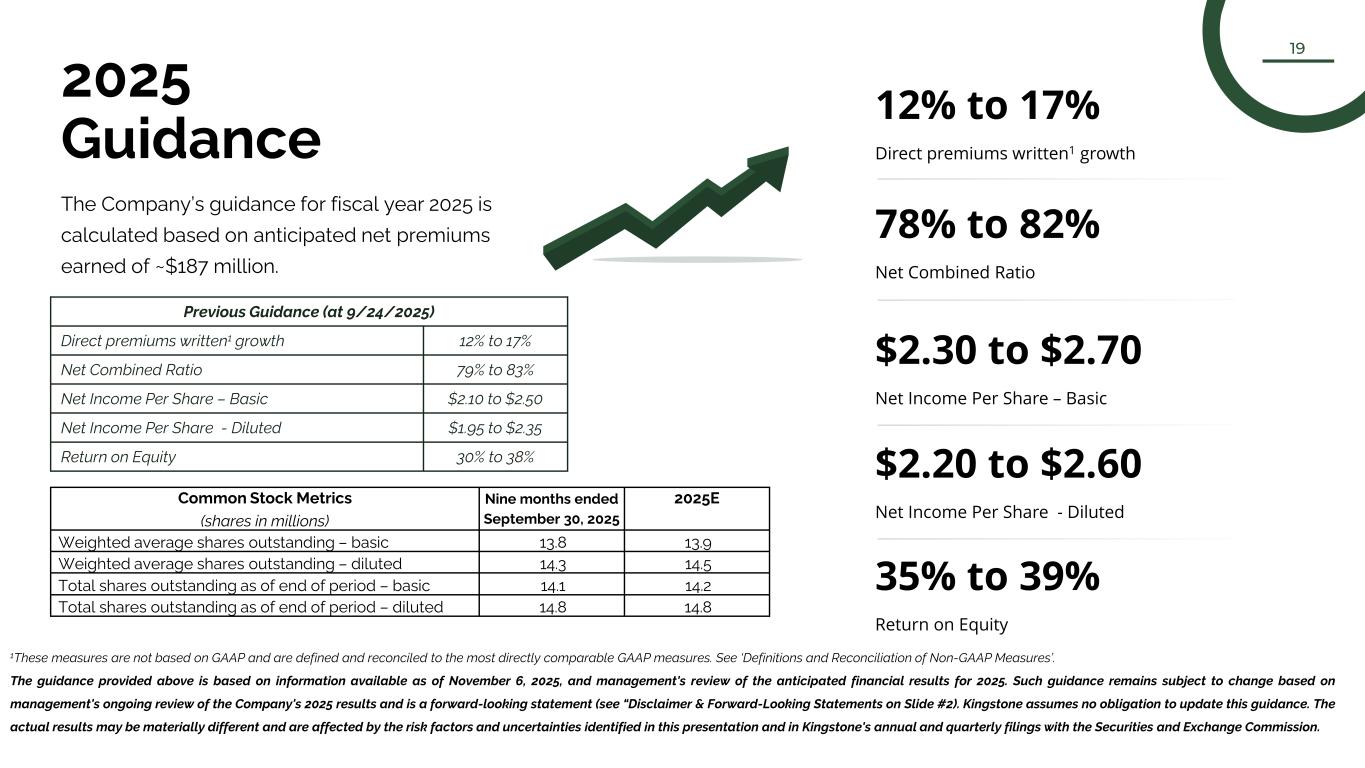
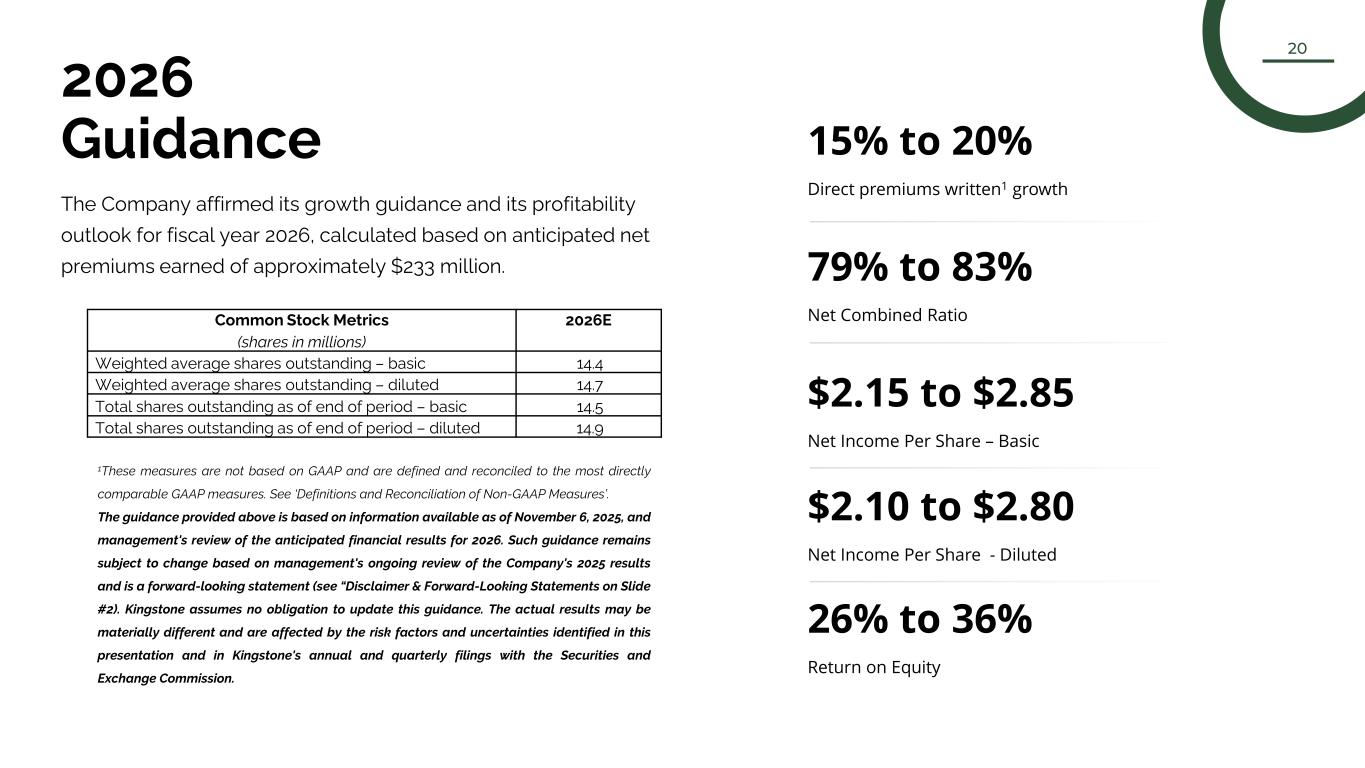
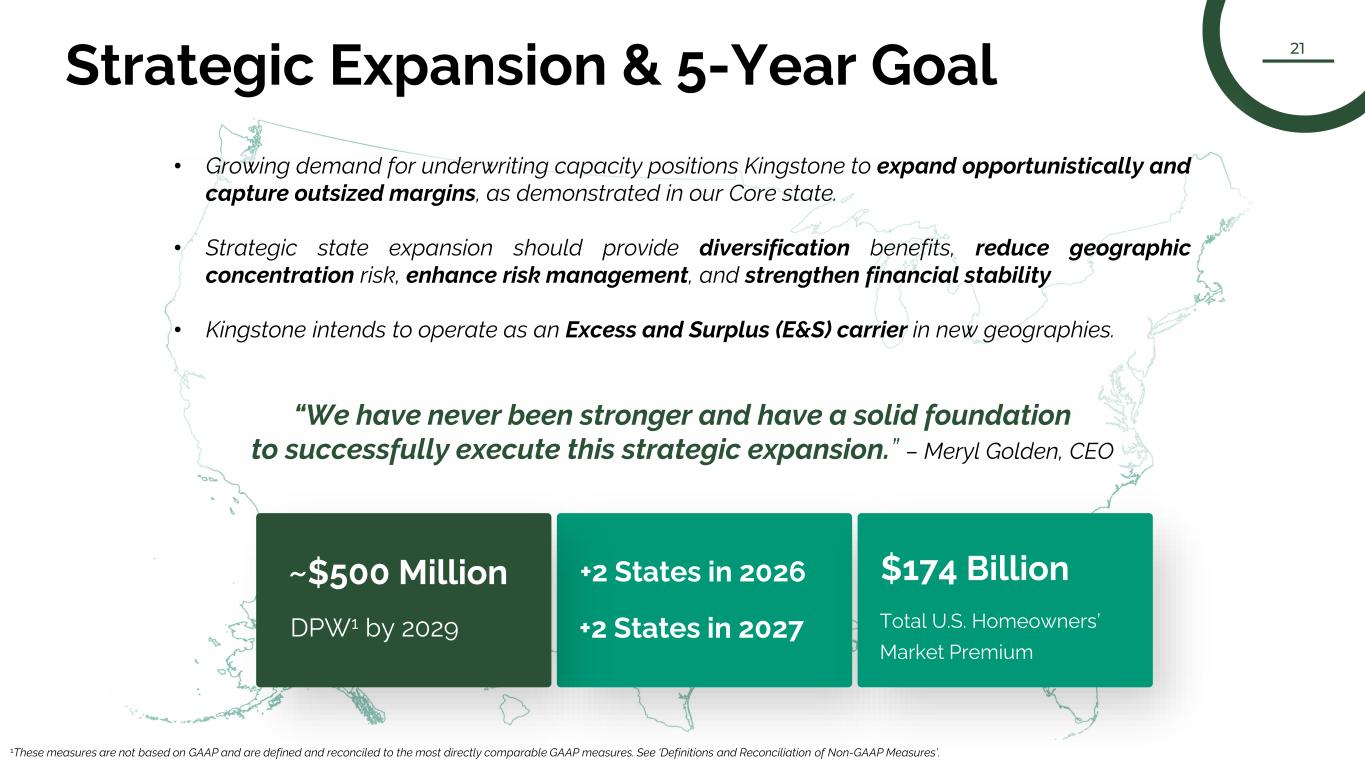
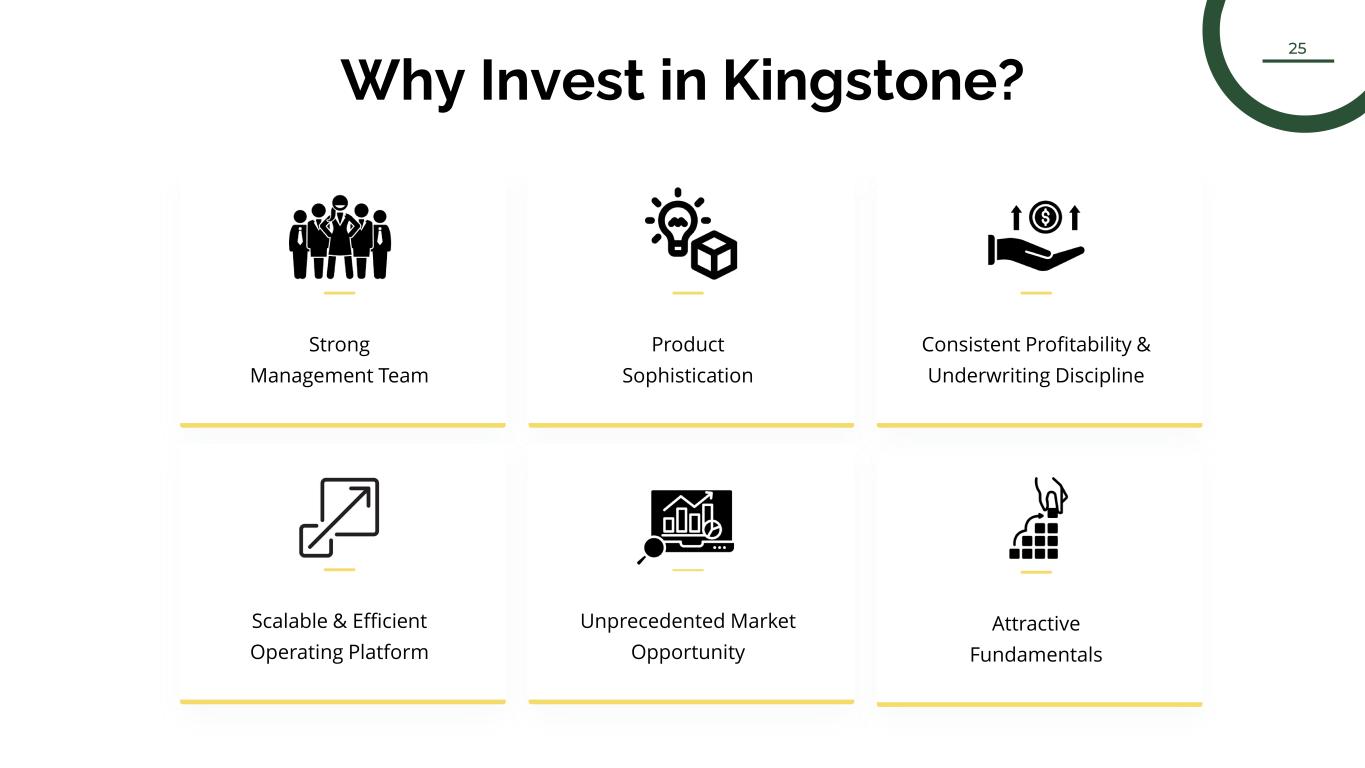
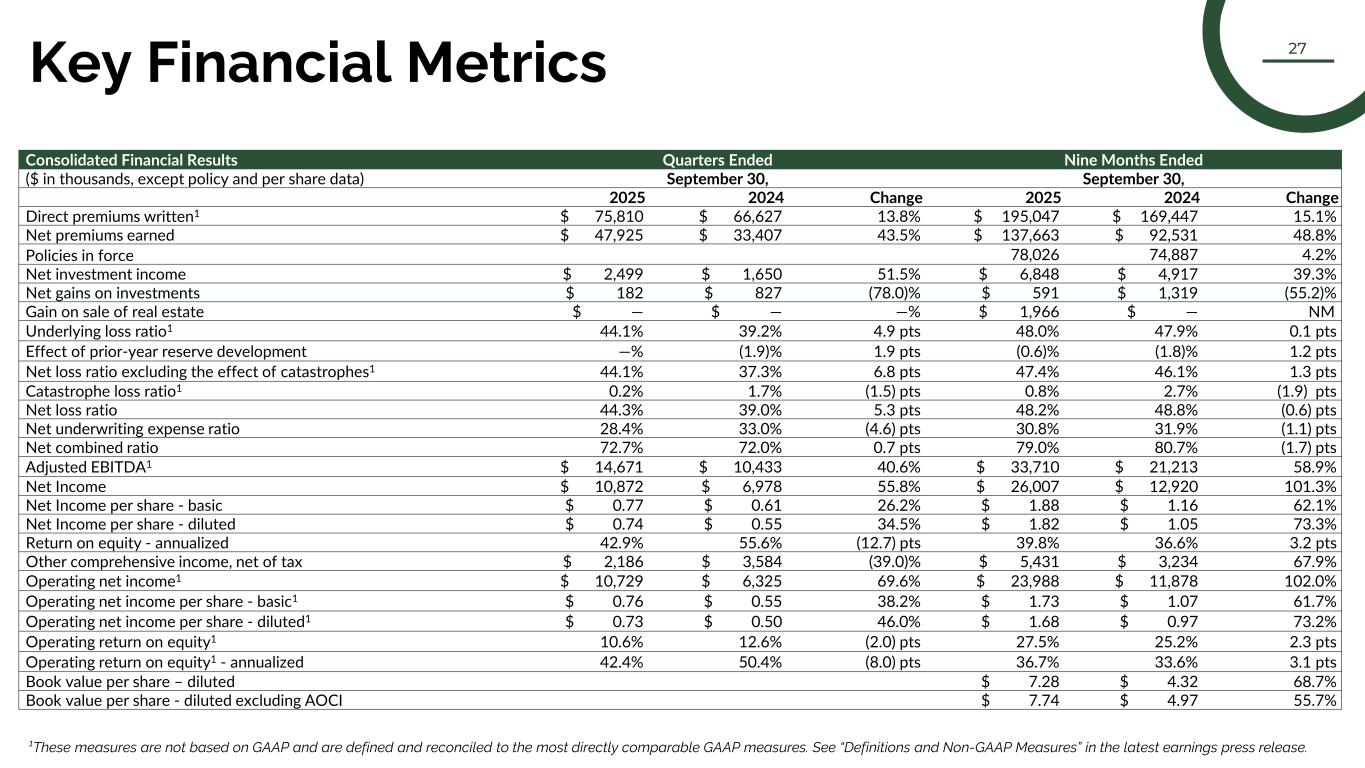
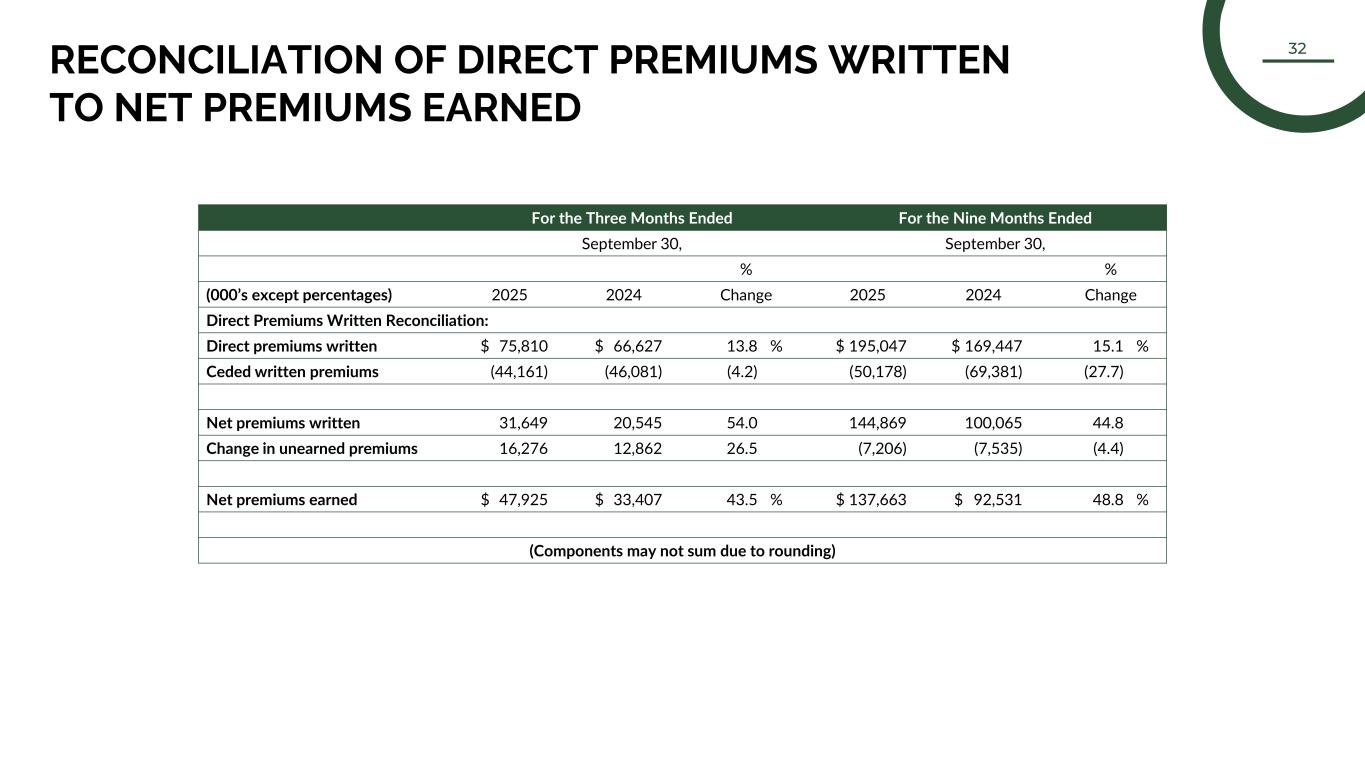
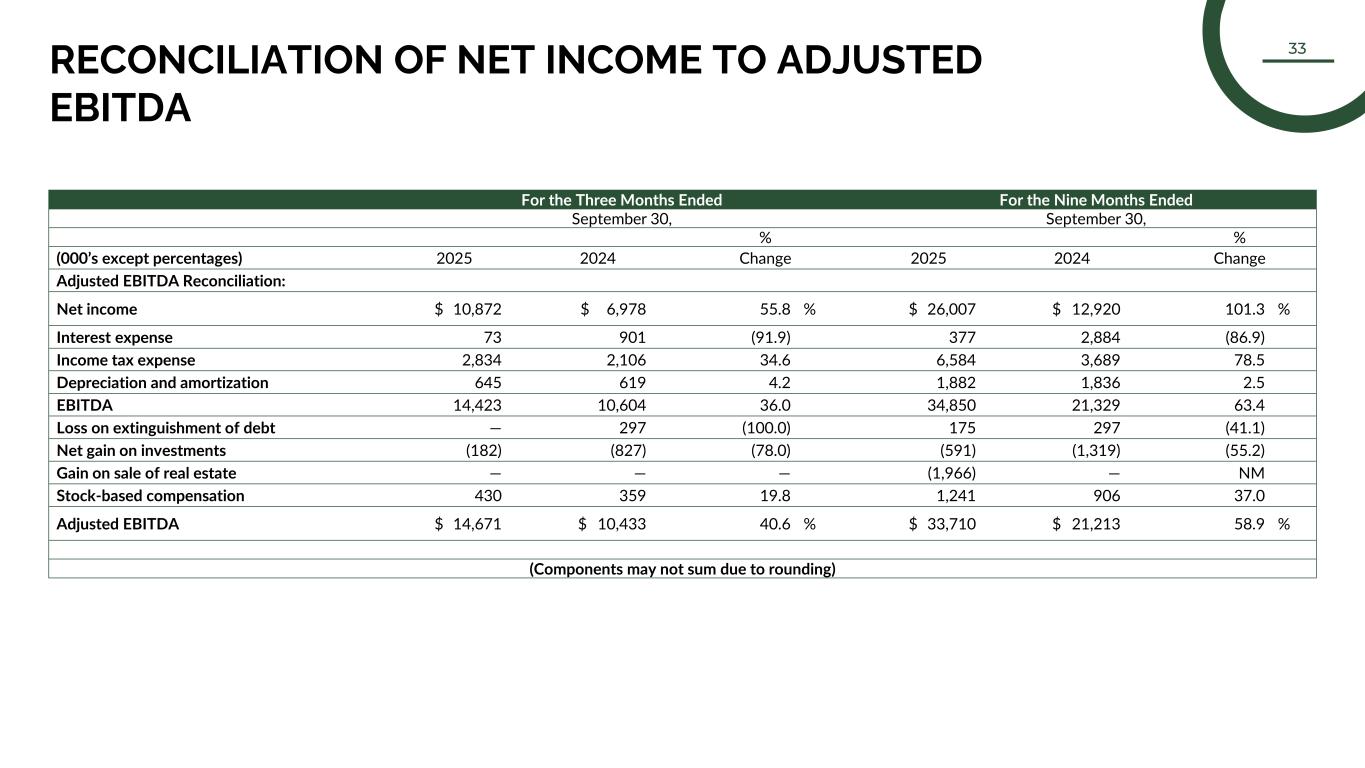
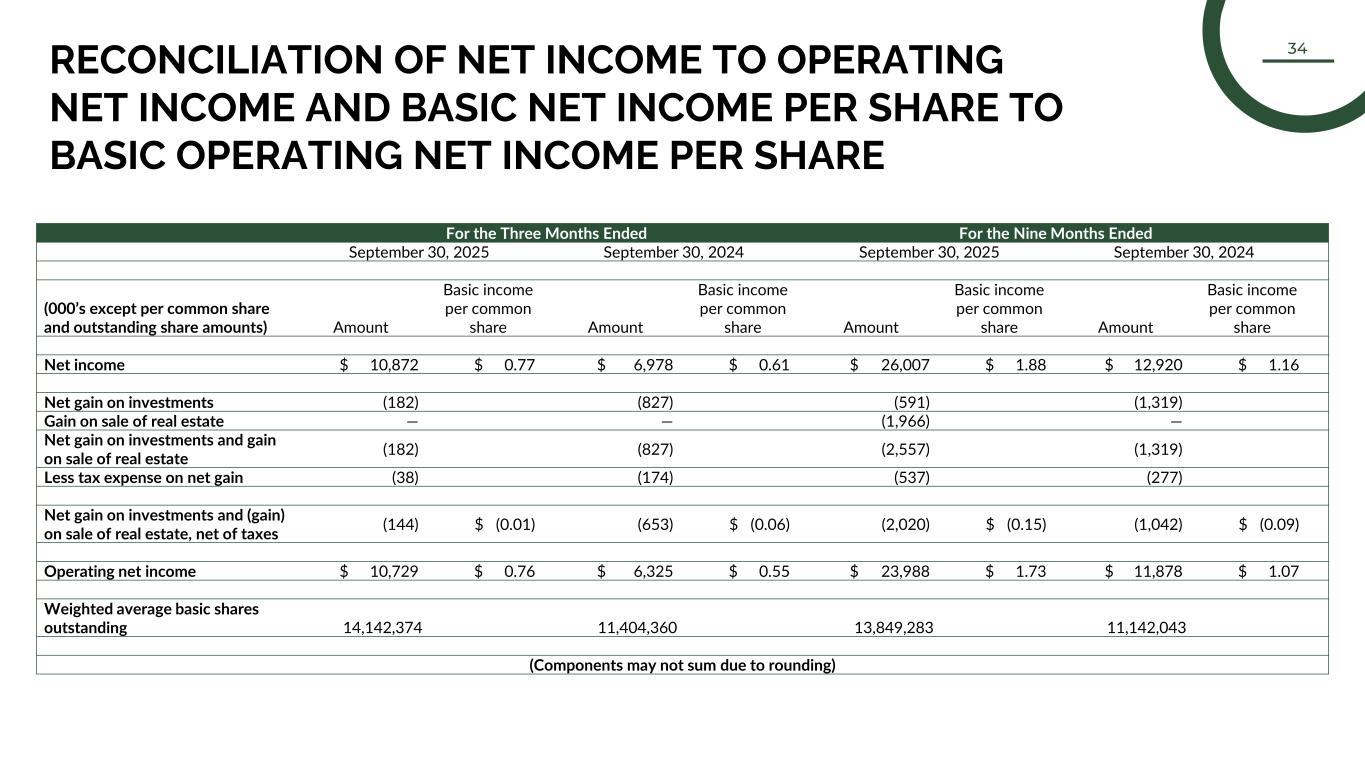
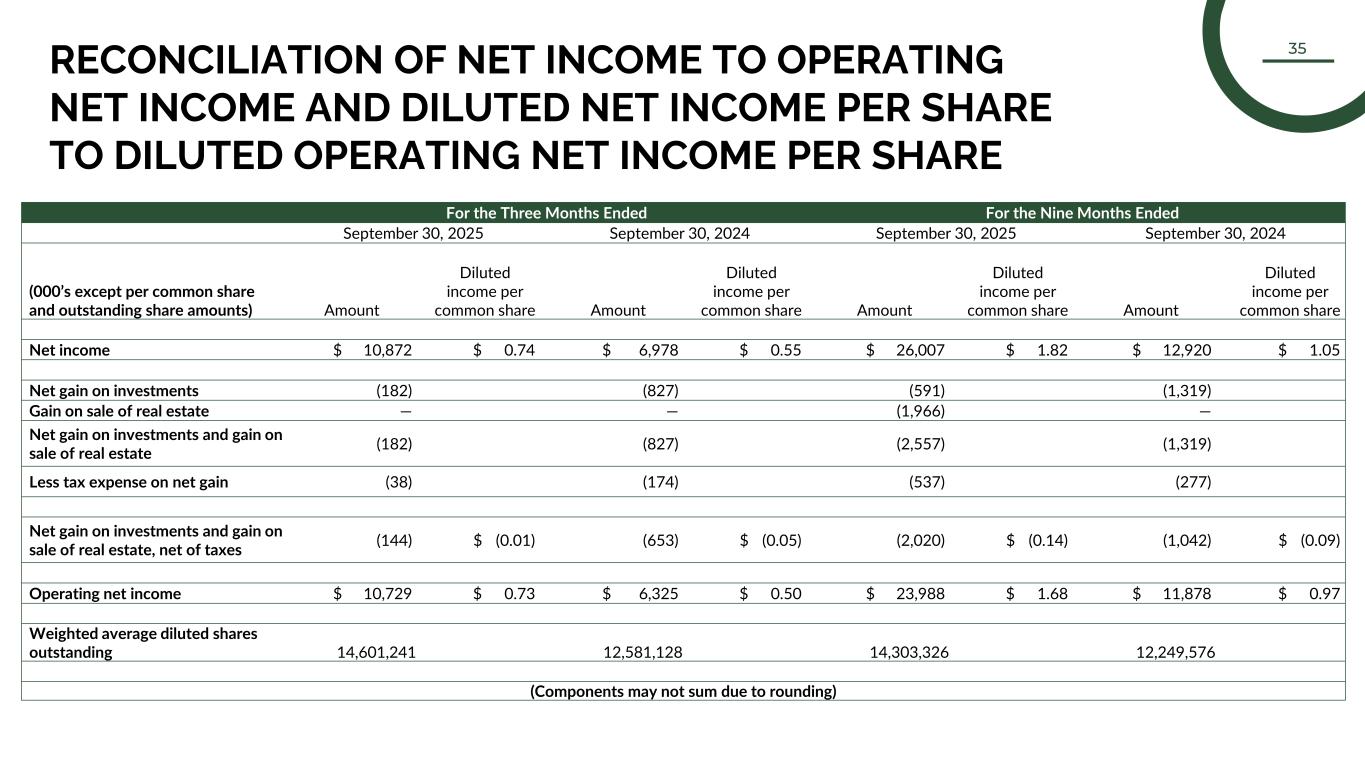
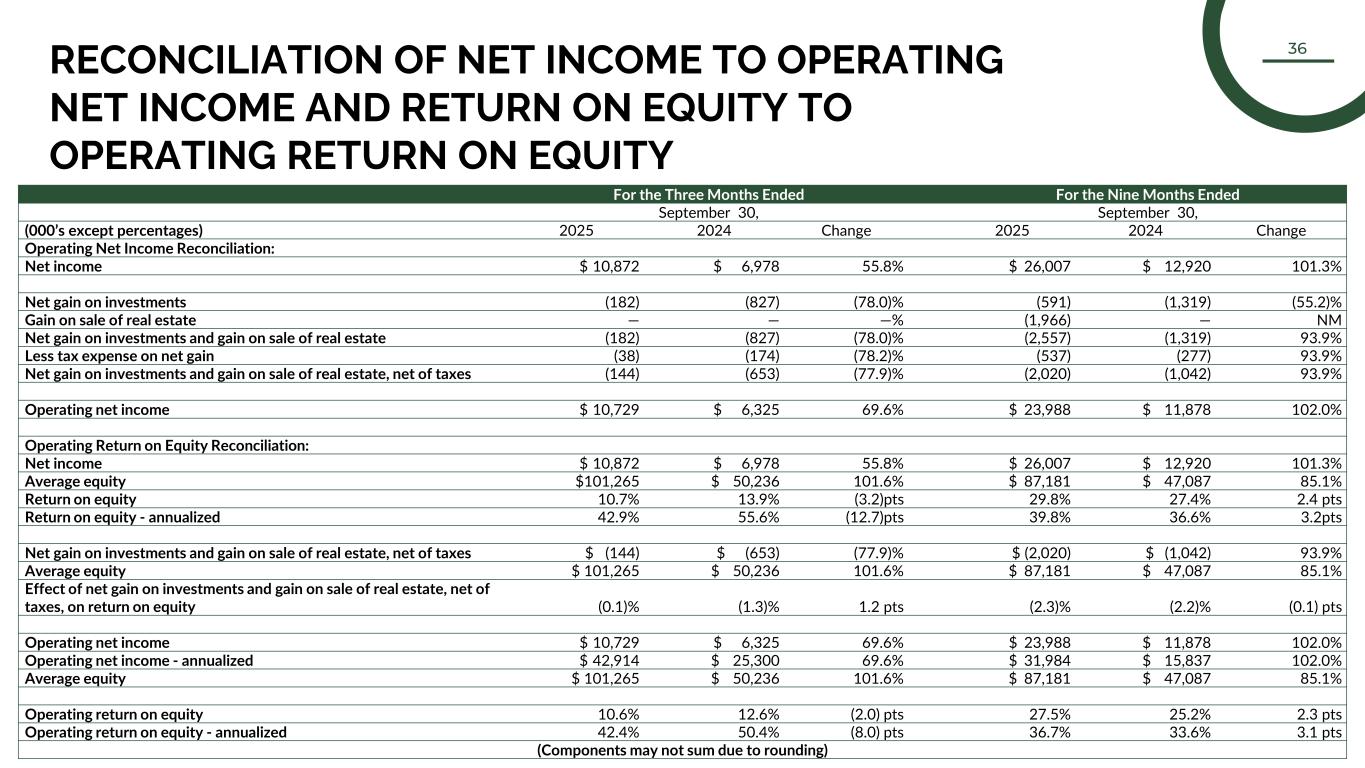
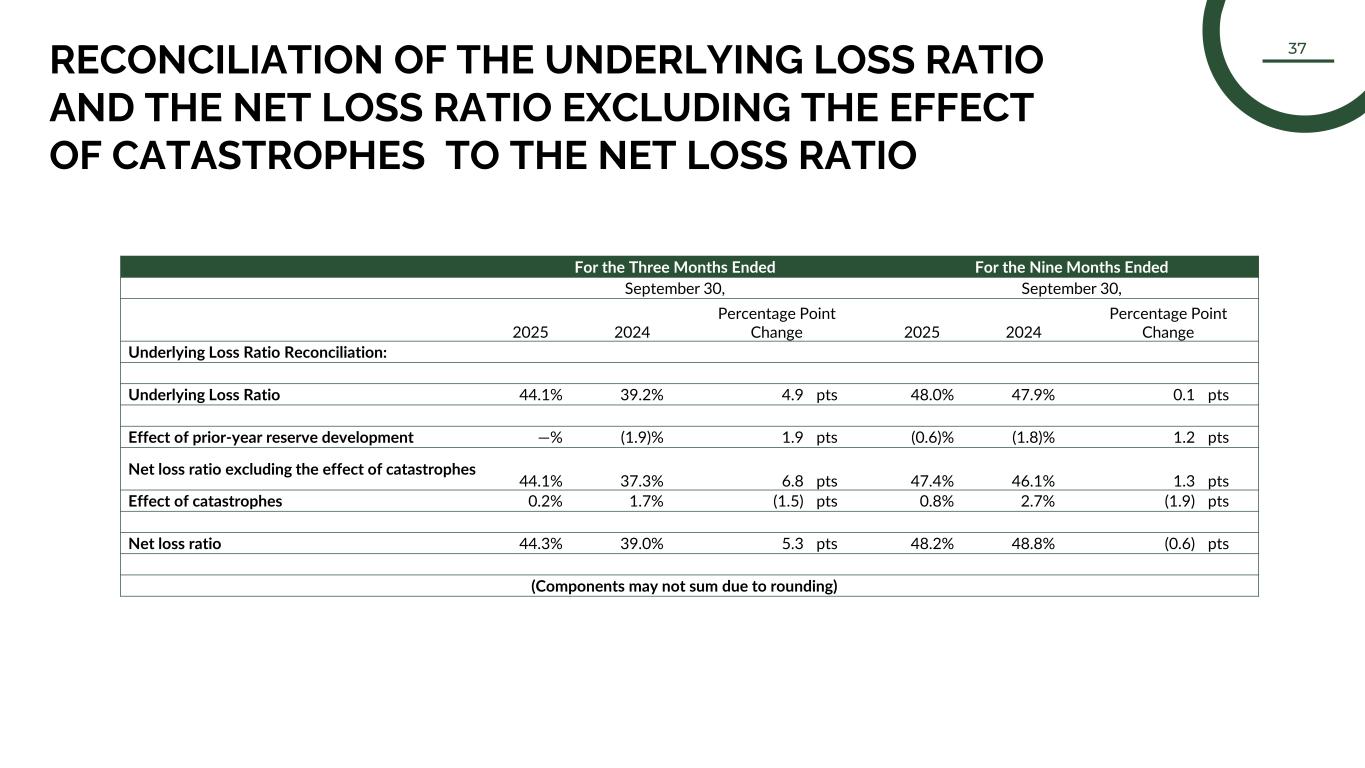
Thank you. Good morning, everyone, and thanks for joining us. We delivered one of the strongest quarters in our history with net income of $10.9 million, diluted earnings per share of $0.74, a GAAP combined ratio of 72.7% and an annualized return on equity of 43%. Direct written premium grew 14% and net investment income increased 52%. This was our second most profitable quarter in history and our eighth consecutive quarter of profitability, underscoring the consistency and enduring competitive advantages we have created. I want to emphasize what sets Kingstone apart. First, our select product does a great job matching rate to risk and with risk selection, which reduces claim frequency over time. Second, our producer relationships support high retention and consistent new business flow. Third, our efficient operations and low expense structure enhance margin durability; and last, our great team, all of whom act with an ownership mentality. The hard market conditions in our downstate New York footprint have not changed materially. While we've seen some competitors broaden their underwriting appetite, our overall volume remains strong. New business this quarter has moderated compared to last year's surge when we benefited from the market exits of Adirondack and Mountain Valley. But we've seen a month-over-month increase in new business since June, and that has continued into the fourth quarter. We've also begun writing policies under our renewal rights agreement with GUARD, which will meaningfully add to new business policy counts going forward. Growth of 14% for the quarter was driven primarily by an average premium increase of 13% and improved retention. Looking ahead, we expect retention, which represents over 80% of our premium base to continue trending higher as rate changes transition to high single digits from the high teens pace of the past 3 years. Policies in force increased 4.2% year-over-year and 1.4% sequentially, underscoring the stability and loyalty of our agent and customer base. Net earned premium growth continues to be a powerful tailwind, exceeding 40% for the third consecutive quarter. The increase is primarily due to our reduced quota share, which allows us to retain a greater share of premiums and underwriting profits. Additionally, the surge in new business written in the second half of last year continues to earn in, further fueling the growth in earned premiums. On underwriting, our underlying loss ratio was 44.1%, an increase of 4.9 percentage points versus the prior year quarter, driven by higher claim severity. Claim frequency, especially for non-weather water and fire, our largest perils, declined versus last year, a trend we have shared previously. We believe this is driven by a mix shift to more preferred risk in our Select products. The Select homeowners program now represents 54% of policies in force. And on an inception-to-date basis, Select homeowners claim frequency is 31% lower than our legacy product. During the quarter, large losses were modestly higher than the prior year's unusually favorable experience, but remained consistent with the prior 3 years otherwise. Year-to-date, our underlying loss ratio is up only 0.1 percentage point from the prior year. The variability in large losses is random and does not indicate a change in trend. Catastrophe losses contributed 0.2 percentage points to the loss ratio compared with 1.7 percentage points in the prior year quarter. While catastrophe activity was light, our strong results aren't solely driven by favorable weather. With a normalized third quarter catastrophe load, our combined ratio would have been in the low 80s. Our state expansion initiative is progressing, and we intend to present Kingstone's multi-year roadmap to you in the first half of next year. With 3 quarters behind us, we've updated our 2025 guidance to reflect our outstanding performance. We are raising guidance for our net combined ratio, EPS, and ROE, while reaffirming direct-written premium growth for all states to range between 12% and 17%. With anticipated net earned premiums of $187 million, we expect a GAAP net combined ratio between 78% and 82%, basic earnings per share between $2.30 and $2.70, diluted earnings per share between $2.20 and $2.60 and return on equity between 35% and 39%. Relative to our prior guidance and on the same net earned premium base, we have improved our GAAP combined ratio range by 100 basis points at the midpoint, raised both basic and diluted EPS ranges by 9% and 12%, respectively, and increased our ROE target range by roughly 300 basis points at the midpoint. This increased guidance reflects strong underwriting performance, sustained investment income growth, and lower expenses, while maintaining our disciplined posture on pricing and exposure management. With regard to fiscal '26 guidance, our baseline assumes normal seasonality and catastrophe activity. In both 2024 and 2025, we have very mild winters and low catastrophe losses overall. Weather is unpredictable, and we assumed more reversion to the mean for our '26 guidance. We will refine our outlook as the year unfolds and moving forward, we'll announce subsequent years guidance in March, along with fourth quarter results. Now I'll turn the call over to Randy Patten, our Chief Financial Officer, who joined Kingstone in late August. Randy?
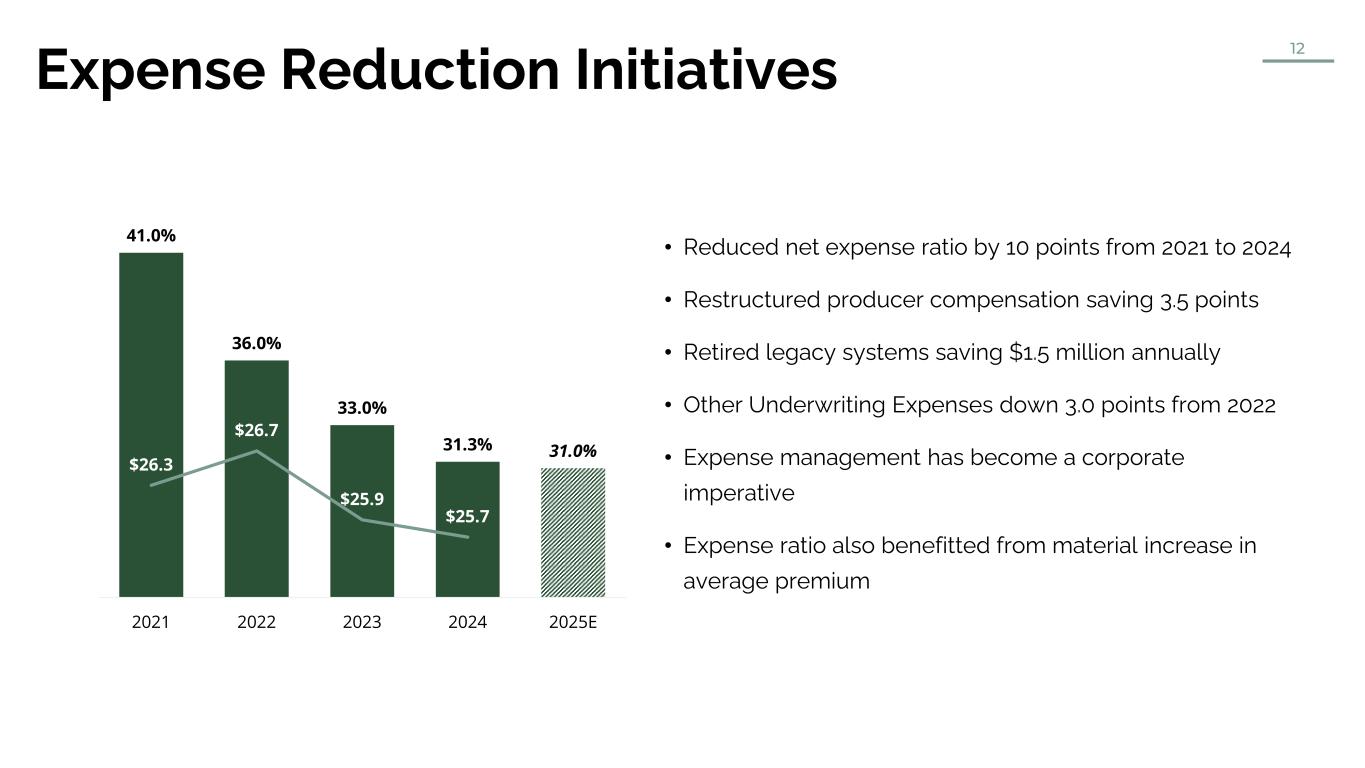
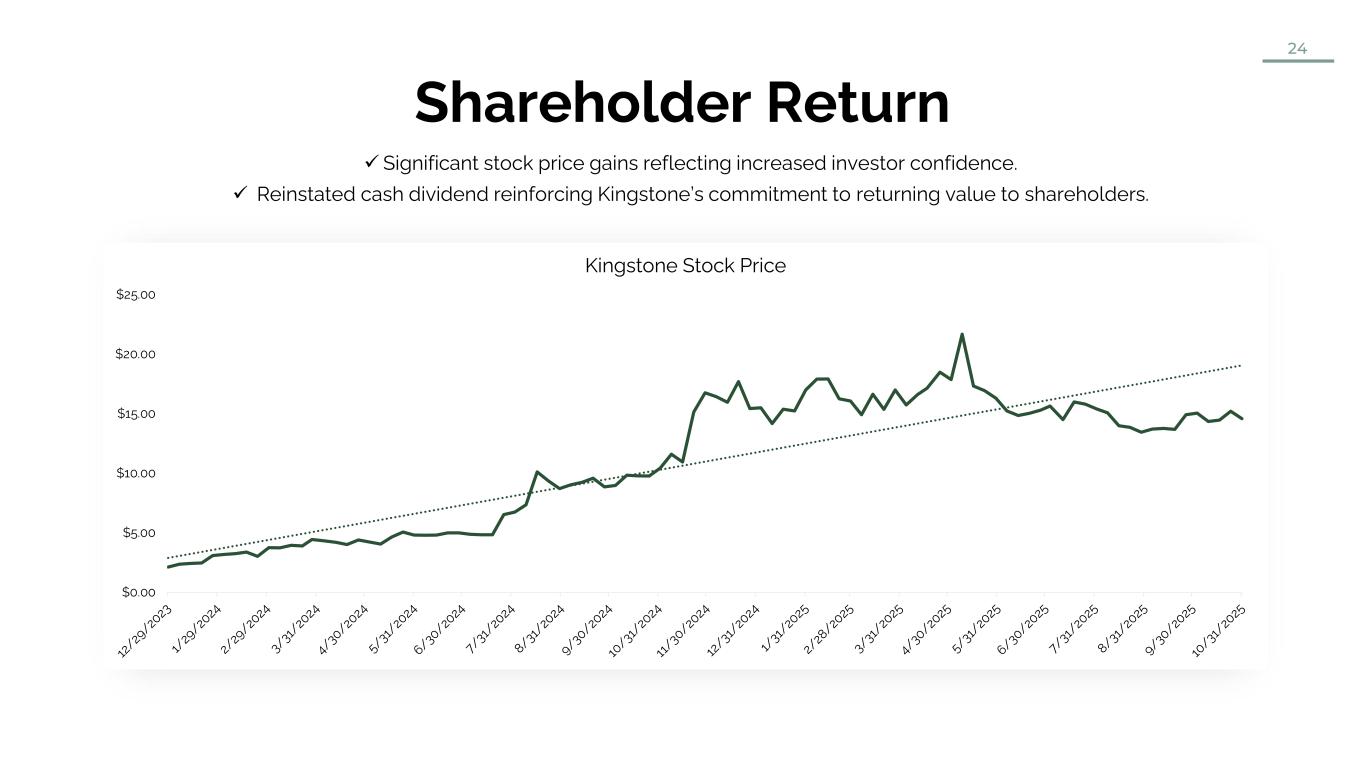
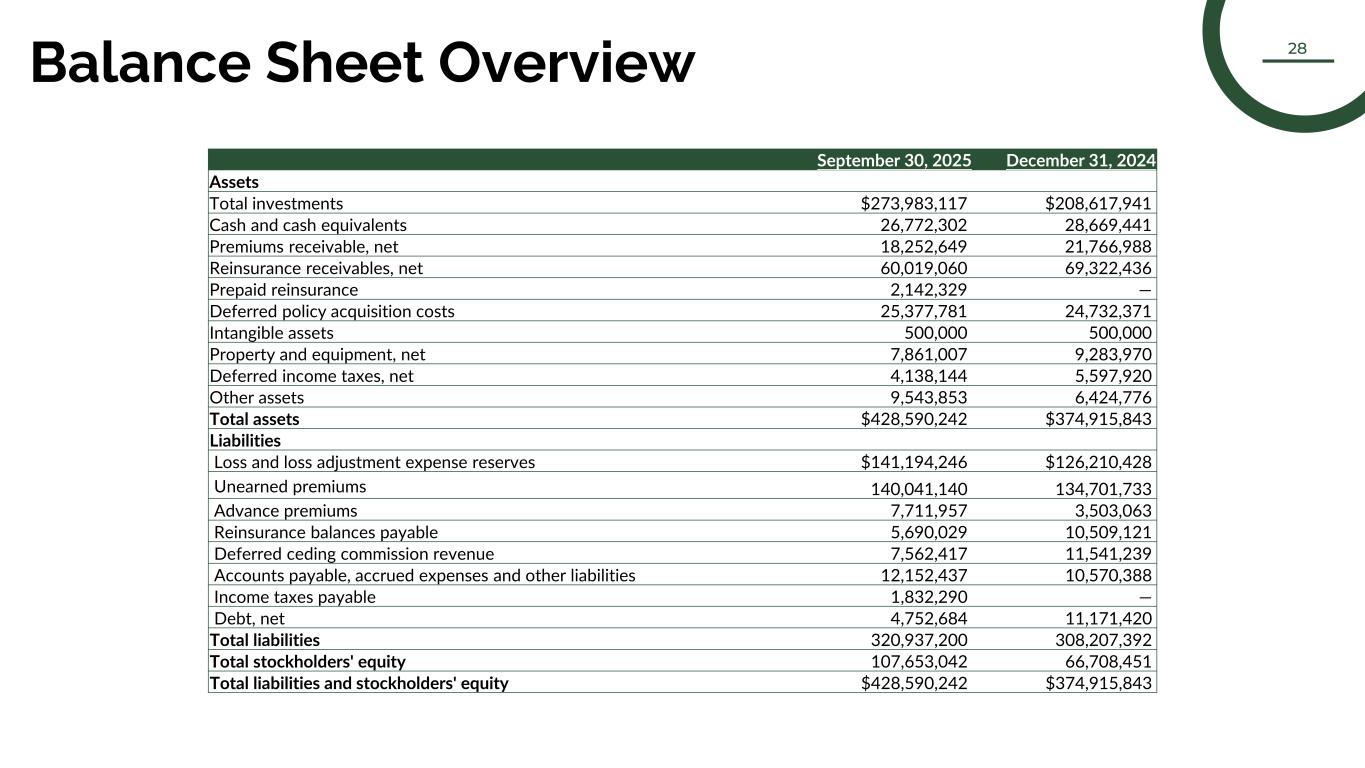
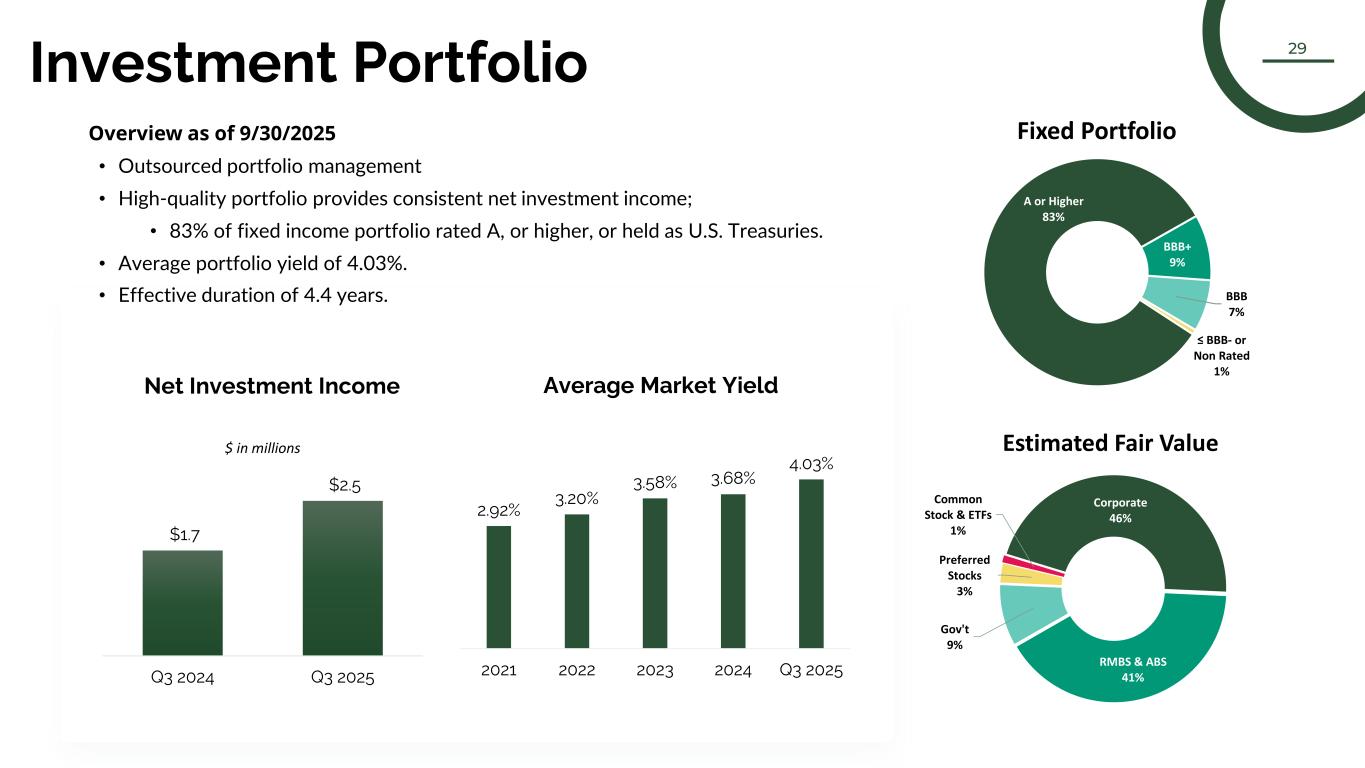
Thank you, Meryl, and good morning again, everyone. Q3 was our most profitable third quarter on record and our eighth consecutive quarter of profitability. We generated net income of $10.9 million, diluted earnings per share of $0.74, a 72.7% combined ratio, and an annualized return on equity of 43%. Year-to-date, net income was $26 million, more than double the prior year. Performance was driven by strong net earned premium growth as our reduced quota share in the second half of 2024 new business surge continued to earn in, combined with very low catastrophe losses, favorable frequency trends, and lower expenses aided by an adjustment to the sliding scale ceding commissions. Our net investment income for the quarter jumped 52% to $2.5 million, up from $1.7 million last year. Year-to-date, we've seen a 39% increase, reaching $6.8 million. The momentum is due to robust cash generation from operations, which has enabled us to grow our portfolio and benefit from higher fixed income yields. We capitalized on attractive new money yields of 5.2% in the third quarter. While we remain conservative in our investment strategy, we are actively seeking opportunities to enhance our portfolio's yield and duration. As of September 30, 2025, our fixed income yield is 4.03% with an effective duration of 4.4 years, up from 3.39% and 3.7 years at September 30, 2024, an increase of 64 basis points and 0.7 years, respectively. During the quarter, we recognized an increase of $1.4 million in sliding scale contingent ceding commissions under our quota share treaty, reflecting low catastrophe losses, which contributed to the 4.6 percentage point decrease in the quarter's expense ratio. 2025 marks the first period in some time in which a significant portion of the quota share ceding commission is on a sliding scale basis. While sliding scale ceding commission for the attritional loss ratios look quarterly, sliding scale ceding commission for the catastrophe loss ratio cannot be reasonably estimated until after the peak of the hurricane season, so it was recognized this quarter. As a result of this adjustment, our year-to-date expense ratio is down 1.1 percentage points to 30.8% versus the same period in 2024, and we anticipate ending the year with an expense ratio for the full year 2025 lower than the prior year. I will conclude my portion of the call today discussing our capital position. Our capital position remains strong. We have no debt at our holding company, KINS, and shareholders' equity exceeded $107 million, an increase of 80% year-over-year. Year-to-date return on equity is 39.8%, an increase of 3 percentage points from the same period last year. Given this foundation and our outlook, we reinstated our quarterly dividend during the quarter and have ample capital to fund disciplined growth. With that, I'll open it up for questions.
Operator
Our first question is from Bob Farnam with Janney Montgomery Scott.
Speaker 3
So on your New York admitted basis, the Select product now is 54% of the policies in force. Will all accounts eventually move to Select, or some just renew on the legacy product indefinitely?
Yes. So we are maintaining our legacy book because it's profitable. So any policy written in legacy will stay there. But clearly, when it gets to be small enough, we'll probably convert it to Select, but we don't want our customers to experience that dislocation because it's profitable. So we don't have any plan to do that in the near term.
Speaker 3
Okay. But all new business, is that put on the Select platform?
Yes, all new business has been written in Select since the beginning of 2022.
Speaker 3
When entering new states with an excess and surplus lines approach, I assume this will be a new product since it is E&S rather than admitted. How will this product differ from Select, and what is the development process for it?
We will definitely benefit from the Select product and the experience we've gained. However, as we enter new states, we may encounter new risks or rating factors that we will need to consider. We are currently heavily focused on developing that product and are collaborating with an external actuarial consulting firm, the same one that assisted us in creating the Select product for New York. We are making significant progress and are optimistic about the results we expect to achieve.
Speaker 3
And has the new E&S carrier been finally been approved yet?
We have filed for a new company in Connecticut, which has not yet been approved. We will be writing on an E&S basis similar to Kingstone Insurance Company in certain states.
Speaker 3
Okay, okay. A little change in direction. So I know it's only been 2 months, but the AmGUARD book, you started writing at the beginning of September. So how has that performed thus far relative to expectations? Not performed in terms of profitability, but in terms of having policies move over to Kingstone?
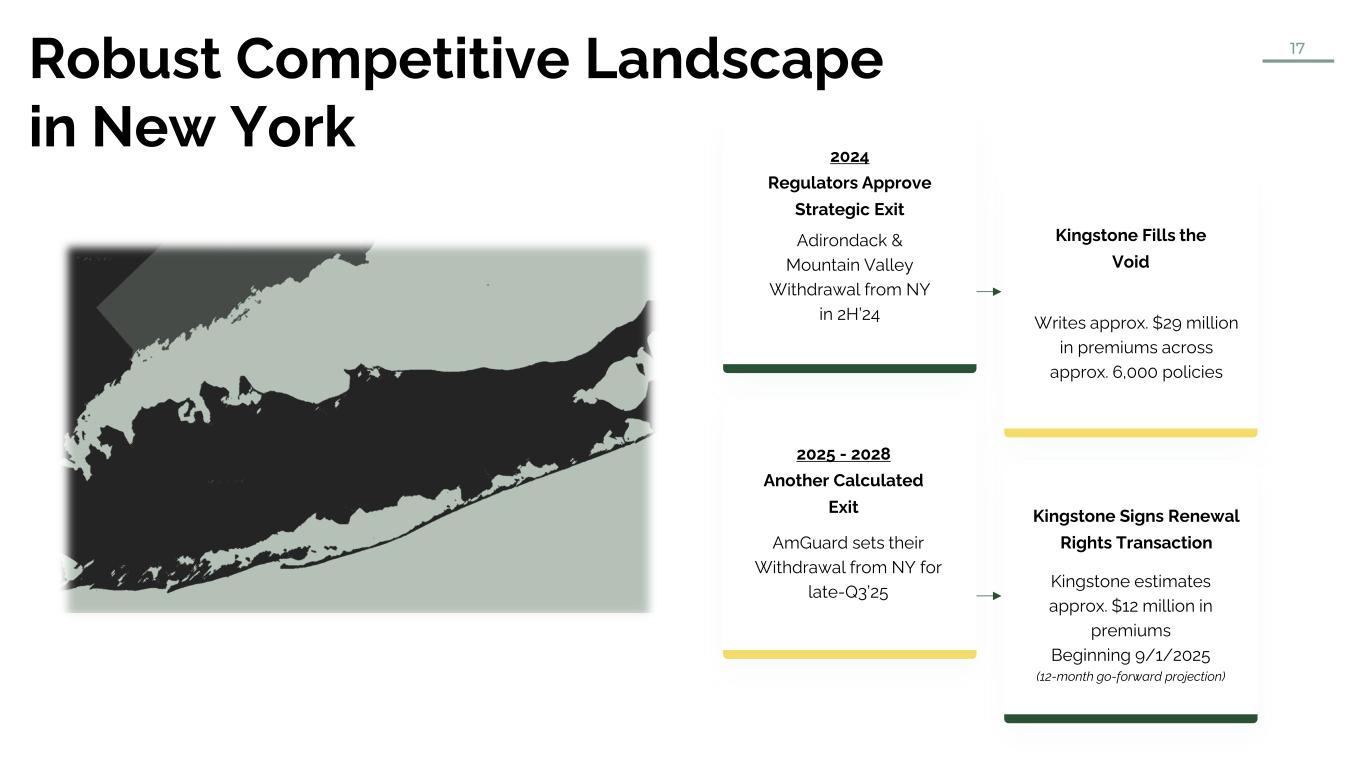
Yes. So it's early on. We started writing business effective September 1st. But so far, it's right within our expectations. So I had indicated that we write between $25 million and $35 million of business over a 3-year period. And we're right on track. We're writing about a little bit less than $1 million a month so far. And what I can tell you is we're very happy with the mix that we're seeing. It's very similar to what we've achieved in Select. However, we're writing a bit more business in the boroughs, and that is giving us some geographic diversification. So we're happy with that. So far, everything is right on track.
Speaker 3
Okay. One of the bigger questions I always get is about the competition in downstate New York. You mentioned that some companies are expanding their target areas. Can you provide more information on how competitors are entering that environment?
Yes. So we compete with mostly MGAs in New York. And last year at this time when there was this surge of business from Adirondack Mountain Valley, a lot of companies stopped writing business. And throughout this year, they've just been opening up and writing more classes of business than they've written in the past, but it's not stopping us. Our growth is very healthy. And as I mentioned, every month since June, we've seen a sequential increase in our new business. So again, the way they're expanding is, it's not always obvious to us, but our conversion rate remains really high. So we feel good about where we're at competitively.
Operator
Our next question is from Gabriel McClure with private investor.
Congrats on a great quarter. And also, please thank whoever puts a PDF in place for us, that's very helpful.
Yes. I had one question for you. I think maybe a couple of months ago at the Sidoti conference or somewhere, you mentioned that these states you're looking at expanding into, you kind of described it as there being more demand for our policies that we'd offer on a homeowners policy that we'd offer on an E&S basis than there was supply. And so just my question is a couple of months ago, is the market still that way? Has it changed? Whatever you could offer up?
The homeowners market, especially for those at risk of catastrophe, is facing challenges nationally because companies are struggling to make profits. However, this situation presents us with an opportunity to expand geographically and take advantage of the market conditions, allowing us to achieve returns similar to what we experience in New York. Market conditions tend to be stable within a quarter, and we have not observed any significant changes. We remain confident that opportunities for successful expansion still exist.
Operator
There are no further questions at this time. I would like to turn the conference back over to Meryl for closing remarks.
Excellent. Thank you for joining today. As we wrap up, I'd like to reemphasize what continues to set Kingstone apart, our Select product, our producer relationships, our low expense structure, and our great team. This quarter's results reinforce the durability of our earnings power. We will continue to execute with discipline, advance our measured expansion road map, and allocate capital prudently to support profitable growth. We appreciate your continued support and remain focused on delivering long-term shareholder value. Have a great day.
Operator
Thank you. This will conclude today's conference. You may disconnect your lines at this time, and thank you for your participation.