Operator
Greetings, and welcome to the Kingstone Company's fourth quarter and full year 2025 earnings conference call. As a reminder, this conference is being recorded. I would now like to turn the call over to your host, Stefan Norbham, Kingstone Investor Relations Representative. Thank you. You may begin.
Thank you, and good morning, everyone. Joining us on the call today will be President and Chief Executive Officer, Merrill Golden, Chief Financial Officer, Randy Patton. On behalf of the company, I would like to note this conference may contain forward-looking statements, which involve known and unknown risks and uncertainties, and other factors that may cause results, actual results, to be materially different from projected results. Forward-looking statements speak only as of the date on which they are made, and Kingston undertakes no obligation to update the information discussed. For more information, please refer to the section entitled Risk Factors in Part 1, Item 1A of the company's latest Form 10-K. Additionally, today's remarks may include references to non-GAAP measures. For a reconciliation of these non-GAAP measures to GAAP figures, please see the tables in the latest earnings release available at the company's website at www.kingstonecompanies.com. With that, it's my pleasure to turn the call over to Meryl Holden.
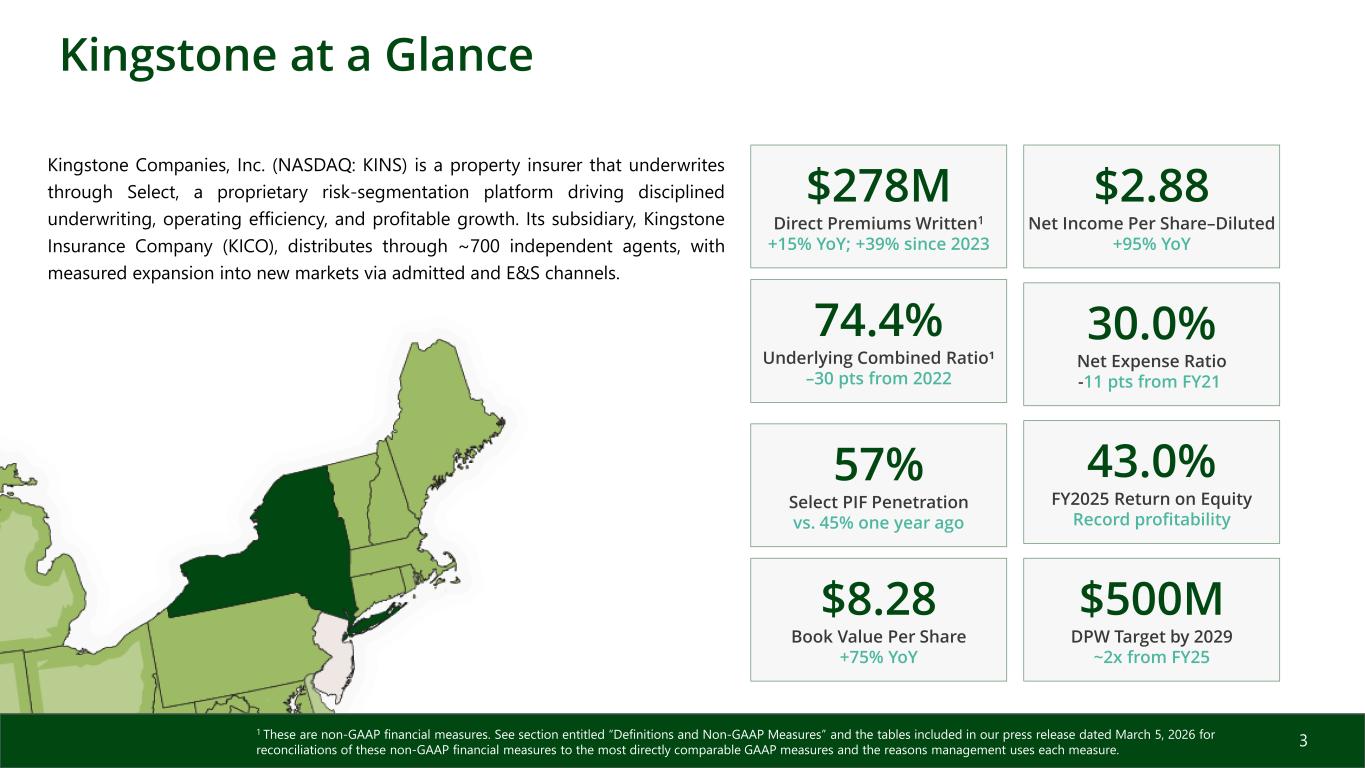
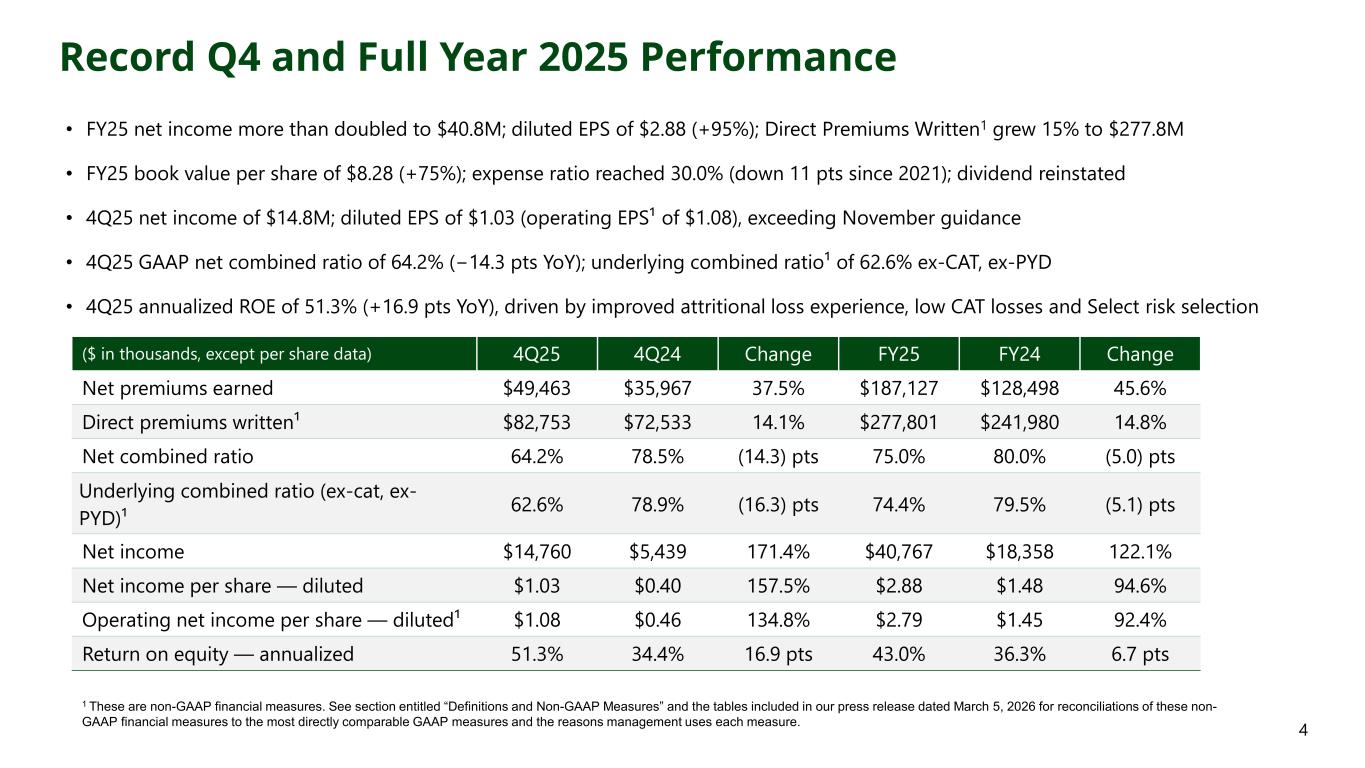
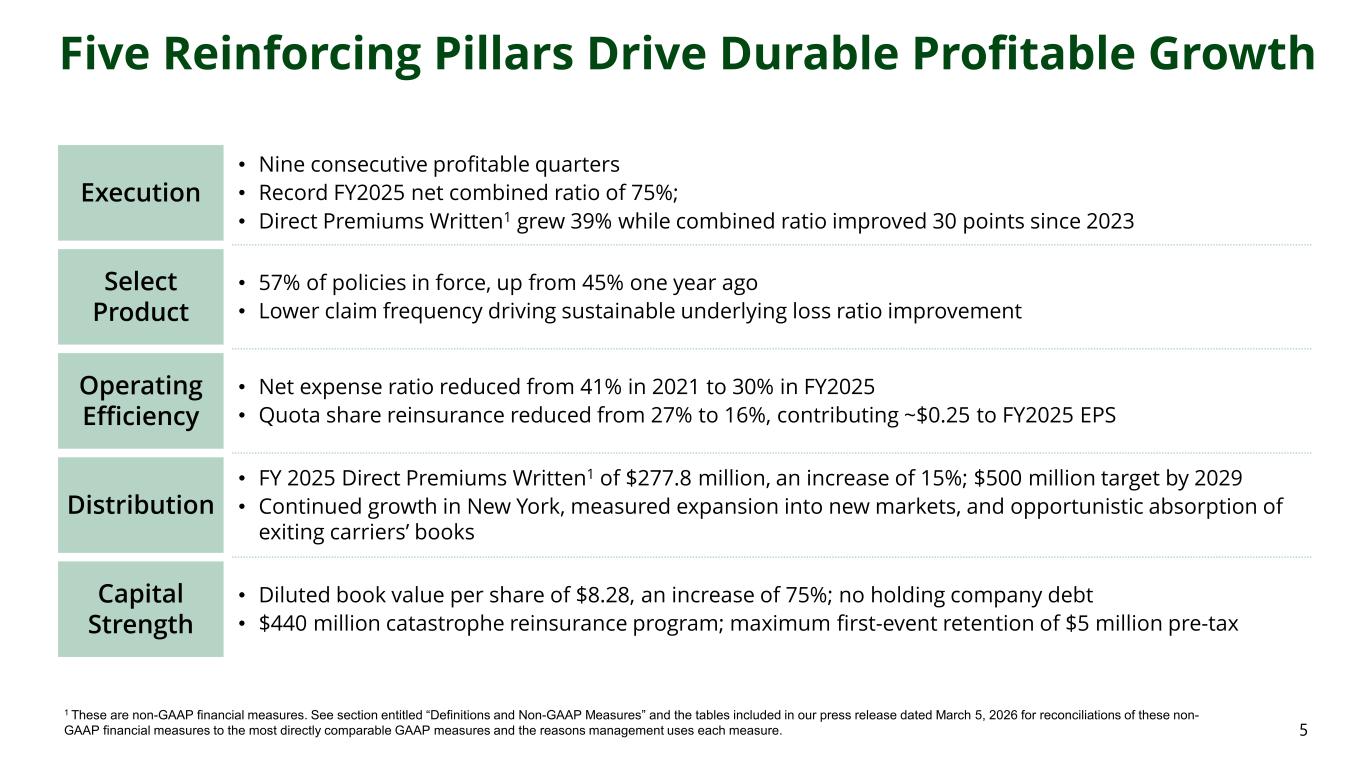
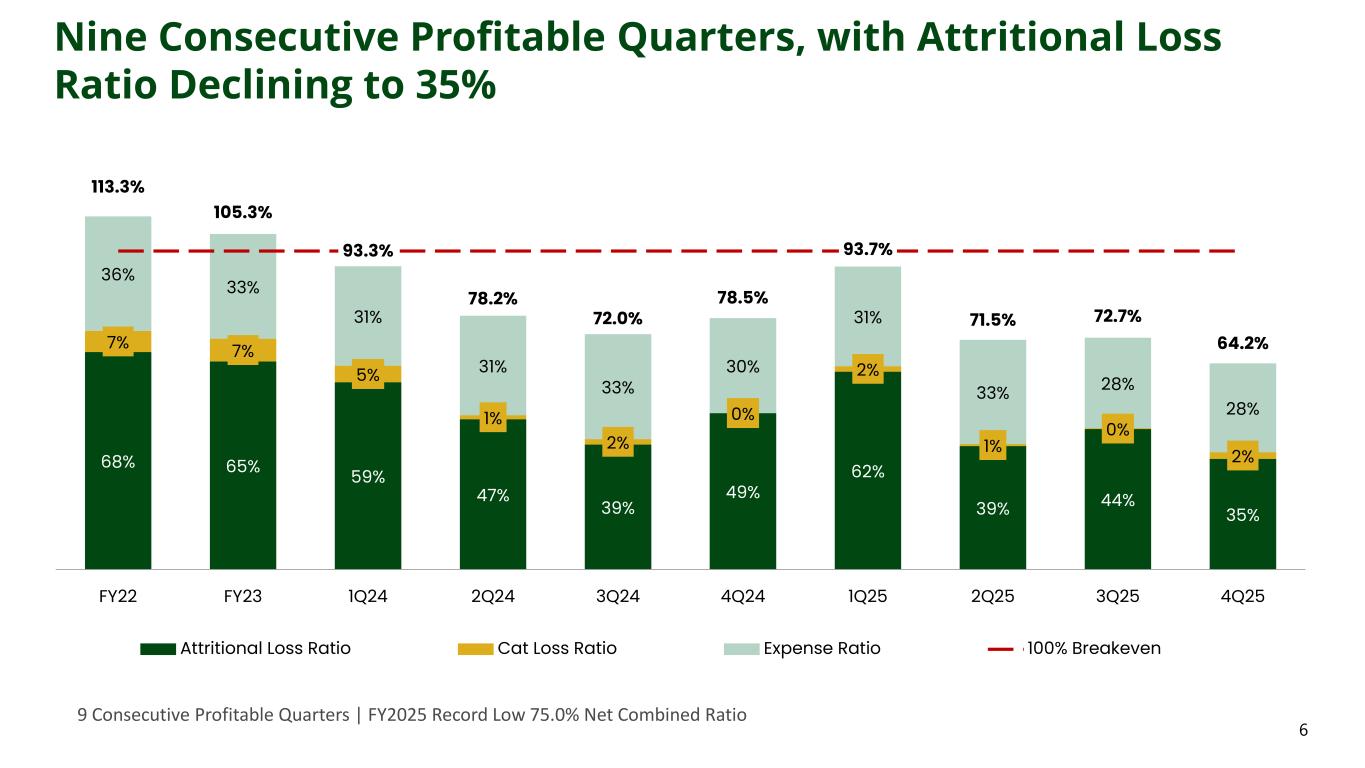
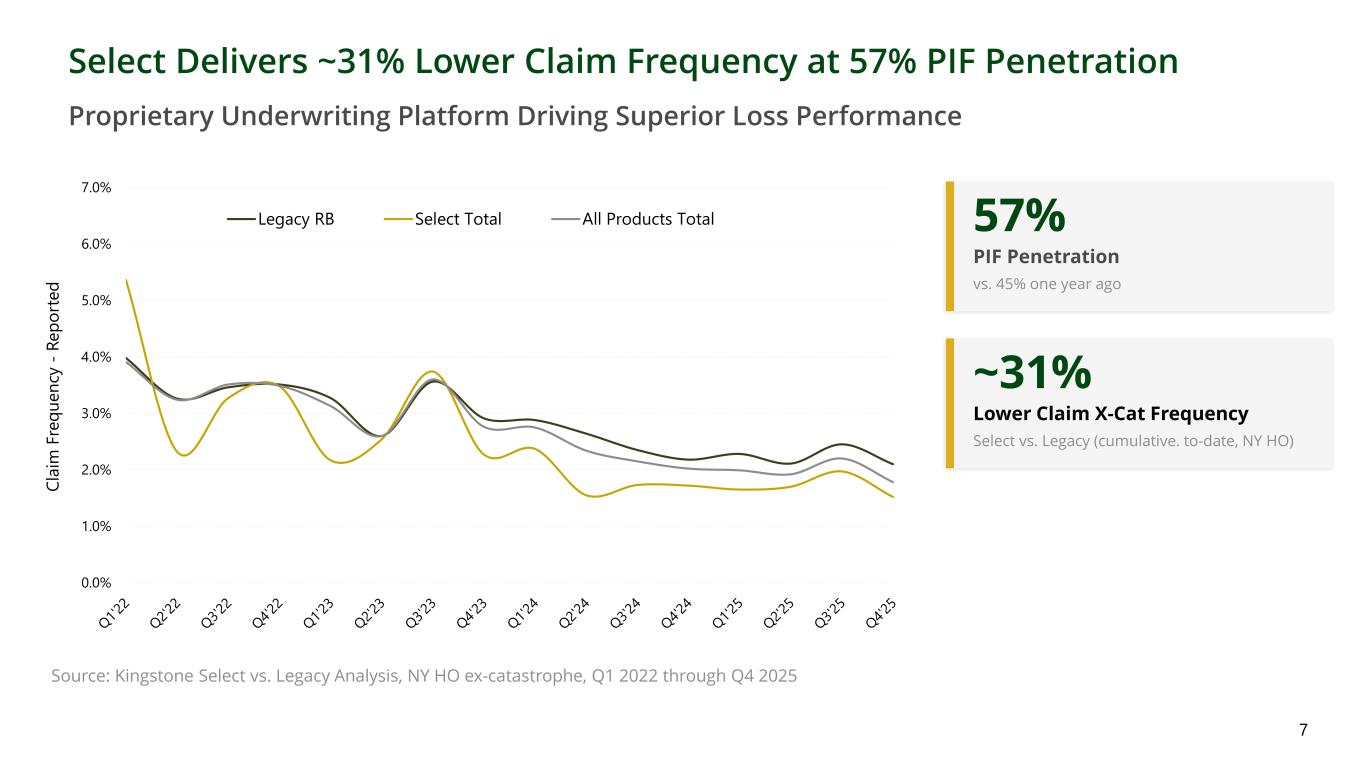
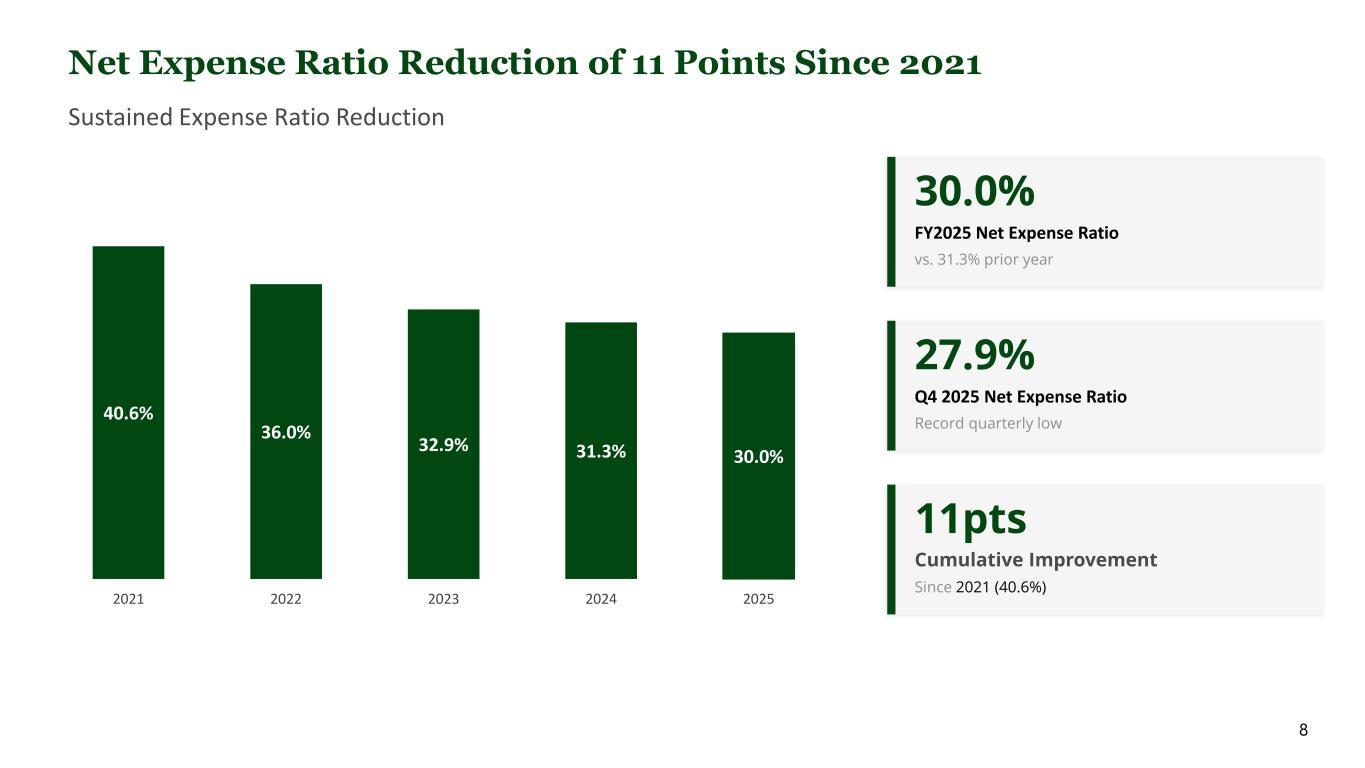
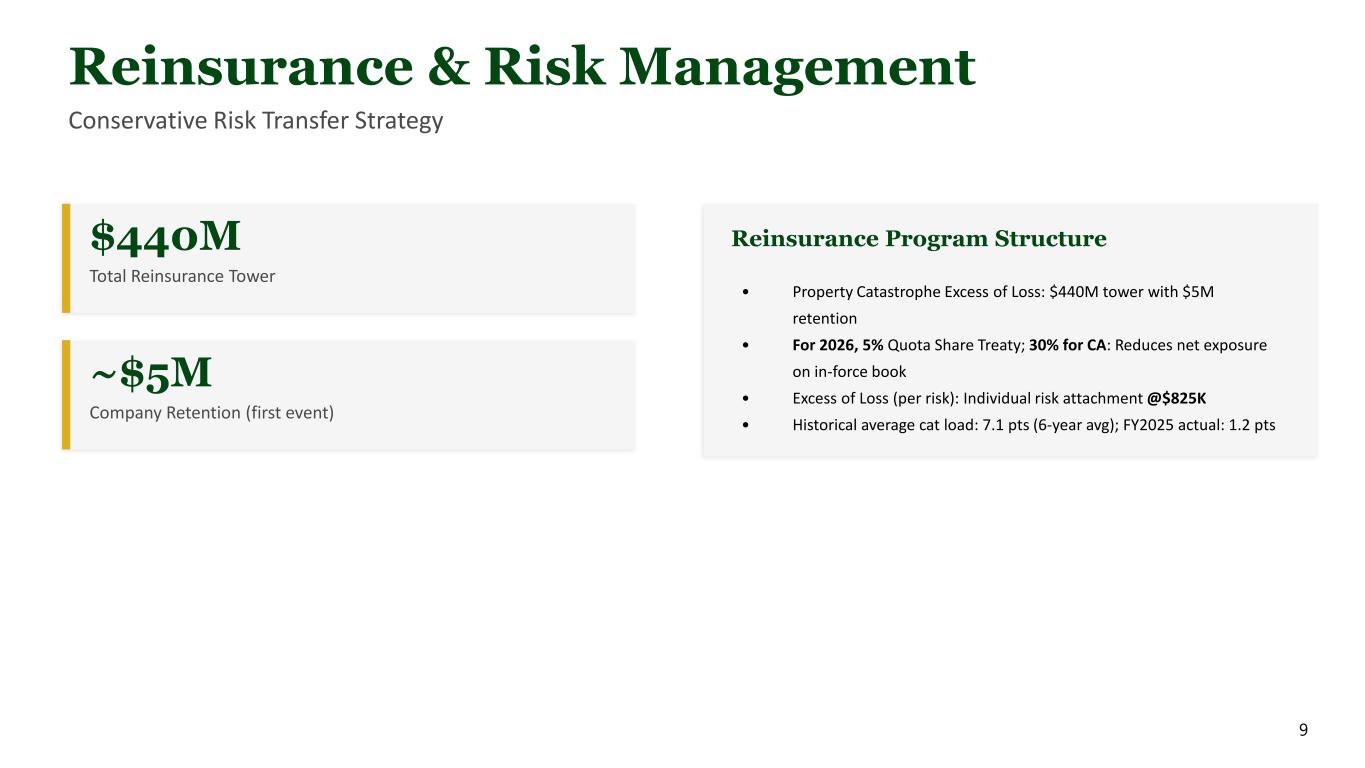
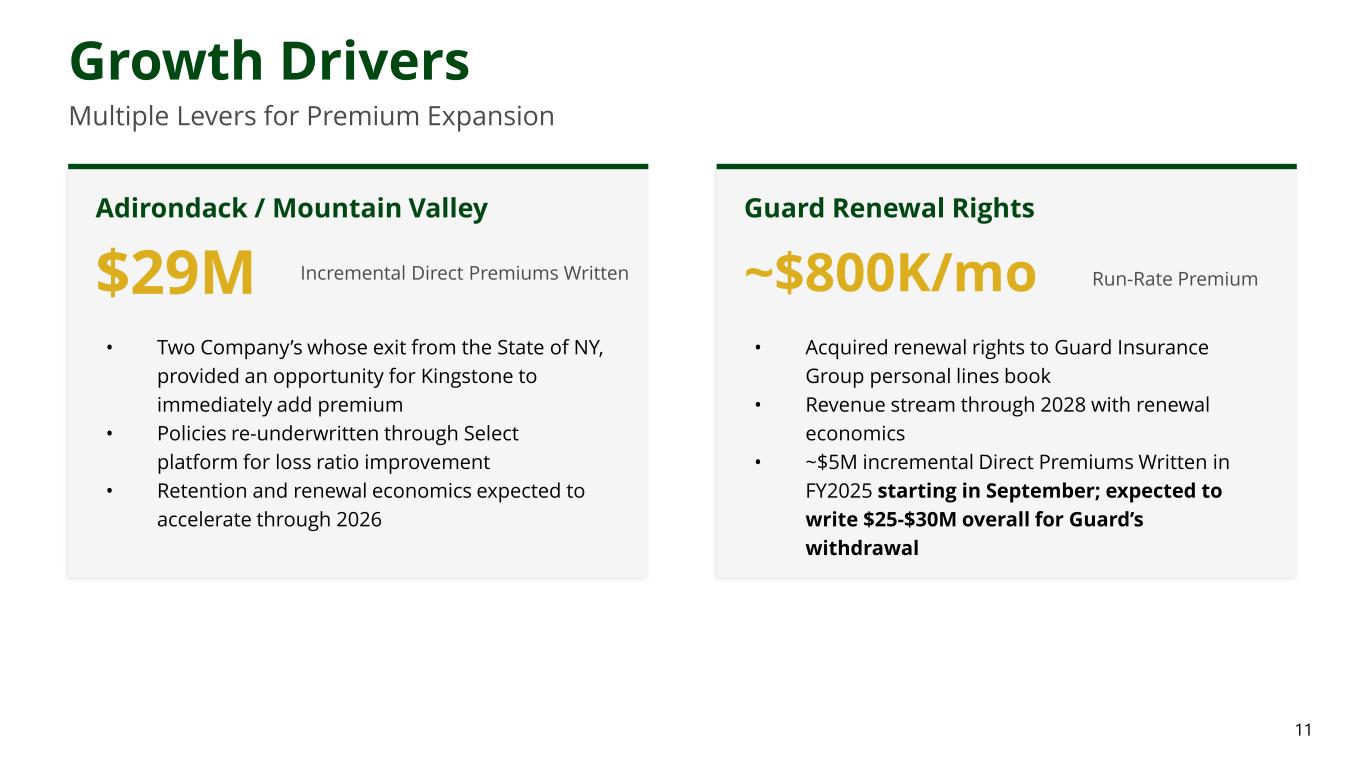
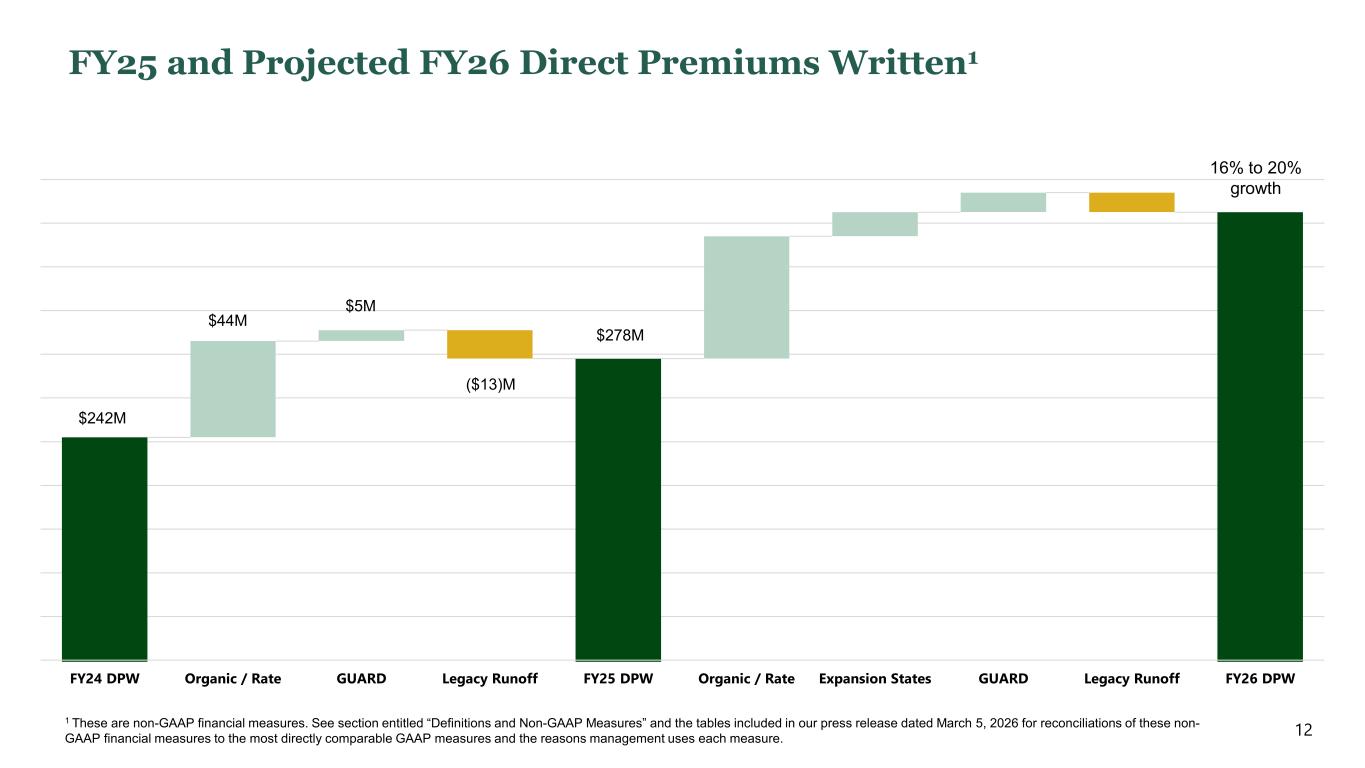
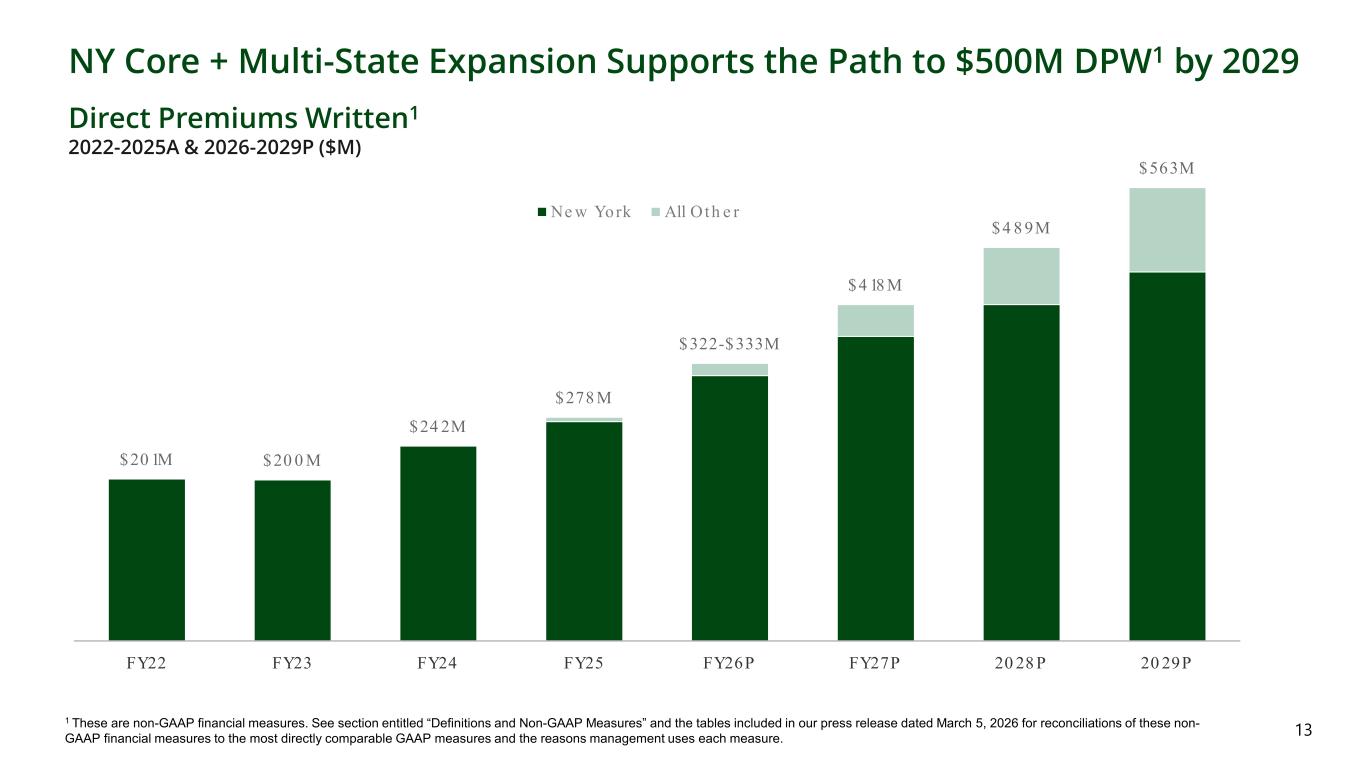
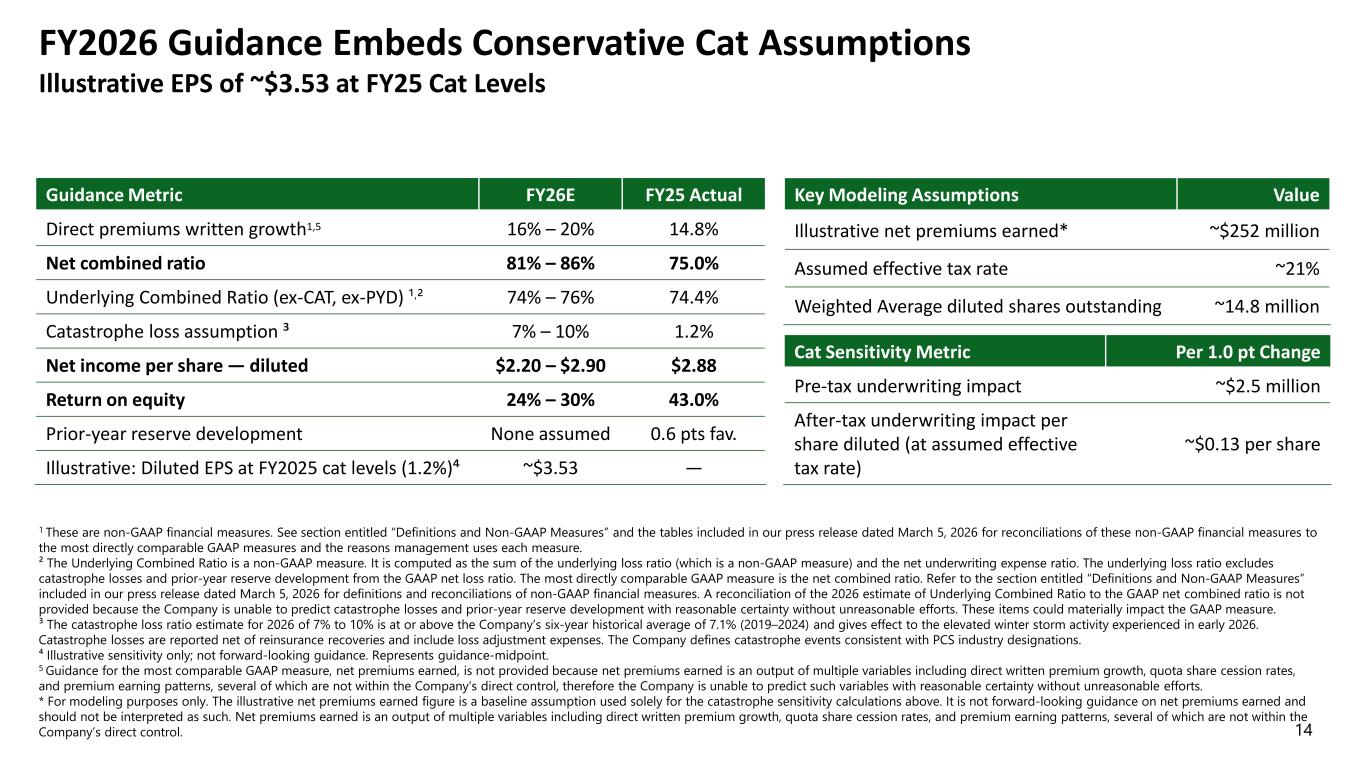
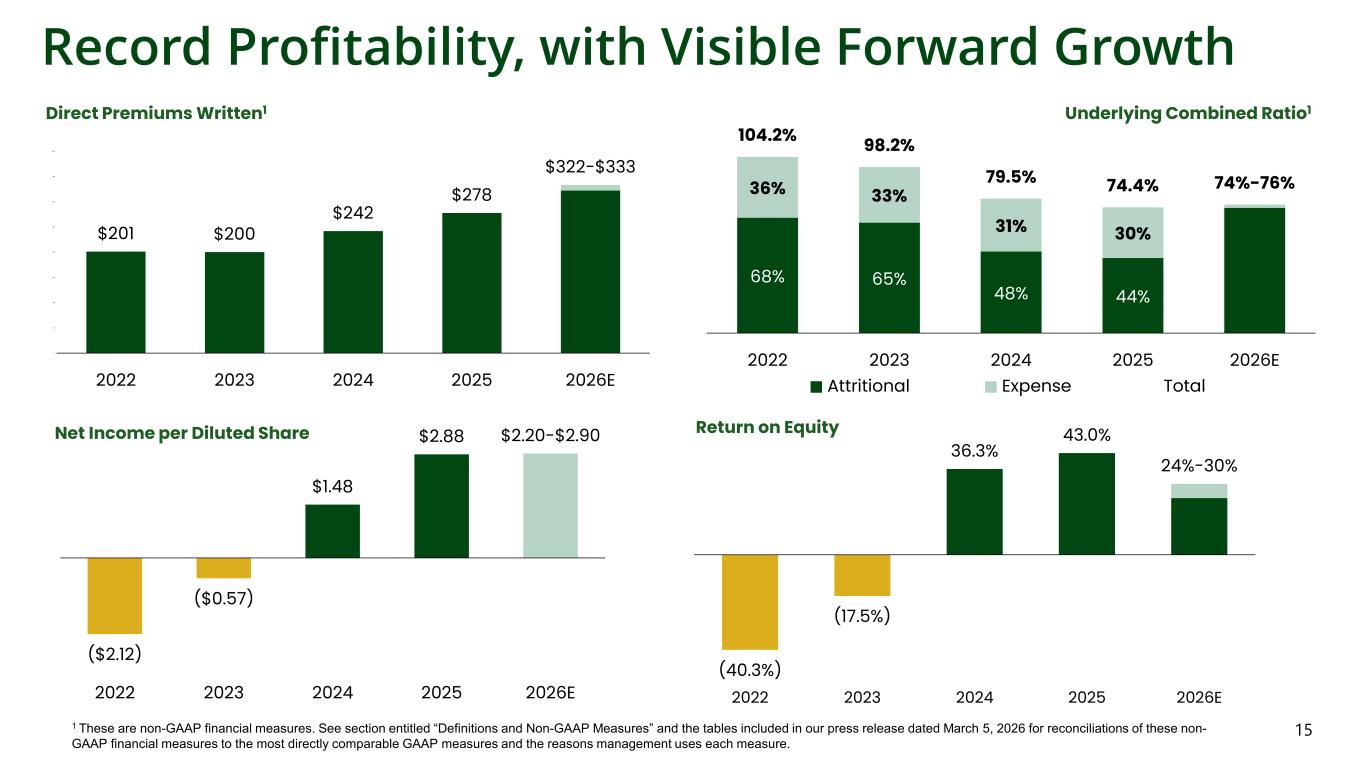
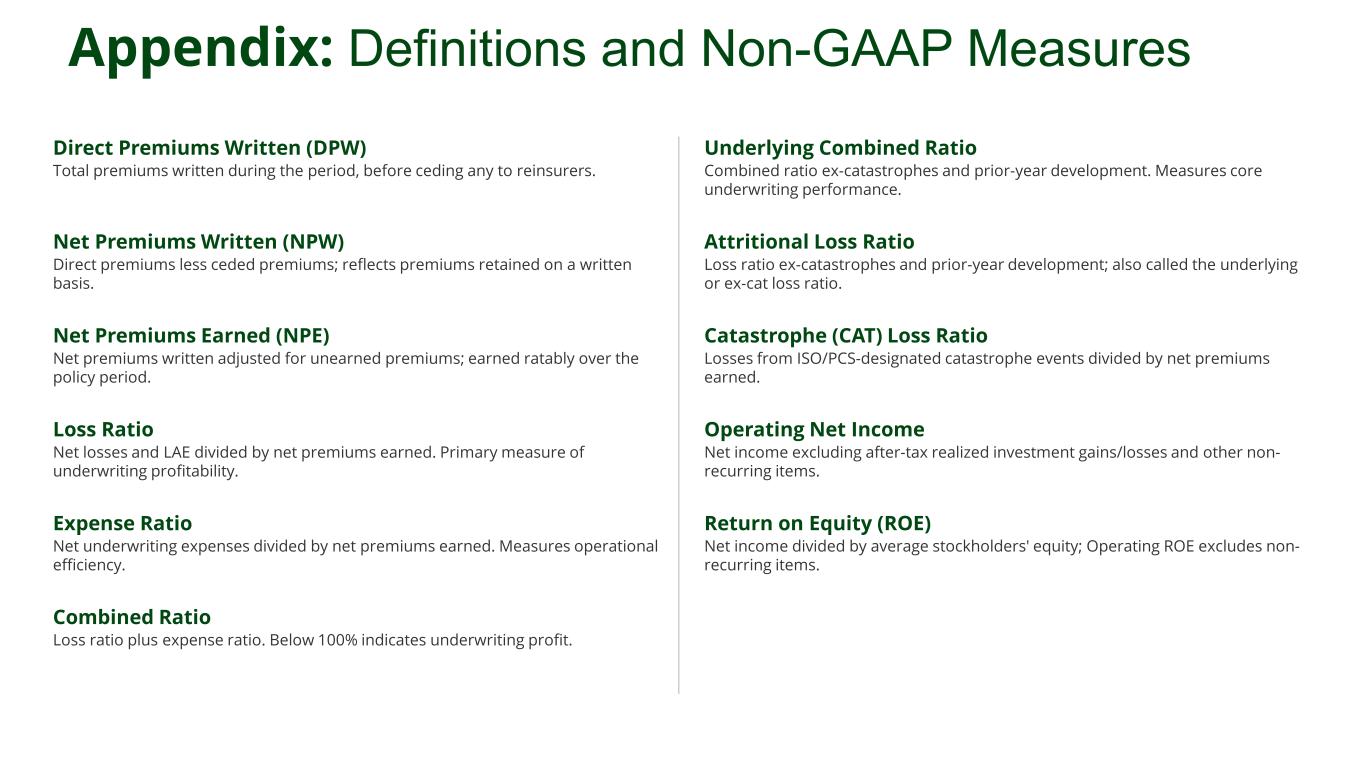
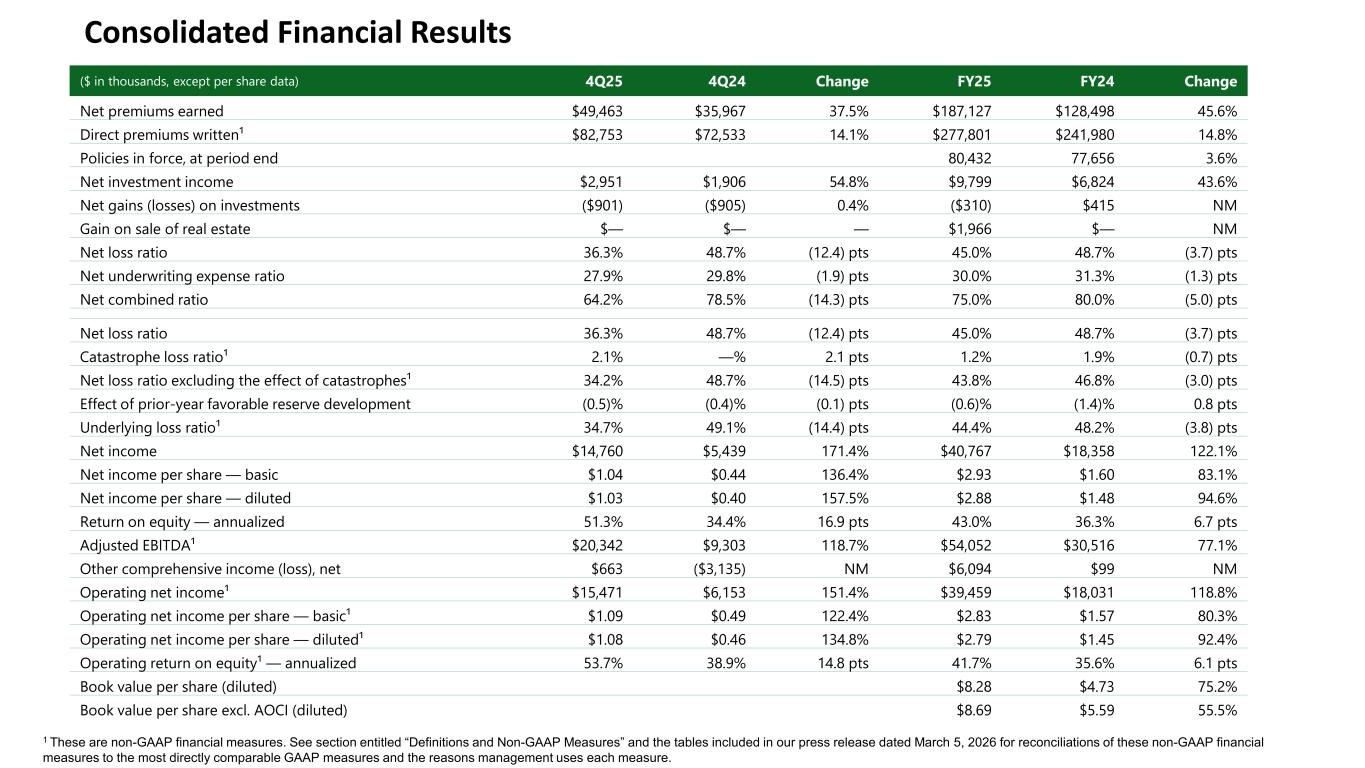
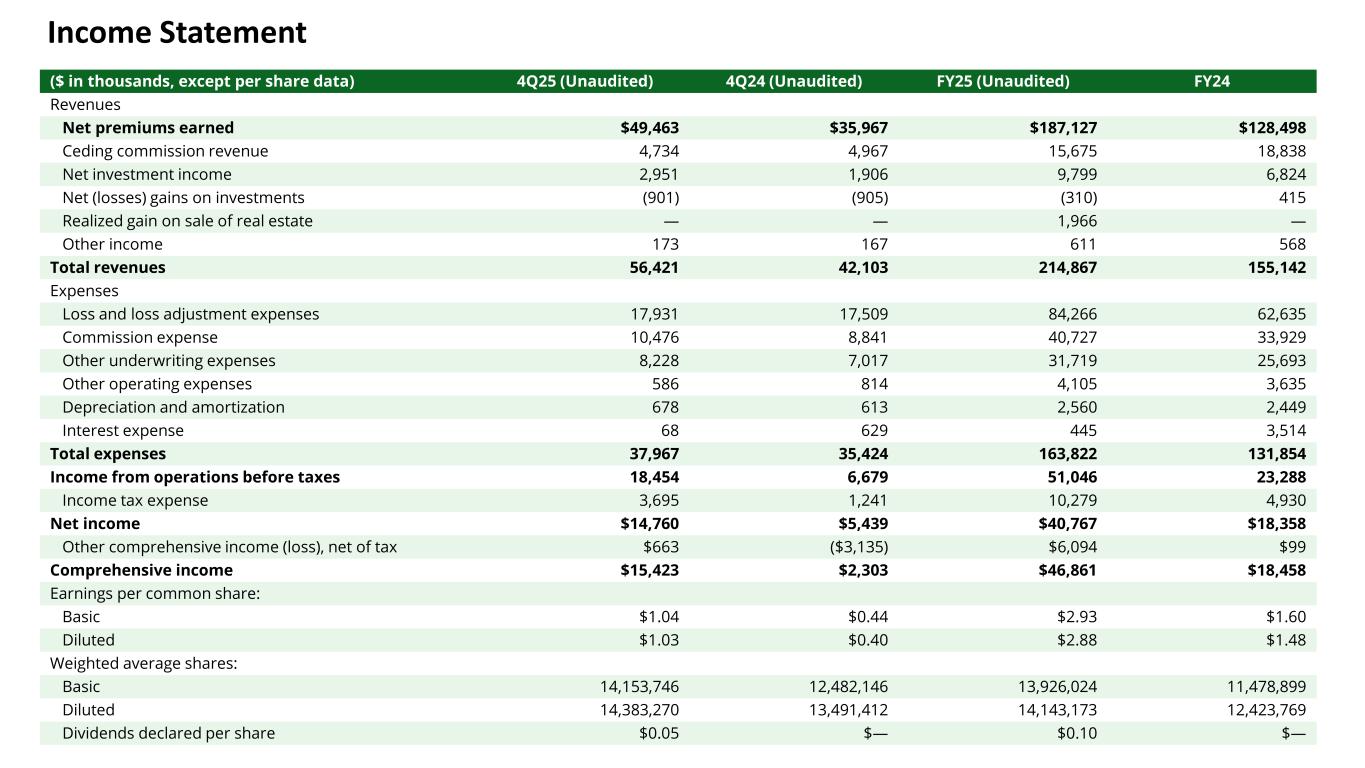
Thanks, Stephan. Good morning, everyone, and thanks for joining our call. I am delighted to share the results of our most profitable quarter and year in Kingstone's I want to thank the amazing Kingstone team and our select producers for making it possible. Let me start with the headlines. In the fourth quarter, we delivered net income of $14.8 million, diluted earnings per share of $1.03, diluted operating earnings per share of $1.08, a gap net combined ratio of 64.2, and an annualized return on equity of 51%. For the full year, net income more than doubled to $40.8 million, diluted earnings per share increased 95% to $2.88, and our return on equity was 43%. These results exceeded the guidance we provided in November. I am particularly proud that from year-end 2023 to year-end 2025, we grew direct premiums written 39% while improving our combined ratio by 30 points. These results are structural, not simply weather-driven, and they validate the transformation we have executed. What sets Kingston apart and what drove these results is clear. First, our select product, now 57% of policies enforced compared to 45% one year ago, continues to improve risk selection, properly matching rate to risk and driving lower claims frequency. Second, our producer relationships generate strong retention and consistent new business flow. Third, our operating efficiency with a net expense ratio that improved from 41% in 2021 to 30% in 2025 provides durable margin advantage. And last, our conservative financial position with no debt and robust reinsurance means we can grow with confidence. Turning to the quarter, direct premiums written grew 14% to $82.8 million, driven by higher average premiums and strong retention. For the full year, direct premiums written grew 15% to $277.8 million, and our New York personal lines policies in force grew over 7%. The hard market conditions in our downstate New York footprint have not changed materially. Demand from our producers remains strong, supported by policies from the Guard Renewal Rights Agreement, which we began writing in September. New business policy count has increased sequentially from Q2, and in Q4 grew 25% over Q3. In this environment, what separates the winners from the rest is straightforward. work, highly segmented products to better assess risk, low expenses, claims execution, and deep producer relationships. We have built these advantages, and we will not chase volume at the expense of underwriting discipline. Net earned premium growth remains a powerful tailwind. Net premiums earned increased 38% in the fourth quarter and 46% for the full year, primarily due to our reduced quota share, which allows us to retain a greater share of premiums and underwriting profits. The decision to reduce our quota share reflects our confidence in the quality of our book and that our underwriting results warrant retaining more premium. As such, we have reduced our quota share even further for 2026, and net earned premium growth will continue to be a tailwind. On underwriting, our fourth quarter net combined ratio of 64.2 reflects exceptional performance across the board. The underlying loss ratio was 34.7, an improvement of over 14 points from the prior year quarter, driven by meaningfully lower claim frequency. The improvement in frequency, particularly for non-weather water, our largest peril, is a trend we have shared throughout the year, and we attribute it to the effectiveness of risk selection in our select prop. During the quarter, we also recognize the benefit from continuing improvements in our claims operations, were faster cycle times, and providing earlier visibility into ultimate property claims cost. For the full year, our underlying loss ratio improved nearly four points to 44.4. and our catastrophe loss ratio was just 1.2 points. I want to be direct. While we benefited from very low catastrophe activity in 2025, our underlying performance improved materially. Even with a normalized catastrophe load, our full year combined ratio would have been in the low 80s, reflecting the differentiated platform we have built. As we shared in the second quarter, we have set a five-year goal of $500 million in direct premiums written by year-end 2029, approximately doubling the size of the company through continued growth in New York, measured expansion into new markets, and strategic inorganic opportunities. I am pleased to share that our first new market will be California, which we will be entering in the second quarter of 26 on an excess and surplus lines basis. California is one of the largest homeowners markets with $15 billion in written premium, almost double the size of New York, and the largest E&S homeowners market in the country where the supply-demand imbalance for homeowners coverage continues to grow. The E&S approach gives us the flexibility to price wildfire risk using forward-looking model, to set prices to achieve our margin requirements, and to apply strict underwriting standards, including rigorous property-level risk selection and real-time accumulation management. We will start small, consistent with our disciplined approach, and scale as we gain confidence in our pricing and product. The initial contribution from California will be modest, less than 5% of our 26 premium, with the vast majority of our volume continuing to come from New York. But the opportunity is enormous, and California will become a large contributor to our growth over time. Turning to our outlook for 26, I want to explain important change in how we're reframing our outlook for this year because we think it will help investors better understand our business. Starting this year, we're introducing the underlying combined ratio, which excludes catastrophe losses and prior year reserve development as our primary operating lens. We define it as the underlying loss ratio plus the net expense ratio. This metric isolates the performance we control, including pricing, risk selection, claims management, and operating efficiency from the inherent volatility of catastrophe events. In 2025, our underlying combined ratio was 74.4, an improvement of 5.1 points from 79.5 in 2024. That improvement is structural. It reflects select product penetration, earned rate adequacy, and operating leverage is independent of catastrophic weather events. At the same time, our record combined ratio of 75 benefited from an outlier low catastrophe loss ratio of just 1.2 points. To put that in context, the six-year average cat loss ratio from 2019 through 24 is 7.1 points. Both 24 and 25 were well below the average, including two consecutive mild winters. So when you look at our 26 guidance, I want to be very clear about the bridge. The headline year-over-year change in earnings per share and return on equity is driven almost entirely by our assumption of a higher-than-normal catastrophe load, not by any deterioration in our underlying business. In fact, our underlying combined ratio guidance of 74 to 76 is comparable to 2025. The headline story is straightforward. The controllable business is healthy and growing. The year-over-year change reflects cat normalization. Here is our updated guidance for fiscal year 2026, direct premiums written growth of 16 to 20%, an underlying combined ratio excluding catastrophes and prior year reserve development of 74 to 76, a catastrophe loss assumption of 7 to 10 points, which is at or above the six-year historical average and reflects the elevated winter storm activity we experienced in the first quarter of 2026 and a net combined ratio of 81 to 86. Diluted earnings per share of 220 to 290 with a midpoint of 255 reflects an increase at the midpoint relative to our initial outlook and the benefit of a lower quota share session for the 26 treaty year. Our 16% to 20% direct premium growth target keeps us on pace toward our five-year goal of $500 million in direct premiums written by year-end 2029. I want to give investors the tools to model different catastrophe scenarios. On an illustrative basis, and this is not guided, each one point of catastrophe loss ratio has approximately a 13 cent impact on diluted earnings per share. So if you want to see what our earnings power looks like at fiscal year 2025 cat levels of 1.2 points, the illustrative answer is approximately $3.53 per diluted share, which This represents 23% growth year over year. That is the underlying trajectory of this business. I want to emphasize that weather is unpredictable and our 2026 guidance assumes a higher than average catastrophe year given the winter weather in the first quarter of 2026. As reminder, our catastrophe reinsurance program limits our maximum first event loss to 5 million in pre-tax, or approximately 27 cents per share after tax, whether from a hurricane or a winter storm. We will refine our outlook as the year unfolds. Before I hand it to Randy, I want to briefly address the regulatory proposals in New York regarding homeowner insurer profitability. We share the goal of affordability for consumers, and we are monitoring these proposals closely and engaging constructively through industry bodies. We believe any final legislation will need to account for the inherent volatility of catastrophe-exposed property insurance and the importance of maintaining carrier capacity and availability for New York homeowners. We will continue to execute with discipline, advance our measured expansion roadmap, and allocate capital prudently to drive sustained, profitable growth. I remain highly confident in Kingston's strategic direction and fully committed to creating long-term shareholder value. With that, I'll turn the call over to Randy Patton, our Chief Financial Officer, for a more detailed review of our results.
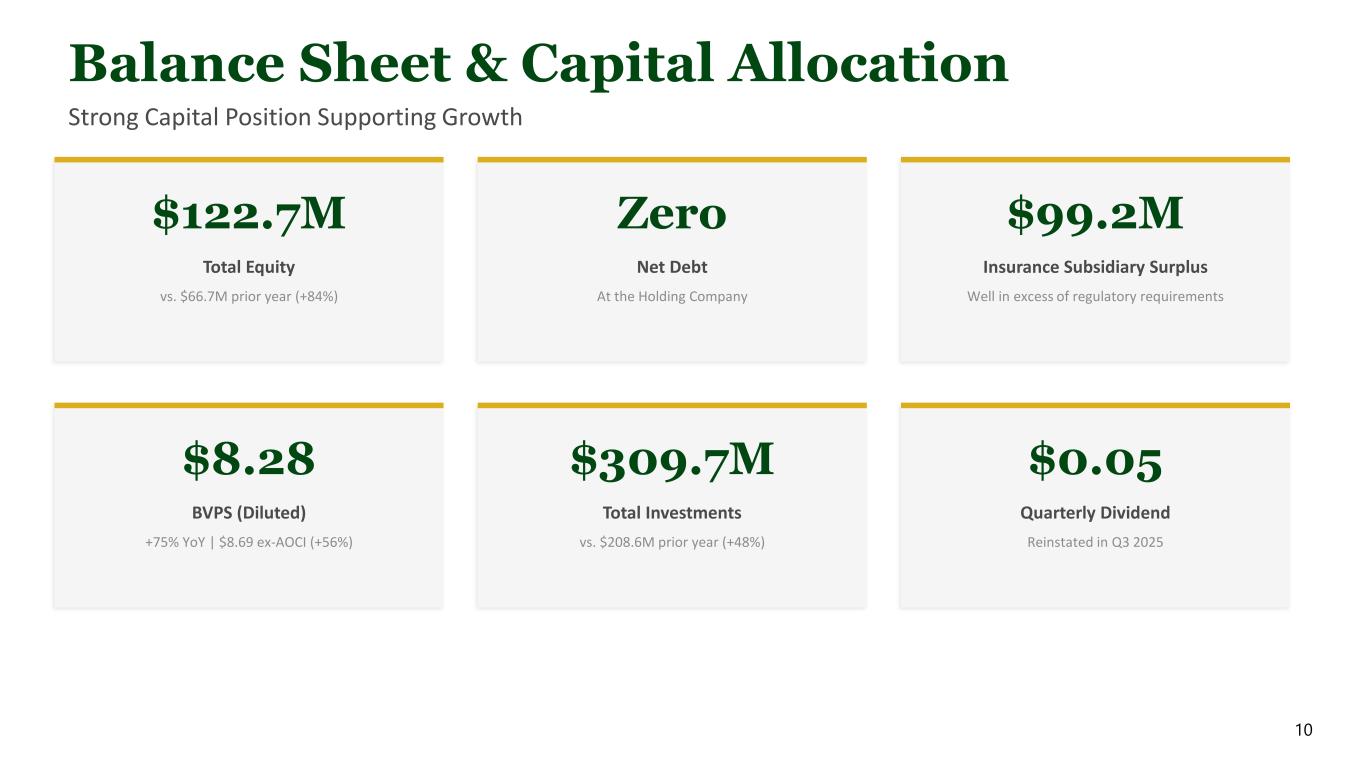
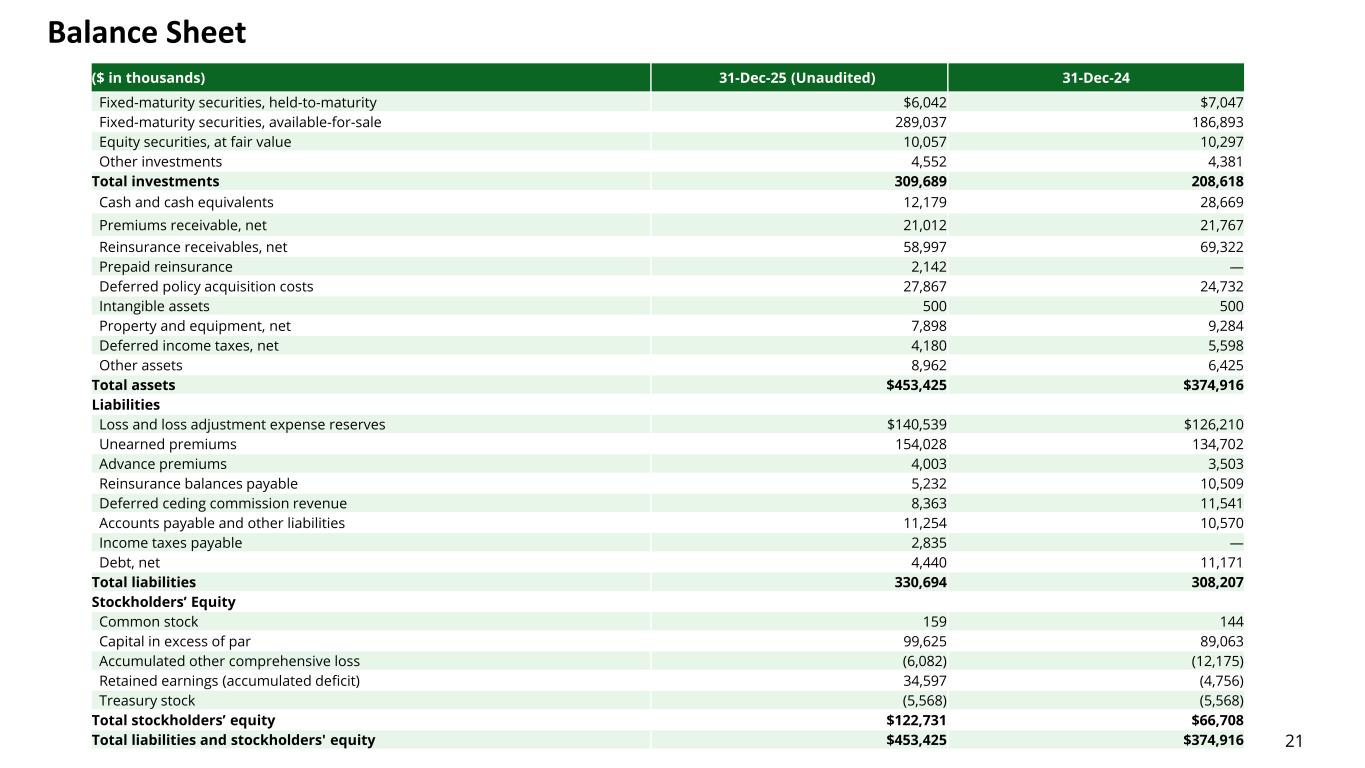
Thank you, Marilyn. Good morning again, everyone. The fourth quarter was our most profitable quarter in the company's history and our ninth consecutive quarter of profitability. During the quarter, we reported net income of 14.8 million, diluted earnings per share of $1.03, a 64.2% combined ratio, and an annualized return on equity of 51%. For the full year, net income was 40.8 million, more than doubling the prior year and the most profitable in company history. Performance is driven by strong net earned premium growth as our reduced quota share and our second half of 2024 new business surge continue to earn in. This was combined with very low catastrophe losses, favorable frequency trends, and lower expenses aided by adjustment to the sliding scale seeding commissions due to both an improvement in nutritional loss ratio and low catastrophe losses. As a reminder, the quota share reduction from 27% to 16% for the 2025 treaty year reflected the improved quality of our book and increased our projected earnings per share by approximately 25 cents for 2025. For the 2026 treaty year, we have further reduced our quota share recession from 16% to 5% reflecting continued confidence in the quality of our underwriting portfolio and capital positions that support our growth. This reduction is expected to increase projected earnings per share by approximately 20 cents for 2026 and is incorporated in our updated guidance ranges. Our net investment income for the quarter increased 55% to $3 million, up from $1.9 million last year. For the full year, we achieved a 44% increase, reaching $9.8 million. The momentum is due to robust cash generation from operations, which has enabled us to grow our investment portfolio to $309.7 million and benefit from higher fixed income yields. We also continue to reposition a portion of the portfolio to capitalize on attractive new money yields of 4.7% in the fourth quarter. While we remain conservative in our investment strategy, we are actively seeking opportunities to enhance our portfolio yield and duration. As of December 31st, 2025, our fixed income yield is 4.3% with an effective duration of 4.4 years up from 3.7% and 3.9 years at December 31st, 2024, an increase of 60 basis points and a half year respectively. During the quarter, we recognized an additional 1 million in sliding scale contingent seeding commissions under our quota share treaty, with about half the adjustment coming from lower attritional losses and half from lower catastrophe losses, which contributed to the 1.9 percentage point decrease in the 27.9% expense ratio reported in the fourth quarter. For the full year of 2025, we reported an expense ratio of 30%. An improvement of 1.3 percentage points from the prior year, reaching 30% for the expense ratio is an important milestone for the company. As a reminder, the company's expense ratio was 41% in 2021. In four years, we have successfully lowered the expense ratio by 11 points through several expense initiatives. I'd now like to provide some detail on the guidance framework Merrill introduced. For the full year of 2025, our underlying combined ratio was 74.4%, comprised of a 44.4% underlying loss ratio and a 30% expense ratio. This was a 5.1-point improvement from 79.5% in the prior year. For the full year of 2026, we are guiding to an underlying combined ratio of 74% to 76%, reflecting continued benefits from our select product and operating leverage. Our full year 2025 catastrophe loss ratio of 1.2 points was well below the six-year historical average of 7.1 points for the 2019 through 2024 period. Our full year 2026 guidance includes 7 to 10 points of catastrophe losses, which is above our historical average and incorporates the elevated winter storm activity experienced during the first quarter of 2026. The difference between our full-year 2025 reported combined ratio of 75% and our full-year 2026 guided range of 81% to 86% is mostly attributable to the inclusion of above-average catastrophe losses and minimal change to our underlying combined ratio. I will conclude my portion of the call today discussing our capital position. We have no debt to holding company. shareholder equity ended the year at $122.7 million and increased by 84% during the year. Book value dilute share increased 75% to $8.28 and book value excluding and accumulating other comprehensive income increased 56% to $8.69. For 2025, return on equity is 43% and increase of nearly seven percentage points from the prior year. Given this foundation and our outlook, we declared our third consecutive quarterly dividend during the first quarter of 2026 and have ample capital to fund the Discipline and Growth initiatives that Merrill outlined. With that, I will now turn the call back to Merrill for closing remarks.
Thanks, Randy. I just want to underscore one thing. The results we're sharing today reflect the durable competitive advantages we have built in underwriting, in our producer relationships, and in our operating model. We are entering 26 with a strong foundation, a clear roadmap for profitable growth, and the financial flexibility to execute. We look forward to updating you as the year progresses. Operator, we're ready for questions.
Operator
Thank you. The floor is now open for questions. If you would like to ask a question, please press star 1 on your telephone keypad at this time. A confirmation tone will indicate that your line is in the question queue. You may press star 2 if you would like to remove your question from the queue. For participants using speaker equipment, it may be necessary to pick up the handset before pressing the star keys. Again, that's star 1 to register a question at this time. Our first question today is coming from Bob Farnum of Breen Capital. Please go ahead.
Hey there and good morning. I have a couple questions. Let's just talk about California first, because obviously California risks are not quite the same as, you know, downstate New York risks. So I kind of want to know, and I think this is going to be your first foray into kind of the access and surplus lines basis of writing things. So I just want to know, like, how do you see the differences in the risks? How do you expect performance-wise? I'm just trying to get a little bit more color as to how California may be different from New York.
Sure. So, you know, we hired an actuarial consulting firm earlier this year to look at the landscape of all the catastrophe exposed property markets for Kingstone to expand. And California came out on top because it's a very large market. it's dislocated, and it's completely diversifying for Kingstone relative to New York. So our plan is to enter with the same differentiators as we have in New York. We're going to be using our select product, and that same firm that helped us build the select product is helping us modify it to be appropriate for the California market. it. We are entering a ZNS, so we can have a highly segmented product and use best-in-class models for underwriting and rating of wildfire risk and for risk aggregation. And we're fortunate that we have some underwriters and some claims employees that have experience in California, so that will be really helpful to us. But mostly, the point I want to make about our entering into California is that we will be disciplined. Our plan is to enter small, less than 5% of our premium for 2026, make sure we understand the market and we're doing everything right before we expand.
And if I read right in the presentation, you have a 30% quarter share on the California business? Is that right?
That's correct. out of an abundance of caution, we have a 30% quota share for California initially.
Okay, and are you looking to, you're right, all across California? Are you looking like Northern California, Southern California, or Coastal California, you know, where the wildfires could possibly be? I'm just kind of curious, you know, obviously in New York you have a specific targeted area, so I don't know if California would be similar.
Yes. So in California, we're going to write all across the state, it's really important to manage our concentration in any area of California to manage the wildfire exposure. And we'll be doing that in real time. And, you know, we're focused on low to moderate wildfire risk.
Okay. Same kind of target size value for homes as in New York? Same as New York.
Just change tack a little bit here. So your expense ratio, obviously you've had a lot of progress getting it down to 30%. Do you see – like where do you see a happy run rate as to where that expense ratio can get to? Are you pretty much where you should be, or do you think you can still squeak some improvement out of that?
Randy, do you want to take that?
Hey, Bob. Good morning. Yeah, so reaching a 30% expense ratio is a huge milestone for the company. As you know, if you look back to 2021, we were at 41%. I think with some economies of scale, you know, we can get that expense ratio down, you know, possibly another half to a full point. But, you know, it's kind of where we expect it to be, you know, kind of in that 29% to 30% range is where we're ultimately we're comfortable with that expense range.
I just want to add, Bob, that most of the expense to enter California has already been incurred in terms of developing the product, programming the product. And we'll likely need to add some staff, but a modest amount of staff as we continue to grow in California. So I think we're going to get scale economies like the platform we've built is scalable.
Yeah, right. I saw that in the presentation. You're talking about your ability to scale up is not going to have a whole lot of impact on the expenses at this point.
Last question for me. I probably ask you every quarter, but obviously with such profitable business, there's been a change in competition at this point in New York. You know, it's just something that baffles me that you don't have a whole bunch of other companies trying to get into the same market to try to capture the same profitability.
Yeah, I mean, we've been hearing lately about different companies planning to entering the state. But let's not forget that competition has come and gone in New York, and Kingstone has been able to execute regardless of the competitive environment. We are in a really good place in downstate New York. We have our select product that properly matches rate to risk, low expenses. We're providing great service to our producers and our policyholders, and we have very deep and broad producer relations. So I feel confident we can compete successfully with whoever is entering New York State.
Okay, good answer. Congrats on a great year. That's it for me.
Operator
Thank you. Again, that's star one to register a question. Our next question is coming from Gabriel McClure, a private investor. Please go ahead.
Good morning and congrats on an outstanding quarter. Thanks, Gabe. Yeah, so I think Bob asked most of the questions that I had for you. I just want to circle back on the exposure limits on the policies in California. Can you remind us again what our exposure limits are on our New York policies?
Sure. We just, in New York, increased the available coverage A, or value of the home, to $5 million. So we had been operating with a max of $3.5 million for all of last year, and we've just increased to $5 million. And that would be our plan for California as well. We're going to start off with a cap that's a bit lower. And as we gain confidence in our product, we'll open up to $5 million as well.
Okay. Okay, got it. And then I think in your prepared remarks, you made a little bit of reference to the winter storm that y'all had a couple of weeks ago. Did we have some noticeable claim activity from that storm? It looked pretty bad from out here in Arizona.
Yeah, Gabe, it's obvious you're not in the Northeast because it has been a bad winter. We haven't just had one winter storm. There have actually been seven catastrophe events that have been declared since January 23rd. So the one thing I want to say is our claims department has been working so hard. I'm so proud of the way they've managed this catastrophe event and the service that they've been able to provide to our policyholders. And our estimates for the winter storm losses has been included in our guidance for 2026. So we've mentioned that we're planning for an at or above average catastrophe last year of seven to 10 points, and that includes the catastrophe activity from Q1. Hopefully the winter's over and there won't be any more catastrophes declared.
Okay. I hope so. Okay. And then just last thing, the California opportunity is super exciting and interesting.
I know Bob answered really or asked most of my questions already, but is there anything interesting or anecdotal that you have about the California market that you might want You know, I think what is really important to understand is that the market is in need of capacity, and many people think that's because of wildfire, and certainly wildfire is a major risk for California. But the primary issue in California is the regulatory environment, which precludes companies from charging adequate prices for the underlying exposure. So as an ENS writer, we're not subject to that same regulation. So it gives us a real advantage. And that's why you're seeing in California, the ENS market for homeowners is growing faster than any other place in the United States. So I think it's a terrific opportunity to highlight the differentiators that Kingstone brings to the market, particularly relative to pricing sophistication and producer relationships. And I'm really excited to start writing business there in Q2.
Sounds really good. That's all for me. Thanks, Meryl.
Operator
Once again, that's star one. If you would like to register a question at this time, we'll pause for any additional questions. we're showing no additional questions in queue at this time i'd like to turn the floor back over to miss golden for closing comments great thank you everyone for joining us today it's a really exciting time for kingstone and we appreciate your support have a wonderful day ladies and gentlemen this concludes today's event you may disconnect your lines or lock off the webcast at this time and enjoy the rest of your day