Operator
Thank you for standing by. My name is Rebecca, and I will be your conference operator today. At this time, I would like to welcome everyone to the LXP Industrial Trust Fourth Quarter 2025 Earnings Call and Webcast. All lines have been placed on mute to prevent any background noise. After the speaker's remarks, there will be a question and answer session. If you would like to ask a question during this time, simply press star followed by the number one on your telephone keypad. If you would like to withdraw your question, press star one again. Thank you. I would now like to turn the call over to Heather Gentry, Investor Relations. Please go ahead.
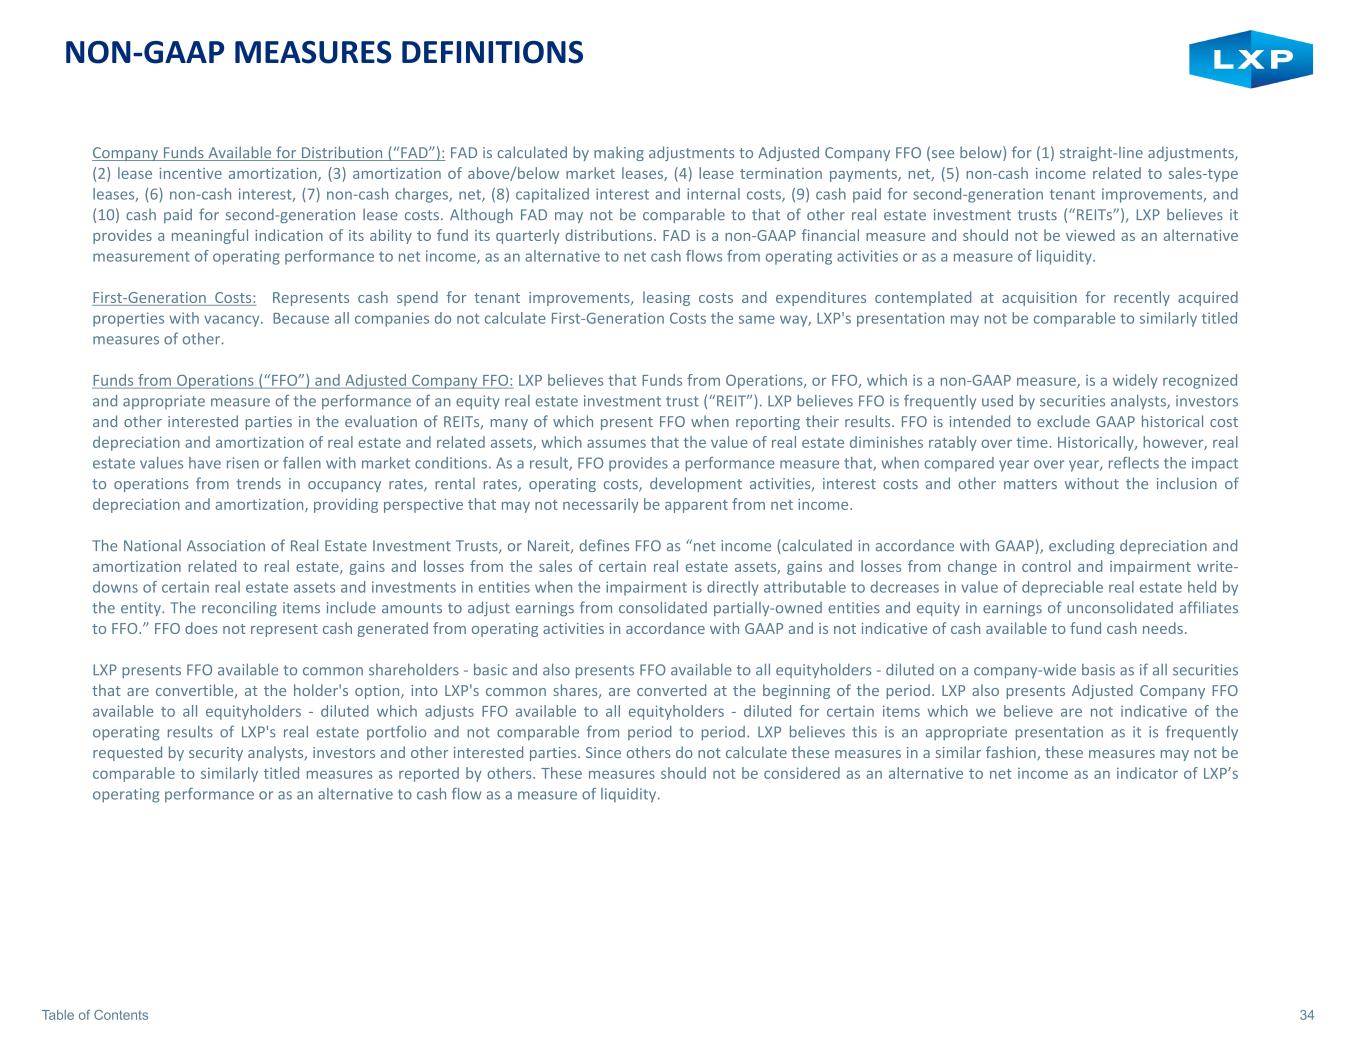
Thank you, Operator. Welcome to LXP Industrial Trust's fourth quarter 2025 earnings conference call and webcast. The earnings release was distributed this morning, and both the release and quarterly supplemental are available on our website at www.lxt.com in the Investors section and will be furnished to the SEC on a Form 8K. Certain statements made during this conference call regarding future events and expected results may constitute forward-looking statements within the meaning of the Private Securities Litigation Reform Act of 1995. LXP believes that these statements are based on reasonable assumptions. However, certain factors of risks, including those included in today's earnings press release and those described in reports that LXP files with the SEC from time to time, so cause LXP's actual results to differ materially from those expressed or implied by such statements. Except as required by law, LXP does not undertake a duty to update any forward-looking statements. In the earnings press release and quarterly supplemental disclosure package, LXP has reconciled all non-GAAP financial measures to the most directly comparable GAAP measure. Any references in these documents to adjusted company FFO refer to adjusted company funds from operations available to all equity holders and unit holders on a fully diluted basis. Operating performance measures of an individual investment are not intended to be viewed as presenting a numerical measure of LXP's historical or future financial performance, financial position, or cash flow. On today's call, Will Eglin, Chairman and CEO, and Nathan Brunner, CFO, will provide a recent business update and commentary on fourth quarter results. Brendan Mullenix, CIO, and James Dudley, Executive Vice President and Director of Asset Management, will be available for the Q&A portion of this call. I will now turn the call over to Will.
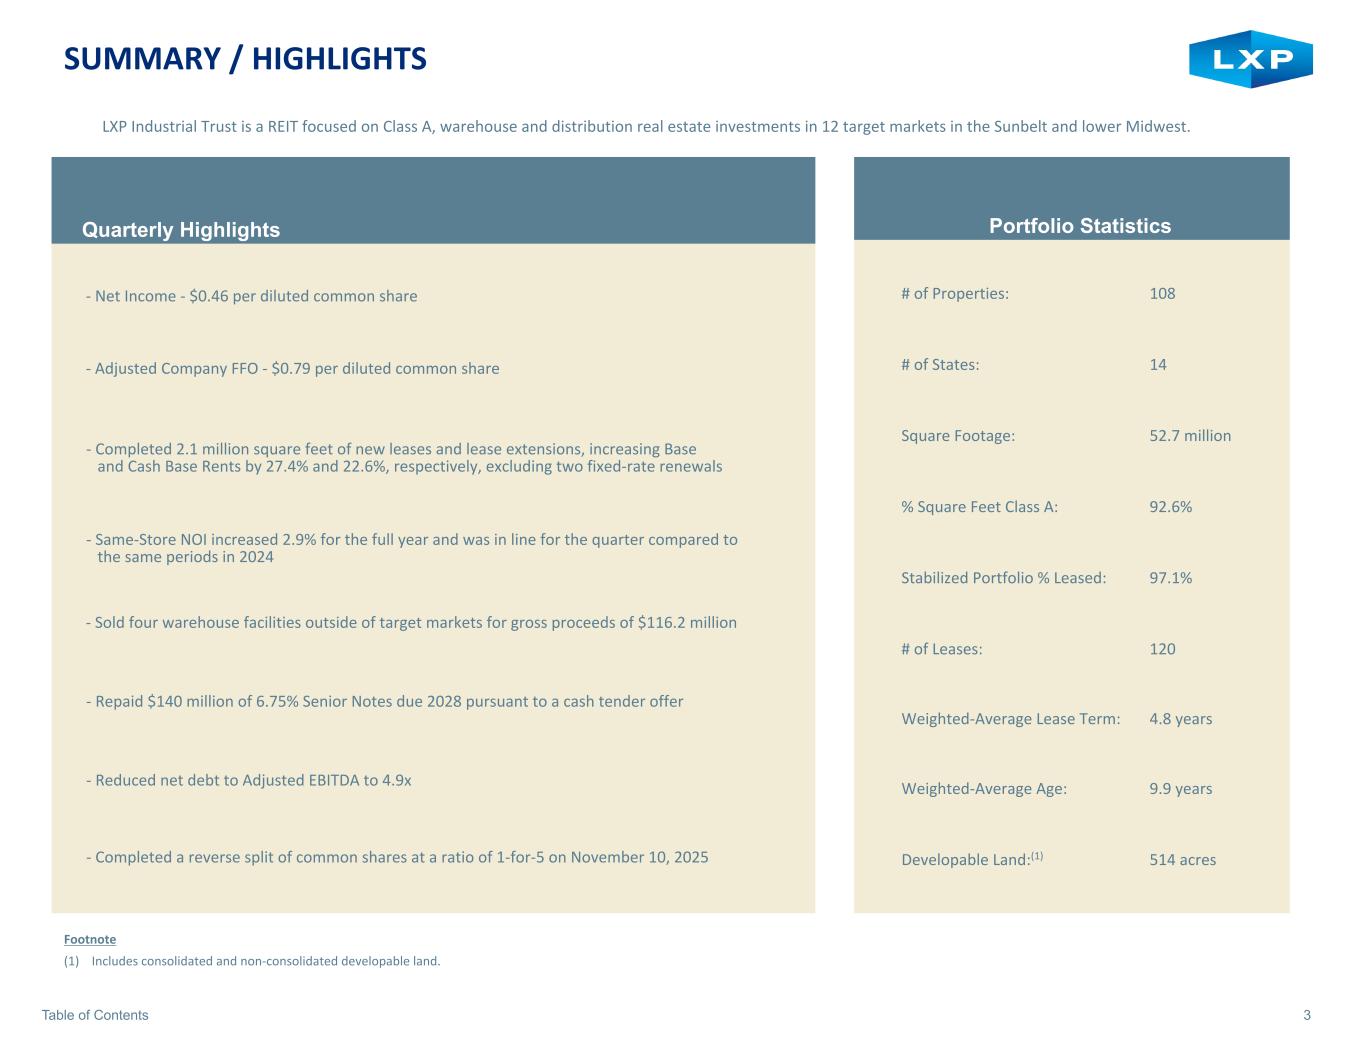
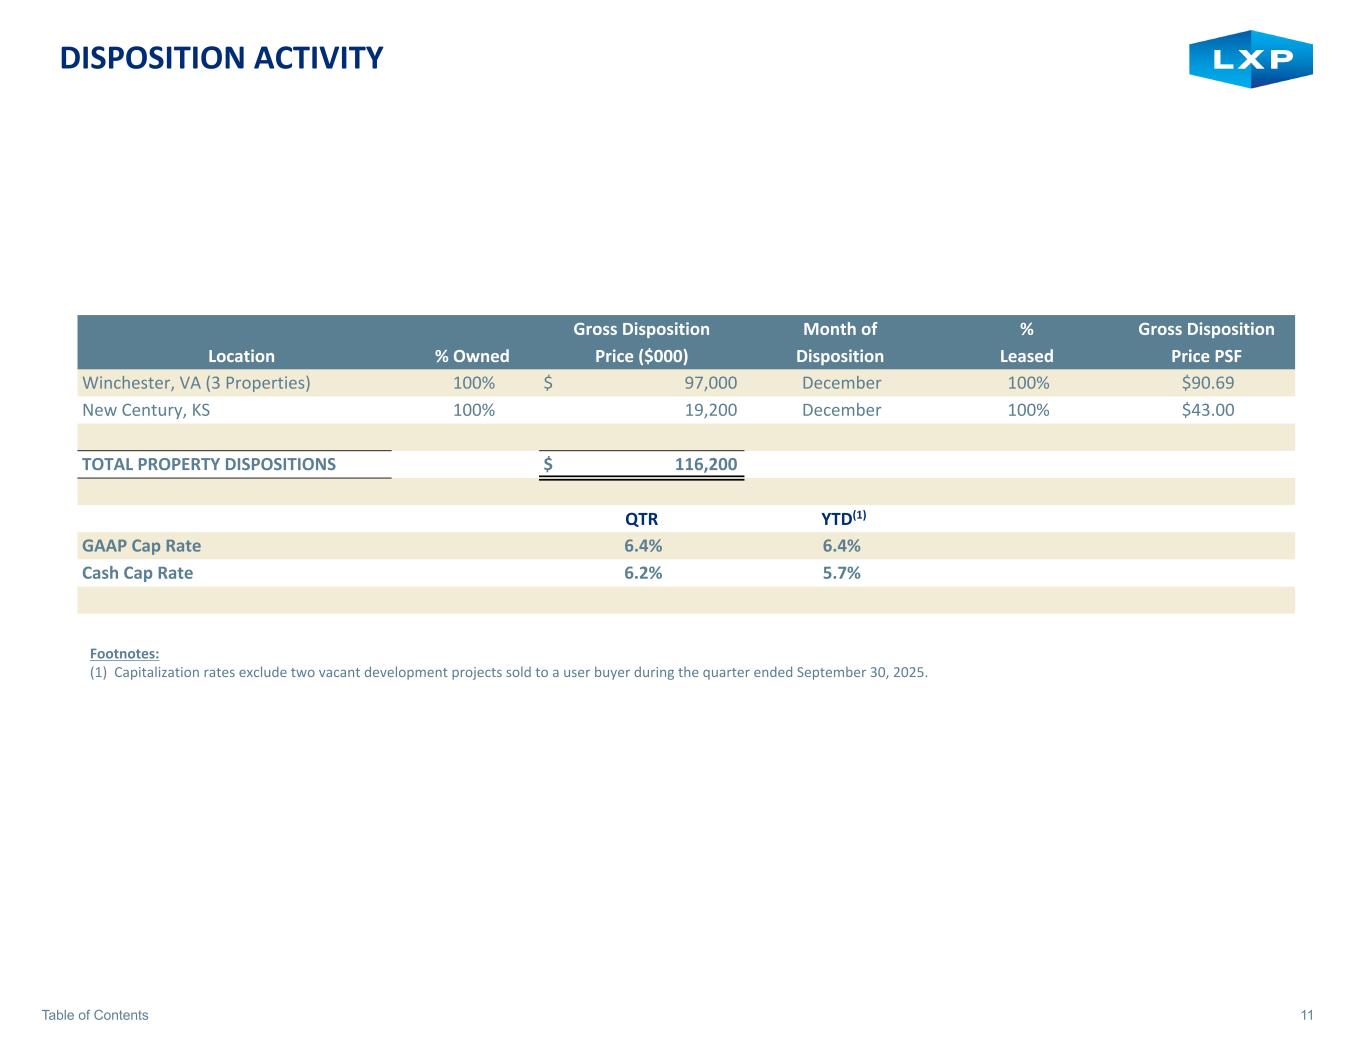
Thank you, Heather. Good morning, everyone. Our fourth quarter marked the conclusion of a successful year, driven by meaningful achievements in leasing, healthy occupancy gains, strategic property sales, and continued progress strengthening our balance sheet. We delivered on our key operating objectives in 2025, notably reducing leverage from 5.9 times to 4.9 times net debt to adjusted EBITDA, and increasing occupancy 350 basis points to 97.1%. Additionally, we leased nearly 5 million square feet in 2025 with attractive mark-to-market outcomes of approximately 28% on a cash basis, excluding fixed-rate renewals. We were encouraged to see market fundamentals continue to improve during the fourth quarter, with our target markets driving over 66% of the overall U.S. net absorption of about 54 million square feet. Larger users made up the bulk of the demand, favoring facilities exceeding 500,000 square feet that were built within the last five years. Several of our target markets, including Phoenix, Indianapolis, Dallas, Fort Worth, and Houston, led this demand. Reflective of an improving leasing market, in the fourth quarter, we leased over 2 million square feet at attractive base and cash-based rental increases of approximately 27 percent and 23 percent, respectively, excluding fixed-rate renewals. We've also made good progress on our 2026 expirations. To date, we have addressed roughly 3 million square feet, or 41% of our total 2026 rollover, achieving an average cash rental increase of approximately 28%, excluding two fixed-rate renewals. On the sales front, we exited five non-target markets in 2025 and continued to prioritize investing in our 12 target markets, which currently account for 87% of our gross book value. Total disposition volume for the year was $389 million, including $116 million from non-target market sales in the fourth quarter, with an average cash capitalization rate of 5.7% on stabilized assets sold during 2025. This volume included the sale of our Indianapolis and Ocala development properties to a user buyer in September at an implied capitalization rate of approximately 5% and a 20% premium to our cost basis. The capital generated from asset sales was primarily deployed to strengthen our balance sheet by reducing high coupon debt. Additionally, we acquired one property in Atlanta for a 1031 exchange requirement in September and repurchased approximately 277,000 shares at an average price of $49.47 in December 2025 and January 2026. At year end, we held approximately $170 million in cash on our balance sheet. While cash balances are currently weighing on earnings, we believe liquidity is valuable as we head into a period where we can create significant value in our land bank. Strengthening our balance sheet was one of our primary objectives in 2025. We successfully accomplished this goal and entered 2026 in a strong financial position. Our capital allocation priorities will now primarily focus on disciplined investment and external growth opportunities. mainly in our land bank, and executing opportunistic share repurchases, provided they don't impact the balance sheet progress we made in 2025. Acquisition activity is expected to be limited to 1031 exchanges, which may happen from time to time as we exit non-target markets. Through our development program, we have developed 15 facilities since 2019 at a 7.1% weighted average stabilized yield on first-generation leases and generated sale proceeds of $91 million in excess of our cost basis. At year-end, our development program was 98% leased or sold. We have continued to closely monitor market fundamentals where we own development land, evaluating both built-to-suit and speculative development opportunities. In the West Valley of Phoenix, where we own a 315-acre land site, we have observed an acceleration in leasing activity for facilities over 1 million square feet. Eighteen months ago, there were 10 1 million square foot buildings available in the West Valley. Since then, eight of these buildings have leased or sold to users, and the remaining two are in advanced stages of negotiations. Consequently, there will be no 1 million square foot facilities available in the West Valley, and nothing is currently under construction. In addition, construction costs are roughly $20 per square foot lower than they were at the market peak. With this favorable backdrop, we will be breaking ground on a 1 million square foot spec project on our Phoenix landslide. Project completion is anticipated for the first half of 2027 with an estimated budget of $120 million and a stabilized cash yield within a range of seven to seven and a half percent. In summary, we successfully executed our core strategic initiatives in 2025, including enhancing our balance sheet, addressing vacancy at our three big box development properties, increasing portfolio occupancy, and achieving attractive leasing outcomes. In 2026, our priorities will center on strategic capital deployment, specifically pursuing disciplined growth opportunities, and making opportunistic share repurchases, leasing our remaining vacancies, and generating robust mark-to-market outcomes. Our high-quality portfolio, FFO, consisting primarily of Class A assets in the Sunbelt and Lower Midwest, is well positioned to benefit from improving market fundamentals and the positive momentum associated with advanced manufacturing investments. I'll now turn the call over to Nathan, who will provide a more detailed overview of our financials, leasing activities, and balance sheet.
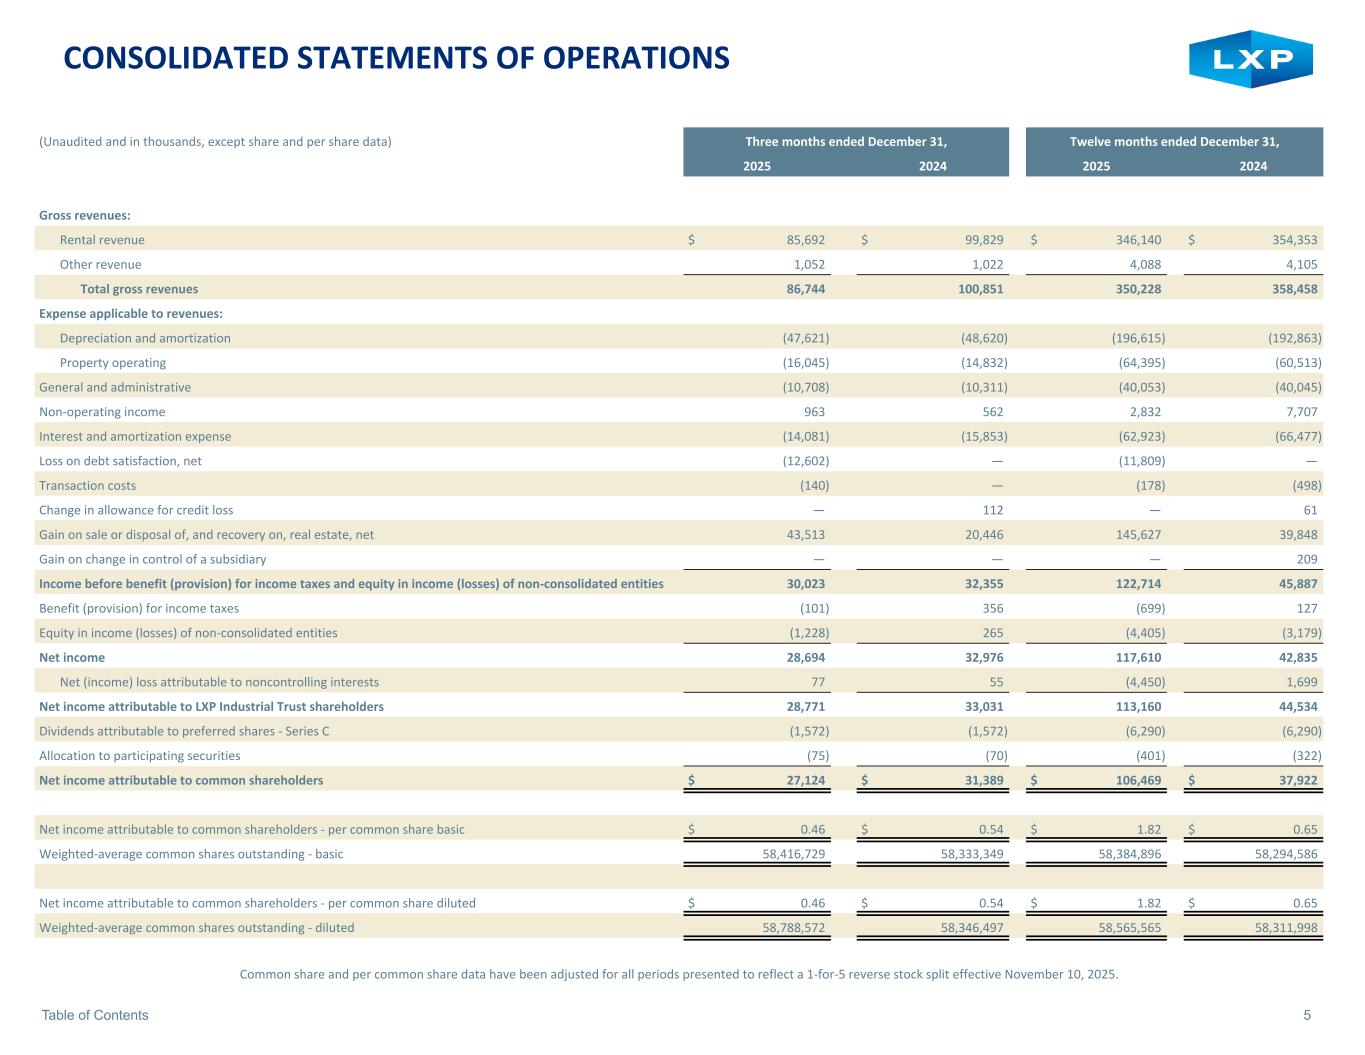
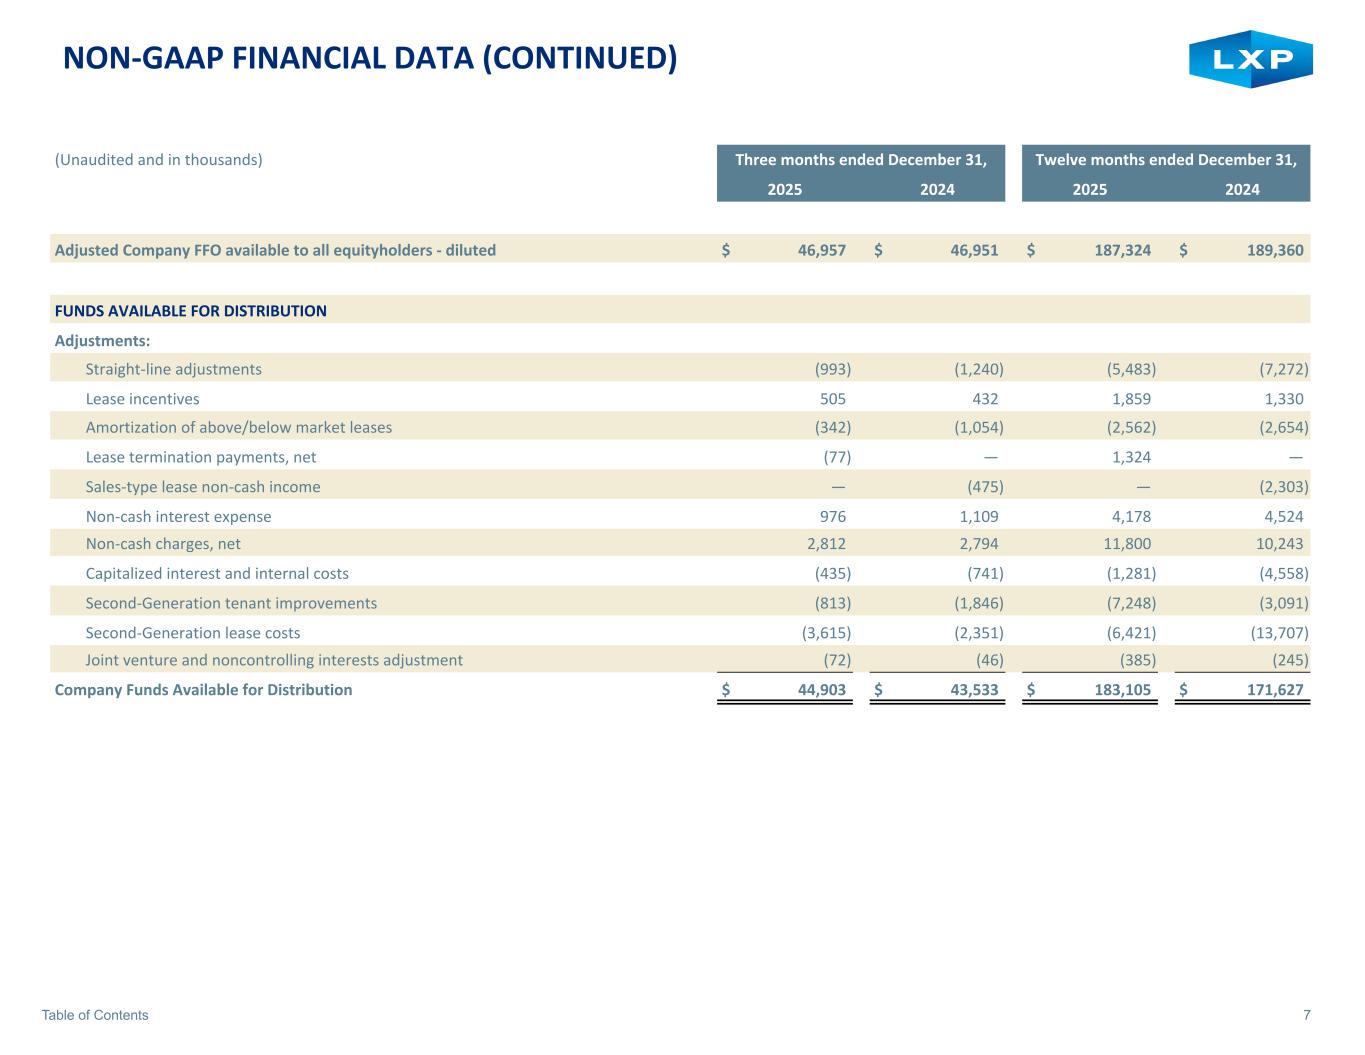
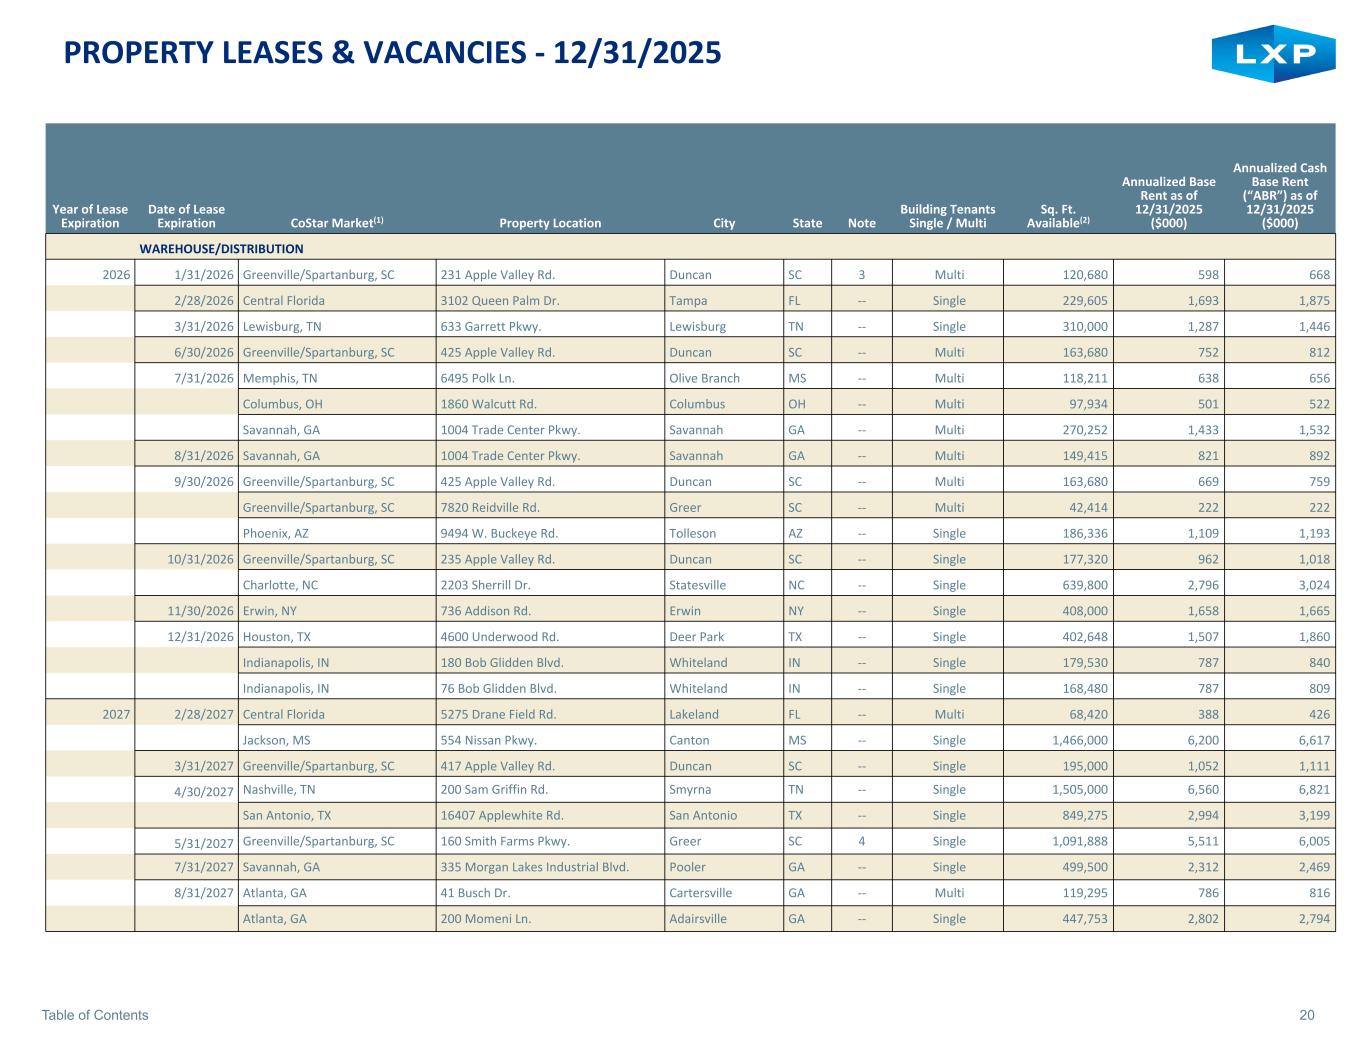
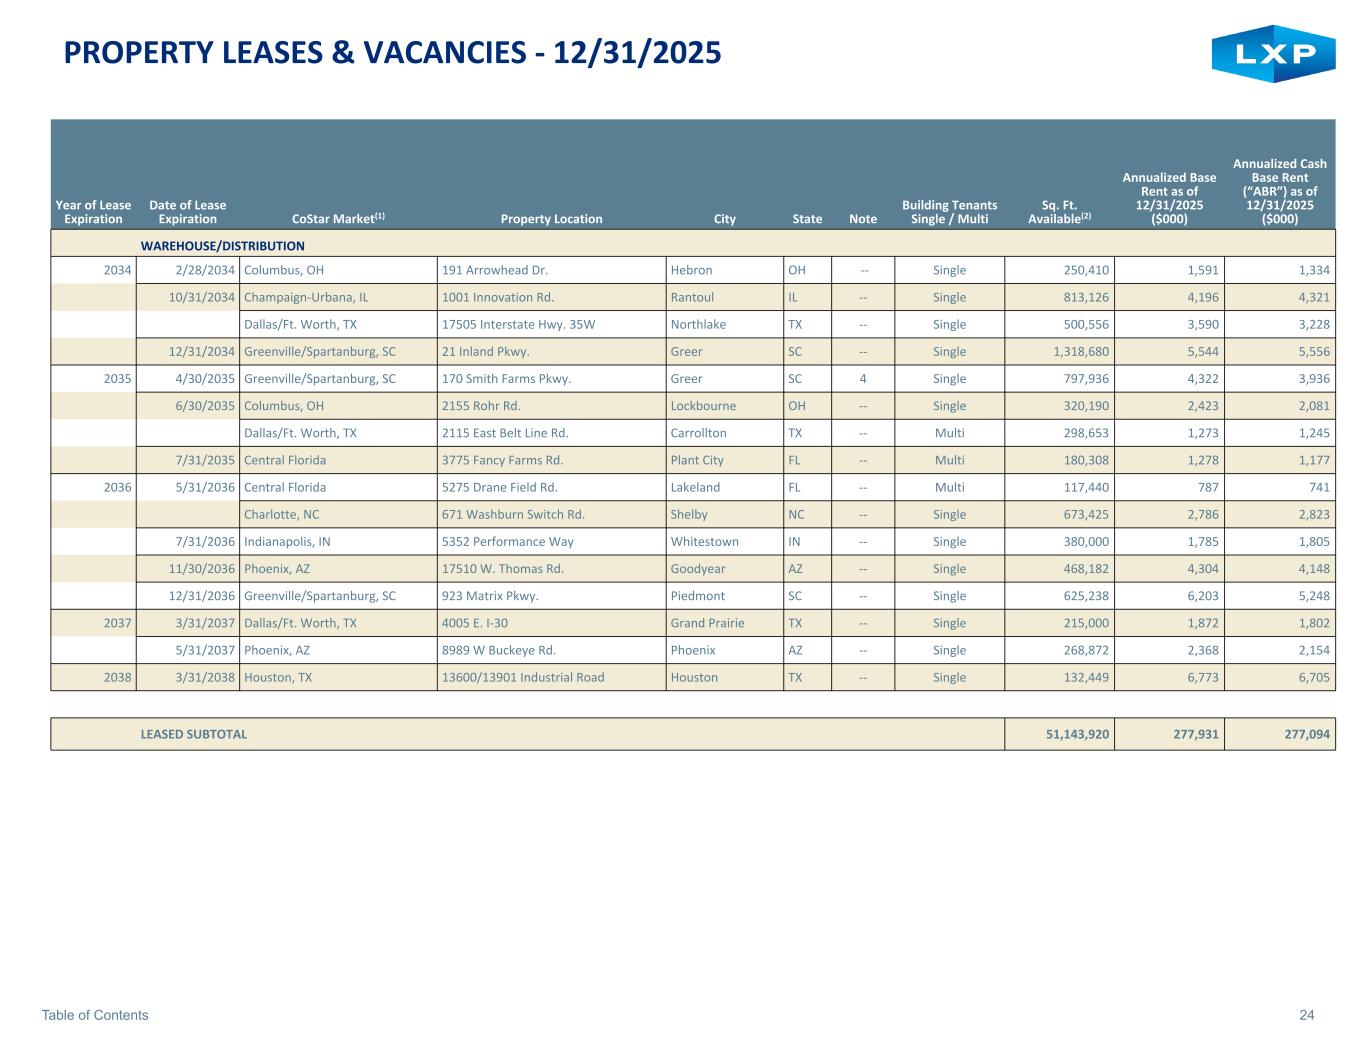
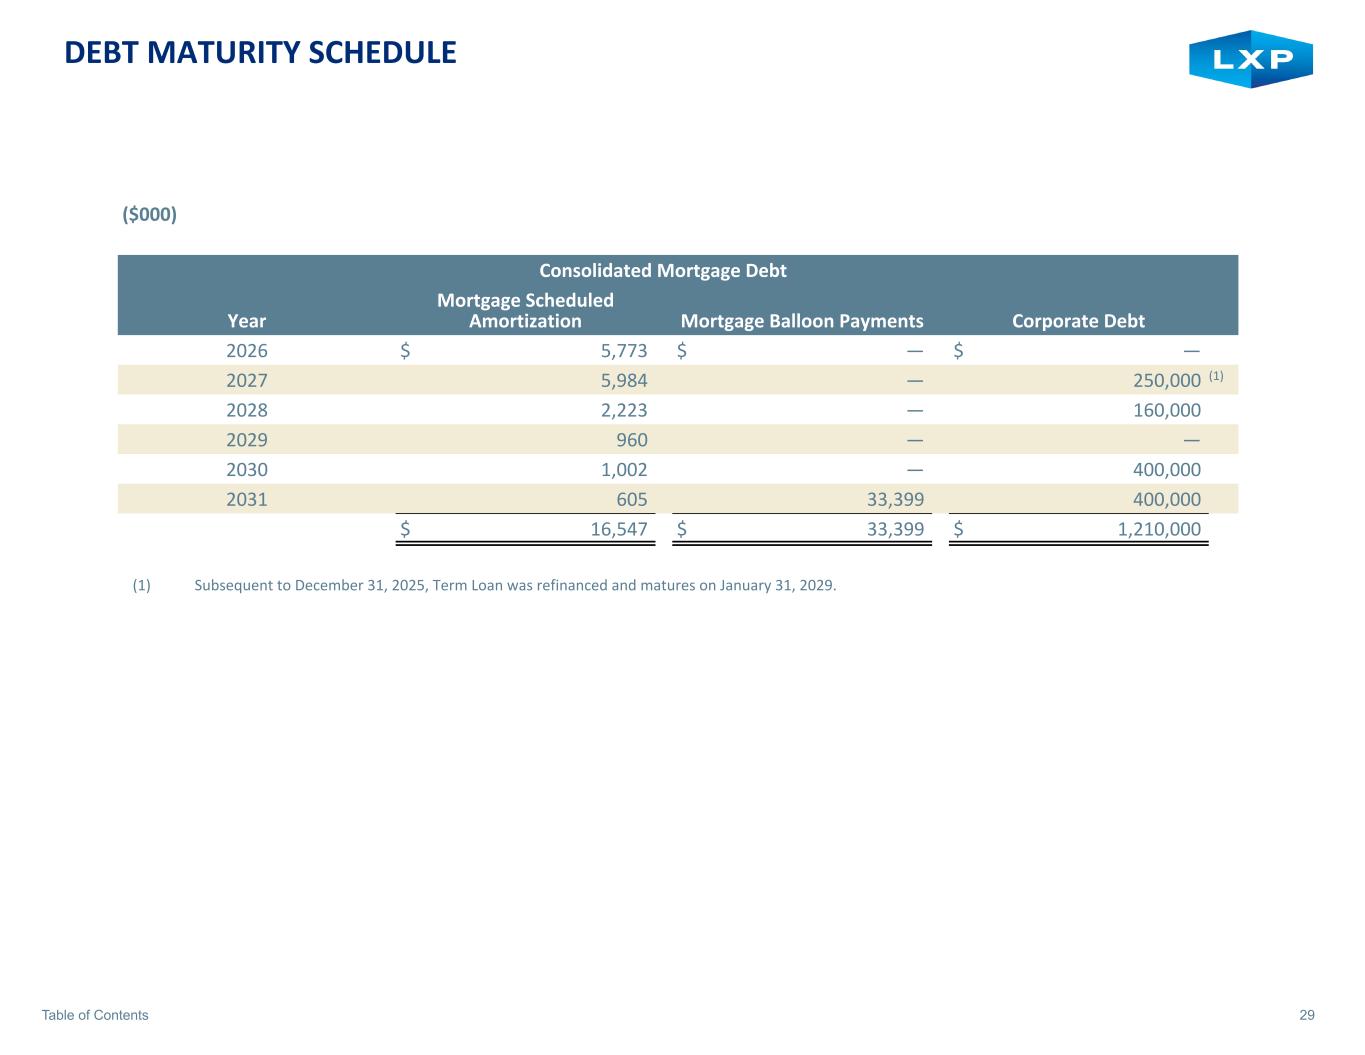
Thanks, Will. Adjusted company FFO in the fourth quarter was $0.79 per diluted common share, for approximately $47 million. For the full year, we produced Adjusted Company FFO of $3.15 per diluted common share, or $187 million. This morning, we announced our 2026 Adjusted Company FFO guidance range of $3.22 to $3.37 per common share, which represents 4.6% growth at the midpoint. This guidance assumes the proceeds from the properties sold in the fourth quarter will be redeployed into the development project in Phoenix. Although these assets, sales, and capital redeployment are a drag to 2026 FFO, that will be a source of earnings growth in future years. Our guidance does not assume any other dispositions or investment activity. Our portfolio occupancy increased to 97.1% at year-end, compared to 93.6% at year-end 2024, primarily reflecting the successful outcomes for the three big-box development properties in 2025. Turning to the same-store portfolio, full-year same-store NOI growth was 2.9% and flat in the fourth quarter when compared to the same time period in 2024. Consistent with our commentary on our last earnings call, our fourth quarter same-store NOI growth reflects lower occupancy in the same-store portfolio of 97.3% as of year-end 2025 versus 99.5% in 2024. We are estimating 2026 same-store NOI growth to be within a range of 1.5% to 2.5%. At the midpoint of 2%, the components of same-store growth include a positive contribution of 3.25% from contractual rental escalators and lease renewals, offset by a 1.25% impact associated with lower occupancy and higher rent concessions in the form of free rent. Our 2026 guidance range assumes average occupancy for the same-store pool of 96% to 97% versus average occupancy for this same pool of properties of just over 97% in 2025. The low end of our adjusted company FFO and same-store guidance assumes $500,000 of credit loss. G&A was approximately $11 million in the quarter, with full-year 2025 G&A of $40 million, within our expected range. We expect 2026 G&A to be within a range of $39 to $41 million, broadly in line with 2025. Turning to leasing, our current mark-to-market on leases expiring through 2030 and second-generation vacancy is compelling, with in-place rents approximately 16% below market based on brokers' estimates. As a reminder, this mark-to-market metric is inclusive of fixed-rate renewals. With respect to 2025 expirations, during the fourth quarter we secured a new 10-year lease with 3.5% annual rental bumps at our 380,000-square-foot facility in the Indianapolis market. The lease expired in July, but the previous tenant held over through the end of September. The new lease yielded a 34% increase in rent over the prior rent. The positive contribution of this new lease to same-story and online growth will be recognized beginning in the second half of 2026, reflecting concessions associated with the 10-year lease term. At year end, the tenant at our 160,000-square-foot facility in Phoenix moved out. This is a modern building with highway frontage, and we expect the releasing of the building to produce a 40 to 50 percent rental increase. Moving on to 2026 expirations, we signed two leases during the quarter, including our 650,000 square foot facility in Cleveland and 769,000 square foot facility in St. Louis. Both were subject to fixed rate renewals with two and a half percent and one and a half percent annual escalators respectively. The extension of these leases is positive for occupancy and uninterrupted cash flow, particularly given the absence of leasing concessions. Additionally, we renewed our 194,000 square foot facility in Cincinnati and a 70,000 square foot facility in the Greenville Spartanburg market, generating cash rent spreads of approximately 15 percent and seven percent respectively for the first half of 2026 we have two known move outs including 121 000 square feet at our multi-tenant facility in greenville spartanburg that expired at the end of january and a 230 000 square foot facility in tampa scheduled to expire this month the tampa facility is in an infill location within the sought-after Sable Business Park. There are no other properties of this size available in the market currently. Given the older vintage of the facility, we will be undertaking some renovations, including the addition of rail capabilities, which we expect to result in a rent increase of 10 to 20 percent over the existing rent. We have assumed in our same store growth guidance that this property remains vacant for 2026. Our 600,000 square feet of redevelopment projects in Orlando and Richmond are progressing well. Completion of the Richmond project is expected in the second quarter, while Orlando is now slated for the third quarter. Both properties are anticipated to produce yields on cost in the low teens. Our balance sheet is in terrific shape with net debt to adjusted EBITDA at 4.9 times at year end. Reflecting this strength, S&P Global Ratings revised LXP's outlook to positive in the fourth quarter. Over the course of the year, we were paid approximately $220 million of debt, which included $140 million of our 6.75% senior notes due 2028, pursuant to a cash tender offer in the fourth quarter. Subsequent to quarter end, we recast our $600 million revolving credit facility and $250 million term loan, extending the initial maturities to January 2030 and January 2029, respectively. The new debt facilities extend our debt maturity profile and reduced interest costs, further advancing the progress we made on the balance sheet in 2025. With that, I'll turn the call back over to Will.
Thanks, Nathan. In closing, we're pleased with the success we had in 2025 and are focused on building on our momentum in 2026. While it has been several years since we've seen attractive development opportunities that make sense for LXT, we're excited to capitalize. on improving market dynamics by pursuing disciplined external growth opportunities at the same time we remain focused on leasing and producing favorable marked market outcomes that drive enhanced value for shareholders with that i'll turn the call back over to the operator at this time i would like to remind everyone in order to ask a question press star then the number one on your telephone keypad.
Operator
We'll pause for just a moment to compile the Q&A roster. Your first question comes from the line of Jim Comert with Evercore ISI. Please go ahead.
Good morning. Thank you. Will, interesting on your plan development here in Phoenix, the Reams and Olive. I'm just curious, obviously, it sounds like the market's definitely improved. Do you have sort of a quiet list of prospects that you're talking to already? I mean, it's a big project.
It is a large project. The supply-demand equation there is really favorable for us, as is the lower construction So it wouldn't be surprising to me if there was interest in the facility before it's And there are prospects hunting for that size space now, and there really aren't any So we think it's an extremely good setup for us and almost the best one that I've seen candidly.
Interesting. And you're using about 65 acres, if I interpret your presentation materials. So you're left with like net 240. So there could be more in the future of development? Thank you.
Operator
Your next question comes from the line of Todd Thomas with KeyBank Capital Markets. please go ahead.
Hi, thanks. Good morning. Maybe for Nathan, you know, I just wanted to ask about the full year, same-store and OI growth, the 2.9%, you know, it was unchanged in the quarter. For the full year, though, it came in a touch below your prior forecast, three to three and a half, which was revised lower last quarter from three to four. I'm just curious, you know, in terms of the trends later in the year, what drove that miss versus your budget, if you could talk about that a little bit.
Yeah, thanks, Todd. So actually, our year-end same-store occupancy of 97.3% was actually within the range of expectations that the 3 to 3.5% range was set on. the difference between you know the final result of the 2.9 percent and the low end of guidance of three was about 200 grand um that variance was primarily driven by marginally higher property expense leakage across about a half a dozen properties um some of them uh two or three of them are vacant properties where we're carrying the full opex burden and uh two or three of them leased properties that have property expense caps in the leases where we had some unbudgeted expenses that ultimately went through the caps.
Okay, that's helpful. Is that expense leakage? You didn't mention that when you talked about the same store forecast for 26. Is that expected to continue to weigh on 26 to some extent. And then you did mention that concessions are acting as a little bit of an offset to the base rent and escalators in 26. Are concessions a little bit greater than previously anticipated? And can you maybe speak to the environment for concessions more broadly?
Sure. I'll take the first piece and I'll hand it to James, to talk about concessions and the environment. On the first piece, we certainly updated our budgeting for the property expenses that we experienced in Q4 and reflected that in the guidance that we put out this morning.
So on the concession piece, I would just say that, you know, the market's changing pretty rapidly. And if you look at what happens in anything that was done in kind of the first half of last year and really into the third quarter, There are some pretty high-level concessions just because the supply-demand outlook was a little bit softer than it is now. Over the last six months, we've had a massive amount of space get taken down. We've had vacancy rates, and most of our markets start to either flatten and, in many cases, start to decline. So I do think the concessions will continue to be a part of the story, but I do think we're in an environment where some of the concessions that were given 12 months ago will start to recede and soften a bit, and we'll get into a situation that's a little bit more landlord favorable.
Okay. That's helpful. And then I just lastly wanted to ask about transaction activity and capital allocation a little bit. It sounds like acquisitions going forward will be driven by dispositions.
And just wanted to get your thoughts on what that might look like and the potential to exit more non-target markets in 26 and maybe you can you know sort of speak to how you know that activity might might stack up versus you know additional stock buybacks sure well as you can see we've been methodically working our way through that portfolio of assets outside of our 12 target markets and taking our time and being sure that we're maximizing value and match funding those proceeds to enhance shareholder value so often there's an asset management project involved as a dating item before maximizing value and I would say there's a couple of hundred million of assets in that portfolio where there are negotiations underway that could lead to a very good outcome so none of that is in our guidance but it could create some great outcomes that would give us some some capital to redeploy as the year progresses. We have to be careful about managing tax gains as we do that, you know, but we're in a good position of liquidity to begin with. So, you know, buyback has been appealing after we address the need to bring our leverage down.
But in terms of new development, we think the shareholder value is, you know, more and more interesting from that perspective than buyback at the moment, but there has been room for some buyback activity. okay thank you your next question comes from the line of vince t-bone with green street please go ahead hi good morning um i wanted to follow up a bit more on the cash same store noi guide um i believe you said uh nathan you know it's going to be about three and a quarter percent contribution from both contractual bumps and spreads um and i believe contractual bumps are just south of three so it doesn't seem like spreads are going to be much of a contributor so maybe we can just talk about you know i'm guessing fixed rate renewals are going to drag that figure down you cited from you know the 28 spreads on you know um 26 rollovers you already mentioned but i guess how can we think about spreads with the fixate renewals or contribution to spreads in 26 because it seems to be pretty minimal um given the you know that that data if I just stated.
Yeah, Vince, I'll go first and just, I just want to clarify, you know, the 3.25%, and then I'll head it to James to talk about the 26 spreads. But the 3.25% positive contribution is the contractual rent escalator, which you're right, that's 2.8% on average across the portfolio. And the second component is just the renewal rent spreads. So that's the positive contribution. And then the 1.25% we talked about in prepared remarks reflects the lower average occupancy across the portfolio, which actually captures a combination of new leases on vacant spaces we have today or move outs that we might experience offset by the drag from vacancy. so it actually captures some of the rent spread activity around new leases so it's a little bit of a um bucketing as to whether it goes into the first category or the second category but that first category is just the renewals and then james yeah i can so um yeah we had two
you know really large um fixed rate renewal options that did you know do put a pretty good drag on it so we've got the you know 28 cash for 2025 which included quite a bit of the 2026 um that was done and if you kind of put those back in it's about a 14 and a half percent um you know mark to market so that that kind of shows you the delta between the two when you include the fixed rate renewal options uh the good news is is we're pretty much through those at this point for uh 2026 we have two small ones at the end of the year um which we expect to renew But we've gotten past those now, so hopefully we'll start to see some higher marked market numbers, you know, holding with more ability to fully mark those rents to market.
That's a really helpful color. And then just curious how you thought about the average occupancy guide in terms of retention, you're assuming for some of the larger expirations in the back half of the year. But also just if you touch on some of the activity on some of the vacancies that you've had for a bit longer that I think when we spoke in there, you're having some activity on. So just curious kind of how you're budgeting those and if you can just talk broadly or quickly on some of the activity, some of the existing vacancies in the portfolio.
Sure. For retention, I mean, we're feeling pretty good about it at this point. We've already chopped a lot of that wood and gotten through the big potential vacancies with renewals. I mean, two of them were the fixed rate renewal options that I just mentioned. So we feel pretty good about our retention numbers for the balance of 2026. And then looking to 2027, we feel like we're going to have a nice retention there as well. We've got a number of big leases rolling, but we feel like we'll retain those tenants and should be back to more of a typical LSP clip at that high retention rate with 2025 kind of being an anomaly on the vacancy side we continue to have activity across our vacancies it's just it continues to be a real challenge to get deals done lots of rfp traffic lots of tenant tours lots of interest and it's really just getting them across the finish line i think that we will make some good progress this year on the vacancy that we have and as a reminder there's a really good opportunity there to mark those rents up you know in the mid-30s if we can get those deals done great thank you thanks your next question
comes from the line of nikika bailey with jp morgan please go ahead hey good morning guys uh any comments i know you you just did a bigger spec development but anything on the build-to-suit front um some of the companies in the natalie space uh seemingly they're increasingly getting to the industrial BTS deals. Does that pose more competition for you guys down the line? I don't know if that's something that you'd consider given this large expected spectator going on right now?
Yeah, sure. Why don't I take that? This is Brendan. Yeah, I think the build the suit space remains interesting to us and it's probably uh uh looking the the supply dynamic is making it look more encouraging uh particularly in our land bank so you know there may be more competition from some of those other players but since we do have a land bank um uh that puts us in a more favorable position and then many of those guys looking to finance uh build a suit um so the dynamic you see is a supply comes out of the market of existing that built space, that we remove that competition. So we've been pretty actively responding to Build the Suit over the last couple of years, in fact, in our land bank. But in many cases, you know, some of those deals didn't make, but the ones that did proceed, we were competing against existing supply. So that factor is encouraging for us. um and we've been responding and you know in particular in Columbus which is tightened significantly in Phoenix uh we've been responding to build-to-suit inquiries as well so we'll we'll look at at both as those fundamentals um have improved we will consider spec uh but that we absolutely will will continue responding to build-to-suit was it an option to do a build-to-suit maybe for this land site in Phoenix and maybe wait a little bit longer I mean was there any urgency to do a spec deal versus doing a build-to-suit maybe at some point down the line if you were able to get someone locked up? Well, as we looked at it, the supply dynamics, the lack of competing supply made that very compelling. And then the other piece of it is that we're strategically taking advantage of, you know, what I think will probably turn out to be a particularly attractive construction pricing window here before competing supply starts starting. So, it's really twofold. It's not just supply demand, but it's also very attractive construction pricing. And the combination of that was very compelling for us to start on a spec basis. Like Will said, I would not be surprised if we could potentially have an early conversion and, you know, maybe it turns into sort of a specter suit, but both options continue to look good there, and we'll continue to respond to Build-A-Suit at that site. And to get back to Jim's comment earlier, actually, like this initial site is going to be approximately 75 acres.
We've planned a little over 5 million square feet at our site in Phoenix, so there's a lot run way beyond um the building that we're starting got it um definitely a more modeling question uh what's your bed that assumption for 26 that you guys have in guidance and how does that compare to 25 at that um nikita so uh we you know we continue to have a very good track record on credit loss.
We didn't have any credit loss in 2025. In the guidance, we included $500,000 in the low end only. We looked at some of the stress that's happening in certain sectors and a matter of prudence and bringing ourselves in line with some of the peers. We decided to make a little bit of our credit loss in the low end only.
Operator
Again, if you would like to ask a question, press star 1 on your telephone keypad. I will now turn the call back over to Will Eglin for closing remarks.
We appreciate everyone joining our call this morning, and we look forward to updating you on our progress over the balance of the year. Thanks again for joining us today.
Operator
Ladies and gentlemen, that concludes today's call. Thank you all for joining. You may now disconnect.