Operator
Good morning and thank you for standing by. My name is John and I will be your conference operator today. At this time, I would like to welcome everyone to the LXP Industrial Trust First Quarter 2026 earnings call and webcast. All eyes have been placed on mute to prevent any background noise. After the speaker's remarks, there will be a question and answer session. If you would like to ask a question during this time, simply press star followed by the number one on your telephone keypad. And if you would like to withdraw your question, press star when again. As a reminder, this call is being recorded. I would now like to turn the conference over to Heather Gentry, Investor Relations. Please go ahead.
Thank you, Operator. Welcome to LXP Industrial Trust's first quarter 2026 earnings conference call and webcast. The earnings release was distributed this morning, and both the release and quarterly supplemental are available on our website in the investor section and will be furnished to the SEC on a Form 8K. Certain statements made during this conference call regarding future events and expected results may constitute forward-looking statements within the meaning of the Private Securities Litigation Reform Act of 1995. size. LXP believes that these statements are based on reasonable assumptions. However, certain factors and risks, including those included in today's earnings press release and those described in reports that LXP files with the SEC from time to time, could cause LXP's actual results to differ materially from those expressed or implied by such statements. Except as required by law, LXC does not undertake a duty to update any forward-looking statements. In the earnings press release and quarterly supplemental disclosure package, LXC has reconciled all non-GAAP financial measures to the most directly comparable GAAP measure. Any references in these documents to adjusted company FFO refer to adjusted company funds from operations available to all equity holders and unit holders on a fully diluted basis. Operating performance measures of an individual investment are not intended to be viewed as presenting a numerical measure of LXP's historical or future financial performance, financial position, or cash flows. On today's call, Will Eglin, Chairman and CEO, and Nathan Brunner, CFO, will provide a recent business update and commentary on first quarter results. Brendan Mullenix, CIO, and James Dudley, Executive Vice President and Director of Asset Management, will be available for the Q&A portion of this call. I will now turn the call over to Will.
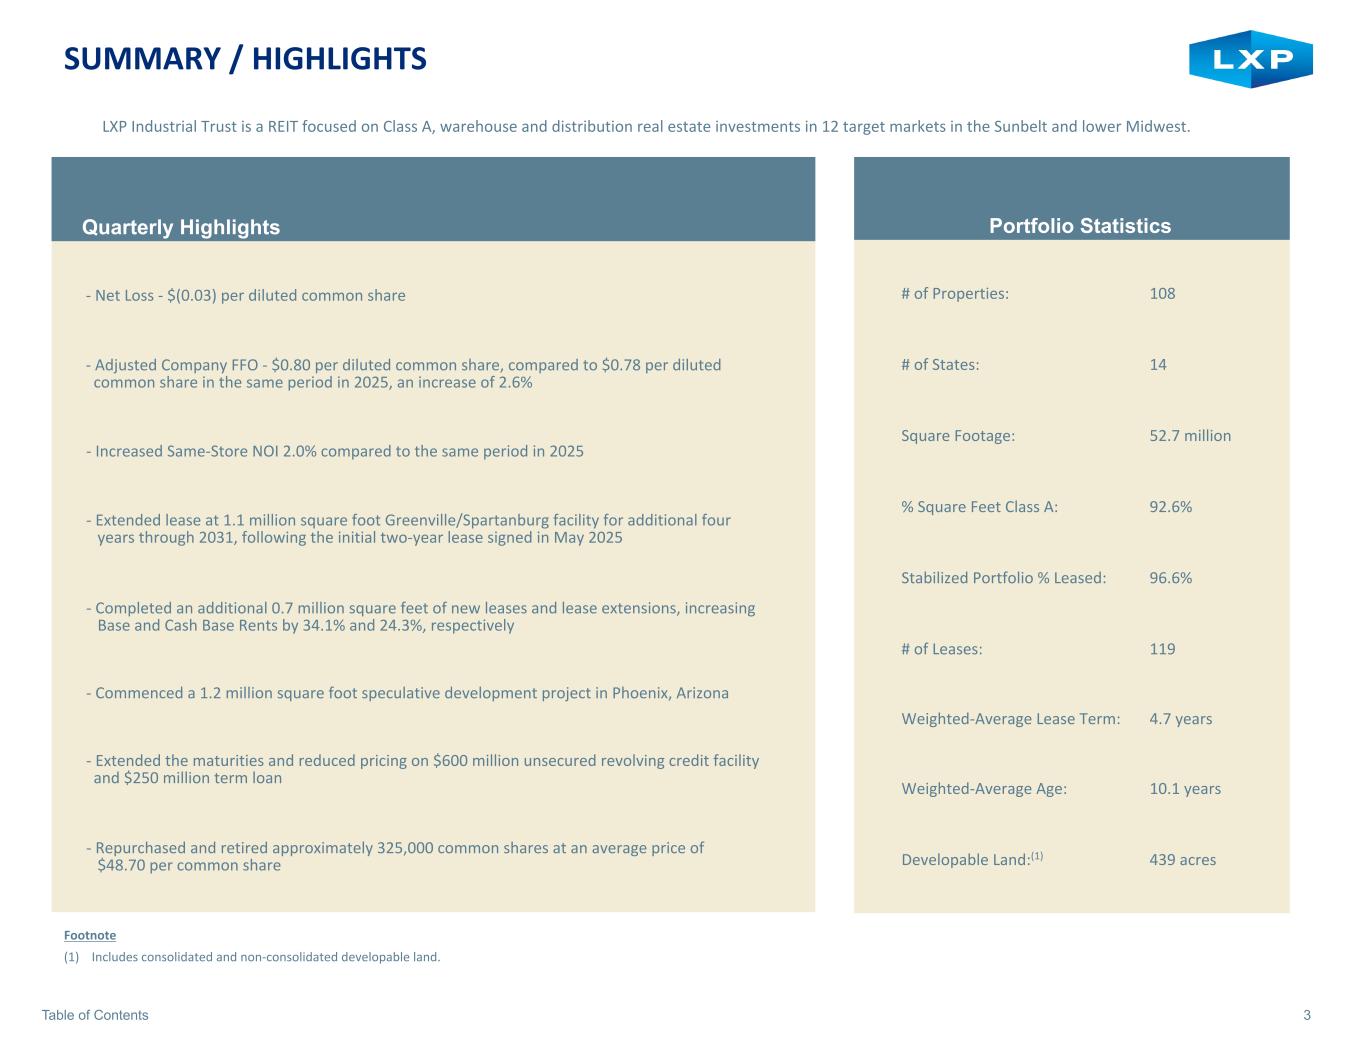
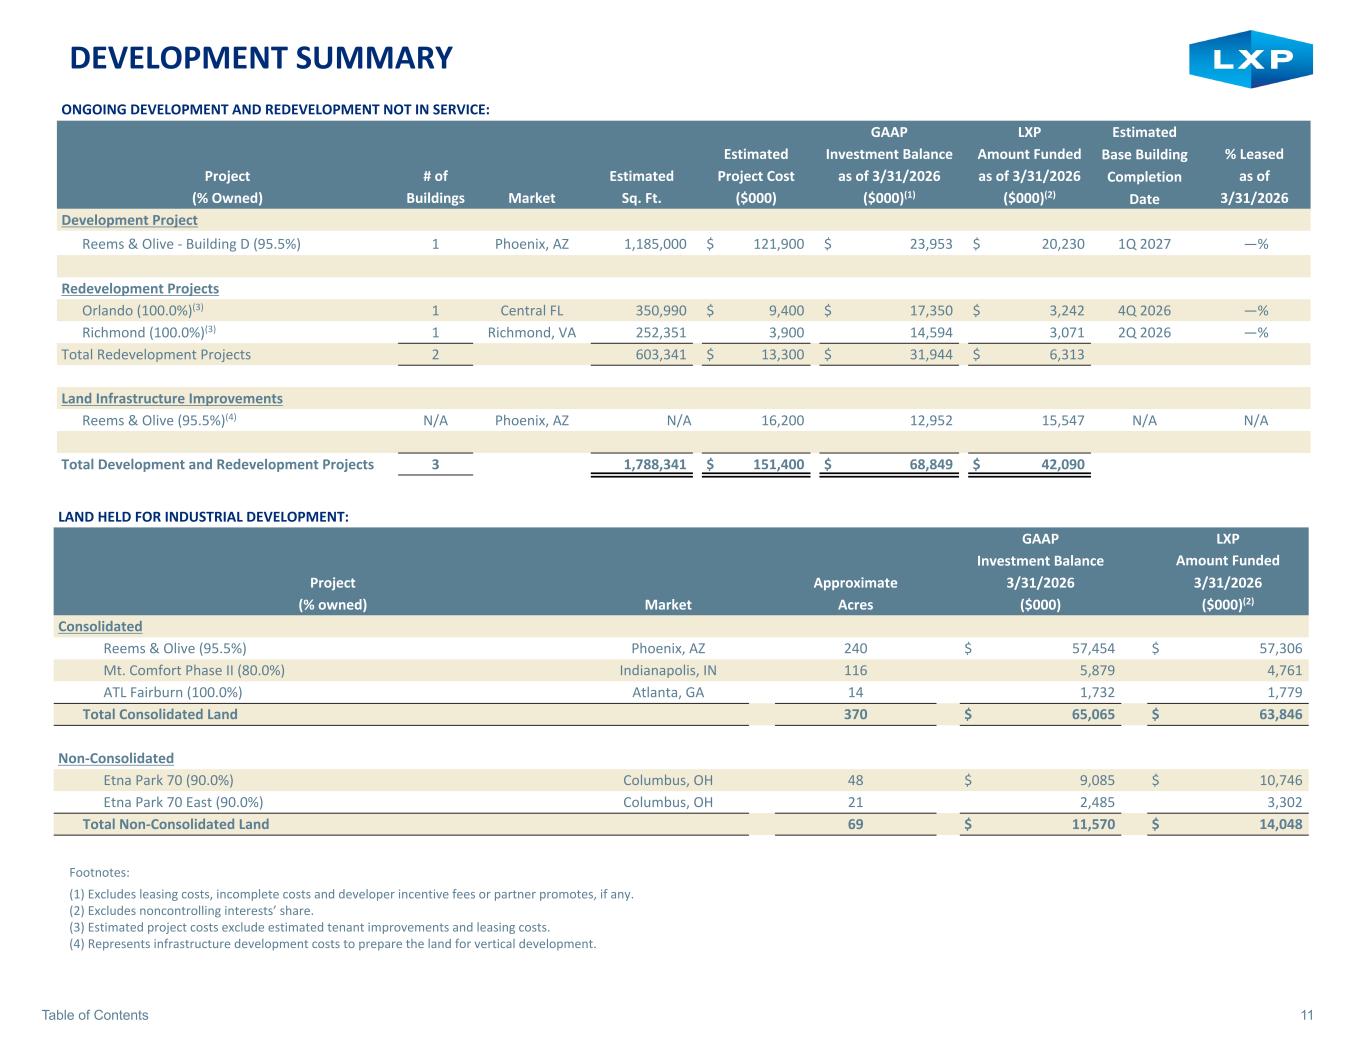
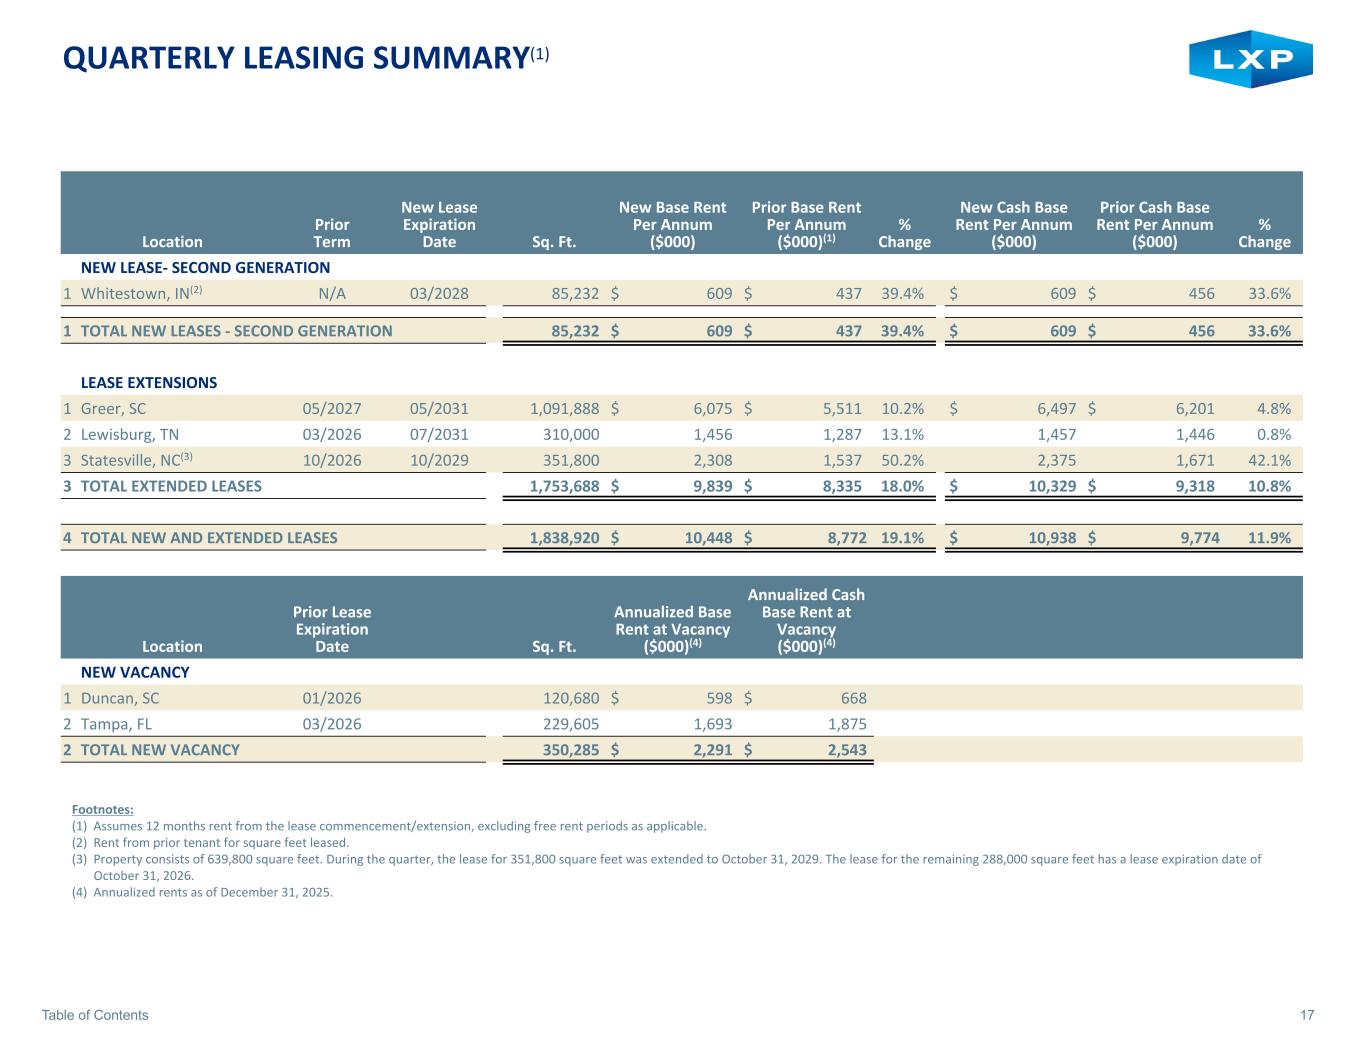
Thank you, Heather. Good morning, everyone. Following the successful execution of our key strategic initiatives in 2025, including strengthening our balance sheet increasing occupancy and resolving our big box vacancy this year we are focused primarily on creating value in our land bank and addressing our near term expirations and existing vacancies we've executed 3.2 million square feet of new leases and lease renewals year-to-date highlighted by the successful outcome at our 1.1 million square foot facility in the Greenville Spartanburg market. Additionally, we leased over 300,000 square feet of vacancy and extended the lease on an 850,000 square foot facility for 10 years. Industrial fundamentals continue to trend in the right direction with first quarter U.S. net absorption of approximately 40 million square feet representing the strongest. Our target markets made up of approximately 29 million square feet, or 72% of U.S. net absorption, demonstrating continued strength in our markets, particularly in Phoenix, Indianapolis, Houston, Dallas-Fort Worth, Atlanta, and Columbus. These positive trends are reflected in our strong leasing momentum year-to-date, as well as our forward pipeline, in which we are in active discussions on 7.4 million square feet of development and redevelopment leasing, vacancy, and expiration through 2027. Leasing activity continues to be the strongest for large format facilities, especially for those of 1 million square feet or more. We're also seeing increased demand from data center-related tenancy and manufacturing suppliers and industries. Leasing volume of 1.8 million square feet during the quarter included the extension at our 1.1 million square foot, which added considerable value. We renewed this lease for an additional four years to 2031, following the initial two-year lease signed in May 2025. This extension enhanced the 8% initial cash-stabilized yield on the development project, with the new cash rent representing a 5% increase over the prior rent and 3% annual rental bumps. On the remaining 700,000 square feet we leased during the quarter, we achieved base and cash-based rental increases of 34% and 24% respectively. Construction is underway at our 1.2 million square foot Phoenix development project that we announced on our last quarterly call. Since then, the remaining 2 million square feet in the West Valley has been leased, leaving no million square foot buildings currently available in the market. we are in discussions with a prospective tenant and we are well positioned if they've given the limited supply of million square foot buildings we're evaluating other development opportunities in our land bank including in columbus where we have 69 acres at our aetna land sites which can support three facilities totaling roughly 1.25 million square feet in the last 12 months net absorption in the columbus market was 10 million square feet resulting in a decline in vacancy This continues to be a strong distribution market with increasing demand across product sizes, particularly in the large format space, and is seeing an influx of tenant activity that supports data. To the extent we move forward with future development projects, we intend to fund them through opportunistic asset sales in our non-target markets. As we've noted previously, acquisition activity will be selective and will be funded via 1031 exchange transactions to defer gains on disposition. I'll now turn the call over to Nathan, who will provide a more detailed overview of our financials leasing activity.
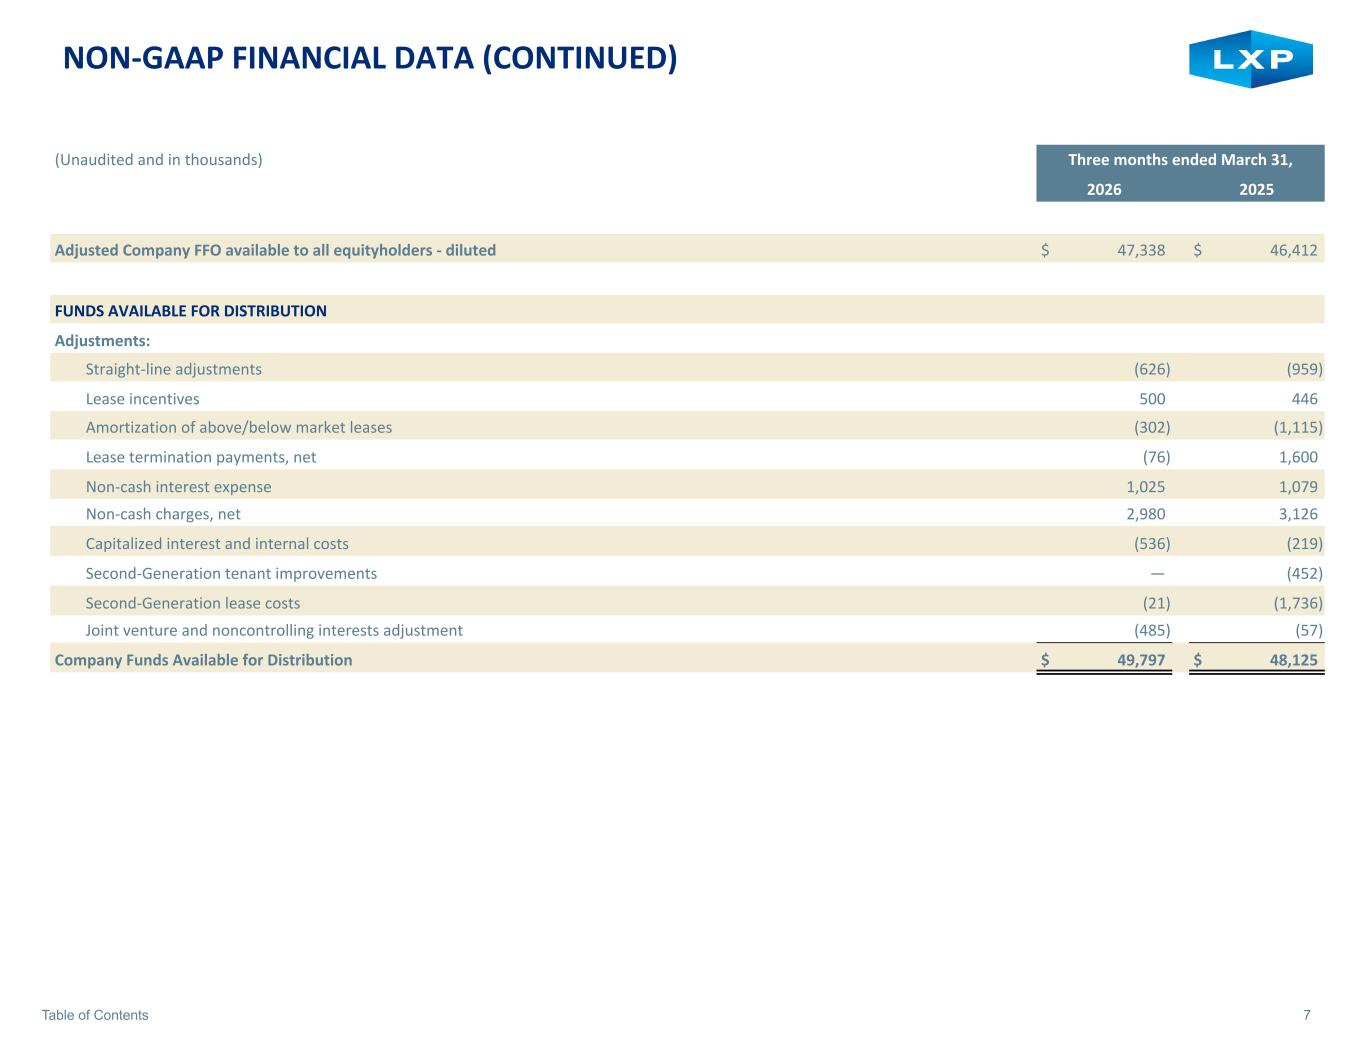
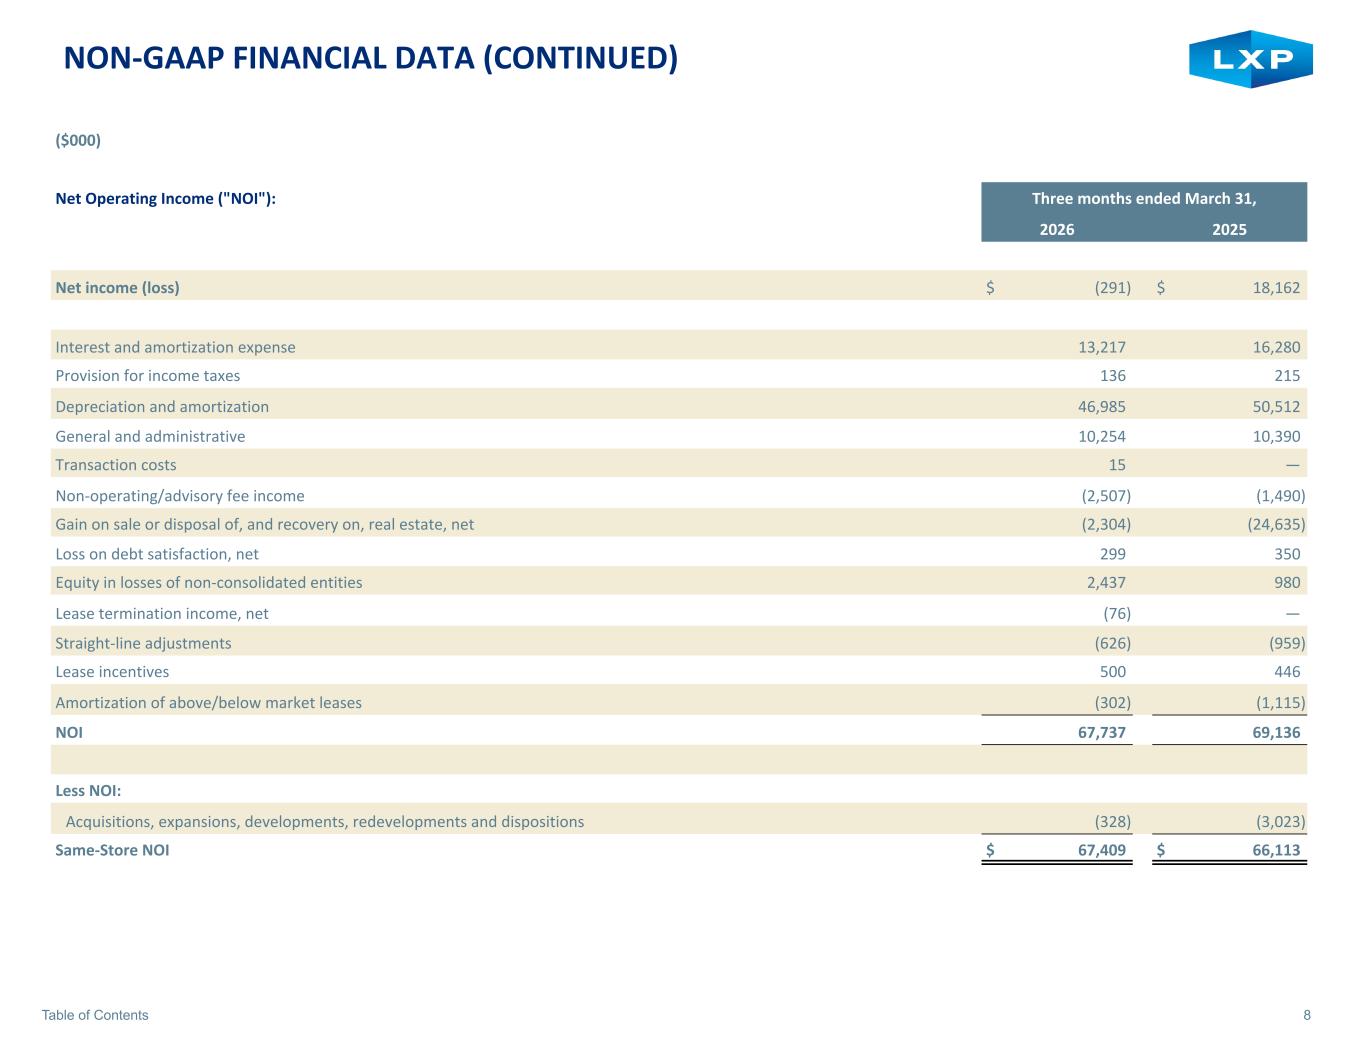
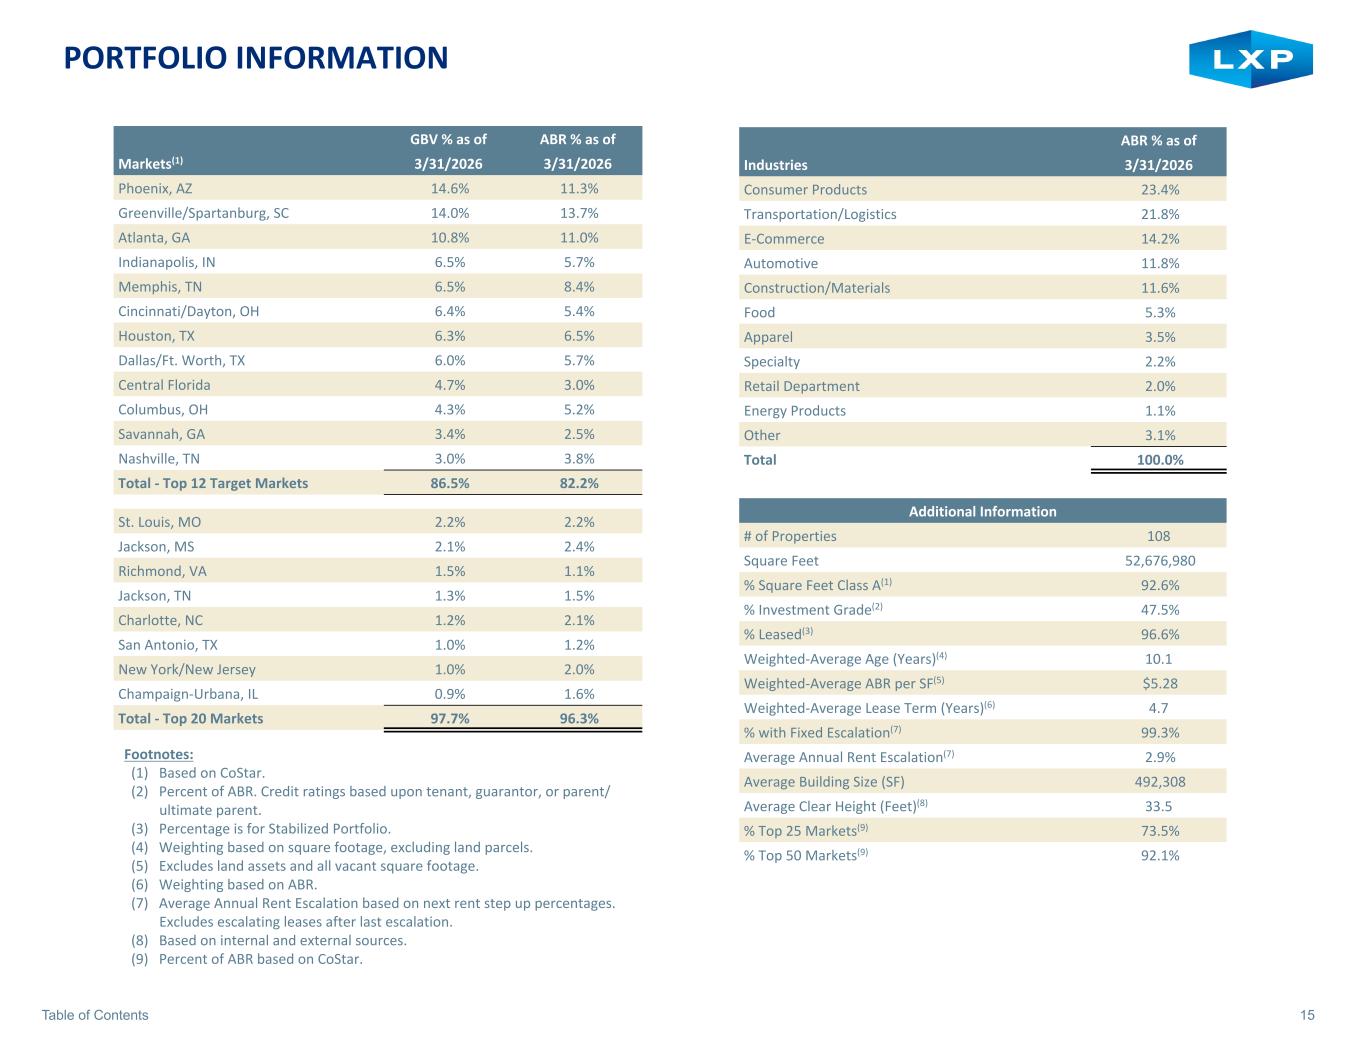
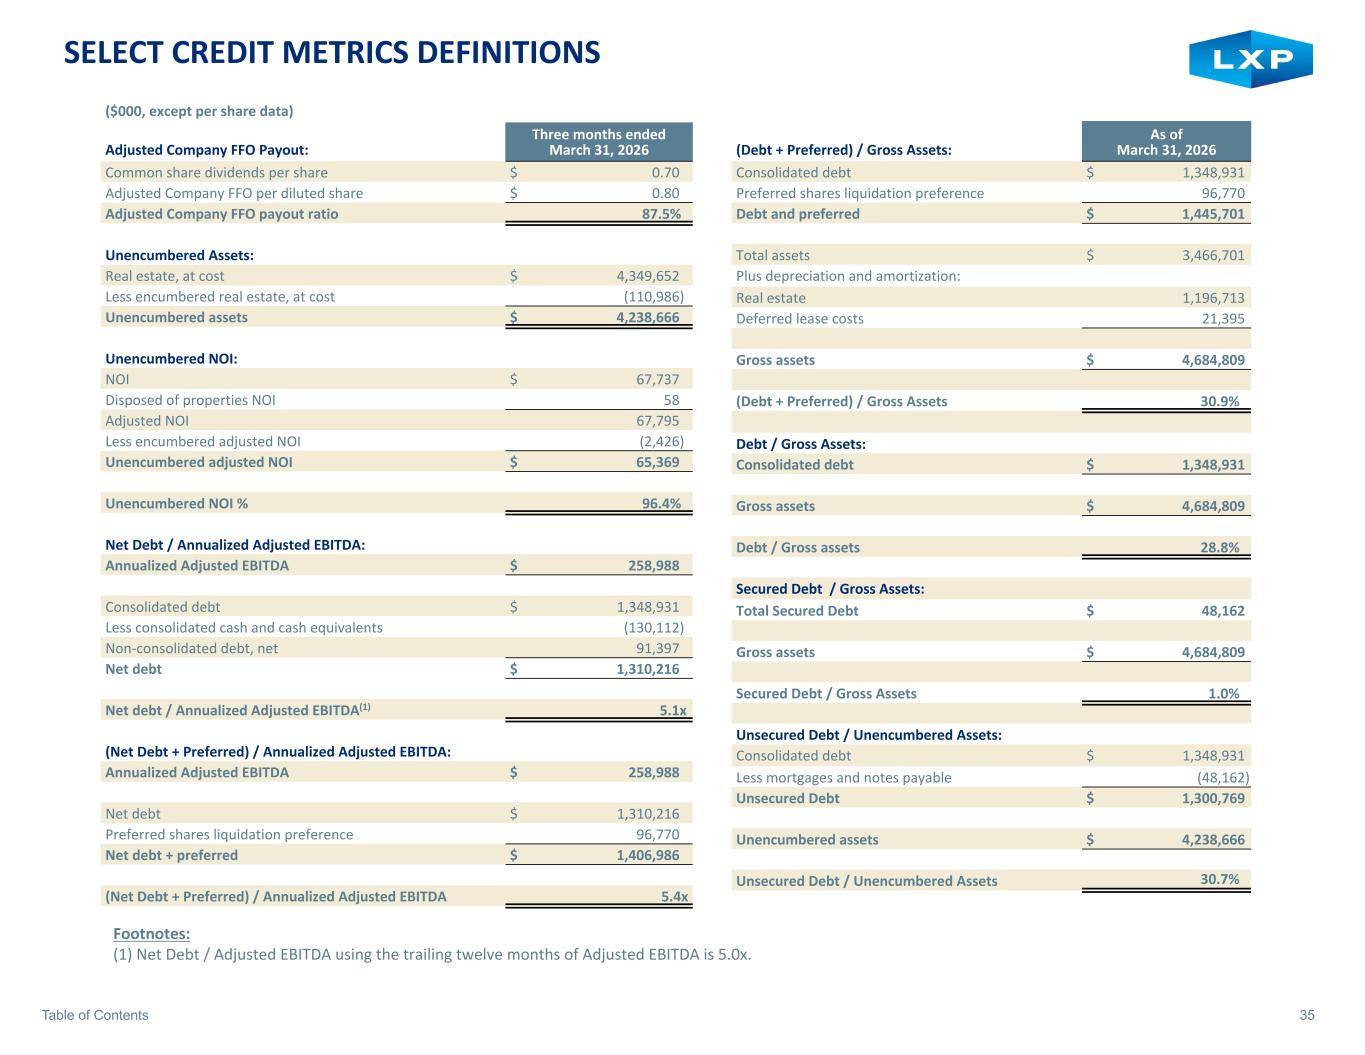
Thanks, Will. Our adjusted company FFO in the first quarter was approximately $47 million, or $0.80 per dollar, for the first quarter. Same-store NOI growth was in line with our expectations. The totalized portfolio was 96.7% and 97.1% leased, performer for new leases signed in April, in line with year-end 20. We are maintaining both our 2026 adjusted company FFO guidance range of $3.22 to $3.30 and 2026 same-store NOI growth guidance. We anticipate that second quarter same-store NOI growth will be lower than the first timing of at least 2,000 square feet.
Operator
Ladies and gentlemen, we will now begin the question and answer session. At this time, I would like to remind everyone in order to ask a question, please press star followed by the number one on your telephone keypad. And if you would like to withdraw your questions, you can press carbon again. If you are called upon to ask your question and are listening via loudspeaker on your device, please pick up your handset and ensure that your phone is not on mute when asking your question. Our first question comes from the line of Todd Thomas with KeyBank Capital Markets. Please go ahead.
Yeah, hi, thanks. A couple of questions. One, you talked well about the lack of big box space in some of your major markets, including phoenix where you broke ground um you know can you talk about you know how that's impacting the market are you seeing that translate into you know pricing power better discussions around um prospective rent growth or or urgency from tenants and then would you look to you know sort of de-risk and pre-lease that development project or do you think it probably affords you know better return opportunities to hold off until it's um you know closer to completion and library yeah sure thanks Todd I think that as we expected in Phoenix since our last call the last two million foot competitive buildings at least so we're essentially in a great position on that
facility that that we've started we do have a prospect that we're working fairly closely with but nothing to report today I think we would prefer to pre-lease and you know de-risk the investment and locking in a profit and then move on because there are other good opportunities in the land bank. You mentioned Columbus. That's another one that we think sets up pretty well for us. So big box demand is doing very well. And at the moment, we're quite optimistic about the outcome of Phoenix for sure.
And then, Nathan, you indicated, you know, the 57% of the 26 expirations have been addressed i think that included um some of the activity that that occurred in april can you just provide an update on the remaining 26 expirations in terms of your expectations there if there's any uh known move outs hey tom this is james i'll take it um we've got really good activity on the remaining 20 26s and the majority of which we're expecting to renew we do have a few small known move outs that are remaining we've got a 97 000 square foot space in a multi-tenant building in columbus where we're expecting the tenant to move out
we're marking that the lease we've got good activity on that one um and then i guess touching on a couple of the new vacancies that we had to uh we had the the tampa move out the 230 that we we've got some decent activity on recently and also the 120 that just moved out in the first quarter as well in greenville spartanburg we've got really good activity on um and then we've also got a a very small lease in greenville spartanburg of 70 000 square feet um that we expect the tenant to potentially move out of and another one for 163 000 square feet in greenville spartanburg that's a no move out so small no move outs um you know good activity in a strong market and and the greenville spartanburg stuff is uh is concentrated um mostly around the park that we own so we've got a lot of different things we can do there from a size perspective and moving tenants around we're talking to the tenants that are in our in that space in the park currently trying to figure out if someone to expand so again good activity on that on that upcoming vacancy and the vacancy that we had the first floor okay that's helpful and just lastly I guess the 1.8 million square feet of vacancy, that opportunity in the portfolio, you know, you estimate it to be about 32 cents a share.
You know, is there anything embedded in guidance related to the lease up of that vacant space that would hit or that's included in the guidance this year?
Yeah, Todd, maybe the way I'd frame that is, you know, back to kind of the underlying drivers of the guidance and and they're pretty much unchanged versus our q4 earnings call that is average occupancy for the portfolio at the midpoint is about 96 and a half percent which is which is essentially in line with where we finished q1 we're a little above that with some of the activity we had in april at the high end of guidance average occupancy be 97 and at the low end average occupancy would be 96 percent.
Operator
Our next question comes from the line of Anthony Paolo with J.P. Morgan. Please go ahead.
Thanks. Good morning. You know, given the comments on Columbus, what's the likelihood that you start a project or two this year?
Oh, hey, it's Brendan. Nothing to announce today, but as has been noted, the fundamentals in Columbus are very positive today. We've been seeing a lot of demand from both data center related uses and manufacturing, as well as the demand drivers that have existed in that market for some time. At the moment, we can…we're…in order to position ourselves with the most flexibility, we're doing pre-development work, including design work, on three different sized buildings there we can build a total of 1.25 million and that'll just allow us the maximum flexibility to to respond to where we see the most favorable supply and and demand okay and is the pipeline outside of what you have on your balance sheet right now for things like build the suits and development uh has that changed much is there much activity there with any other developers that you might be working with right now well i should have also added to just with respect to the existing land bank uh we are additionally uh responding to build the suit interest at both our our columbus sites and our phoenix sites uh so there's that build the suit opportunity uh in the land bank as well as considering speculative development if the fundamentals are there and remain there with respect to other opportunities yes we do have conversations with the merchant builder relationships that we have from time to time about build to opportunities outside of our land bank as well but nothing imminent to to report on today on that front.
Okay. And then just last one, the stock buyback, just you've done a little bit of there, a little bit there. What's just the appetite at current levels and just how does it fit into the capital allocation right now?
Development is a better investment from our standpoint with respect to creating yearholder value.
So we have some liquidity that we can use for buyback opportunistically but what's happening in the in the development there especially in phoenix is is a much larger driver of value creation okay thank you thanks Tony our next our next question comes from the line of vince t-bone with room street please go ahead hi good morning um question for nathan i'm curious within guidance how much new leasing is kind of baked in to the, you know, low end, high end, because it sounds like you have a pretty good pulse on knowing move outs and retention rates. So just trying to get a sense of, you know, you need to lease, you know, another 300,000 square feet of, you know, existing vacancies or move outs to hit the midpoint, or is it lower?
Just trying to get a sense of the, you know, kind of different outcomes besides just move outs on the new leasing side that could move the numbers within guidance, whether it be same store or FFO. yeah vince um you know so going back to to uh james's answer a little earlier in the q a here you know we have um we have three node move outs essentially in the second half which is uh a roughly 550 000 square feet um so in the context of our earnings guidance at the midpoint we're essentially saying that on average during the um during the year including including q1 your occupancy will be 96.5%, which is in line with Q1. So the guidance at the midpoint essentially assumes that, you know, we have new leasing activity with regard to all of that move-out activity.
And then so if you look to the high end of guidance where average occupancy is 97%, there's obviously incremental new leasing beyond the 550 of no new move-outs. no that's helpful um and just to follow up it looks like just some quick math it looks like the retention rate is going to be higher than than we previously projected is that fair i think on the last call you indicated to be about 70 percent and it looks like just given the first quarter move outs and the you know 500 you mentioned there it looks like retention will be yeah closer to 90 if my math is right or in the 80s is that is my logic correct there We're building in some buffer for, you know, unknown situations that come up.
There's always something that comes up in the back half of the year that, you know, you're not expecting. So, there's some buffer. Our guidance is still, you know, based on 70 to 80 percent retention.
Got it. And then just last one for me, just on the – you mentioned if you're going to proceed with any new developments, you would likely fund it with dispositions. Is there any chance you look to, you know, sell out of the cold, you know, cold JV or the, you know, the remaining net lease office JVs, or kind of what's the strategic rationale to hold on to those, you know, joint venture assets that are, you know, now very different from the rest of the portfolio?
Well, yeah, there's not much left in the office JV, Vince, and we have been sort of, you know, liquidating that as quickly as the market will bear uh in the other industrial joint venture you know we're a 20 partner there so it's um you know where the minority partner is entirely up to us we do have some opportunities to make some good sales in that in that portfolio so uh we do expect that it will shrink modestly over time um but um you know it's an investment that produces a pretty high return on equity for us and uh it keeps us with the you know modest exposure to the manufacturing business um which which gives us some some insights into the logistics
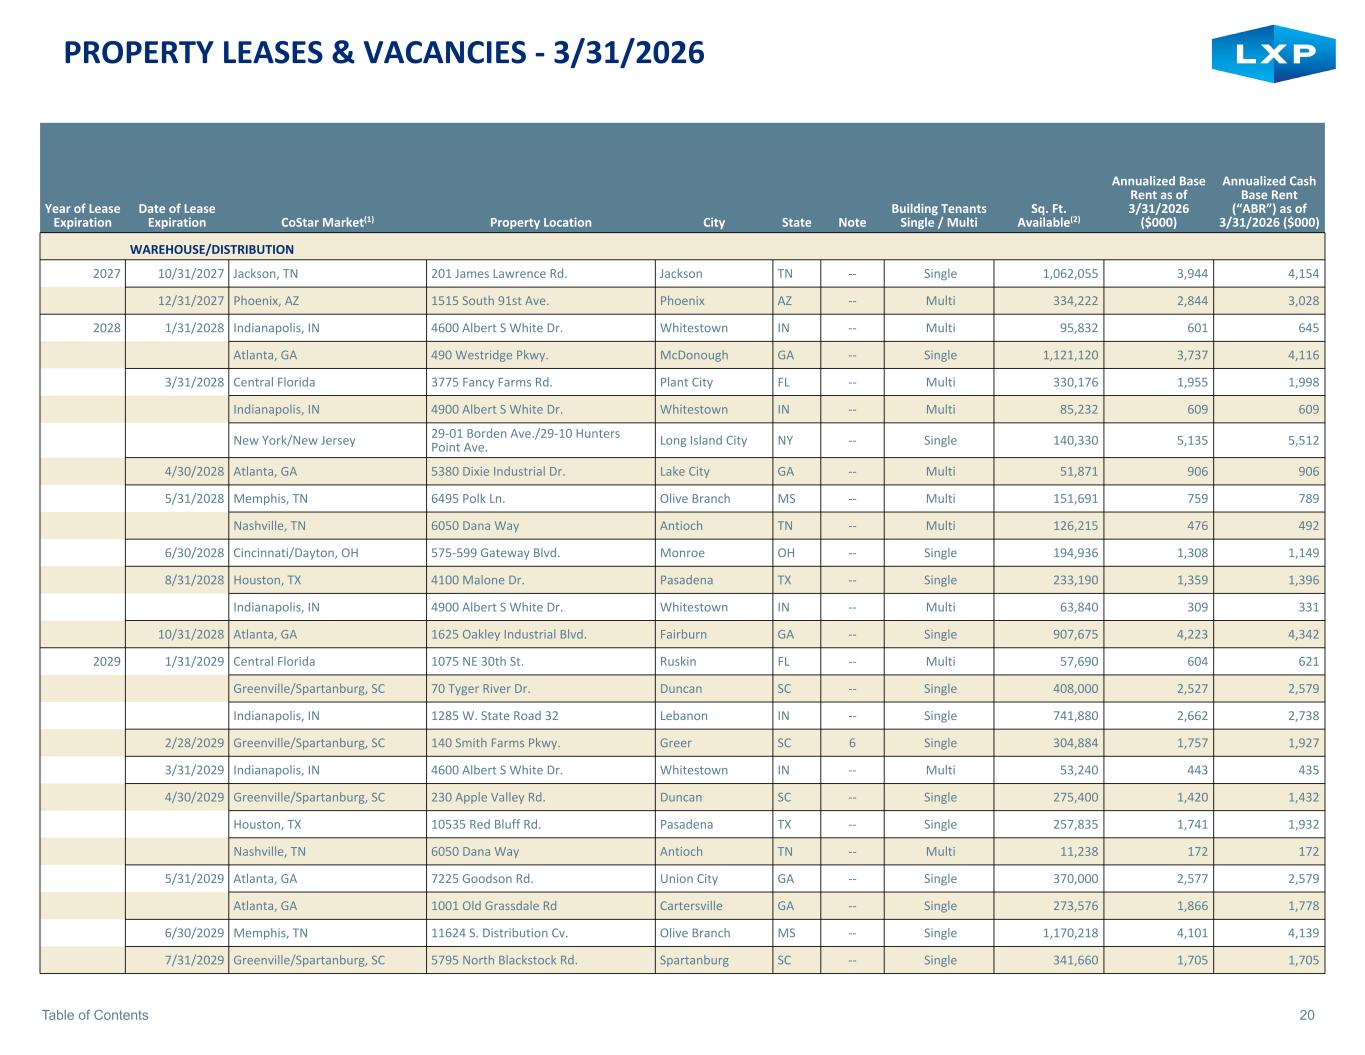
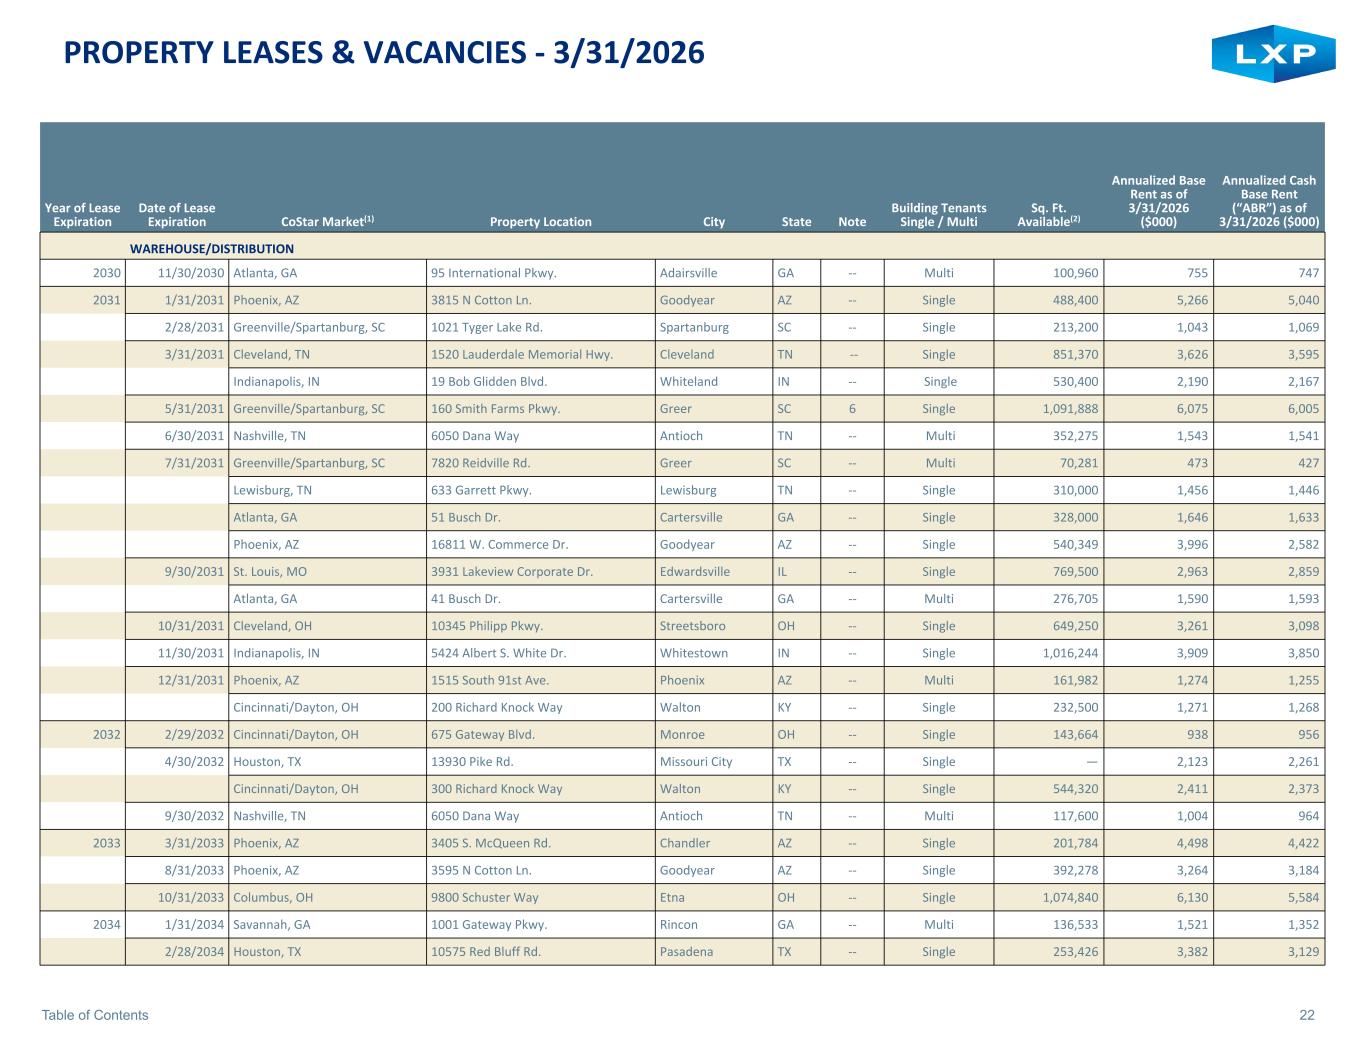
demand and some of those manufacturing hubs that we're invested in great thank you our next question comes from the lightest gm camera evercore please go ahead uh good morning thank you i think nathan And you mentioned, you know, 4.6 million square feet or so of lease negotiations for looming explorations. How much or does any of that encompass? You guys have two big Nissan deals in early 27 and then a million square footer in Jackson, And any color updates on those would be appreciated. I didn't know if that was in your 4.6 million square feet.
Hey, Jim, it's James again. I guess I'll touch on the 2027s. Yeah, we've got a number of chunky leases in 2027. And, you know, we're in advanced negotiations in some cases, and I'm definitely talking to all the tenants for these large boxes and expect a very high rate, if not 100% renewal on the big boxes that we have. That includes Nissan.
Operator
Our next question is from the line of Mitch Germain. Please go ahead.
Good morning. I think, Will, you mentioned any new development would be matched with, or new potential development would be matched with asset sales. Is that, you know, are you going to sell ahead of, you know, the project commencement and kind of sit on those proceeds like you've done at the end of 4Q with Phoenix? Or how should we think about the cadence regarding how that process can play out?
No, I think it's preferable to match fund sales with stabilized outcomes for development. So we had some distribution activity last year that left us in a very strong cash position to fund the project in Phoenix. But I think we would prefer to hold on to the income from the assets that we might sell to fund development and try to match things better.
Got you. And then, you know, last one for me, obviously, a significant amount of demand acceleration happening in the industrial sector. You mentioned the seven-plus million square foot pipeline. Any sort of themes, industries that you're seeing that are driving, you know, more demand versus others?
You know, Brendan touched on it a little bit. We've seen a big uptick in data center adjacent demand in a number of our markets, and we're fortunate to be placed well for those potential tenants as well you've seen a couple of big leases get done for Meta and for AWS and Phoenix that took down a couple of the big boxes there there's been a lot of new activity in Columbus that's data center related as well and then we've got our Richmond redevelopment where there's a big Google data center campus going in next door so I think that's one of the things I would point out there's also continue to be growth and, you know, supplier demand for advanced manufacturers that we're seeing continue to grow and develop their different opportunities, you know, I'll bring Phoenix up again with TSMC, you know, moving along and some of the ancillary demand that's popped up there. So we're starting to see a pickup there. So, you know, manufacturing and data center adjacent, I think, has definitely been the recent theme and a big pickup in the Thank you.
Operator
Once again, if you would like to ask a question, please press R followed by the number one on your telephone keypad. Our next question comes from the line of John Peterson with Jeffries. Please go ahead. Oh, great. Thanks.
Just one quick question for me.
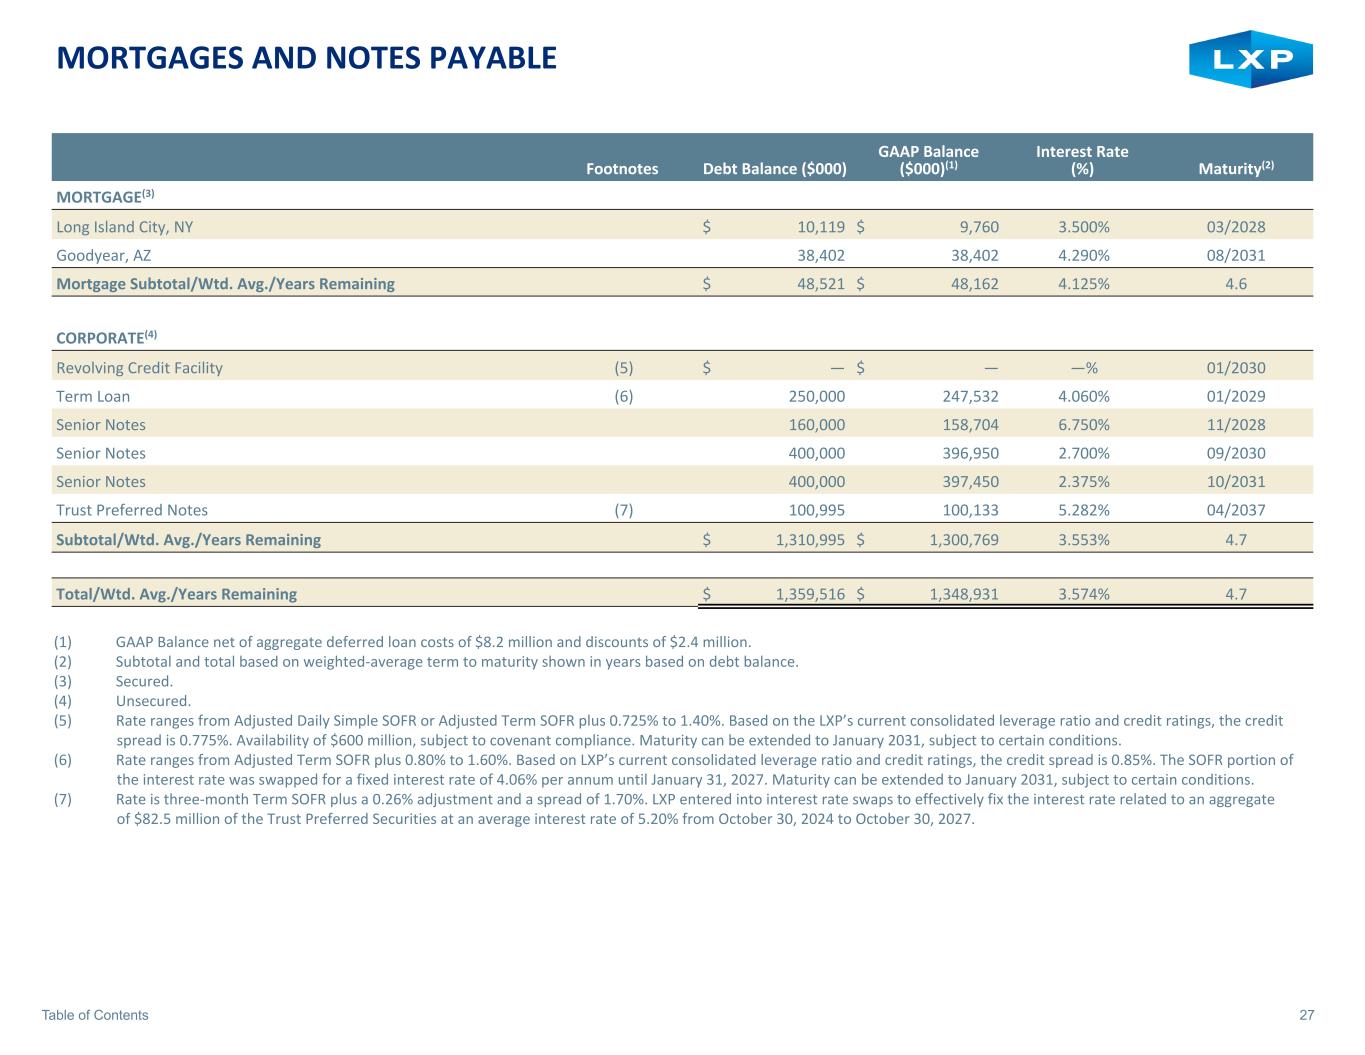
So the senior notes that are due in 28, $160 million with a six and three quarters interest rate, can you remind us, are those callable early?
Like, should we think about you taking those all the way to maturity or should we assume you're able to refinance those um early but they uh they they have a um uh may call uh structures so they're uh technically callable but it's uh uh requires payment for premium okay all right that's all for me thank you thank you john and at this time we have no further questions i will now turn the call back over to will eglin for closing remarks we appreciate everyone joining our call this morning and we look forward to updating you on our progress over the balance of the year. Thanks again for joining us today.
Operator
This concludes today's conference call. You may now disconnect your lines. Have a pleasant day.