Operator
Good morning, everyone. Welcome to today's M&T Bank fourth quarter and full year 2025 earnings conference call. All lines have been placed in a listen-only mode, and the floor will be open for your questions following the presentation. If you would like to ask a question at that time, please press star, then the number 1 on your telephone. If at any point your question has been answered, you may remove yourself from the queue by pressing star 2. When posing your question, we ask that you please pick up your handset to allow for optimal sound quality. Lastly, if you should require operator assistance today, please press star zero, and please be advised that today's conference is being recorded. I would now like to hand the conference over to Rajiv Ranjan, Head of Investor Relations and Corporate Development. Please go ahead, sir.
Thank you, Bo, and good morning. I would like to thank everyone for participating in M&T's fourth quarter 2025 earnings conference call. If you have not read the earnings release we issued this morning, you may access it along with the financial tables and schedules by going to our Investor Relations website at IR.MGB.org. Also, before we start, I would like to mention that today's presentation may contain forward-looking information. Cautionary statements about this information are included in today's earnings release materials and in the investor presentation as well as our SEC filings and other investor materials. The presentation also includes non-GAAP financial measures as identified in the earnings release and investor presentation. The appropriate reconciliations to GAAP are included in the appendix. Joining me on the call this morning is M&T's Senior Executive Vice President and CFO Darrell Bible. Now I would like to turn the call over to Dara.
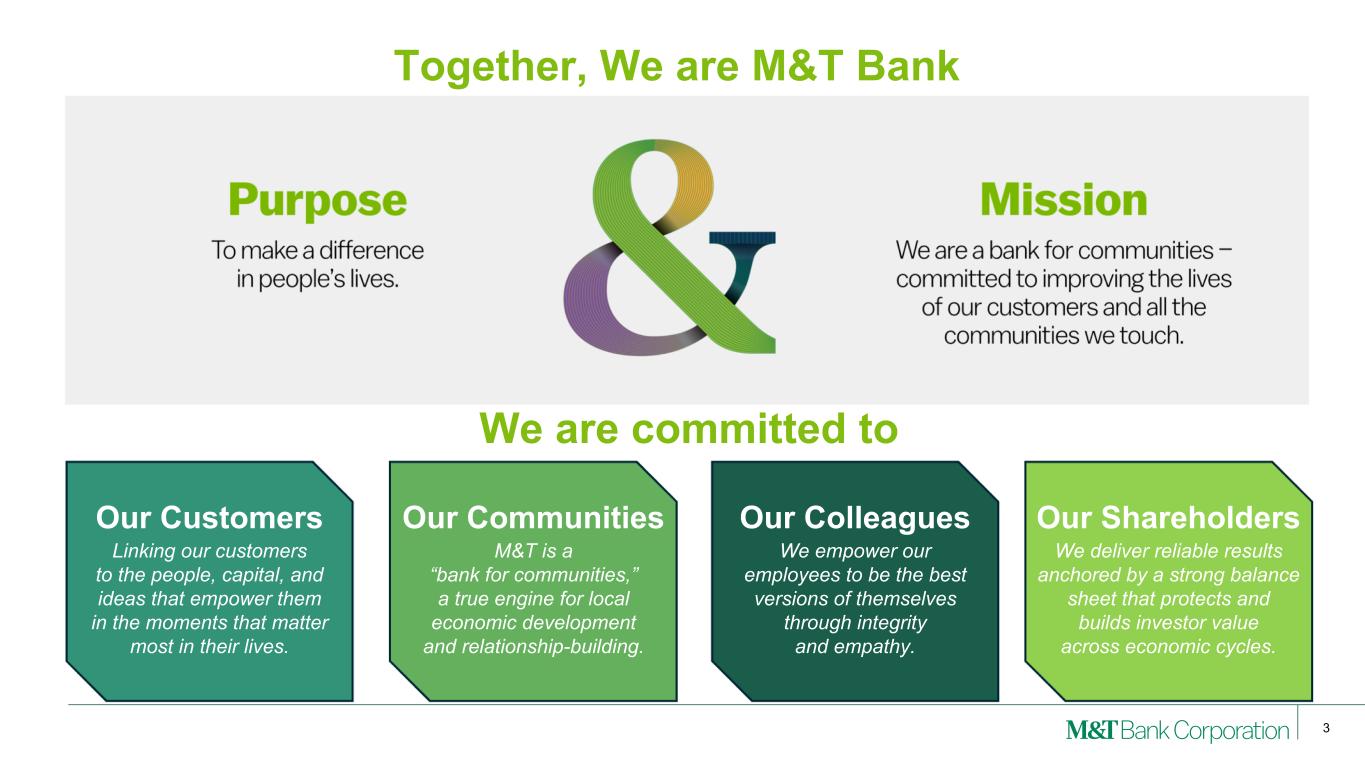
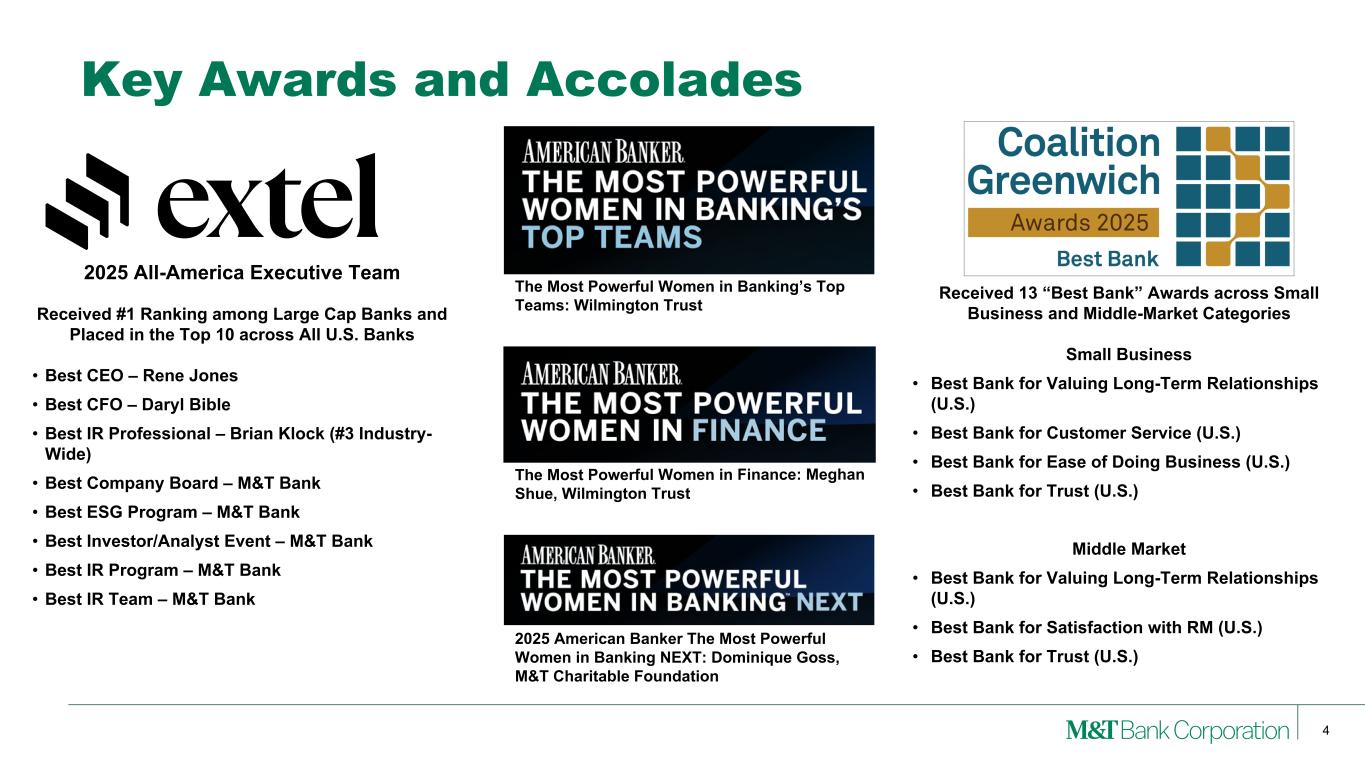
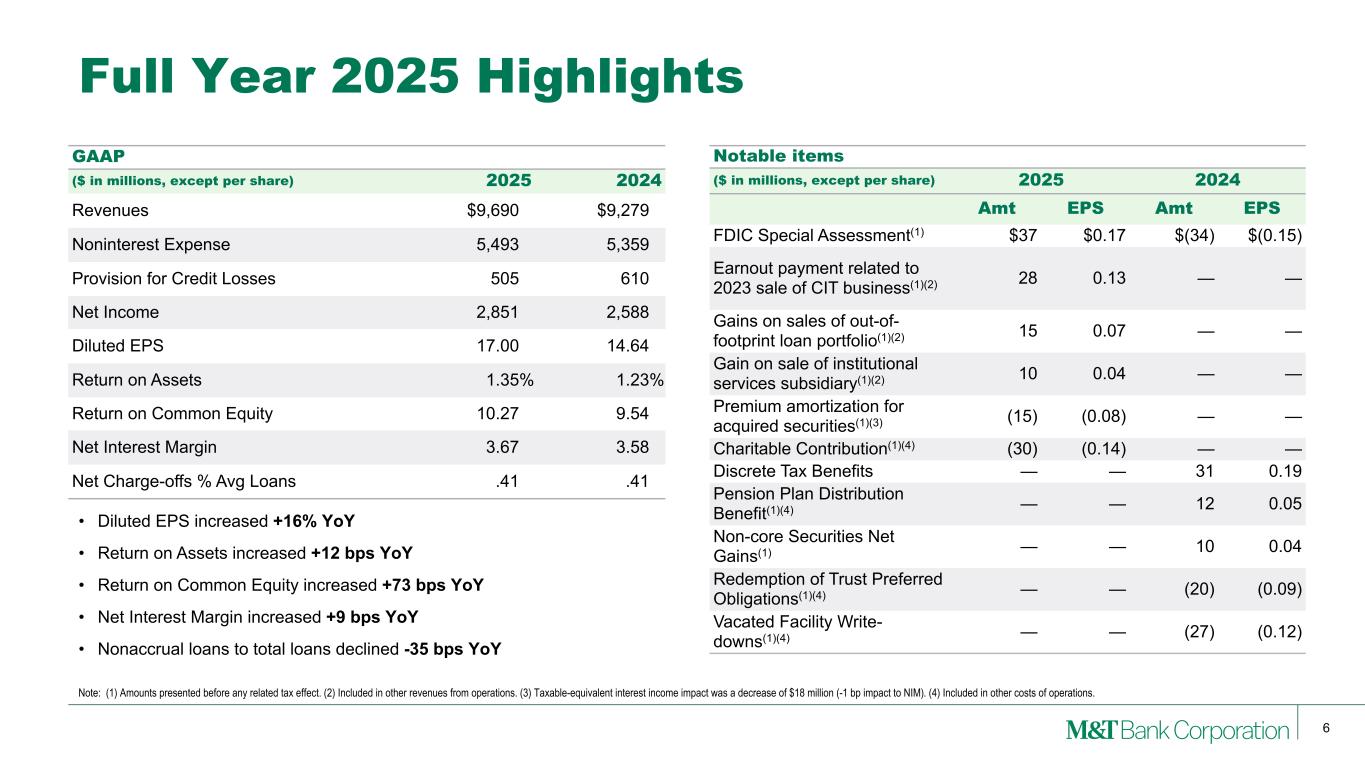
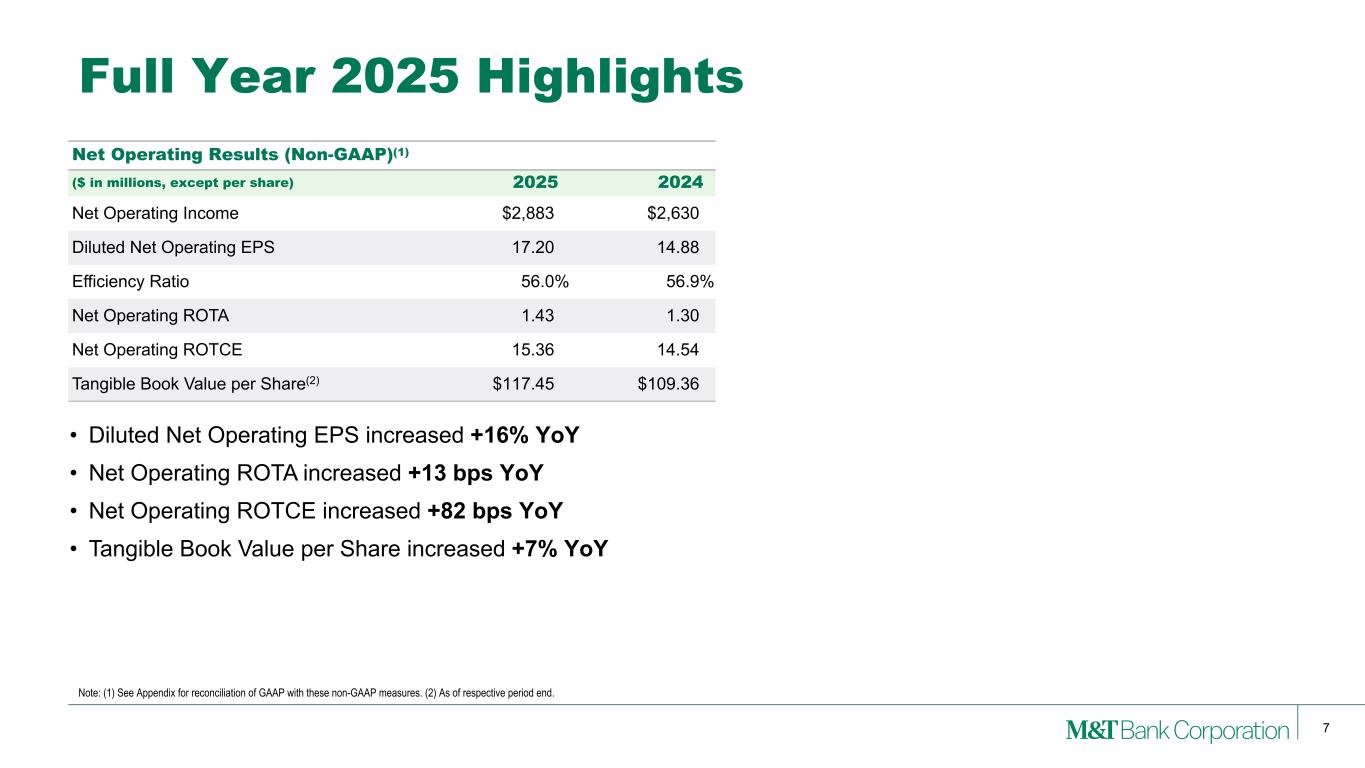
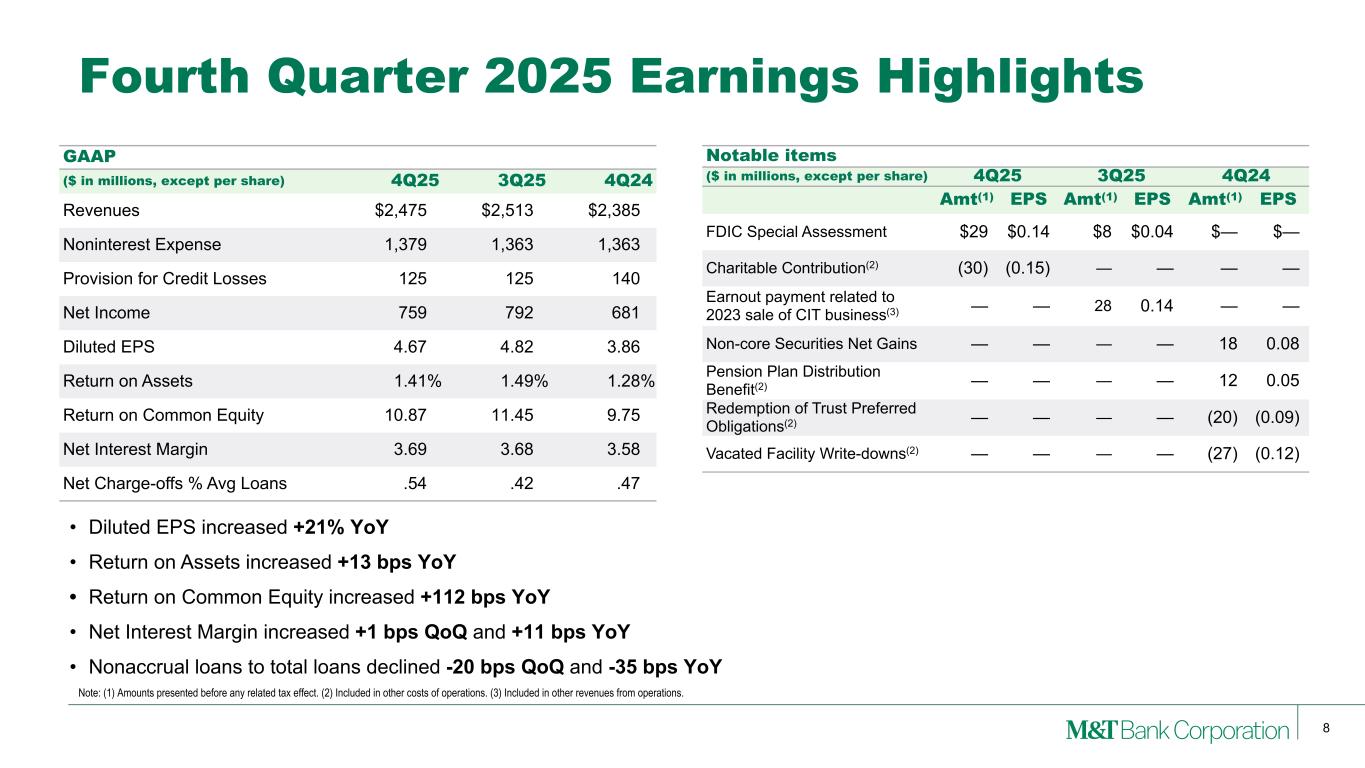
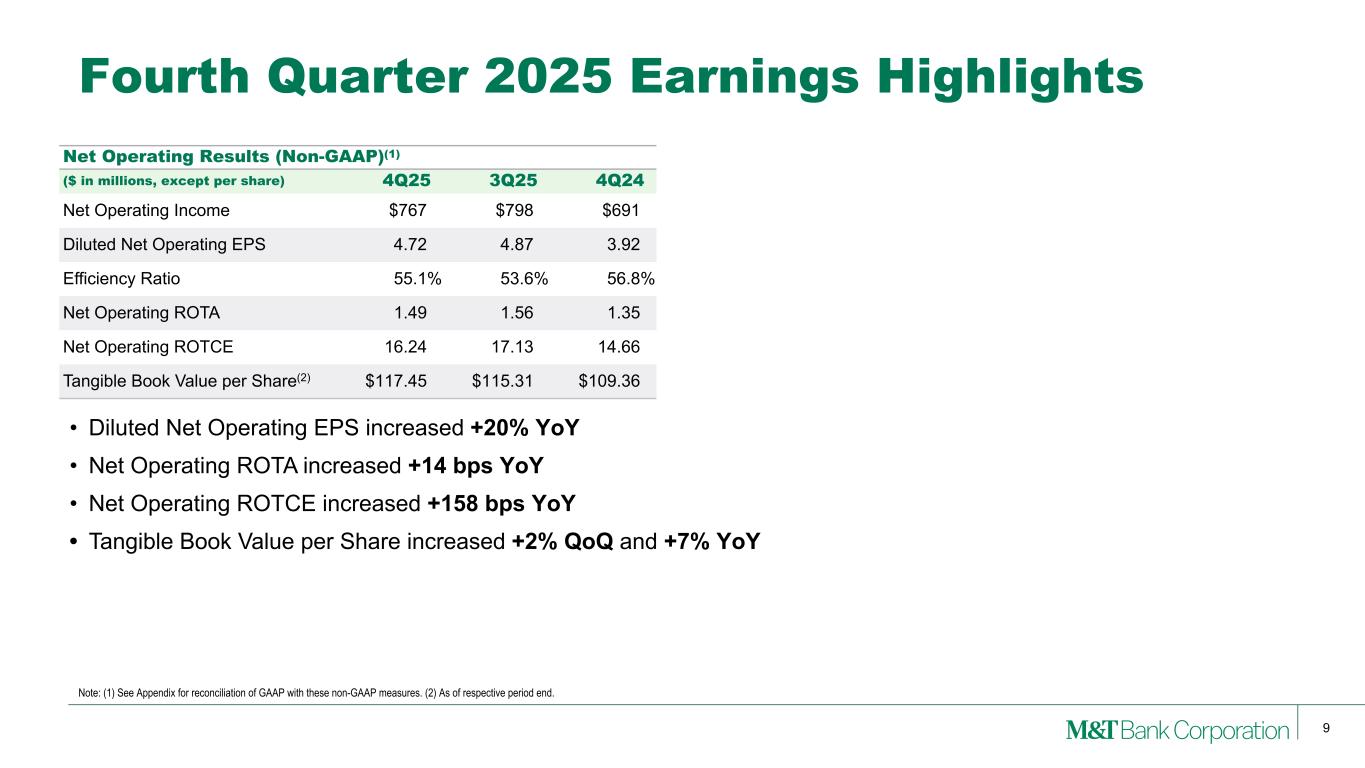
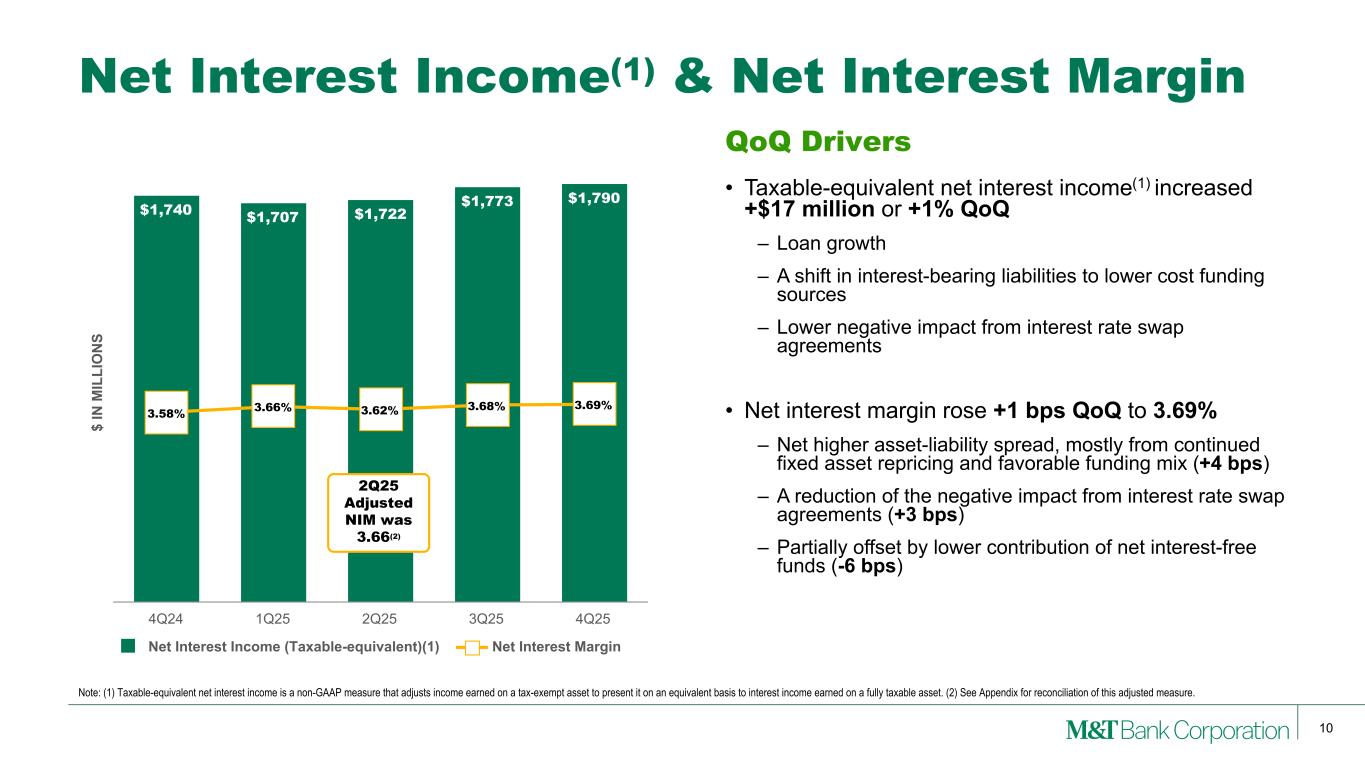
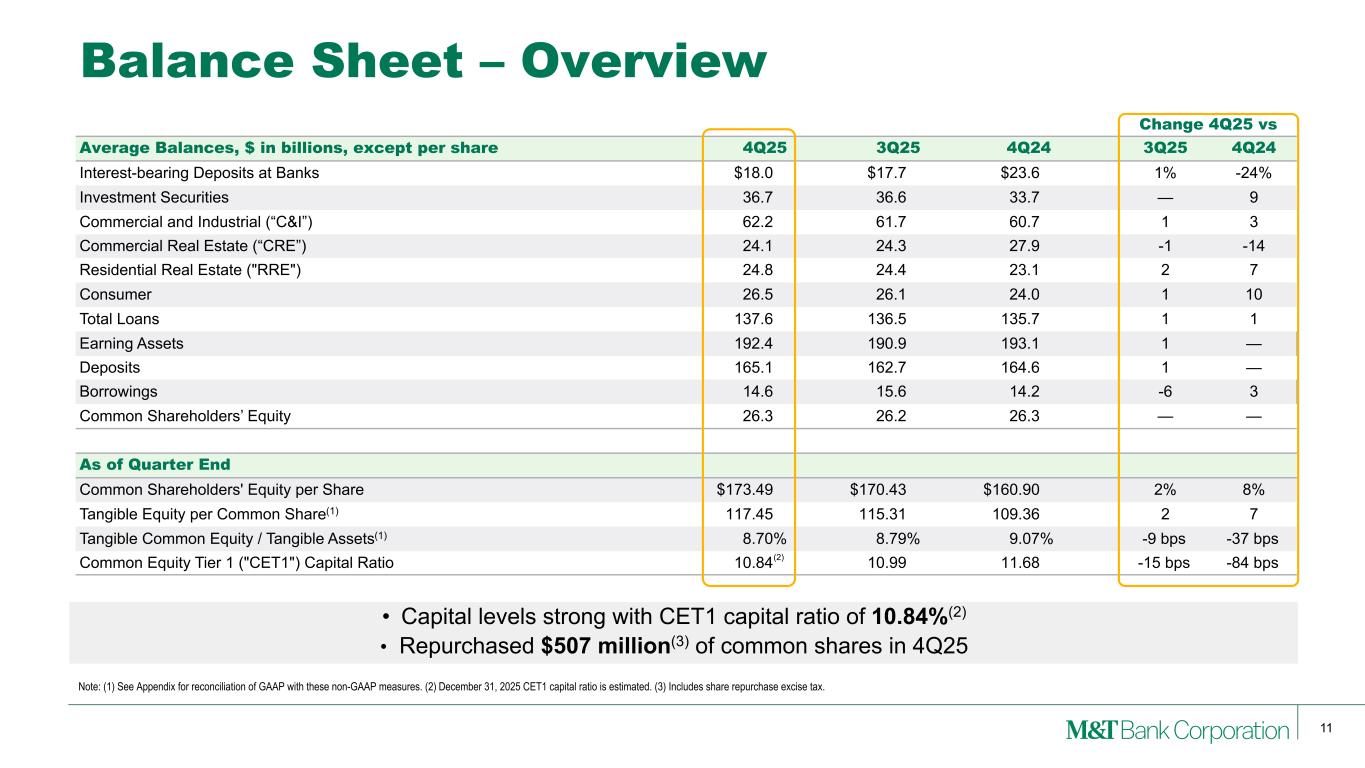
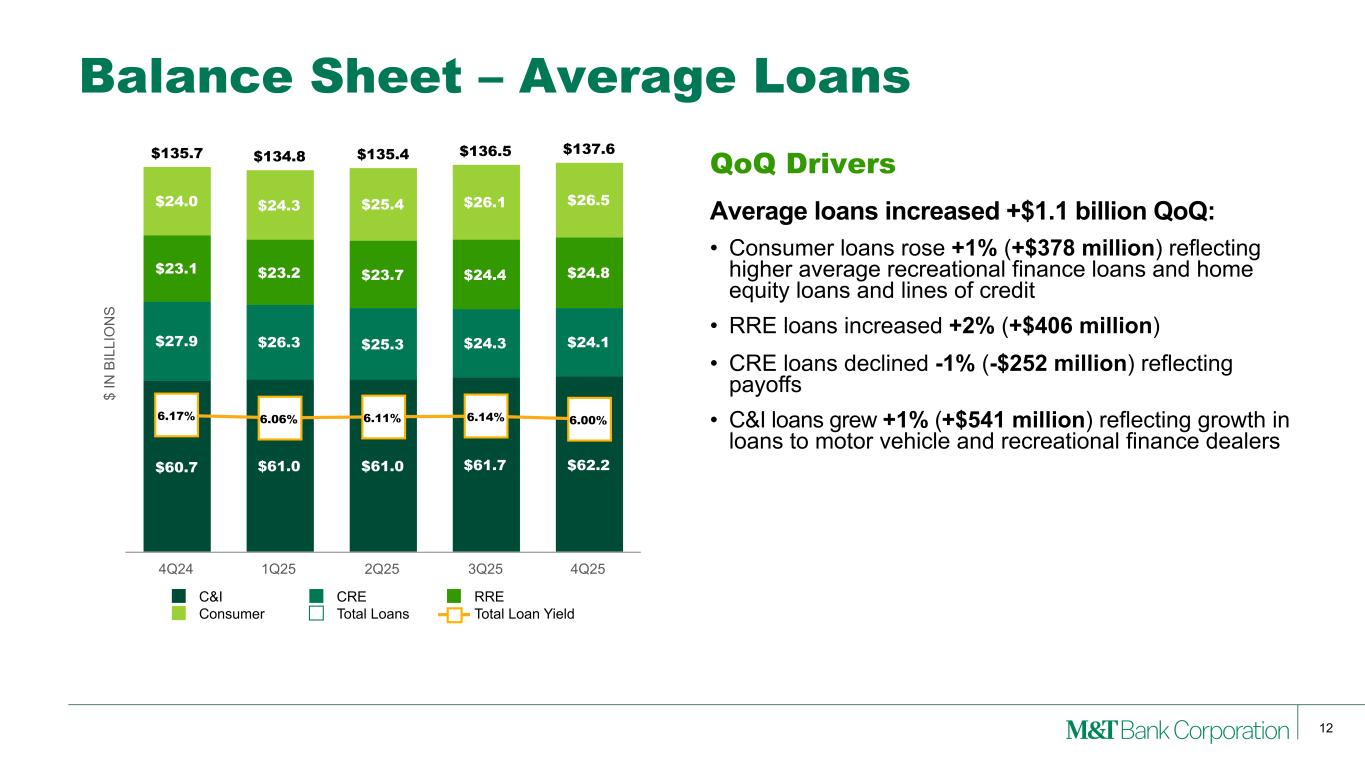
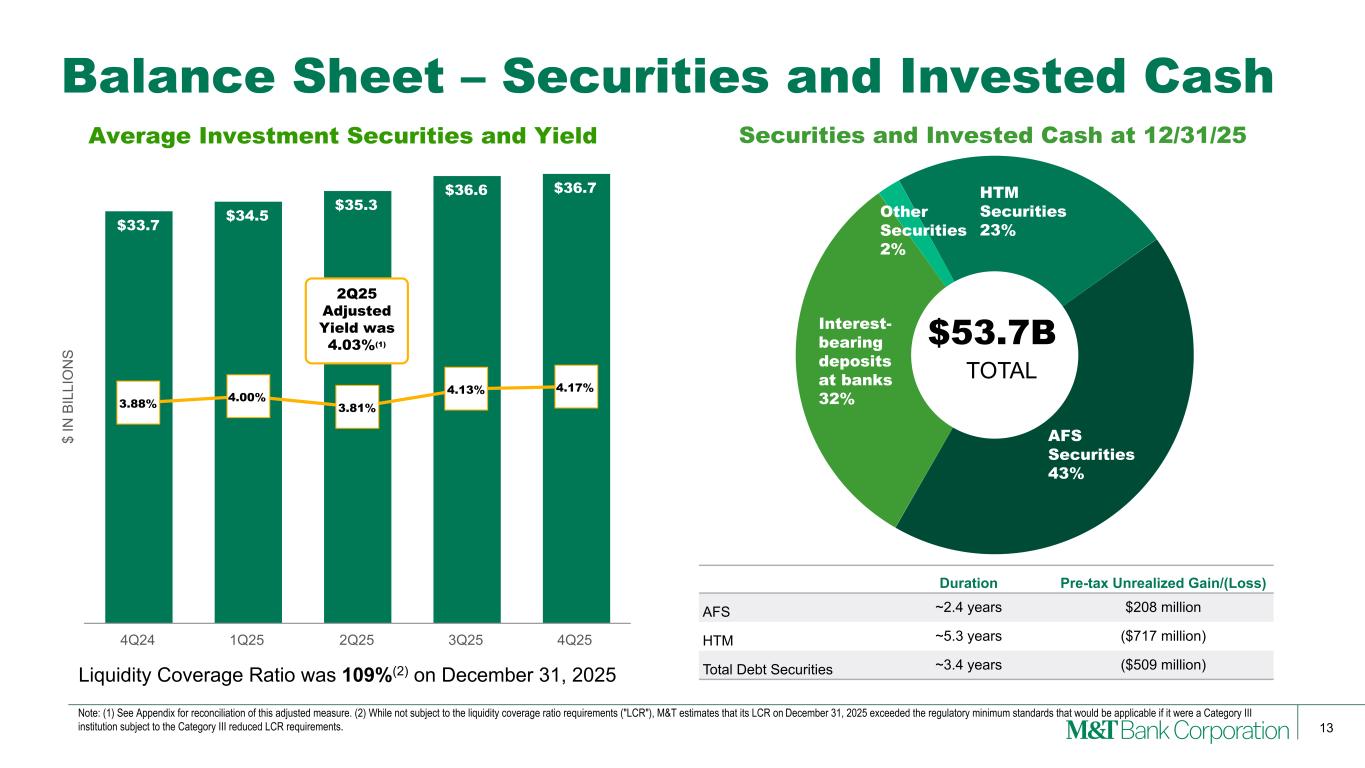
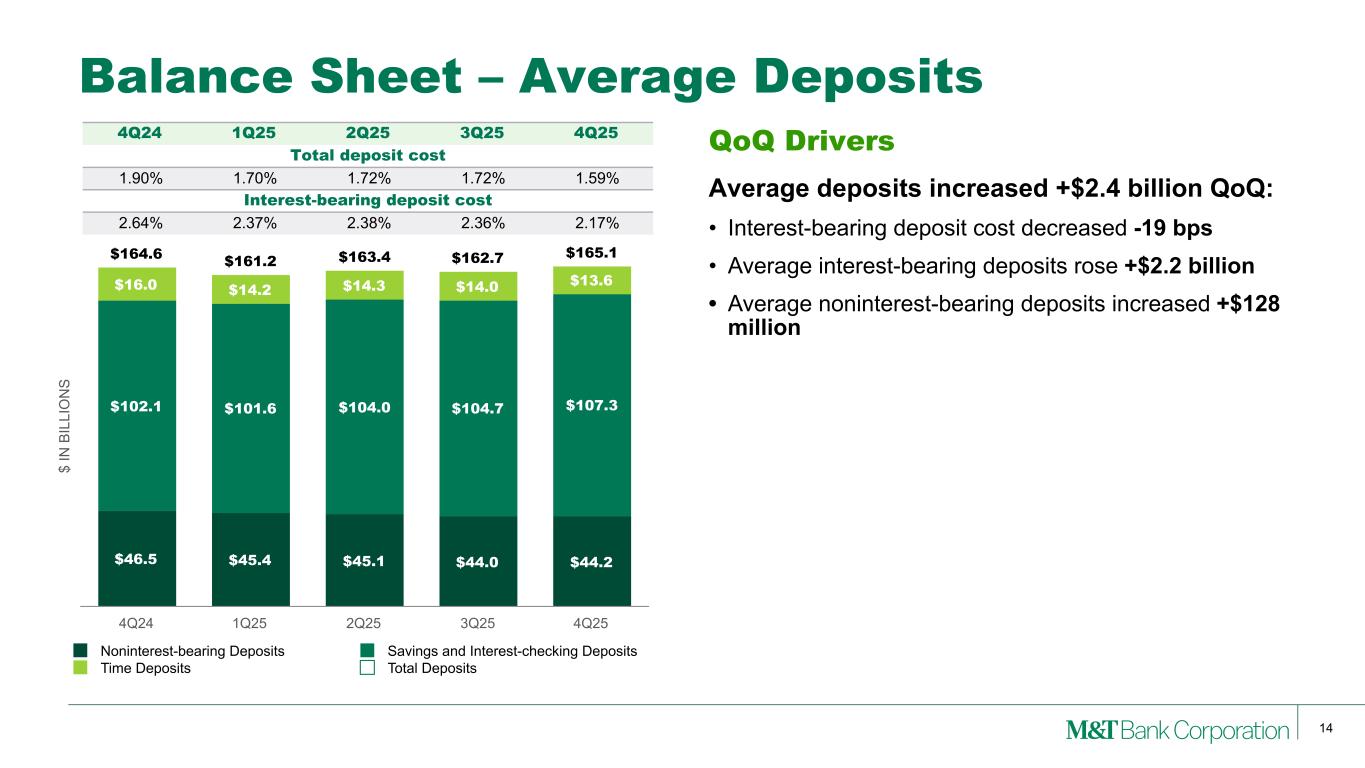
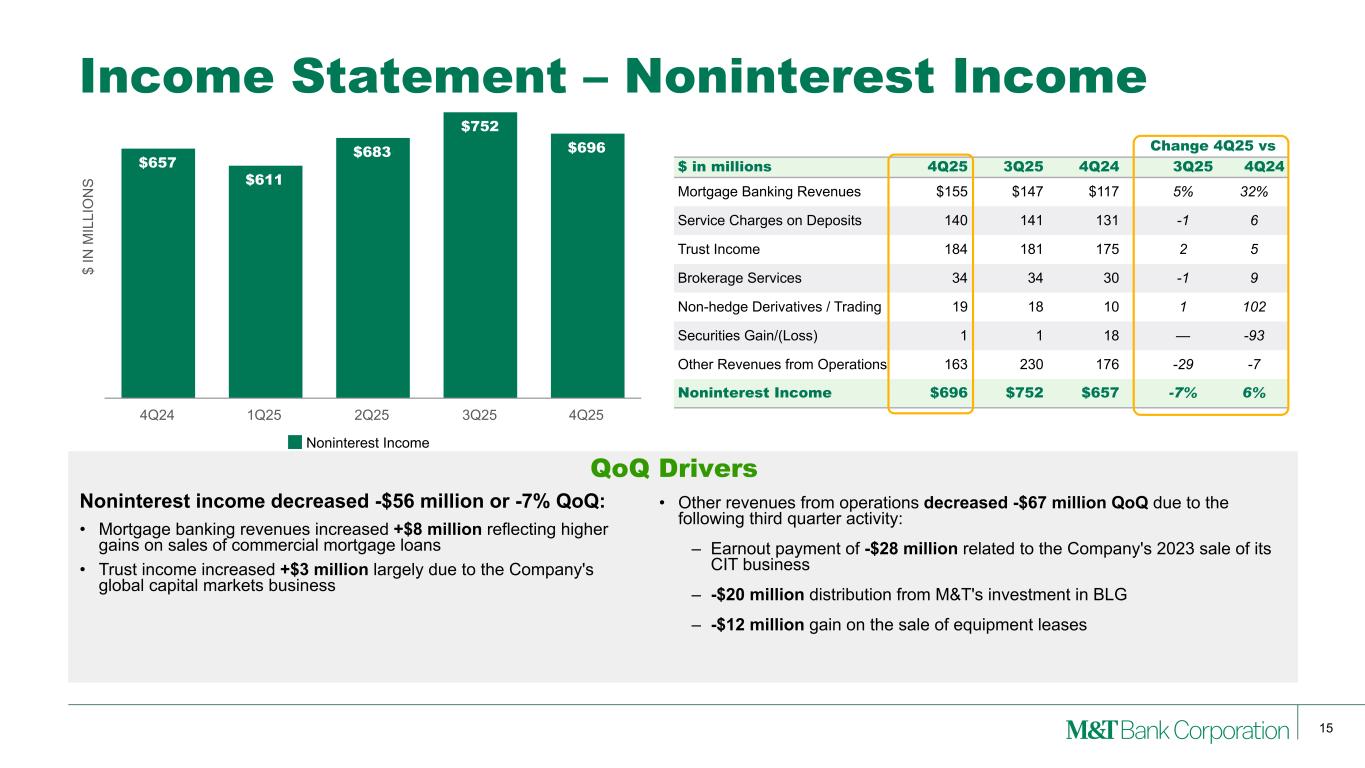
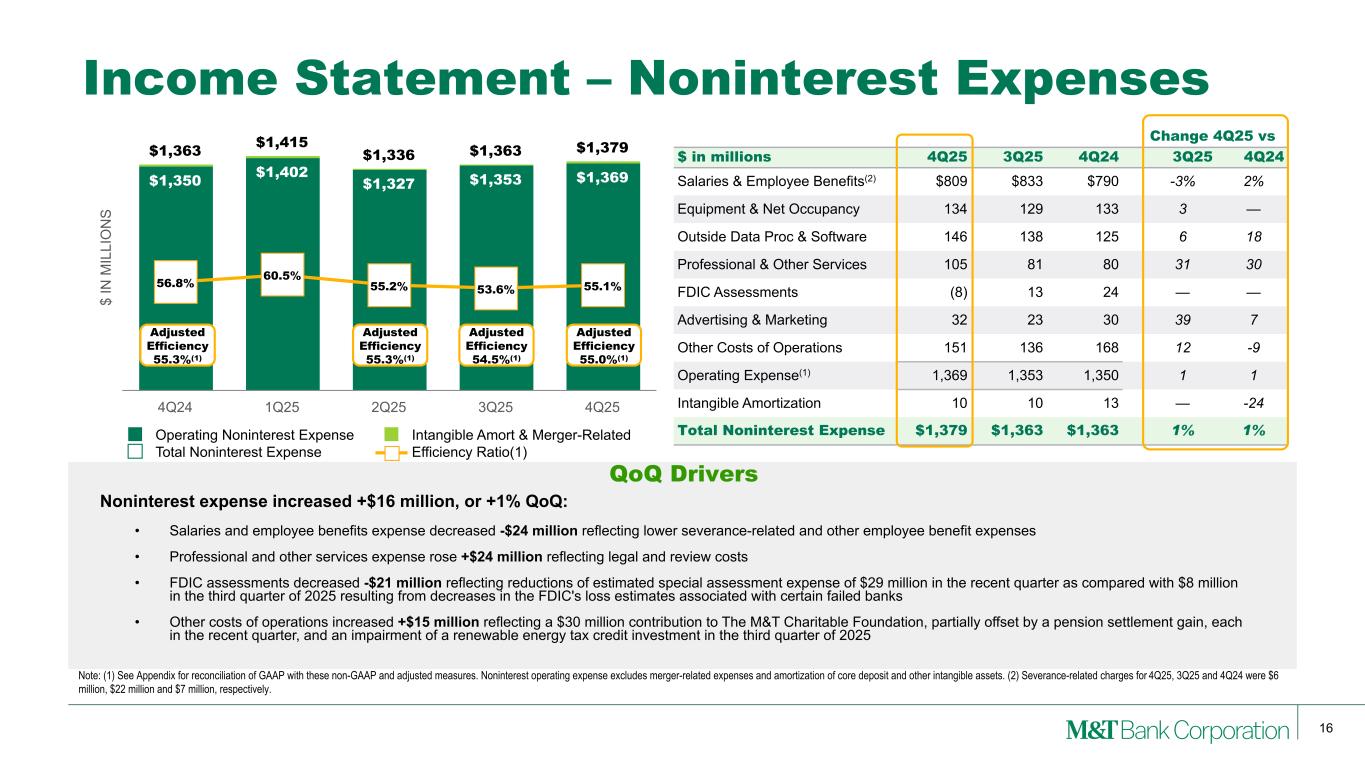
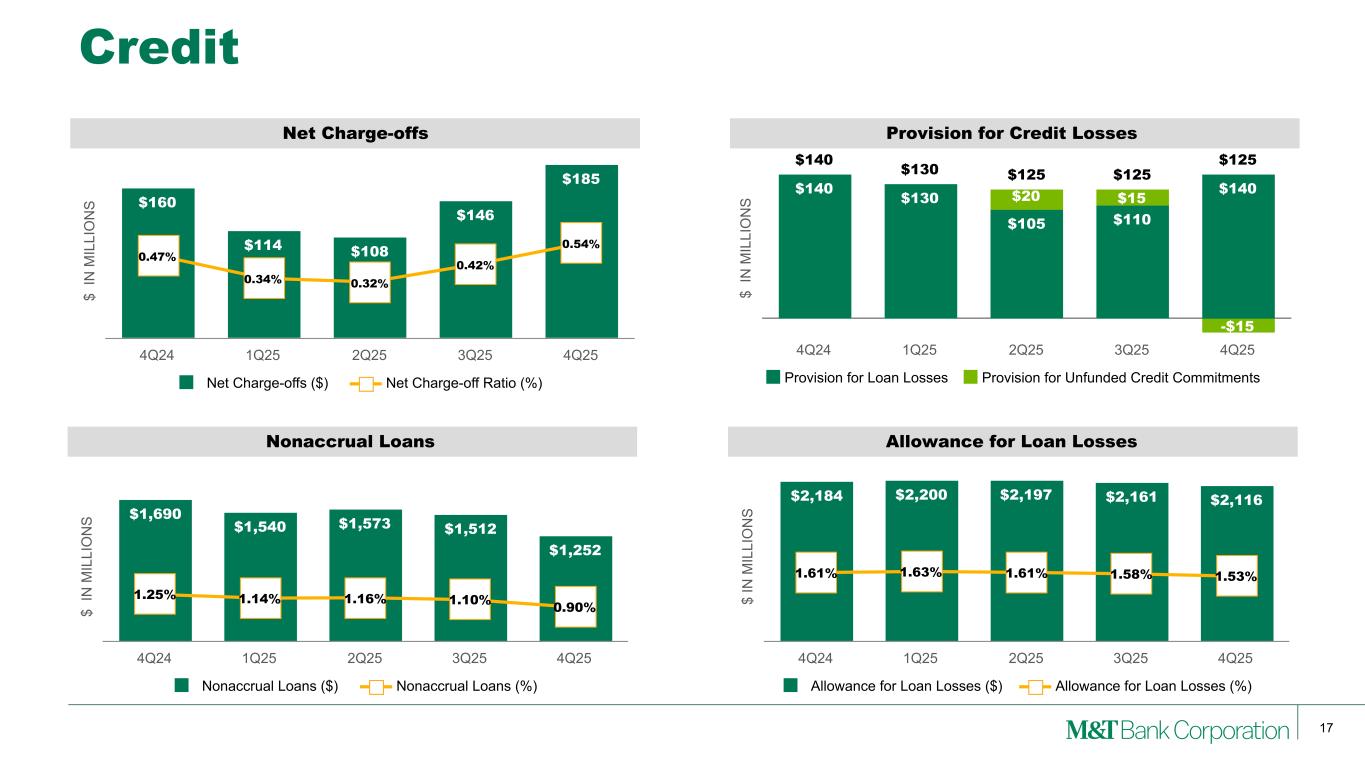
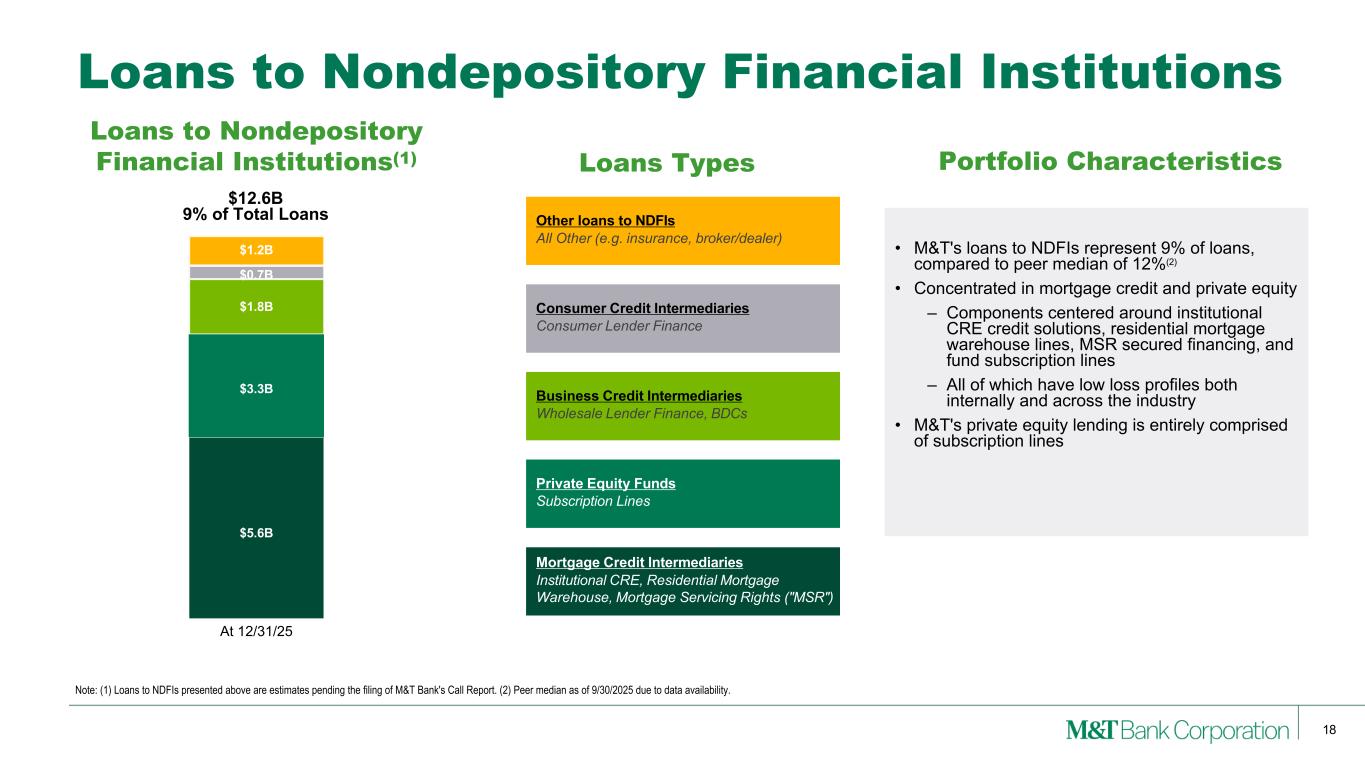
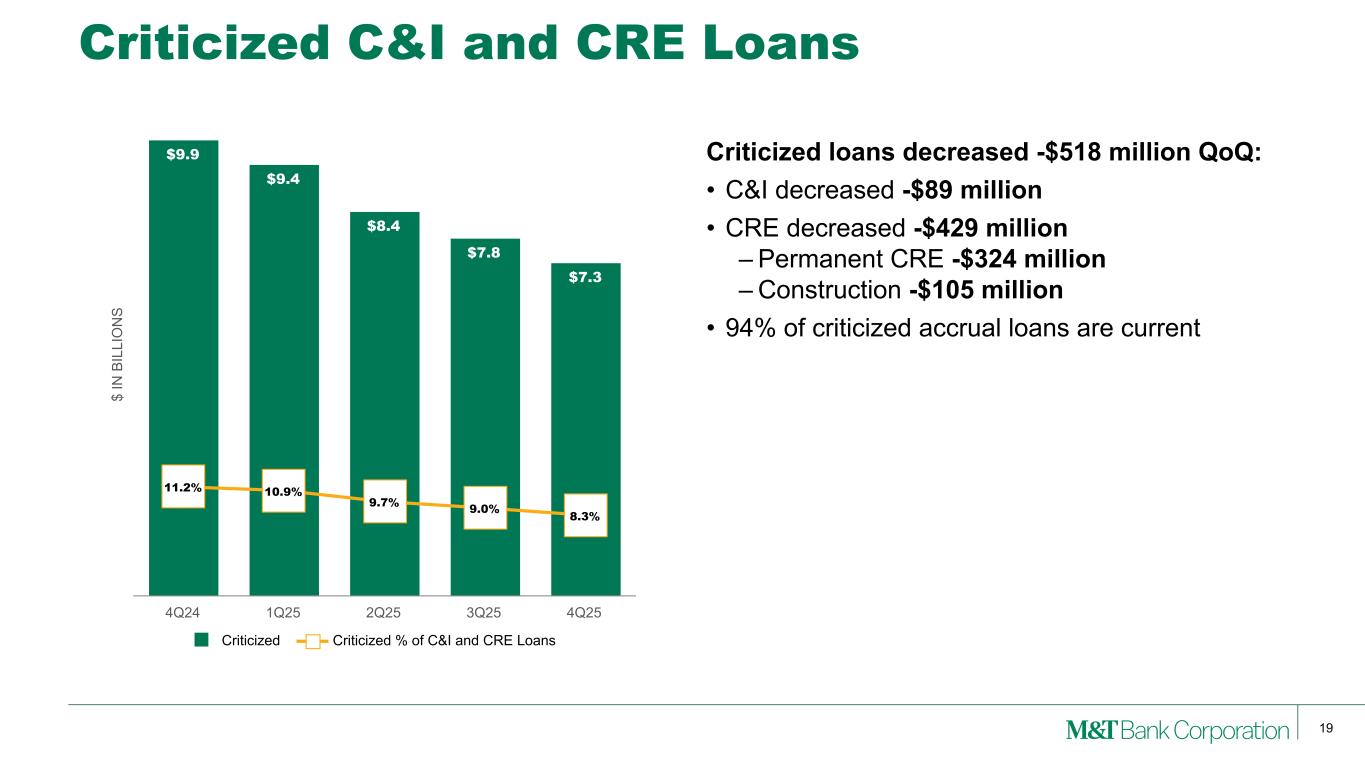
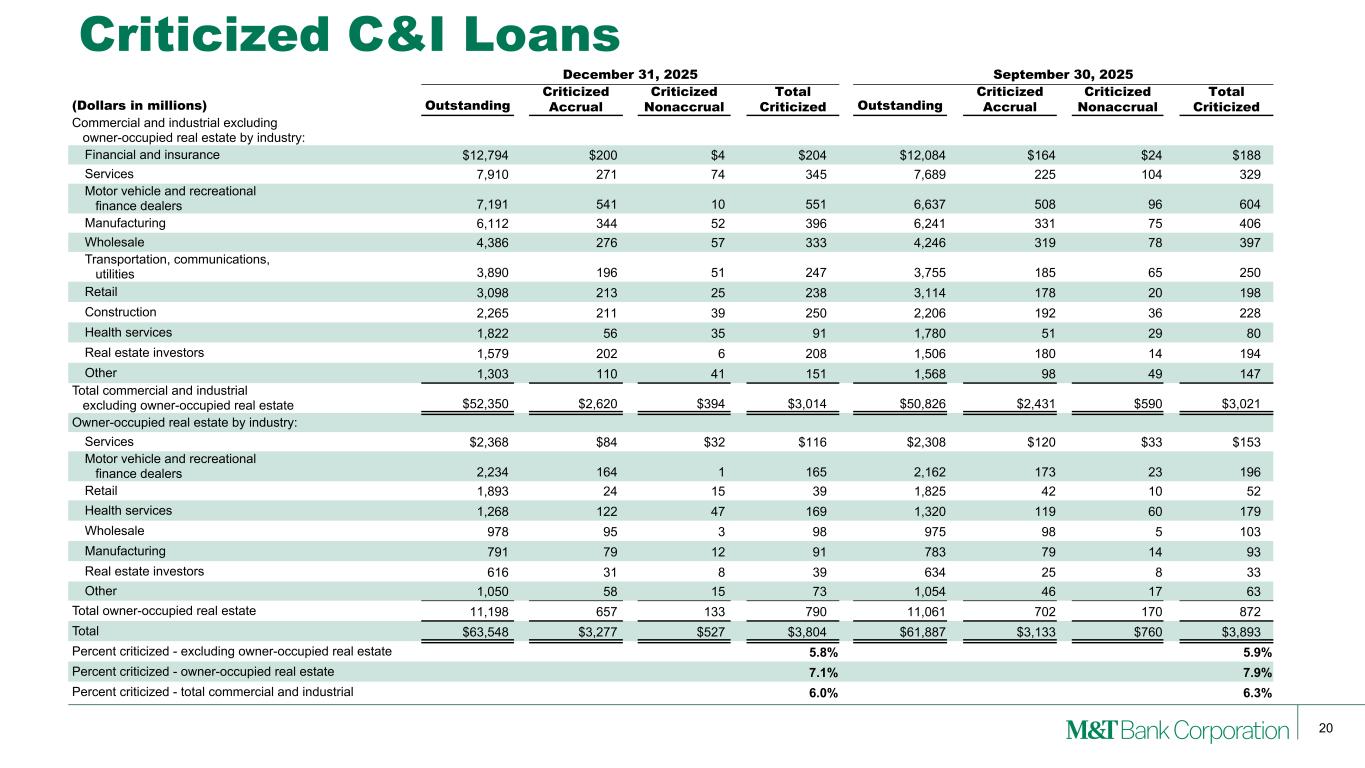
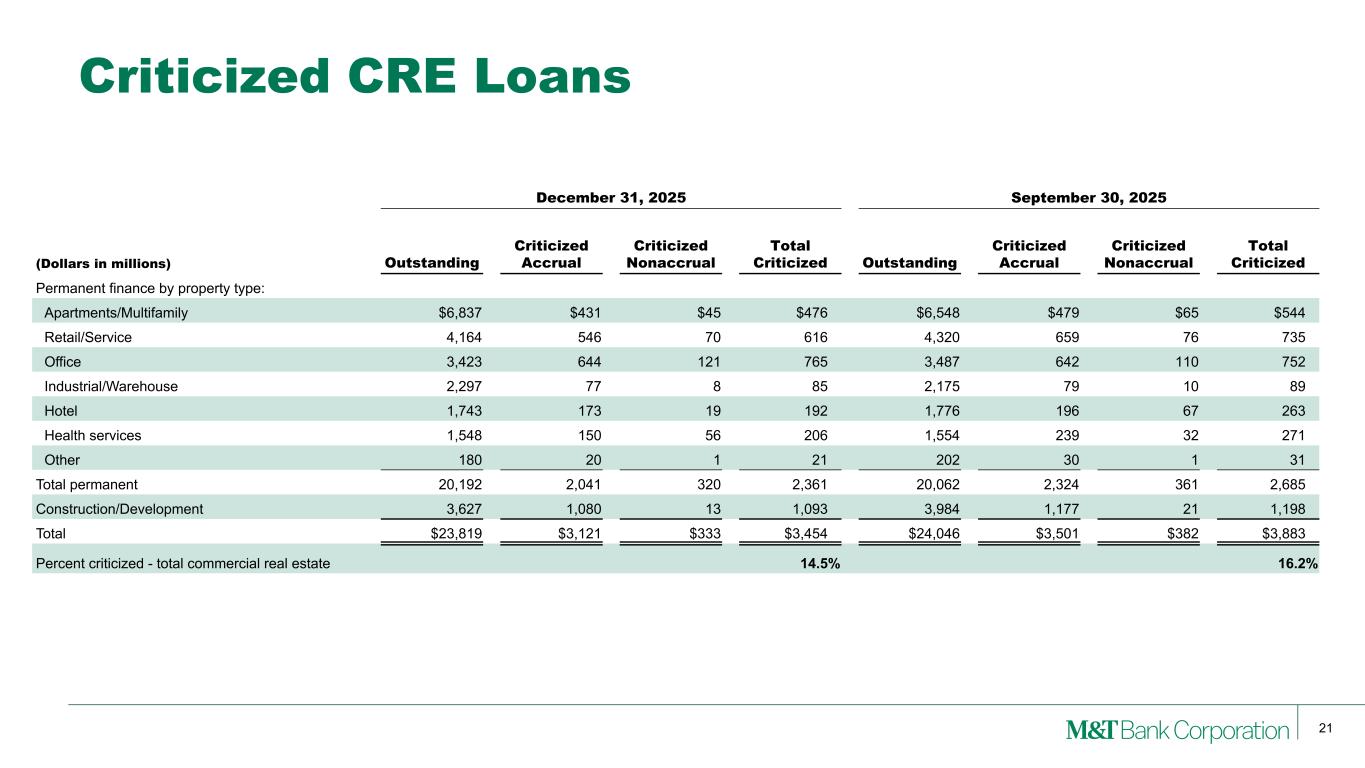
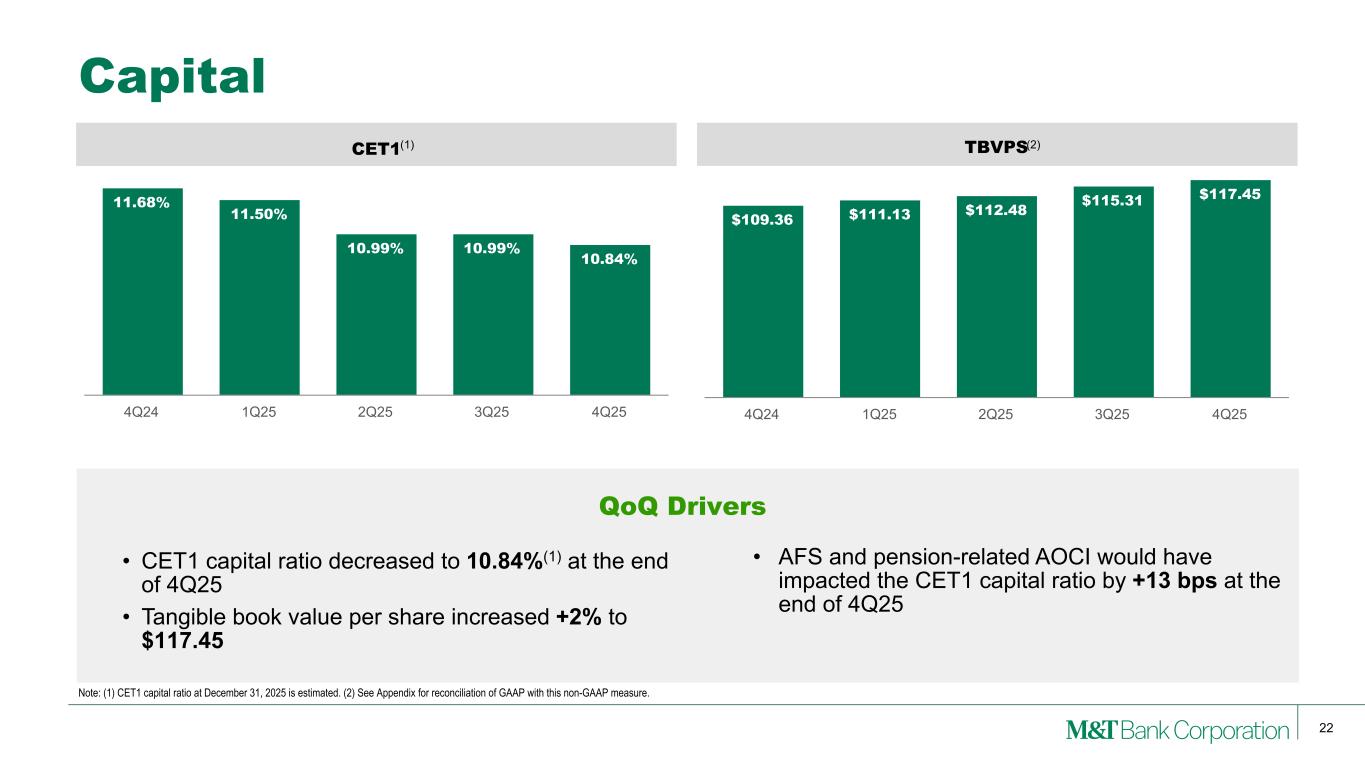
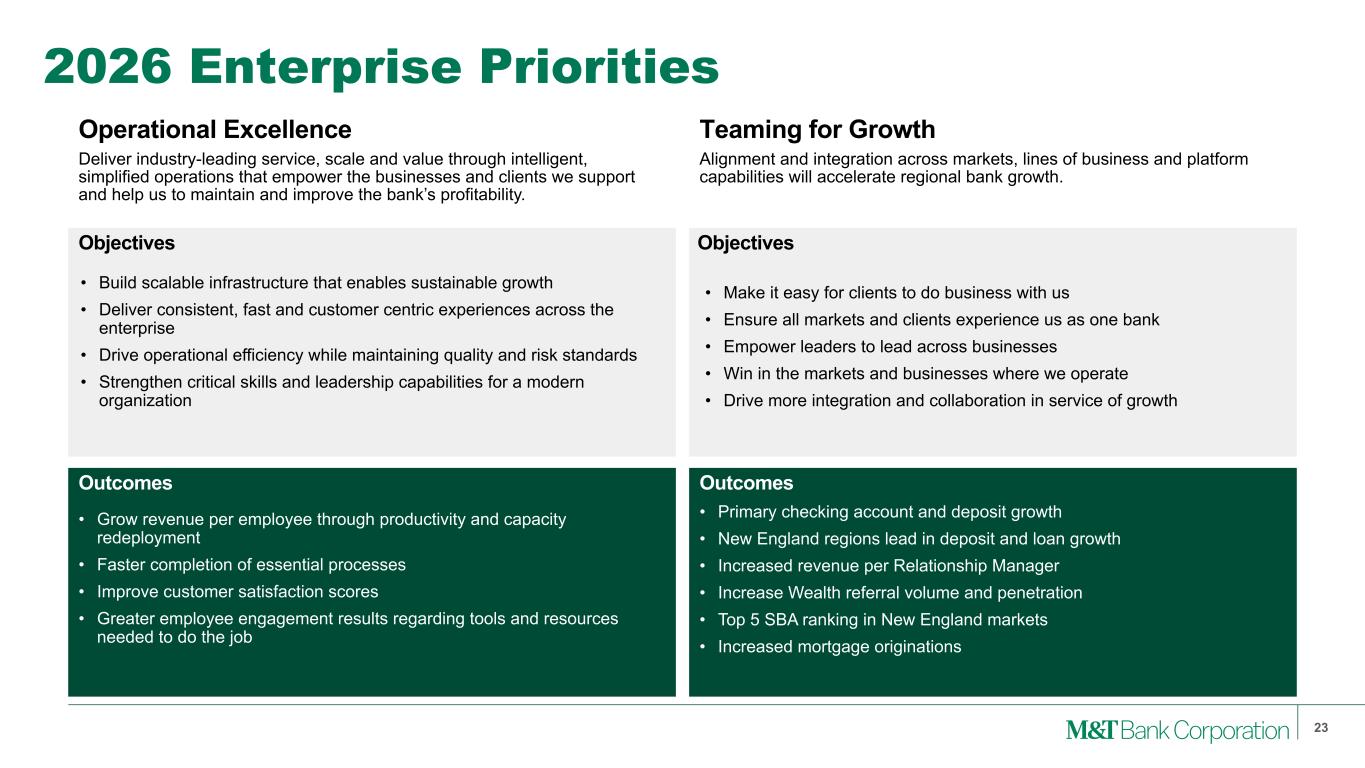
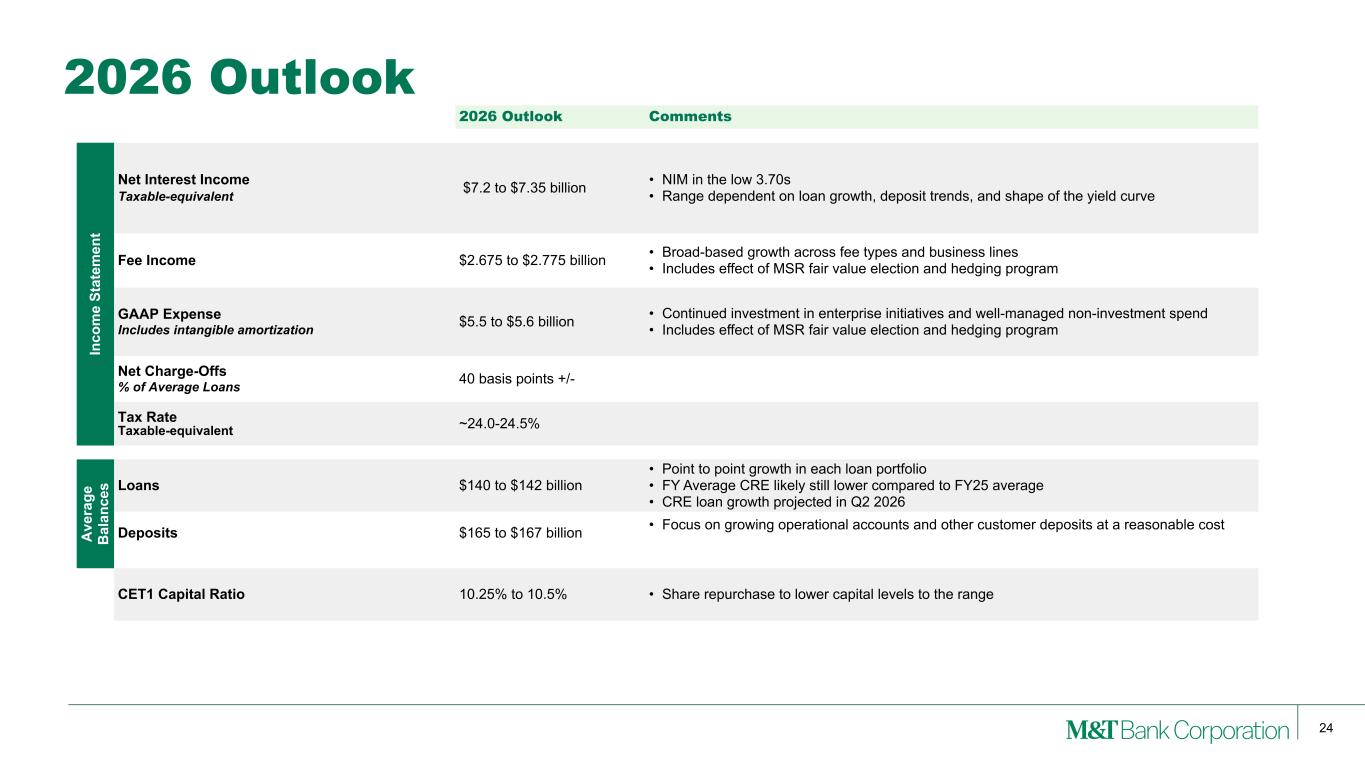
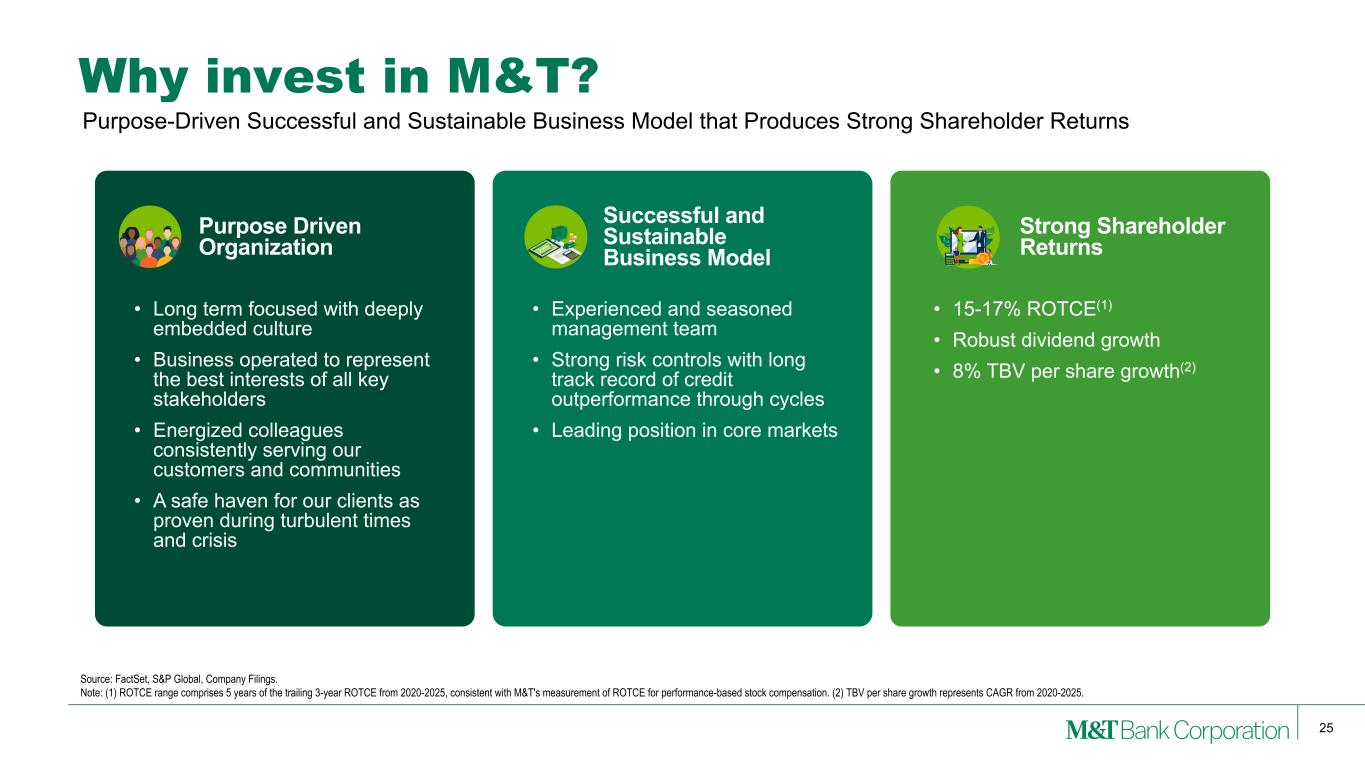
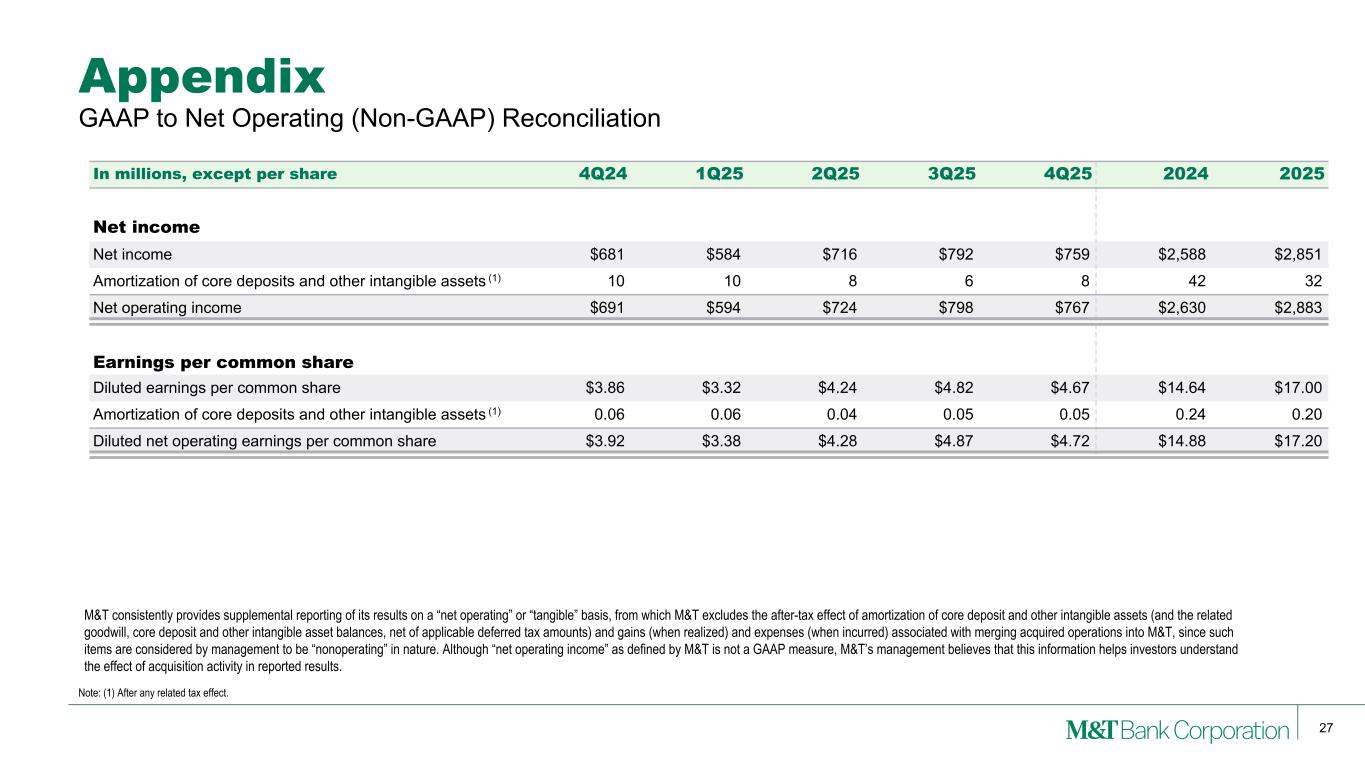
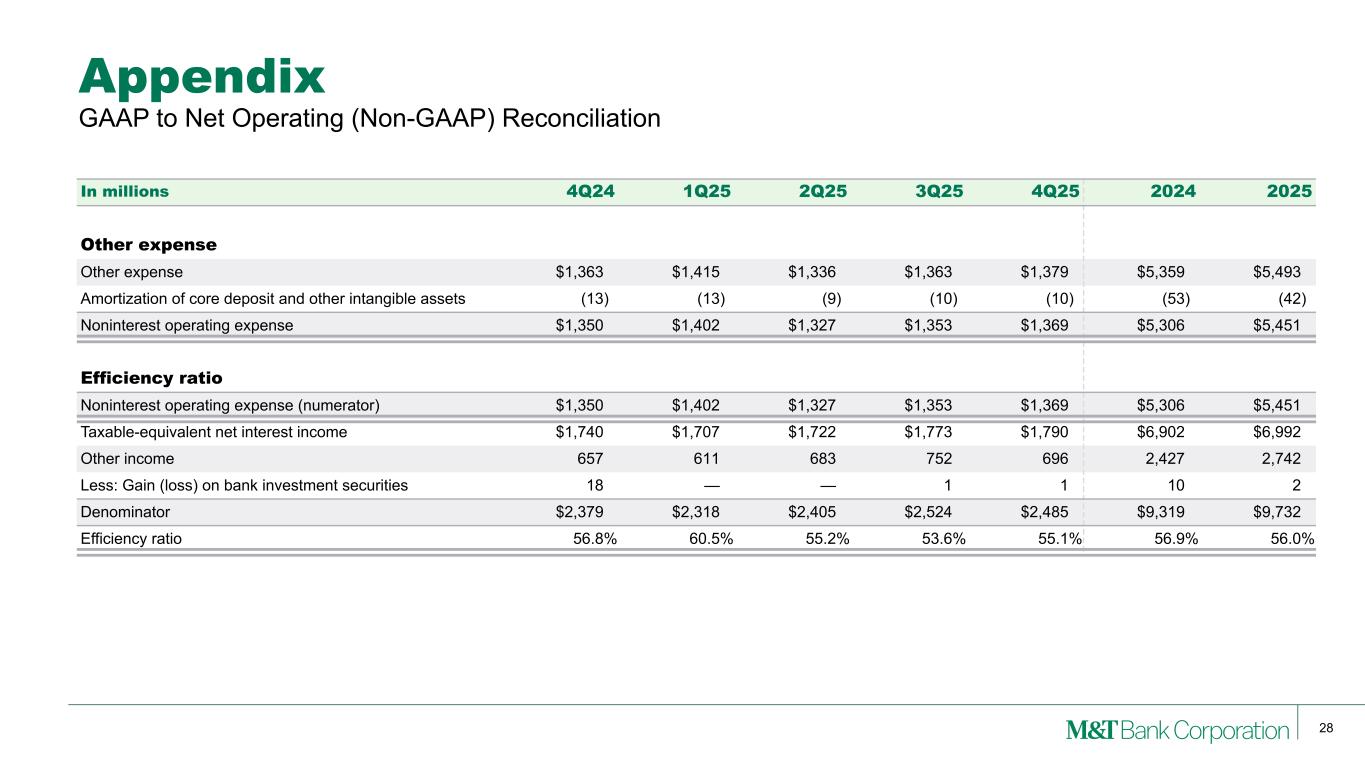
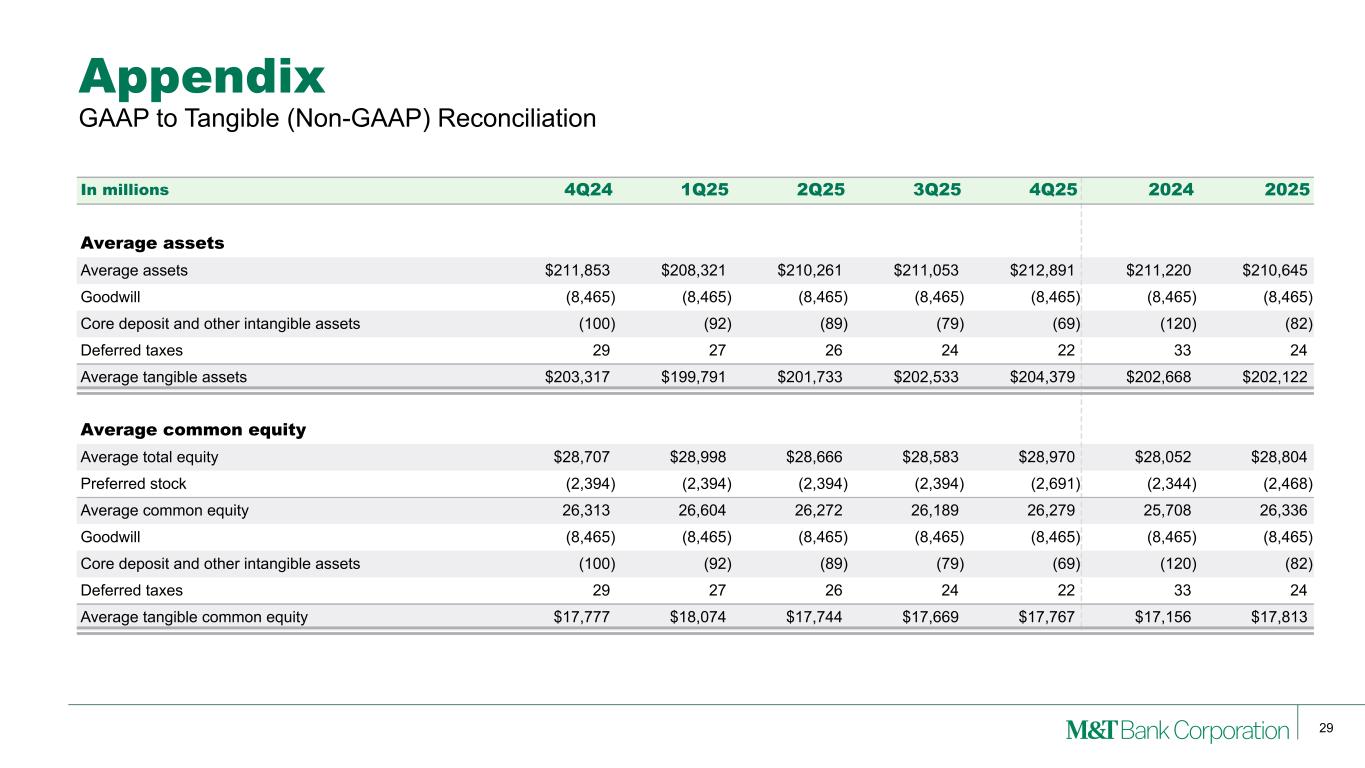
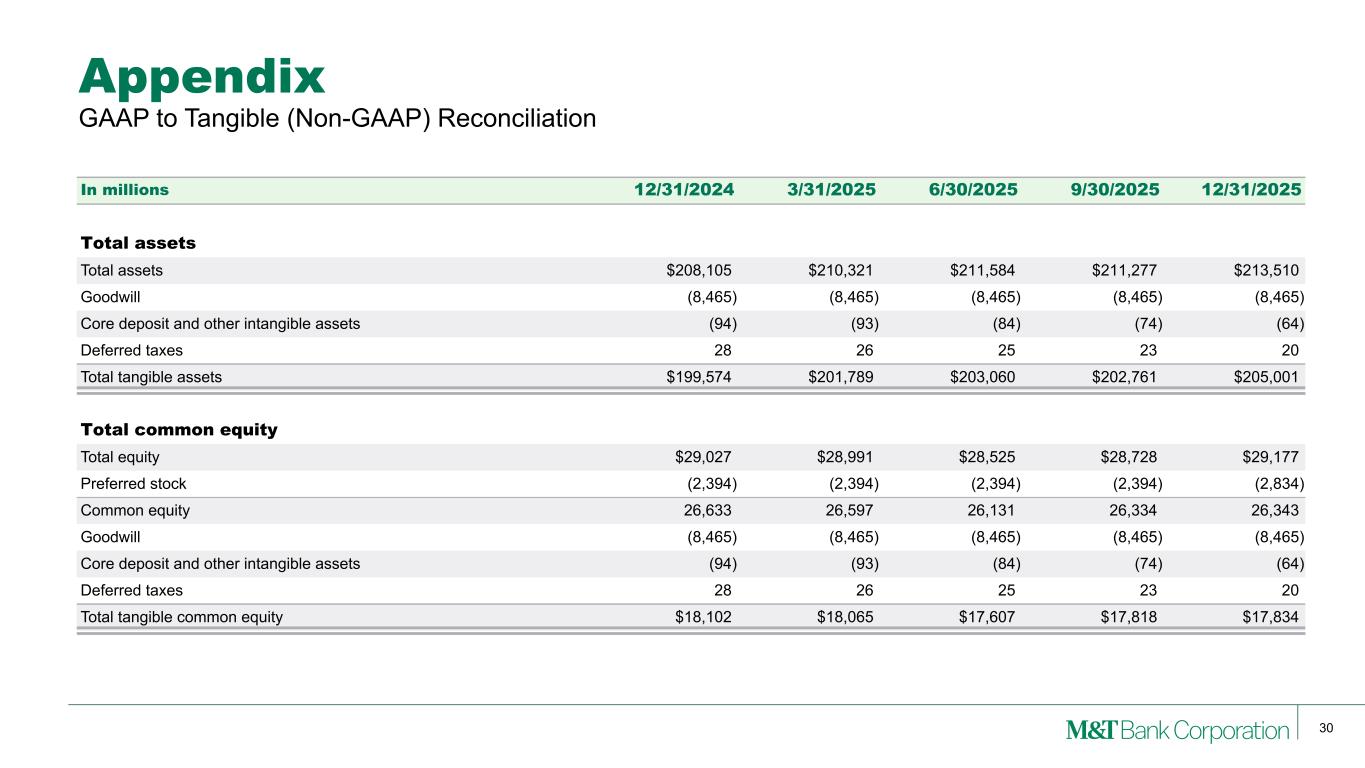
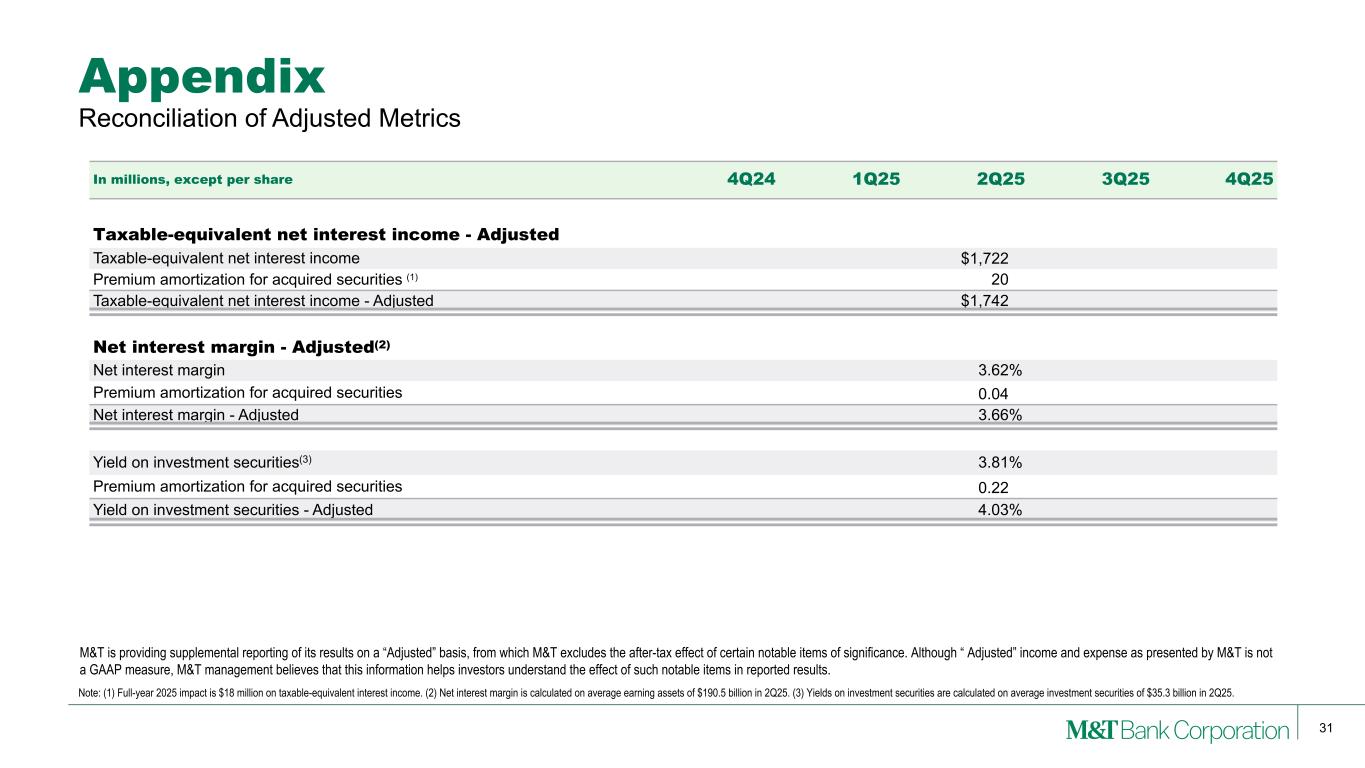
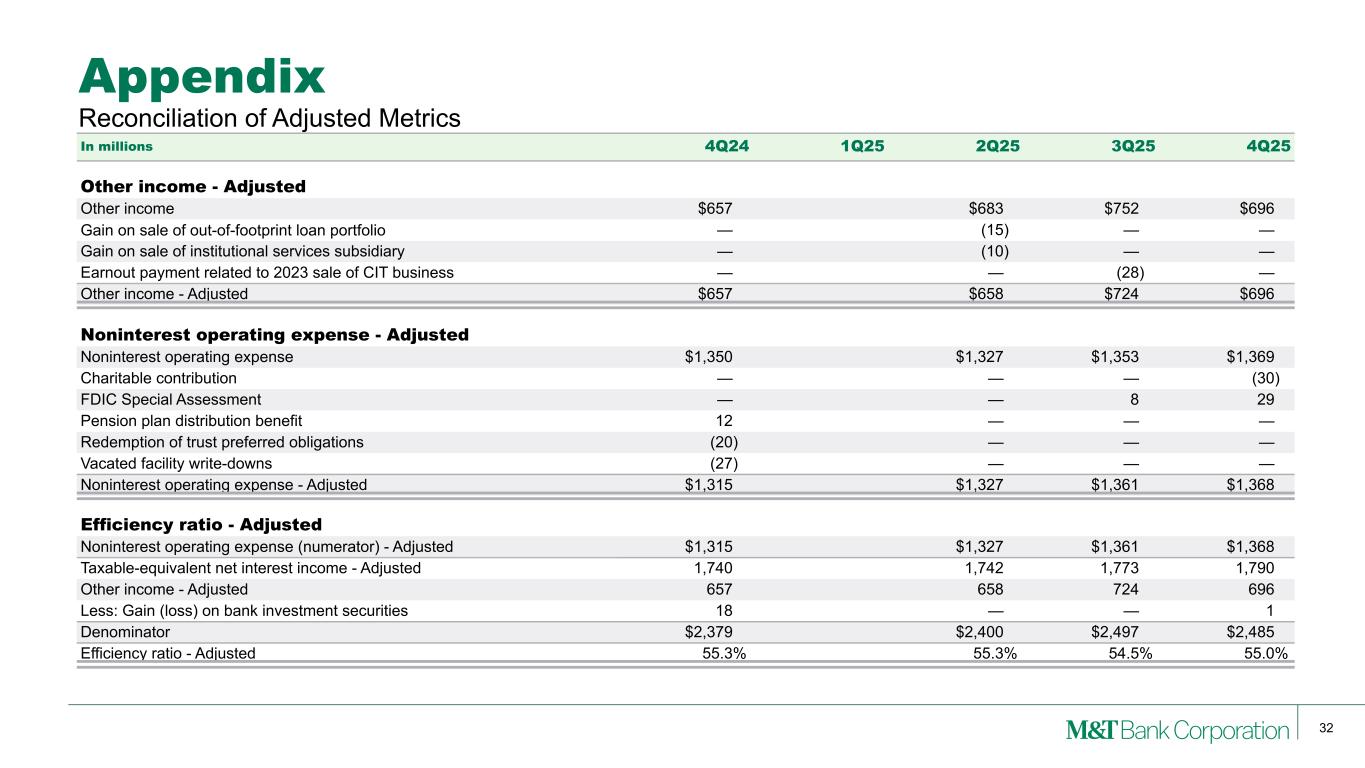
Thank you, Rajiv, and good morning, everyone. I'm excited to share our full year 2025 results. M&T has continued to deepen our presence in key markets, expand access in new communities, and build innovative offerings that empower our customers and businesses alike. In the last quarter alone, we delivered on our commitment to expand access to banking in Bridgeport, Connecticut's East End, opening our new full-service Honey Locust branch, the community's first new bank branch in decades. We partnered with the Baltimore Ravens and wide receiver Zay Flowers to launch our Financial Fitness Academy to give young people dynamic real-world tools to build financial confidence. And we launched our new Banking Made for Business suite of business banking solutions tailored to support small and mid-sized businesses throughout the growth of their life cycle. These efforts reflect our long-term commitment to creating economic opportunities and our purpose to make a difference in people's lives. Turning to slide four, we continue to garner recognition for our businesses and our people, people, including those who lead the engagement with you, our investors and analysts. Now, let's turn the slide 6 and 7. Before getting into the details of the fourth quarter, I want to pause and reflect on some of the highlights for 2025. The progress we made against our four 2025 priorities and related enterprise initiatives will allow us to grow and scale in the coming years. I look forward to executing against our updated priorities in 2026. Our focus on the fundamentals drove our continued success in 2025. In 2025, M&T realized consistent and continued growth while also remaining disciplined and return focused. We earned record net income of $2.85 billion and record EPS of $17 while also maintaining our top quartile return on tangible assets of over 1.4%. We increased our quarterly dividend by 11%, repurchased 9% of our outstanding shares, and grew tangible book value per share by 7%. We made great progress on improving our asset quality with nonaccruals decreasing 26% and the non-accrual percentage of total loans reaching 90 basis points, the lowest since We also reduced credit-sized commercial loans by 27% over the course of the year. We grew fee income by 13%, reaching a record of $2.7 billion, and we increased our fee mix as a percentage of revenue from 26% to over 28%. Expenses remain well controlled. The efficiency ratio improved from 56.9% to 56% while making significant enterprise investments that will allow M&T to thrive in the years to come. Turn to slide 8, which shows the results for the fourth quarter. The looted GAAP earnings per share were $4.67, down from $4.82 in the prior quarter. Net income was $759 million compared to $792 million in the linked quarter. M&T's fourth quarter results produced an ROA and ROCE of 1.41% and 10.87% respectively. The fourth quarter included two notable expense items, a $29 million reduction in FDIC expense related to the lower estimated special assessment adding $0.14 to EPS, and a $30 million charitable contribution which reduced EPS by $0.15. Slide 9 includes supplemental reporting of M&T's results on a net operating or tangible basis. Amity's net operating income was $767 million, compared to $798 million in the linked quarter. Deluded net operating earnings per share were $4.72, down from $4.87 in the prior quarter. Net operating income yielded an ROTA and an ROTCE of 1.49% and 16.24% for the recent Next, we'll look a little deeper into the underlying trends that generated our fourth quarter results. Please turn to slide 10. Taxable equivalent net interest income was $1.79 billion, an increase of $17 million, or 1%, from the linked quarter. The net interest margin was 3.69%, an increase of one basis point from the prior quarter. This improvement was driven by a positive four basis points from higher asset liability spread driven by continued fixed asset repricing and favorable funding mix. Positive 3 basis points from a reduction and negative impact of our interest rate swaps. Partially offset by a negative 6 basis points from the lower contribution of net free funds. Turning to slide 12 to talk about average loans. Average loans and leases increased $1.1 billion to $137.6 billion. Higher commercial, residential mortgage, and consumer loans were partially offset by a nominal decline in CRE balances. Commercial loans increased $0.5 billion to $62.2 billion, aided by growth in dealer commercial services and to a lesser extent REIT lending, business banking, and fund banking. CRD loans declined 1% to $24.1 billion, reflecting a slowing pace of decline in the portfolio with continued payoffs and paydowns and higher originations. Residential mortgage loans increased 2% to $24.8 billion. Consumer loans grew 1% to $26.5 billion, reflecting growth in recreational finance and HELOC. Loan yields decreased 14 basis points to 6 percent, reflecting lower rates on variable rate loans, partially offset by continued fixed rate loan repricing, including reduction in the negative impact on our interest rate swaps. Turning to slide 13, our liquidity remains strong. At the end of the fourth quarter, investment securities and cash held at the Fed totaled $53.7 billion, representing 25% of total assets. Average investment securities increased slightly to $36.7 billion. In the fourth quarter, we purchased a total of $0.9 billion in debt securities with an average yield of 4.9%. The yield on the investment securities increased four basis points to 4.17%, reflecting continued fixed-rate securities repricing benefit the duration of the investment portfolio at the end of the quarter was 3.4 years and the unrealized pre-tax gain on available for sale portfolio was 208 million or a 10 basis point CET1 benefit if included in regulatory capital while not subject to the LCR requirements M&T estimates that its LCR on December 31st was 109%, exceeding the regulatory minimum standards that would be applicable if we were a Category 3 institution. Turning to slide 14, average total loans rose $2.4 billion to $165.1 billion. Non-interest-bearing deposits increased $0.1 billion to $44.2 billion. Interest-bearing deposits increased $2.2 billion to $120.9 billion, driven by growth in commercial and business banking, partially offset by smaller declines in consumer and corporate trust deposits. Interest-bearing deposit costs decreased 19 basis points to 2.17%, aided by lower retail time deposit costs, and lower interest checking and savings costs across our business lines. Continuing on slide 15, non-interest income was $696 million compared to $752 million in the length quarter. Mortgage banking revenues were $155 million, up from $147 million in the third quarter. Residential mortgage banking revenues decreased $3 million to $105 million. Commercial mortgage banking increased $11 million to $50 million, driven by higher gains on the sale of commercial mortgage loans. Trust income increased $3 million to $184 million from higher institutional services fee income. Other revenues from operations decreased $67 million to $163 million, primarily from prior quarter items, including the $28 million distribution of an earn-out payment, a $20 million debut distribution, and a $12 million gain on the sale of equipment leases. Turning to slide 16, non-interest expenses for the quarter were $1.38 billion, an increase of $16 million from the prior quarter. However, salary and benefits decreased $24 million to $809 million from lower severance and other benefit-related expenses. Professional services increased $24 million to $105 million, reflecting higher legal and review costs. FDIC expense decreased $21 million, mostly related to the reduction in the estimated special assessment expense. Other costs of operations increased $15 million to $151 million from the $30 million contribution to the M&T Charitable Foundation, partially offset by the settlement gain from the pension annuity purchase and the prior quarter impairment of renewable energy tax credit investment. The efficiency ratio was 55.1% compared to 53.6% in the late quarter. Next let's turn to slide 17 for credit. Net charge-offs for the quarter totaled 185 million or 54 basis points, increasing from 42 basis points in the late quarter. Net charge-offs reflect the resolution of three previously identified credits totaling over $100 million. Nonaccrual loans decreased 17% to $1.3 billion. The nonaccrual ratio decreased 20 basis points to 90 basis points, driven largely by payoffs and charge-offs of the commercial NCOE nonaccrual loans. In the fourth quarter, we reported a provision for credit losses of $125 million compared to net charge-offs of $185 million. The allowance for loan losses as a percent of total loans decreased five basis points to 1.53% from improved asset quality and macroeconomic factors. Slide 18 has a summary of our NDFI portfolio. The NDFI portfolio increased $1.3 billion from the third quarter to $12.6 billion. The increase was driven by both net new loan growth and a recategorization of certain CNI loans as NDFI. Please turn to slide 19. The level of criticized loans was $7.3 billion compared to $7.8 billion at the end of September. The improvement from the link quarter was largely driven by a $429 million decline in CRE criticized balances. The CRE decline was broad based with lower criticized levels across nearly all property types. Given the consistent improvement in criticized, we will likely exclude the detailed criticized information on slides 20 and 21 in future earnings presentations, but the detail will continue to be available in our 10K and 10Q reporting. Starting to slide 22 for CAPA, M&T's CET 1 ratio was an estimate of 10.84%, a decline of 15 basis points in the third quarter. The lower CET ratio reflects a $507 million in share repurchases and an increase in risk-weighted assets, largely from higher end-of-period commercial loans, partially offset by continued strong capital generation. The AOCI impact on the CET1 ratio from AFS securities and pension-related components combined would be approximately a positive 13 basis points if included in regulatory capital. On slide 23, we have our employee directions for 2026, which is shaped by two priorities drawn from the work across the company. The The first is what we call operational excellence. We are building an enterprise that can operate at scale with greater consistency, efficiency, and transparency. Our focus is on creating intelligent, simplified operations that make it easier for customers to do business with us and easier for our teams to deliver. This includes strengthening our shared standards, streamlining processes, equipping colleagues with better tools and maturing capabilities such as automation and enterprise-wide control processes these steps help reduce risk improve performance and free our people to focus on the work that matters most the second priority is teaming for growth we are leaning into more unified enterprise wide approach to growth bringing together markets business lines and capabilities so clients experience us as one bank when we integrate the strengths across regions and when we match local insight with the scale of M&T and Wilmington Trust we unlock opportunities we cannot reach in silos this focus is about deepening relationships, more coordinated planning, and a shared approach to serving clients across the spectrum, from retail to commercial to wealth. Together these priorities help deliver us consistent value, position the bank for the long-term performance, and strengthen how we serve the communities that rely on us. Now turning to slide 24 for the outlook. First, let's begin with the economic backdrop. The economy continues to hold up well despite the ongoing concerns and uncertainty regarding tariffs and other policies. Private data sources reported decent spending growth in the holiday season and roughly a 4% through price increases have driven some of that growth. The economy bounced back in the third quarter to the strongest expansion in two years, though we are cautious of possible revisions and the slowdown once the fourth quarter data is collected. Businesses continue engaging in capex and equipment, while spending on new buildings remain in decline. Although overall economic activity was resilient, we remain attuned to the risk of the slowdown in coming quarters due to weakening labor market remain well positioned for a dynamic economic environment now turning to the outlook starting with net interest income we expect taxable equivalent net interest income to be 7.2 to 7.35 billion as net interest margin in the low 370s our outlook includes 50 basis points of rate cuts in 2026 though our sensitivity to the short end of the curve remains relatively neutral. That said, shifts in the shape of the curve could drive variability in the NII outlook. We expect four-year average loans to be $140 to $142 billion. Reflected in the priority discussed earlier, we have renewed focus on growing relationship customers in our community bank regions across all business lines. This outlook includes point-to-point growth in each of the four main loan portfolios, though we expect the full-year CRE balances to be lower than the 2025 full-year average. The full-year average deposits are expected to be $165 to $167 billion. Remain focused on growing customer deposits at a reasonable cost and expect broad-based growth across each of the business lines. Turning to fee income, we expect non-interest income to be $2.675 to $2.775 billion. We expect growth to be broad based across our fee income categories and business lines. Continuing with expenses, we expect total non-interest expense, including intangible amortization to be $5.5 to $5.6 billion. Our expense outlook includes continued investment in enterprise initiatives or also closely managing non-investment spend. This outlook includes our usual first quarter seasonal salary and benefit increase, which is estimated to be $110 million. We also included in the outlook is approximately $31 million in intangible amortization. As of January 1st, we elected to carry our own residential MSRs at fair value rather than the prior treatment of lower of cost or market. We have also begun hedging the changes in fair value of those MSRs. Along with this election, MSR amortization is no longer to be recognized as an expense and instead the impact of the MSR time decay and related hedging will be net with mortgage banking revenues. These changes are included in the fee and expense guidance ranges but has minimal impact on net income or PPNR. The MSR fair value election also adds $197 million in regulatory capital or an 8 basis point benefit to the CET1 ratio. regarding credit we expect charge-offs for the full year again to be near 40 basic points we expect taxable equivalent tax rate to be 24 to 25 and the half 24 and a half percent as it relates to capital we expect to operate with a CET one ratio of 10.25 to 10.5 percent in 2026 we always run a bank to generate the best returns for our shareholders of appropriate capital levels and return excess capital to shareholders. Given the current capital levels, continued strong capital generation, we have significant flexibility to continue to support lending, pursue opportunistic and organic growth, and return excess capital to shareholders. We will be opportunistic with share repurchases, but also monitoring the economic backdrop and asset quality trends. To conclude on slide 25, our results underscore our optimistic investment thesis. M&T has always been a purpose-driven organization with successful business model that benefits all stakeholders, including shareholders. We have a long track record of credit outperforming through all economic cycles while growing within the markets we serve. We remain focused in our shareholder returns and consistent dividend growth. And finally, we are a disciplined inquirer and prudent steward of shareholder capital. Last, I would like to thank Brian Clogg for his leadership and contribution to M&T's investor relations since he rejoined the bank in 2021. I look forward to his continued impact as he leads the bank's strategy function. I'd also like to welcome Razeev Runjan, a 20-year-plus M&T finance veteran who will be leading M&T's investor relations along with several other finance functions. As we close, I want to thank my M&T colleagues for serving our customers and communities. It was because of all of you that M&T continues to be the top-performing community bank. Now with that, let's open up the call to questions before which Bo will briefly review the instructions.
Operator
Certainly, Mr. Bible. Thank you very much. Ladies and gentlemen, at this time, if you do have any questions, again, please press star 1. If you find your question has been addressed, you may remove yourself from the queue by pressing star 2. Additionally, we do ask that you please lend yourself to one question and one follow-up. We'll go first this morning to Gerard Cassidy of RBC Capital.
Circling back to the capital ratios, obviously we're going to get the Basel III endgame proposal, hopefully sometime in the first quarter, as well as another stress test. Assuming those are favorable to you and your peers and brings down your required regulatory capital, CET1 ratio, how do you then approach where you are today with the CET1 ratio around 10.25 to 10.5? Is that something you guys would look to maybe bring down if your required number fell with what's coming with those two, the stress test and Basel III endgame?
Yeah, yeah. Thanks for the question, Gerard. I would just tell you that, you know, we are always looking at, you know, what position we have on our balance sheet and what's going on in the economy. You know, and we feel good at bringing it down to a 10-hour quarter right now, and potentially we could go lower. I don't view the regulatory capital limits of where they are now as a binding constraint right now. We can go a lot lower with where we are today, and we may actually improve that. But I think it really depends on what other things are going on in the marketplace. But could we go below 10% at some point? Possibly. And we will evaluate it and consider that with everything else we do as we move forward.
And you mentioned binding constraint. What would you point to as your buy-in constraint if you don't look at it as the CET-1 ratio?
We have other constituencies out there that have other limitations, including the rating agencies. And, you know, working with the rating agencies and getting them comfortable with how we're performing. I mean, when I look at our asset quality now, it's probably been the best it's been in the last couple decades. So we are in really strong condition. and our capital generation is probably the best we've been, so we're really strong there. So we have a lot of positives going forward. I loved the page when I started out with the statistics. We grew dividends 11%, we retired 9% as shareholders, and we grew tangible 7%. We had record income, net income, EPS, our ROTAs over 1.4, and our efficiency ratio went down from 56.9 to 56. I mean, we are performing at a very high level, and the risk that we're taking on our balance sheet is the right risk for us, and we feel really good with it, and we're getting great returns on that.
Great. And then just as a follow-up question regarding the loan growth, you gave us some clarity on where you are today and where you hope to be moving forward. On the commercial real estate side, I think you pointed out that you think it will start to inflect in the second quarter of 26, is there regions of the franchise or property types that you're anticipating will be the driver behind this inflection?
Yeah, I would say when you look at our teams and the CRA team run by Tim Gallagher and all the credit folks in Rich Barry's area, they've been working all 2025 to get us back on track. And if you look at the fourth quarter, our production levels were the strongest they've been for a very long time. December, we closed over 900 million loans in CRE. So we are performing on all cylinders. If you look at our three sectors, we have a large regional CRE portfolio. That is hitting all cylinders. We have a strong M&T RCC business. That is also hitting record returns and record outstanding. And we have an institutional CRE that is also performing very well. So our CRE businesses are really strong and productive, and we will have growth, you know, as we said, starting in the second quarter on an average basis. So we're going to have four of our loan portfolios. All of our four loan portfolios should have point-to-point loan growth for us in 2026, which would be really, really strong and gives us a lot of confidence with our earnings power.
Great. And, Brian, good luck in the enhanced role. Thank you, Daryl.
Operator
We'll go next now to Scott Fiefers with Piper Sandler.
Morning, guys. Thanks for taking the question. Daryl, actually just hoping you can expand upon just what you said about some of those non-CRE drivers. You know, as we look at, you know, CRE having come down the last couple of years, you've had pretty good momentum in some of those other main categories. Where do you see the best demand and sort of your willingness to lend in those kind of non-CRE categories as we look out into the course of the year?
So, Scott, when you look at where we've had growth for the last couple years, it's been in our C&I, but mainly in our specialty businesses, fund banking, mortgage warehouse, and other portfolios like corporate and institutional, and that will continue to grow and do really But when we talked about our new priorities that we have for 2026, one of them is called teaming for growth. Teaming for growth simply is basically bringing the whole bank together in the regions that we operate in. We operate in 27 regions where we have regional presidents. Regional presidents have the local knowledge to how we go to market in those markets. So we're trying to combine the regional presence, local knowledge, what's the scale, and how we deliver our products and services of a larger company together, and we're really focused on growing our regional regions this year and do that. We are planning to grow in that area, and I think we'll be very successful there.
Perfect. Okay, thank you. And then, you know, you all have been just, you know, quite transparent about sort of M&A aspirations, just curious to hear any updated thoughts you might have about how you're thinking about the landscape this year.
You know, M&A will come our way when it happens, Scott. You know, it's – we aren't aware of anybody and, you know, we want scale and density in the markets we serve. We serve – if we're in 12 states plus the District of Columbia, that's where we want to continue to get more density we are not aware of anybody wants to sell in those markets we will continue to reach out and have good relationships with her Renee knows all the appropriate people and all that and what happened when it happens we aren't going to force anything from from that perspective and you know it will happen at some point down the road but right now we have a lot of capital we wanted to deploy that capital to our markets to our customers first and foremost, continue to pay a great strong dividend, and we're going to buy back a ton of stock.
Perfect. Okay, great. Thank you very much. And, yeah, Brian, good luck in the new role as well.
Operator
Thank you. We'll go next now to Matt O'Connor with Deutsche Bank.
Good morning. I was hoping you could elaborate on the deposit environment. You know, obviously, you've been kind of running off some CDs and growing other deposits, but maybe some color in terms of net checking account growth, what you're seeing from a competitive landscape, and, you know, any changes in the brand strategy as you think about driving organic growth?
Yeah, deposits are really key. I, Matt, is that we want to have both oars in the water. So, you know, as we grow loans, we also want to grow our customers. We've done a good job the last couple years growing that and retiring a lot of non-core funding in the wholesale book. I think we will continue to do that as far as you know competitive wise you know all of our businesses having their plans to grow customer deposits and we're really focused in doing that so we complete and really manage both sides of the balance sheet very well as far as competition goes you know I would say the competition is the same as it's been for the last couple years not any worse or any easier what it is it's competitive we have different pricing strategies depending on the scale and density market share that we have in those markets and it seems to be successful our teams are really good at going to market but first and foremost you know we really focus on getting the operating
account the checking account you know whether you're in the consumer bank business banking commercial wealth that is really critical to us and from that other revenues and products and services come off of that and we've always done that we will continue to do that really focused on and growing that new checking accounts which is really important okay that's helpful and then just separately I know it's not a big category for you but the trading revenues has stepped up into the last two quarters to 18 to 19 million remind I mean, like, has there been a change in kind of the efforts there or any small deal that would be set this level higher versus just kind of quarter-to-quarter volatility?
Yeah, no, I appreciate you breaking that out. I mean, that specifically is our customer swap book, you know, but what you see there is really just a precursor of something that's greater overall. We have Hugh Giorgio, who runs our capital markets investment banking area. he's been actually adding resources he had a record year of revenue this past year he's going to have really strong year probably another record in 2026 we will actually once we get through our general ledger conversion shortly we're going to break out and actually show our capital markets and investment banking so you can see it together it's growing really nicely and our teams are executing really well and I think it's been a really strong business and will continue to grow well for our fee income.
Okay, thank you very much.
Operator
Thank you. We go next now to Manan Gasalia at Morgan Stanley.
Hey, good morning, Daryl.
When I look at the guide for 2026 for both fees and expenses relative to what you did in 2025 and even the full-view run rate, it feels like both growth rates are significantly slower. I know you called out the impact of the MSR – well, you called out that the MSR fair value and hedge will impact those two lines. Is that a big driver for both lines, and what is the core growth rate that you expect for both fees and expenses next year?
Yeah, I know. Thank you for the question. I would say that the accounting change is part of it. It's $75 million that would normally be an amortization expense is going to be now netted against revenues. So, that's basically just a shrink of both expenses and revenues by adopting this mark-to-market accounting on the residential MSR as one. When you look look at kind of our projections for fee income and you kind of back out the notable items, we should be about 4% in fee growth is kind of what we're looking there. And it's pretty broad based when you look at the fee growth. You know, we're growing our treasury management, that was up double digit year over year. We expect to be close to that again in 26. We're growing trust revenues, we're growing in the mortgage area, potentially our commercial Residential mortgages are off to a good start, so they're doing really well. Residential mortgages, if rates come down on the long run, will be able to do well there. We could have potential more subservicing growth there. And then what I just talked about in our capital markets and investment banking. So we have momentum on the fee side and feel good about hitting the full split number that we have. But if you look at put it all together, we are generating positive operating leverage in 26, you know, probably 150 basis points, plus or minus. So we feel good about that like we did this past year.
Got it. And then in the deck you spoke about operational excellence and teaming for growth and how the outcome of that should drive better revenues and profitability. You know, when you think about the environment, loan growth is improving. the income is growing, capital is normalizing. How do you think about the trajectory for ROTCE over the next 12 to 18 months? And, you know, what's a good, you know, end goal for ROTC as we look out, you know, in the medium term?
Yeah, thank you for the question. So, you know, we had a, you know, really strong finish in 2025, you know, with our returns approaching 16%. We think that will kind of continue in 2026, so be in the 16% range, and our goal is to get it to 17% by 2027. So I think we're on a great trajectory, and I think we can get there.
Got it. Thanks so much. And, Brian, we will miss you. All the very best. And, Rajiv, looking forward to working with you.
Operator
Thank you. We'll go next now to John Pancari of Evercore.
Thanks, Rajiv. I look forward to working with you. And, Brian, best of luck in your role. It's going to feel kind of weird not seeing you bouncing around at the conferences and cracking some jokes. I guess on the loan growth front, Darrell, I want to see – I know Scott asked you a question just a little bit on the other areas. Could you elaborate a little bit more on what you're seeing in underlying commercial, you know, CNI growth more specifically? Are you seeing – you mentioned CapEx in your prepared remarks. Are you seeing some drawdowns tied to CapEx? Are you seeing line utilization tied to that? If you could just give us a little bit more color on what's actually beginning to take shape and influencing your growth expectations.
In the fourth quarter, our middle market commercial actually had an increase in utilization so that was a positive so I think that was a something really good to see that it's been dormant for a while from that perspective I think net net overall we're seeing good growth it's competitive obviously in the in the commercial space but I feel that we're going to have you know good growth overall both in specialty and in our regions as we kind of launch with our new priorities from that perspective so I I think we're confident we're going to have good long growth I mean if you look at long growth you know for the whole company it's you know in total probably be in the three to five percent range you know and CNI will be kind of right in that same similar range but we got CRE still shrinking year over year but starting to grow point to point we got commercial So real estate, that's what I just talked about, and then real estate, consumer real estate and consumer growth also growing nicely. Consumer actually in the indirect space and HELOCs, you know, will approach high single So we have good overall broad-based growth in all.
Thanks, Darrell. And then separately, on the credit side, I know you indicated you, the charge-offs related this resolution of some of the previous identified credits, but your 90-day past views jumped about 30% in the quarter. Can you give us a little bit of color of what drove that and if that could influence non-performers and losses in coming quarters at all?
So on the consumer delinquencies, that's really just a result of more Gini-May repurchases going on the balance sheet and which is an attractive trade for us and we actually make more fee income doing that on the commercial side it was more administrative delays people basically miss payments in the first week or so if you just move from year-end go back you know forward seven days and we had 250 million more come in and payments and all that that wouldn't have been delinquent so I think there's nothing there to say in the delinquency per se I think we feel good about our credit quality and performance there. It's just kind of one administrative on the commercial side, and consumer is just on the Ginnie Mae growth side.
Got it. Thanks, Darrell. Very helpful.
Operator
We'll be next now to David Cevarrini of Jefferies.
Hi. Thanks for taking the question. I wanted to ask about your deposit beta on the next 50 basis points of cuts. What's your assumption there?
You know, we've been holding pretty good to the low 50s, David, so far. And, you know, we feel really good in the down 50 that you asked for, still staying in the low 50s. I think that's definitely doable. I think at some point, if you continue to go down more, we're going to start hating floors on the consumer portfolios, but definitely feel confident we can stay in the low 50s going down another 50 basis point.
And as you inflect higher on loan growth, do you expect increased competitiveness on the deposit cost front?
You know, our mindset first is to grow operating accounts. We're also, I believe, in like an always-on strategy where we always will offer competitive rates to our customers. We won't be the highest. We won't be the lowest, but we'll get our market share. I think that's what you're seeing come through from the business lines. We grew $2.2 billion this past quarter. It was in business banking and commercial. So I feel that we're pretty much hitting stride there and doing really well. So I feel that our deposit growth will stay intact with our loan growth. I don't think you're going to have any disconnect there.
Great. Thank you. And, Brian, thank you, and good luck in the new role.
Operator
We'll go next now to Erica Najarian with UBS.
Hi. Good morning. I just wanted to take a step back, Daryl, as we think about how longer-term shareholder should sort of frame the M&T investment case, you know, as we think about your capital position and as we think about, you know, some of these initiatives and, you know, sort of the, you know, the CRE optimization strategy, you know, as you think about 2026 and maybe the next three years, what is more important to this management team and board, optimizing ROTC or optimizing growth?
That sounds like a familiar question.
It was a good discussion.
It was a good discussion to be honest with you. We really have capital out there and we want to use it for our customers and make sure we get good returns on that. So we're pretty disciplined in the returns we're getting when we're putting loans on the books and getting those returns. But, you know, we also will distribute capital to our shareholders, and I think you're seeing us do that. I think we're probably the only large bank that basically retired 9% of their shares this past year. We're going to probably do amount close to that this next year, maybe a little bit lower because of the higher stock price, but we are giving back lots of capital to our investors and shareholders. So, I think we feel good, we're balancing that. We generate a lot of capital, we do a lot of good for this community, which is really important for us and our customers, we make them meet their financial needs. So, our company is, I think, doing well on all cylinders right now, and our two new priorities is tweaking us to get even better in the things that we do and how we execute, which is really exciting from the teaming for growth and operational excellence. We just try to keep notching it up and keep setting the standard as we kind of improve and get better.
Got it. And just a more localized question on the Net Interest Income Guide, Daryl, you know, you mentioned neutrality on the short end, you know, how much of those, you know, three components that you mentioned that would be telling of where you are in the range, how much is the shape of the curve important versus the growth trends? And additionally, thanks for giving us the average balances. I'm wondering, you know, if you could give us a sense of the size of your overall balance sheet in terms of earning asset growth that's embedded in that NII number.
Yeah, so I'll start with the shape of the curve. Obviously, the shape of the curve will have impact because we still are getting benefit from kind of our fixed-rate loans and our investment securities and sometimes our swap book and all that. So, if the curve flattens out, we will, you know, definitely have less NII. If it stays steeper, we'll have a little bit of a benefit there. It's really hard to hedge the yield curve, and it keeps moving back and forth. So, I don't recommend trying to do that on a regular basis, to be honest with you. But I feel pretty good, though, that we're pretty neutral on the short end, which is really good. Because, as you know, we're really asset sensitive without the hedges that we have right now. I mean, if we didn't hedge right now, if we stop hedging now and you go a year forward, we'd be much more asset sensitive just by what's rolling off. So we have to hedge to stay relatively neutral. Growth will be a good key component. It's going to be a good value add for us this year, having more growth consistently across all of our portfolios, being able to grow deposits and loans in sync is really And as far as the earning assets, it's growing about 3% if you look at it on a point-to-point-point basis.
Great. And welcome, Rajiv, and congratulations, Brian, on your new role. We'll always have Denver.
Operator
Thank you. We'll go next now to Chris McGrady at KDW. Your line is open, sir. You might be on mute.
Sorry about that. Earlier in your work there, you talked about checking account growth as a priority in terms of mixed shift within the deposit. Can you put a little meat on like checking account traction, you know, maybe accounts opened in 2025, Outlook for non-interest bearing, anything you could provide there would be You know, I'd probably start with my favorite business that I have is business banking.
When you look at business banking, we have three times more deposits than loans. You know, their go-to-market strategy is always to get the checking account first and foremost. In the consumer bank, you know, we definitely, you know, try to grow and we monitor those statistics every month to try to get into account growth from that perspective. And then commercial and wealth, you know, it's definitely important from that. You know, we are investing heavily in our treasury management products and services that are helping the growth in business banking as well as commercial. As far as specific numbers of account growth, I'll probably be able to give you that maybe at the next conference. I don't have that handy with me right now, Chris, but we'll share that information in our next investor deck for the first quarter.
That'd be great. And as my follow-up, I'm looking at slide 24 in the ranges that you've provided. If you take a step back, is there a piece of the P&L where you're, I guess, most optimistic within the ranges? You talked about loan growth by each category, point-to-point growing. But any kind of elaboration there would be great.
You know, we've had a lot of strong momentum in the fee area, you know, the last couple years. So we still have momentum there. So that would be one that I'd probably be most bullish on. You know, NII, I think we're going to do well in that space. You know, expenses, you know, we have a very disciplined company. One of the favorite things I like being part of M&T is once we set our plan and move forward, you know, people follow the plan and get the job done. So I have all the confidence that we'll get our operating leverage that we have and move forward. So I feel good about it. I mean, I feel more positive entering 26 than I have in the first couple years I've been here. I think we're moving together and really working together much better as a team. Rene, I think, has probably the strongest management team he's had, you know, under his tenure running the company, and we are certain to perform like that as well. So I feel really good about that.
Operator
All right, great. Thank you very much. Thank you. We'll go next now to Ken Ustin with Autonomous Research.
Hey, Donald, just two quick ones. On the deposit side, your growth allows you to remix a little bit on the wholesale borrowings. I'm just wondering how much more room you might have there, and do you believe we've seen the bottom here of the DDA balances?
So on the first question, we can probably still shrink, you know, whether it's broker or some of our funds or other areas, maybe a couple billion more. more so we can, you know, if we get cheaper core deposits and we can't deploy it in the lending side, we'll be able to shrink and still optimize there. Definitely want to continue to run as efficient, optimal balance sheet as possible. That's really important to us. Your second question, what was that again?
Just about the DDA balances, and do you think we've hit an absolute bottom, and do you expect any growth from here?
We think when we hit around 3% DDA should bottom out and start to actually grow so we aren't that far away from that if we hit those two or down 50 basis points we think at that point it should start to level off and start to grow again from that perspective is our opinion that and you know we're investing heavily in Treasury management services we have a great leader there that's doing a great job and you know and our businesses are really good going to market so we're watching with good products and services, and that will also benefit. But I think down about 50 more basis points, and I think you're going to start to see it bottom out and grow.
Okay. And one on the loan side, I haven't done the calc this morning, but, you know, as CRE bottoms, you just remind us where CRE is the percentage of your equity today. And as you start to grow it again, where would you be comfortable taking that back to? If, in fact, you know, you kind of, you know, the reduction ended up being any different than where you would, your comfort level would be.
Yeah, so we're at 124%. Our limit is, I think, 160%, so we have a ton of room to grow, and we'll grow serving our clients, getting the right returns on the growth that we're getting. So we really have a large amount of capacity to just be able to grow and add to that portfolio as needed. And I think the teams are excited, and Tim Gallagher, who runs that group, is really excited. He said, you know, he had all three businesses performing at top levels and had an unbelievable strong finish to the end of the year, and that's going to carry us really well. One of the things that I always watch for, you know, going into a new year is start point issues and all that. And when we put our plan together in the third quarter, you know, we didn't know if we'd have any start point problems or issues. And lo and behold, as the year or fourth quarter played out, all of our loan portfolios perform really well, and we have no start point problems. So we're starting where we thought we would be, and we aren't behind. So that gives us a lot of momentum to actually lift off and grow from that perspective.
Operator
We'll go next now to Stephen Chewbac of Wolf Research.
Hi, good morning, and thanks for taking my questions. Sure. I know. So I wanted to ask just on consumer deposit growth, just within the guidance that you offered up for 26, how you're thinking about the growth in consumer versus wholesale? I know we don't have the explicit disclosure within the supplement by the last quarter, year-on-year retail deposit growth. It was beginning to recover back towards that flat year-on-year level. As you continue to build density in some of these markets like New England and then Long Island. Are you nearing a sustainable inflection of retail deposits as we look after the coming year?
Yeah, we are really focused at growing our consumer deposits and believe that is kind of the real value that you have by hand for whether it's consumer, business banking, commercial wealth, all plan for their deposits to grow, both are operating in total deposits, which is really positive. We did shrink some of our time deposits this past year. That was intentional because we didn't have a use for the higher cost. We can get that back very easily by just going out and doing that. That was a conscious decision. But net-net overall, we feel good about the growth and what we can achieve in the consumer As far as commercial goes, they're a machine. They're really important. When we go and serve our clients, you know, it's not just loans, deposits, treasury management, other fee income services. They deliver and bring the whole bank to them and all that. So we're really good about getting the right wallet share on the commercial side.
Thanks for that, Caller. And for my follow-up, just on mortgage banking, revenues continue to grow at a healthy clip. I know that's primarily been driven by the extension of the subservicing business. Do you believe the tailwinds from 25 could persist into 26?
What's a reasonable expectation for growth within that subservicing business at the current So there's going to be a couple changes in 26 and subservicing. Early on, I think we're going to lose a smaller portfolio, but then we're going to get something back the next quarter and potentially even get more back in the second half of the year. So, Mike Drury, who is in charge of that business and many other businesses out there, you know, feels really good about his mortgage business, his subservicing. You know, we are really good subservicers in the hard-to-service, so the FHA stuff is kind of our sweet spot that we do, and, you know, people come to us to have us service those loans, and that's a niche that we have, and we feel really good about it. So, you know, net-net, you know, might bounce around a little bit throughout the year, but I think we're going to finish the year pretty strong overall in that space.
Very helpful caller. Thanks for taking my questions.
Operator
And we'll go next now to Ibrahim Poonawalla of Bank of America.
Hey, Ibrahim. Good morning, Darla. Just one question. As we think about the growing core deposits organically, as we think about the incremental balance sheet growth that's coming on, would you say that's dilutive to the net interest margin where it is today in around 370 and what is there a ton of upside like is there an upside scenario where this margin could be closer to 380 if you could sort of give us a framework around those to appreciate that yeah so yeah that's a good question you know when we you know if we look at the returns for the overall relationship we just don't look at one's relationship you know there are scenarios that where you know if we grow loans grow deposits
Maybe you put a little lower net interest margin on the books, but net net it still returns a good return on capital, and which is something I think we can do. I mean, I think our net interest margin is either first or second in the peer group. So we have room for it to go down if we need it to go down to be competitive. But right now, we're trying to continue to keep our mix there and grow the DDA in conjunction with interest-bearing deposits, as well as, you know, good, attractive spread loans and getting good fee income overall. So, it's really getting the whole balance there. So, but, you know, the guide that we have is what we're giving you is what we think is going to happen, you know, from what we're going to earn, and we'll keep you updated as that plays out. But right now, we feel really good about operating in the low 370s for 2026.
Operator
Thank you. Gentlemen, it appears we have no further questions this morning. Mr. Munjan, I'd like to turn things back to you, sir, for any closing comments.
Thank you. Again, thank you all for participating today. And as always, if any clarification is needed, please contact our Investor Relations Department at 716-842-5138. 5138. And I look forward to working with all of you.
Operator
Thank you, Mr. Ranjan. Thank you, Mr. Bible. Ladies and gentlemen, that will conclude today's M&T Bank fourth quarter and full year 2025 earnings conference call. Again, thanks so much for joining us, everyone. We wish you all a great afternoon. Goodbye.