Operator
Good day, and welcome to the Realty Income 4th Quarter 2025 Earnings Conference Call. All participants will be in a listen-only mode. Should you need assistance, please signal conference specialists by pressing the star key followed by zero. After today's presentation, there will be an opportunity to ask questions. To ask a question, you may press star then 1 on your touch-tone phone. And to withdraw your question, please press star then 2. Please note this event is being recorded. I would now like to turn the conference over to Ms. Lauren Flaming, Manager, Capital Markets, and Investor Relations. Please go ahead, ma'am.
Thank you for joining Realty Income's fourth quarter and full year 2025 Operating Results Conference Call. Discussing our results are Sumit Roy, President and Chief Executive Officer, Jonathan Pong, Chief Financial Officer and Treasurer, Neil Abraham, President, Realty Income International, and Mark Hagan, Chief Investment Officer. During this conference call, we will make statements that may be considered forward-looking statements under federal securities law. The company's actual future results may differ significantly from the matters discussed in any forward-looking statements. We will disclose in greater detail the factors that may cause such differences in the company's filing on Form 10-K. During the Q&A portion of the call, we will be observing a two-question limit. If you would like to ask additional questions, you may re-enter the queue. I will now turn the call over to our CEO, Sumit Roy.
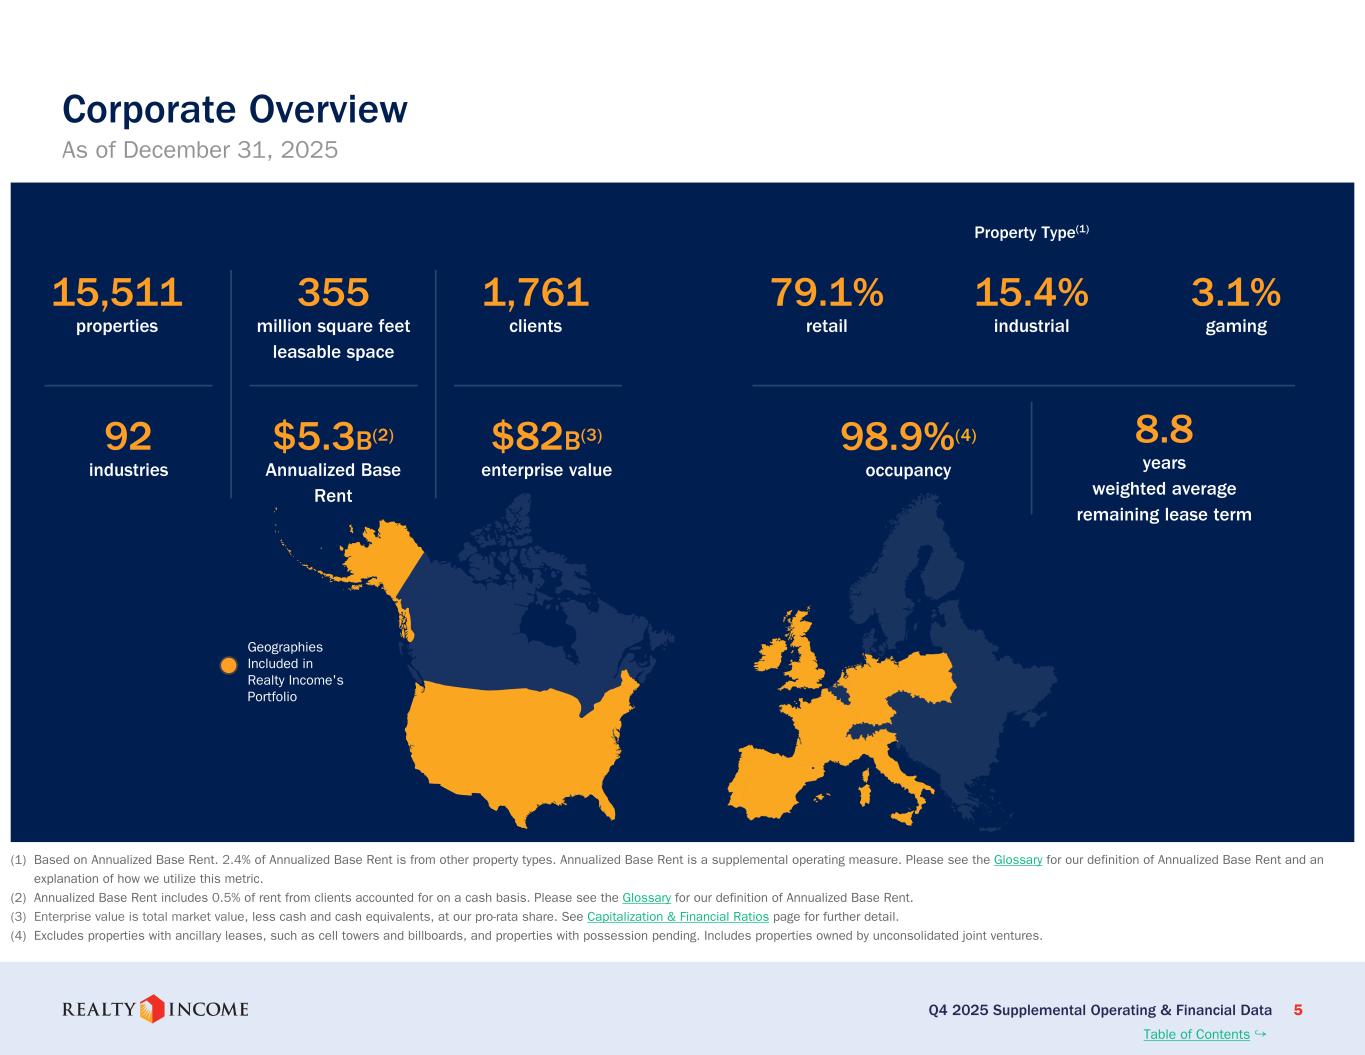
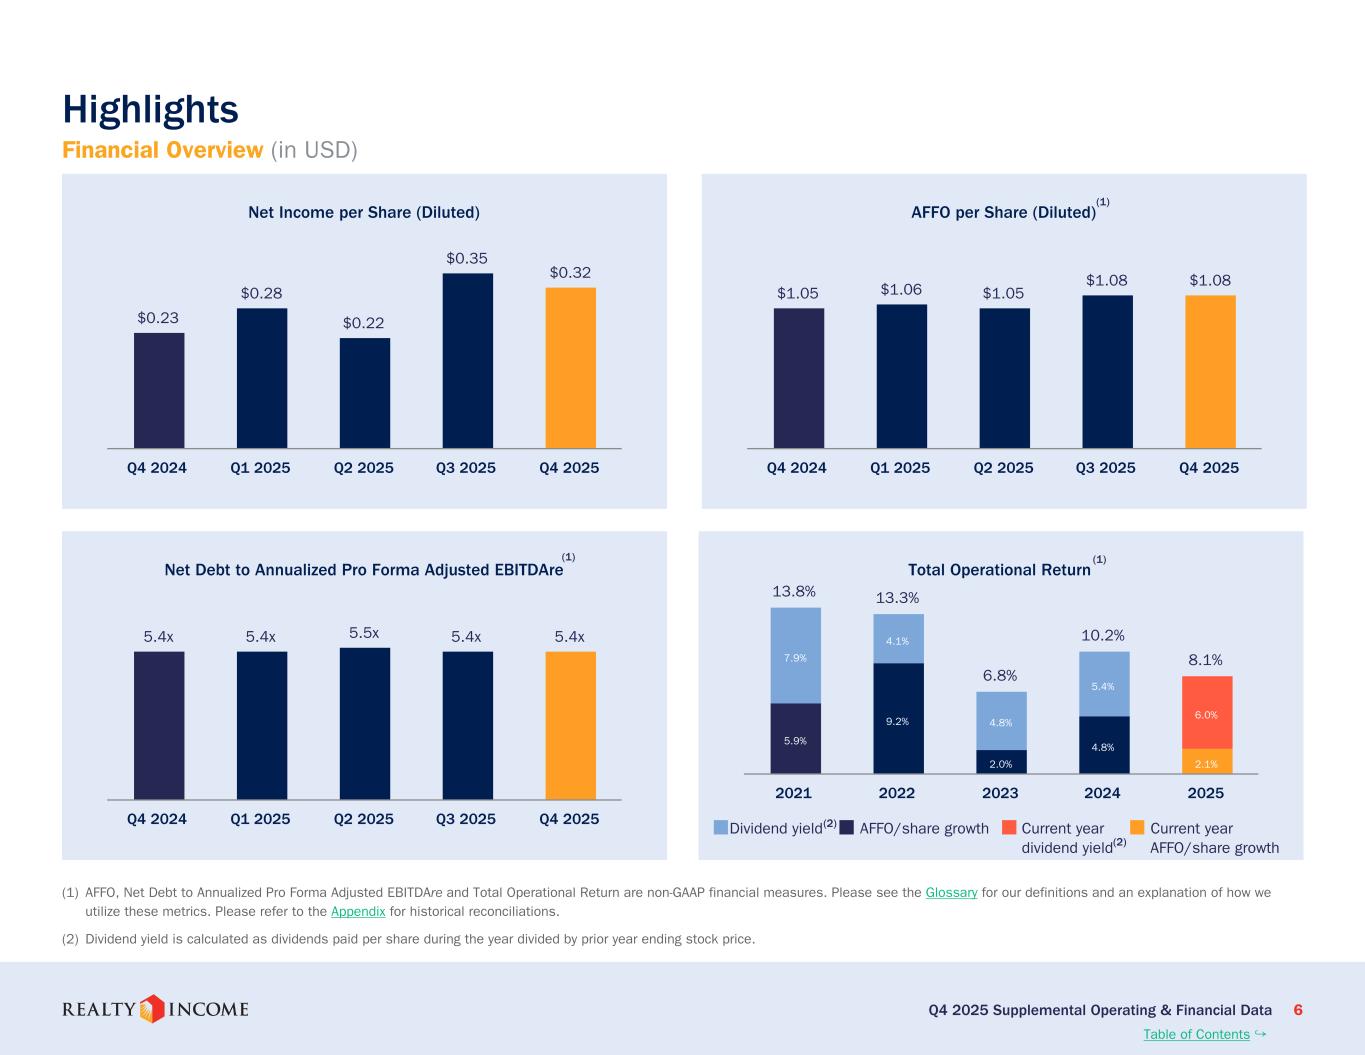
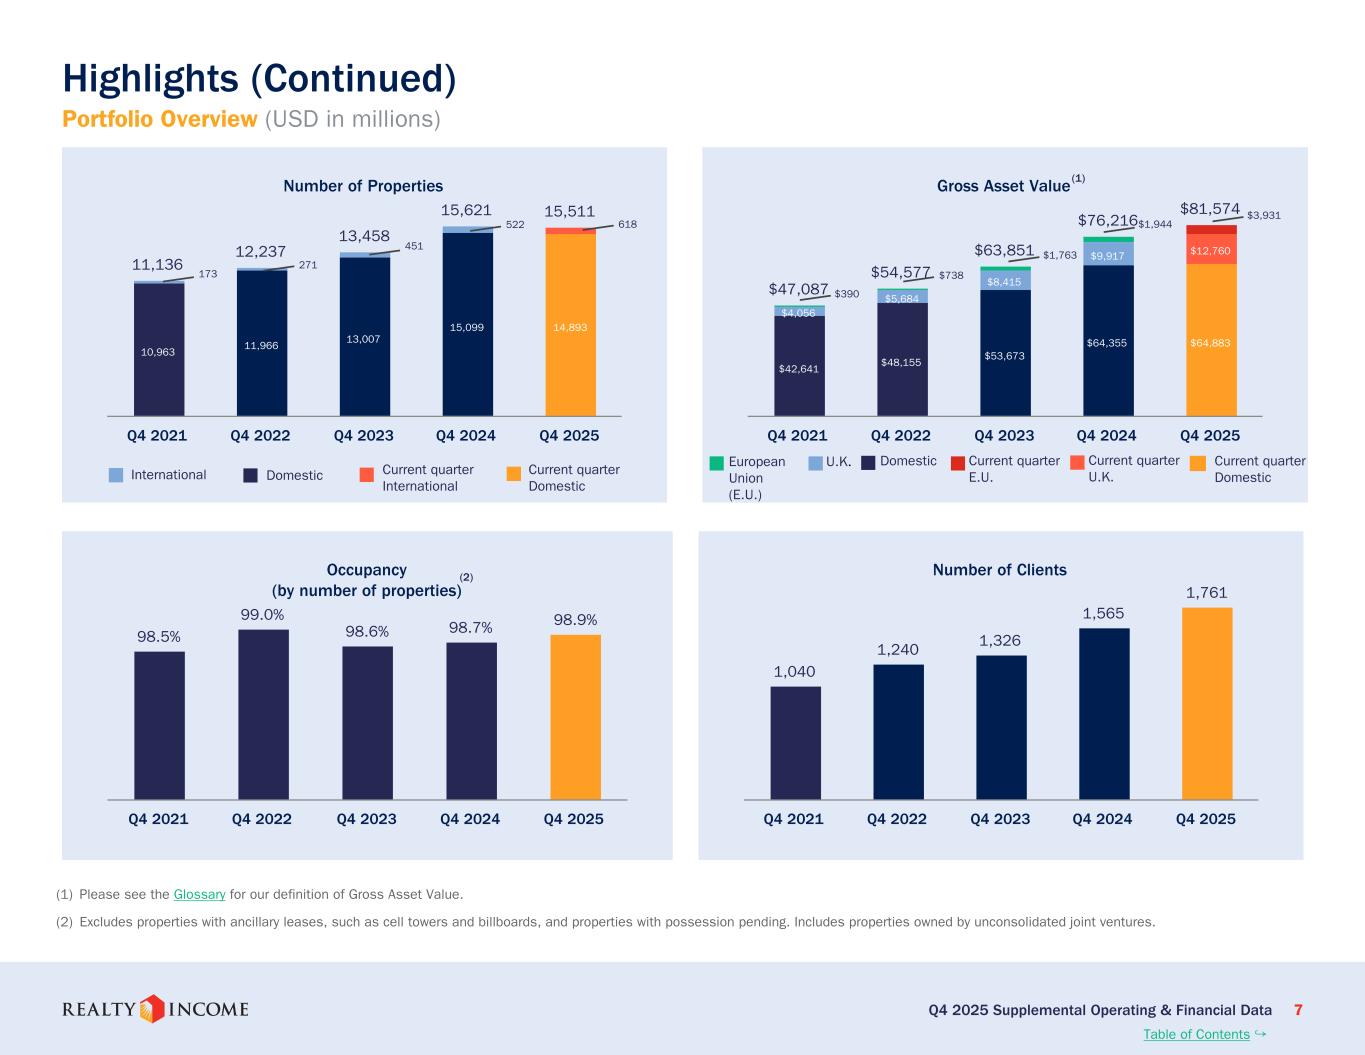
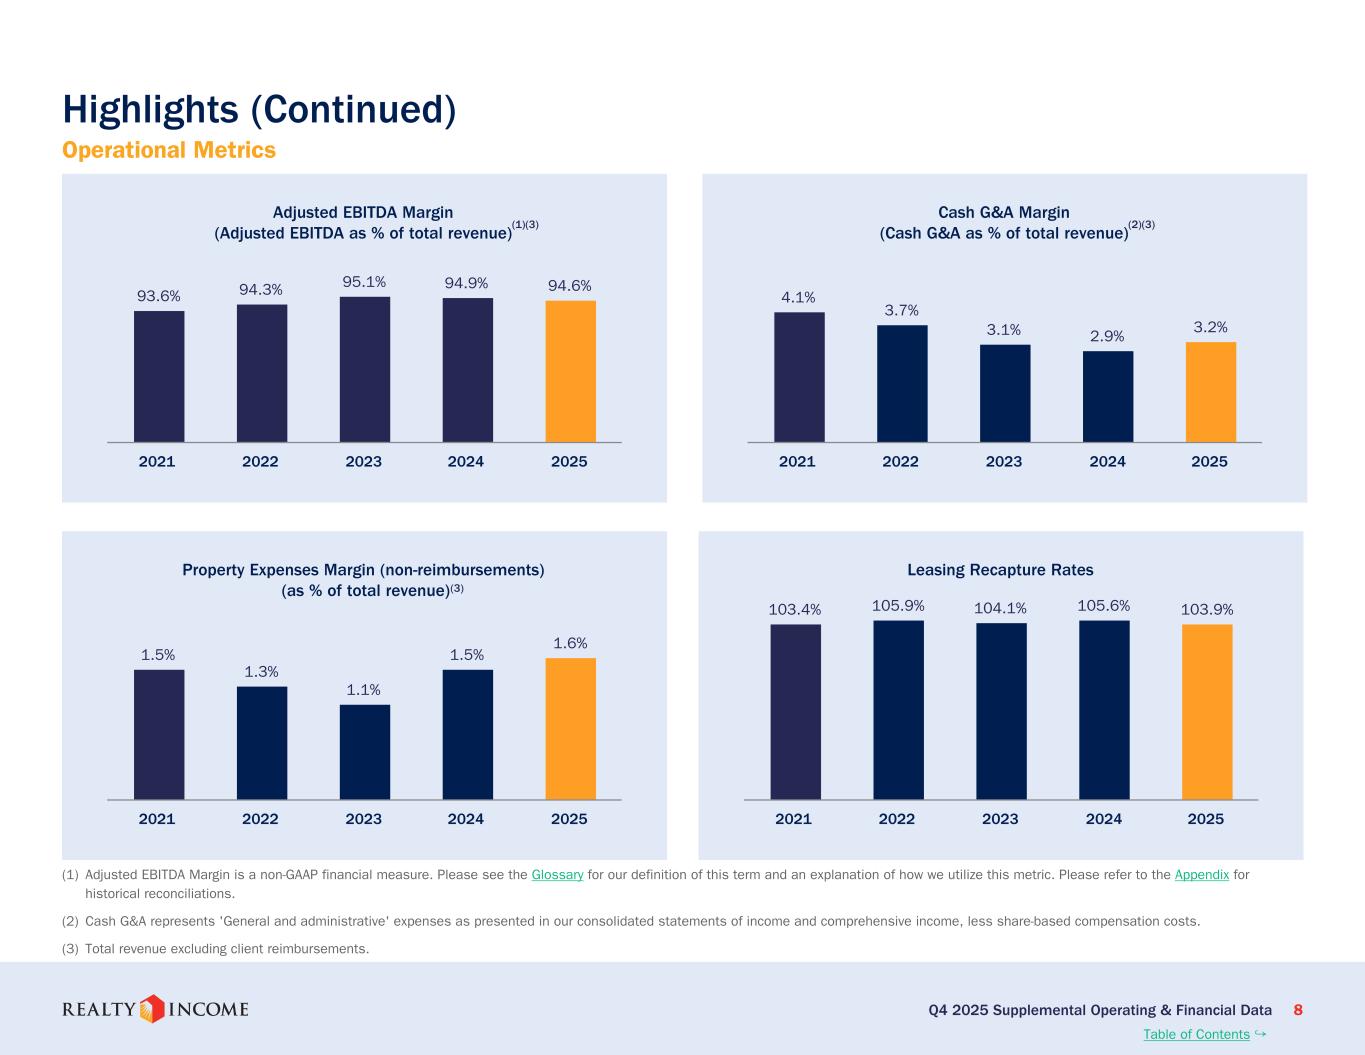
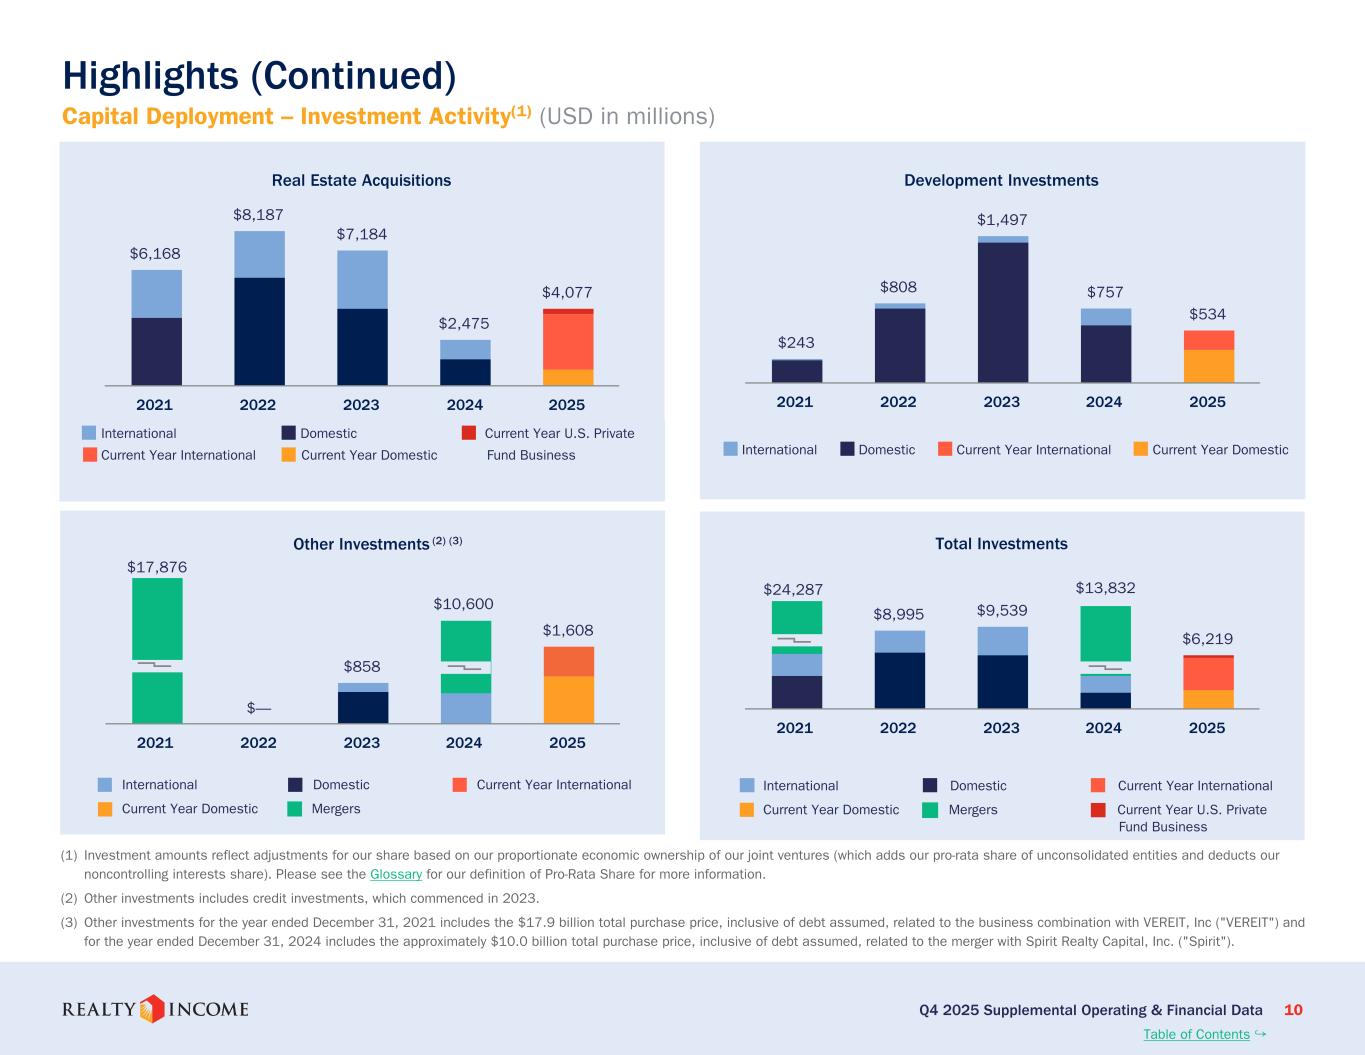
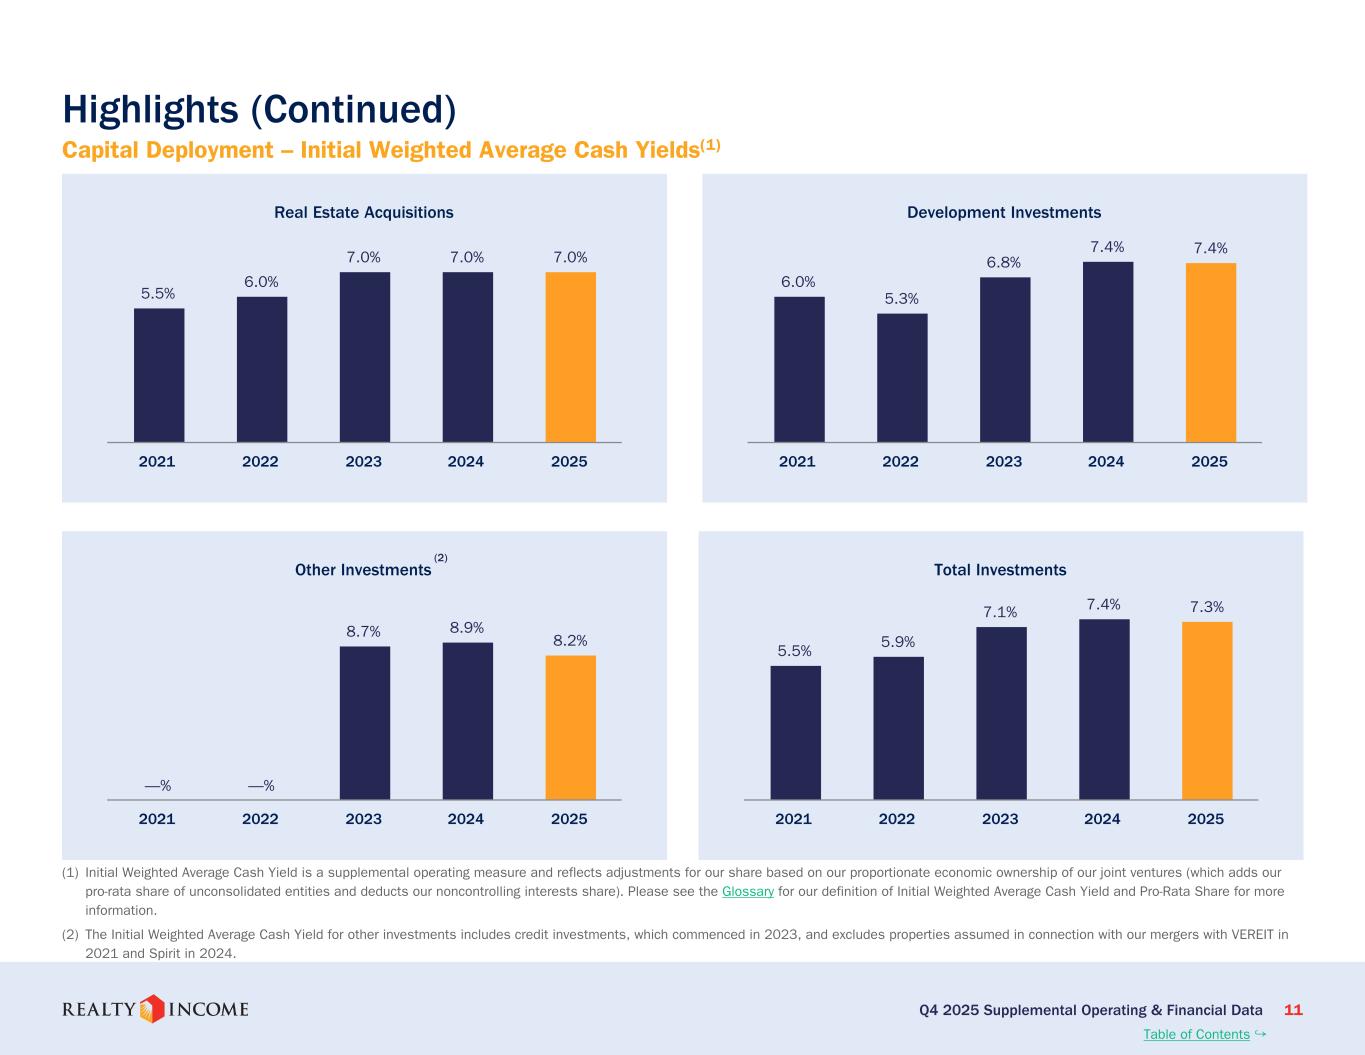
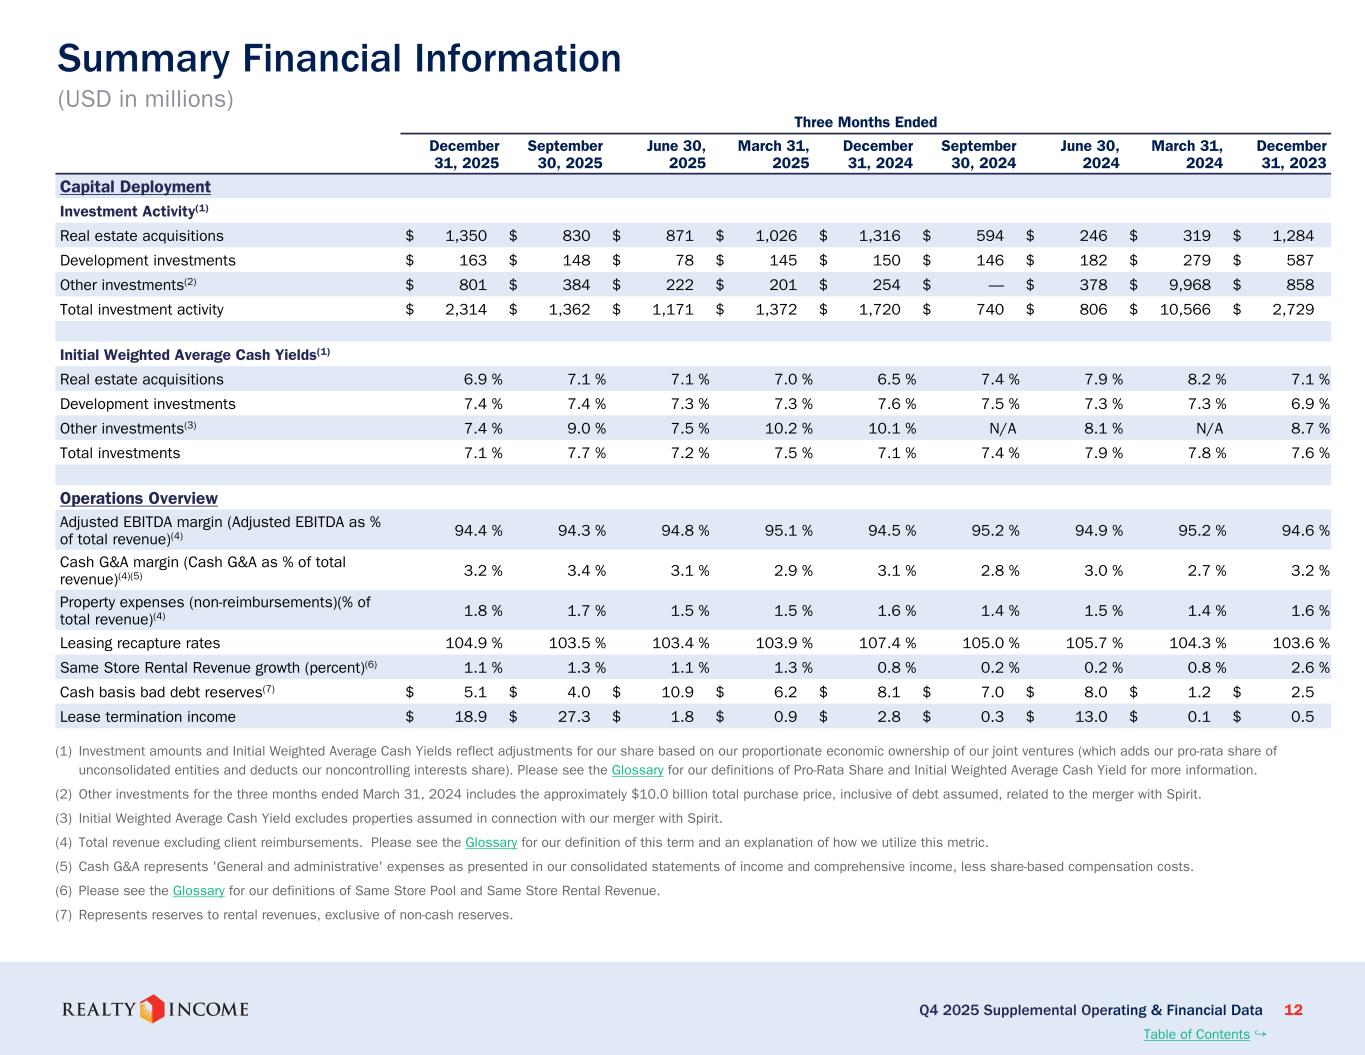
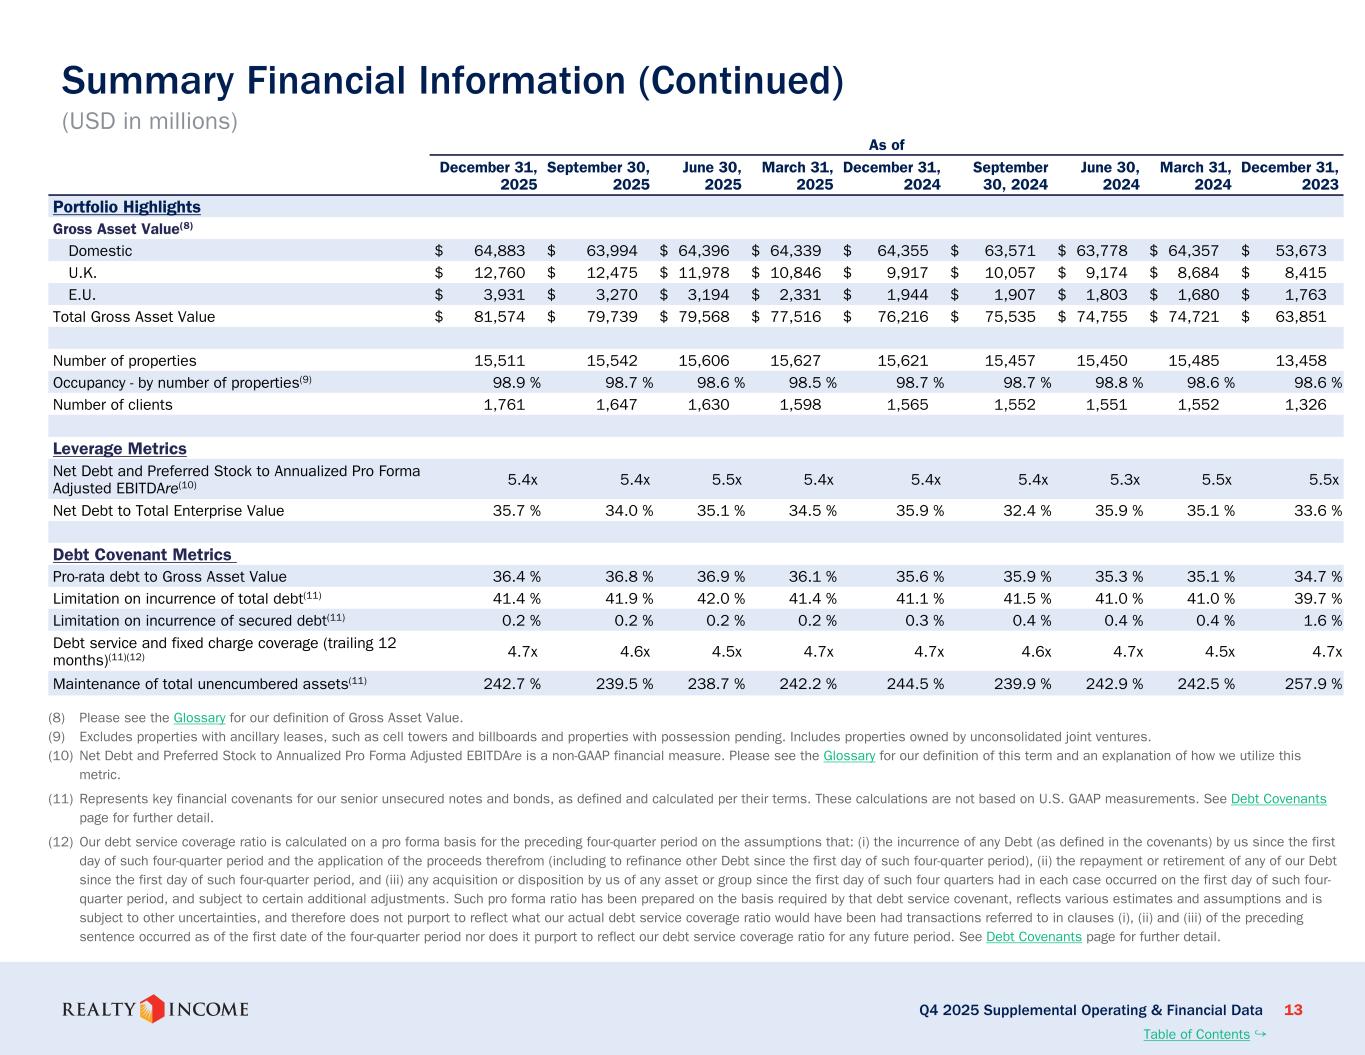
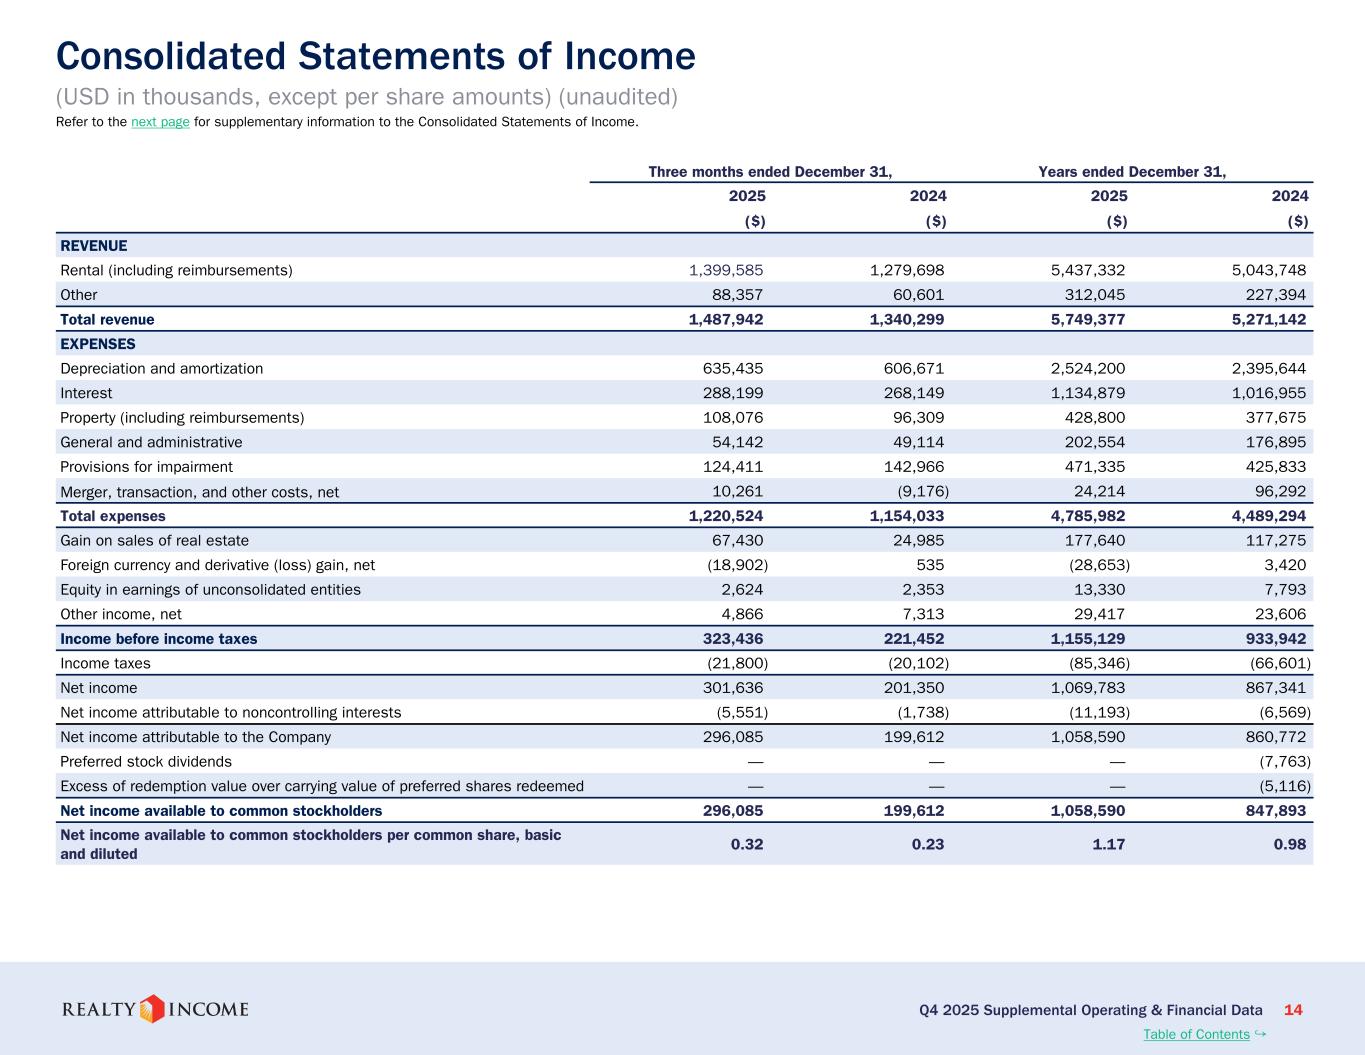
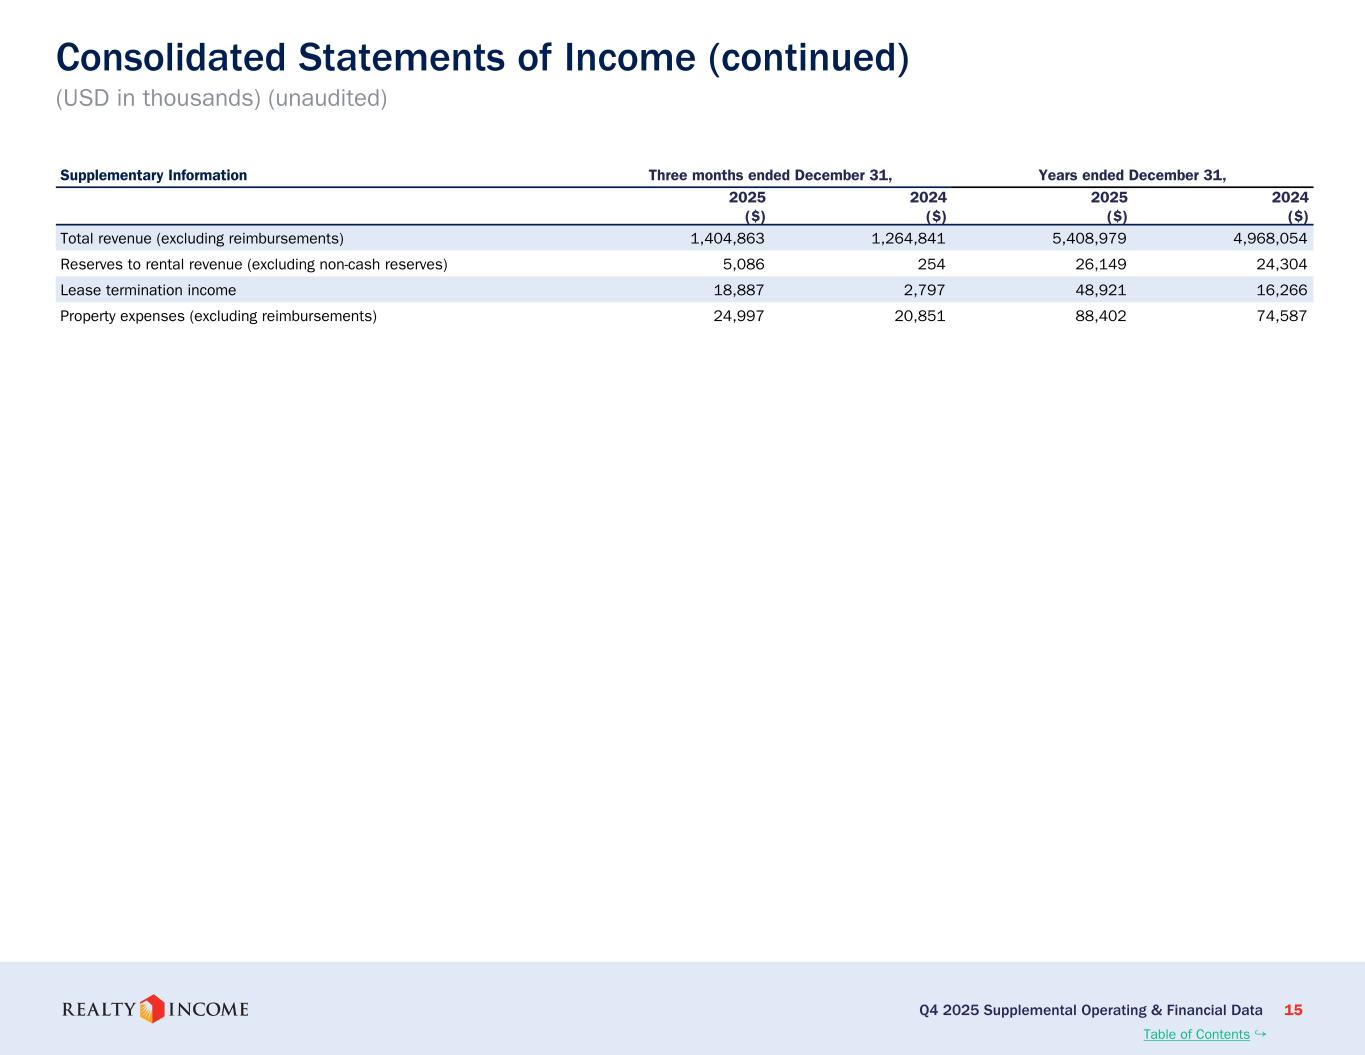
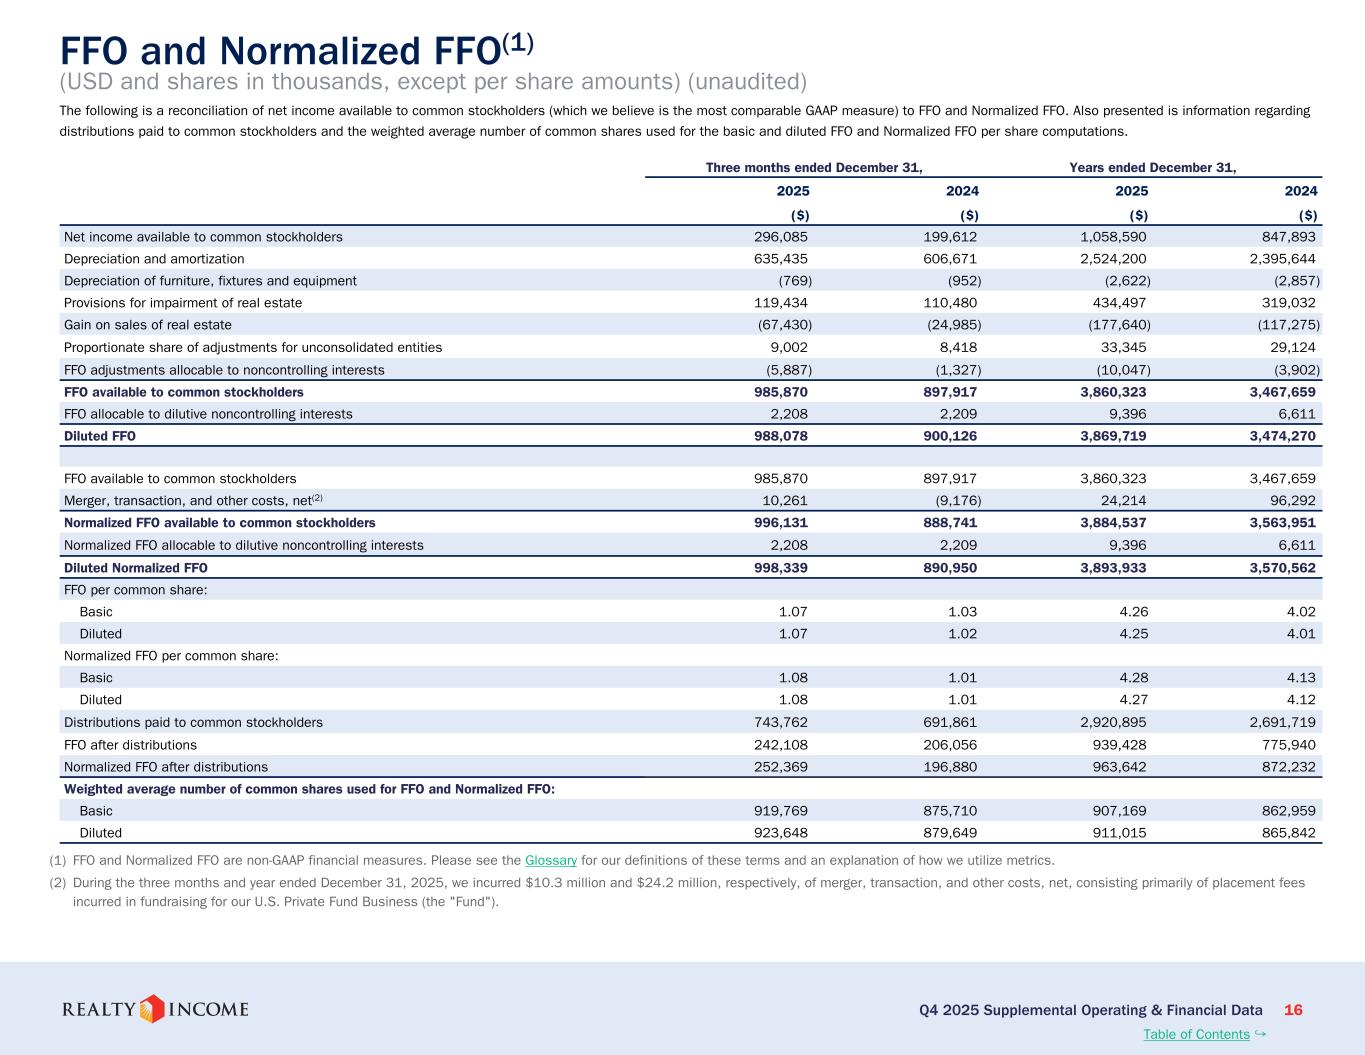
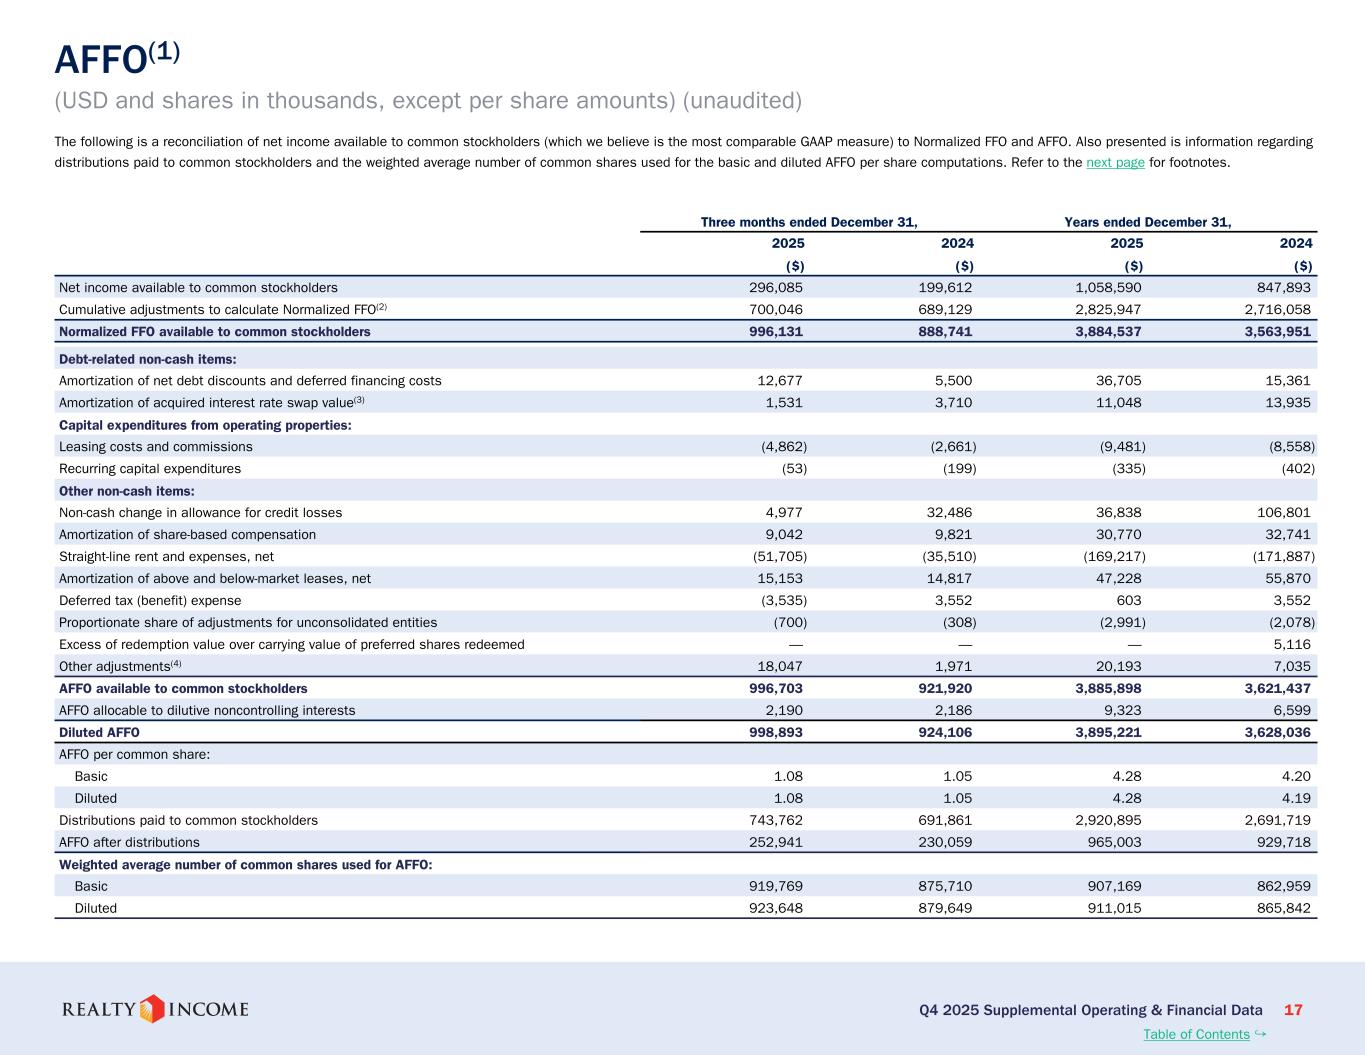
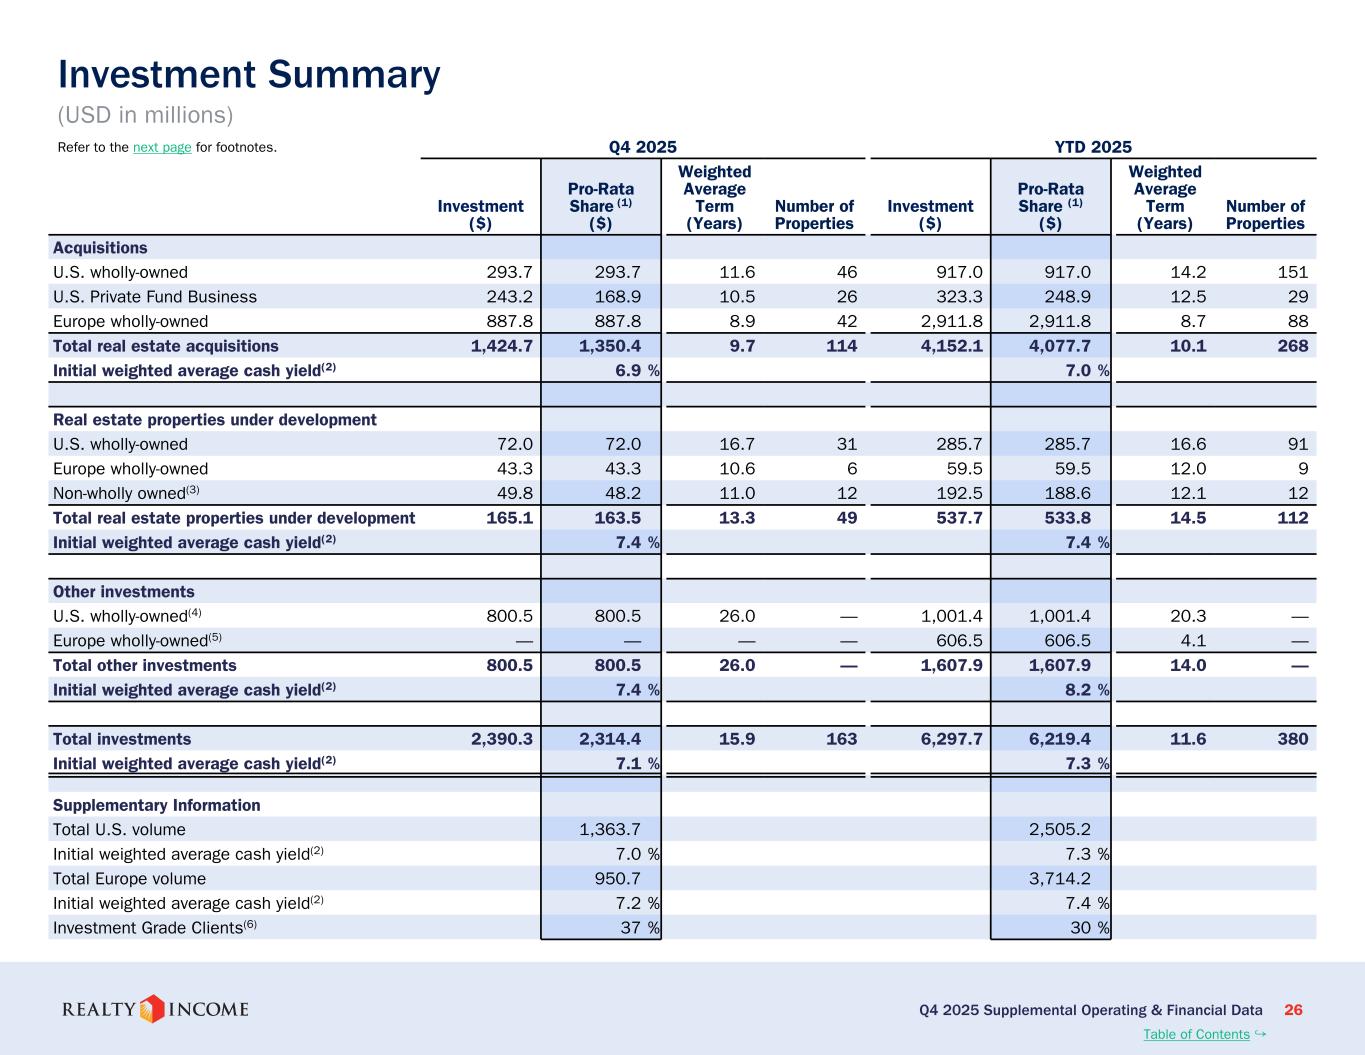
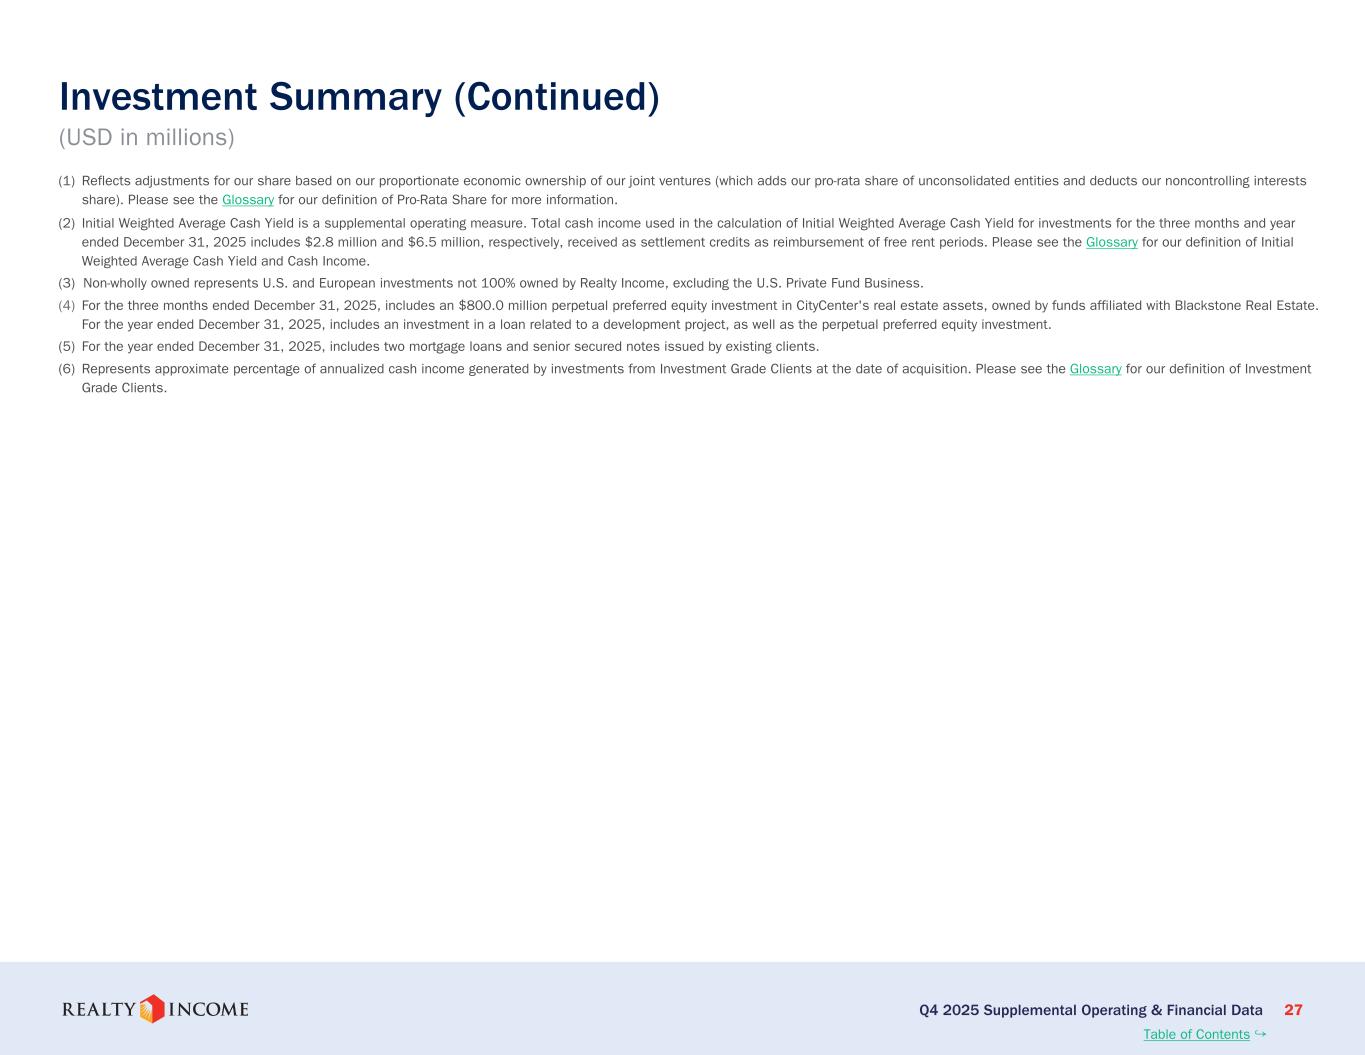
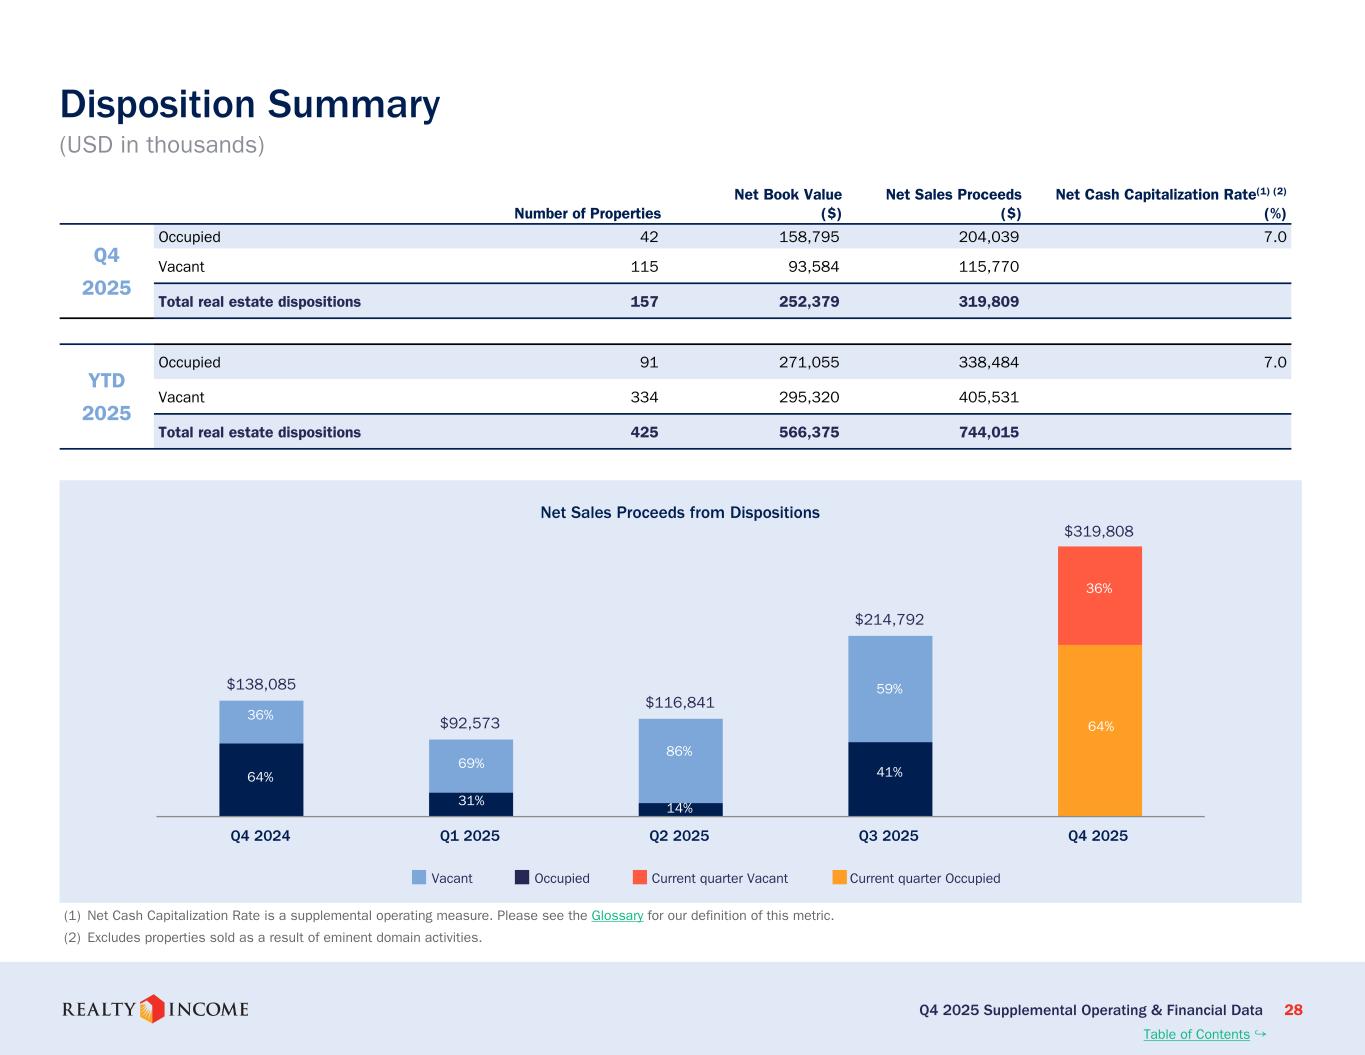
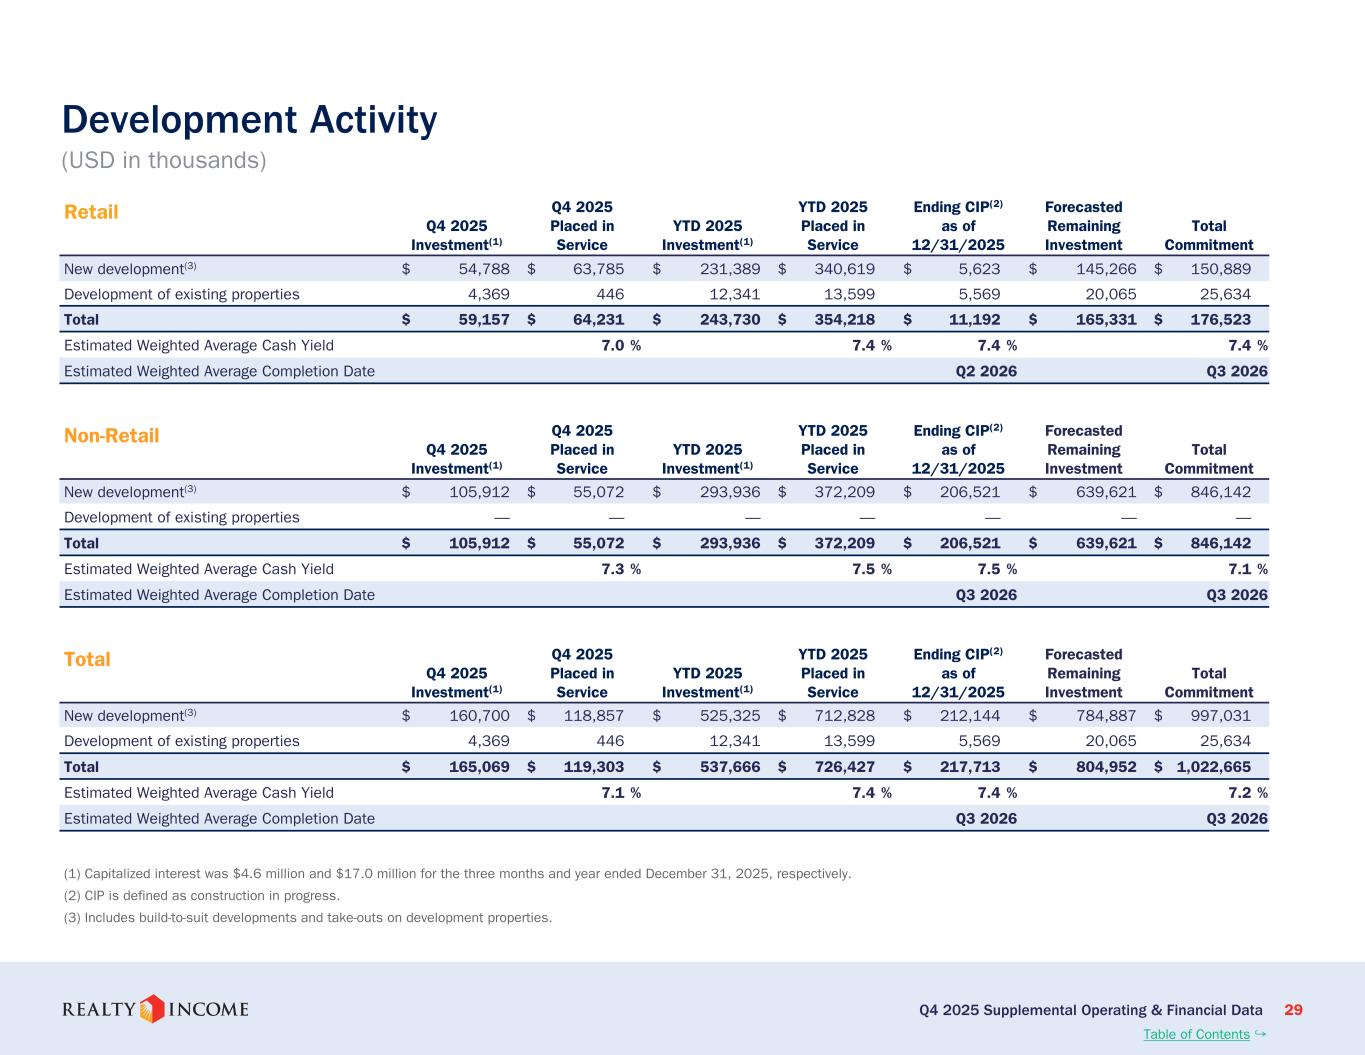
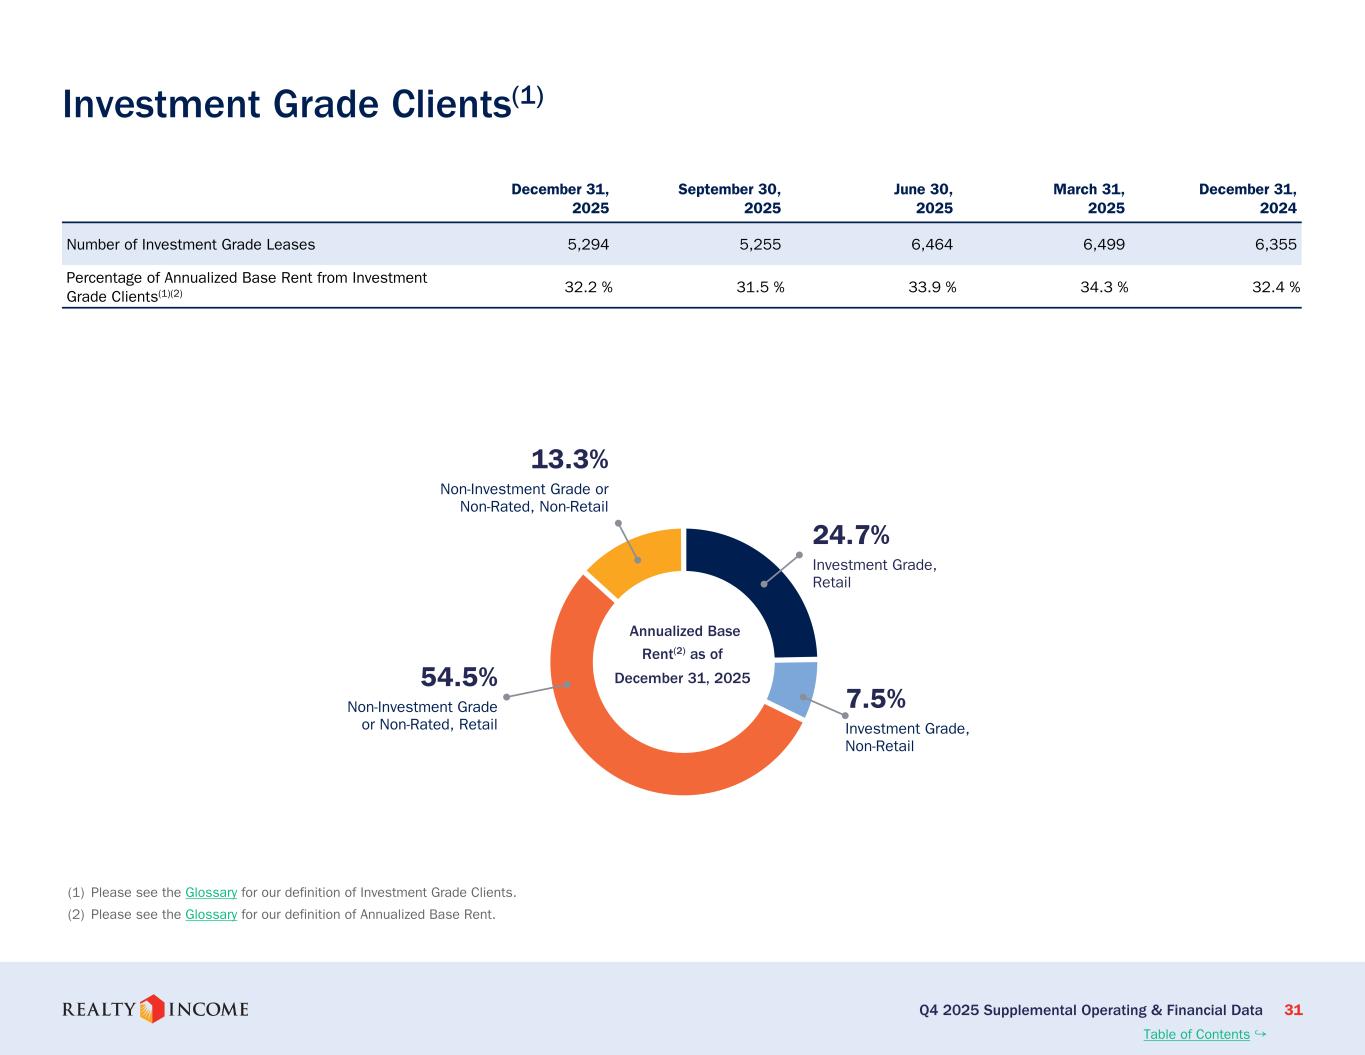
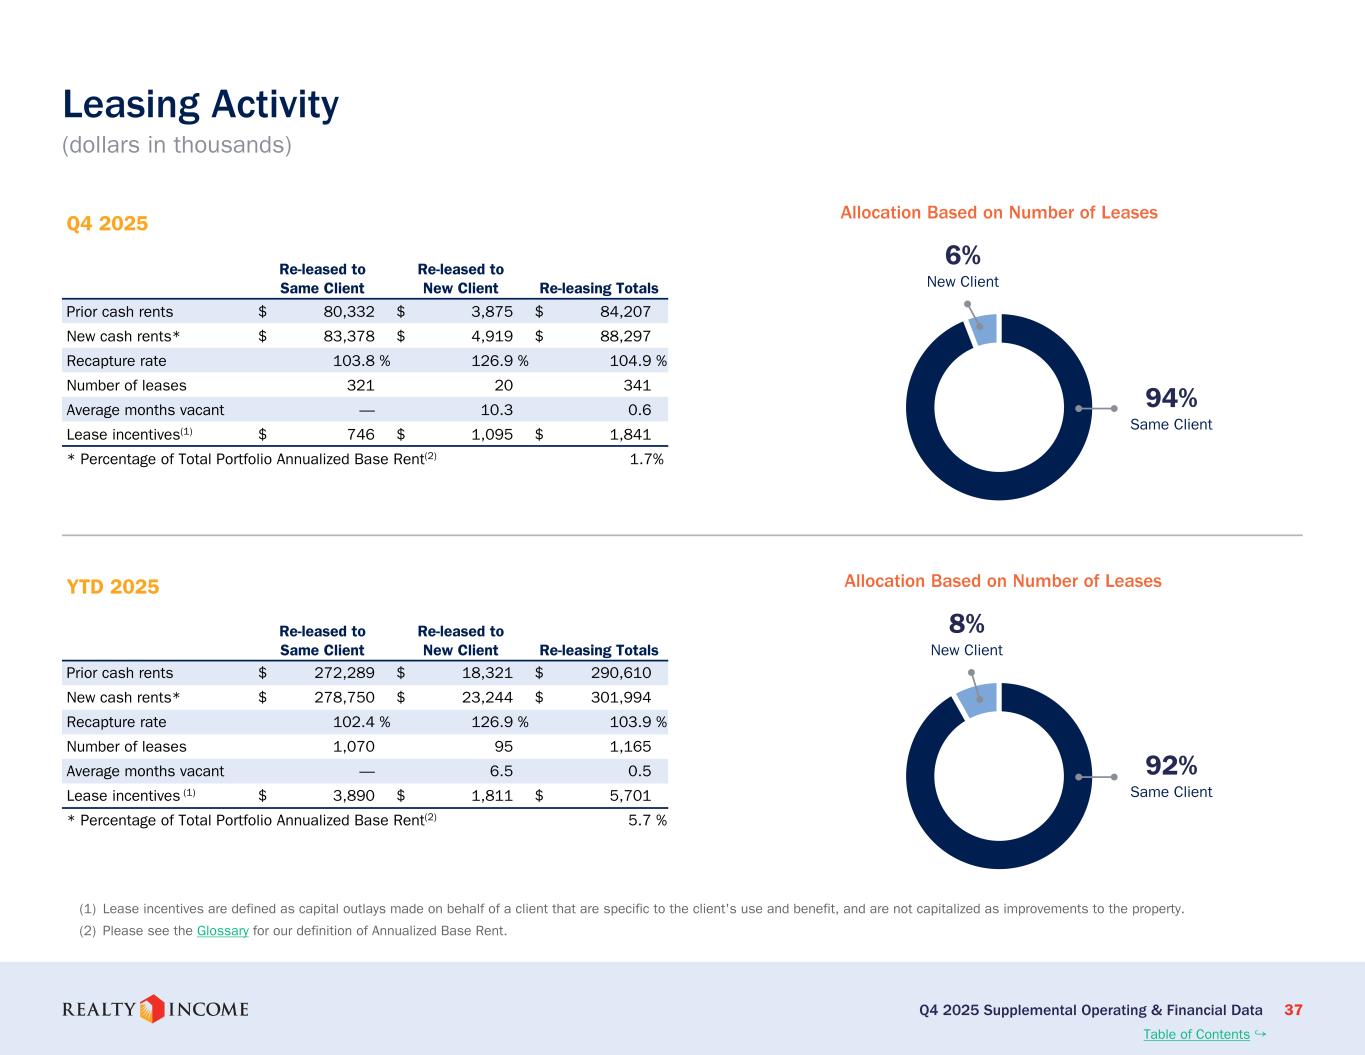
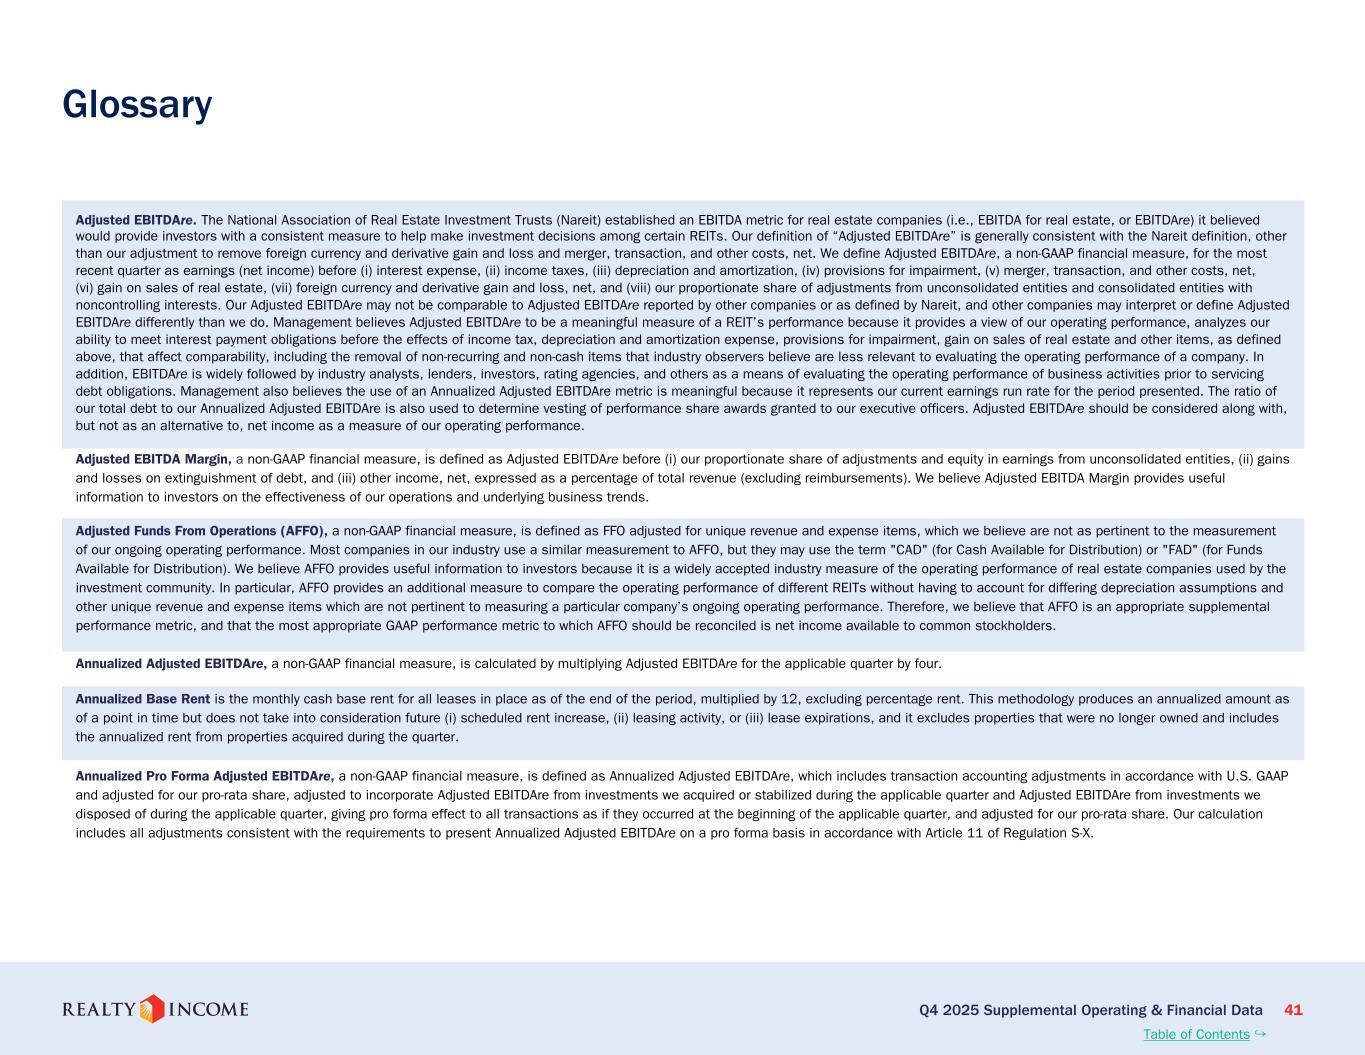
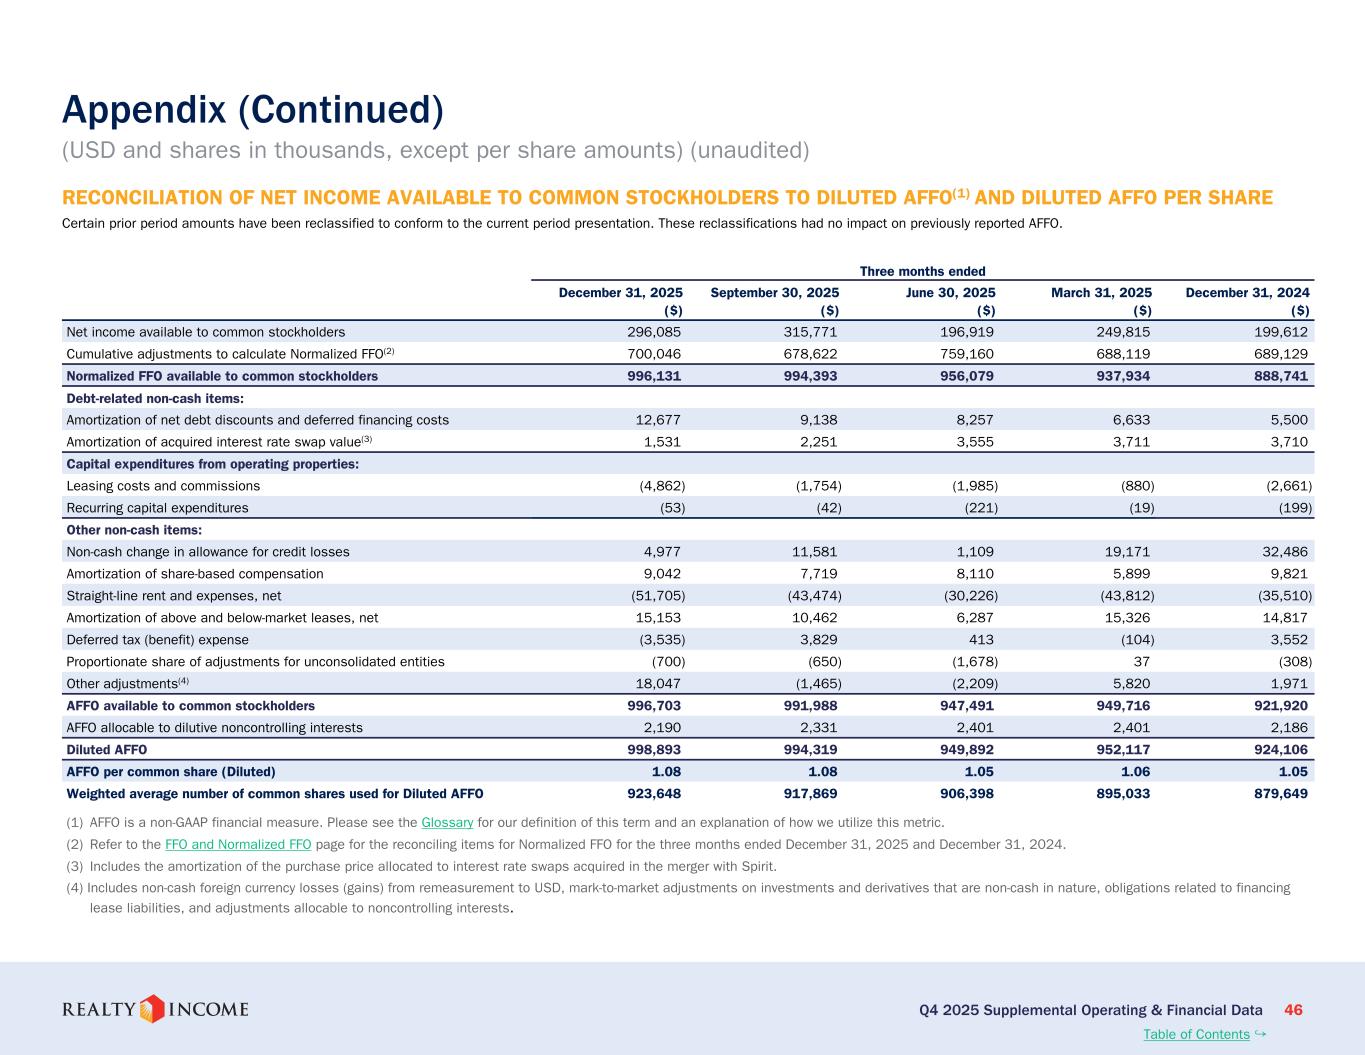
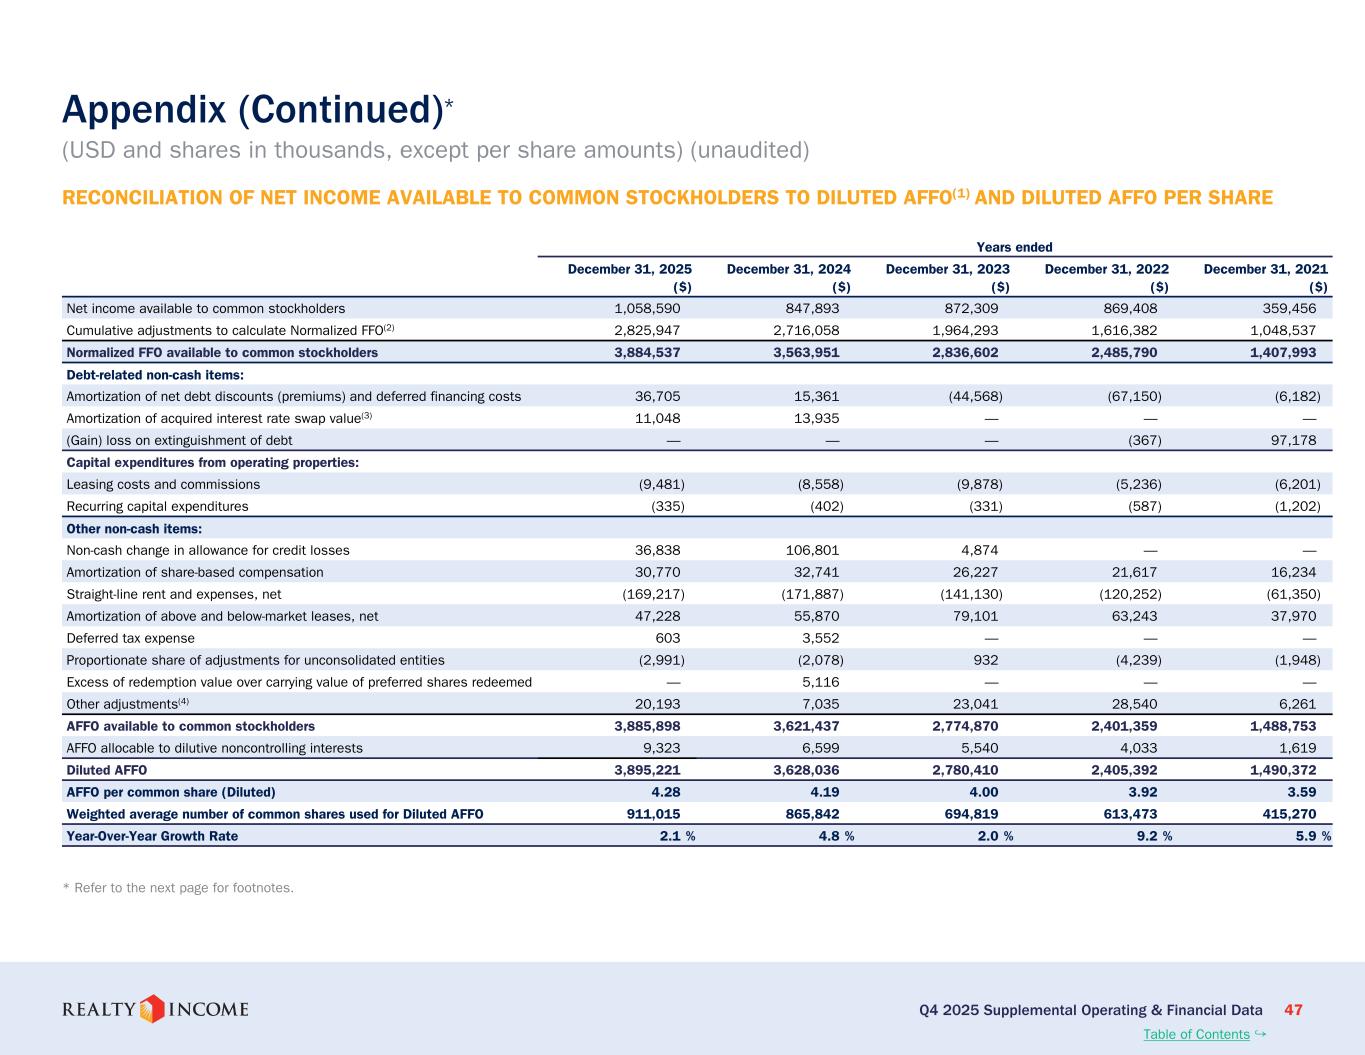
Thank you, Lauren. Welcome, everyone. 2025 was a year in which our platform, discipline, and global reach came together to deliver steady results and position realty income for its next chapter of growth. We delivered AFFO per share of $1.08 for the fourth quarter and $4.28 for the full year, supported by 98.9% occupancy and 103.9% rent recapture, reinforcing the stability and diversity of our cash flows. In the fourth quarter, we invested approximately $2.4 billion, or $2.3 billion, pro rata for our ownership interest at a 7.1 percent initial cash yield driven by strong opportunities in Europe and the closing of our $800 million perpetual preferred investment in the Las Vegas City Center real estate assets with Blackstone. For the full year, we deployed approximately $6.3 billion or $6.2 billion pro rata at a 7.3 percent initial cash yield with 30% of acquisition cash income from investment-grade clients. We also sold 425 properties for approximately $744 million, enhancing portfolio quality and redeploying capital into higher return opportunities. As part of our disciplined approach, we proactively addressed client-specific risks. With At Home, we used early visibility into store-level trends to begin selling select assets ahead of its Chapter 11 filing. Over 18 months preceding the filing, we sold eight properties for nearly $80 million, significantly reducing exposure. Across the remaining 31 stores, our blended recapture rate was just over 80%, consistent with our historical experience for bankruptcy outcomes. we only experienced one rejection, which was resolved in the fourth quarter. With the company now operating with what we believe to be a stronger financial position, we believe that our early action, disciplined underwriting, and active asset management have preserved long-term value. The at-home experience also illustrates how our proprietary predictive analytics platform informs proactive decision-making. Store-level visibility gave us an early read on operating performance, but by using broader predictive analytics to assess closure risk, rent sustainability, and real estate fungibility, we can determine which assets carried elevated long-term risks. In partnership with asset management, that work allowed us to selectively dispose of higher-risk locations at attractive valuations and materially reduced exposure ahead of the filing. And when the filing ultimately occurred, our analysis validated the durability of the remaining locations. That same discipline carries through to how we manage the broader portfolio. We recognized $18.9 million of lease termination income during the fourth quarter, reflecting our proactive approach to resolving potential credit and renewal risk. We also continue to pursue terminations where we see a clear path to higher and better uses. These steps help us preserve long-term value while managing our exposure thoughtfully across the border. Internationally, our established platform remains a competitive advantage. As we have previously discussed, Europe continues to offer compelling risk-adjusted opportunities, And we regularly evaluate the viability of other markets where we can further leverage the strengths of our competitive moat. Last month, we expanded into Mexico as part of our broader strategic partnership with GIC, providing the majority of built-to-suit development financing and a $200 million takeout commitment for a high-quality U.S. dollar-denominated industrial portfolio, Another example of how our scale, cross-border capabilities, and balance sheet open new swim lanes of growth in a disciplined and repeatable way. As part of our international strategy, we're entering Mexico in a disciplined, partnership-led manner alongside GIC and Heinz. This structure allows us to finance built-to-suit developments at attractive, effective yields with forward commitments at cap rates that compare favorably to U.S. assets while maintaining our target risk-adjusted returns. Our initial focus is narrow and phased, centered on Mexico City and Guadalajara, core logistic markets with tight fundamentals, consistent rent growth, and investment-grade tenants. We are investing in mission-critical, built-to-suit facilities with institutional quality and U.S. dollar-denominated leases. Over the long term, we view Mexico as a strategic beneficiary of nearshoring and expect to expand selectively as fundamentals continue to mature. Our approach also reflects current developments on the ground, including increased coordination between Mexican and U.S. authorities that may support a more stable operating environment over time. While near-term conditions remain fluid and market sentiment can be volatile, we believe this reinforces the importance of our phased partnership-led entry and long-term conviction in Mexico's industrial fundamentals. Concurrent with our expansion into Mexico, the U.S. component of our previously announced joint venture with GIC is now executing a similar structure. Through this partnership, Realty Income and GIC will programmatically develop approximately $1.5 billion of primarily industrial, built-to-suit properties. Last month, the joint venture closed its first transaction, a $58.5 million investment alongside a forward acquisition agreement for a modern industrial property in Dallas, leased to a Fortune 500 service-based logistics client. This initial transaction demonstrates how the build-to-suit and financing components of this relationship function in practice, supporting mission-critical clients, earning interest income during development, and creating a clear path to high-quality ownership split between a like-minded, long-term investor in GIC. A defining feature of Realty Income's evolution is pairing our operating platform with diversified, partnership-oriented capital. This relationship orientation continues to shape our sourcing engine. Approximately 89% of our fourth quarter transactions originated through relationship-driven channels, underscoring the depth of our client and partner network. In addition to our GIC partnership, we furthered our relationship with Blackstone through an $800 million perpetual preferred equity interest in Las Vegas City Center, which becomes the second joint venture we have entered into with Blackstone for a high-quality Las Vegas strip casino transaction. The structure provides attractive risk-adjusted returns with downside protection given the strategic importance of this asset to MGM and a right of first offer on an iconic Las Vegas strip asset, demonstrating our ability to execute large, structured, relationship-driven transactions. Looking ahead to 2026, we see a steady core business supported by disciplined capital allocation, healthy occupancy, and a pipeline that reflects both the depth of our sourcing engine and the flexibility of our multi-product platform. With the benefit of global relationships, strategic partnerships, and private capital channels, we expect to pursue high-quality opportunities across geographies and capital structures. Strategically, three priorities guide our capital deployment in 2026. First, deepen client relationships where we can act as a solution provider, particularly in mission-critical retail and industrial, and increasingly through development and structured solutions, including via the GIC platform. Second, broaden the investable universe by pursuing repeatable high-quality adjacencies that align with our underwriting discipline and generate resilient contractual income. As a one-stop-shop net lease solution provider, our platform is well-positioned to originate and structure these opportunities. Third, optimize capital efficiency by diversifying equity sources and maintaining balance sheet flexibility, which Jonathan will outline in more detail. Bringing it together, Realty Income Today is a full-service real estate capital provider with global reach, multi-product capabilities, and a more diversified set of capital channels supporting our growth engine, anchored by a high-quality portfolio that generates stable and growing cash flows. The momentum we saw exiting 2025, combined with the partnerships and platforms we have assembled, underscores the strength of our flywheel and ability to compound long-term value. With that, I'll turn it over to Jonathan. Thanks, Sumit, and good afternoon, everyone.
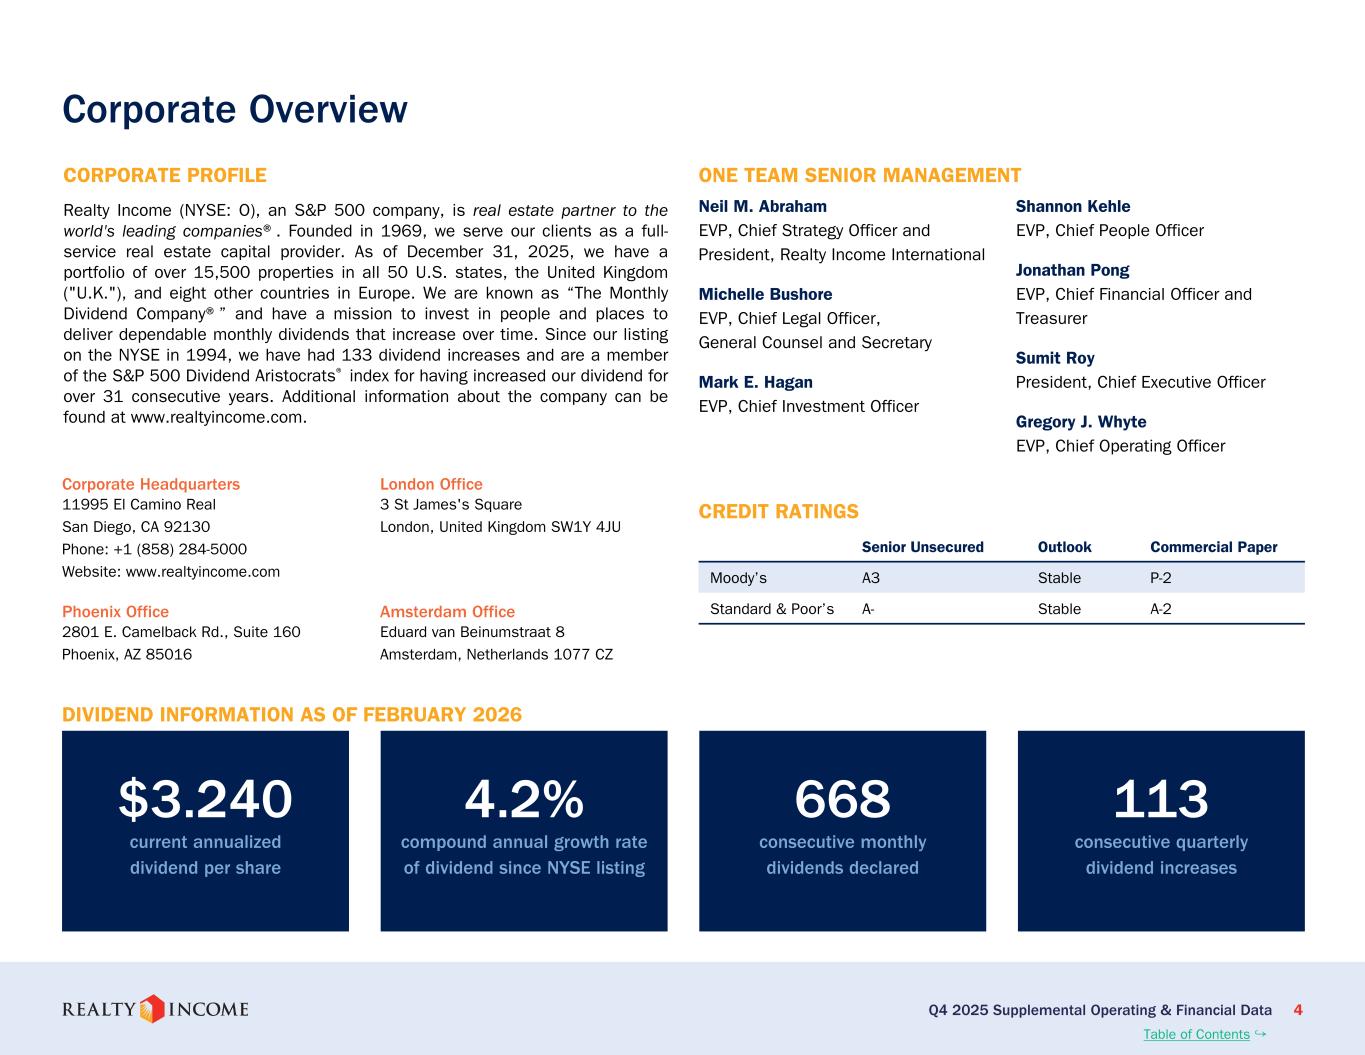
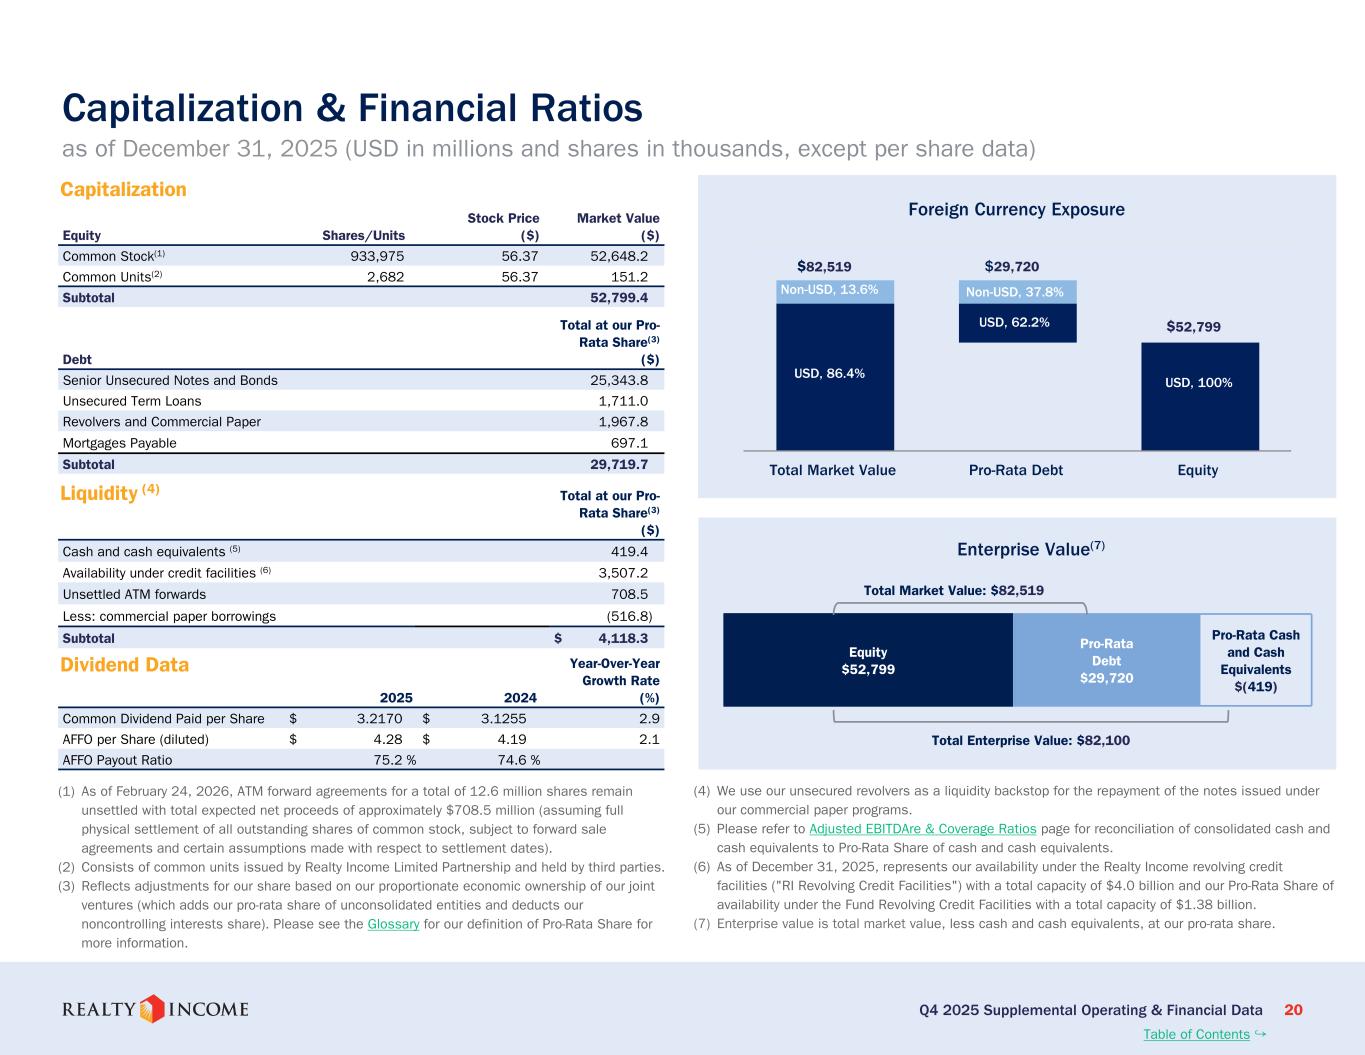
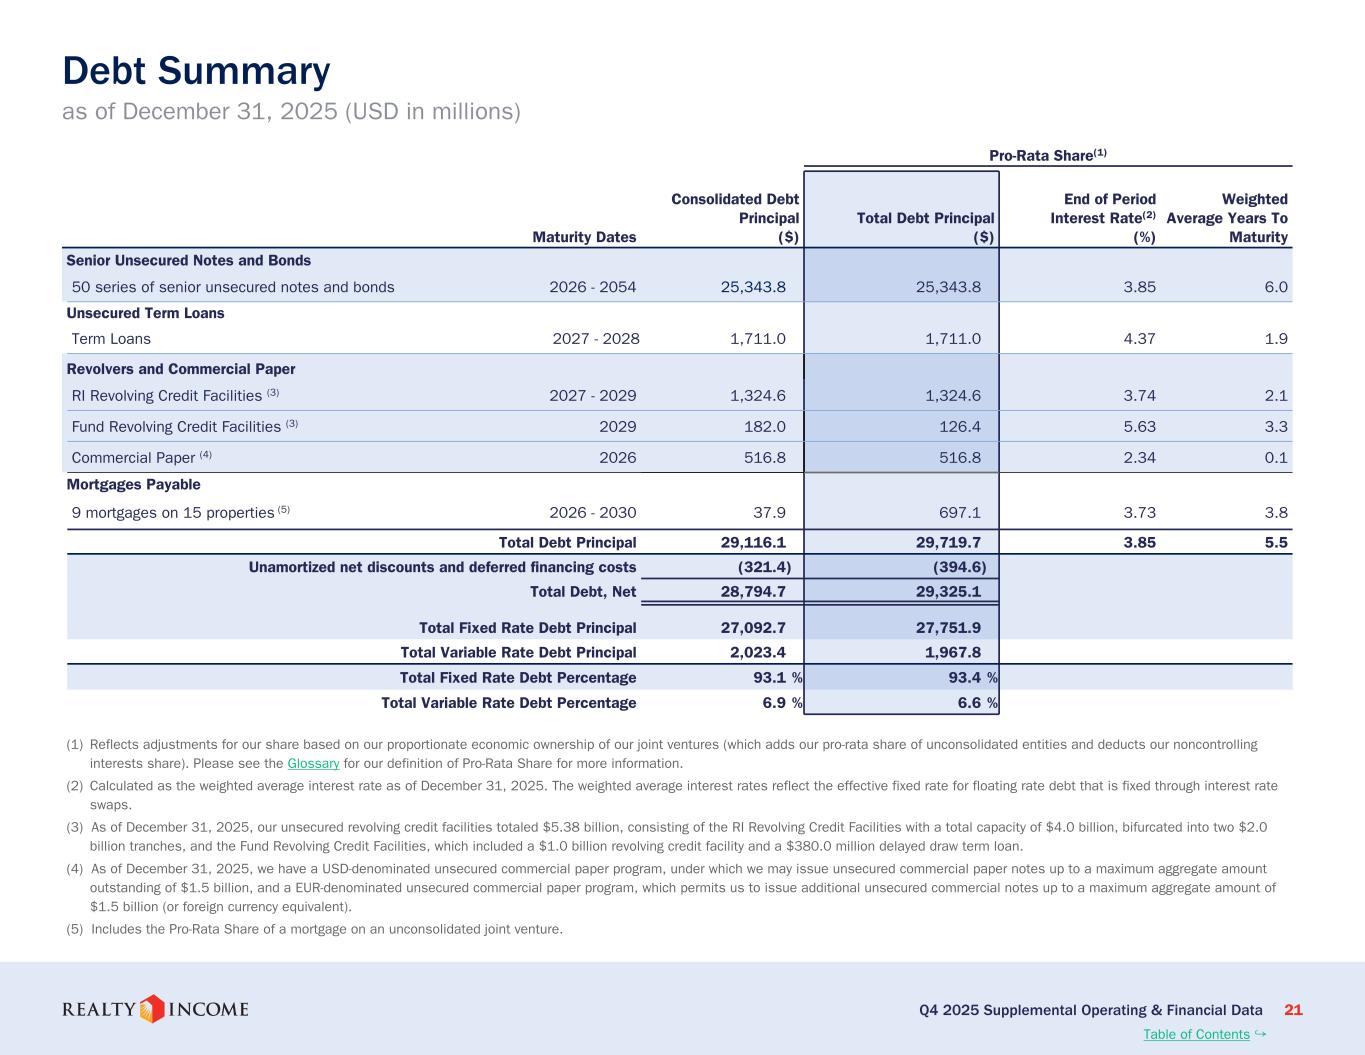
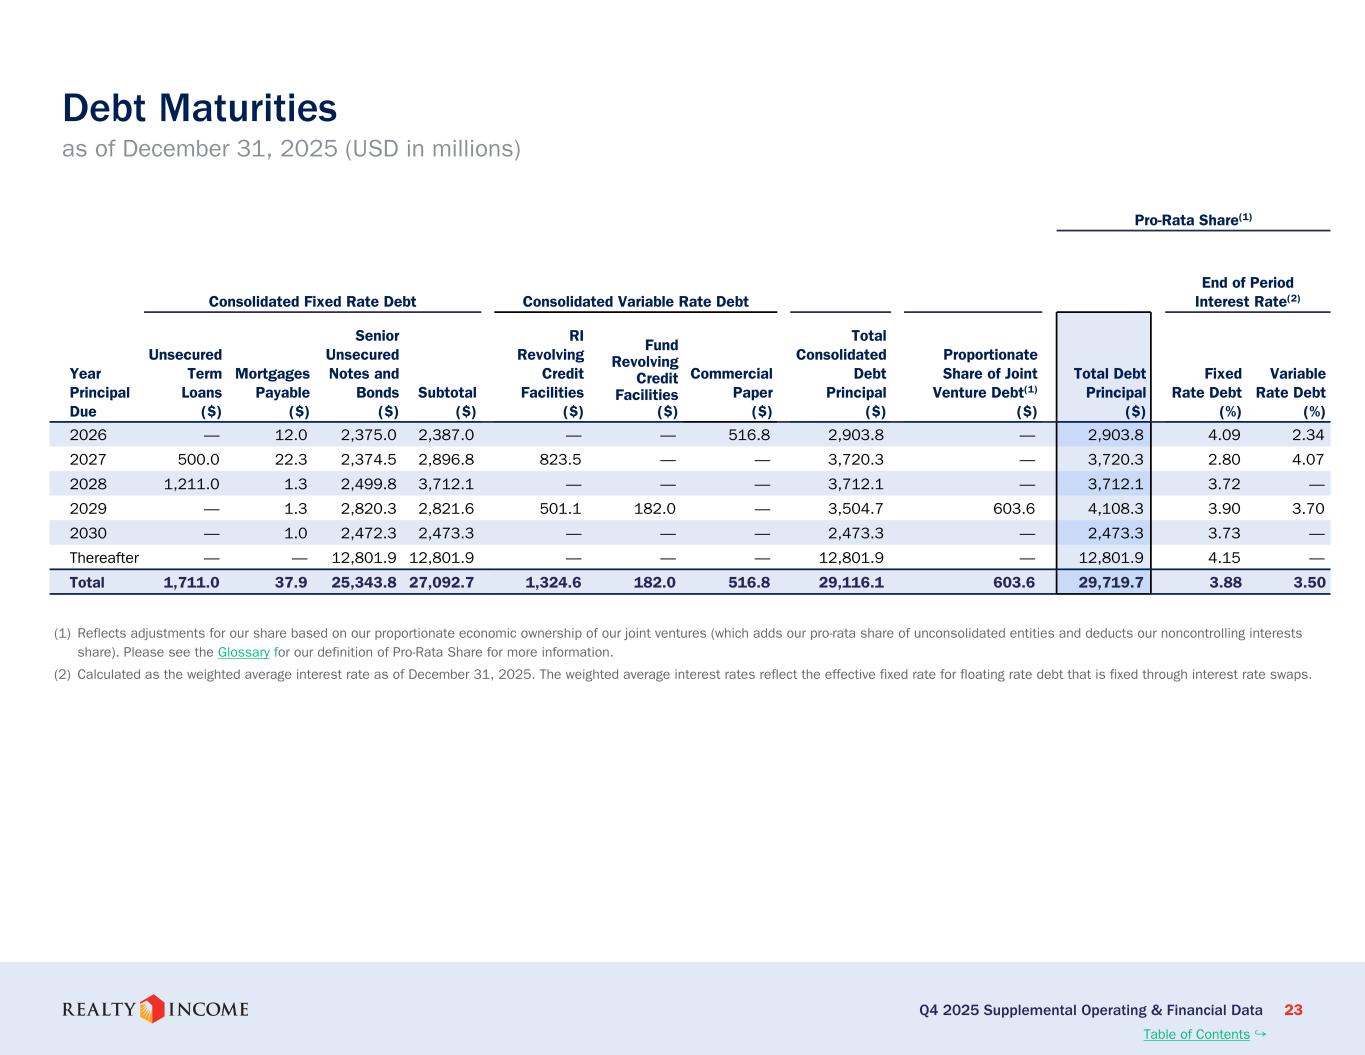
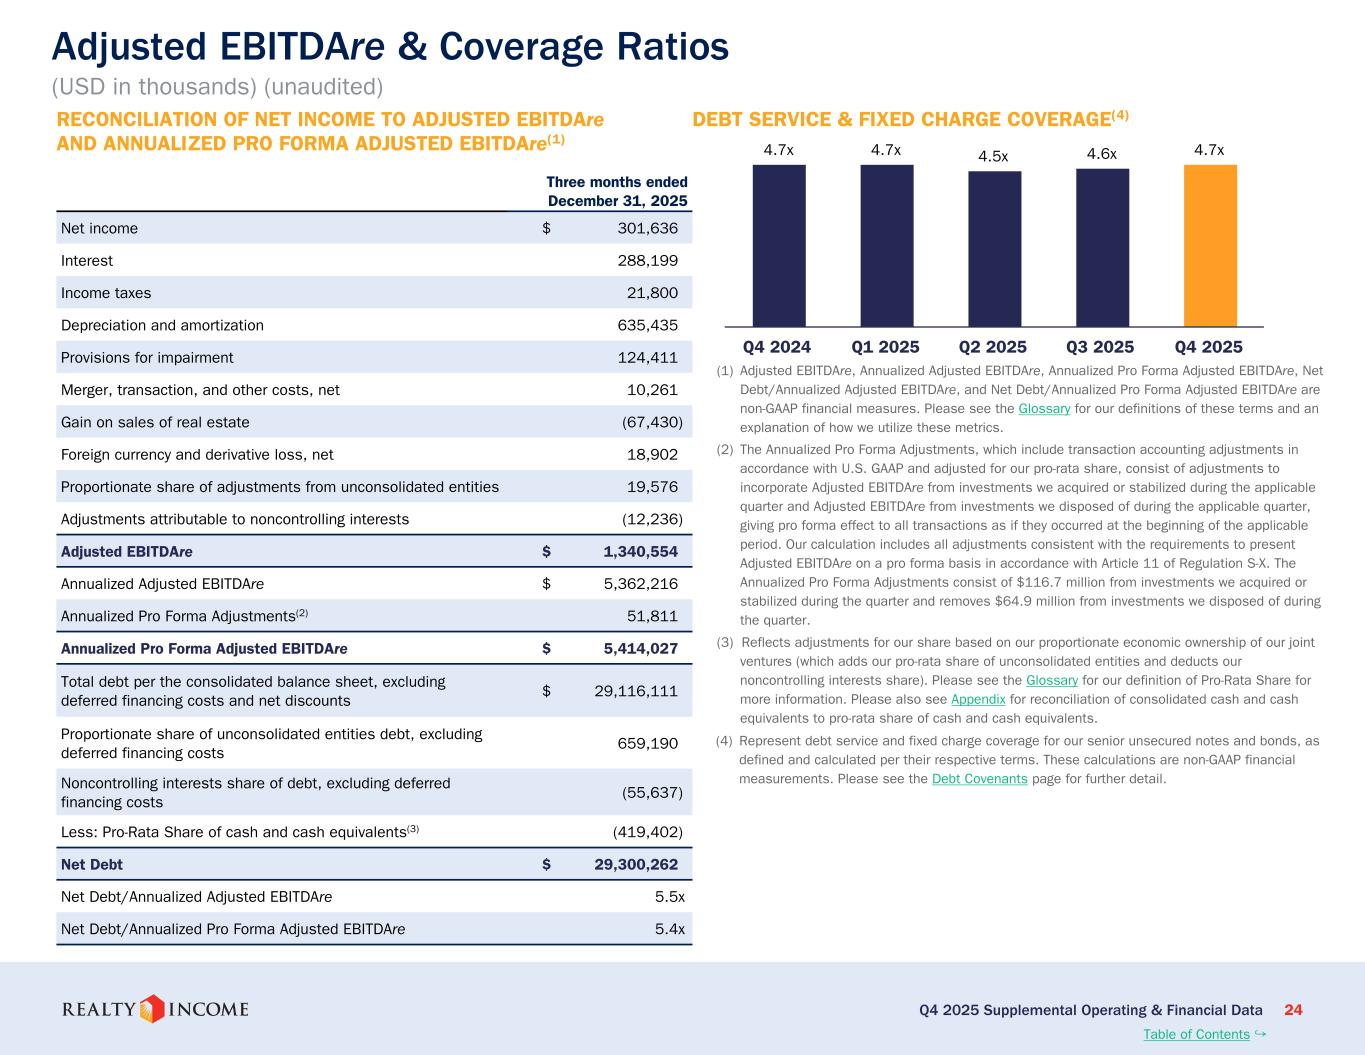
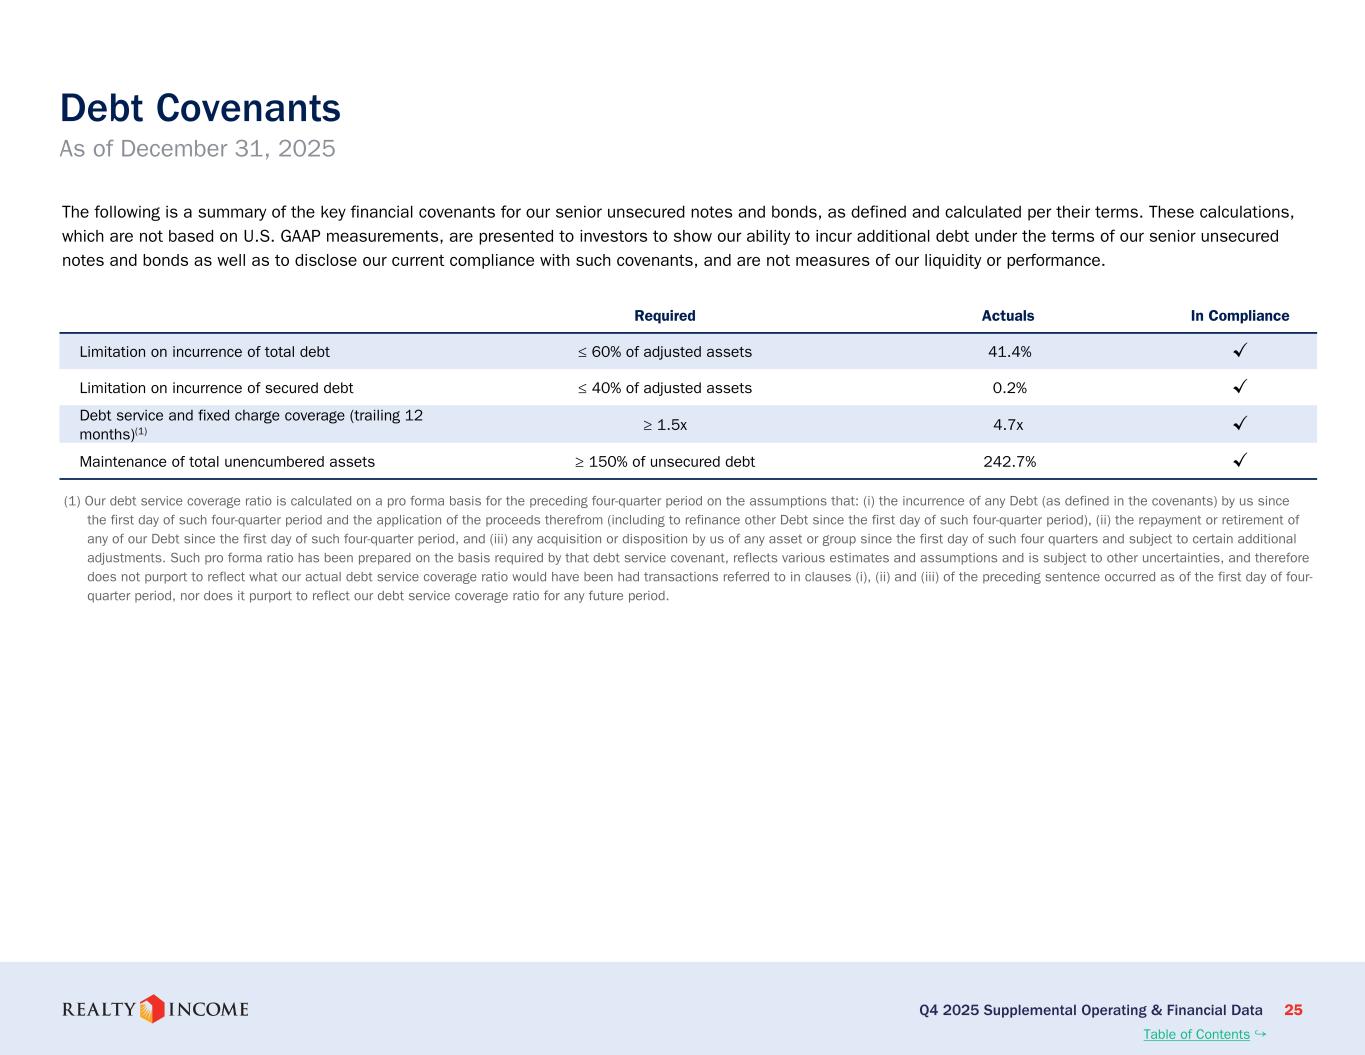
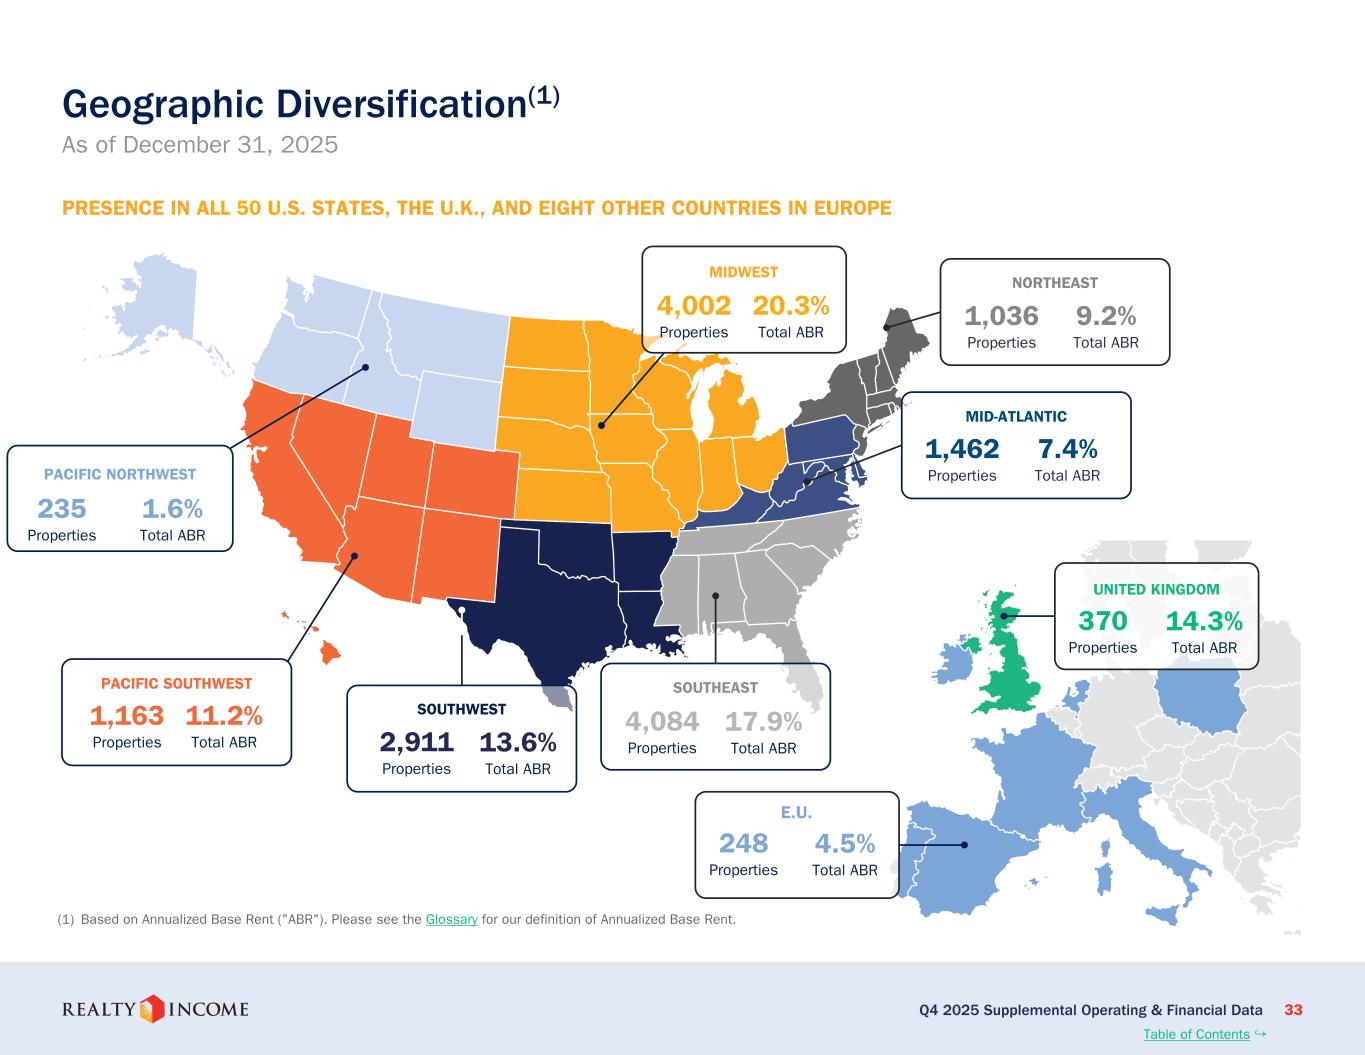
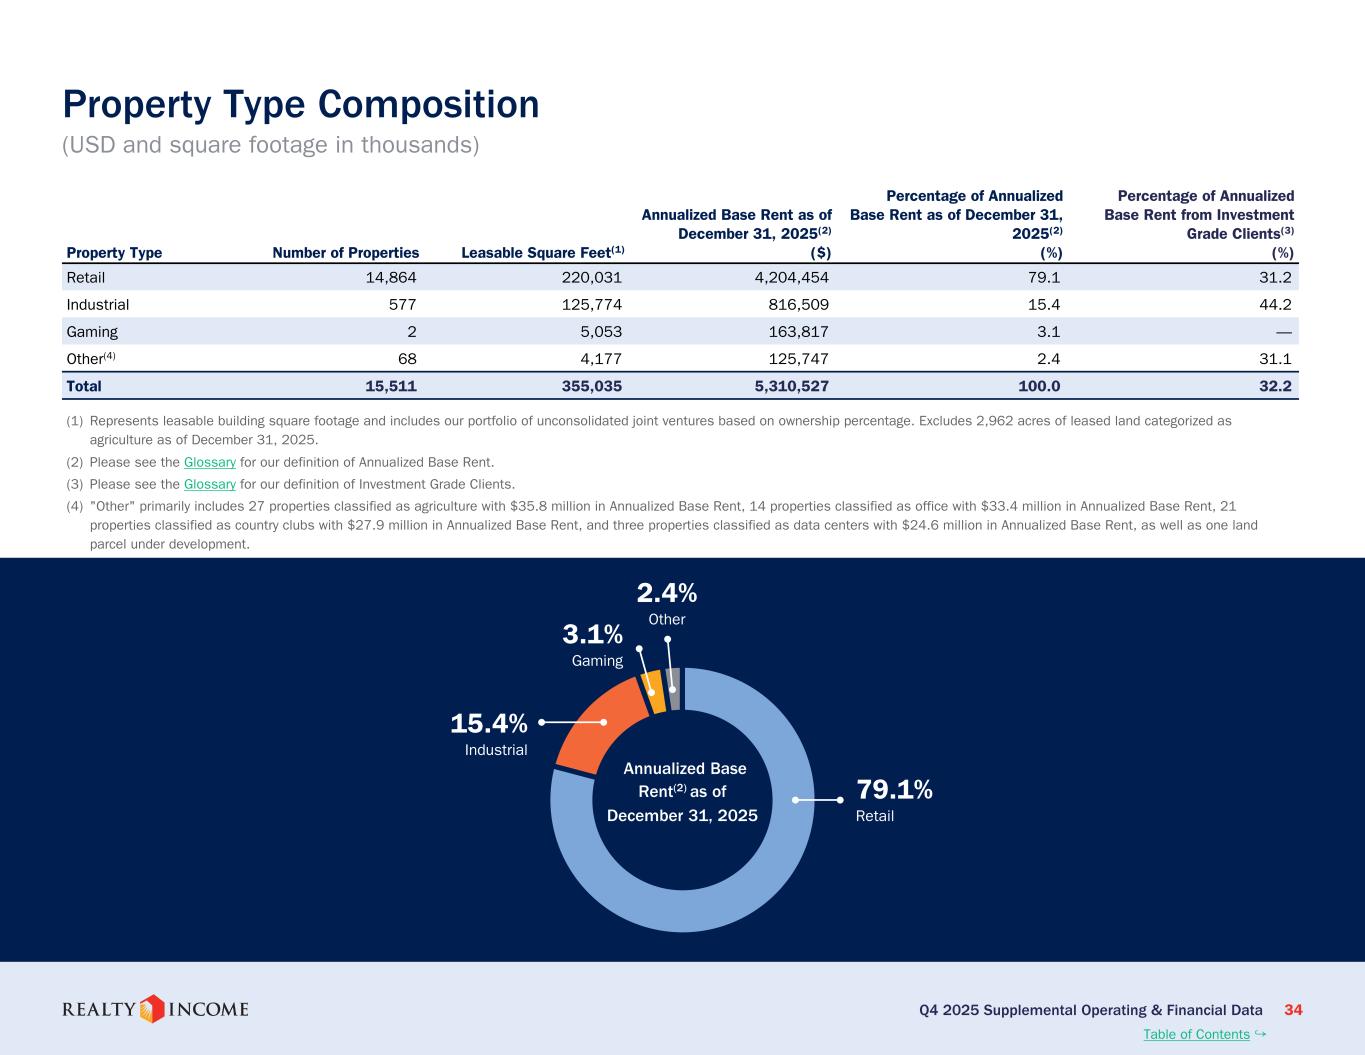
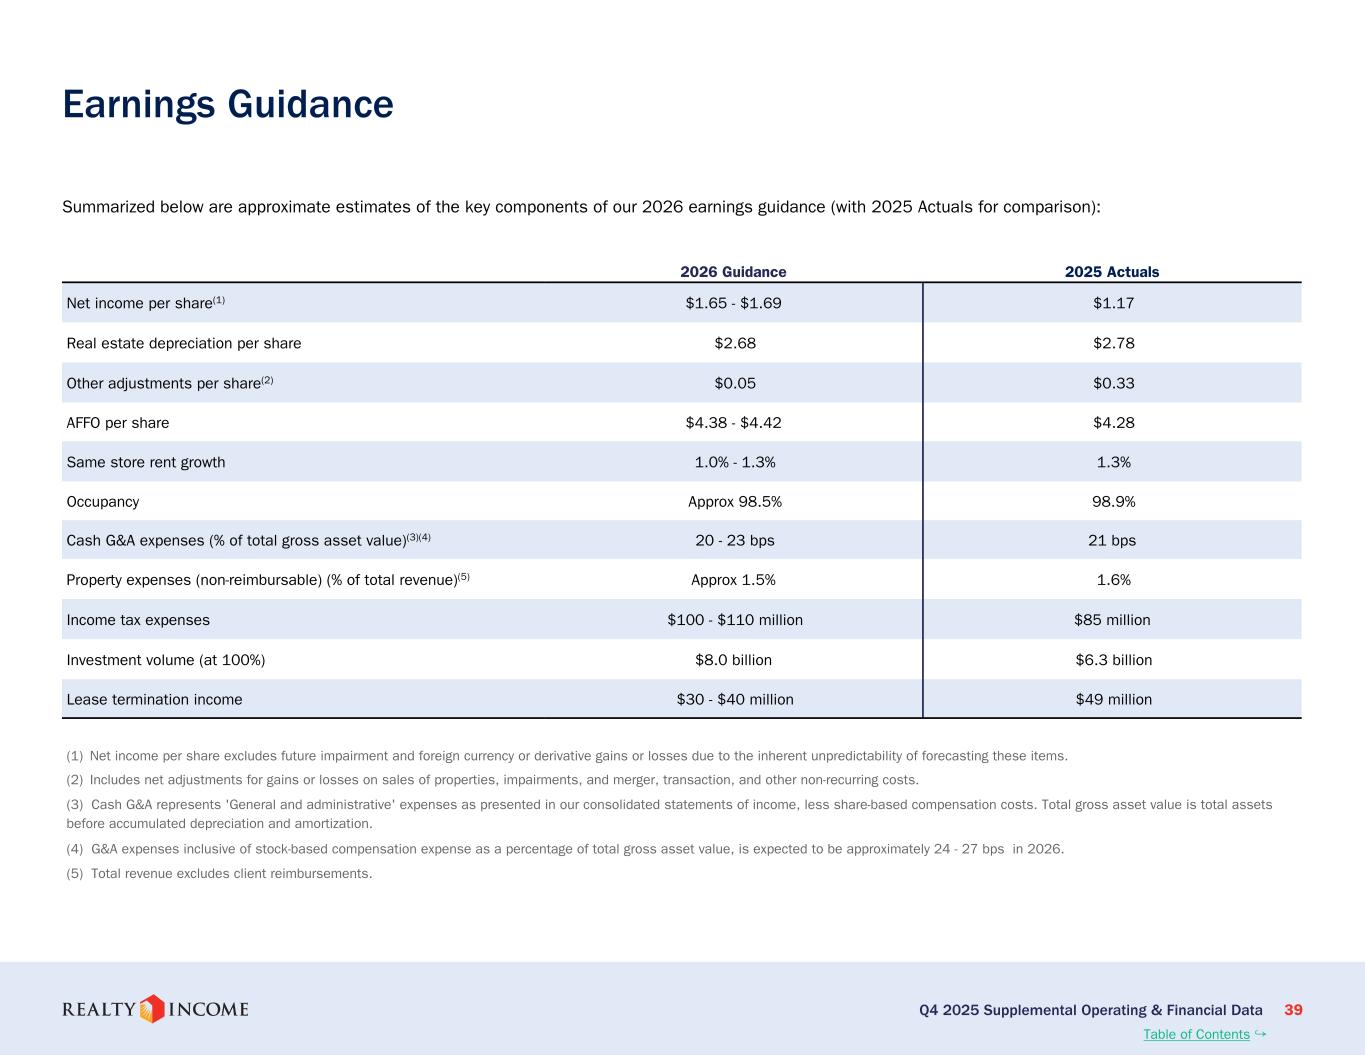
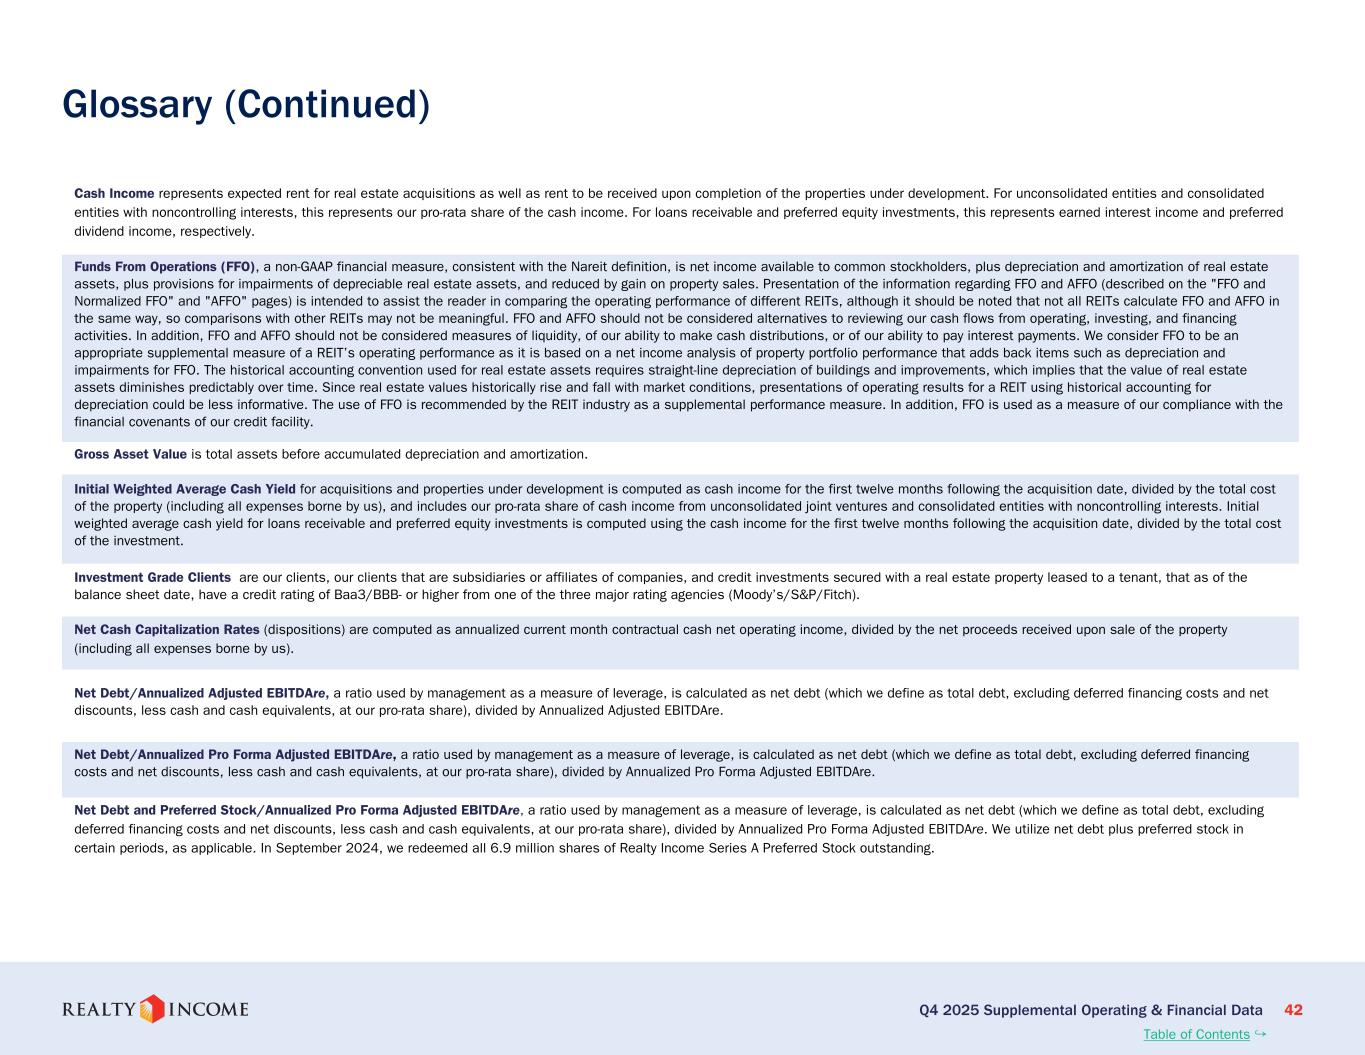
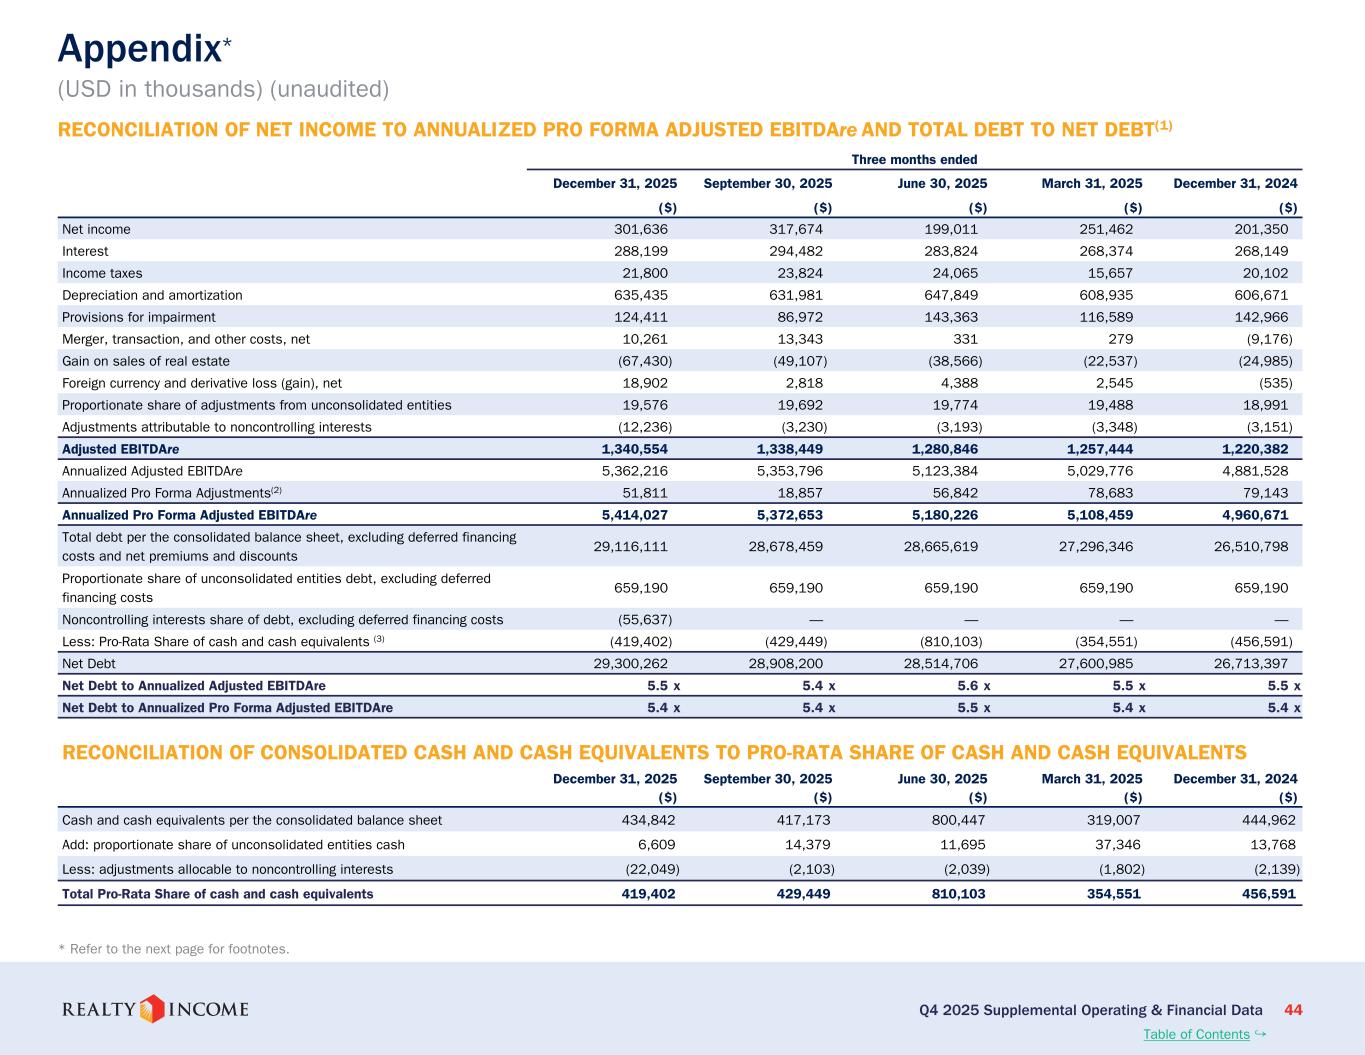
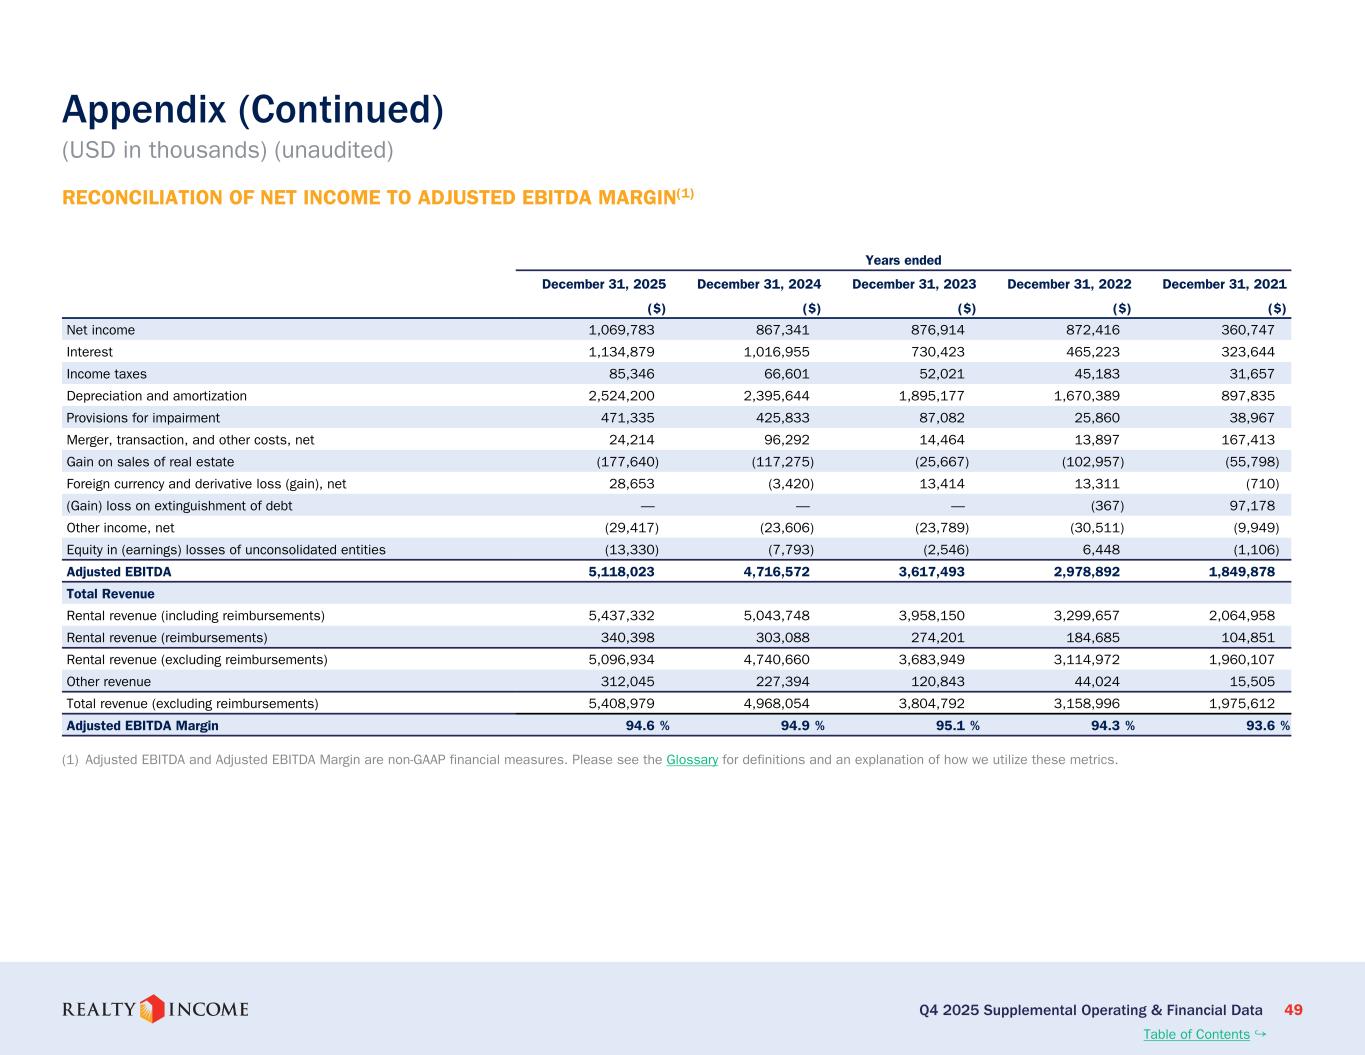
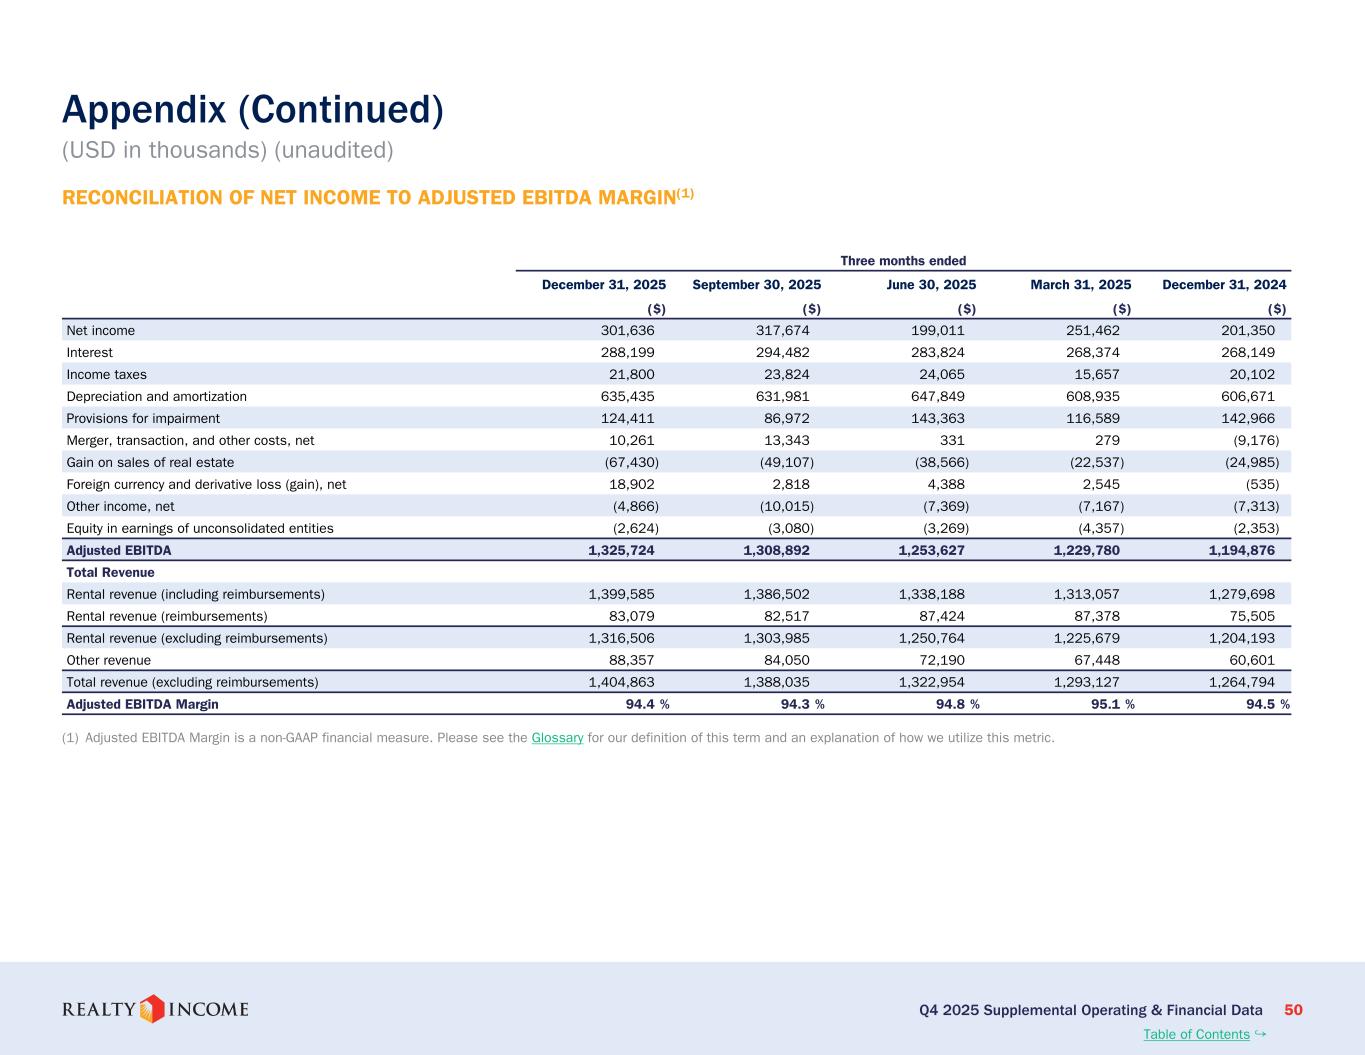
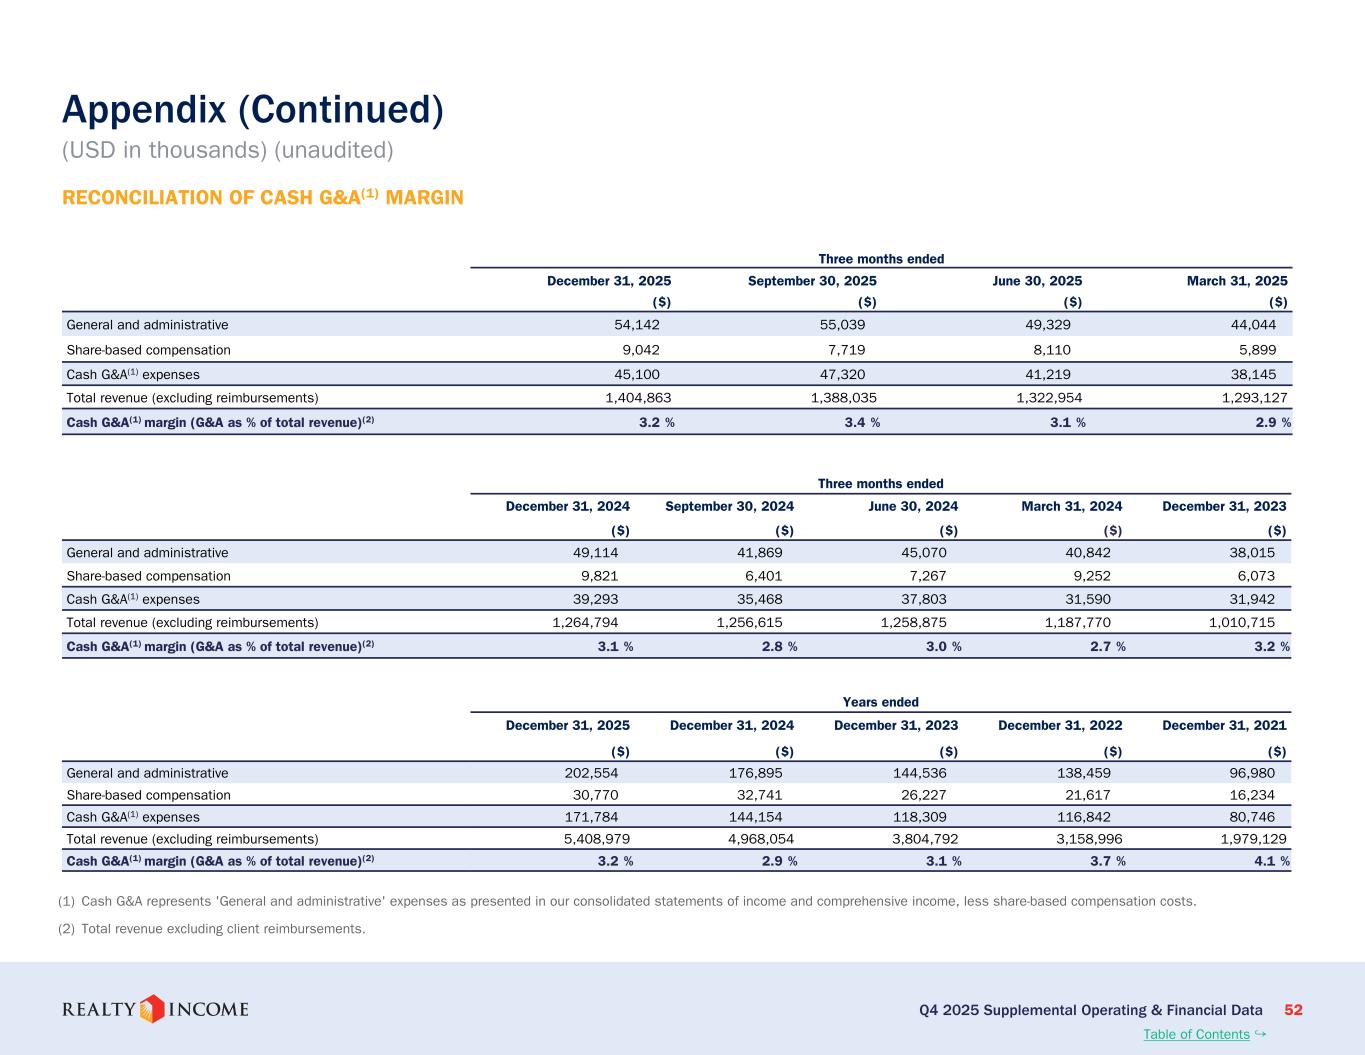
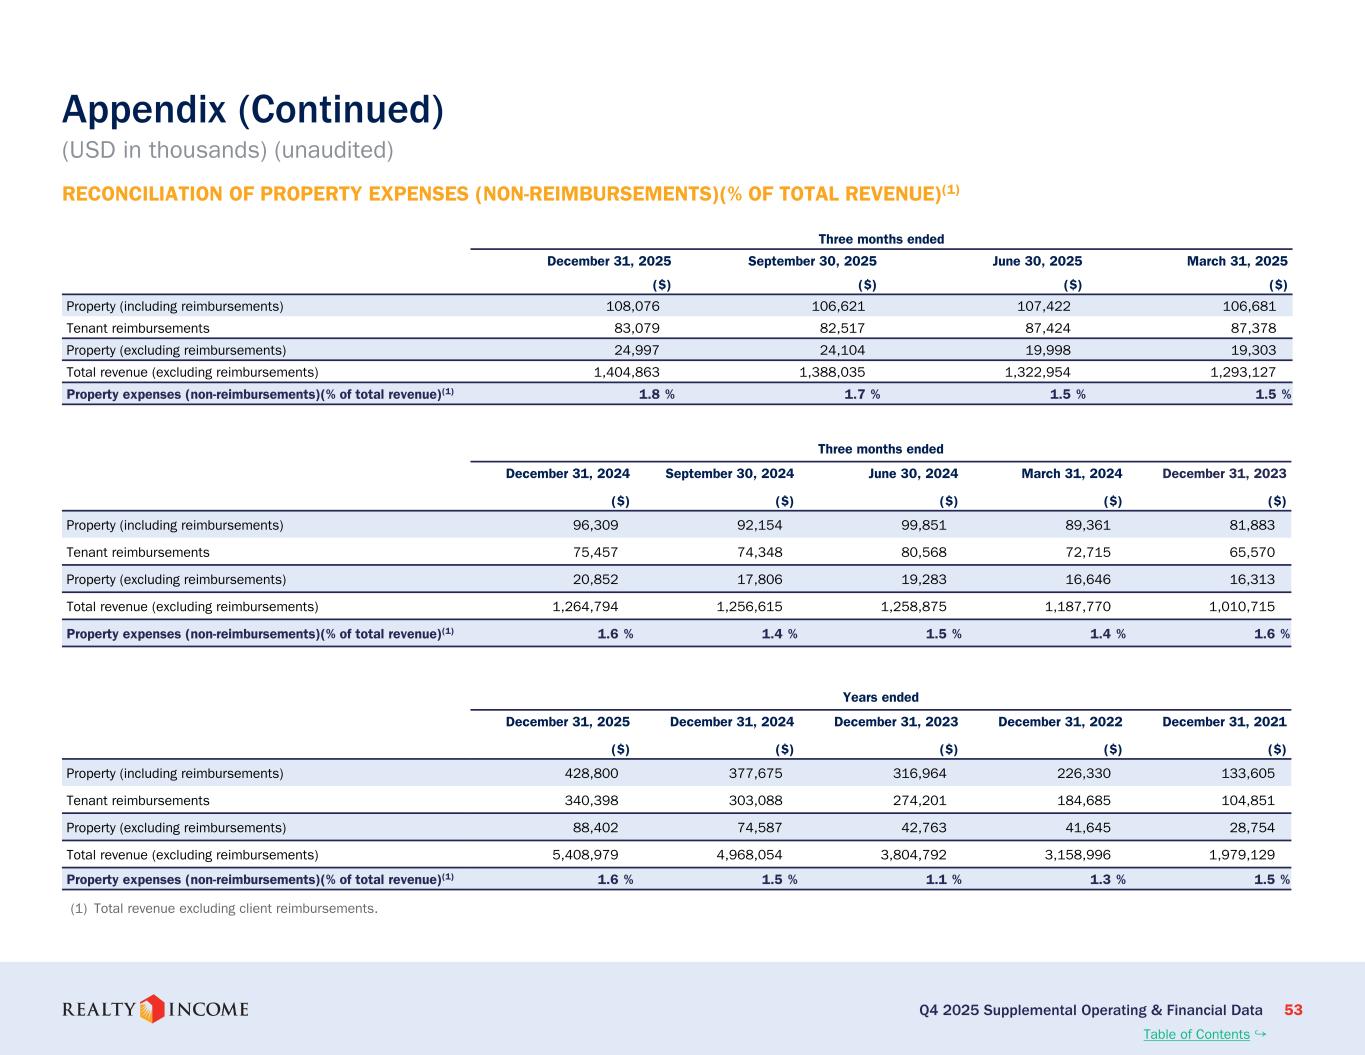
2025 was a foundational year for us from a capital diversification perspective. We've proudly launched our debut open-end fund in the U.S., successfully raising over $1.5 billion in third-party equity from over 40 institutional investors spanning state, city, county, and employee pension funds, sovereign wealth funds, asset managers, foundations, and consultants. We established this open-end perpetual life vehicle because this format was the most strategic, valuable, and appropriate structure for our long-duration net lease business, which is known for its consistency and lack of volatility. We were humbled by the investor reception to our values, performance track record as a public company, the best-in-class human capital, and unmatched access to proprietary data and insights across a seasoned real estate portfolio of over 15,500 properties globally. As Sumed previously mentioned, we were also pleased to establish a programmatic strategic relationship with GIC, which pairs our operating platform with a long-term and disciplined capital partner. While the focus of the partnership will be on built-to-suit industrial development, we expect to partner on a variety of large-scale opportunities given our combined focus on deploying capital at scale, where we can create superior value for respective stakeholders. I want to briefly take a moment to highlight the broader design behind these initiatives. Our partnership with GIC and the launch of our fund business are not intended to be mere single-period contributors. They are programmatic vehicles that expand our opportunity set today while creating embedded pathways for recurring compounding growth over time. Turning to highlights from the fourth quarter, we ended the year with over $4.1 billion of liquidity on a pro-rata basis with a net debt to pro-forma adjusted EBITDA ratio of 5.4 times, squarely within our long-term target range. Subsequent to year end, we issued our first convertible note offering, raising gross proceeds just north of $862 million for a three-year convertible note at 3.5%. We used $102 million of proceeds to repurchase 1.8 million shares of common stock, which reduced potential share dilution and allowed us to minimize the impact on the stock price as we priced the transaction. The remainder of the proceeds were used to repay a $500 million note maturity in January, which had a rate of 5.05%, thus representing immediate earnings accretion through the exercise. Our balance sheet is positioned to play offense on the investments front in 2026. We enter the year with cash and unsettled forward equity totaling approximately $1.1 billion. When combined with an annualized run rate of over $900 million in free cash flow, we have over $2 billion of equity or $3 billion fully leveraged dry powder to address an active deal pipeline. In addition, we have approximately $400 million of undrawn third-party equity capital committed to our open-end fund that adds further liquidity to employ accretive capital at scale. Operational efficiency remains a priority. We finished the year with a cash G&A margin of just 3.2%, while adding talented team members across our global organization, which ended the year at nearly 550 individuals throughout our vertically integrated platform. We are proud of our ability to invest in top talent at all levels of the organization while maintaining one of the most efficient cost margins in the industry. Starting to 2026 guidance, we are introducing AFO per share guidance of 438 to 442, representing an acceleration in AFO per share growth versus 2025. In addition to the $8 billion investment guidance for the year, key assumptions in our model reflect healthy underlying portfolio fundamentals, and in particular, includes credit-related loss of 40 to 50 basis points of revenue, a meaningful decline versus the 70 basis points we experienced in 2025. We expect least termination income to once again be a meaningful contributor to earnings in 2026, as we forecast $30 to $40 million based on our current visibility. As Suman mentioned, this income is driven by our proactive asset management efforts, and we expect this income to remain a recurring part of our business. Our expense margins continue to reflect the efficiency of our business, and for 2026, we are guiding to unreimbursed property expense margins of approximately 1.5% revenue, and we expect cash genie expenses to be just 20 to 23 basis points of gross asset value. Finally, we expect to generate approximately $10 million of base management fees from our open-end fund during 2026, which may fluctuate slightly depending on the pace of capital calls for investments made in the fund. Now to close out our prepared
remarks, I'll pass it back to Sumit. Thanks, Jonathan. Before we open the line for questions, let me briefly summarize. Realty Income enters 2026 with a resilient core business, a broader set of capital partners, and a deeper global pipeline that at any point in our history. Our partnership with GIC, our city center investment with Blackstone, and our successful cornerstone capital raise for our debut private fund all reflect the evolution of our business and the expansion of our investment buy box. We remained disciplined in underwriting, selective in deployment, and focused on compounding long-term per share value. We're looking forward to continuing to demonstrate that our proven operating platform and unrelenting focus on generating durable income is highly valued in the marketplace. Operator, we are ready for questions.
Operator
Thank you. We will now begin the question and answer session. To ask a question, you may press star then 1 on your touchtone phone. If you're using a speakerphone, please pick up your handset before pressing the keys. And to withdraw your question, please press star then 2. And at this time, we'll pause momentarily to assemble our roster. And the first question will come from Linda Tsai with Jefferies. Please go ahead.
Hi, thanks for taking my questions. As realty income has expanded into different capital raising and yield generating capabilities, you know, new channels, including private capital, new JV partners, build-to-suit initiatives, diverse geographies and loans, how different do you think realty income will look over the next three to five years?
That's a great question, Linda. Obviously, all of these various different things that you're seeing now, you know, in some of the recent announcements that we've made, et cetera, has been part of our strategy going back several years. You know, if you think about how realty income has evolved, we used to be 100% retail-only, U.S.-centric business. that over time has created, first, new channels of investments that were adjacent to what our core competency was. Thus, we included the international business, we included other asset types, and then started to focus on making credit investments with our existing client base with the attempt to be viewed as that one-stop solution provider to our clients. The second part of this puzzle was on how we financed our business, and obviously on the fixed income side, as we grew into multiple geographies, we were able to diversify our fixed income sources of capital, but on the equity side of the business, it was always our public markets here in the U.S., which has held us very well in our 31-year history as a public company, but what these last couple of years has shown is the volatility that could exist at points in time in economic cycles that sort of impedes our ability to completely utilize a platform that is capable of doing circa $10 billion of investment per year, which we've shown in years past. And so that was the question that we posed to ourselves internally about how do we start to diversify our sources of equity capital? How do we create partnerships that can allow us to fully utilize a platform that was built for scale and size? And what you're seeing more recently and what you will continue to see is us leaning into these various different sources of capital, forming partnerships with like-minded long-term investors like GIC, working very closely with existing partners and enhancing those relationships like with Blackstone, who view us as, you know, real estate partners that could potentially be a solution for them at points in time. And three to five years from now, all of these different avenues, including the open-ended fund, the Core Plus fund that we've put into place, I believe will be much more mature and will allow us to generate, you know, this growth profile that is much more commensurate with what our average growth profile has been over the last 30, 31 years. That is what I see manifesting over the next three to five years from now. Look, we've always been viewed as a company with the following two brands. It's trust and reliability. And growth for the longest time has been also part and parcel of realty income, this 5% growth rate that we have historically achieved. But in 2025, it was closer to 2%. And so the question that we are trying to answer, and I believe the market is now starting to see how we can use our size and scale to effectively differentiate ourselves and be a company that has a very unique investable mousetrap as well as sources of capital that will allow us to achieve that third element of growth. And so, you know, trust, reliability, and growth, those are the reasons why we are doing everything that we are doing. And I believe in the next three to five years, all of these avenues will have matured and will allow us to be the company that we have been historically for the last time.
Thank you, Sumit. One for Jonathan. on acquisitions guidance of $8 billion in 2016, what's the cap rate you expect and what are some of the assumptions that feed into your expectations? Hey, Linda, rather than giving cap
rate guidance, I would say that we're expecting spreads to be fairly similar on a leverage neutral basis to where we were in 2025 and where we've been historically, so call it 150 to 160 basis points relative to that weighted average cost capital, short-term weighted average cost
Operator
capital. Thank you. The next question will come from Michael Goldsmith with UBS. Please go ahead.
Good afternoon. Thanks for taking my question. Maybe just following up on that last question, but from a different perspective, your acquisition cap rate ticked down in the fourth quarter sequentially. So, can you just talk about, like, you know, what the cap rate environment is looking Like, is that a reflection of what you're buying, or is that a reflection of competition, just trying to get a sense of, you know, if that acquisition cap rate is trending lower here?
Yeah. Good question, Michael. Look, I don't think quarter over quarter, a 10, 20 basis point movement in cap rates really is indicative of the overall market. You know, what ends up closing in a quarter is a function of so many different things. And, you know, when you're sharing an average cap rate on all investments made, it sort of, you know, doesn't highlight the diversity of products that we are pursuing. Obviously, there are assets that we are buying that is inside of that average cap rate, and then there are some that are above that cap rate. And it's really a function more of what ends up closing in a given quarter, what gets moved to the next quarter, that drives these 10 to 20 basis points of movement on average cap rates. But I can step back and share with you our perspective that, look, if you think about the last few quarters, I would say three, four, five quarters, the cap rate has been in this low 7% zip code. And it is largely reflective of what you're seeing in the cost of capital environment and what you're seeing on the competitive side of the equation. And, look, if the cost of capital continues to improve, I believe that, you know, capital rates are going to reflect that. And, you know, the competition today on the private side has largely been, you know, fairly muted, again, because of the higher cost of debt that is there in the market. But if that were to change, which I'm not saying it will, but if that were to change, then you'd have more competition coming from the private side of the equation as well. So those are the variables that I would be looking out for to see the direction of cap rates, you know, over the next 12 months. But I'll tell you that, you know, over the last six quarters, the cap rate environment has been fairly stable.
Got it. Thanks for that, Jim. And then just as a follow-up, maybe you can talk a little bit about the G&A guidance. You know, I think you did 21 basic points in 2025 for 2026. You provided a range, which at the midpoint applies it to go up a little bit. So can you just walk through kind of like, you know, why G&A may move higher in a material way? And then just also maybe that reflects some investments that the company is making. So maybe where are you investing in the business today?
Yeah, thanks, Mike. First of all, I would say the G&A methodology that we're giving for guidance now is percentage of GAV. And the reason for that is, you know, because we have consolidated vehicles, we have unconsolidated vehicles. When you start to utilize the revenue and the income statement, it doesn't give the full picture. So I would say if you look at 2025, apples to apples, based off of that GAV methodology, you know, we're at about 21 basis points in cash G&A. Our guidance is for 20 to 23, so not really a material move. The one thing I'll say is that we've added a lot of really good talent to the team. We ended 2024 at about 468 employees. End of 2025, we're about 544. So about 76 employees hired. It was back and loaded to the back half of the year. And, you know, we feel like we've got a very strong competitive moat across the globe. And a lot of the headcount has been abroad in Europe. And you can see how meaningful Europe has been to our growth. And so that is something that we're very happy about. But I think when you look at 2026 as well, you know, we do have a few heads that we are adding. And, you know, when you're talking about a platform today that's generating $5.3, $5.4 billion in annual-based revenue with over 15,500 assets, you know, and plans for it to grow significantly, We definitely believe that we have the ability to hire the best talent, to scale the business, and to still have one of the most efficient G&A margins in the industry.
Thank you very much. Good luck in 2026.
Operator
The next question will come from John Kuchowski with Wells Fargo. Please go ahead.
Good afternoon. Thanks for taking my question. You know, just for my first one, maybe could you help me bridge this AFFO guide? You know, it's a really healthy acquisition guide at $8 billion, surprise to the upside, but I feel like the AFFO guide was maybe below what the street was expecting. I'm curious, where are the sources of conservatism in your guide, or what is the street missing here?
Yeah, John, I would say it really comes down to the credit loss guidance, credit loss guidance of 40 to 50, you know, basis points of rental revenue, something that has a fair amount of conservatism. We're sitting here in late February, and I think as is per, you know, usual, we want to have a little bit more visibility in terms of how things are playing out before we tighten and lower that guide. So, you know, I think if you kind of back into what that represents on a dollar amount, over half of what that represents is for unidentified, you know, credits that, you know, we don't really see much in the way of high risk of that being utilized. But I think that's probably the number one thing that we would point out. Okay, that's very helpful. And then for my second
one, just to kind of go back on what you were talking to earlier on yields, how do we think about this incremental two billion that you're doing maybe above the six, let's call it, you know, is that you moving into new verticals or, and then how should we think about the yields on those? Like, is that just, it's a better acquisition environment, but maybe tighter cap rates on those incremental deals? Like what allows you to kind of lever up there? The way I would think
about investments is not necessarily in terms of yield, but in terms of spread, because ultimately that's what drives our AFFO per share growth. And I would just underwrite to what we have traditionally achieved, which is that 150, 155 basis points of spread on that $8 billion. There are so many things that go into that mix, John. You know, what is the timing of that $8 billion? Obviously, the reason why we've come out with a fairly large number is because we have a very good pipeline. We feel very good about what is happening here in the U.S. and what's happening in Europe, and now what we are seeing in some of the other geographies that we've gone into. It gives us a lot of confidence that, you know, finally we are at a point where we can lean into the market, and we have, you know, all these different channels of financing our business that gives us this confidence. So that's how I would think about, you know, this $8 billion. is it's a testament to our level of confidence in the products that we invest in. There are no new products that we are going to be sharing with the market in the near future. These are products that we've already invested in, and we will continue to sort of lean into it, and that's what's going to constitute the majority of the $8 billion.
Operator
The next question will come from Jaina Galen with Bank of America. Please go ahead.
Good afternoon. Sorry, again, on the kind of $8 billion investment volume guidance, if you could please clarify, it looks like that's at 100%. And so maybe help us think about how much is wholly owned, how much is in the private fund. And should we assume the full amount of the private fund is deployed near term and maybe mix between the development and acquisitions and whether you also expect it to be an elevated disposition year?
That's a great question, Yana. We'll give you some level of insight, but obviously it's an evolving year, and we'll see how things play out. In our fund, we have already deployed $1.1 billion, And so, you know, assuming that we hit our $1.7 billion, which we are on track to do by the end of March, you know, we have about $600 million of dry powder of equity that needs to be put to work. And obviously, we can lever this instrument up a bit, and that will be what goes towards the fund. What is unknown is how much more capital can be raised, both the cornerstone and time will tell. So we set that aside. The rest of it is all going to be balance sheet, is how you should think about modeling our investment numbers. Does that make sense?
Yes. And any color on kind of dispositions?
The dispositions, as you know, we were right around $740 million in 2025. You should expect a similar number in 2026. And, you know, this is, again, something that we are starting to lean into much more heavily, and you've seen the run rate over the last few years. And, yeah, and that's the goal for 2026.
Great. Thank you very much.
Operator
The next question will come from Brad Heffern with RBC Capital Markets. Please go ahead.
Yeah, thanks, everybody. Sumit, a lot of concerns about the impact of AI on almost everything in the economy at this point. Acknowledging that everything is very uncertain, how do you view the potential for AI disruption through the lens of your current portfolio, and does it change at all how you plan to invest going forward?
Brad, that's a great question. we think of AI as an amazing tool to help us do our business even better going forward. We were one of the first adopters of AI, AI-type tools going back to 2019. And, you know, we've created proprietary machine learning tools that actually is part and parcel of every element of our business that we do today. We are restructuring internally how we think about how all of the data that is produced by the company, that is accessed by the company, how all of that is going to get organized, et cetera, in data lakes, which will then allow us to further accelerate adoption of AI in various different vertical functional areas of our business to continue to separate ourselves from the rest of the business, from the rest of the companies that we run into. This is not something that is scary to us. A lot of us within the company, we are very comfortable with technology. Some of our previous lives were within the technology sphere. And so we welcome the innovation that is occurring. And you're 100% right, Brad. Things are moving very quickly. Stuff like lease abstraction that had an 80%, 82% success rate literally four months ago is closer to 90% today. But those evolutions are going to continue, and the biggest challenge that companies are going to face is how do you create the infrastructure that will then allow you to embrace AI to create the scale benefits. But that's where the world is moving. We are very well positioned to adopt this innovation, and I believe that from a maturity perspective, we are well ahead of the curve. So bring it on.
Okay. Thanks for that. And then, Jonathan, obviously you just completed the convertible notes offering. Can you talk about how you view that as a part of the toolkit, and is it something that was sort of specific to the point in time that we were in, or is it something that you would expect to be more regular going forward?
Yeah, Brett, I would say, to your point, the way we viewed it was exactly another tool in the toolkit. We believe in flexibility. We believe in availing ourselves of, you know, the entire menu of capital options available to us. And so, you know, we are known to be a very active issuer of capital, and a lot of that is equity. And so when you think about the conversion premium that we were able to structure 20%, which takes you to the high $60 range, thinking about issuing that on the ATM at spot versus effectively at a 20% premium, we were okay with that possibility within three years. But I think I would also highlight, you know, we have a U.S. dollar cost of debt on a 10-year basis of 5%, and the debt that we were repaying, you know, was north of 5%. And so at 3.5%, we view that as, you know, an accretive use of proceeds relative to what we would otherwise have done. So something that we'll look at from time to time, probably not to a significant degree, but when circumstances weren't, you know, we now have established ourselves in this market.
Operator
The next question will come from Sneed Rose with Citi. Please go ahead.
Hi, thanks. I just wanted to ask you a couple more questions on your guidance. It looks like your occupancy expectations come down a little bit for the year, as well as same-store rent assumptions come down a little bit, just using the midpoints. I was just wondering if you could talk a little bit about what assumptions you're making behind those two pieces of the guidance.
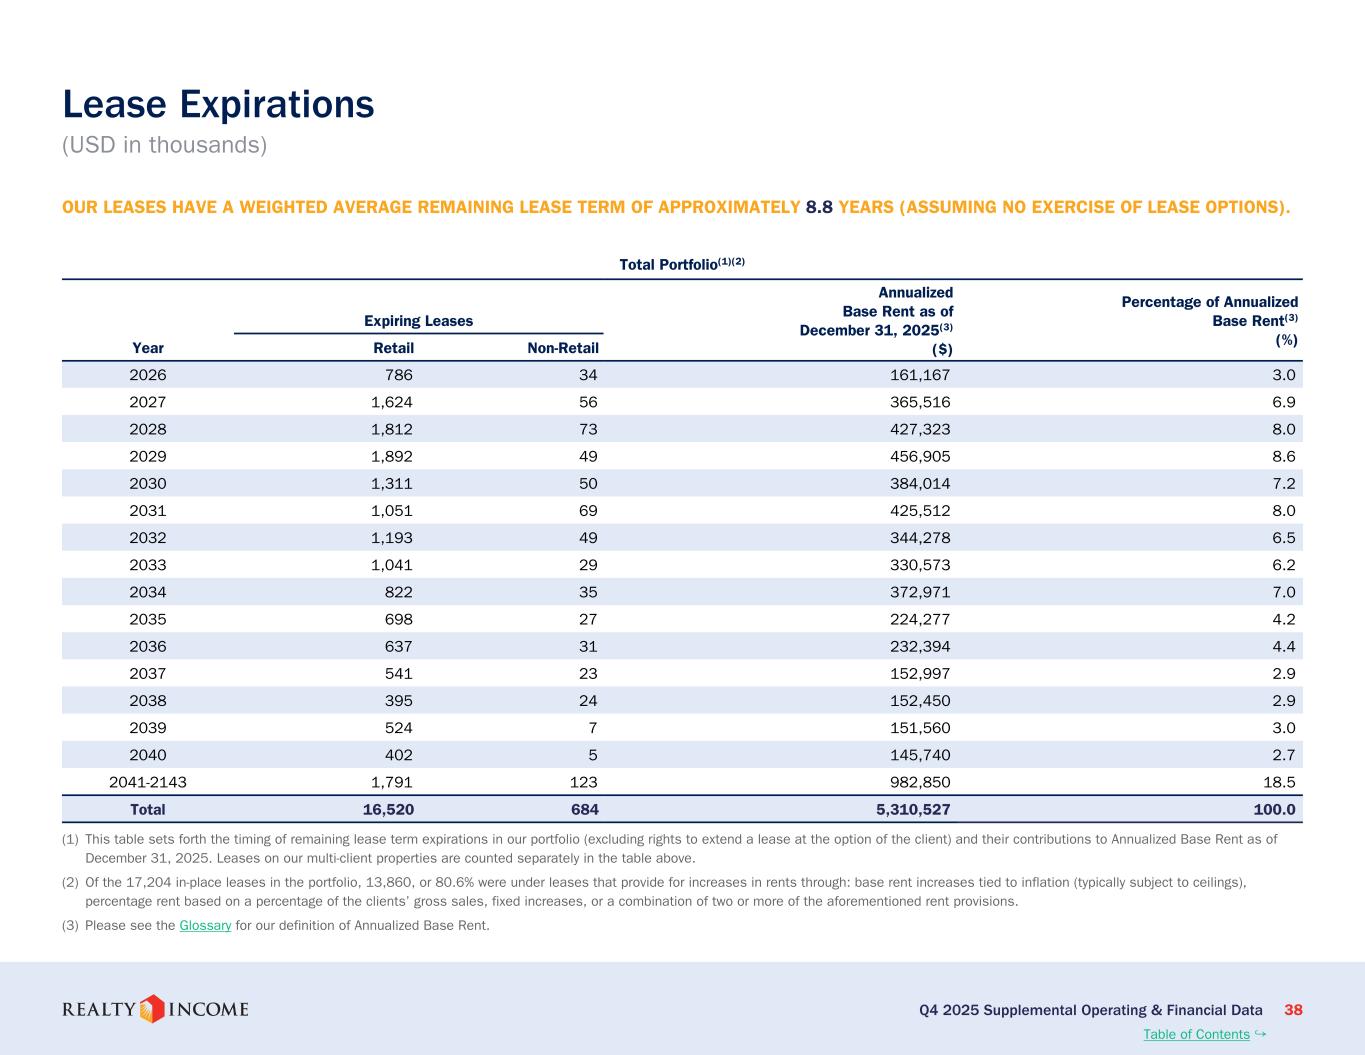
Yeah, with regards to the occupancy number, you know, it's a physical occupancy number that we share, Smead, and, you know, when you have a bunch of, you know, smaller concepts that basically have vacancies, they could move, you know, the occupancy number by these basis point movements that we have shared. Look, we feel pretty confident about the 98.5, and it is largely going to be a function of the type of expirations that we see, the size of these assets that are going to be expiring in 2026, which tend to be a lot more smaller assets with fewer rents. I believe the expiration schedule for 2026 is about 3% of our rent. So it's really a function of what kind of assets, you know, are expiring in a given year that dictates what the physical occupancy is going to look like in any given year. And I believe if you look at what our 2025 guidance was, it was in a similar range, perhaps even slightly lower, and we ended up, you know, at 98.9%. So this is our guidance. We feel very comfortable with it, and maybe there is a level of conservatism, but we'd rather be conservative than wrong.
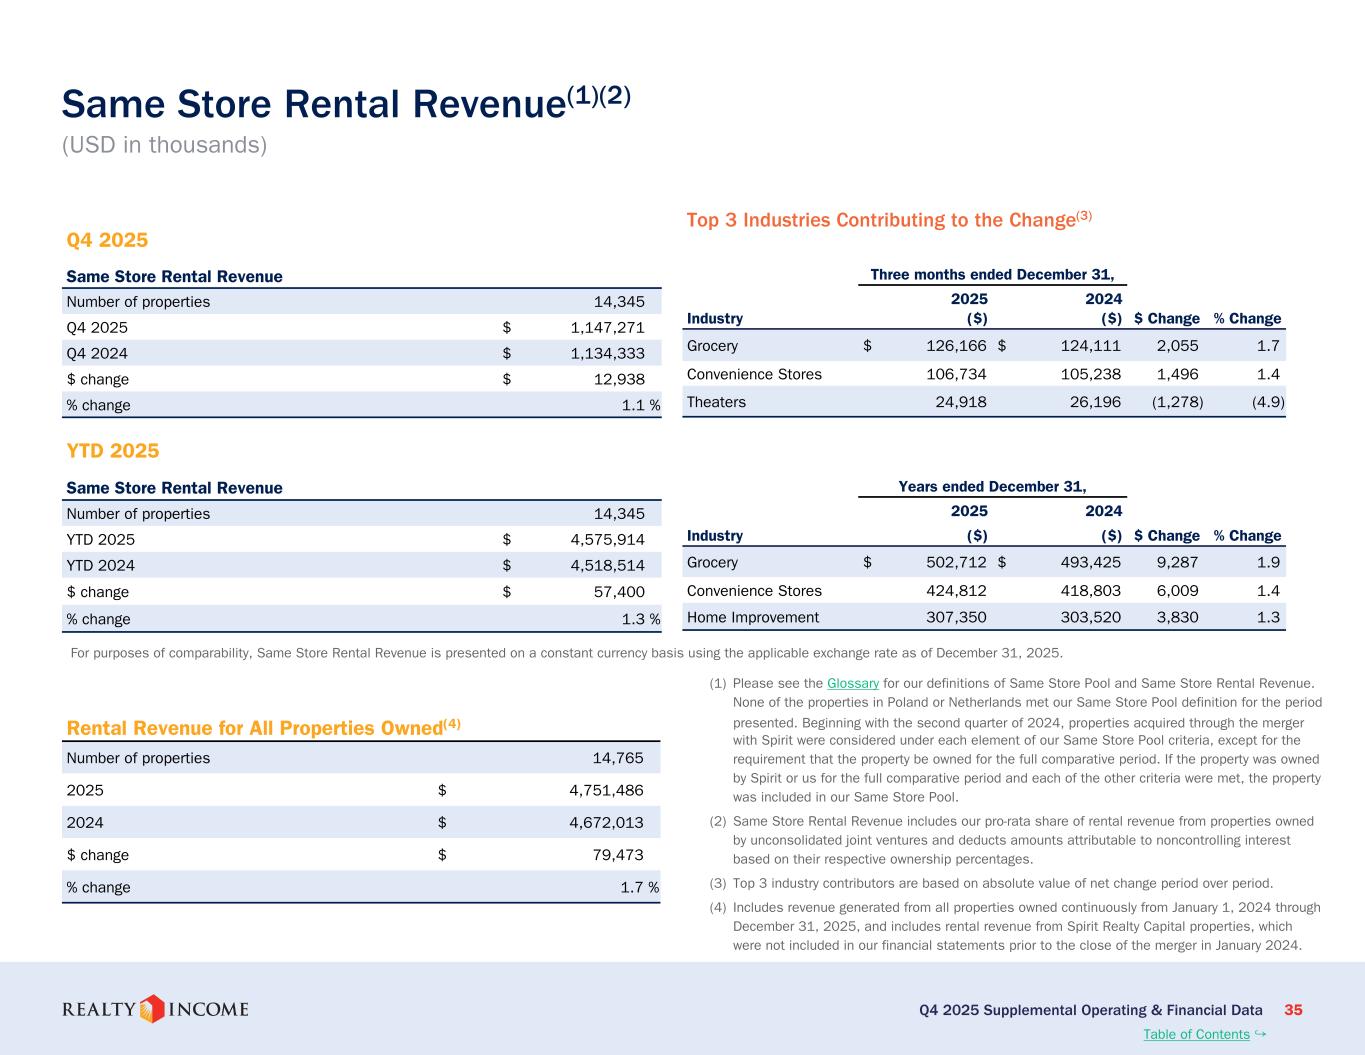
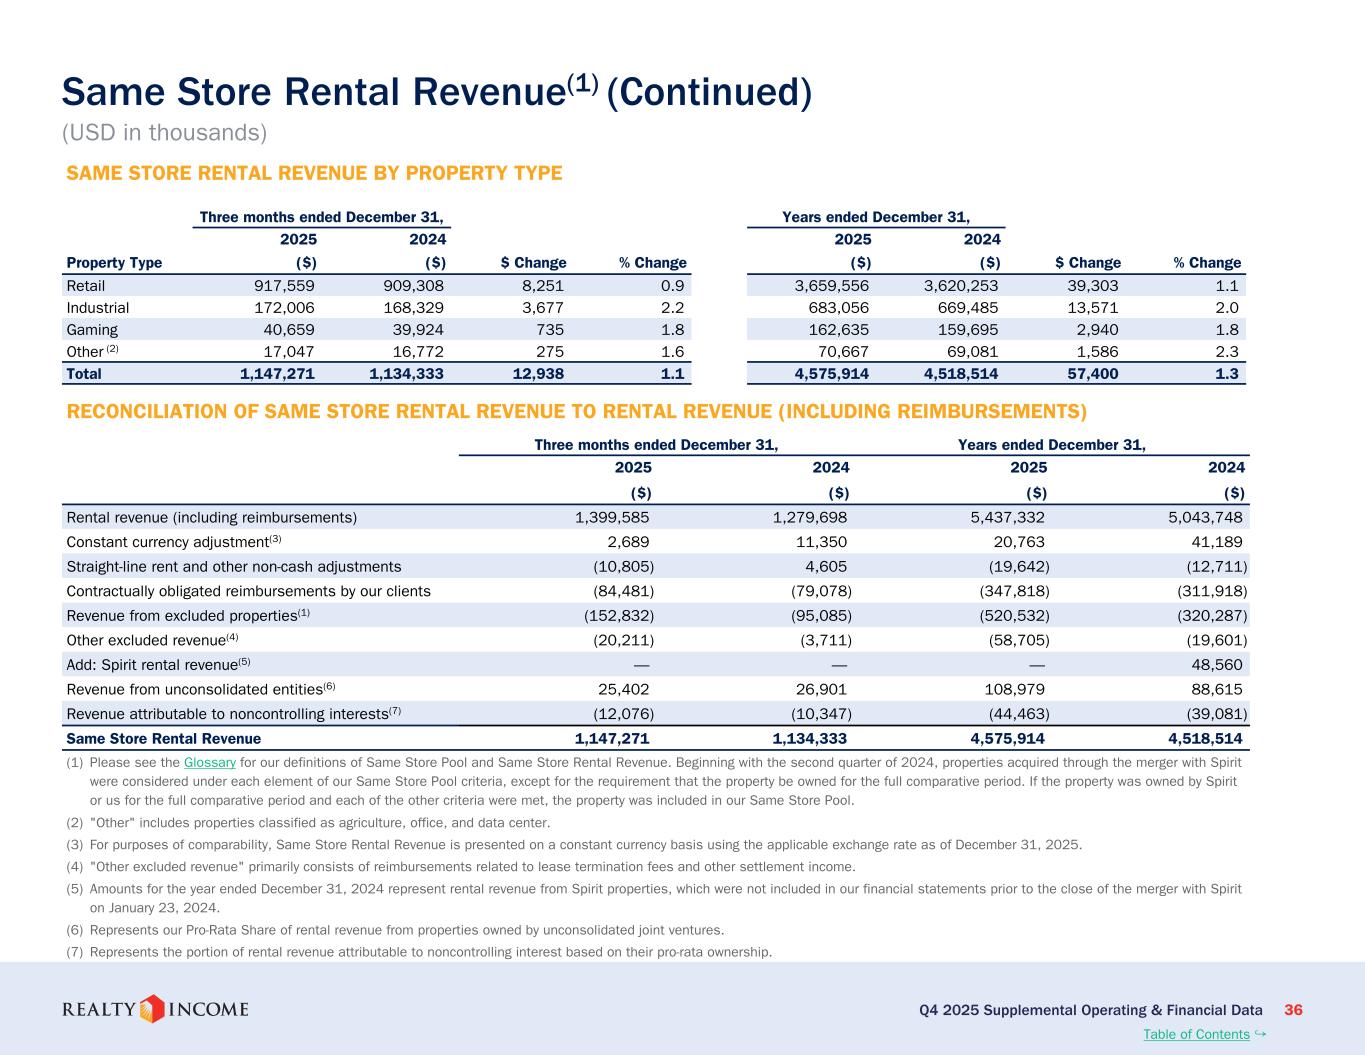
And, Suiz, I'll just add on the same-store side, you know, like the portfolio overall, you know, has about a 1.5% CAGR just on a contractual basis. And so with guidance at 1 to 1.3, that's really just to capture any type of credit-related loss that we may or may not, you know, have in 2026. and a lot of it is associated with just unidentified credit loss that may or may not happen with a sense of conservatism. So that's the biggest contributor that I would also say there are one or two tenets where we did have some restructuring in the fourth quarter, and you're seeing the annualized impact of that through the 2026 guidance number.
Operator
The next question will come from Ronald Camden with Morgan Stanley. Please go ahead.
Hey, just two quick ones. On the sort of the investment guidance, is it still fair to say that, you know, Europe versus the U.S. is where you see the most sort of compelling incremental investments, spread opportunities? Just if you could talk about where the incremental dollars are best spent across sort of geographies and even capital structure would be helpful.
Sure, Ron. If you look at what happened in the fourth quarter, it sort of reversed in terms of where the volume came from. You know, 60%, almost 60% of it was U.S.-centric, 40% was the rest of the world. But prior to that, you know, Europe was driving so much of the volume. And, you know, if you look at the year, you know, 2025, $6 billion of acquisitions, it was dominated by what we did in Europe versus the U.S. But the point I want you to take away is in the fourth quarter and now going into 2026, we are starting to see momentum in the U.S. as well. Europe continues to be, you know, where there's a lot of visibility, and, you know, our core differentiators in terms of what we bring to the table vis-à-vis our competitors continues to lead to, you know, disproportionate amount of volume for us. And I believe that in 2026, we will continue to see that. And now that we've added Mexico as well to the mix, I believe you're going to continue to see, you know, us looking for opportunities, et cetera. And, you know, by sheer math, I mean, the more geographies we're going to start adding, you know, the reason and the rationale behind adding all of these geographies is because we feel like there's a, you know, know, it's helping us increase our time and our ability to source transactions, this shift is a natural occurrence of, you know, our ever-evolving business. So that's the other piece I'm going to leave you with. But the good news that I see and, you know, both Mark and Neil are sharing with me is that momentum is strong in all of the geographies that we are playing in today, and we expect 2026 to be a banner year for us.
And then my second one is just, you know, we've talked a lot about over the last 12, 18 months, whether it be sort of gaming or some of the data centers or some of the retail parks, just trying to get a sense of a pulse of, like, how sort of those opportunities are evolving. Is one playing out more better than the other? Is one falling back? Just are those initiatives coming?
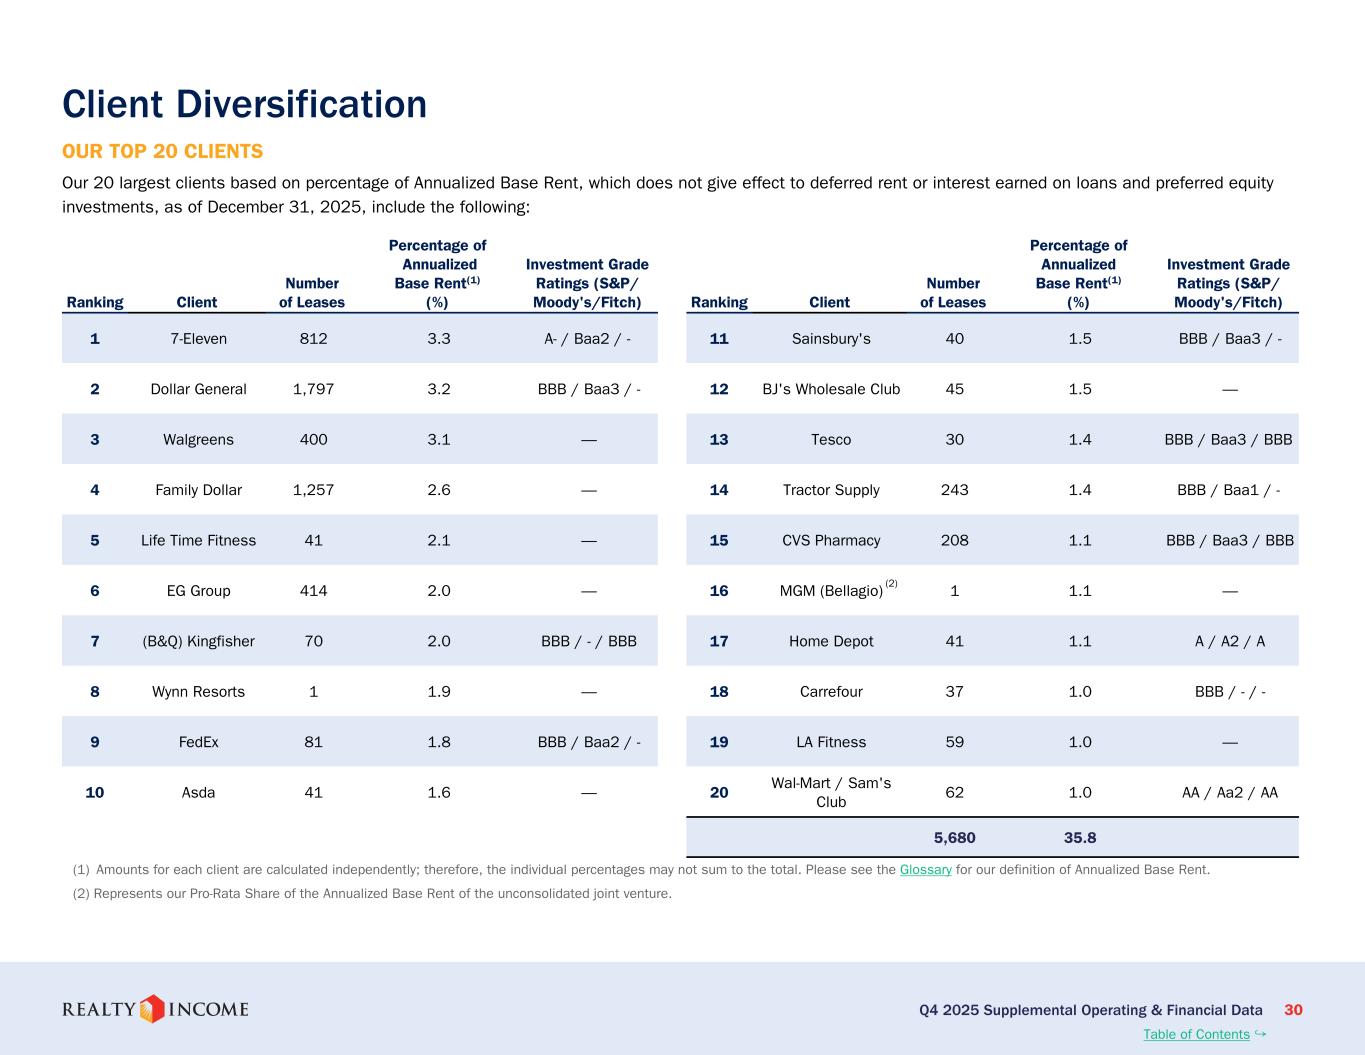
That's a very good question, Ron. And I'm going to try to be very succinct. Look, we said we were going to be super selective on the gaming side. I believe you can see that we've been super selective in terms of where we've invested in gaming. And the underlying asset that we have exposure to are the, you know, one could argue, some of the best assets in the gaming industry. So that's a check mark. They're all performing very well, no surprises. And, in fact, I would go so far as to say that the Boston asset, you know, when we started, had a particular coverage, which was very healthy. But if you look at the coverage today, it is 100 basis points north of where we originally underwrote the asset. So, again, that's been very good. The retail park strategy is really starting to bear fruit. If you look at what our releasing spreads have been, we bought some vacancy, some of the strategic conversations that Neil and team are having with clients who have aggressive expansion agendas for 2026 and beyond, that is starting to manifest in value creation that we had underwritten to, but I believe that most of the plans that are being executed are well ahead of where we had originally underwritten. So that's a double check mark, and, you know, we are the most established name on the retail park in the U.K., and we are well established in Ireland, and we are now starting to see if that same strategy can play out in the rest of Europe. So that's a strategy that has double-clicked as well. Data center continues to be an area that we are very focused in trying to grow, But, again, we've said that we are going to be very selective. We are going to make sure that we are partnering with the best-in-class developers and that the ultimate exposure that we have to assets have the fundamentals that gives us the confidence that they are going to continue to perform beyond that initial lease term. And so, you know, if you look at where we've invested, what we've announced to date, I think you can safely say that that's a double check mark as well. And, look, we want to accelerate the data center investment piece, but we are not going to do it at the expense of, you know, taking on additional risk. So all three of those areas that you mentioned, Ron, continue to be very core to our strategy, and you will and you should continue to expect us to make investments.
Operator
The next question will come from Jay Kornreich with Cancer Fitzgerald. Please go ahead.
Hey, thanks very much. First off, you know, just as you think about your cost of capital, you know, the stock has performed very well year-to-date. And so I guess I'm curious, as you've seen your equity cost of capital improve, does that change how you're thinking about your investment outlook at all and maybe allow you to be more aggressive in acquiring real estate at slightly lower cap rates while maintaining healthy deal spreads? Just curious of your thoughts on that.
So, look, we are very blessed that, you know, the market is starting to recognize the value proposition that we bring to the table. The fact that our cost of capital has improved is an added, you know, lever that we can sort of lean on. But in terms of how we think about underwriting, how we think about risk-adjusted returns, that's on a, you know, that's on an asset-by-asset basis. And the fact that we can finance those assets at lower cost, I think, just lends itself to higher spreads. It is also true that we can pursue assets that, you know, are a little bit lower in the cap rate scale and still be able to get our historical spreads, and that is something that we will look into. But I wouldn't think, Jay, that it changes the way we think about underwriting assets. We are very focused on day one accretion. That is what our, you know, investors are looking for, along with making sure that the overall return profile of that investment is meeting our long-term, you know, hurdle rates. And so none of that changes.
Okay, I appreciate that. And then just following up on the private capital fund, which has the $1.5 billion of commitment so far, should we expect any meaningful bottom-line earnings contribution in 2026 from the private fund, or is the AFO earnings contribution more picked up in 2027?
Jay, in 2026, there will be accretion. You know, the $10-plus million in base management fees is a pretty good margin. You know, the costs that accrue to realty income to generate that, you know, is really the dedicated team that we have, which today is around seven individuals and, you know, some other costs that we bear at the realty level. So you're still seeing margins that are, you know, kind of in the 70-plus percent area on a flow-through basis to realty, and that's because for us we've got a platform that, you know, has 550 employees. And so we don't have to build from scratch the same way other subscale players would have to.
Operator
The next question will come from Bill St. Just with Mizzouho. Please go ahead.
Hi there. Sorry, Bill, that's the first one. Hi, it's Bill St. Just from Mizzouho. Sumit, I wanted to go back to a comment you made earlier. You're talking about another three to five years for all the changes you're making to manifest itself into real growth. So I guess I'm curious if you're suggesting that we should expect a similar growth profile from realty income for the next few years as you're forecasting this year, giving your commentary about spreads, dispositions, lease term fees, and maybe some thoughts on levers that you could pull to perhaps enhance that growth over the near term.
Handel, when I saw the name, I was going to ask you if you had officially changed your name. but I think I'll leave it at that. Look, everything that we do is to make sure that, you know, those three words that I said out loud, trust, reliability, and growth, continue to be associated with realty income. The last couple of years has been a bit of an aberration on that third element. And so we started to, you know, cultivate channels to basically go back to a company that can grow at a level that continues to make us one of the most attractive companies to invest in on the real estate spectrum. So that's the goal, Handel. And I believe that what you're starting to see now are those channels that have gotten over the finish line, and we can talk about it much more. And each one of those has been deliberately thought through to see how can it contribute, you know, to the earnings growth for the business. So that's why we are doing what we are doing. And, you know, I think Linda's question was around a three- to five-year horizon. You know, that's my expectation is that we, within that time frame, not only will these channels have matured, but they're going to start to add meaningful contribution to our growth profile and get us to levels that we've achieved in the past and hopefully even supersede it in certain years where we have outsized growth, just like we have done historically. And so that's the goal.
Operator
And the next question will come from Spencer Glimter with Green Street Advisors. Please go ahead.
Thank you. Can you talk about how the dollar value of deals sourced for the parameters of the private fund compared to that sourced for the parameters of the public vehicle? I'm just curious. I'm trying to get a sense of the opportunity set and what that looks like for each vehicle.
I don't know, Spencer, if I'm going to answer your question accurately. If I don't, please just help me understand what precisely you're looking for. Look, I think what lends itself to the fund is products that don't necessarily meet the public company's day one spread requirements. So they tend to be lower cap rate transactions, but with very healthy growth that more than meets the long-term return profile that our fund business is looking for. But, you know, one of the reasons why we sort of wanted to create this perpetual life core plus fund was to take advantage of, you know, transactions that we were seeing in the market that basically checked every element of our underwriting standard outside of that day one spread. And so that's the kind of product that you should expect to see going in to the fund. Having said that, if you think about the pure math of, you know, transactions that we do, being able to enhance, because realty income will continue to be, you know, a significant owner of the fund, our 20% investment, co-investment in any of these vehicles, in any of these investments, with the benefit of, you know, the management fees that we get on the 80%, that allows us to actually enhance our 20% investment. And so a deal that we may not have been able to meet on a standalone basis with the management fee on our 20%, it allows us to meet those spreads. So this is a flywheel. It's a, however you want to think about it, a setup that we've created that would allow us to do so much more having these different pockets of capital available to us, priced differently, with different expectations, and obviously scale a platform that is built to do so much more. So hopefully that answers your question, but not sure if I
got your question 100% right. Yeah, maybe to clarify, so per the parameters you outlined, which is obviously very helpful, how would you say that the deal volume that realty income looks at or looked at last year, how would you say that that is split between what would be appropriate per those parameters for the private fund, so those low initial yield but longer term growth opportunities, you know, how much of the overall pie that realty income looked at, how much would fit the private fund versus the public vehicle? Yeah, so obviously what we ended
up buying on the public side would sit on the public side, we forego a lot of transactions that did not meet our year one spread requirement, which would have otherwise been purchased had the fund been up and running. And I think in quarters past, we've shared that number with you. I think in the third quarter, I shared a number that was circa 1.7 or 2 billion. I don't quite remember the number, but, you know, that was what we forego, what we, you know, did not pursue because we didn't have the fund up and running and we didn't have that capital available. I think it was $2.2 billion, if I remember correctly, or $2 billion. And so if you look at what we sourced in 2025, it was, by the way, the single largest year of sourcing. It was circa $120 billion. You know, there was quite a bit. in that mix, you know, that could have lent itself to the fund investing, which we had to pass on because we didn't have this vehicle up and running. So there's plenty to do, and obviously not all of that $120 billion was U.S. I think 55 percent of that volume was in the U.S., and 45 percent was Europe, so our fund is only U.S. centric, so we can, you can make the adjustments appropriately, but it is, it is absolutely true that there was a lot of stuff that we forego on that we would have pursued had we
had the fund up and running. Yeah. Okay, great. Thank you for that clarification. And then is there any cost associated with raising capital for this fund as of yet? I'm just curious if you are using or intend to use a marketing team, like an outside marketing team or a consultant as you
continue to raise capital? Hey, Spencer. So, we have, you know, discussed in 8Ks and press releases past that we do use a placement agent. You know, I don't want to share the exact percentage of the fee, but I will share that it's inside of what we would, you know, pay on the ATM and certainly inside of what we pay on a public equity overnight. So, much more efficient to raise
capital via this channel and thank you and beyond October Spencer this will be something that we're going to bring in-house and so this will become part and parcel of our you know continuous fundraising given that it's an open and
Operator
perpetual life fund excellent thank you the next question will come from West Galladay with beard please go ahead hey everyone maybe just following up on that
last question. You're going to be able to source the cost of equity a little bit cheaper. I guess maybe could you put a parameter around how much the incremental spread could be for your investing?
Do we not have that in the investor presentation?
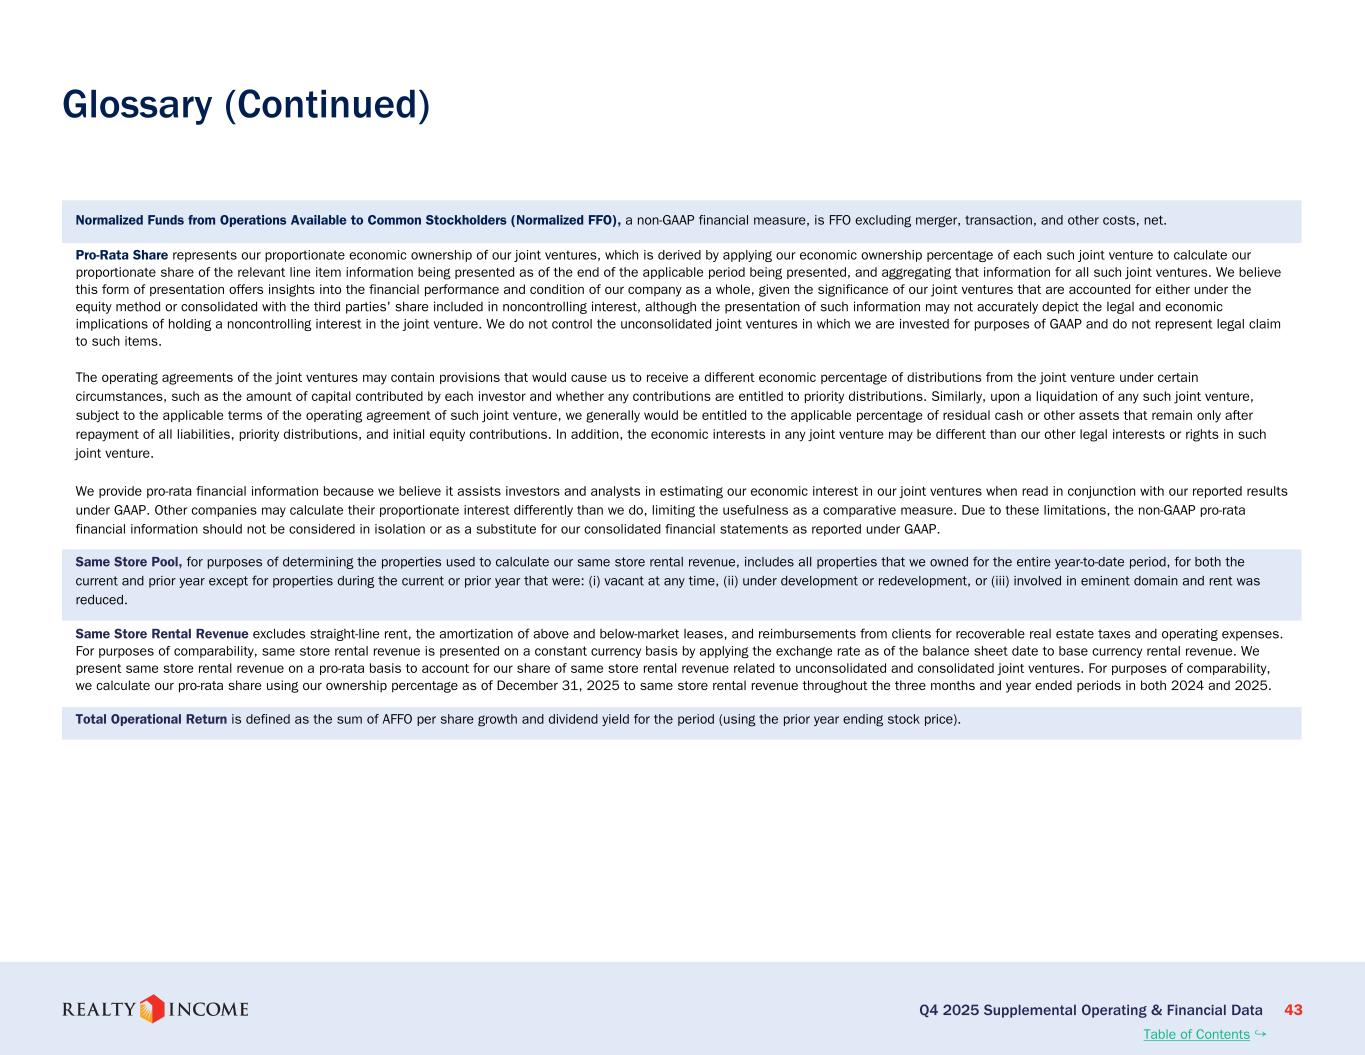
Wes, it's Jonathan. One thing that I'll share, we do have this in our investor presentation where if you kind of do the math and if you assume that realty income is a 20% co-investor in the fund utilizing our same 35% LTV ratio when we go out and finance transactions. And let's just assume for round numbers we're getting about a point on the 80% of equity we're managing on someone else's behalf. What would otherwise be a six cap would be closer to eight and a half. And so this is all about amplifying our return on invested public shareholder capital. And that's how the math plays out and so that's a way for us to generate more bang for the buck if you
will okay fantastic and then you have the u.s. open-ended core fund is there another opportunistic fund you can do later on that's a forward-looking
comment Wes we are not in a position to answer that right now but we are very happy about the u.s. open-ended core plus fund that we have in place we feel super excited about that. Our goal right now is to make that as big as we possibly can.
Okay. Thanks for the time.
Operator
The next question will come from Jim Hammer with Evercore. Please go ahead.
Hi. Good afternoon. Thank you. Does realty income have a sense of GIC's annual dollar investment appetite for net leased investments, whether owned or credit structured?
Well, I guess my second question, really the related question is, Is realty income prohibited from pursuing other programmatic co-invest programs away from GIC with other sovereign wealth funds, insurance companies, you name it? I'm just trying to get a sense of the scale of that sort of TAM or opportunity for you as you think about it.
We are not prohibited from pursuing partnerships with other sovereigns or other sources of capital. But there is no need for us to, you know, look for other sources within the built-to-suit industrial development that we have in place with GIC. Like I said, they are, you know, they're very positively inclined towards the net lease space. If you recall, Jim, they ended up buying store. And this is a continuation of their overall strategy. And I don't want to speak on behalf of GIC. That's a question that's best answered by them. But we are very excited about this programmatic JV that we've put in place. And I believe Jonathan already mentioned this, but it's worth repeating. This is not a one-and-done deal. The $1.5 billion is the initial commitment. It's programmatic in nature. And the hope is that we can grow that co-investment thesis because there's value creation for both parties. You know, they have certain requirements given FERPTA, and we have the ability to help, you know, recognize earnings during the development phase. This works, and we are able to both lean into our own sourcing channels to make this as big as possible. I think that's what is so appealing about this particular relationship.
Operator
Got it. Appreciate it. The next question will come from Jason Wayne with Barclays. Please go ahead.
Hi, good afternoon. You said a portion of credit loss assumed and guidance comes from identified properties. So, can you give some color on which tenants or industries are known today, maybe which are a risk to bring to the high end of the range for the rest of the year?
Yeah, so on the identified side, you know, I'm not going to name a client or tenants, but I think from an industry perspective, you know, there's a couple restaurants, restaurant chains that would be part of that. More broadly speaking, you know, again, that's the minority of, you know, the 40 to 50 basis points. And so the unidentified piece is considerably larger. And, of course, we don't have any type of color by definition, given that it is unidentified.
Okay. And then just does lower year-over-year occupancy guidance include any lease terms so far in the first quarter? And what's a good run rate for quarterly lease termination fees?
The answer to the first question is no, nothing material. From a quarterly run rate standpoint, look, this is very opportunistic, episodic. It's very difficult to say that this is going to be something recurring. But I think given just the proactiveness of our team, as I said in the prepared remarks, it is something that you can expect to be, of course, a 12-month period, something in line with this call of $30 million to $40 million that we discussed. But obviously, it's subject to change as conversations are ongoing and the analysis continues to be done by several different functions within the organization.
Operator
The next question will come from Yupal Rana with KeyBank. Please, go ahead.
Great. Thanks for having a question. Sumit, I appreciate all the comments on the potential to raise equity. You know, could you talk through your ATM strategy today, given the improved cost of capital? You know, there was no ATM issuance subsequent to quarter end, and the share price has had a nice run recently. So, I'm just wondering what it would take to issue equity to the ATM today.
Hey, Uphal. This is Jonathan. I'll say this. Over the last 30 days, you know, we've averaged around $400 million a day in trading volume in our stock. If you look back a year ago, that was around $250 million. And so for us, you know, we've got multiple ways where we can raise equity. A lot of it, you know, we already have in place, over $700 million of unsettled equity right now. You know, we have $400 million of cash as of the end of the year. We have over $900 million in free cash flow that we're generating on an annual basis now. We talked about the disposition activity, And, you know, that could easily be something very similar to this past year, over $700 million of equity-like proceeds. We've got, you know, $400 or so million of uncalled capital for the fund. So when you start to take away all of that, and when you look at an $8 billion investment guidance number on a leverage-neutral basis, that will require, you know, roughly $5 billion of equity. But what I just highlighted was around $3 billion. And so you can do the math. If the delta is two and we're averaging $400 million a day in trading volume in the stock, we can be a very, very small percentage of a day's trading volume, barely impact the stock price of it at all, and raise more than enough to that $8 billion and then something.
Okay, good. That was really helpful. And then maybe you could update us on your watch list today. And, you know, could you update us on your Red Lobster exposure given, you know, the back of the headlines that potentially shut down some locations?
Yeah. So, Opal, our watch list is right around four-point credit watch list is 4.8%. With regards to Red Lobster, you know, it's certainly not in our top 20. And so it's not significant enough for us to, you know, really have much of a comment around them. We are watching them closely. They are trying a few different things, but it is not a significant piece of our business anymore. And so all I can say is, you know, they are trying a few different things. I believe they've rationalized their menu. They've reduced that by 20%. LobsterFest is coming up, along with a few other promotions. So we'll see. And I think we are following this company closely, but like I said, it's not a significant portion of it.
Operator
The next question will come from Greg McGinnis with Scotiabank. Please go ahead.
Hey, this is Greg McGinnis with Scotiabank. I haven't moved. Sumit, I wanted to go back to your comments regarding the other investment avenues maturing and getting back to a more historical level of growth in three to five years, especially considering many investors are not necessarily looking for a long-term wait-and-see story, which could pressure the equity cost of capital. What does success or maturity look like with regard to those new avenues, and should we expect to see that 3% growth in the interim or a more modest, ratable improvement back to the
5% over time? Greg, what I'd like to do is just show what we are capable of doing. We've come out with an earnings guidance at the beginning of the year, and we have all these avenues that we've talked about and allow these avenues to mature, and let's see how that manifests in a higher growth rate. For me to give you a blow-by-blow in terms of what my expectation is, you know, over the next three months, six months, in terms of how this growth rate is going to accelerate, I don't think is something that I'd be able, I'd be, you know, viewed as a prognosticator if I can do that, but my long-term view is that all of these channels will manifest in a growth rate that is much more commensurate with what we've achieved historically. The How long does it take? You know, I hope sooner than later, but I can't give you an answer.
Okay, that's fair. And just to follow up, you know, you mentioned that the platform's capable of around 10 billion investments a year, close to what it's achieved before. Is that enough to achieve these growth goals, especially as the company has gotten larger, or are you anticipating investing in G&A and growing, you know, how much the platform's capable of?
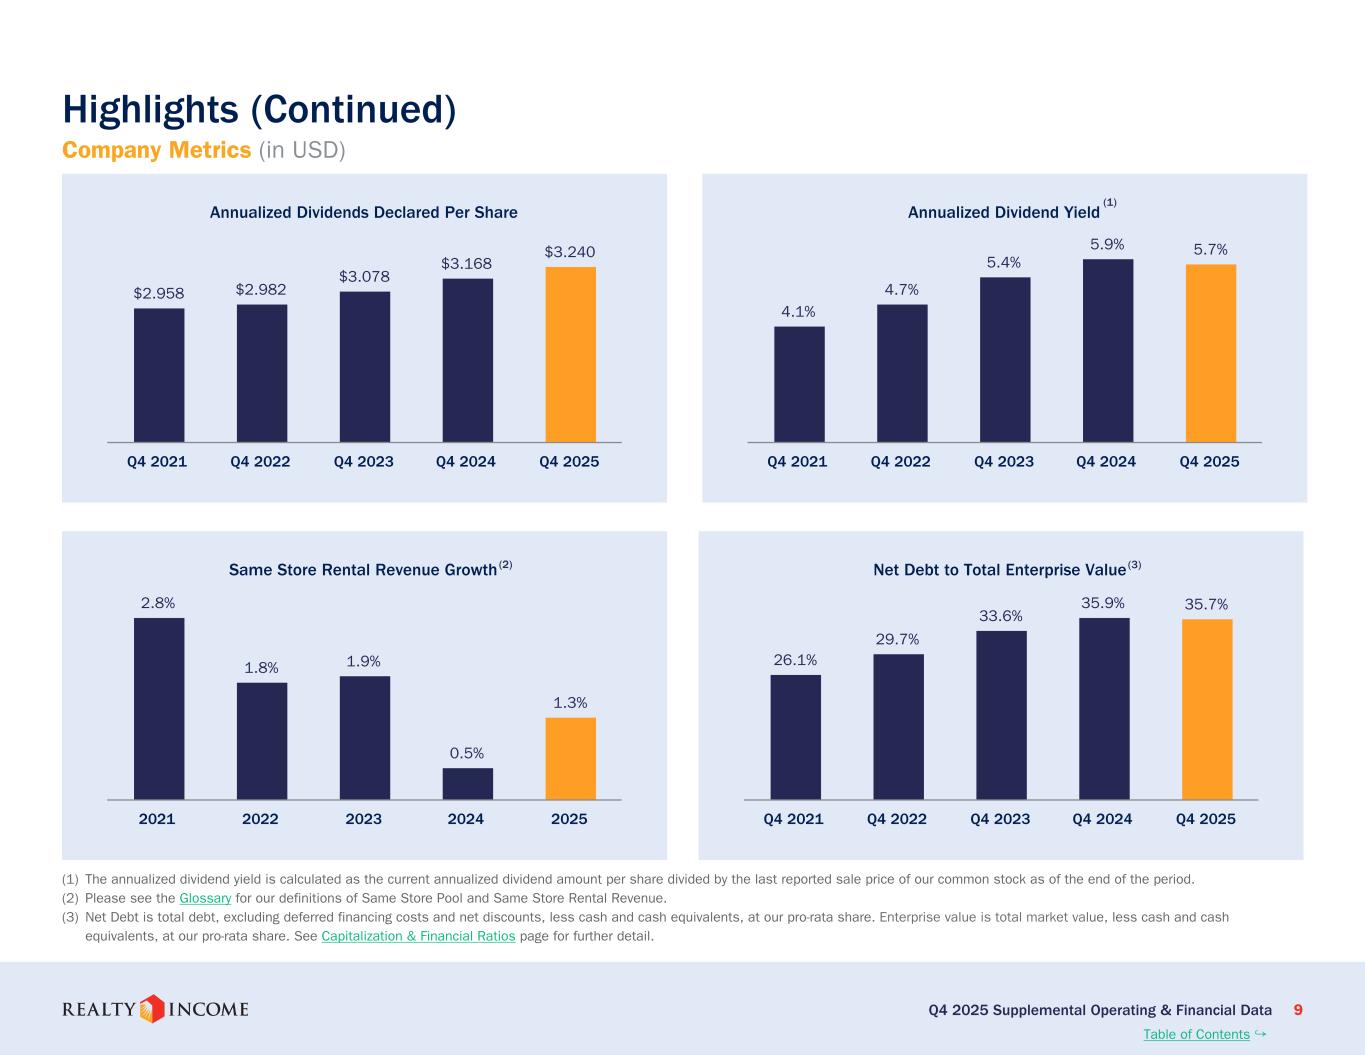
Yeah, that's a good question, Greg. And by the way, you know, when we talk about growth rates and earnings, you know, we shouldn't forget that we are the monthly dividend company. And our dividend, you know, as of the end of last year, beginning of this year, was still 5.7%. And so that's the dividend yield, and that continues to be something that we distribute on a monthly basis. So it's very much part and parcel of the total return story that's, you know, associated with realty income. With regards to, you know, what is this platform capable of, I think it's capable of a lot more. You know, what I was pointing out to was if you looked at what we did on an organic basis in terms of investments in 2022 and 2023 or thereabouts, was in that $9 billion, $9.5 billion zip code. And it was with a much smaller team, with fewer geographies, and we still had fewer after types that we were investing in at that point in time. So we have scaled the team. We are in more geographies today. Our cost of capital is improving. I believe that our team is capable of doing a lot more investments, just having created a much larger time for ourselves today vis-a-vis where we were three years ago. And that's where the scale benefit comes in. But what I'm saying is not mutually exclusive from, you know, what Jonathan said, which is selectively we will continue to look for the right people to drive certain areas of our business. You know, and that is an investment we feel very comfortable making as we become a company that has defined all of these different channels of growth. So, you know, you should expect both, us to do more and us to continue to invest very selectively in talent that can help us drive our…
Operator
Your next question will come from Eric Borden with BMO Capital Markets.
please go ahead. Great. Thank you. How should we be thinking about the recapture rate on the 3% of ABR expiring in 26 relative to your long-term average? And should we see an acceleration over time from your releasing efforts across your retail park exposure? I, again, you know, every
year is different. It's a function of what type of assets are expiring. Some assets lend themselves to higher growth rates in their exercising of the options versus others. But look, if you look at historically what we've achieved over the last four, five, six years, it has been north of 100 percent, closer to 103, 104, 105 percent. And my expectation is that the team will continue to meet, if not exceed those numbers. But it is, you know, it is very difficult to compare one year over another, just given the makeup of the expirations that are taking place. You know, so I'll just leave it at that.
Okay, thank you. And then you currently have 173 properties available for lease. You know, could you just provide a little bit more detail on what percentage is slated for disposition versus the portion that you believe can be released today?
Obviously, if you looked at that same number at the beginning of last year, that was closer to 220 or 230 assets. So, you know, capital recycling, making sure that we get to resolutions quicker so that the holding costs are much lower, those are all elements of a very proactive asset management team that we have in place today. Having said that, we are very comfortable, you know, holding on to a certain number of vacant assets because we are either trying to reposition it or we are trying to find the right client who can enhance the ability to recapture rents, et cetera. So, you know, in a company that has north of 15,200 assets, you know, having 170 assets vacant, I think you could view that as what the natural rate of vacancy ought to look like. You know, that's circa 1%. And I'm going to go a little bit more and say, you know, we are comfortable with this 1.5% to 2% of assets that we have that we are working on, either to dispose of or to reposition. And so I think this 170 is a smaller number than if you were to compare it over the last couple of years, what you had seen in our portfolio. But I view that as a natural rate of –
Operator
The next question will come from Teo Okasanya with Deutsche Bank. Please go ahead.
Yes. Good evening, everyone. So, again, just looking at the portfolio today, again, you know, thousands of assets across, you know, hundreds of companies across several regions. And it just feels to me like, again, given the nature of what you guys are doing, AI somehow should be able to create much more efficiencies in your overall business, whether it's on the underwriting side, asset management side. Just kind of curious, you know, how you guys are thinking through the use of AI in the business and how, if I may use the word AI competency or supremacy, could create additional competitive advantages versus your peers.
It's in line with a question that was asked, Tayo, and I intentionally have it brief because this is an entire discussion in its own right. What I will share with you is we are a very highly literate, technology-driven, data-driven organization. And so, you know, AI absolutely is going to be part and parcel of every element of our business. It already is on proprietary tools that we've created. It helps us on the sourcing front. It helps us on the underwriting front. It helps us on making asset management decisions, et cetera. And that's just one piece of it. But when you think about an organization and you think about the direction of drift, where is AI really going to sort of make monumental, you know, positive scale benefits for organizations? It doesn't start on the front end with the tools. It starts with the data. And it starts with creating an organization that has data that is very clearly the interrelationships between those data is very well established. Then data that gets created by this input data is also very well not to come up with to overlay will become an even more integral part of every function within a real estate company. There is no doubt in my mind, and we, I believe, in my heart, are best positioned on this journey and the level of sophistication from a technology standpoint and how this company and the management team thinks about technology as a – I'm just touching on things. Each one of these areas that I've talked about, we can spend two hours just having a detailed discussion, But we are well on our way, and, you know, there are certain tools that's very much part and parcel across the entire business, you know, that we already have, such as Co-Pilot, et cetera. And then there are other very specific tools that are being used by vertical elements of our business to help drive scale. But that is still just scratching the surface of what AI will do, you know, three to five years from now.
Operator
This concludes our question-and-answer session. I would like to turn the conference back over to Sumit Roy for any closing remarks. Please go ahead.
Thank you, Chuck, for helping facilitate this conference, and thank you, everyone, for participating. I look forward to seeing you at some of the upcoming conferences.
Operator
The conference has now concluded. Thank you for attending today's presentation. You may now disconnect.