Operator
Good day, and welcome to the Realty Income Q1-2026 Earnings Conference Call. All participants will be in listen-only mode. Should you need assistance, please signal a conference specialist by pressing star, then zero. After today's presentation, there will be an opportunity to ask questions. To ask a question, you may press star, then one on your telephone keypad, and to ajar your question, please press star, then two. We do ask, do you please limit yourself to one question and one follow-up? Please also note, today's event is being recorded. I'd now like to turn the conference over to Alex Waters, Vice President, Investor Relations. Please go ahead.
Thank you for joining Realty Income's first quarter 2026 results conference call. Joining us on the conference call today are Sumit Roy, President and Chief Executive Officer, Jonathan Pong, Chief Financial Officer and Treasurer, Neil Abraham, Chief Strategy Officer and President, Realty Income International, and Mark Hagan, Chief Investment Officer. During this conference call, we will make certain statements that may be considered forward-looking statements under federal securities law. The company's actual future results may differ significantly from the matters discussed in any forward-looking statements. We will disclose in greater detail the factors that may cause such differences in the company's Form 10-Q filed today with the SEC. We will observe a one-question and one follow-up limit during the Q&A portion of the call to ensure that everyone has an opportunity to participate. And with that, I would now like to turn the call over to our CEO, Sumit Roy.
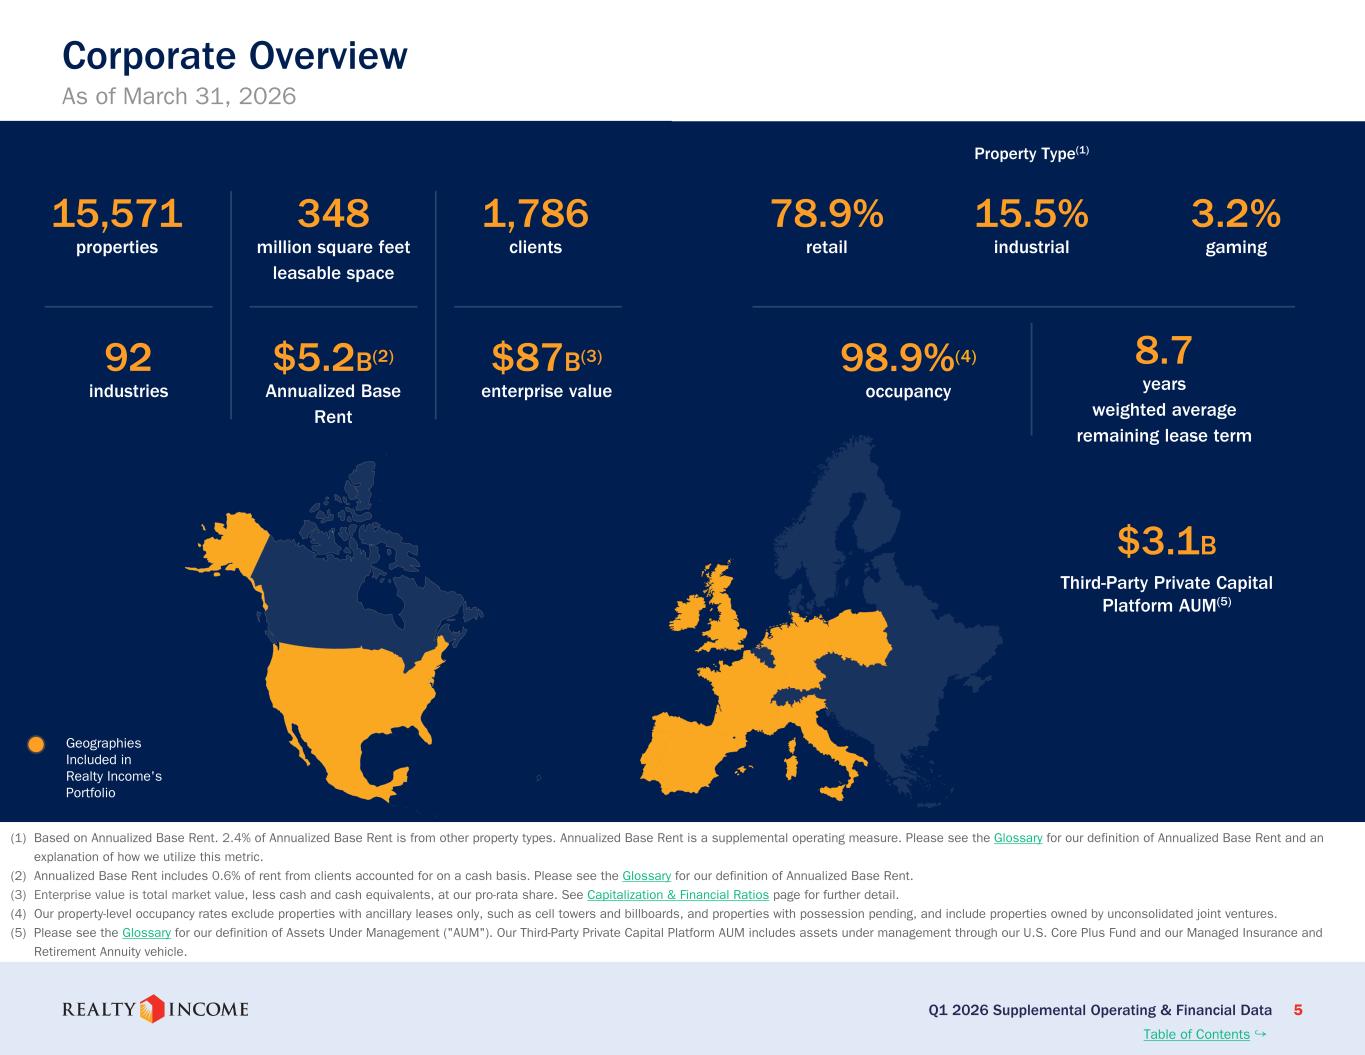
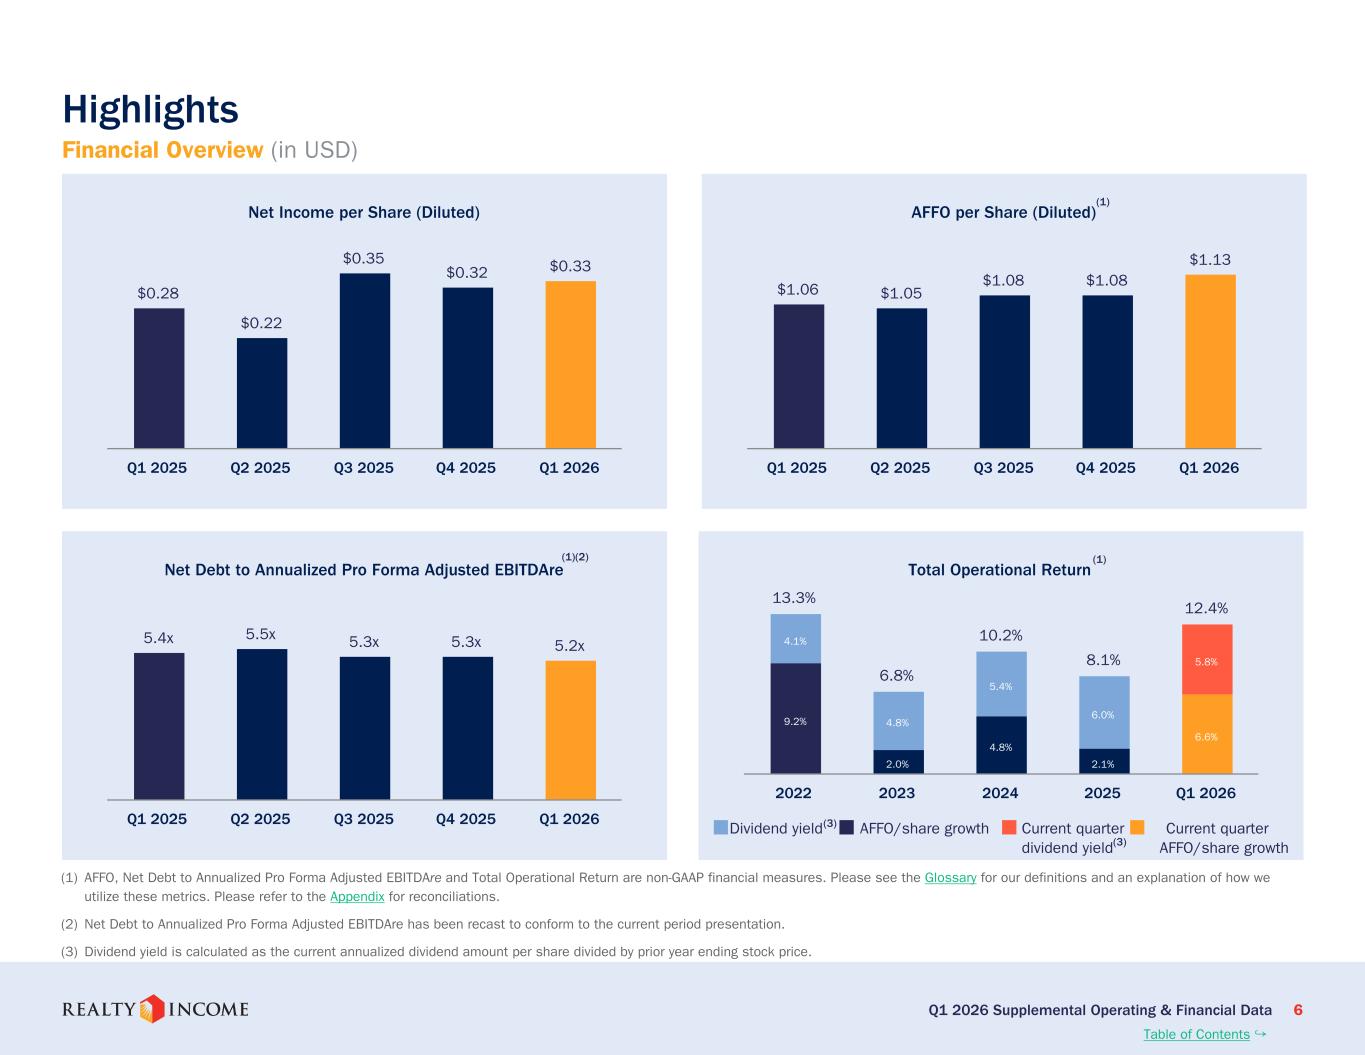
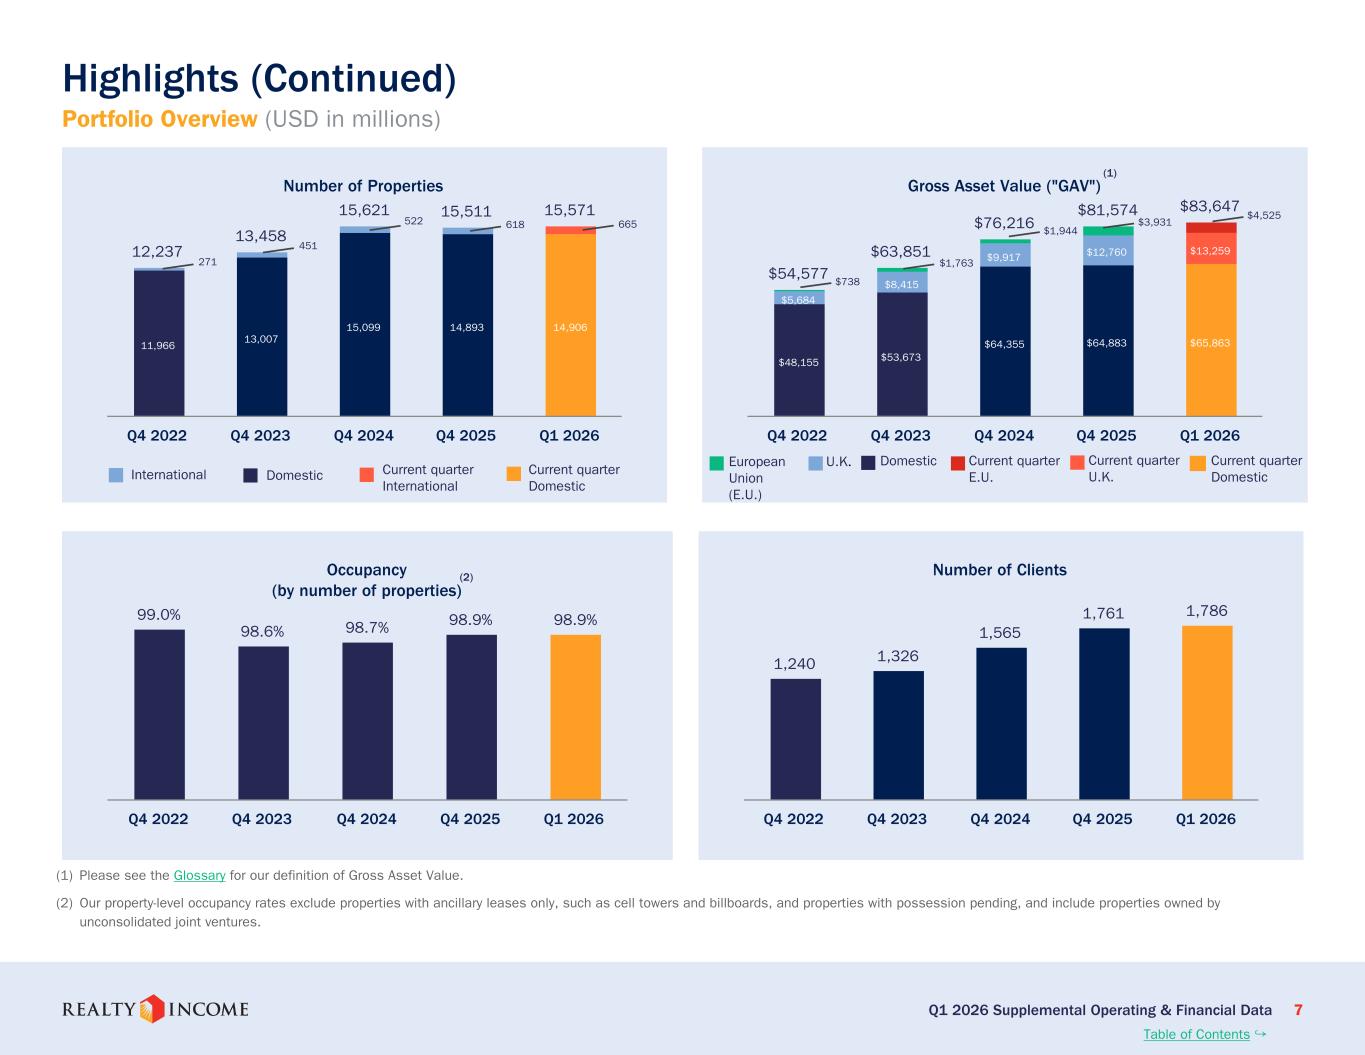
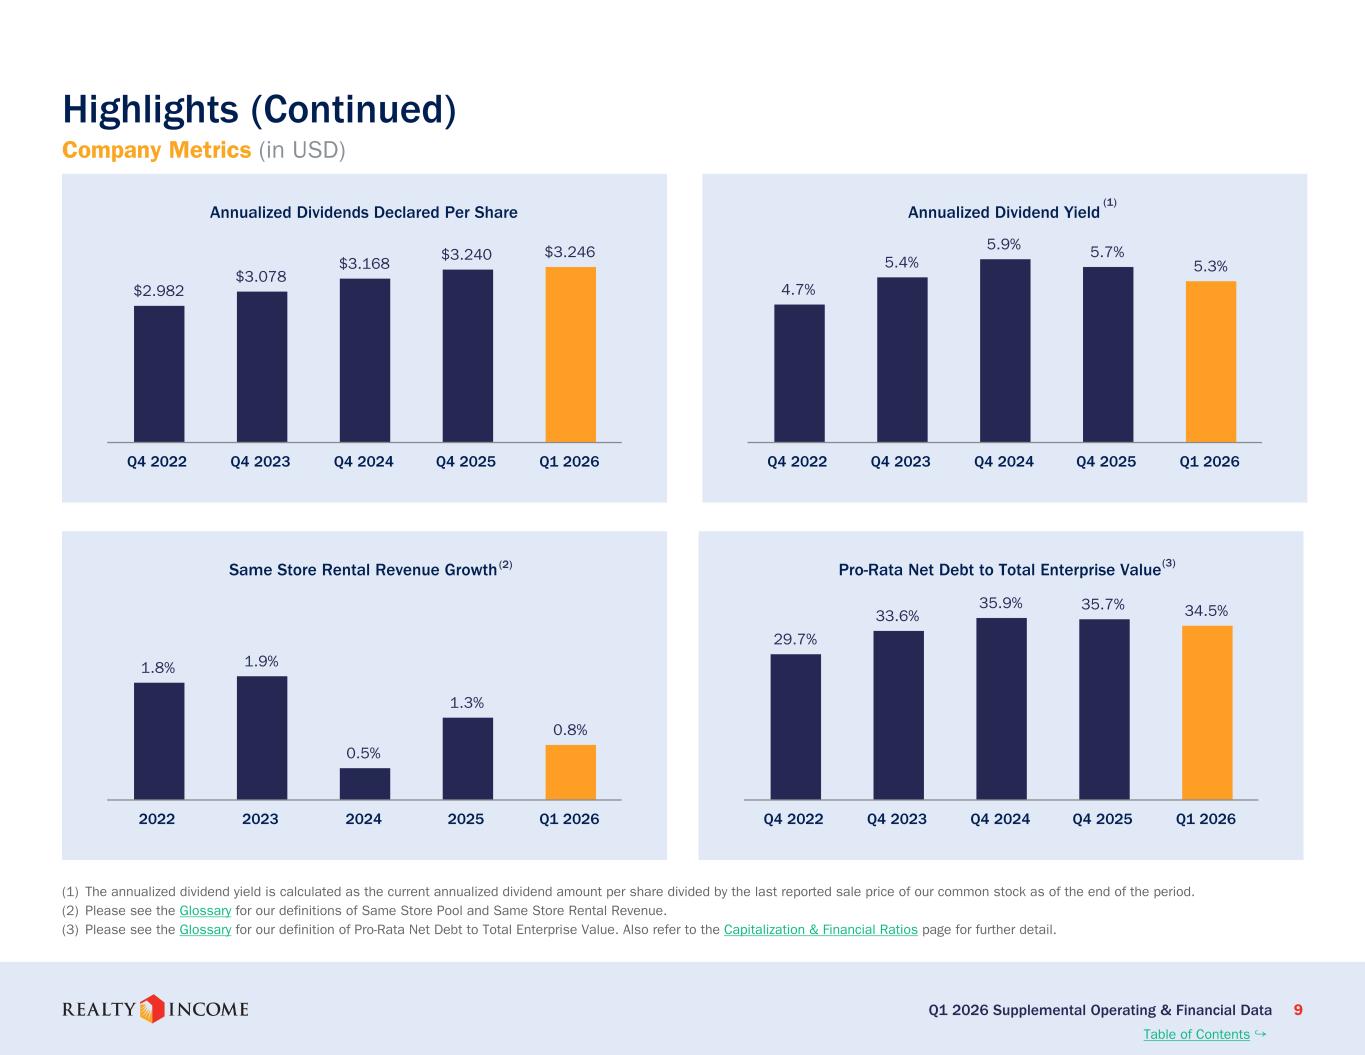
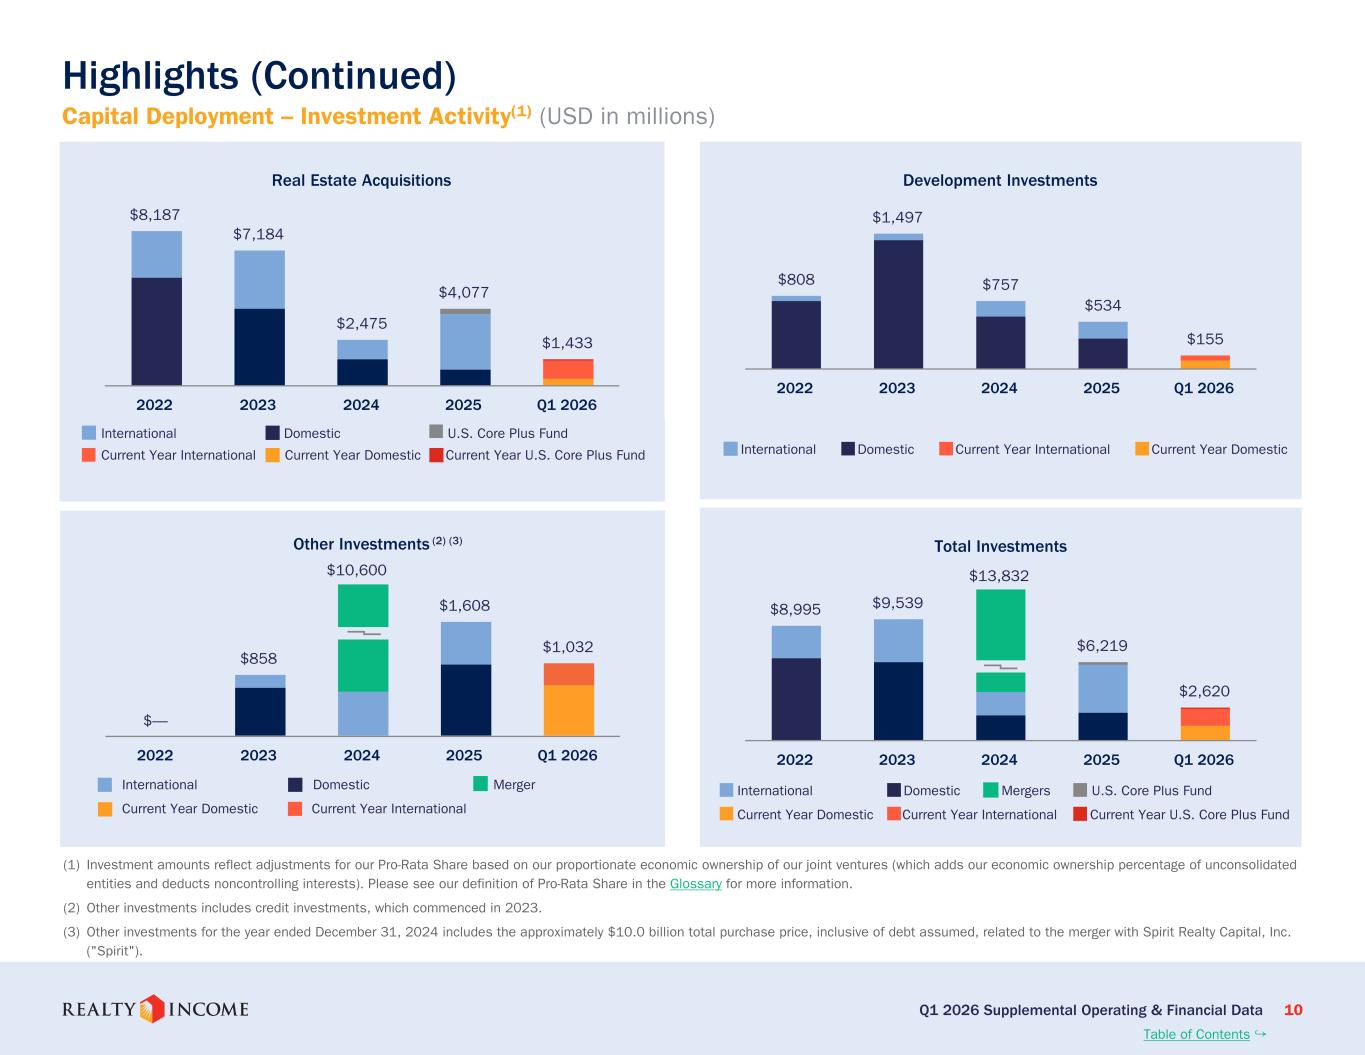
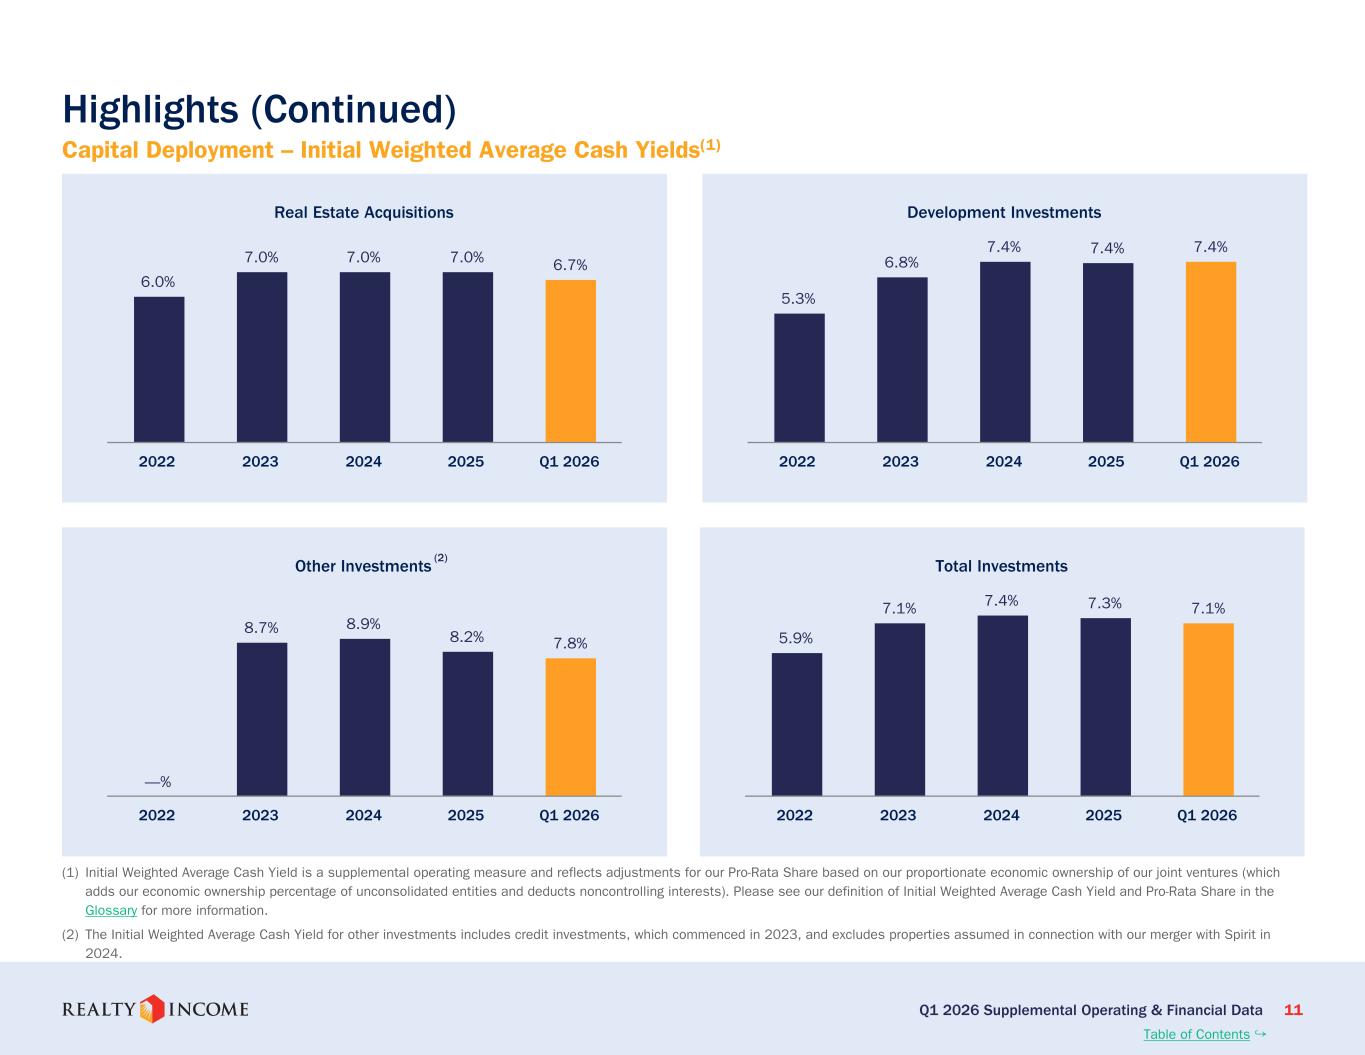
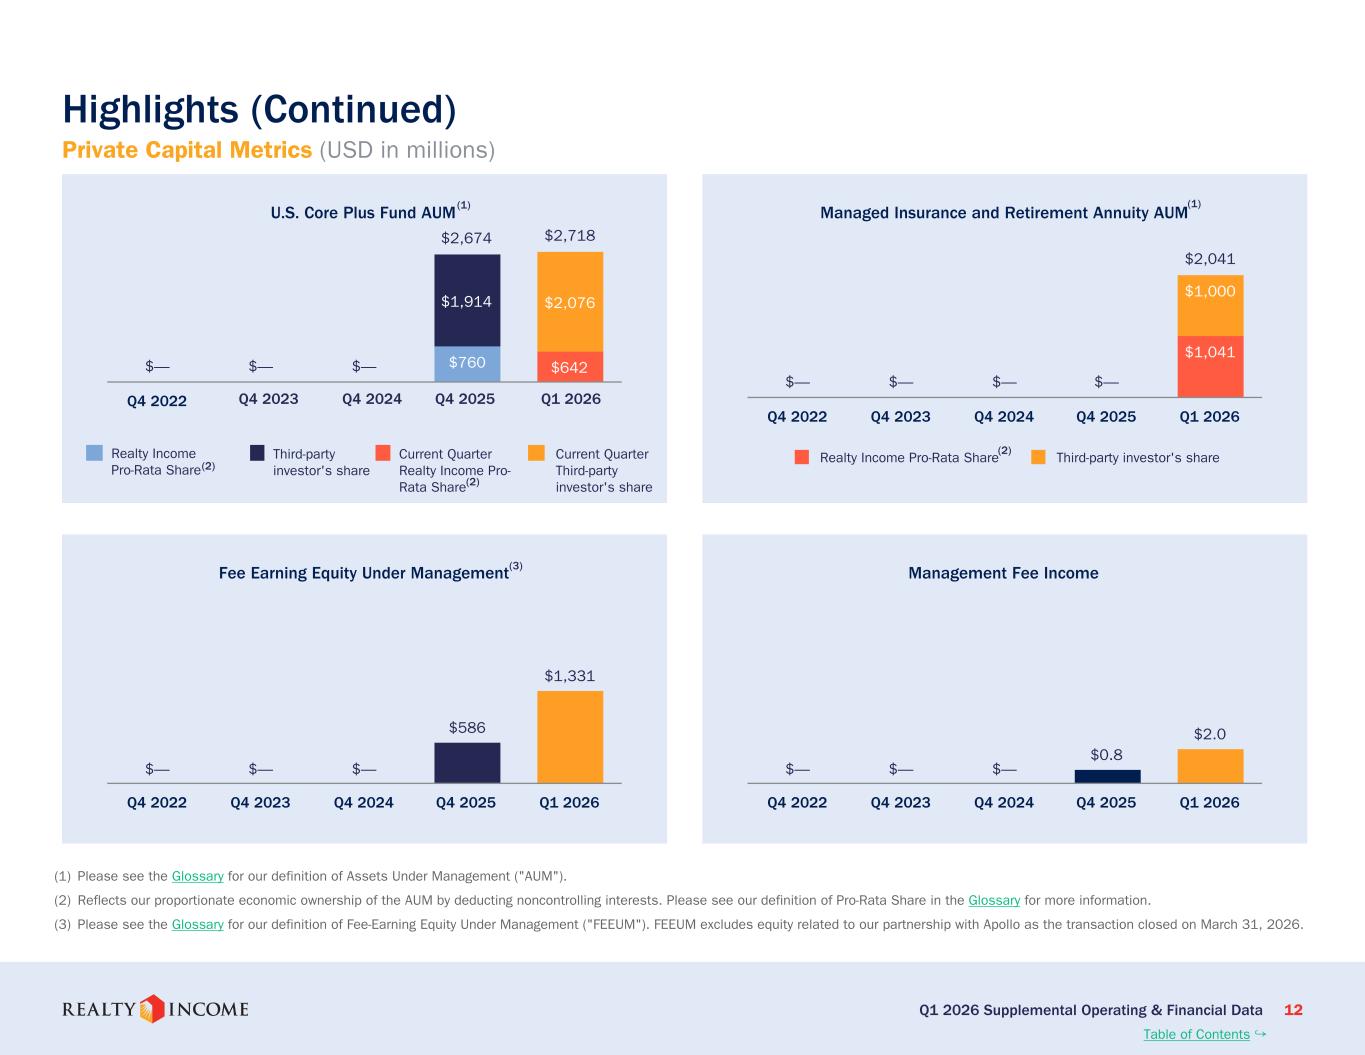
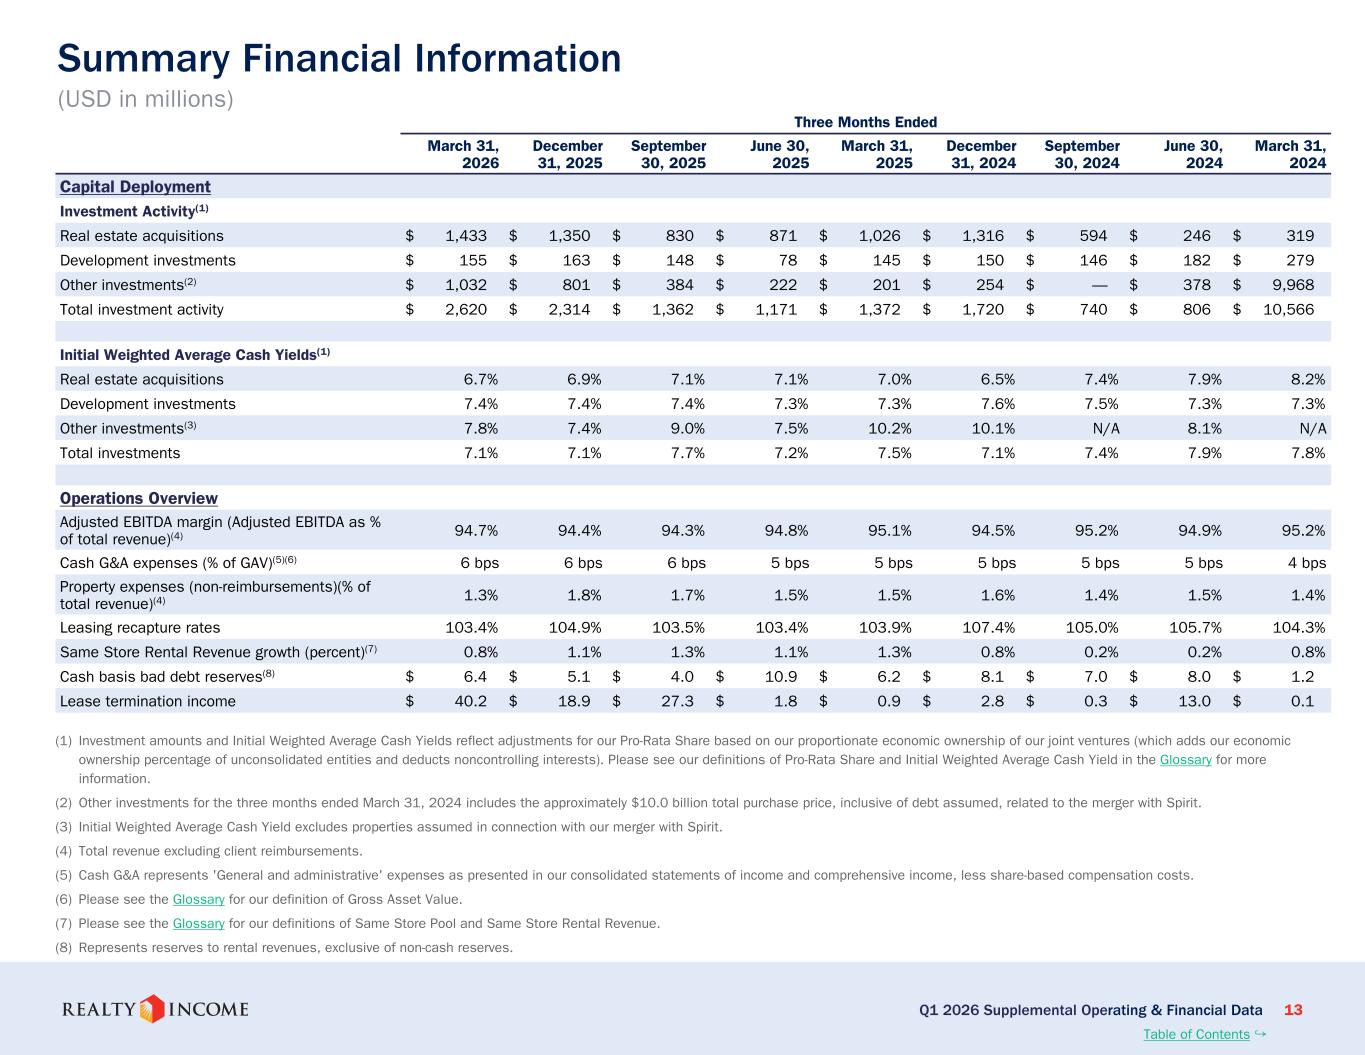
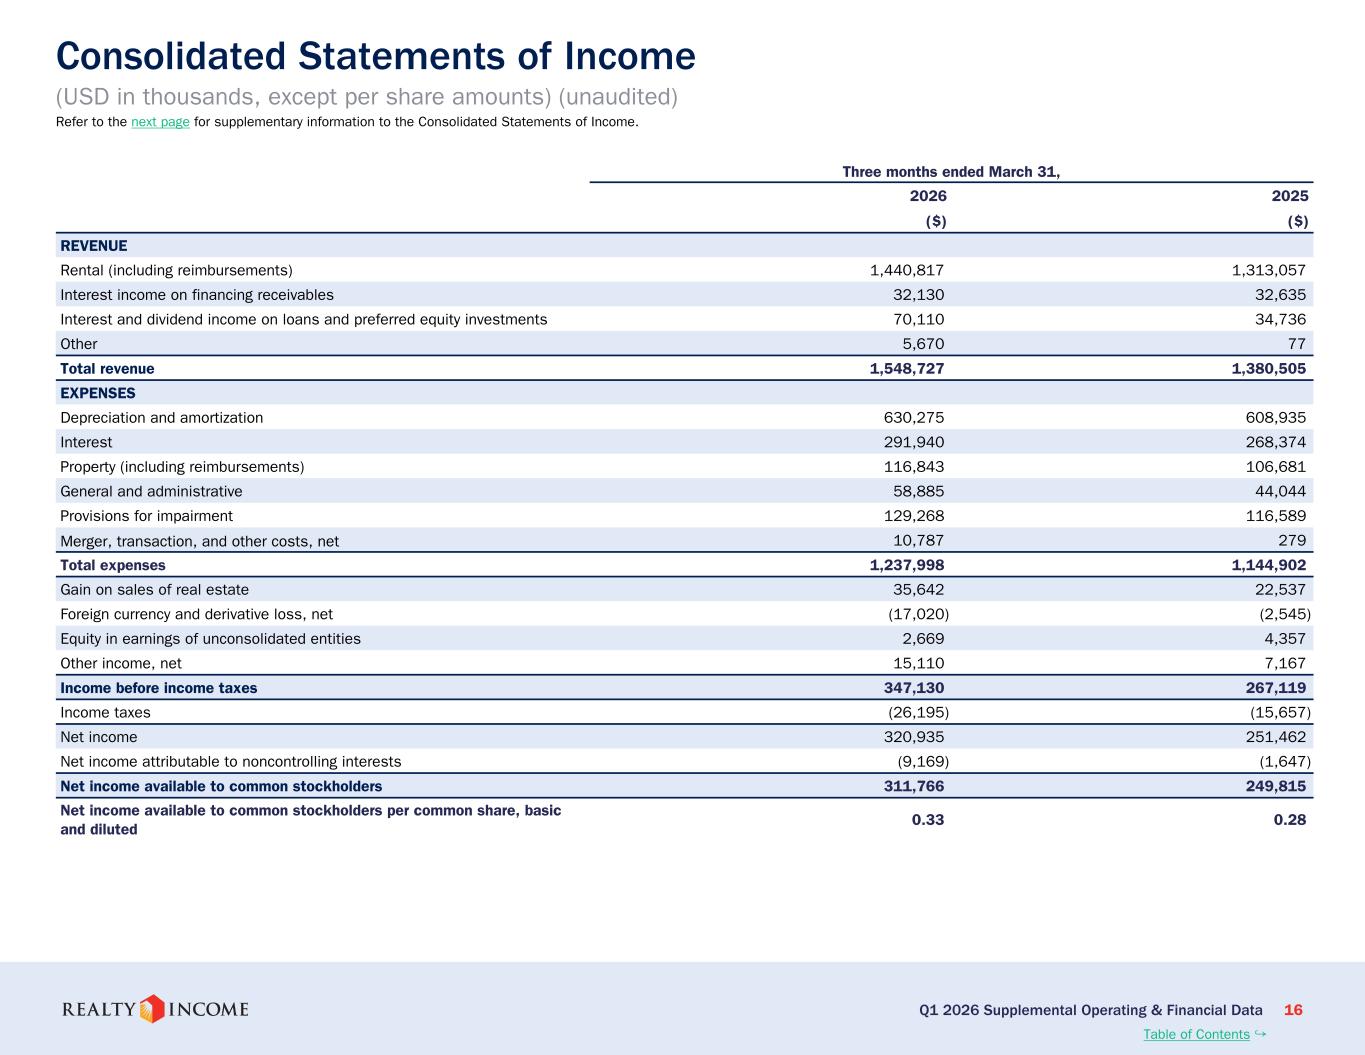
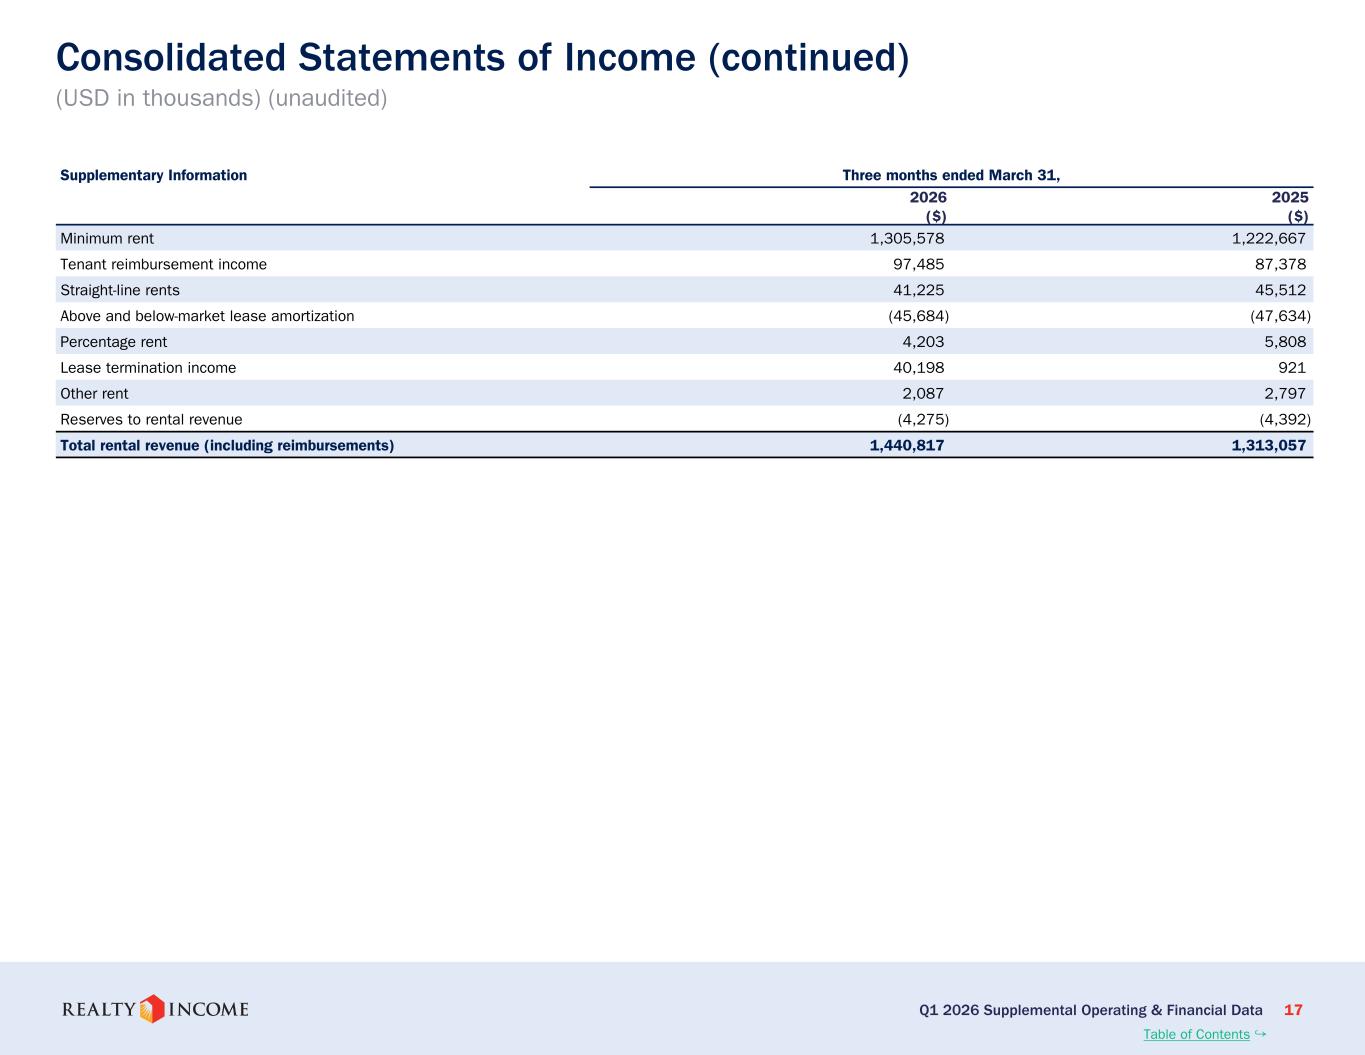
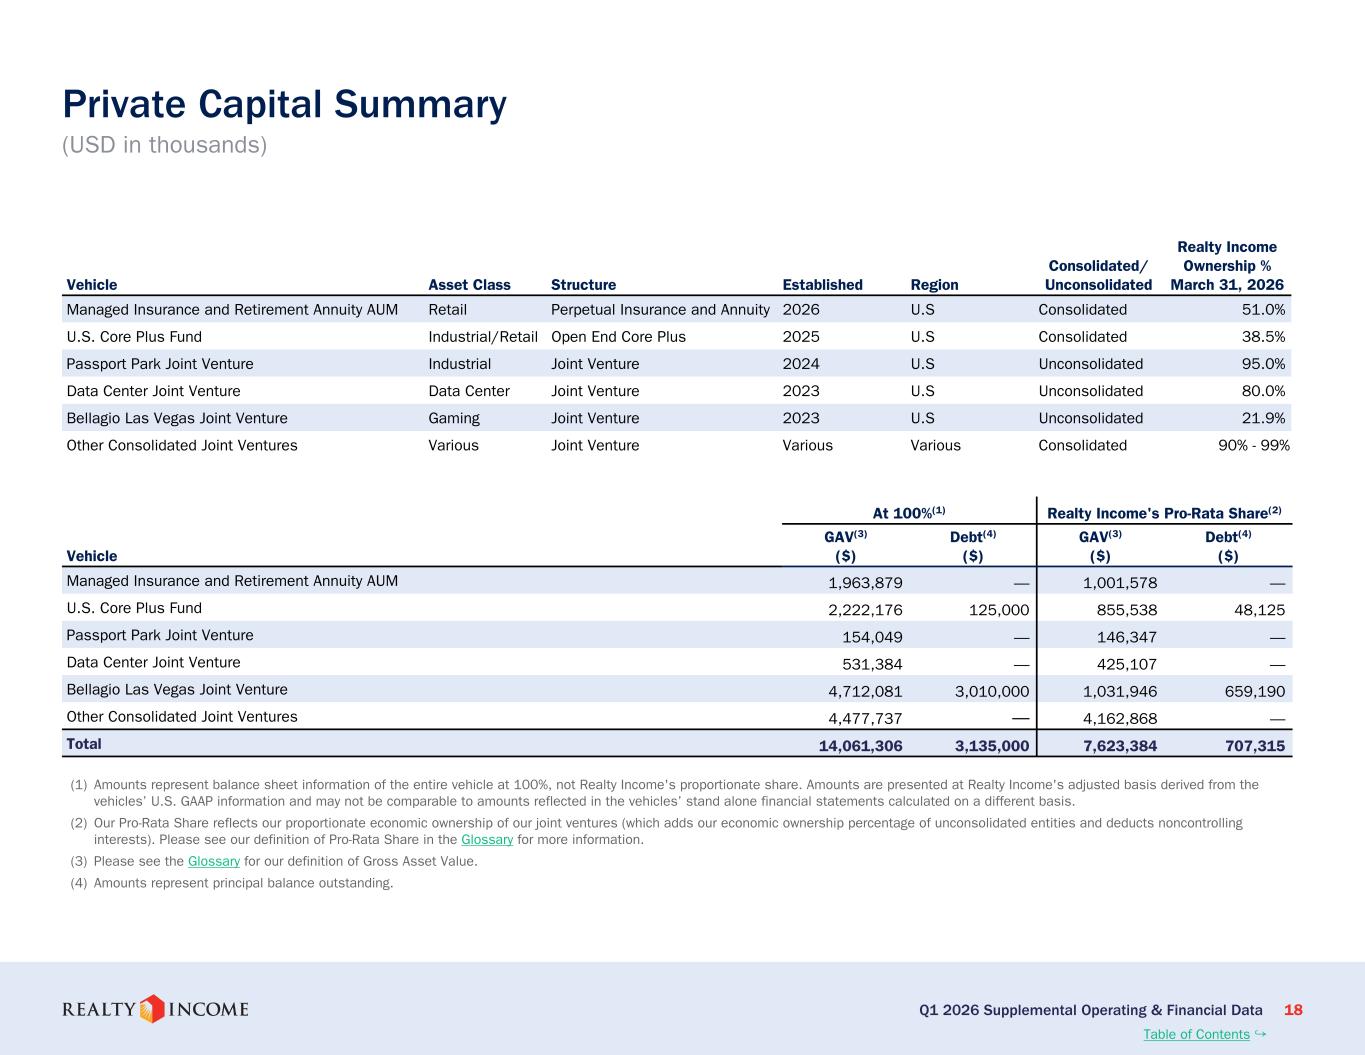
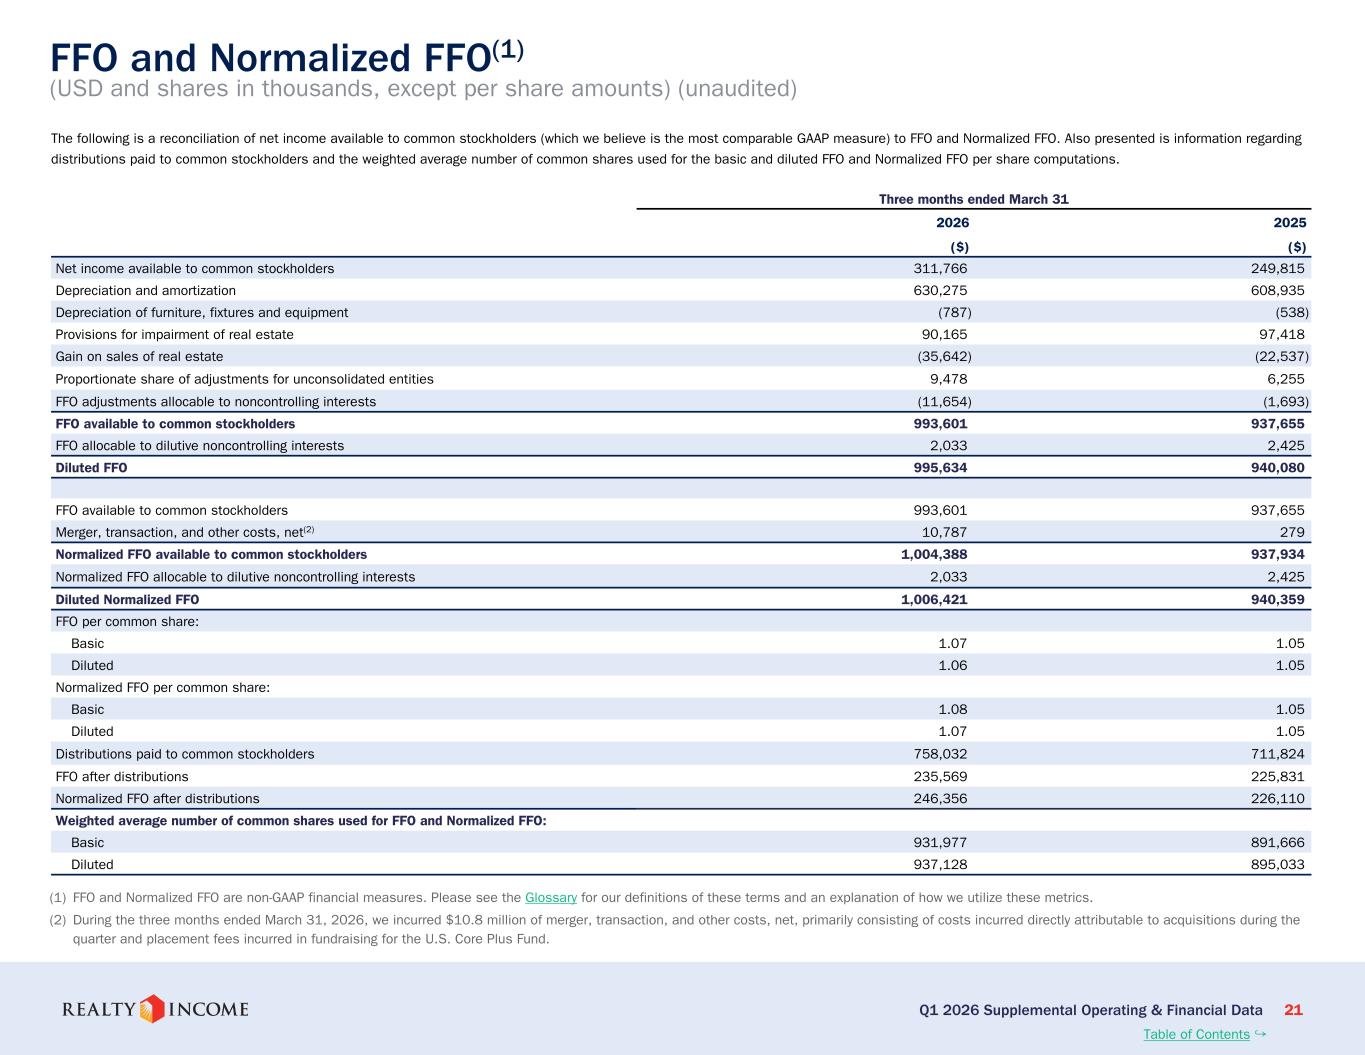
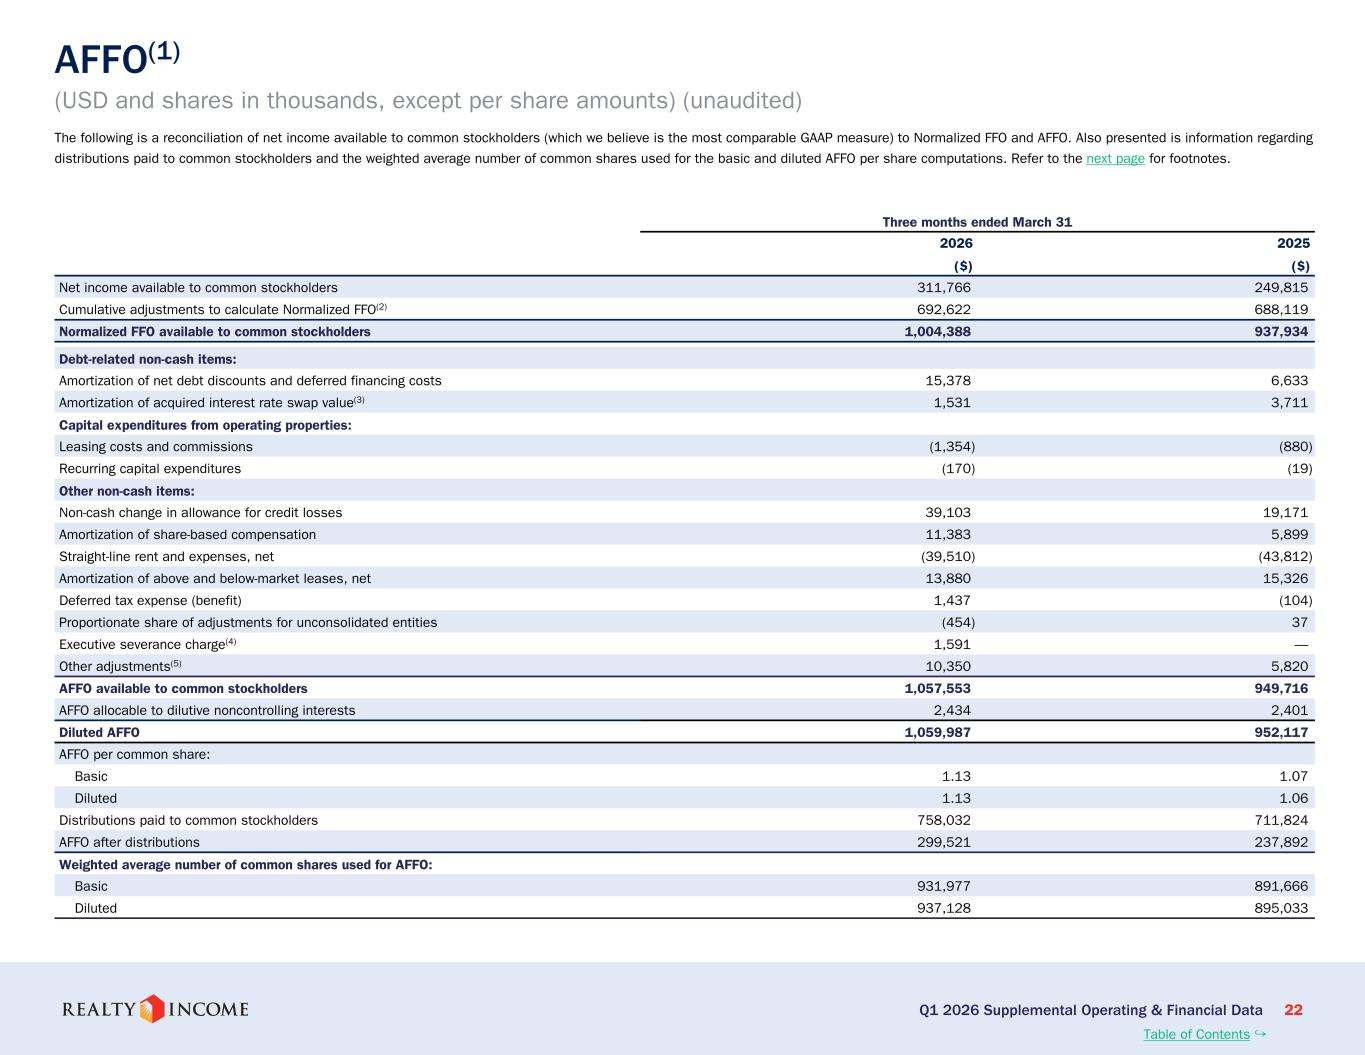
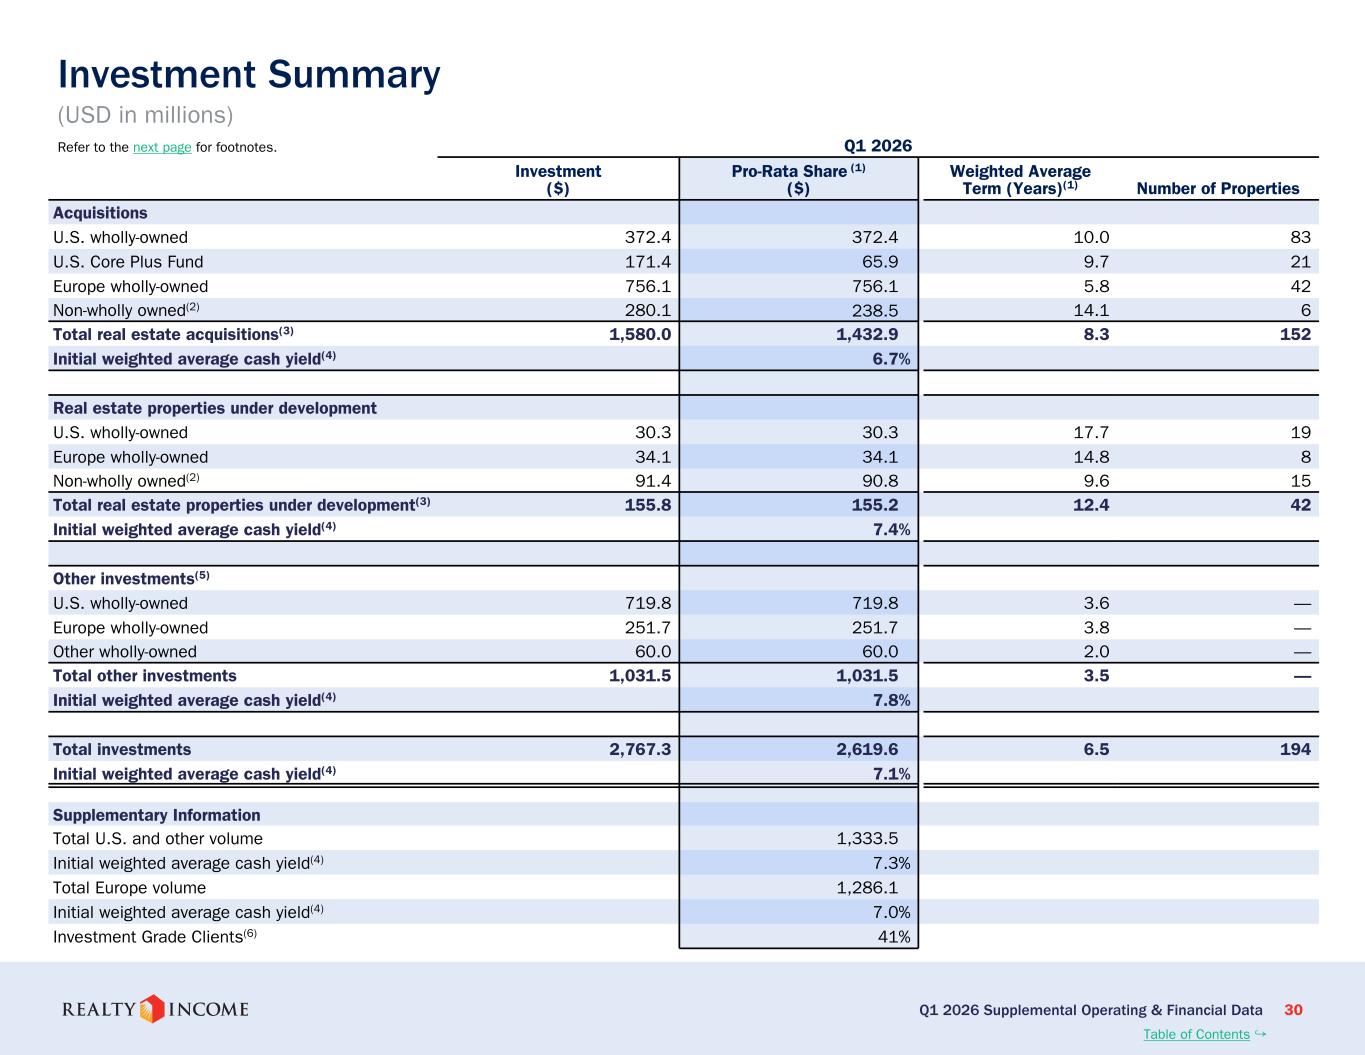
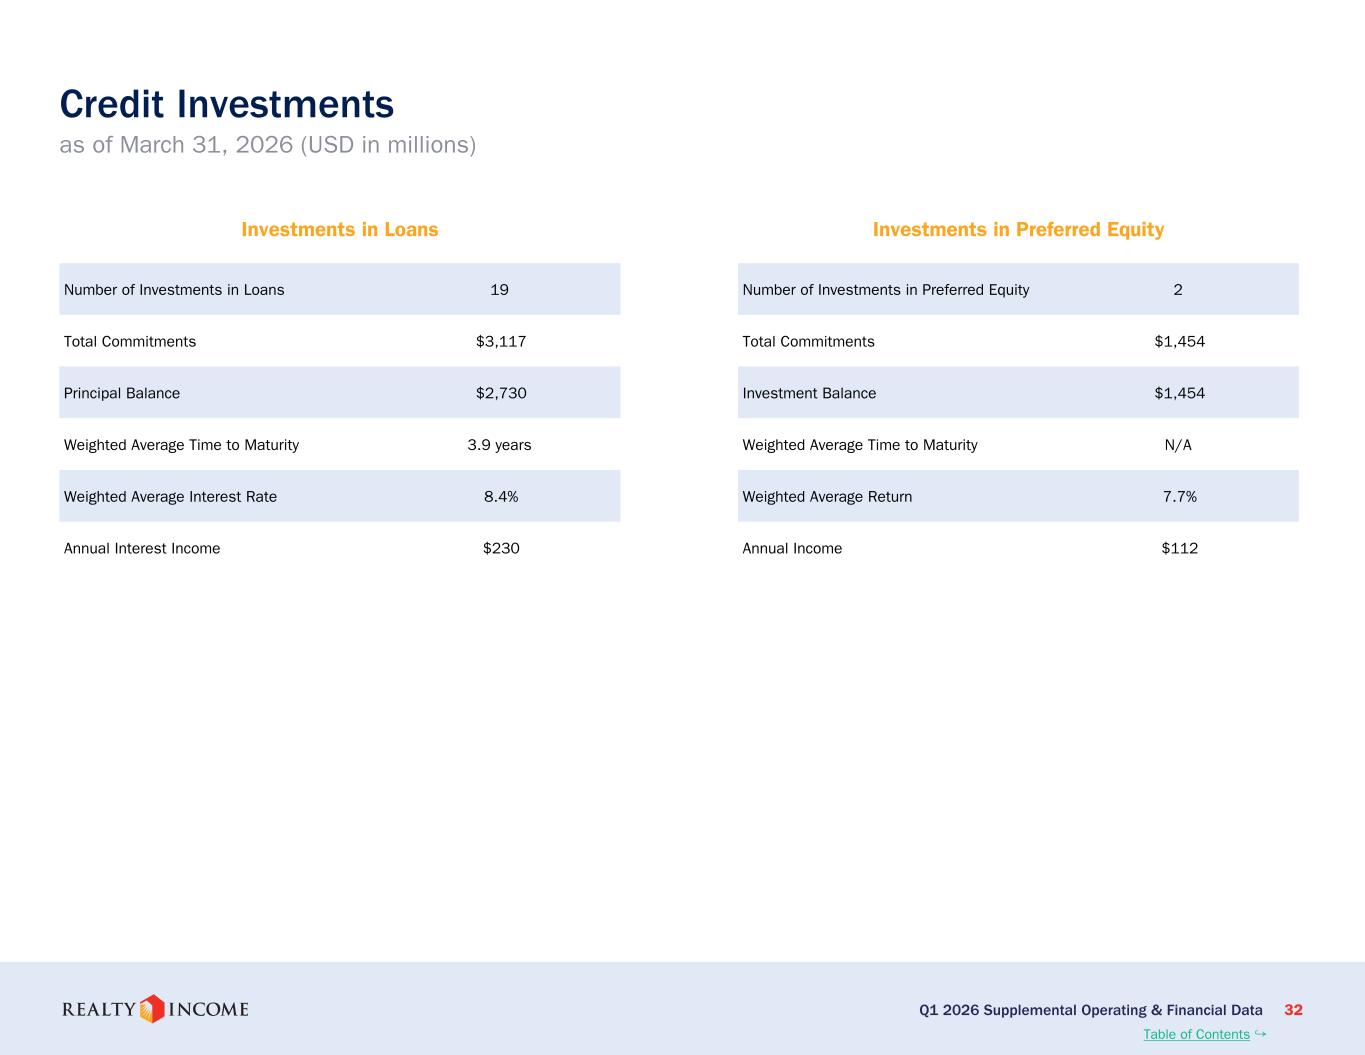
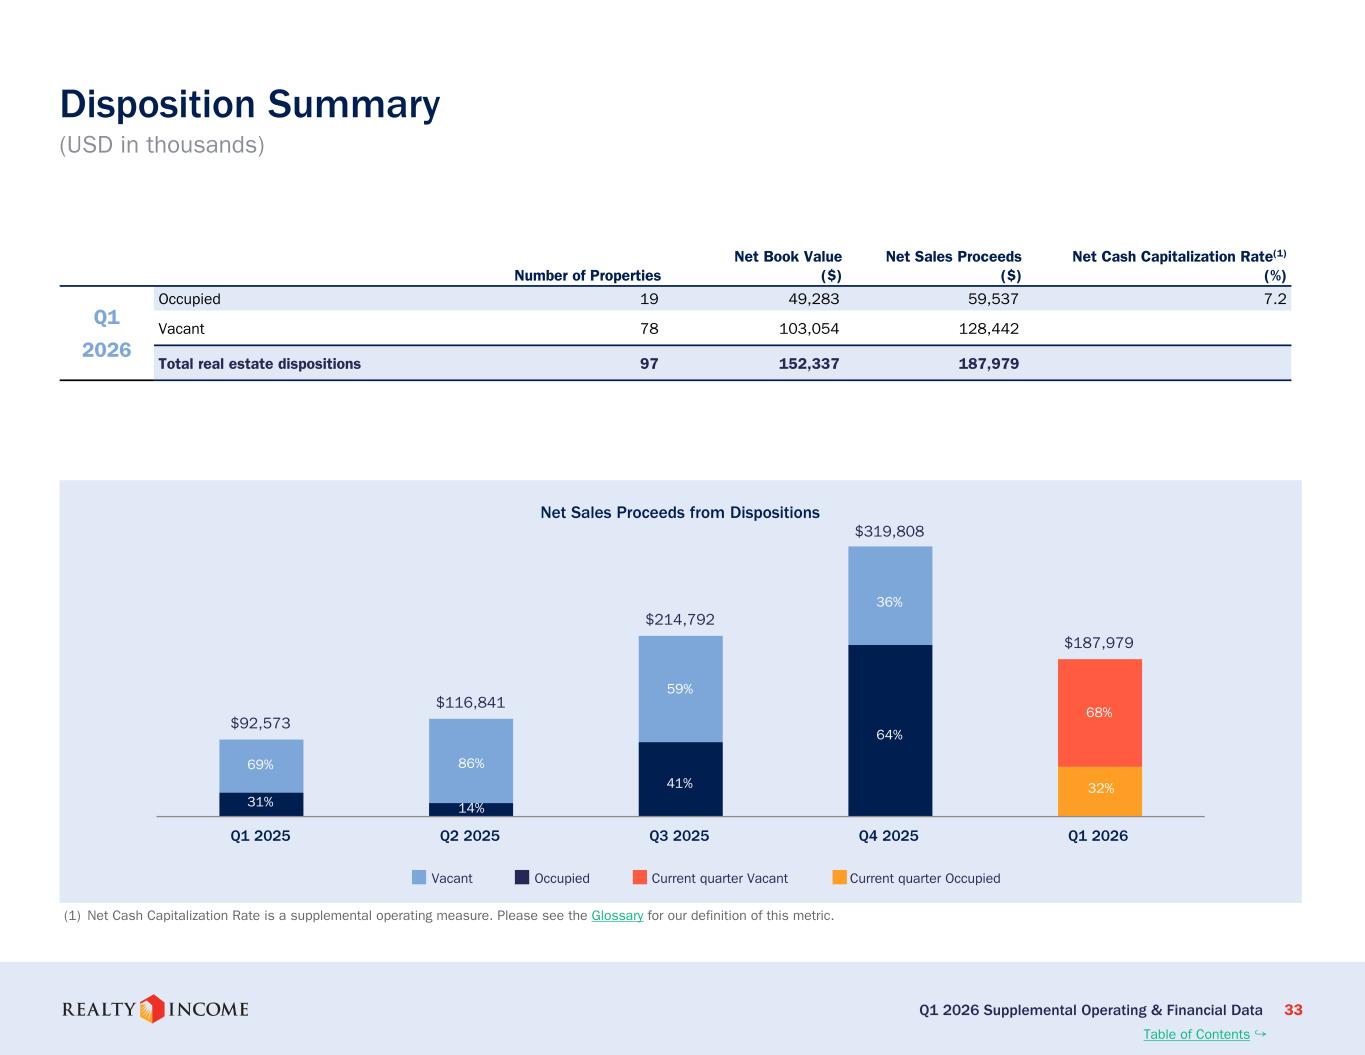
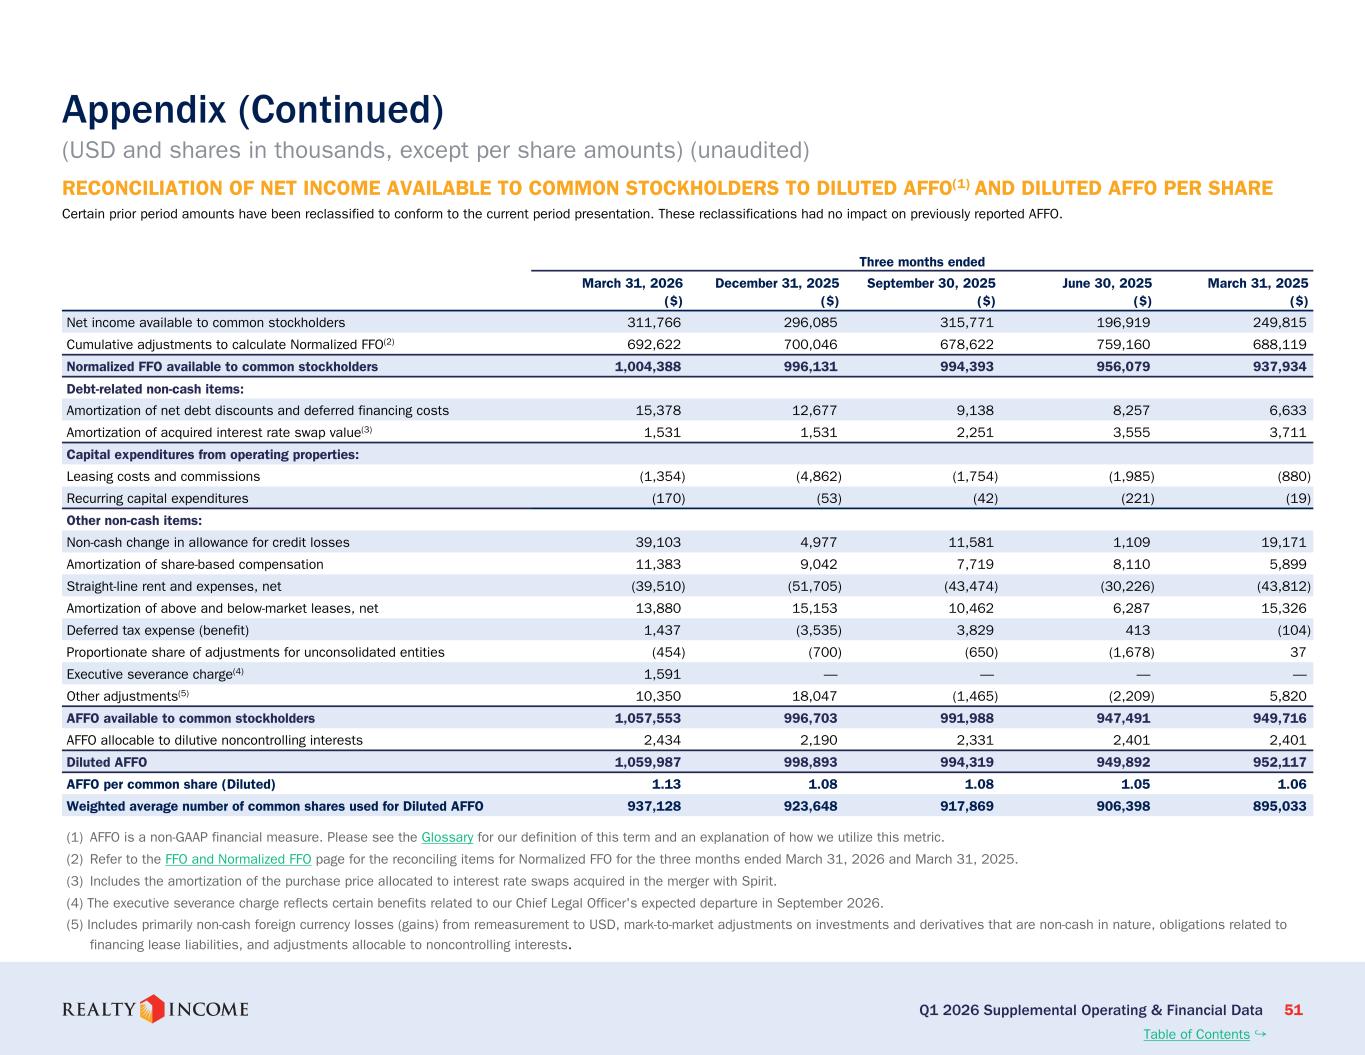
Thank you, Alex, and welcome, everyone. We entered 2026 with strong momentum, and our first quarter results demonstrate progress across the priorities that matter most for realty income. Disciplined capital deployment, durable portfolio performance, and continued expansion of our private capital platform. In the first quarter, we delivered AFFO per share of $1.13, up 6.6% year-over-year, and invested approximately $2.8 billion, or $2.6 billion on a pro rata basis, at a 7.1% initial weighted average cash yield. Our investment activity remained balanced between North America and Europe, and we also deployed approximately $1 billion into credit and structured investments. That strong start to 2026 supports our decision to raise the midpoint of full-year AFFO per share guidance by 2.5 cents, or approximately 60 basis points at the midpoint. Jonathan will walk through the quarter and our updated guidance in more detail. Looking ahead, our 2026 outlook reflects an anticipated acceleration from 2025 as we leverage our scale, data-driven, and robust platform to strive towards consistent, double-digit total operational returns for our shareholders. I'd like to briefly step back and place our recent announcements into the broader strategic context for realty income. Over the past several months, we've been deliberate in building a private capital ecosystem to diversify our sources of permanent equity, expand our investment opportunity set, and support long-term value creation, all while remaining anchored in the same underwriting discipline, credit standards, and focus on durable growing cash flow that have defined realty income since our inception. This is demonstrated through three critical achievements. First, we completed our $1.7 billion Cornerstone capital raise for our Perpetual Life U.S. Core Plus Fund. Second, we formed a strategic partnership with GIC focused primarily on construction financing and takeout commitments for built-to-suit industrial in the U.S. and Mexico. Lastly, we raised $1 billion in equity from Apollo as part of a programmatic venture that strives to ultimately deliver Realty Income's dependable income to the massive insurance and annuity market. Taken together, these initiatives represent what we view as a meaningful evolution of the Realty Income platform, rooted in years of intentional planning to strengthen how we fund growth and deploy capital across cycles. Several years ago, we identified a potential concentration risk in relying primarily on public equity markets, where pricing at times can become disconnected from underlying operating performance, and this discrepancy persists for prolonged periods. That realization led us to a fundamental question. How do we diversify capital sources to better leverage a platform designed to deploy billions of dollars annually while seeking to create long-term value for public shareholders? These partnerships represent the early stages of our private capital journey, and we expect to continue adding accretive sources of permanent capital over time. Today, we view private capital not as a single strategy, but as an ecosystem of distinct, non-overlapping verticals tailored to different geographies, property types, and investment mandates. This approach has expanded our investor base, strengthened our return profile through asset-light fee income, and meaningfully broadened our investable universe. Importantly, it allows us to deploy capital across property types and across the real estate capital structure while preserving the core DNA of realty income. Each vehicle is designed to be complementary to our public REIT model and accretive to long-term per share value. Alongside that backdrop, our global platform evolution drove transaction activity during the third quarter. With approximately $2.8 billion of investment volume, we delivered one of our higher levels of quarterly deployment in recent years, supported by consistent execution across geographies, property types, and investment structures. We sourced approximately $31 billion of investment opportunities during the first quarter, reflecting the depth of our global relationships and the scale of our platform. That sourcing allowed us to remain highly selective, closing on roughly 9% of what we reviewed, while maintaining discipline on yield, structure, and credit. Approximately 94% of opportunities were relationship-driven, reinforcing the durability of our origination engine. Our European platform continues to be a key competitive advantage. Markets remain more fragmented and less crowded than in the U.S., allowing us to source portfolio-oriented, tailored transactions with attractive duration and credit and to flex capital toward highly compelling opportunities. In the U.S., transaction markets remain active and competitive, particularly for small, one-off assets. We continue to see meaningful value creation in larger and more structured investments, where our relationships, scale, and underwriting capabilities provide a competitive advantage. We deployed $1 billion into credit investments globally, including two mezzanine transactions. The first was a $375 million loan alongside a sovereign capital investment firm backed by a portfolio of high-quality logistics assets leased to a strong investment-grade e-commerce client with a right of first offer on the underlying real estate. The second was a $190 million loan supporting the development of a data center campus in Virginia, pre-leased to an investment-grade hyperscale tenant. Our ability to invest across owned real estate, loans, preferred equity, and structured investments gives us flexibility to remain disciplined and selective, particularly in periods of macro volatility. Our global platform, long-duration leases, and conservative balance sheet position us to stay active while maintaining underwriting rigor. Our platform advantage continued to deliver strong operating results, and we ended the quarter with robust occupancy and reported recapture. Through proactive asset and property management, our teams remained focused on driving AFFO per share growth from the core portfolio. We combined deep familiarity with our assets and clients, proprietary predictive analytics, and disciplined credit underwriting to maximize risk-adjusted economics on releasing and renewal outcomes. That approach generated outsized lease termination income of $40.2 million during the first quarter. And based on current visibility, we've increased our full-year termination income outlook range to $45 to $50 million. Overall, we believe realty income today is more differentiated and better positioned for long-term growth than at any point in our history. With that, I'll turn the call over to Jonathan.
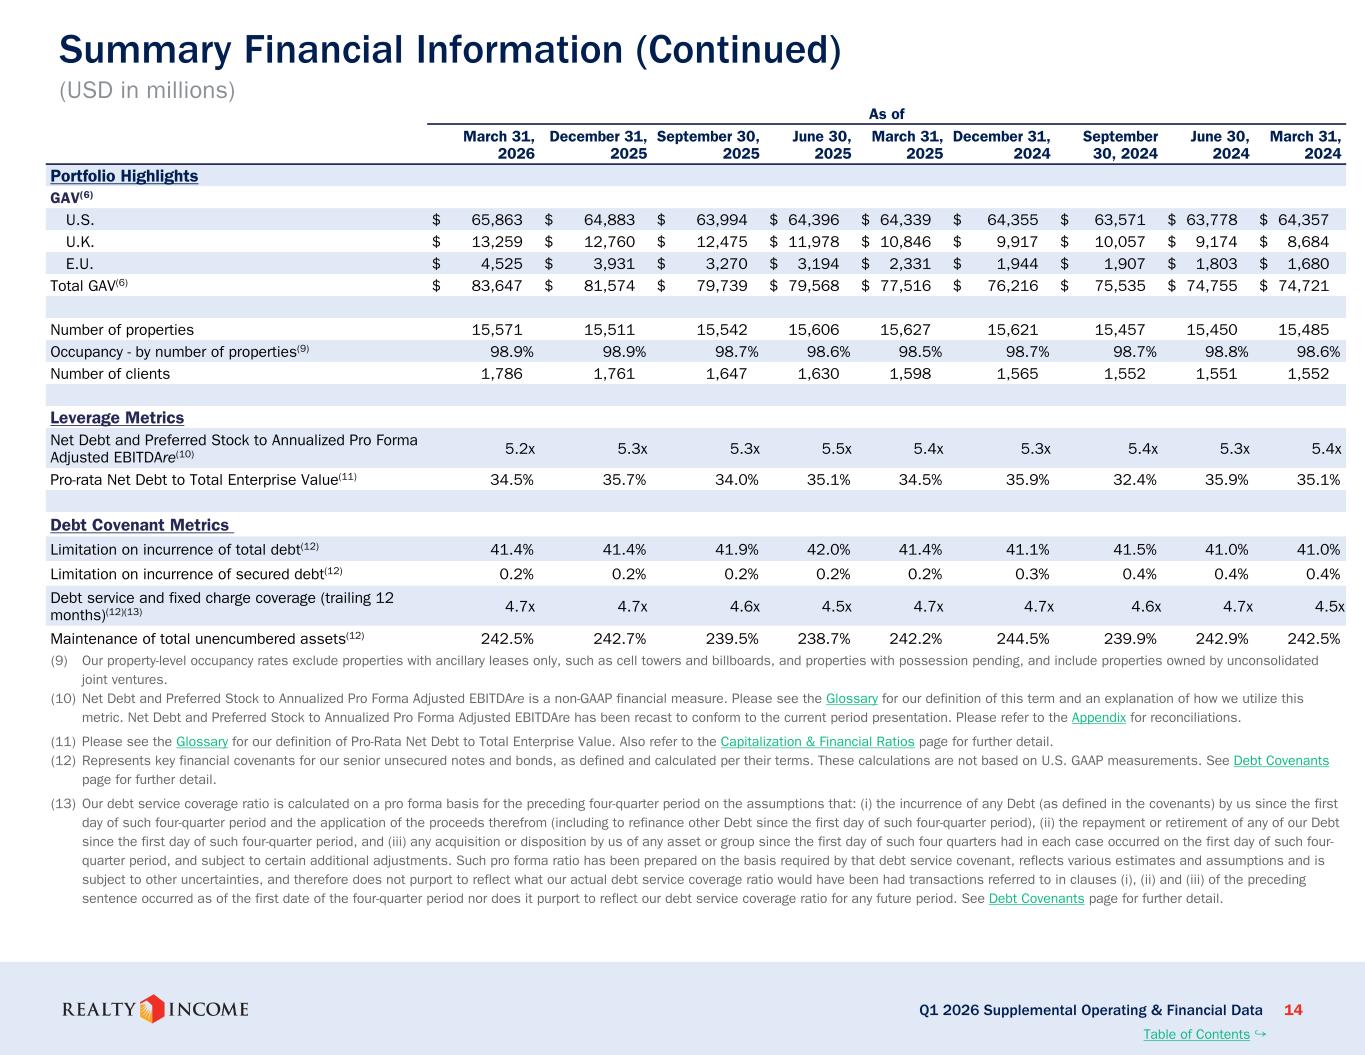
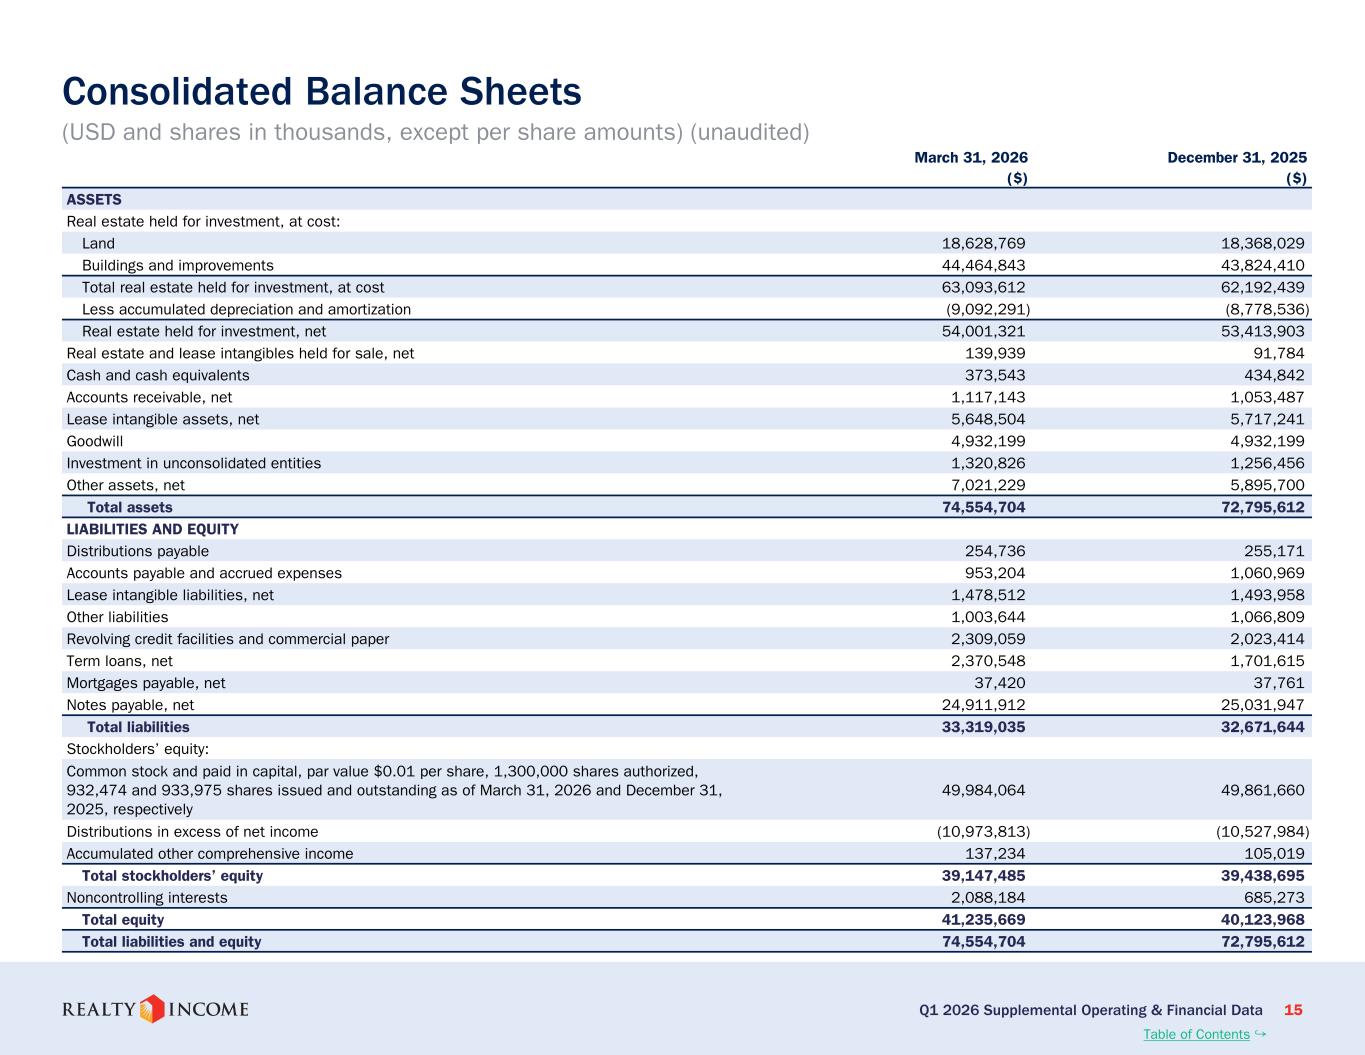
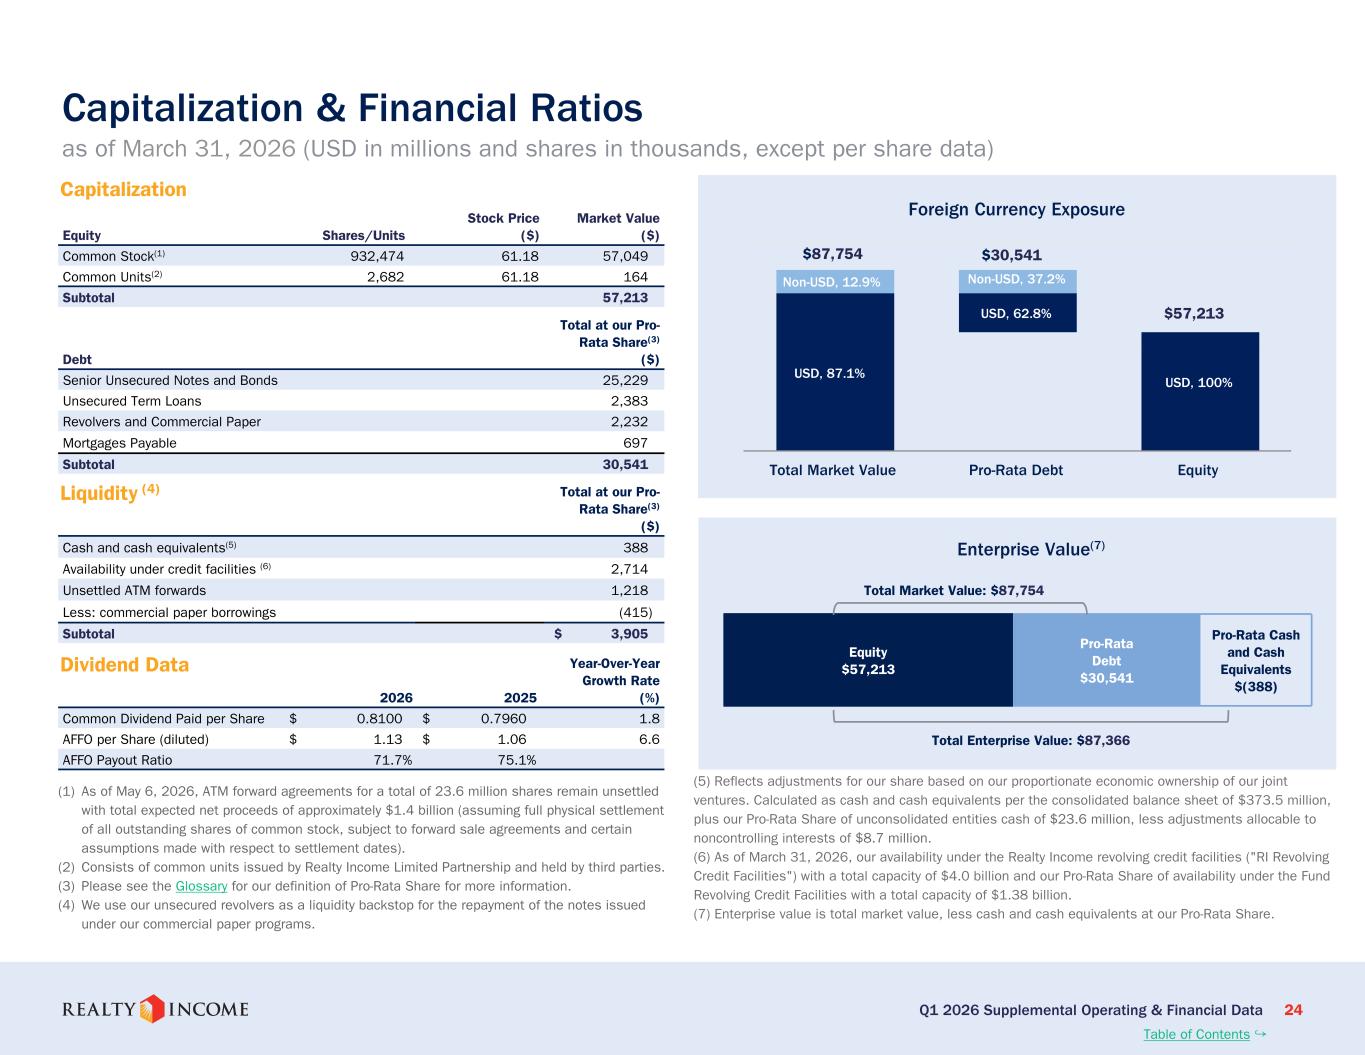
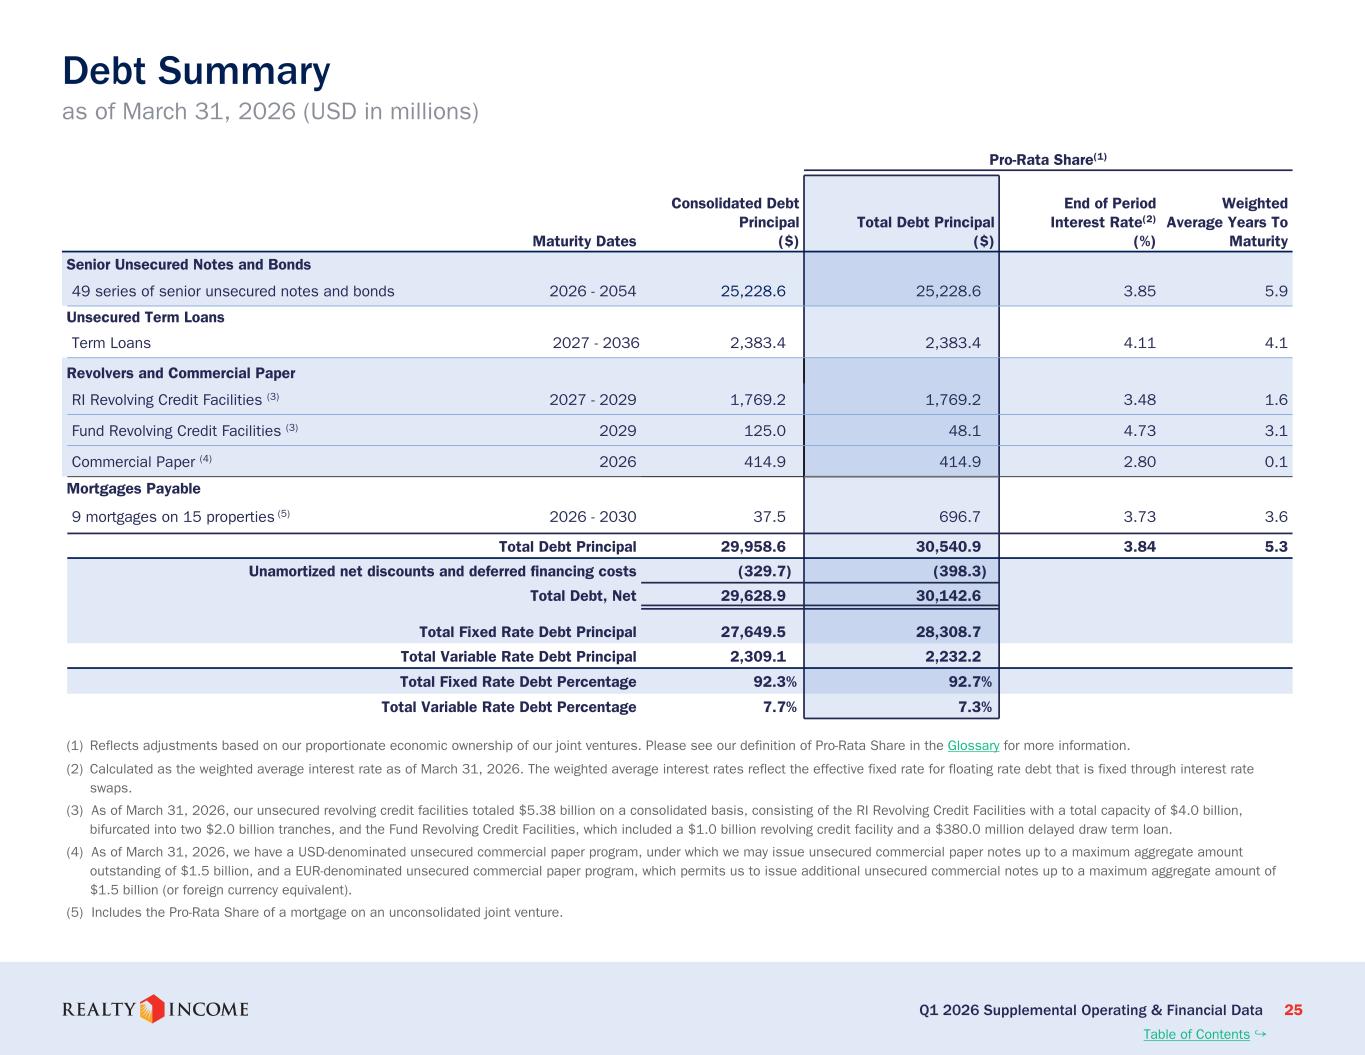
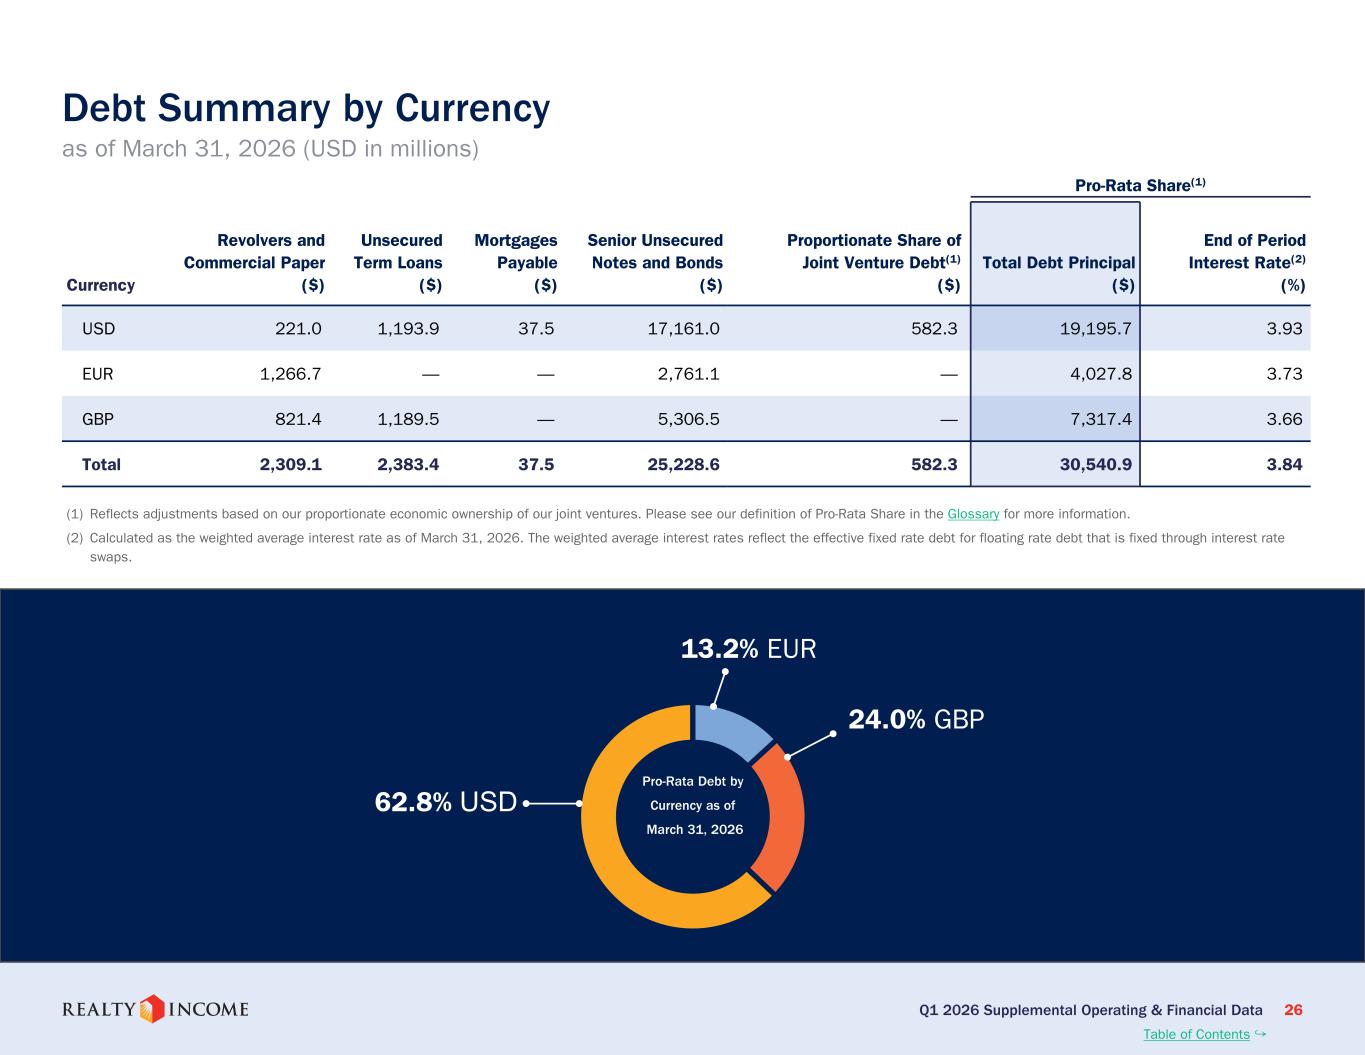
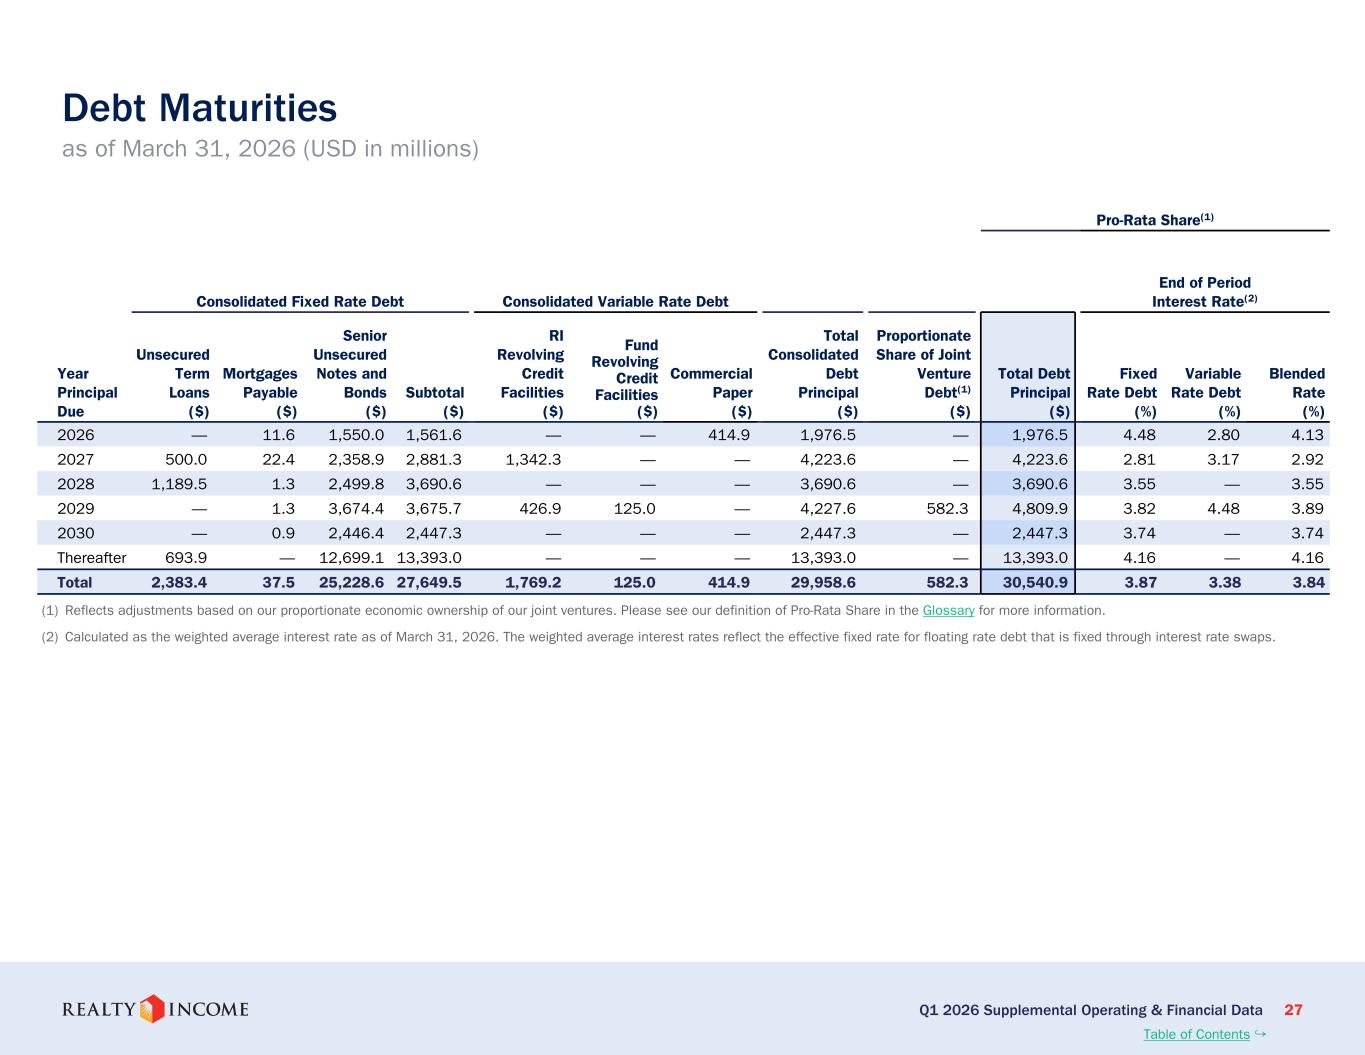
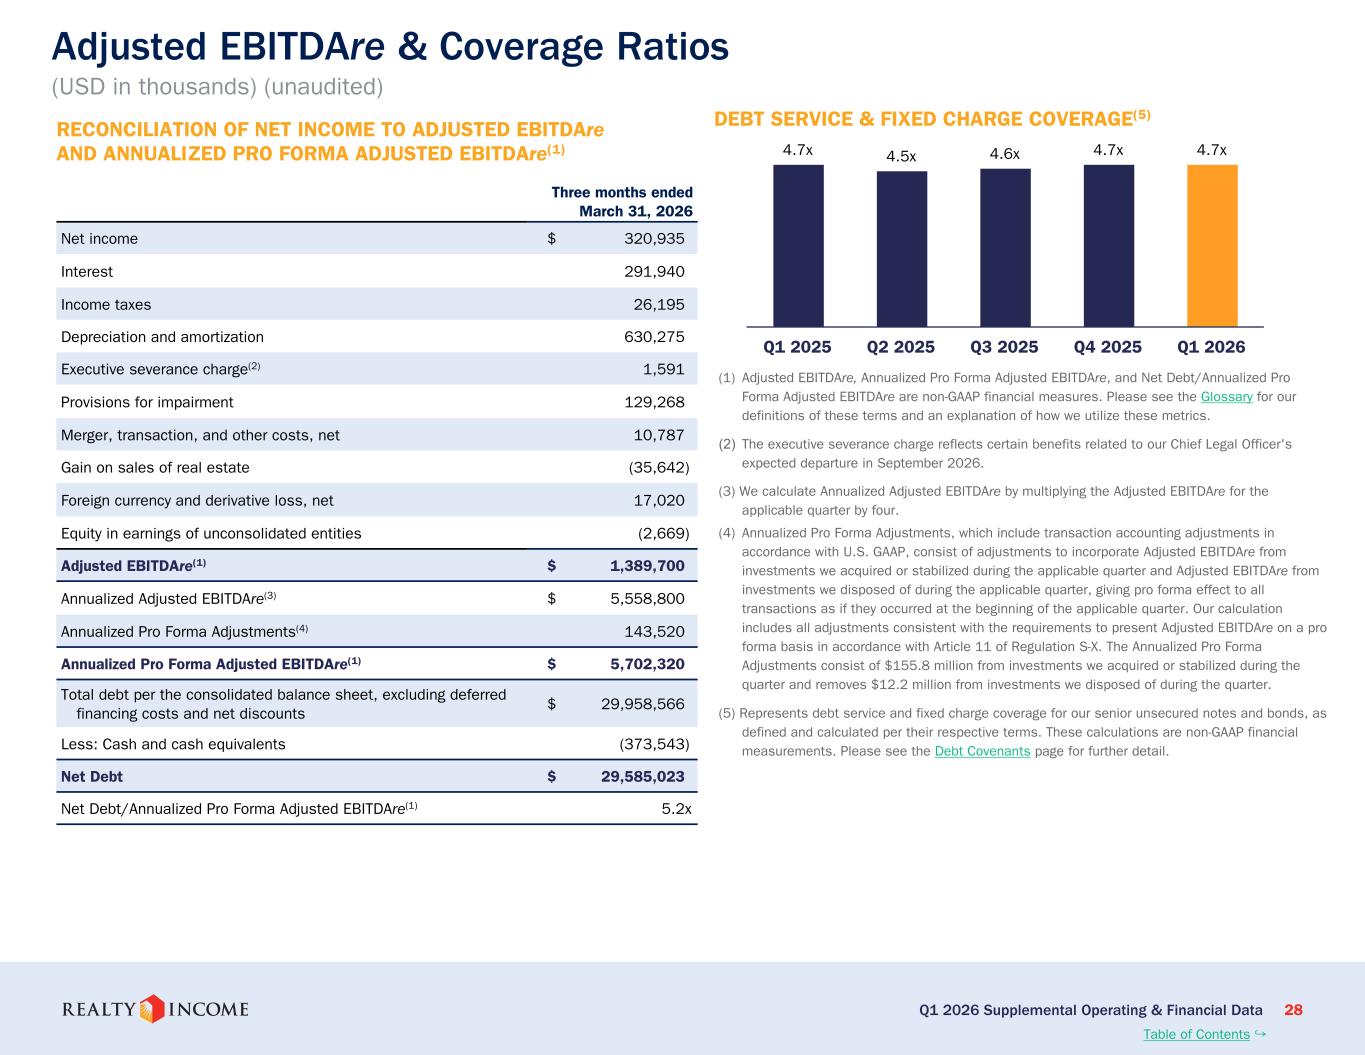
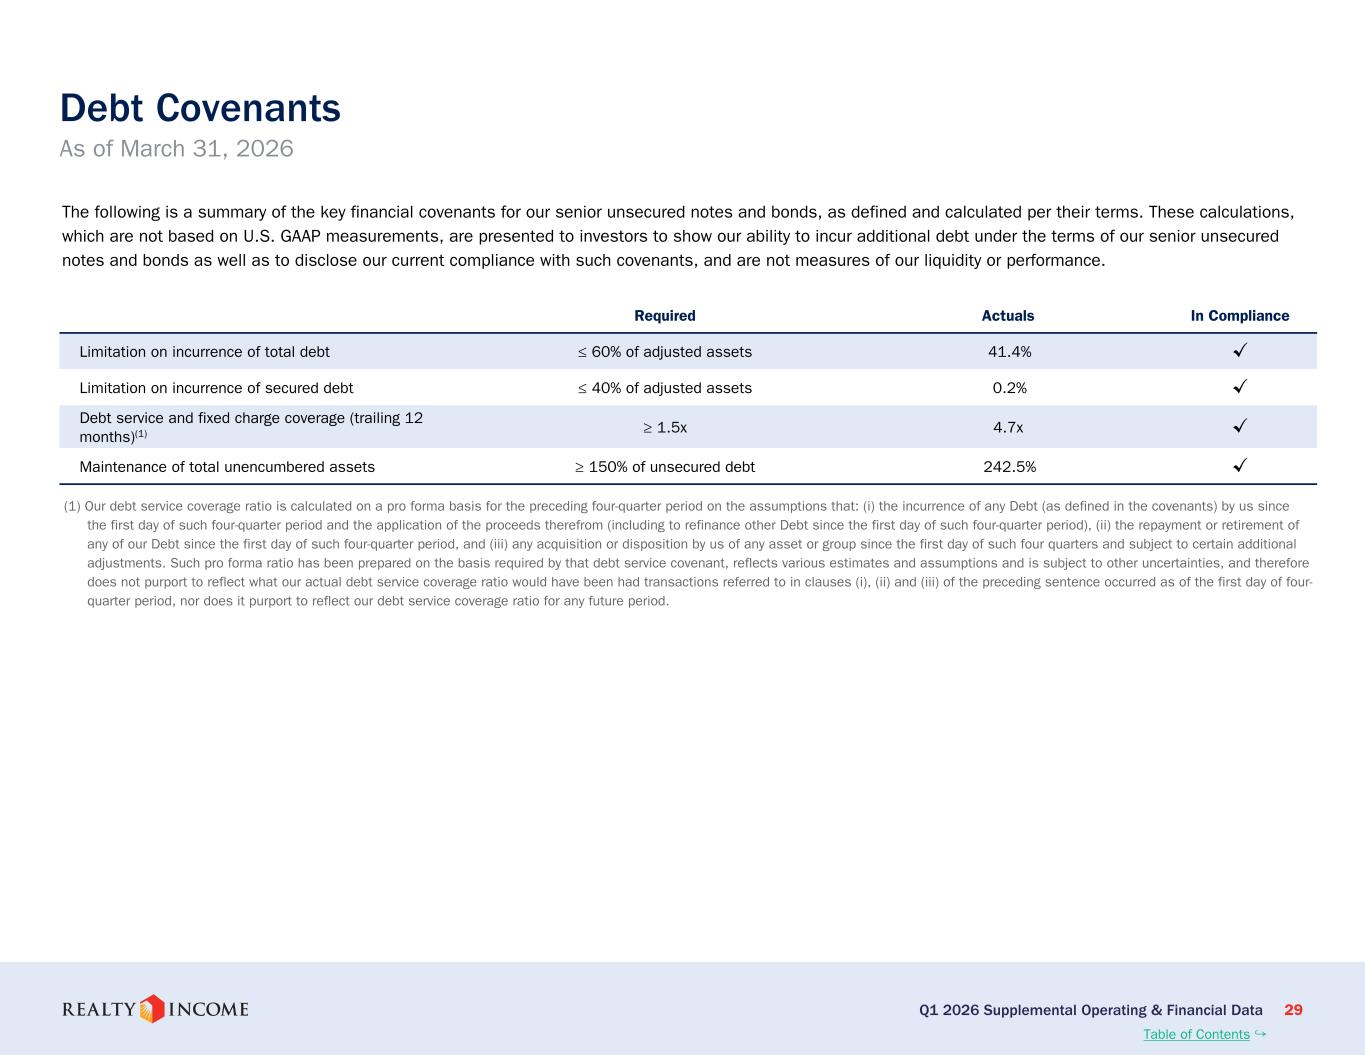
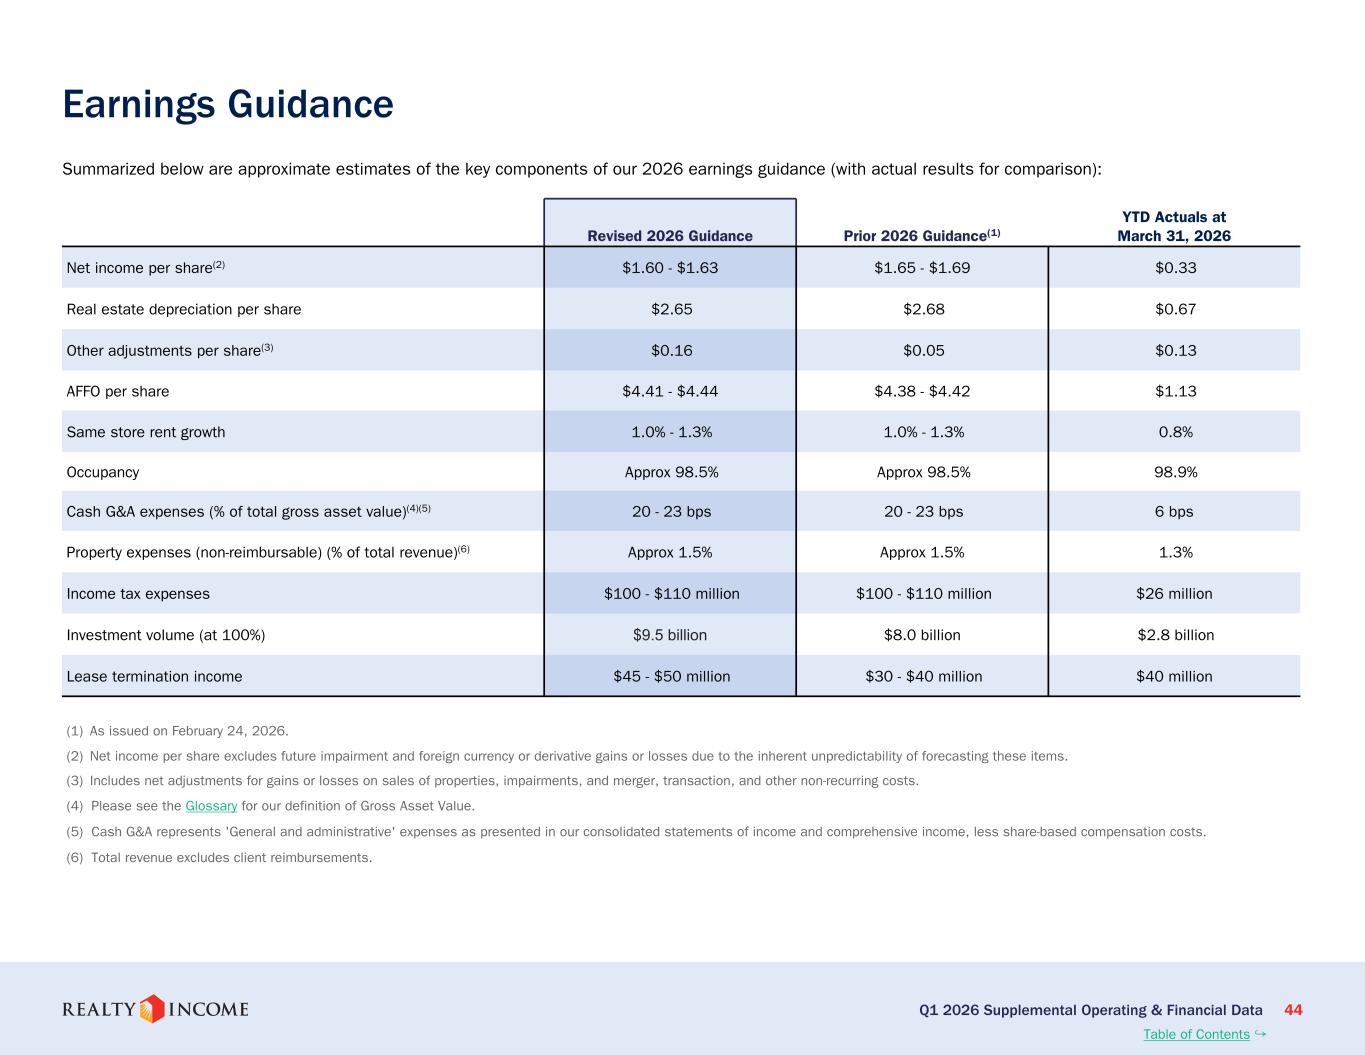
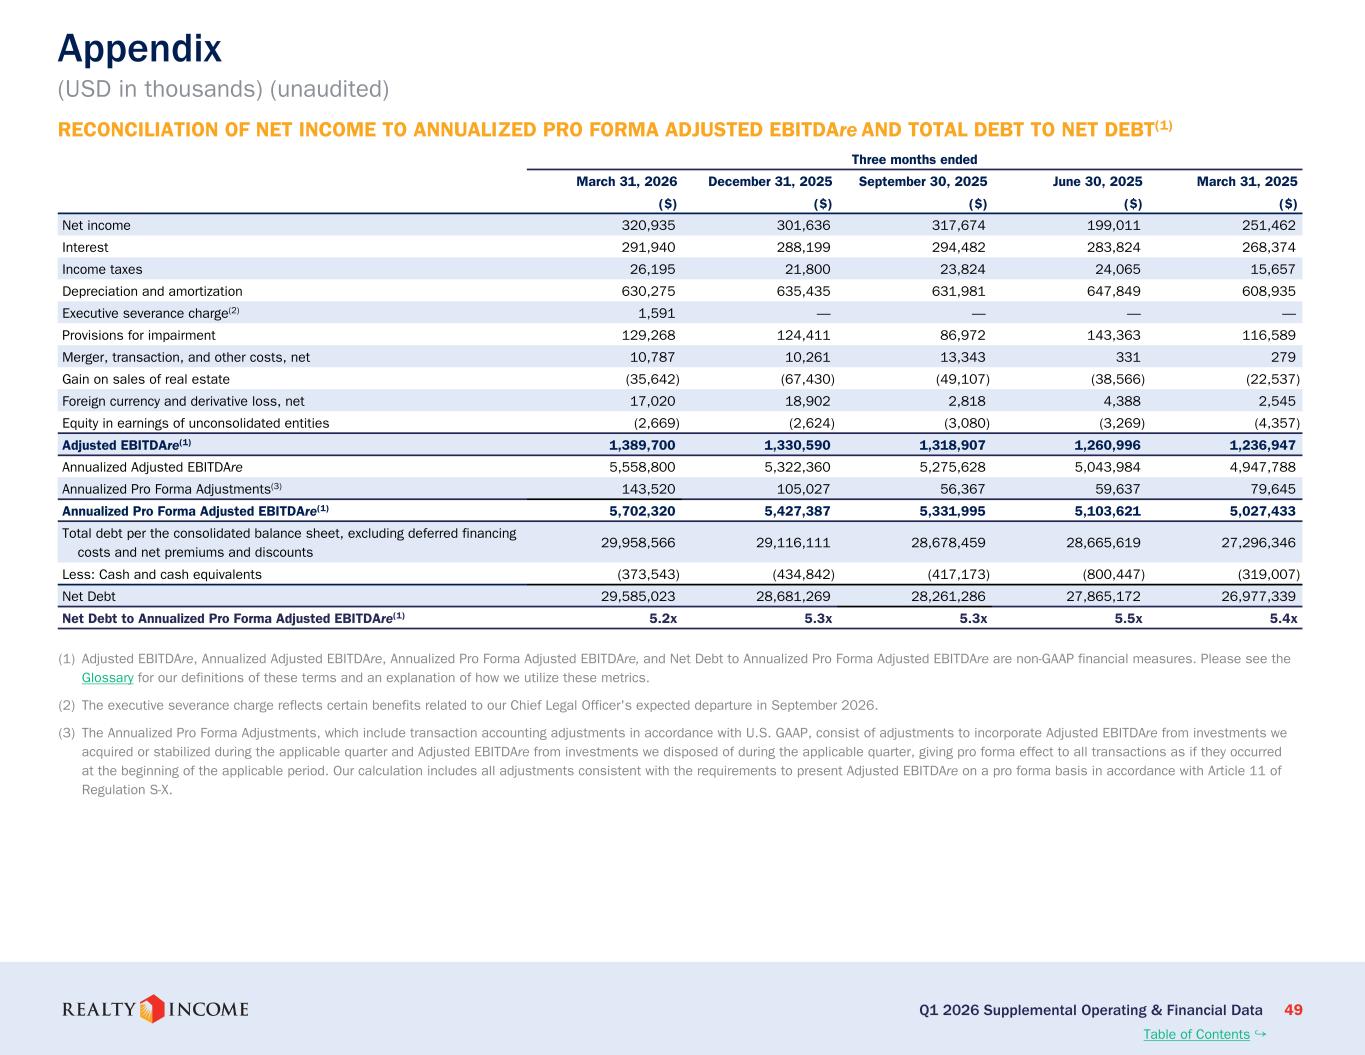
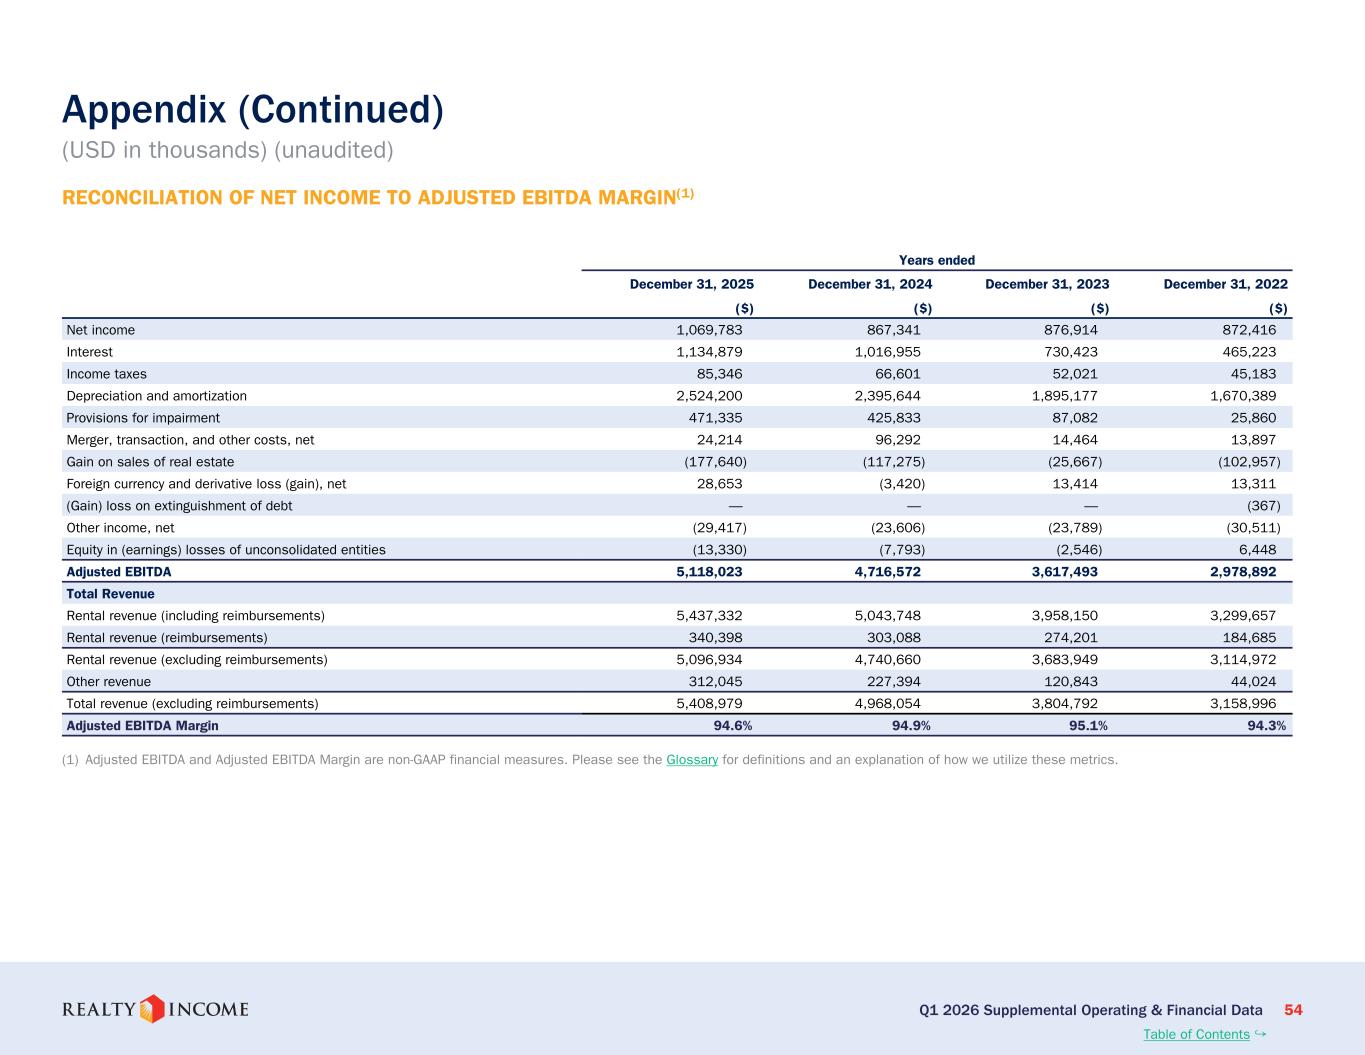
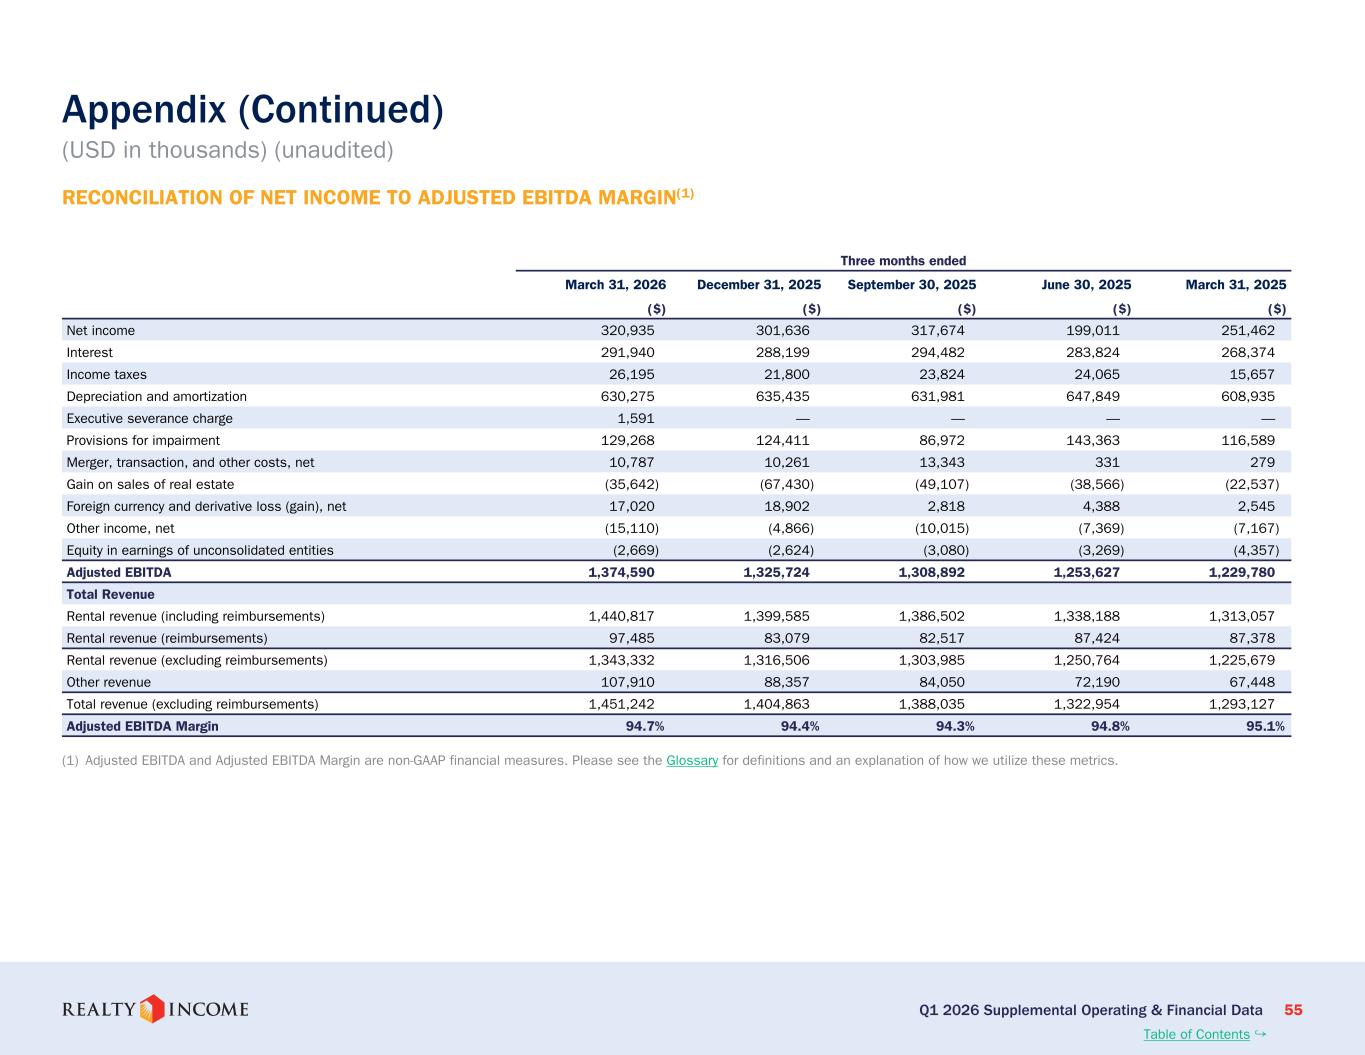
Thanks, Jiminy. Good afternoon, everyone. We had an active first quarter with several new capital partnerships that expand our financial flexibility and deepen our access to long-term oriented private capital. Combined with our establish access to public markets, these initiatives broaden our investment buy box and support sustained global development. We ended the quarter with approximately $3.9 billion of liquidity on a pro rata basis. Subsequent to quarter end, we raised an additional $174 million of forward equity, bringing our current ATM unsettled balance to approximately $1.4 billion. Net debt to annualized pro forma adjusted EBITDA was 5.2 times within our targeted leverage range. And inclusive of our outstanding forward equity, our leverage would sit at 4.9 times. Subsequent to quarter end, we issued $800 million of 4.75% senior unsecured notes due 2033, swapping 500 million into euros for a blended yield of 4.44%. In addition to diversifying our sources of equity, we're also taking steps to broaden our access to unique sources of debt capital. In the first quarter, we established a new form of debt financing through a 10-year unsecured term loan with an affiliate of Goldman Sachs. The capital raise provided Realty Income the opportunity to partner with the local community via San Diego Community Power, supporting its long-term energy procurement objectives for San Diego residents. To facilitate this arrangement, San Diego Community Power utilized a well-established municipal prepay structure that enables a public agency to issue municipal bonds and use the proceeds to prepay for future electricity deliveries, while effectively lending a portion of the proceeds, in this case $694 million, to realty income. In return, we agreed to pay a fixed annual interest rate of 4.91% through the Goldman Sachs term loan. We subsequently swapped $500 million of the note to euros via a cross-currency swap, resulting in a 4.34% all-in blended cost of debt. The strategic benefit to realty income is the creation of a deep pool of new debt capital at attractive pricing that can complement our access to the public unsecured debt market. Our European operations continue to provide incremental, low-cost financing flexibility. Euro-denominated debt is priced approximately 100 basis points inside comparable tenor U.S. dollar debt and serves as both a natural currency hedge and a tool to offset higher-cost U.S. refinancings while remaining leverage neutral. Given our strong start to the year, we are increasing full-year investment volume guidance to $9.5 billion at 100% ownership and raising the AFL per share guidance range to between $441 and $444. As Sumit noted, we are also increasing the expected lease termination income guidance range to between $45 million and $50 million as we become increasingly proactive with our asset management platform. And lastly, we are lowering our credit loss outlook to approximately 40 basis points of rental revenue, reflected improved visibility and performance across the portfolio. As Sumit highlighted, we now have three distinct and intentionally structured private capital vehicles through our partnerships with Apollo, GIC, and the Perpetual Life U.S. Core Plus Fund. Each vehicle serves differentiated investment mandates and is designed to provide realty income with three new alternative sources of long-term oriented equity. Our most recent strategic partnership with Apollo seeks to provide a repeatable source of low-cost, property-level equity while allowing us to retain operational control. We view this structure as a compelling complement to traditional public equity, and we expect it will carry comparatively less volatility of pricing and availability. A diversified net lease portfolio at scale is a natural complement to Apollo's perpetual capital AUM, which comprises a significant majority of their total AUM. Our initial transaction with Apollo resulted in a $1 billion equity investment and a highly granular, well-diversified, long-duration retail portfolio of approximately 500 single-tenant properties contributed off our balance sheet. The joint venture includes a call option exercisable between years 7 and 15 that caps the cost of this equity at 6.875% during Apollo's ownership period. This structure provides meaningful long-term optionality as contractual rent growth compounds over time, increasing spread versus our long-term cost of equity, and enabling incremental investment volume at lower return hurdles. We are pleased to partner with one of the world's leading asset managers and intend to scale this relationship beyond this initial product. The partnership is well aligned with Apollo providing long-term equity capital and realty income delivering sourcing, underwriting, and asset management capabilities through our global net lease platform. The Apollo partnership represents our second programmatic private capital joint venture following the January announcement of our bill-to-suit development JV with GIC. Finally, during the first quarter, we completed the cornerstone fundraising round for our U.S. Core Plus open-ended fund, raising $1.7 billion of institutional capital, primarily from state, city, and employee pension plans. The vehicle is designed to allow us to invest alongside high-quality institutional partners in assets with lower initial yields but strong long-term growth characteristics, while generating high-margin, capital-like fee income. Just as important, it is intended to broaden our buy box and enhances day one accretion by more efficiently matching capital opportunity. With that, I'll turn on back to Sumit.
Thank you, Jonathan. Our private capital initiatives represent a natural extension of Realty Income's long-standing business models. They're expected to enhance our ability to deploy capital through cycles, improve our cost of capital efficiency, and strengthen our long-term value proposition for shareholders. We are encouraged by the progress to date and look forward to building on this momentum. Operator, we are ready for Q&A.
Operator
Thank you. We will now begin the question and answer session. To ask a question, you may press star than 1 on your telephone keypad. If you are using the speakerphone, we ask that you please pick up your handset before pressing the keys. If at any time your question has been addressed and you would like to withdraw your question, please press star than 2. Once again, we do ask, do you please limit yourself to one question and one follow-up? At this time, we'll pause for just a moment to assemble our roster. And our first question today comes from Yana Gallin at Bank of America. Please go ahead.
Dan
Analyst — Bank of America
Good evening. This is Dan for Yana. Did you provide more detail on the $40 million lease termination income recognized this quarter? For example, was it driven by a small number of tenants or a broad-based activity, and were they released or sold?
So this was obviously part of the forecast that we had shared with the market. If you recall, we had come out with a forecast of $40 million to $45 million. We were expecting this to be front-loaded. We have increased that based on the momentum we've seen to $45 million to $50 million. So this was not concentrated in any one single name. It was across the board. And, again, the rationale for doing this remains the same. It is 100% focused on trying to create and maximize our total return profile on our investments. And if we feel like we have the ability to recoup the remaining rent and be able to lease these assets to alternative tenants who are better suited for those locations, that is one of the main drivers of doing this. The second being rather than waiting for an asset to become vacant in three to four years from now, being able to recycle the capital today and create a value proposition for our clients who are not long-term occupiers of that asset is, again, a win-win situation. So it is really us leaning into our analytics and being much more proactive about harnessing these types of opportunities in our portfolio that's driving this. And despite the fact that it was all pretty much front-loaded, you know, the actual increase in lease termination is only $5 million.
Dan
Analyst — Bank of America
And just as a follow-up, could you walk through the rationale behind the $40 million ad-backed AFFO related to credit loss?
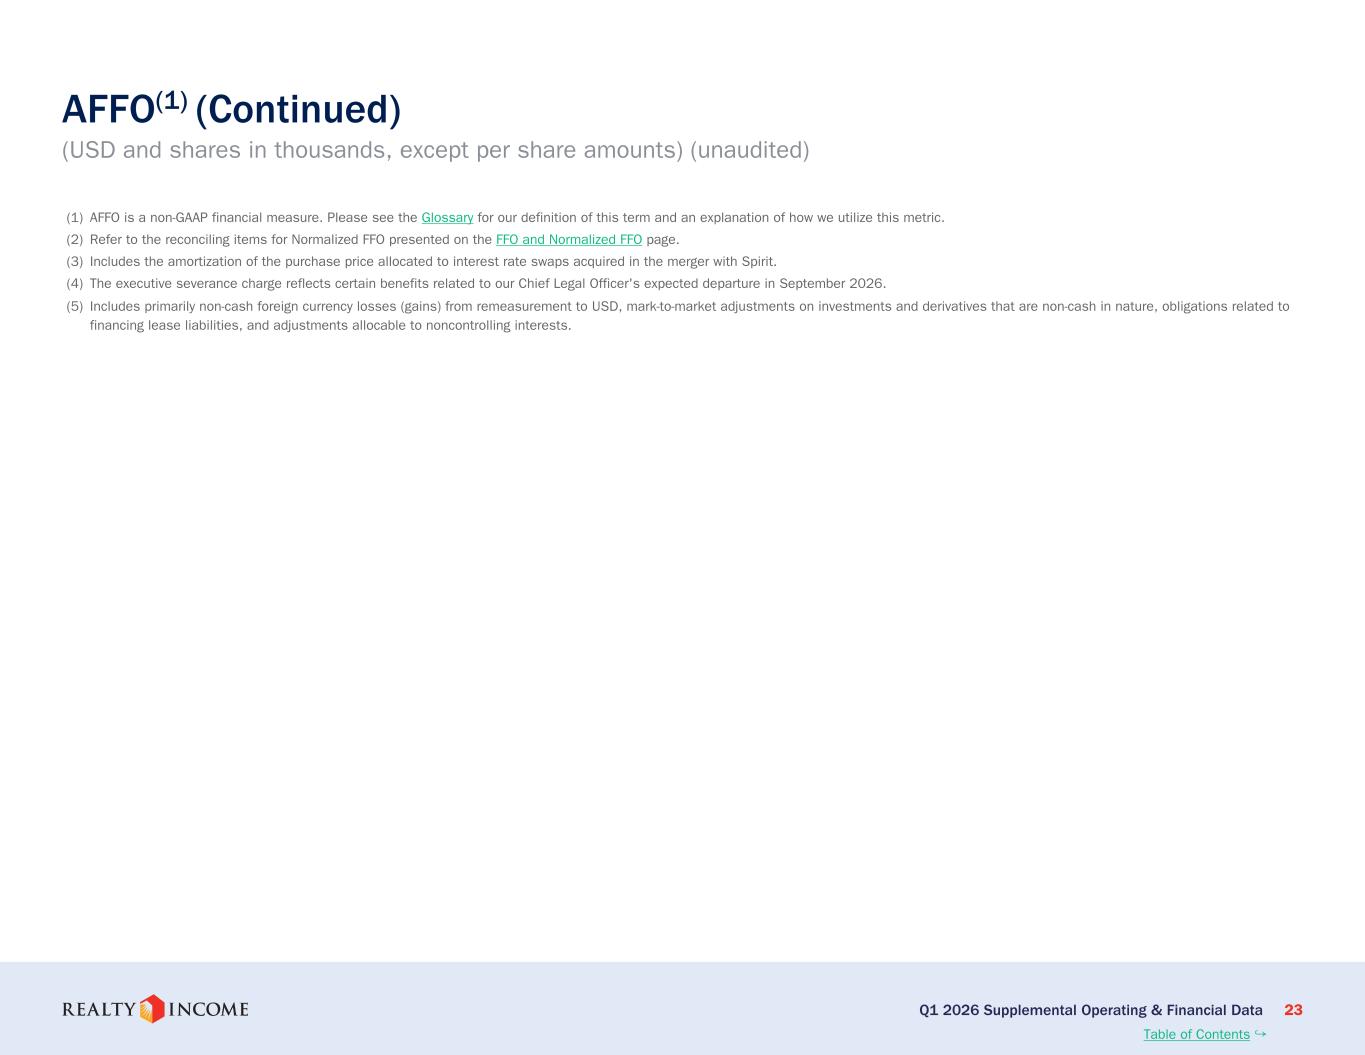
The add-back to AFO for credit loss is really a non-cash dynamic. So, you know, we have loans that we invest in. These are non-cash allowances for loan loss, very standard with how we've treated similar situations in the past.
Incidentally, they happen to be the same number, but one is CISO, non-cash-driven add-back. The other one is an actual cash payout to us, which is certainly part of AFO.
Operator
Thank you. Our next question today comes from Brad Heffern at RBC Capital Markets. Please go ahead.
Yeah, thanks, everybody. You obviously have the various private capital vehicles now. Clearly you want to grow those. So I'm wondering where you see the split of private capital investing versus the traditional investing going in the coming years.
Brad, this is a continuation of a theme that we've been touching on for the last, call it, 18 months now, where we used to share pretty much every quarter some of the transactions that we were passing on just because it wouldn't fit what our public shareholders demand, which is day one accretion or spread investing along with meeting a long-term hurdle rate. And, you know, part of why we are doing what we are doing is to be able to continue to take advantage of transactions that we think that actually meet the long-term return profile. These are very good investments, and there's a pocket of private capital that is very interested in trying to take advantage of that. So that was really the genesis behind why we started to look at these opportunities. And if you think about the three buckets of capital that we have, and you try to sort of dive in and analyze what is the potential overlap, if you will, on strategies, there's very little, if any, to be very honest. One is a potentially lower initial yield, but with higher growth, which lends itself to our open-ended fund. The insurance capital is much more steady-eddy, low-growth investments that don't necessarily meet the long-term hurdles, but are very good, predictable cash flow streams that works very well for insurance capital. And then the third it is a bill to suit that we have with GIC. That is, you know, we go in with the intention to provide debt capital and then have the path to ownership, you know, downstream if we so choose to exercise. So I think these are three distinct strategies, which if you think about in the traditional sense of the word and how we were able to or not able to recognize earnings in these three different buckets, and in some cases not even do these transactions, it is now allowing us to execute those three strategies. And it's largely based off of, you know, third-party capital. And the way it translates to, you know, a positive for our public shareholders is through predictable permanent fee income stream, allowing us to recognize, you know, development investments that we make and interest income during development, which we were not able to do in the past, and be able to satisfy a need by insurance capital that doesn't really work long-term on our balance sheet but allows us to create a fee income stream by leveraging our platform. So that's how the strategy that we have now started to implement and will continue to grow is going to benefit our shareholders is essentially monetizing the platform that we've built. Okay.
Thank you for that. And then it sounded like you did a data center development loan during the quarter. You obviously did the deal with digital a few years back. There's been a ton of consistent investment in data centers.
I'm wondering, what does the playing field look like for O today in that space and does it look more like the center loans or is there a chance that maybe you know the deal like you did with digital would you know potentially come back from a pricing standpoint to being attractive yeah so you know the rationale here is again anytime we are we are making credit investments it's with a desire to own the real estate or at least a path to ownership And so, you know, what we have said about our data center sleeve is we are highly selective around who our operator is going to be. And I'm very happy to say that, you know, we are partnering with one of the best private operators out there. We are also very highly selective in terms of the location of these assets. Once again, it is in Virginia. What I've described in the past is the epicenter of the data center business. to, again, address the residual risk that is associated with these assets. And then the underlying asset itself, the lease itself, needs to be able to fit into our investment thesis of being a single-tenant asset, long-duration lease, well above growth rates that we've been able to realize on the retail side of the business, and it fits all those boxes. And so, you know, my hope is this is the second investment we've made with this particular developer, and it is with the intent to have a path to actual ownership of these assets. And in the meantime, we are lending our balance sheet. We are getting, you know, very decent yields on these investments, which will then allow us to, you know, be able to ultimately own the real estate. Thank you.
Operator
Our next question today comes from Michael Goldsmith at UBS. Please go ahead.
Good afternoon. Thanks all for taking my questions. Sumit, in your remarks, you talked about just all these private credit vehicles, but you also mentioned that you're kind of in the early stages of this. So just kind of curious, are you thinking, hey, you know, we've done these three things, and now we've got another three more to do, you know, in the next, you know, 24 months? Or should we be thinking about this as more longer term? I'm just trying to get a sense of, you know, how much more activity you expect in this avenue going forward.
That's a good question, Michael. So let me, you know, step back and share with you that any time we are exploring attracting third-party capital, it was the singular intent to grow our earnings per share for our public shareholders. If it doesn't translate to that, there is no reason for us to be attracting, you know, third-party capital. So let's start there. And if you filter any decision that we make and how it translates to growth, and if there isn't a clear tie-in, then we are not going to be pursuing that capital source. So that's the governing factor on anything we do. The reason why I've said is, you know, what are we going to do in the future remains, you know, unclear. But our intent is we have effectively, you know, solved for what we need here in the U.S. And, you know, our bill to suit with GIC also includes Mexico. But we do happen to be in other geographies as well. We are being approached by other sources of capital. And if we can create a distinct strategy that does not interfere with our ability to continue to buy on balance sheet and is truly accretive to what we are doing on balance sheet, those types of decisions and those types of, you know, channels are ones that we are going to continue to look at, continue to consider, and potentially add to the, you know, ecosystem that we have created. Just like we've done on our investment side where we've diversified asset types, we've diversified across geographies, we are trying to do the same on the capital side. Jonathan's done an amazing job diversifying on the fixed income side. We continue to do that today with, you know, this muni prepay structure that he talked about. But we had a single point of failure when it came to our equity capital, and that's what we are trying to diversify today. And hopefully this is the path to being able to get to our double-digit total return profile that we are all, you know, singularly focused on.
Got it. Thanks for that. And just as a follow-up, it seems like you're doing an increasing amount of these credit investments. So how should we think about the duration of some of these investments? And, you know, it seems like a shorter vault than maybe we've seen in the past. So can you just talk a little bit about what does that mean for the portfolio going forward?
Sure. And again, great question, Michael. Now, you know, a portion of the investment that we made was on this build-to-suit in Mexico. It's a perfect example of how we are effectively, you know, lending during the construction phase with the intent to own the asset, you know, once it's fully stabilized. That is part of our credit investment. The other bigger credit investment was on this data center project. Again, the intent there is to, you know, lend capital to a partner that we have decided is the right partner going forward on our data center strategy. And what we are hoping and we believe will happen is on the back end, we are going to be the owners of these data center assets. And what it is effectively allowing us to do is get a much higher yield on the front end of the, you know, on the development side, which can then make up for perhaps a nominal yield, you know, when we are actually buying the assets on balance sheet. And so, you know, again, this is a strategy. Yes, we start off with the credit side of the business, but it is leading to what we believe is the real estate, which was the intent behind why we instituted this credit investment strategy to begin with. So there's a similar story behind every credit investment that we do. And we are, you know, we are acutely aware that, you know, these tend to be shorter duration, which, by the way, is by design. We want it to be shorter duration so that we can then have the decision on whether or not when it comes to an end, do we own the real estate or not, or at least develop relationships with clients or with developers who can then feed us a lot more product downstream, but we are starting the relationship building on the development side. So that is really the thesis behind why we are making credit investments.
Operator
Thank you. Our next question today comes from Smitty's Rose at Citi. Please go ahead.
Hi. I just wanted to follow up on that, on the credit investments or that sort of loan portfolio, because we definitely see it with some of the other names that we cover. And it seems like, you know, frankly, a good way to kind of build relationships and end up with real estate ownership. Is there kind of a, I guess, sort of a limit, an upper limit on how much you'd be willing to sort of build in this book? It looks like it's, what, a little over a billion right now. Or, like, where do you think that could be in the next two or three years as some of these early loans start to roll off and you're replacing them, presumably?
It's a good question, Speed. You know, look, obviously it's not going to suddenly start to dominate what we do. Our capital is very dear to us, and, you know, it is very important that we allocate it appropriately. And, look, we turn down a lot more credit investments than we actually engage in. And so despite the plethora of opportunities available to us on the credit side, we are highly selective. And, you know, what size could it become? It's going to be a function of the overall size of our platform. Today we are $90 billion plus minus, you know, we have a small book of loans. But, again, it's by design. These loans are short duration, and the hope is that this same capital will then be, you know, used towards the permanent buying of the real estate. And so if we can't create that clear path, it's not something that we're going to be leaning into, you know, So unlike a credit, a true credit company, that all they do is invest in loans. In terms of percentages, I really don't have a numbers meet. This is going to be opportunistic driven. It's going to be driven by this strategy that I've laid out.
And then I just wanted to ask you, too, maybe just a little bit, just a bigger picture. I mean, you obviously took the investment volume outlook for the year up quite a bit. also a theme we see across, you know, many of the reports this quarter. Could you just sort of talk to kind of generally what you're seeing? I mean, I assume part of this is you have this access to these other pools of capital that's bringing opportunity, but just sort of bigger picture for the market in terms of how competition is trending or just, you know, U.S. versus Europe the sort of bigger picture?
Yeah, look, we are, obviously, we feel very confident of what a pipeline looks like. It is largely a function of the pipeline and our ability to forecast out what that's going to translate into for, you know, the entire year. That's what's helped us raise our number from eight to nine and a half billion. And, you know, what I would say is we did about – it was an even split between the U.S. and Europe, and this was something we started talking about last quarter where we had started to see a bit more of a momentum here in the U.S. than we had seen for the prior three quarters in 2025 where Europe was dominating, you know, what we were getting over the finish line. And so I think that trend, we are continuing to see a lot of opportunities in Europe, and that will continue to drive a lot of the volume. But we are starting to see similar impact here in the U.S., which is a good thing, which is why it gives us the confidence to increase the investment to $9.5 billion. And the other piece is what you touched on, Smeet. I mean, the fact remains that, you know, having these different sources of capital will allow us to do transactions that we wouldn't have done in the past. And, again, why are we doing all of this? It is to help grow our earnings per share. And so that's what we're seeing. From a competition perspective, public markets here in the U.S., I think that hasn't changed much. There is certainly a lot more competition on the private side here in the U.S. You know, I think our product is well understood now, and it's very attractive to private sources of capital to sort of pursue. So we do see that competition, but elevated, you know, interest rate environment will continue to be a benefit for us because, you know, debt capital remains elevated. And so in order for these private sources of capital to meet their return hurdles, it's going to be a little bit more of a challenge. Europe continues to be, you know, a very interesting area for us. I mean, I've mentioned this in the past, and I'll mention it again. I think Neil and the team have done a great job of becoming the go-to net lease name, especially in the U.K., and soon it's translating into mainland Europe as well, where we get a lot of, you know, off-market transactions, where, you know, transactions are negotiated on an off-market basis, and closed. And the fact that we have delivered for so many of our clients there, you know, the repeat business continues to be a big driver of the volume that we've gotten over the finish line. I believe for this quarter, it was circa 94% was effectively relationship-driven businesses. So I think that's what the landscape looks like from a, you know, from a competition perspective.
Operator
Thank you. Our next question today comes from Wes Galladay at Baird. Please go ahead.
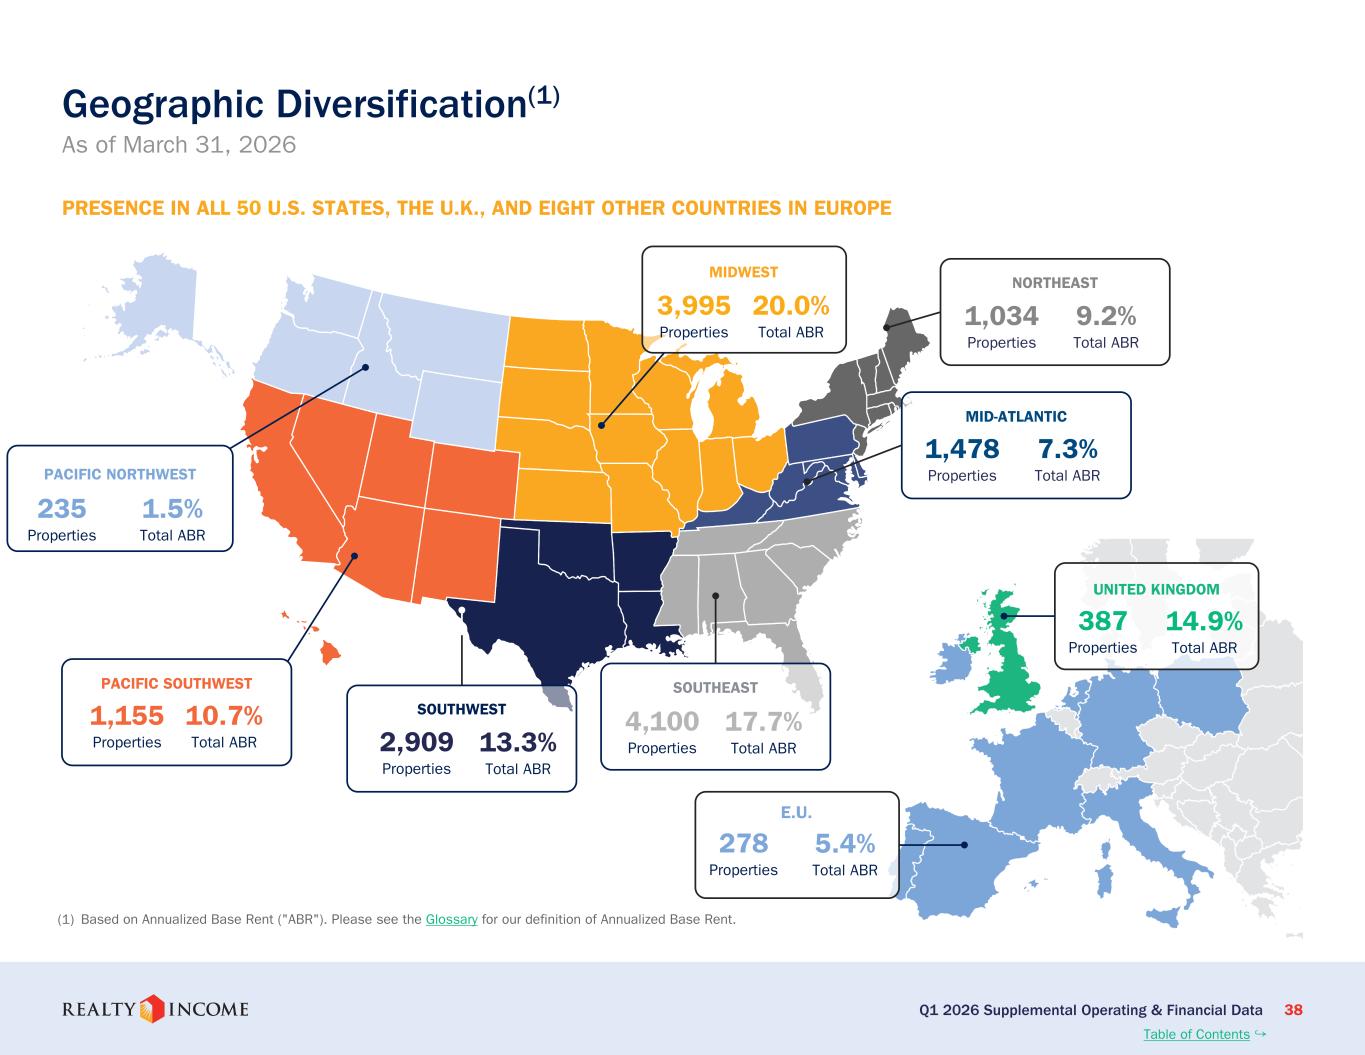
Hey, everyone. A question on the UK. Are you doing much over there right now on the investing side or in the pipeline? I'm just curious how the bond market volatility is impacting the bid-ask spread, and maybe there's some opportunistic opportunities in the pipeline there.
I'll start it off, and then, you know, Neil, if I miss something, please jump in. Yes, it is absolutely true that the bond market in the U.K. is quite elevated. But it is also true that we are getting higher cap rates because of the cost of capital environment in the U.K. And more importantly, we are pursuing transactions and we are providing solutions because of the retail footprint that we have that continues to be very attractive to potential clients. And it creates opportunities for us to invest with them either via the, say, leaseback route or through repositionings of assets where we are attracting these clients remains an area that is very helpful. But outside of that, Neil, if there's anything else you would like to add in terms of the market, in terms of what you're seeing, that would be great.
Thanks, Amit. So I would say we continue to see a very healthy pipeline in the U.K. The higher rate environment has meant that yields are either moving out or will soon move out. And then beyond that, the historical pattern that we saw of funds having to sell just because of redemptions or end-of-life continues and makes it a very good time for us to consolidate the market there.
Thanks a lot. That's all for me.
Operator
And our next question today comes from Jim Kamert at Evercore. Please go ahead.
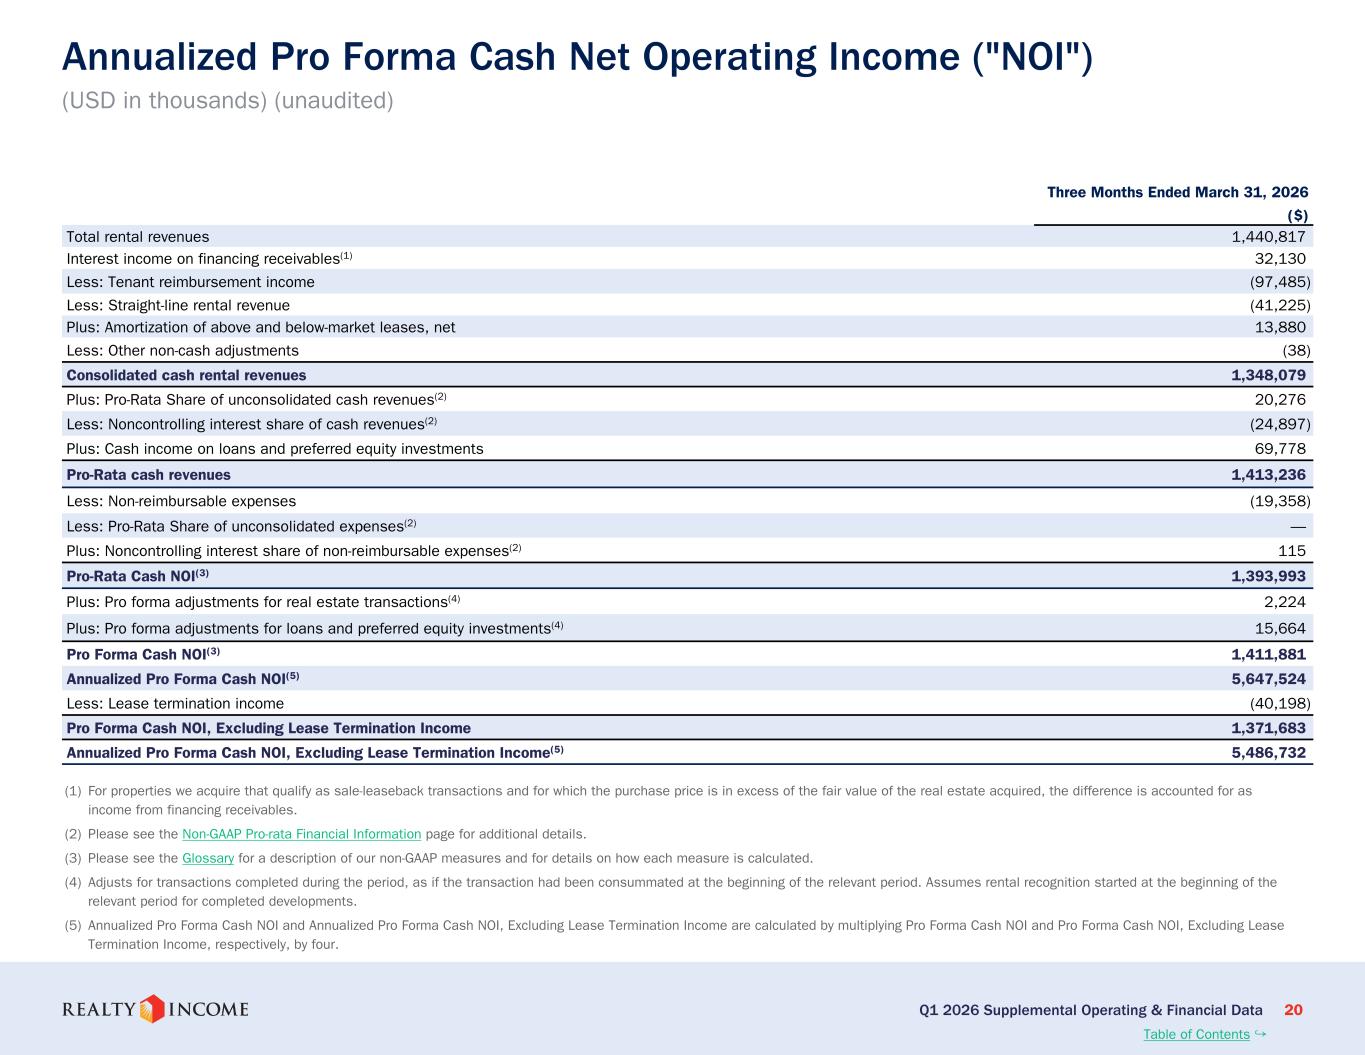
Given the intensified sort of asset management function vis-à-vis the capture of the lease term fees, is it a reasonable assumption that the annual lease term fee revenue can trend in the 85 to 95 basis point type level of ABR, which I think the 26 guidance equates to? i wouldn't look into you know what we are doing what we did in 2025 and what we are planning on doing in 2026 as you know the new watermark for lease terminations i think what we are trying to do jim is make sure that if we are starting to see opportunities with certain clients with certain assets that we are taking care of those right now and this is an intent to sort of you know Look, we did two very large-scale M&A deals in the last four years, and we obviously inherited a lot of assets that were not ideal for the long-term hold strategy that we have, generally speaking, on anything that we do organically. And so this is a mechanism that we are using to sort of reposition those assets with the right clients or, you know, accelerate the rent collection and dispose of these assets so that we can get to, you know, a profile of portfolio that will fall into that long-term hold strategy. So I don't see, you know, $45 million to $50 million, which is our current forecast, you know, continuing indefinitely for our strategy going forward. This is, you know, much more episodic and much more around what we see in our portfolio today, and I gave you the rationale as to why we see that. It's largely through these M&A transactions.
Well, thank you, Stephen. The M&A context and cleanup makes a lot of sense. I get it now.
Operator
Thank you. Our next question today comes from Hendo St. Just at Mizuho. Please go ahead.
Hi, this is Mike. I'm with Hendo at Mizuho. My question is, what is the timeline to full deployment of the $1.7 billion U.S. core plus fundraise, and how much management fee income could that generate on an annualized basis?
Thanks, Mike. Look, we are very close. I think in our opening remarks, we mentioned that we've raised the $1.7 billion, which we had forecasted, to the market. We are very close to full deployment. Our belief is that, you know, the next time we are having this earnings call, all of that equity capital will be fully deployed. And then, of course, given that it is largely an unlevered structure today, we will still have dry powder to continue to invest beyond the 1.7 and get to a zip code of $3.5 to $4 billion of, you know, assets under management. I think we also share – Jonathan, do you want to take the management fee comment?
Yeah, in terms of the annualized management fees, once fully drawn, it'll be a little bit over $10 million on an annualized basis. And these are all base management fees. It doesn't include any kind of promotive rules or anything.
Thank you. That's helpful.
Operator
Thank you. And our next question today comes from Anthony Palone, AP Morgan. Please go ahead.
Yeah, thanks. Sumit, I think you talked a lot about just the debt, the why, and so forth around all the deal activity. But just for this year, the $9.5 billion, any sense as to how much of that's likely going to be debt?
And then the rest, how we should think about your share, just to try to roll all that up? i really don't have a number for you in terms of what's going to constitute debt you know of that nine and a half billion tony i'm sorry like i said it is very opportunistic it is very episodic some of what initially starts off as a debt investment will then convert over to an equity investment because ultimately the name of the game here is to own the real estate. So, you know, if this is the way how we can ultimately own the real estate and in the meantime get enhanced returns, I think that is why we are doing what we are doing. But I'm sorry, Tony, I don't have a number of that nine and a half billion that I can share with you with a high level of confidence that it'll constitute, you know, the debt piece of our investment strategy.
Okay, fair enough. And then just my follow up is on the Apollo transaction. How should we think about that as being whether, like if there's new money coming in from that, is it likely that you'll just sell stakes and existing assets or will that be used to go out and buy new assets? I'm just trying to think whether that falls into the full year, or $9.5 billion if you continue to go down the path of using that capital? And also, just what do you think the capacity is there that they have to offer you?
Yeah. You should expect, you know, any new capital that we raise through the, you know, Apollo Channel will be on new investments. Now, it is possible that just because of expediency, we end up warehousing the assets on our balance sheet, but it will be assets that we are buying with the intent of putting into this Apollo strategy. So, look, the proof of concept was very important for everyone involved, including Apollo and including us. And now that we have, you know, the mousetrap fully functional, fully endorsed by the rating agencies and the SEC, we're going to really lean into expanding that channel. But it should be on new investments that we make.
Operator
Thank you. And our next question today comes from Ronald Camden with Morgan Stanley. Please go ahead.
Hey, just my quick one, just looking at the real estate acquisition cap rates look like came down another 20 basis points this quarter, similar to last quarter. Maybe can you just talk a little bit about sort of the competition and just your thoughts on just the cap rate compression that you've seen and any forward thoughts?
Yeah, sure, Ron. Good question. No, this is precisely what we expected. When you are starting to buy assets into the fund, we have shared with the market that the fund is going to be buying assets at a lower yield. And when you blend all of that in, you know, the fact that our average cap rate is going to be a little lower is a function of that strategy. So, you know, ultimately it's all about growth. And, you know, if we look at the fact that we have effectively increased the midpoint of our guidance by two and a half cents, that is what's driving, you know, a lot of what we are doing. But the 6-7 was fully expected, and it's a function of us being able to deploy more and more of the fund capital into the assets that are lower yielding.
Great. My quick follow would just be on, if you could just give us an update on the watch list again, and going back to sort of the termination cost in the quarter, how much of that are we through? Is that a number that's going to recur over time, or does that create a tough comp for next year?
No, it's – I think somebody prior to you asked this question, Ron, and I don't think you should expect us to come out with, you know, the same number year in, year out. I'm not going to say that next year we won't have a similar number, but I'm just saying that this is, you know, this is being done with, you know, with the intent of making sure that the remaining portfolio that we have is truly a long-term hold strategy for us. And we are trying to create a win-win situation for our clients who are not long-term, you know, tied to that particular location. And at the same time, you know, for us, when we believe we can actually collect on the remaining rent and then be able to entice another client to step in on these particular locations. But, yes, if next year, mathematically speaking, you know, if our termination income is going to be less, it is a headwind. But we are not, you know, we are not doing this with the intention of, you know, this is going to become an ongoing strategy and it will have a similar quantum. It is largely being driven by asset management decisions that our asset management team is very focused on executing upon.
Operator
Thank you. Our next question today comes from Eric Borden at BMO Capital Markets. Please go ahead.
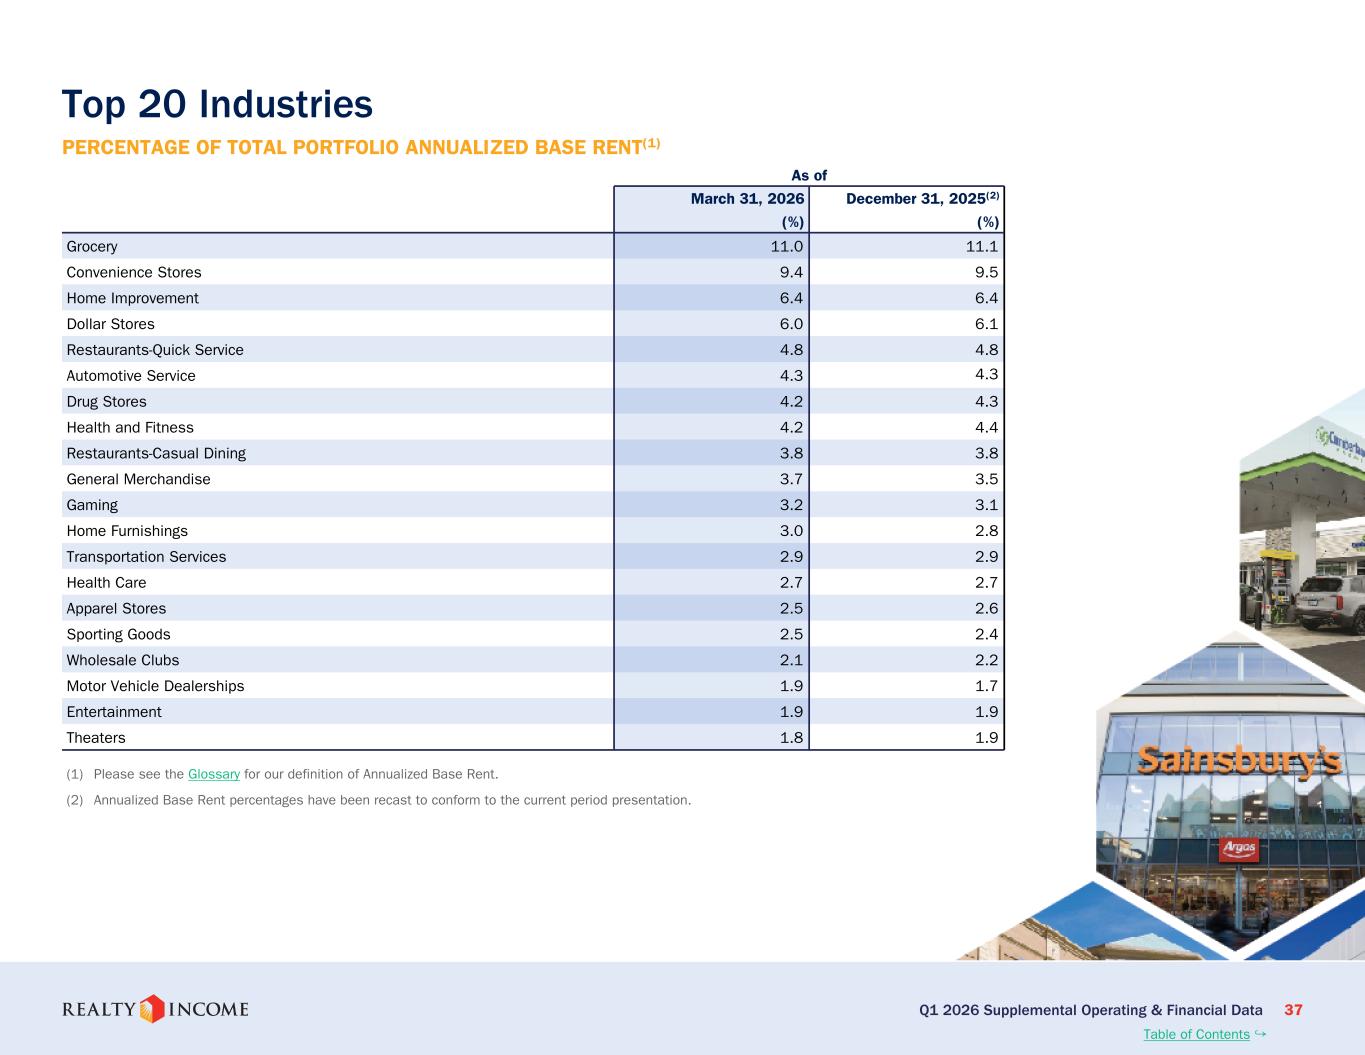
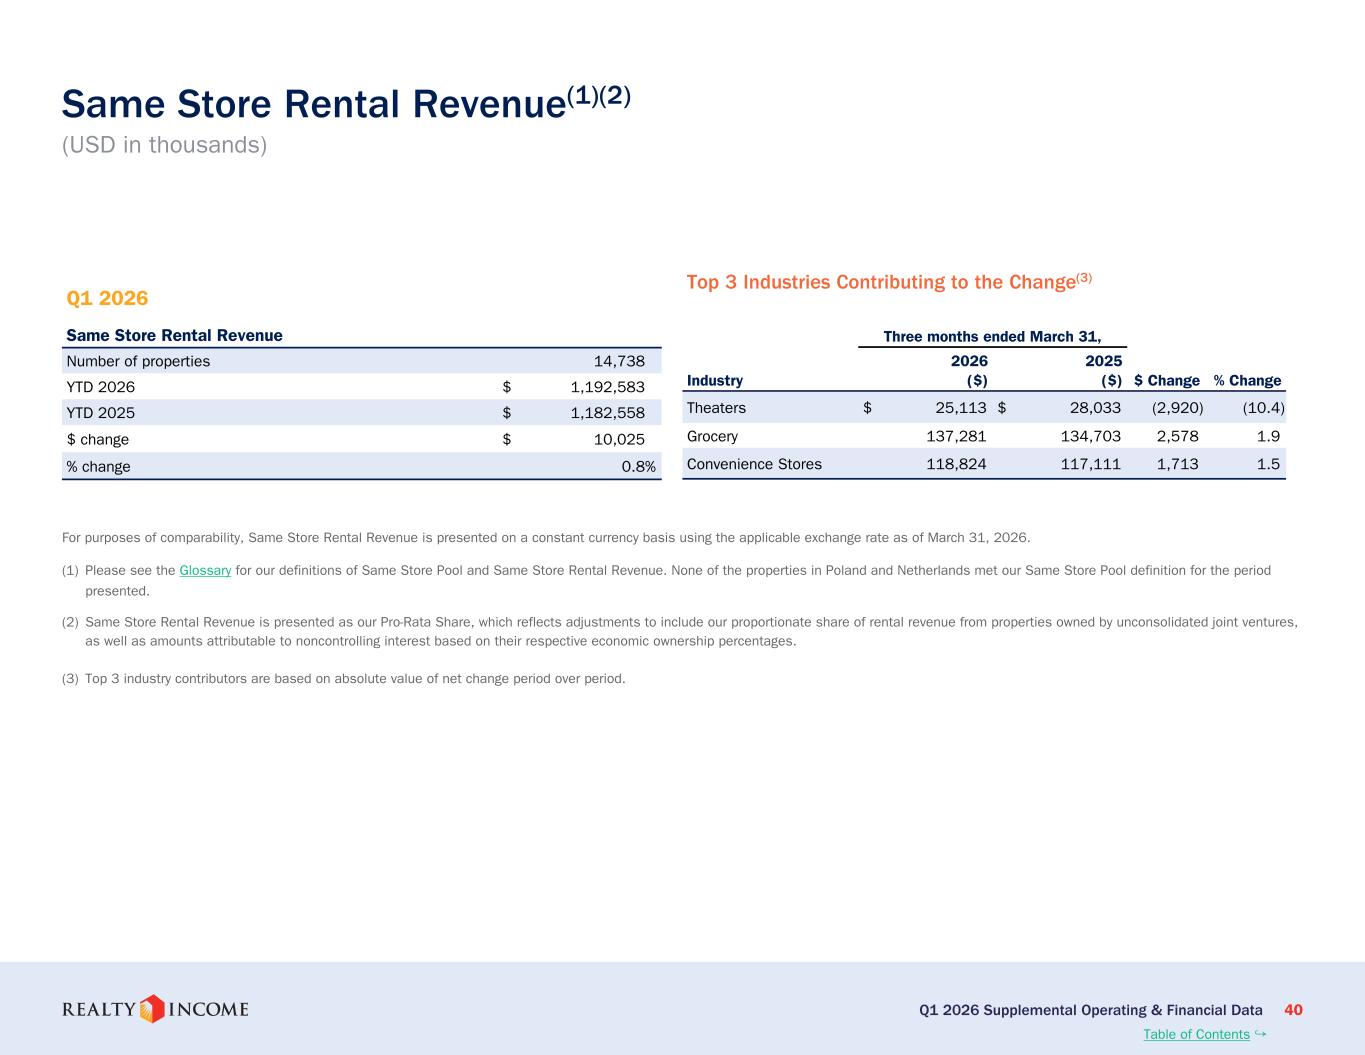
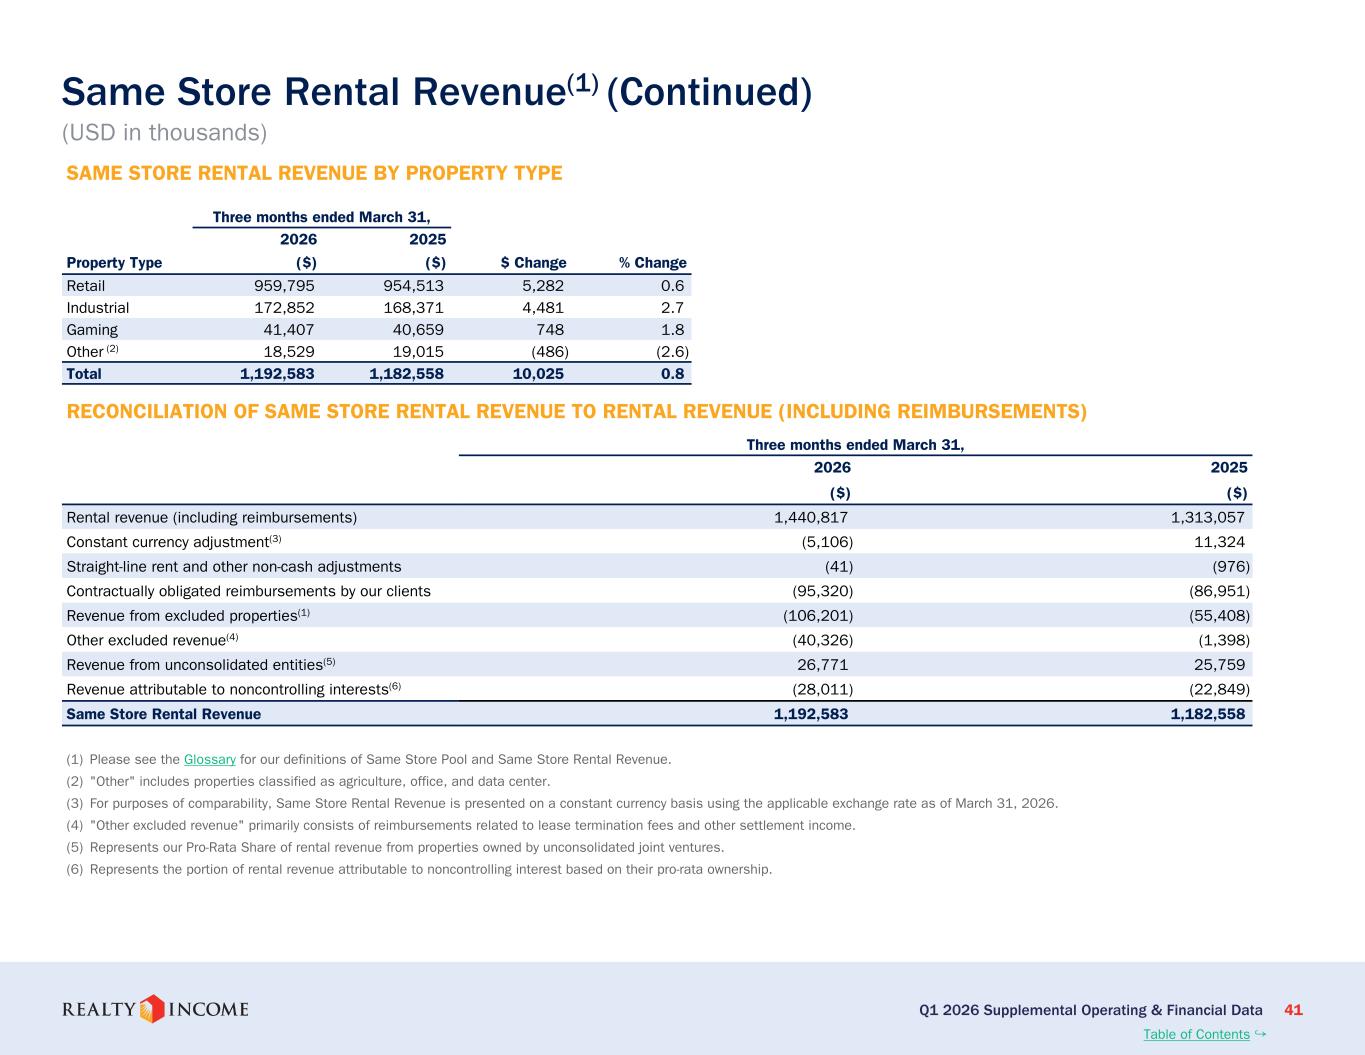
Hey, thank you for taking my question. Same-store rental revenue for theaters declined about 10% year over year. Just curious what drove the underperformance this quarter, and how are you guys thinking about the outlook and potential credit risk within the theater segment going forward?
Yeah, great question, Eric. Look, I think there were a lot of adjustments that we made to both when Regal came out of their Chapter 11 situation. And so, you know, that obviously is part of what is flowing through on a same-store basis. Also, I think the first quarter of last year, we moved some of the cash accounting to accrual accounting. And so from a, you know, comp perspective, We recognized and accelerated the recognition in the first quarter of last year. And so, you know, when you compare that to what we have this year, you know, it was, again, a headwind. Some renewals that have gone through, we have shifted more to a percentage rent type of arrangement with some of these operators. And so the base rent is lower vis-a-vis the base rent, and that's all we actually compare. And so, again, from a same-store basis, that, too, would have been a bit of a headwind. And then some restructurings, you know, at home emerged. And though the outcome for us was very good, there was a slight adjustment down on some of those rents, and that's what's flowing through the business. If you're talking about what do we think about the theater business going forward, you know, There was a big conference a couple of weeks ago. So far, so good. First quarter was great. Second quarter is turning out to be pretty good. And the numbers that I've heard bantered about is $9.5 billion in sales, which is, of course, still not anywhere close to 2019 levels of $11 billion, but moving in the right direction. And so we hope to see some of this flow through on the percentage rent, but that gets calculated at the end of the fiscal year.
Thank you for that. I appreciate it. And then more of a bigger picture question. Assuming in your prepared remarks, you noted that you sourced $31 billion of opportunities but only closed 9% selectively. Where are you seeing the largest disconnects today between your underwriting and seller expectations?
Yeah, look, I do see some of it is just unreasonable expectation. The pricing seems to be off. Everything else would work, but there's a disconnect between what the seller wants versus what we are willing to pay. And, you know, some of the source is on the high-reielding stuff that we just are not comfortable, given the adjusted return profile that we are seeing, especially in an environment where interest rates are highly volatile and the cost of debt could be something that we are acutely aware of could, you know, be a headwind for some of these operators. And so it's a combination of multiple factors. Look, we've always been very selective. If you look at the history of what we've sourced and what we've closed, it is, you know, right in that 5 to 10% zip code. And so 9% this quarter is in line with what we've done. But the point for sharing these sourcing numbers is to say, look, it's all trending in one direction, and we are starting to source more and more, and it is absolutely a byproduct of the team that we've developed, the geographies that we've added, the asset types that we have, you know, decided to pursue. All of these swim lanes are translating into much higher volume, and it's allowing us to pick and choose the investments that make sense for us. And so, you know, what we pass on, there could be so many different reasons, including the couple that I've just shared with you.
Operator
Thank you. And our next question today comes from Greg McGinnis at Scotiabank. Please go ahead.
Hey, Sumit. Is there any color you can provide in terms of the potential annual capital contributions from GIC or Apollo that they're looking to place, you know, newly placed into these programmatic ventures?
Yeah, so Greg, the GIC partnership is $1.5 billion. That's their initial contribution to the partnership, the JV that we've created. Apollo obviously was $2 billion of assets under management. We don't have a number that we have shared with the street in terms of how much more could this be. I mean, it's going to be, again, opportunity-driven, and, you know, this will be us in constant contact with our partners to make sure that when we are seeing something that they would be interested in participating and it meets their return profiles, et cetera. The return profile, obviously, it will meet because those are the only ones you're going to be sharing with them. But we don't have, Greg, a number in mind in terms of how much bigger each one of these partnerships would be. But let me just tell you this, that we wouldn't have engaged in either one of these partnerships if we didn't believe that this was programmatic in nature and could become a huge source of our alternative equity capital going forward.
Okay. Thank you. And then from your data center comments, should we interpret that to mean there's more of these investment opportunities in the pipeline with the same partner, and then any color on the magnitude or yield on those would be appreciated?
Yes, you should assume that we are in ongoing discussions with our partners to obviously continue to grow this relationship. But once again, there are no definitive commitments on either side. But the goal is, you know, when you're engaging with someone, the intent will always be to deploy more capital. And like I said, they are, in our opinion, one of the best in class private developers of data centers.
Operator
Thank you. And our next question today comes from Ryan Caviola at Green Street Advisors. Please go ahead.
Thank you, and good afternoon, everyone. Europe Investments this quarter had a weighted average lease term close to six years. Is that driven by potentially a return to retail parks that have those shorter terms or just a result of the general mix or maybe a different property type? Any color you could share there would be appreciated.
I'll take this, Ryan. So, look, I think, you know, as we look at retail parks, we are consciously prioritizing investments where we believe there's roll-up potential. I think if you look at the recent releasing that we've talked about and other peers in the U.K. have talked about, there's now an acceleration in rent and a shrinkage in giveaways like TIs or CapEx. And so we're actively looking for retail parks. We continue to have a high-yield bogey on those. But increasingly, if we can find short tenancy, we are taking that.
Got it. That's helpful. Thank you. And then just on cap rate trends, you know, we touched on it briefly earlier in the call, completely stripping out the private fund cap rates that obviously drive down that weighted yield. Could you just give color on public acquisition cap rate commentary in terms of compression or stability? Maybe a Europe versus U.S. split. Anything would be helpful. Thanks.
Yeah, so Ryan, I mean, obviously, we've been asked this question every quarter for the last, I don't know how many years, but every time I've made a comment around, we're starting to see, you know, the direction of drift of cap rates one way or the other, I've turned out to be wrong. I mean, it's pretty much stayed in this, you know, zip code, if you will, for now two years and continuing. And if you look at what's happened to the 10-year, it stayed in this band of 3.8 to 4.4, 4.5 for that same duration. And so it is so difficult. If you're asking for a forecast, Ryan, of where I see cap rates going, I might answer that question with a question. which is what is the direction of drift for the 10-year? I mean, every day we get this incredible volatility in terms of what people think will happen to the short-term rate and how it translates to the longer-term rate, et cetera, et cetera. So at this point, I'll tell you what we are seeing in the market is effectively what we've seen these last couple of years. It's the same zip code for assets, you know, that we are buying 100% on balance sheet, But obviously, our ability to do more and go after, you know, lower yielding, higher quality, more growth assets has now widened. And so, we are able to do a lot more.
Operator
Thank you. And our next question today comes from Jay Kornreich at Cantor Fitzgerald. Please go ahead.
All right, thanks. Just wanted to ask about geographies. You know, you entered Mexico recently, and just wondering, as you explore new investment locations beyond where you currently have a presence, are there any new frontiers that, I guess, agree more favorably that you'd like to expand into in the future?
Yeah, so Jay, you know, if we talk about Mexico just for a second since you brought it up, and it is the last geography that we entered into, look, it was largely a client-driven opportunity for us. We went in there with our partners who had, you know, decades of experience developing in that market. We tried to minimize the risk in terms of currency fluctuations by making sure that our leases were dollar denominated. with clients that we understood and we knew very well. And it was largely a macro thematic play, seeing the nearshoring and the onshoring of, you know, what we see as basically tailwinds in the logistics sector, in the industrial sector. So this was our way of playing that particular theme with partners who we felt very comfortable with. And so if these types of thematic opportunities present themselves, Jay, we are happy to continue to expand geographies, et cetera. The good news is we've done it now in so many different geographies. We have the playbook down. We understand the risk. We know how to get our arms around, you know, the inherent risk of investing in new geographies. There was a piece that my colleague Neil did in the Financial Times where he talks about how people underestimate the operational intensity of making these investments. We've got that covered. We are, I would say, at this point, got the blueprint, and we recognize the risks, and we are happy to sort of absorb those for the right opportunities.
Okay. I appreciate that. And then just going back to the 94% of investments that you mentioned were relationship-driven, which seems like a very high number, was that more so tied to the private partnerships that you recently done or were there other dynamics that led to leveraging current relationships, I guess, more so than seeking new ones this quarter?
A lot of them are existing clients that we have operating our assets. Some of it was developers that we have done repeat business with. Some of it was, you know, clients that we are co-investing with and, you know, looking at opportunities together. It's all of those, you know, elements that go into that 94%. And I think, you know, as we cultivate new relationships, as we cultivate, you know, new opportunities, you will see that number right around that 85% to 90%, 95%. It's been very steady. It's just that the quantum that that percentage represents is continuing to grow as we become more familiar with, you know, as our name becomes more familiar in the sale-leaseback arena with developers, with clients, and with capital sources.
Operator
Thank you. And our next question today comes from Jason Wayne at Barclays. Please go ahead.
Thank you. Just the properties that they created early to date in your asset management strategy, can you talk to your expectations on mix for sell versus release and what kind of recapture rates you're seeing on those?
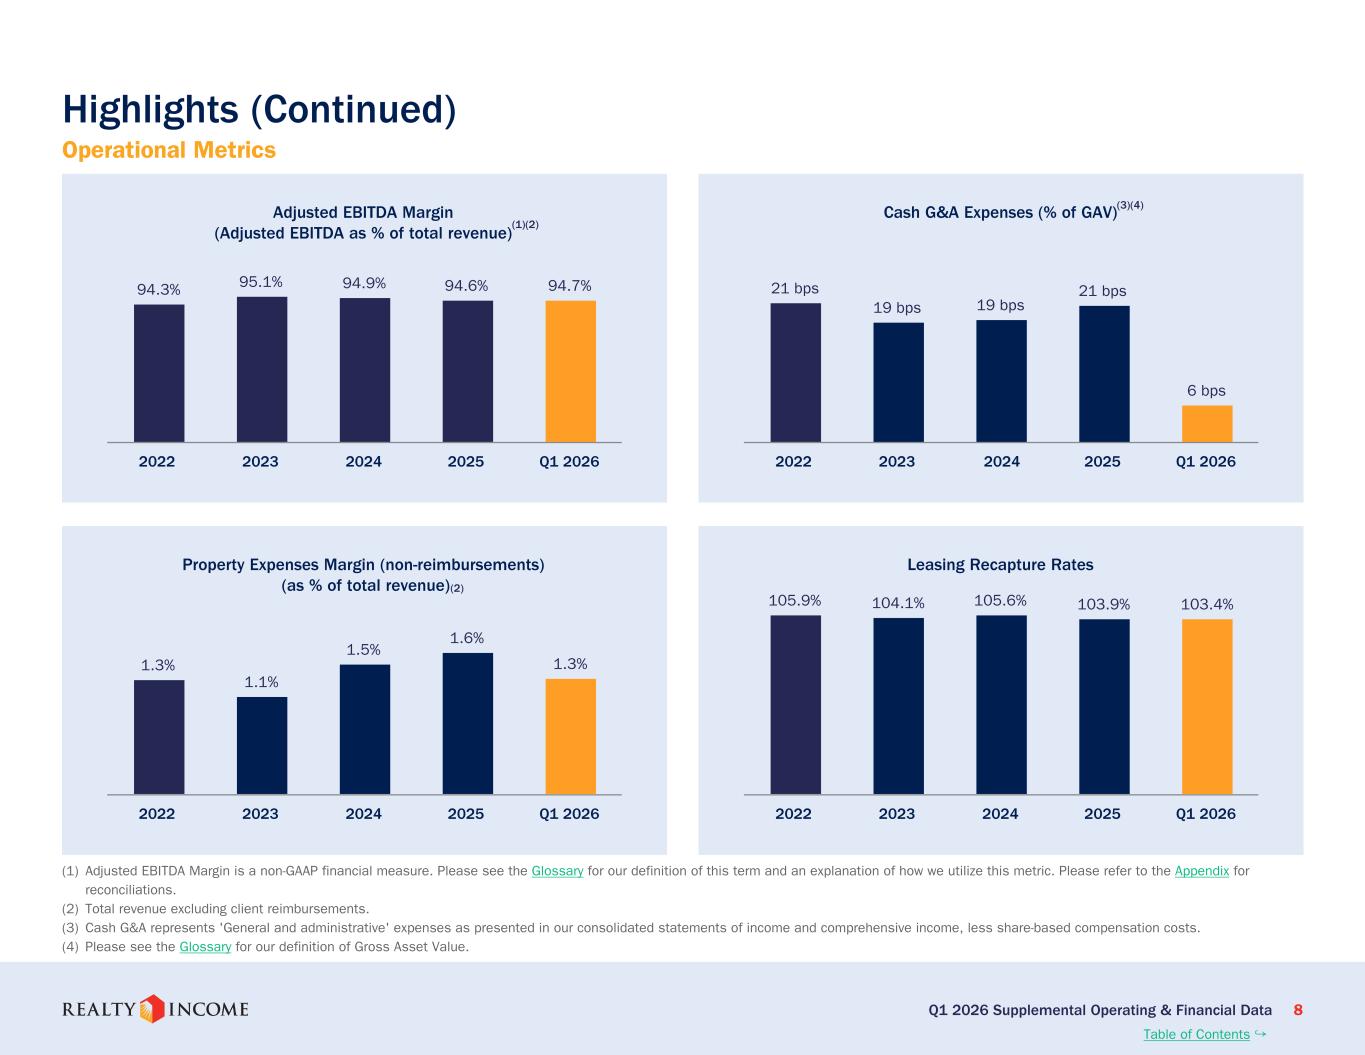
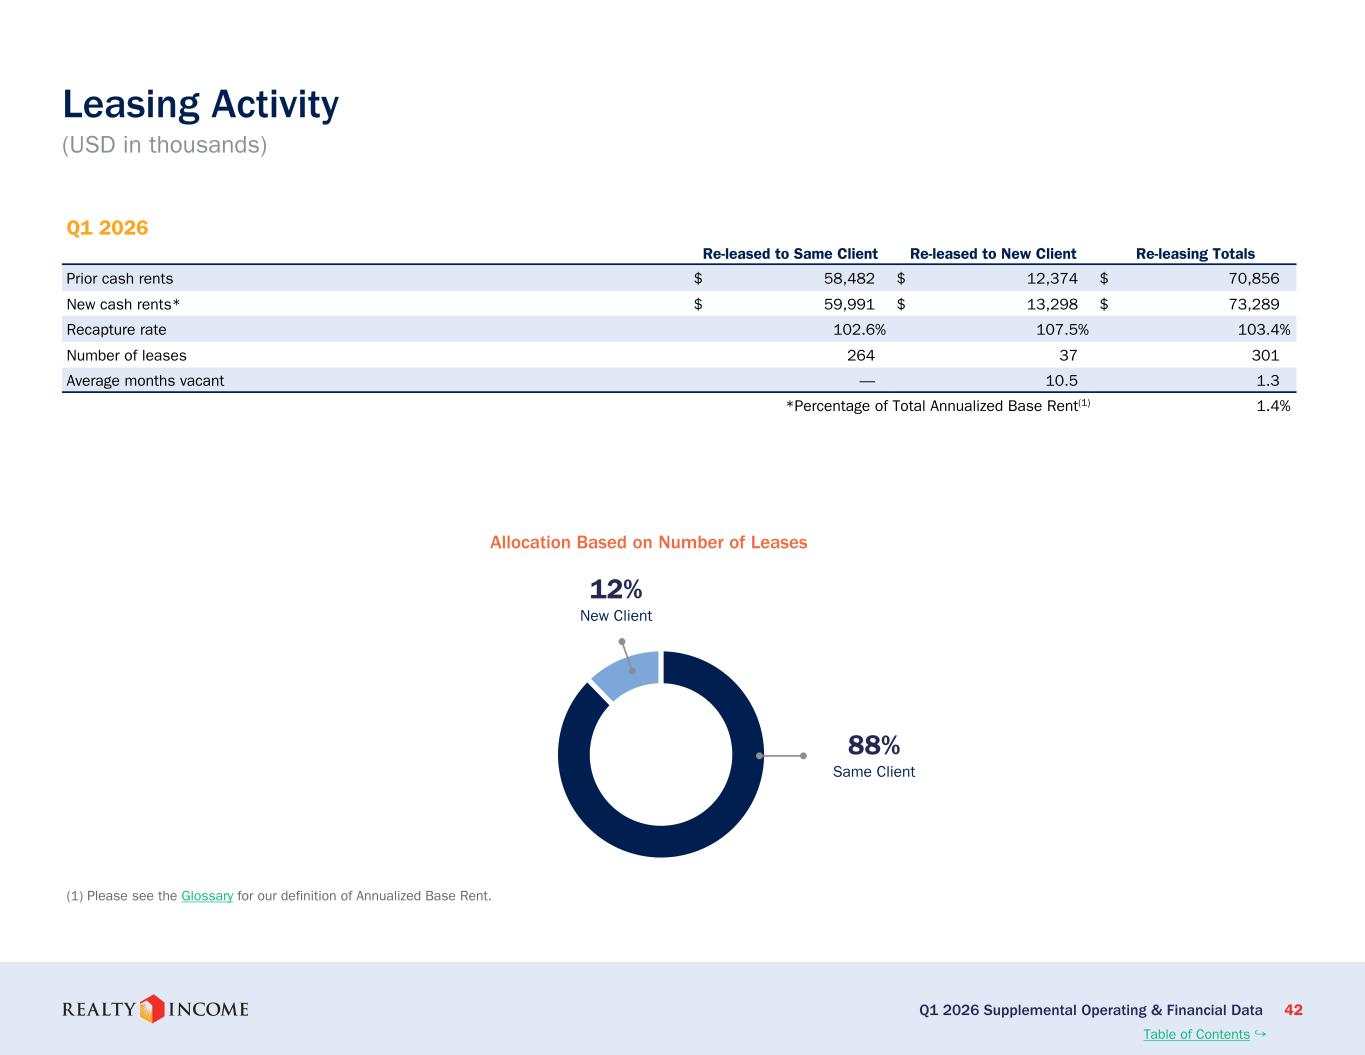
Yeah, sure. So, Jason, any time an asset is coming up for, you know, if there's a lease expiration in the near term, and I would say in the next two to two and a half years, you know, our asset management team is very focused on trying to figure out, you know, what is going to be the ultimate outcome. And then it can effectively take multiple, you know, routes. That is one of the strategies that they are executing. Another one would be if, you know, through our predictive analytics channel, if we are looking at location risk and we see that particular assets are, you know, no longer going to be viable, even if the expiration is five, seven years out, we would put those on the disposition bucket and we would try to dispose of those assets. And so there's a variety of reasons. There could be a credit event that we see coming down the pike that could, you know, help drive disposition decisions. We then look at, okay, even if this particular client is going to be willing to stay, what is the releasing rates that we believe we can get? And if our asset management team thinks that there is enough alternative clients that could be stepping in and giving us more, that's, again, a decision that they rely upon. Of course, all underpinned by the predicts of analytics and what it's suggesting would happen in that particular location. So there's a variety of, you know, analysis that the asset management team goes through. And what they are focused on is what is going to yield the highest return, economic return, based on these various different decisions that one can take. And then they try to implement, you know, that highest return probability. And in some cases, taking a rent haircut is the right long-term decision. Having said that, if you look at what we've been able to achieve in totality every quarter, it's been, you know, like even last quarter, we just reported it, it's not of 103%. So our, you know, renewal rates and releasing rates in combination is yielding us, you know, north of 100%, 203%, quarter in, quarter out. But like I've said before, sometimes the right decision is to take 99% recapture rate rather than trying to sell that asset vacant or try to attract a client knowing fully well that the recapture rate is going to be lower. So it's a very fluid strategy, Jason, but one that we believe that we have the best asset management team on the street. They have years and years of experience. And when you control so many assets for a given client, the benefit of having a conversation not on a single asset but on multiple assets for that client is something that translates into these higher recapture rates that our asset management team does brilliantly on. So that's really how we think about renewals and releases and sales.
Yeah, that makes sense. Thanks for the color. And I guess just on the full-year disposition volume, you gave $750 million last quarter on track. Is that still the expectation for this year?
Operator
And our next question today comes from Upul Reina with KeyBank Capital Markets.
Please go ahead. Great. Thank you for taking my question. Just one from me. Assuming that you've spoken on several industries already, But I had a question on the gaming category. How are you viewing the industry today, and what's your appetite to invest more into that category through any of your investment vehicles? The category did tick a little higher to 3.2% in the quarter. Thank you.
Sure, Rupal. Good question. You know, I would put gaming in a similar, you know, thought process that I described our digital investments. And what I would say is the operator is going to be very important to us. The location of these assets is going to be very important to us. The sustainability of EBITDA and the ability of these operators to extract that EBITDA is what we are very focused on, which is why if you look at the investments we've made, largely three investments, right, Mark? It's City Center, Bellagio, and we own 100% of the Wynn in Boston. And so that will continue to dictate our gaming strategy. And obviously having a very close relationship with both MGM and Wynn, one could argue two of the best operators in the space, should yield more transactions for us. But again, we're going to remain very, very selective, Opal.
Operator
Thank you. And that does conclude our question and answer session for today. I'd like to hand the conference back over to Sumit Roy for any closing remarks.
Thank you very much for joining us today, and we look forward to seeing you at NARIT in a few weeks.
Operator
Thank you, sir. That does conclude today's conference call. We thank you all for attending today's presentation. You may now disconnect your lines and have a wonderful day.