Operator
Good day, and welcome to the Realty Income Second Quarter of 2025 Earnings Conference Call. All participants will be in a listen-only mode for the duration of the call. And should you need any assistance today, please signal a conference specialist by pressing the star key followed by zero. After today's presentation, there will be an opportunity to ask questions. To ask a question, you may press star, then 1 on your touchtone phone. And to withdraw a question, please press star, then 2. Please also note that this event is being recorded today. I would now like to turn the conference over to Kelsey Mueller, Vice President, Investor Relations. Please go ahead.
Thank you for joining us today for Realty Income's 2025 second quarter operating results conference call. Discussing our results will be Sumit Roy, President and Chief Executive Officer, and Jonathan Pong, Chief Financial Officer and Treasurer. During this conference call, we will make statements that may be considered forward-looking statements under federal securities law. The company's actual future results may differ significantly from the matters discussed in any forward-looking statements. We will disclose in greater detail the factors that may cause such differences in the company's filing on Form 10-Q. During the Q&A portion of the call, we will be observing a two-question limit. If you would like to ask additional questions, you may re-enter the queue. I will now turn the call over to our CEO, Sumit Roy.
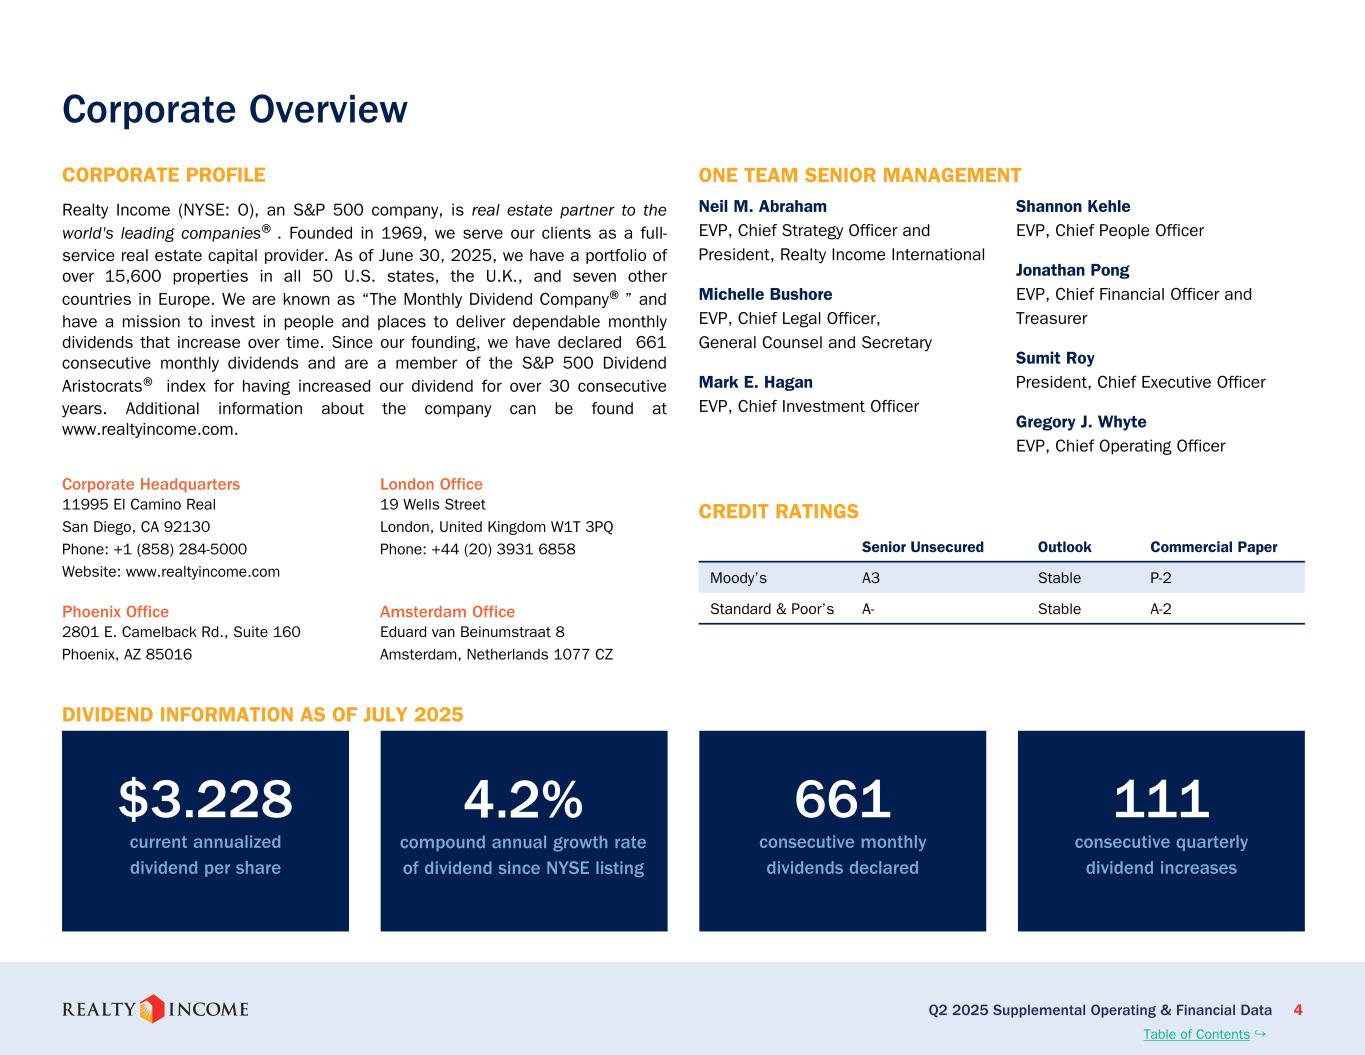
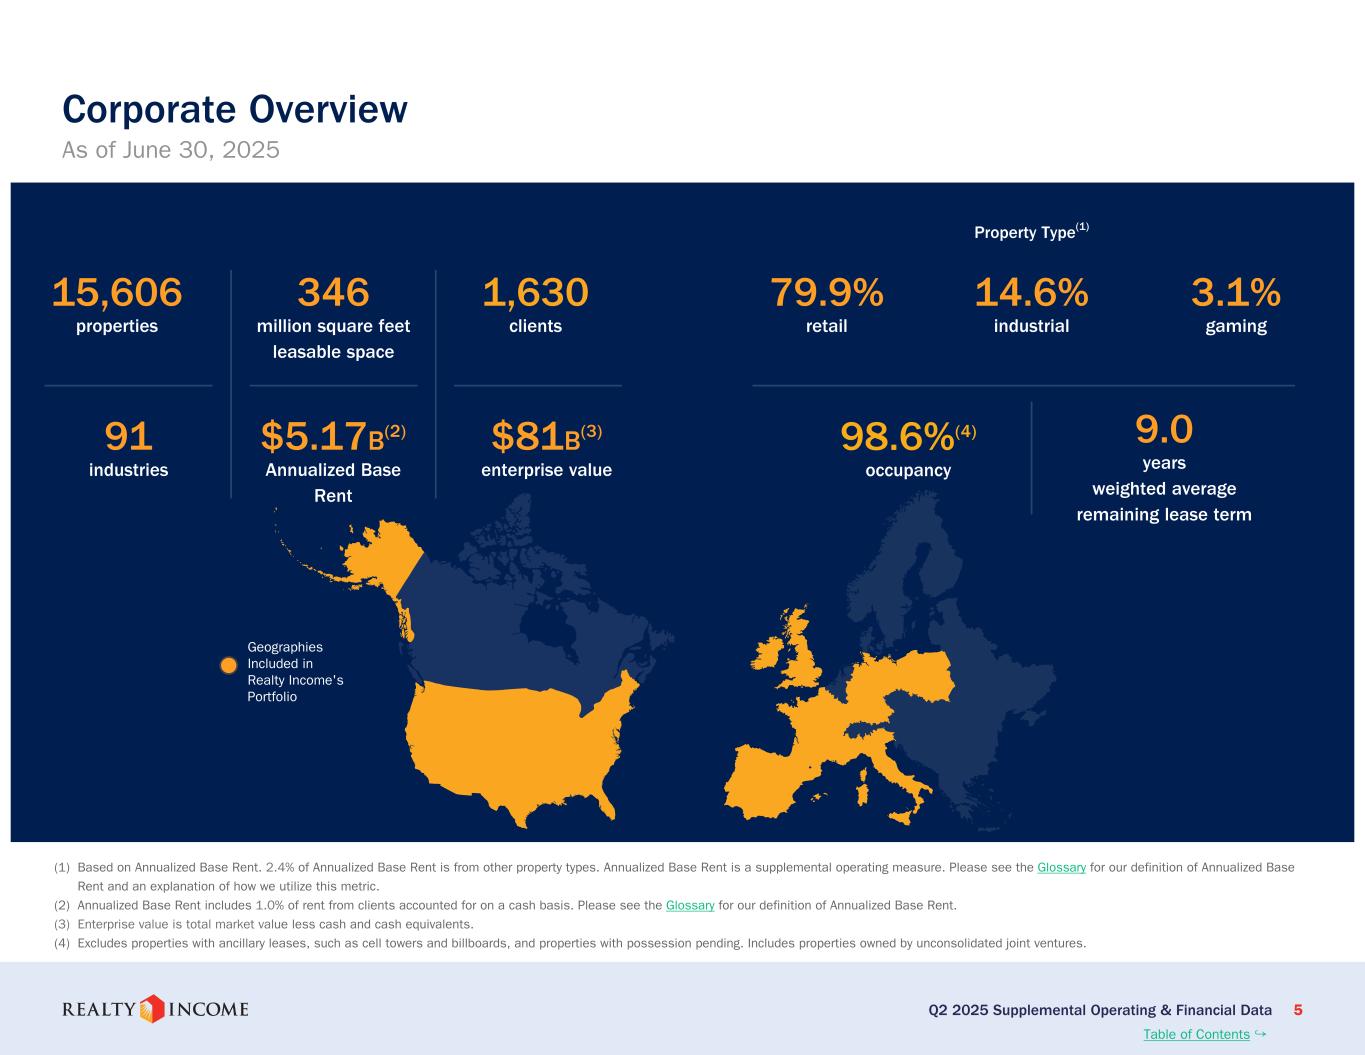
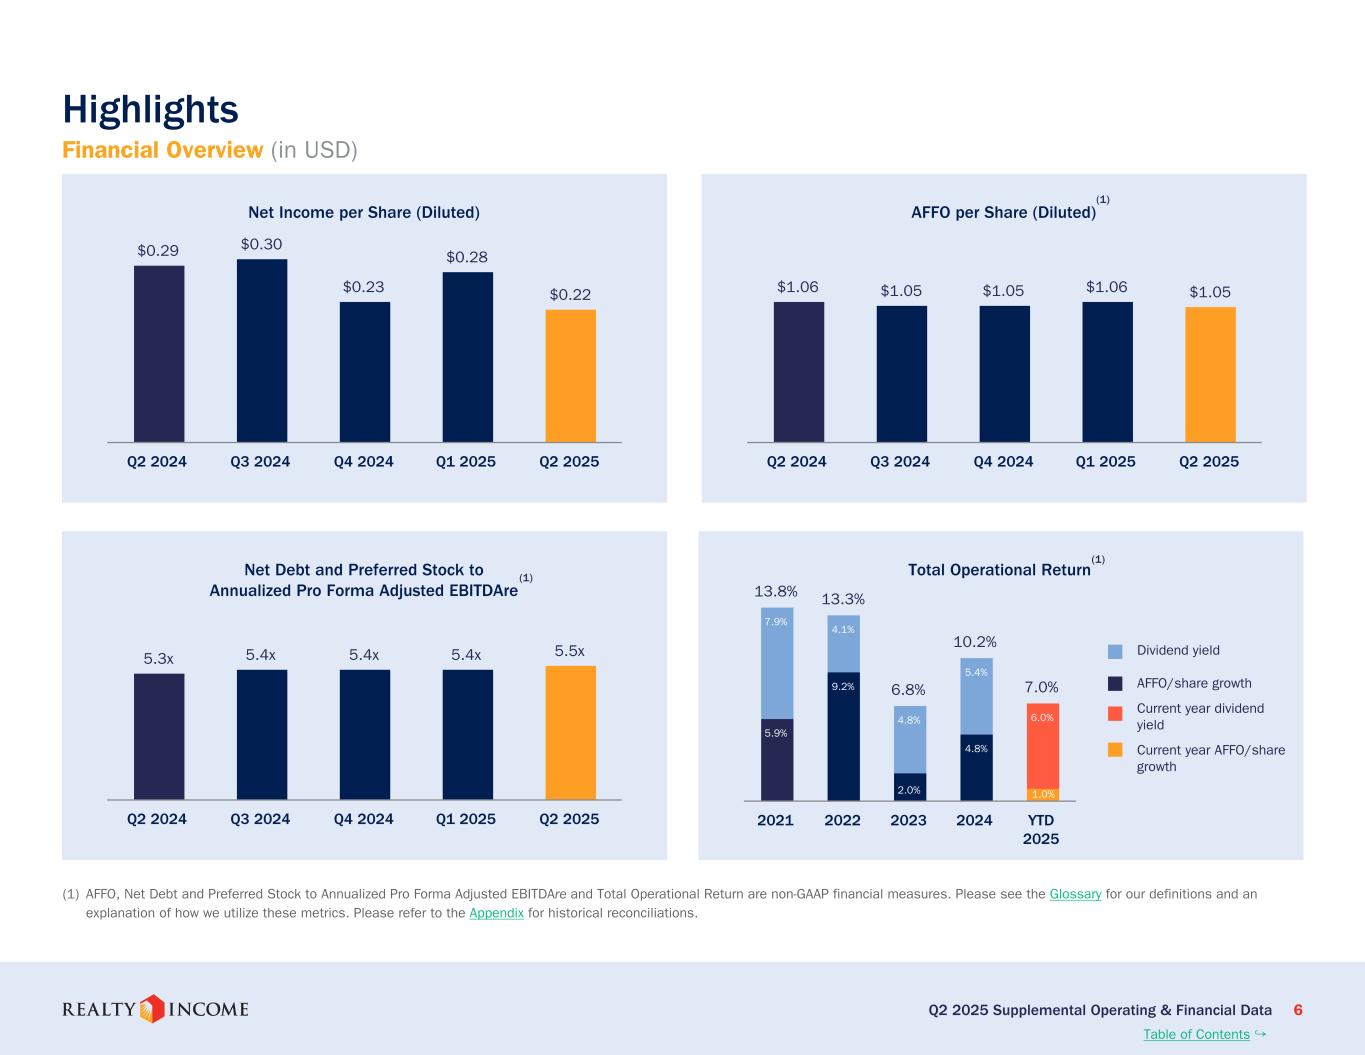
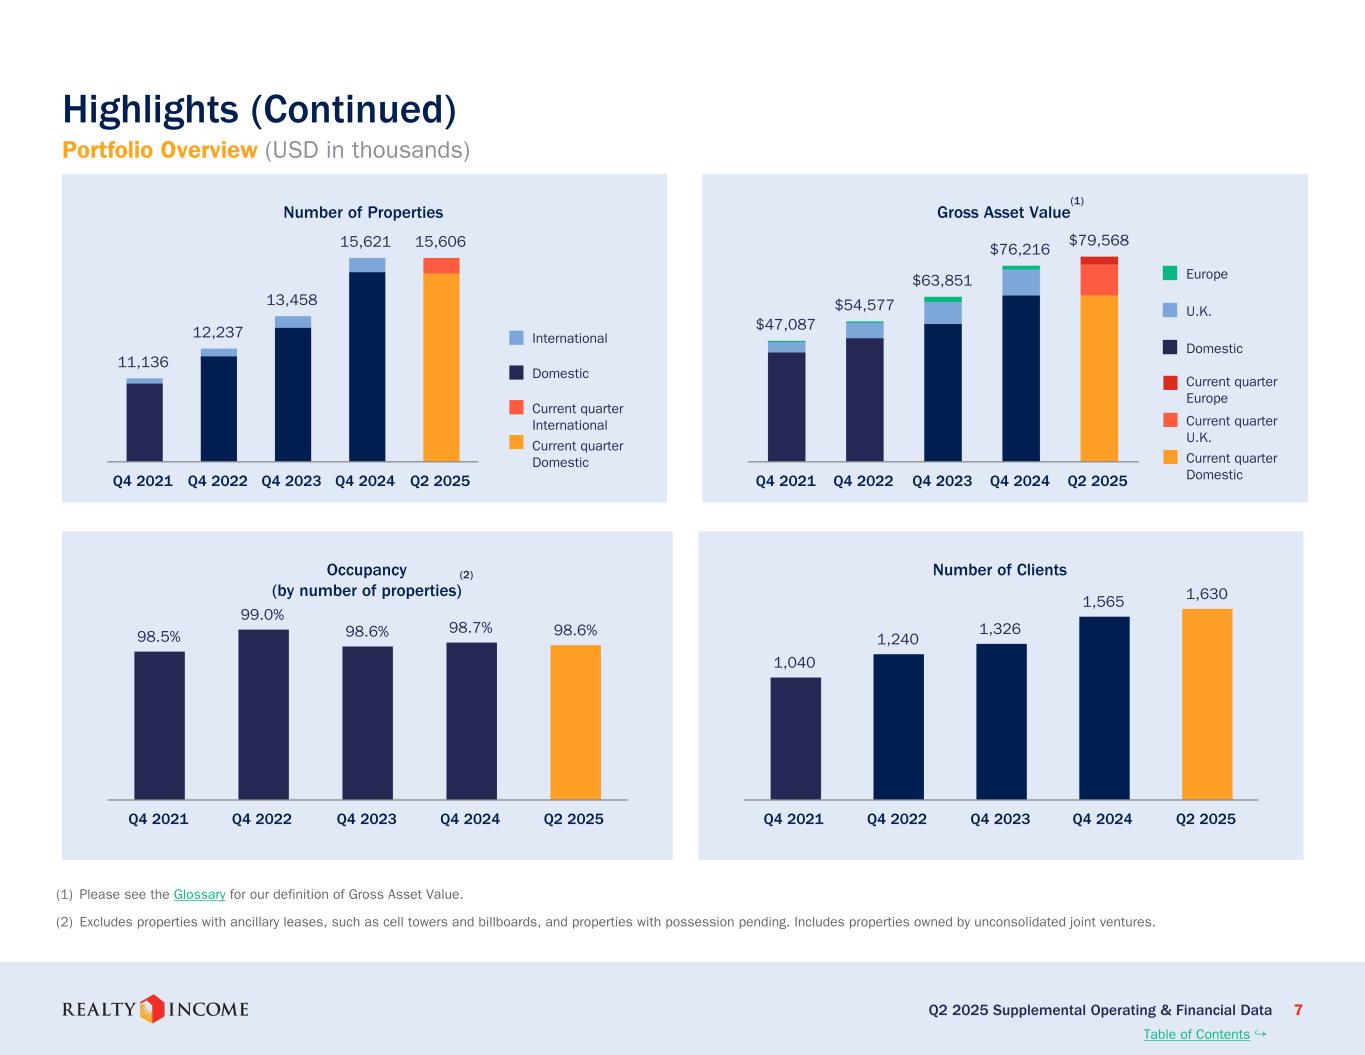
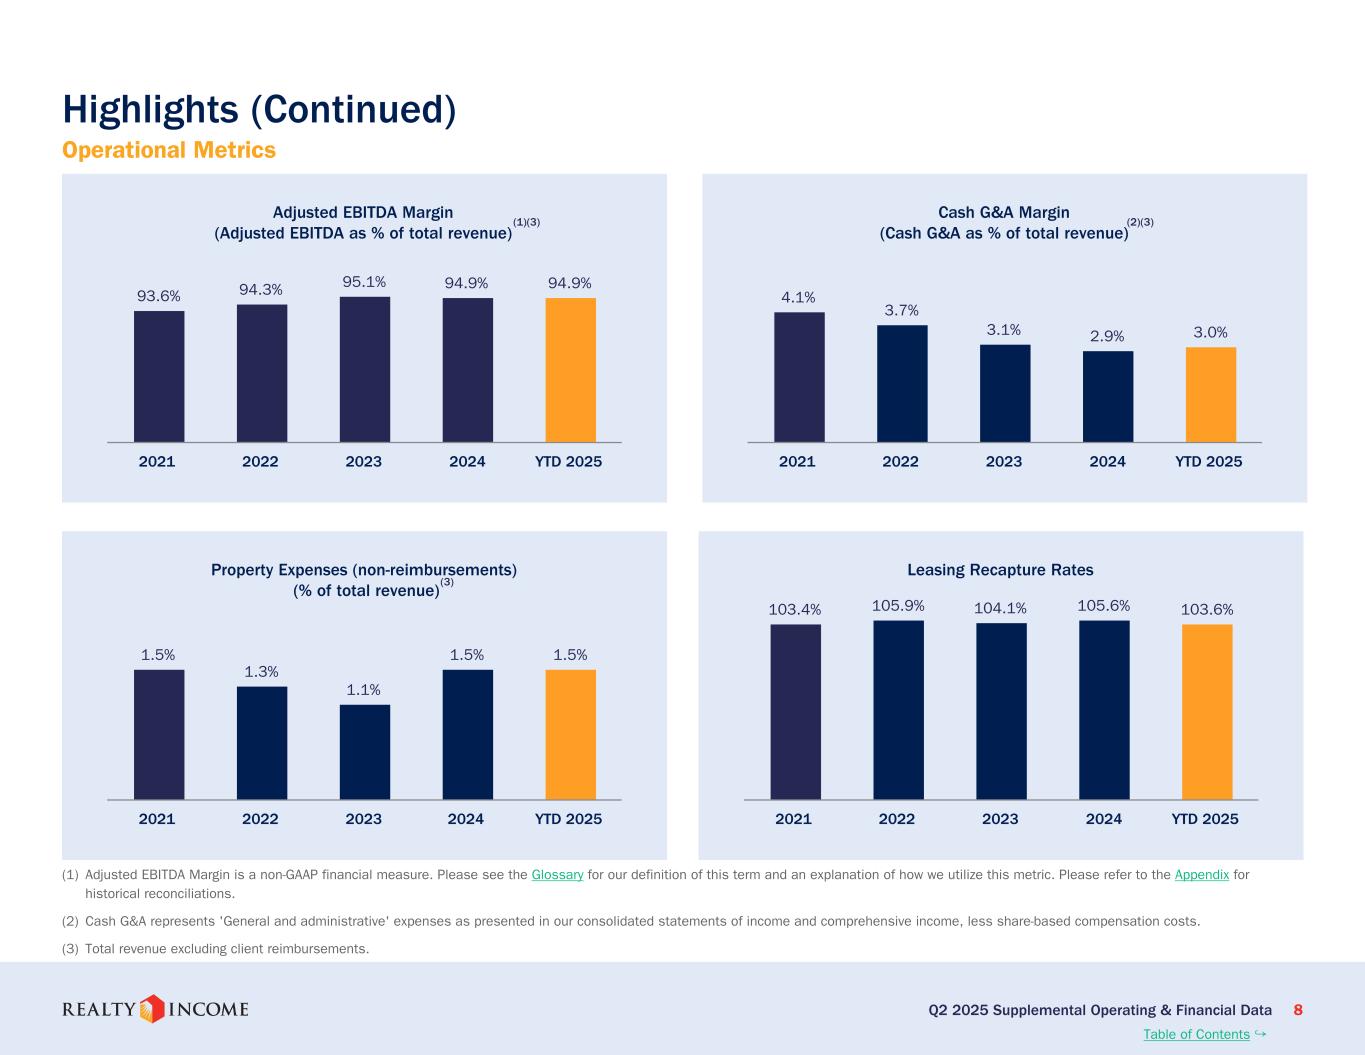
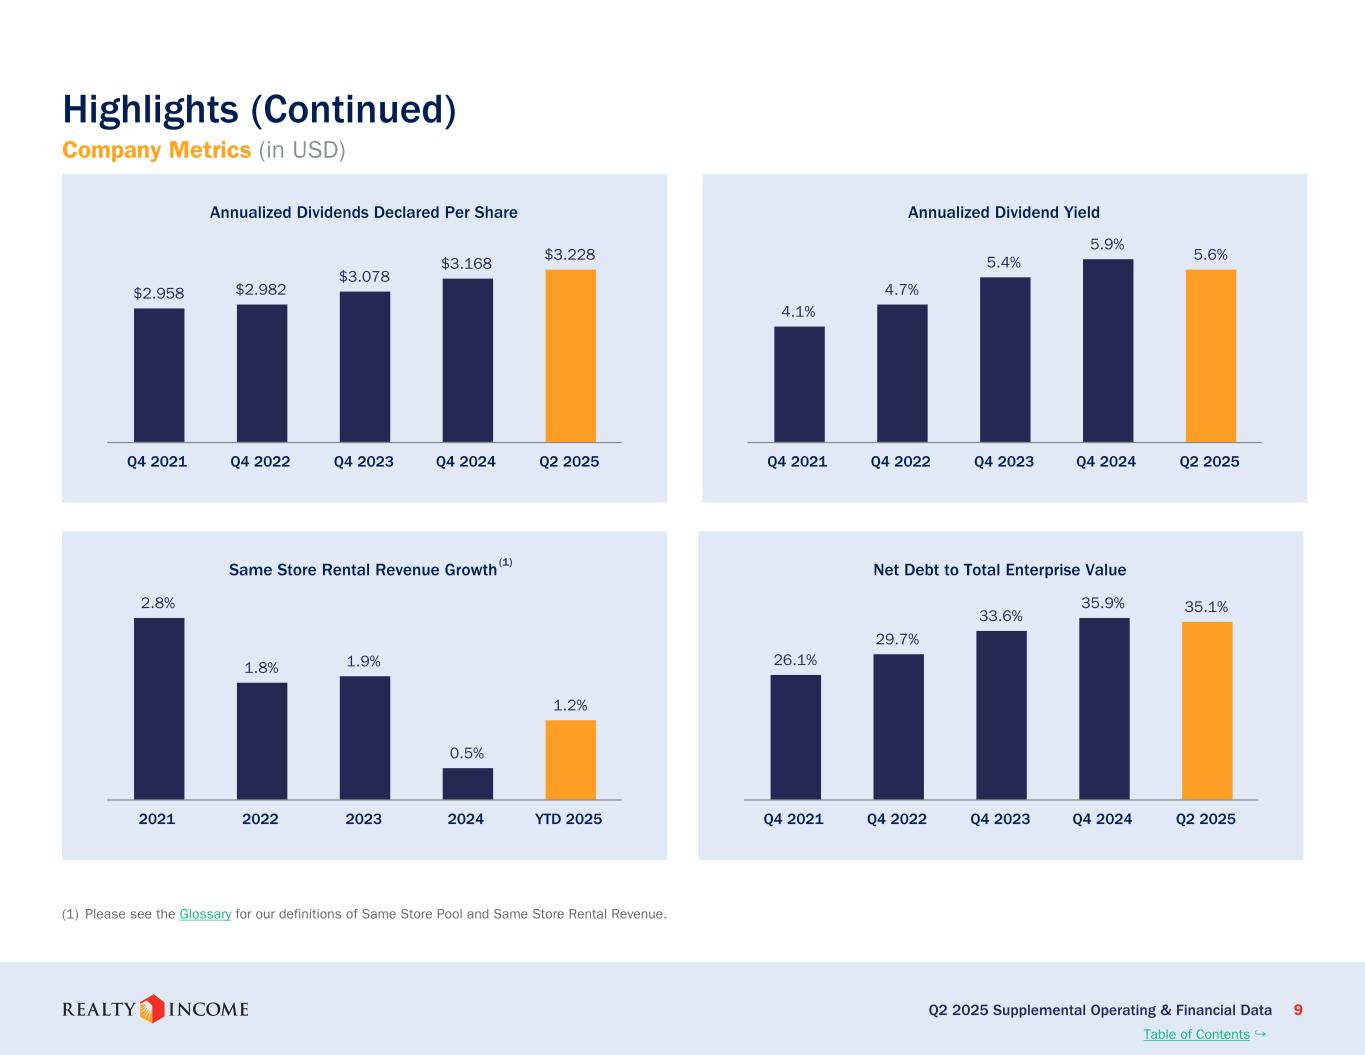
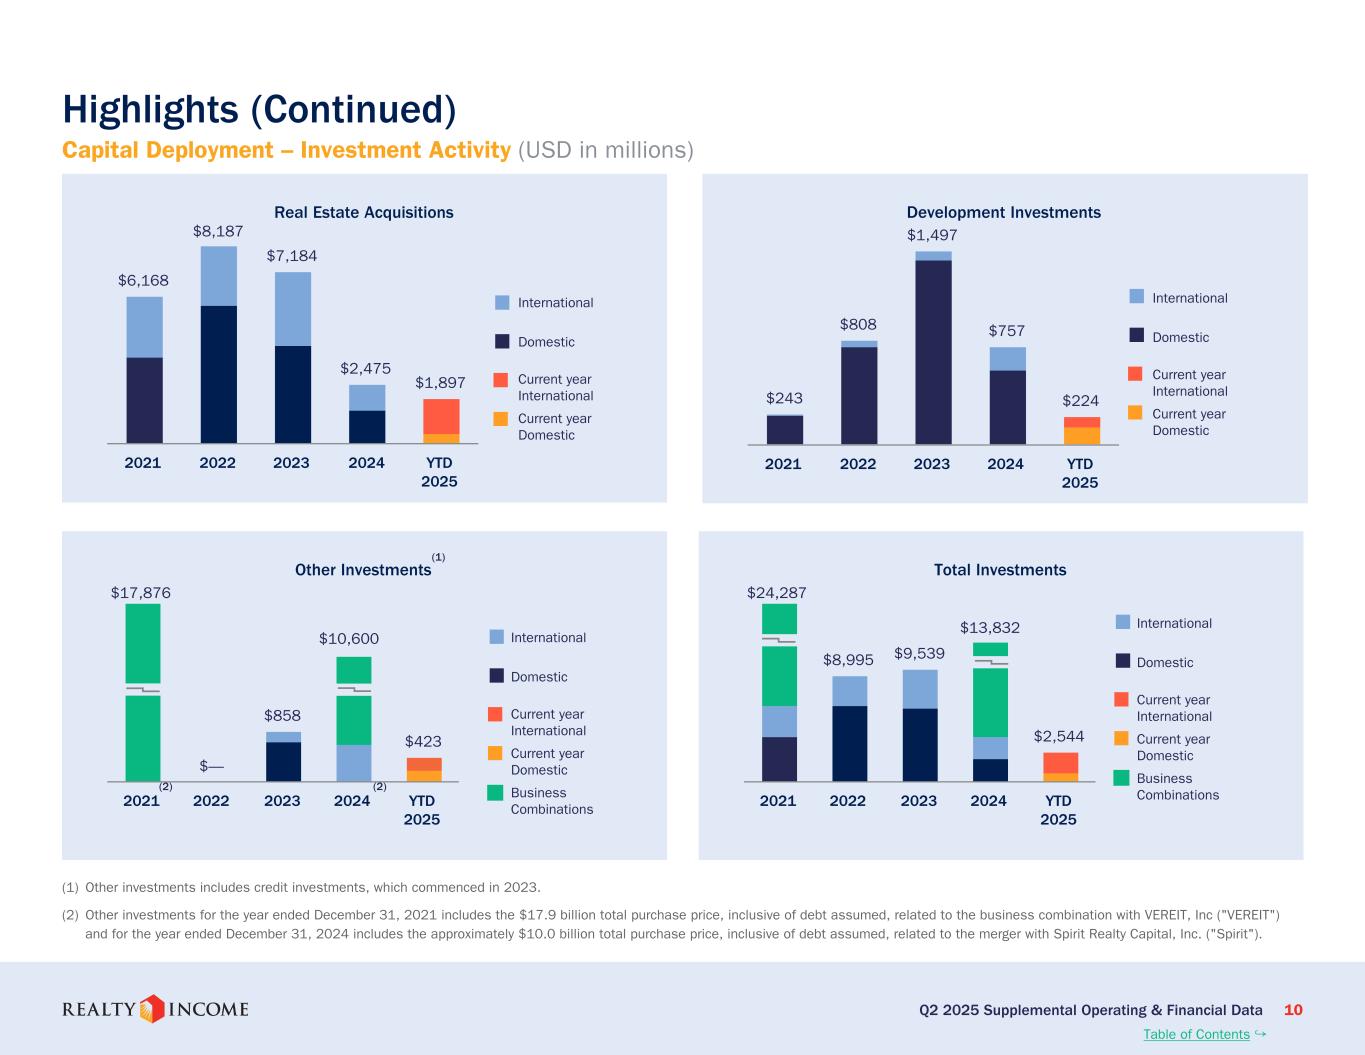
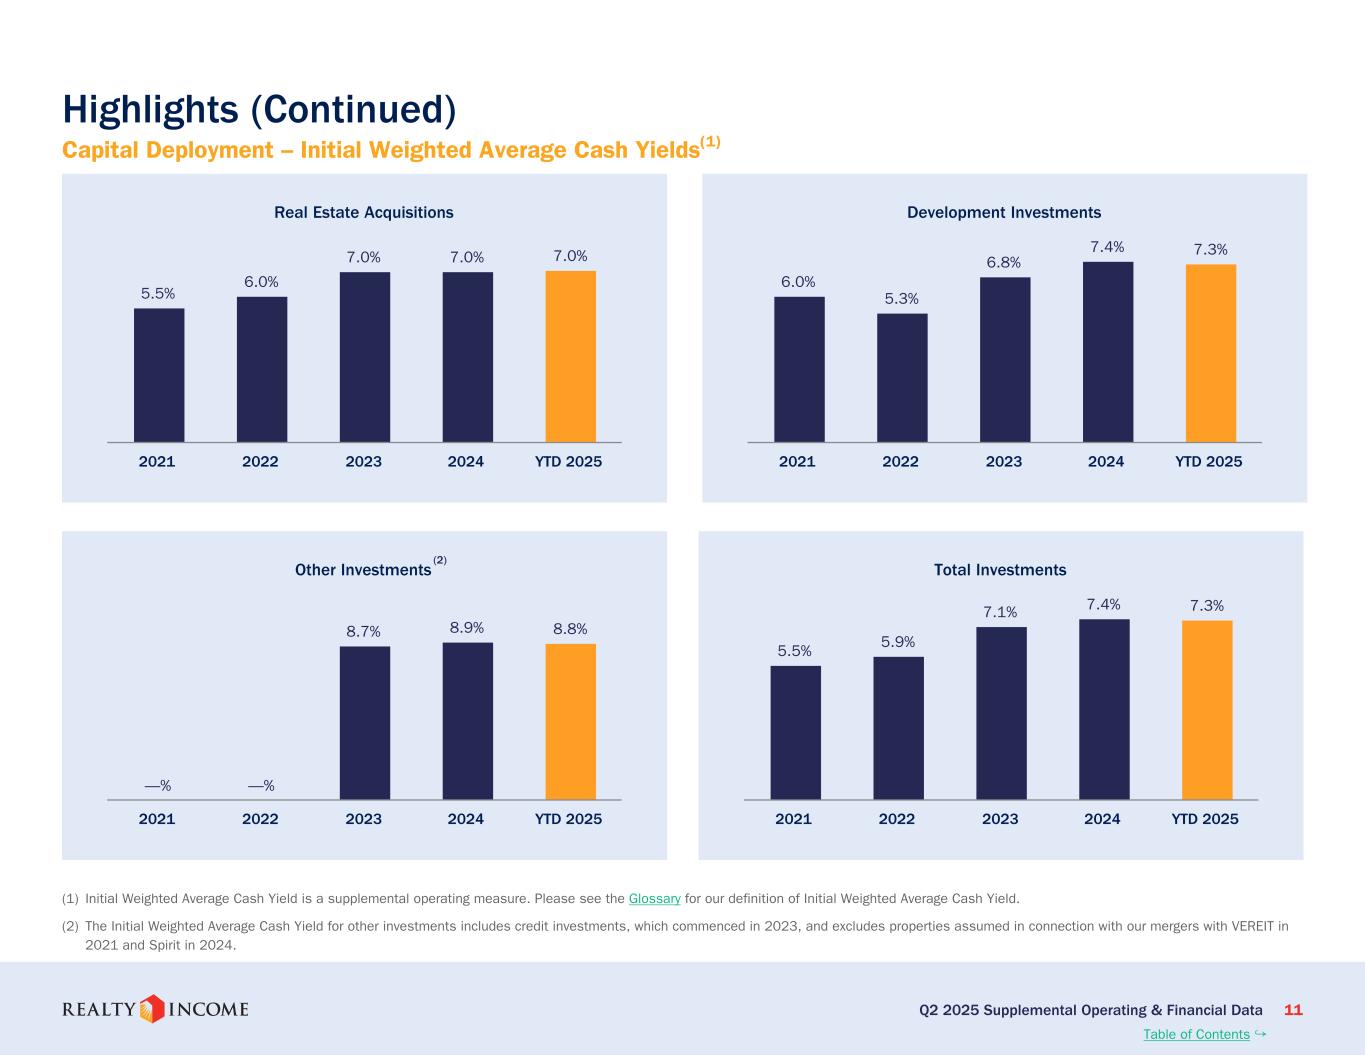
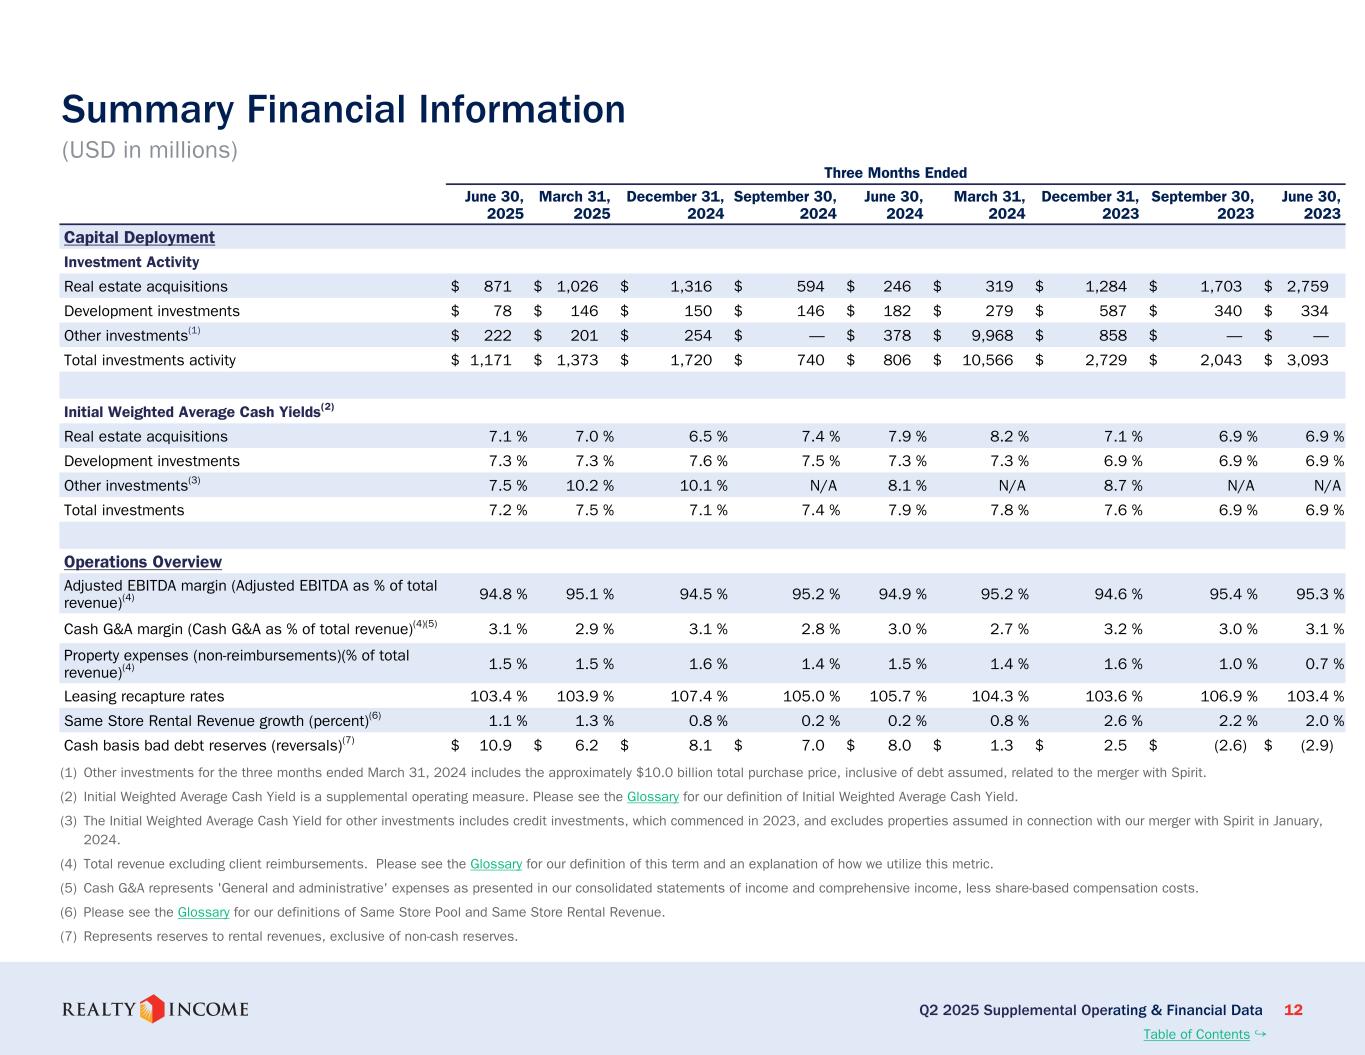
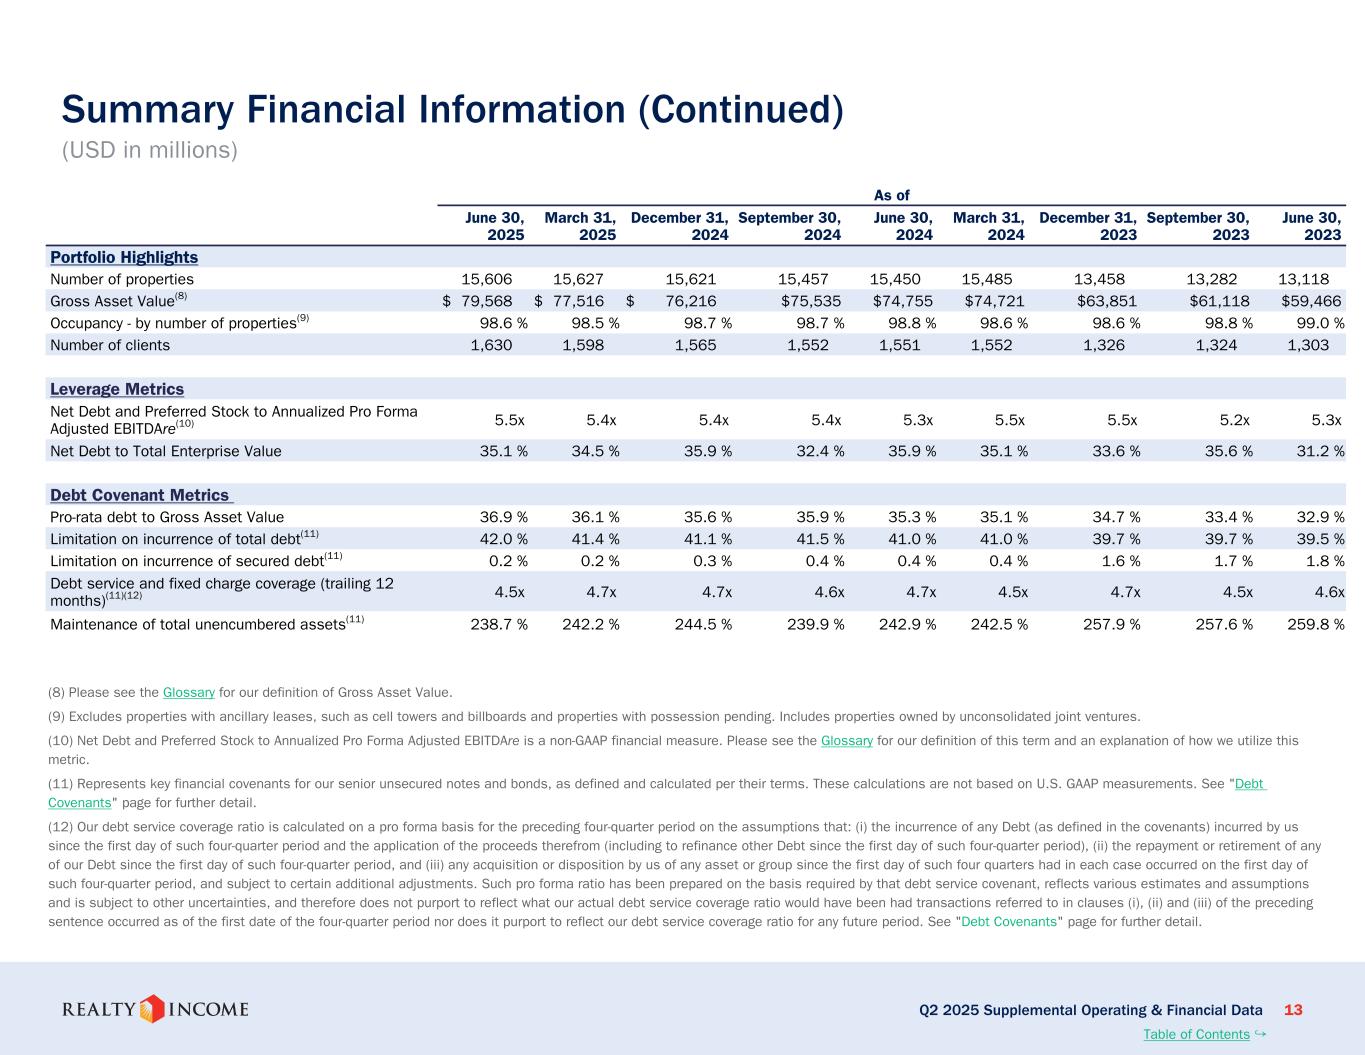
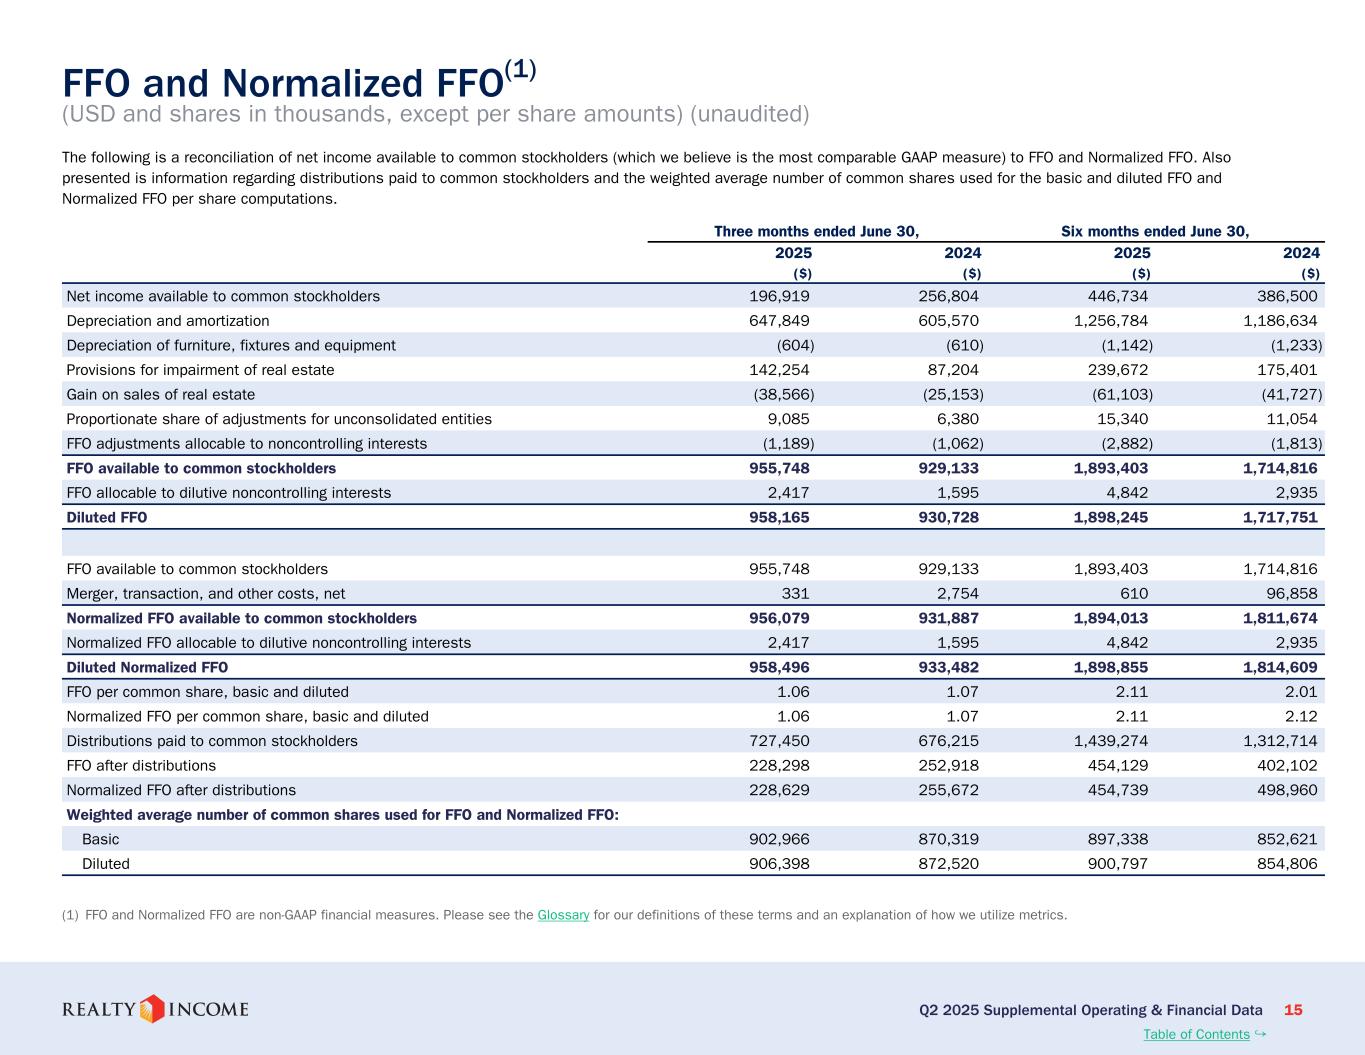
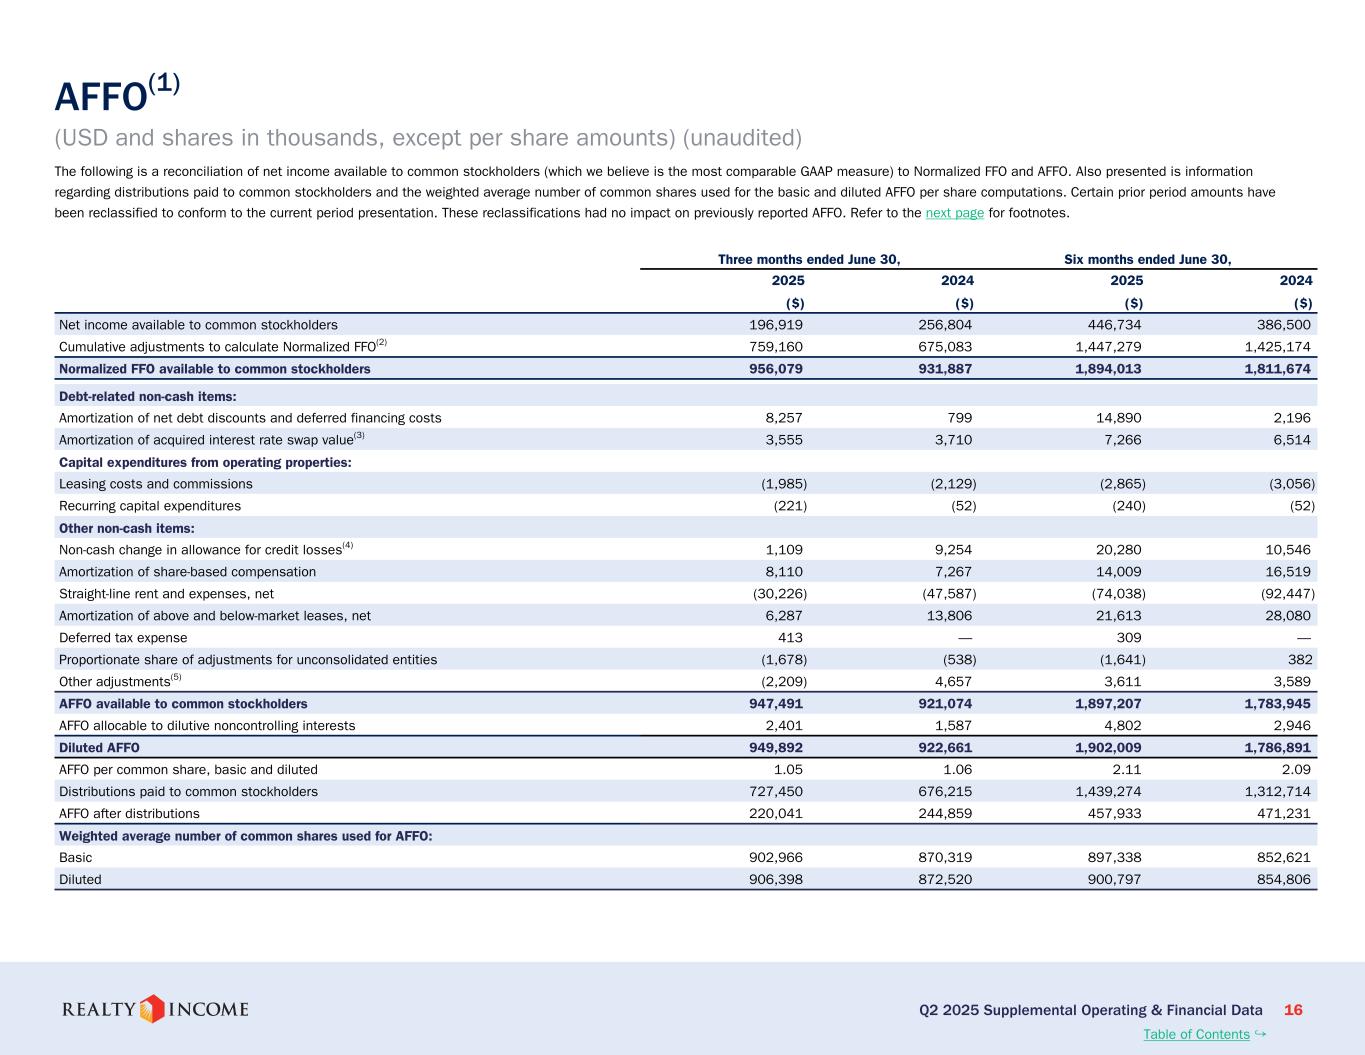
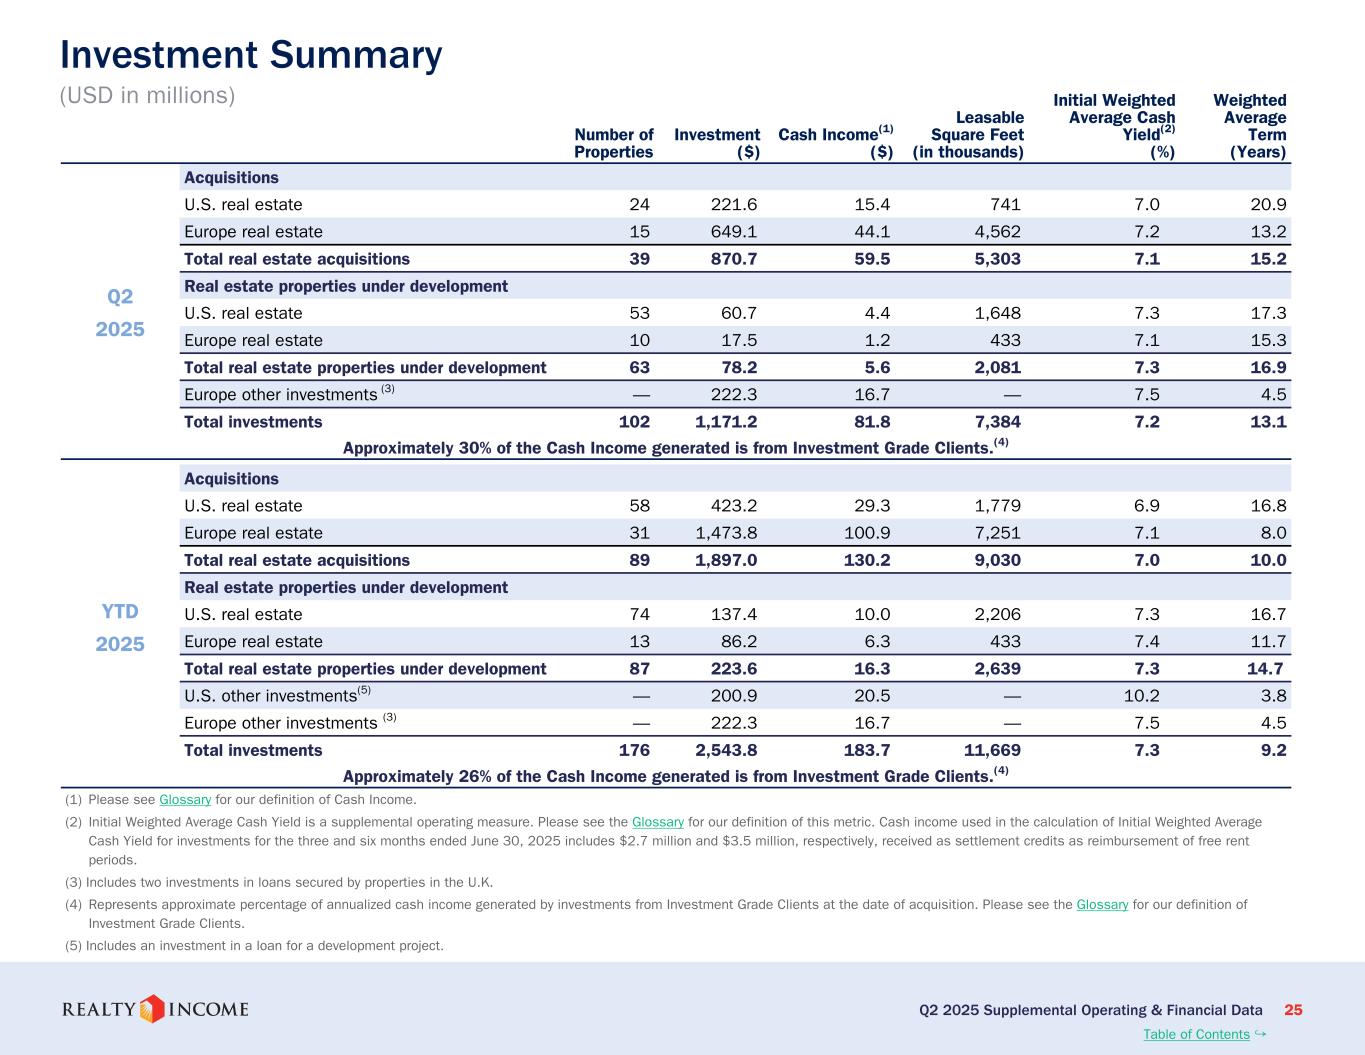
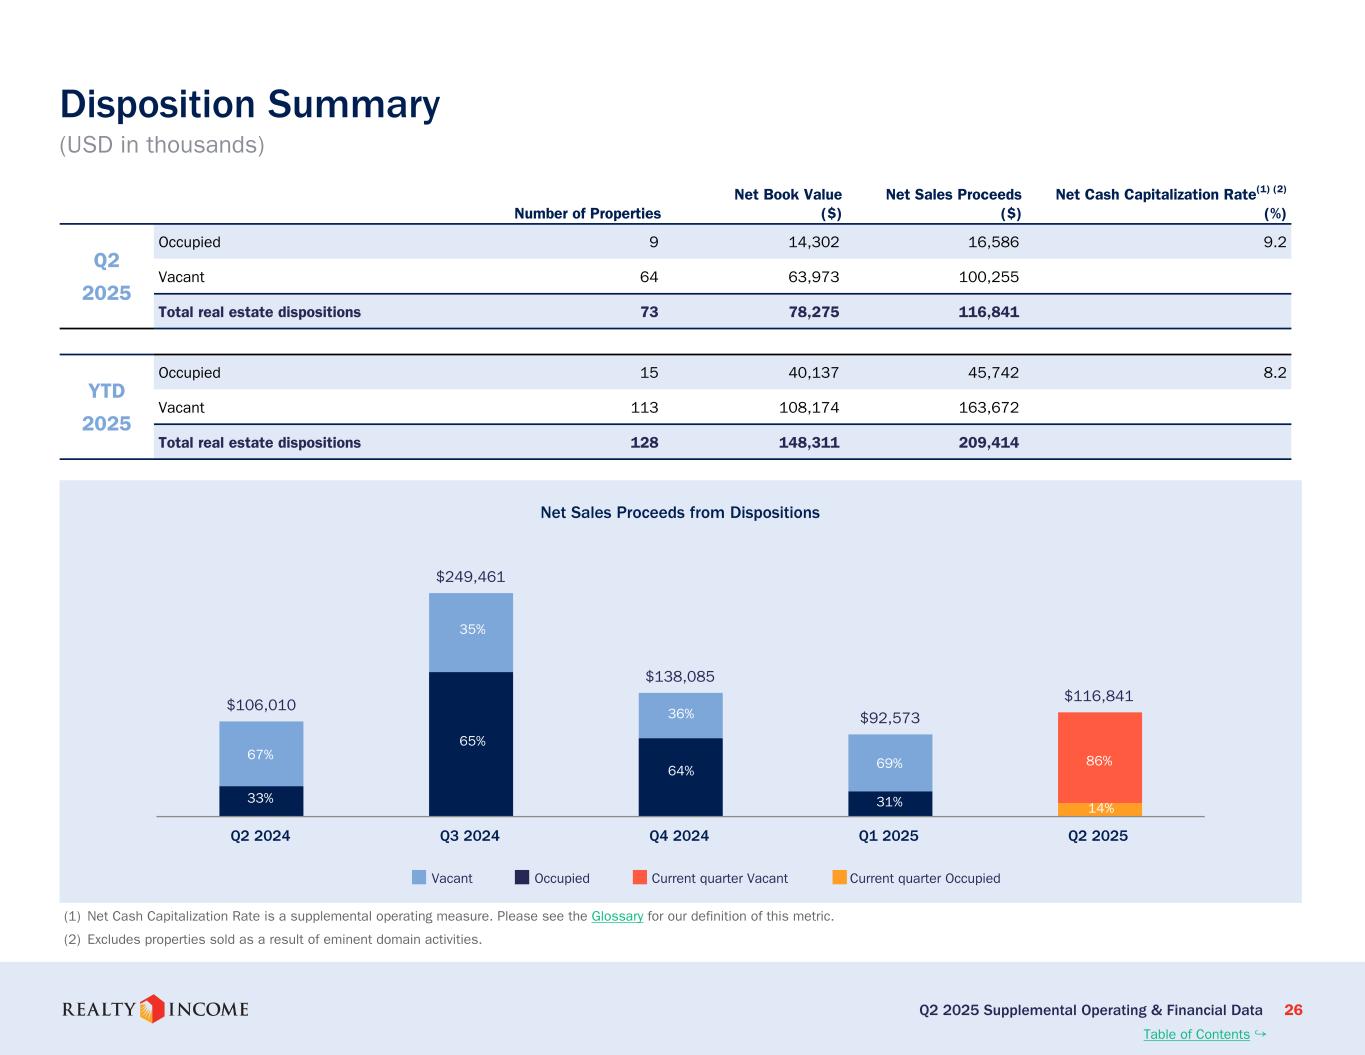
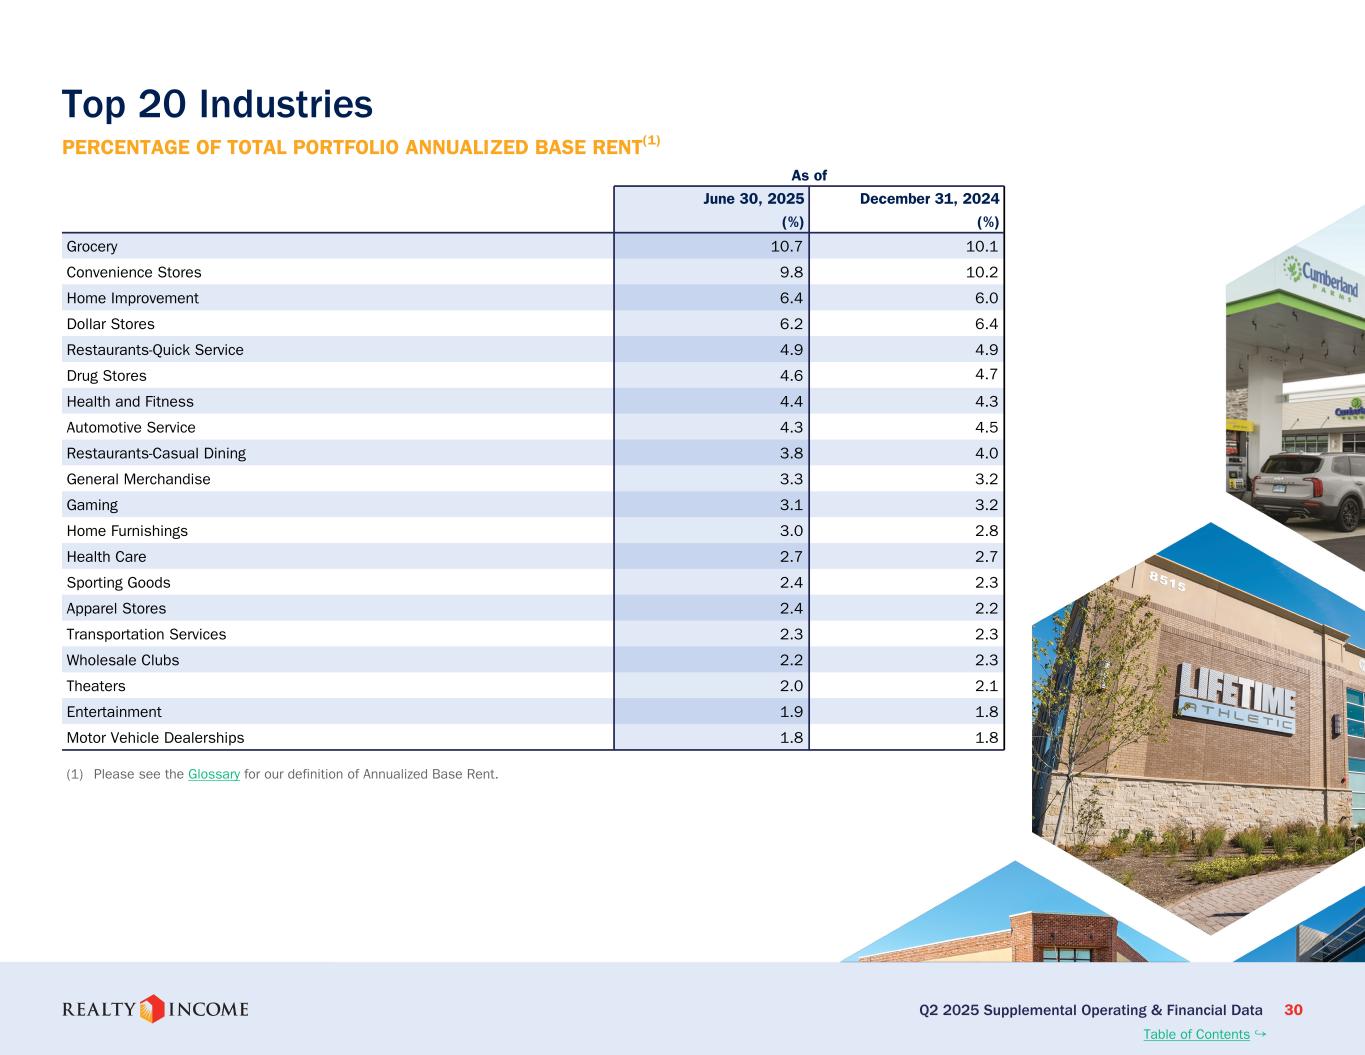
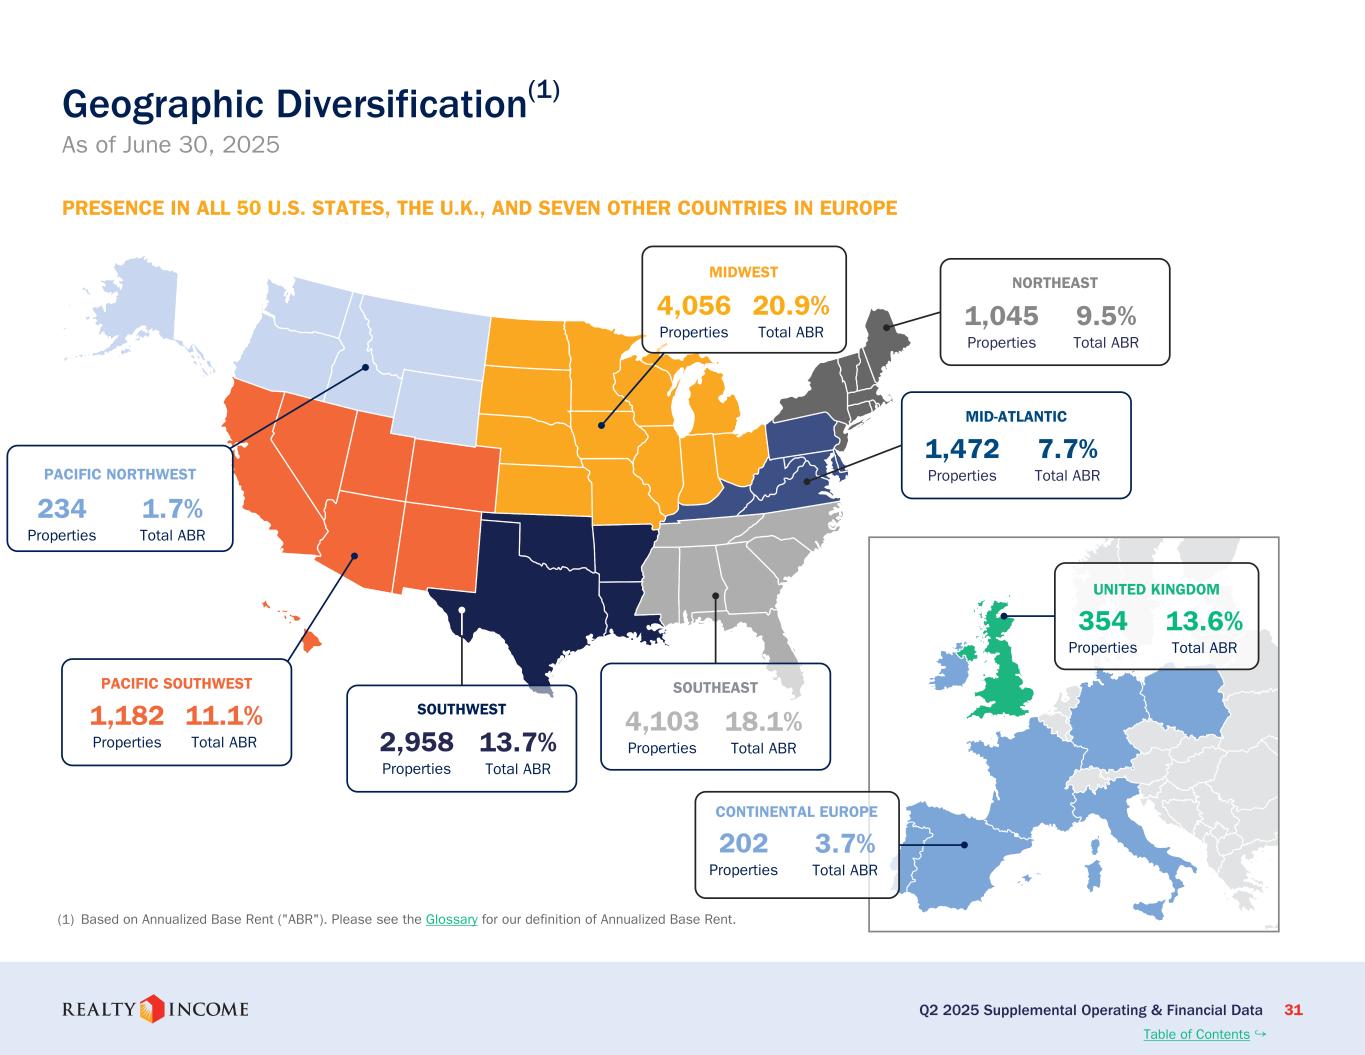
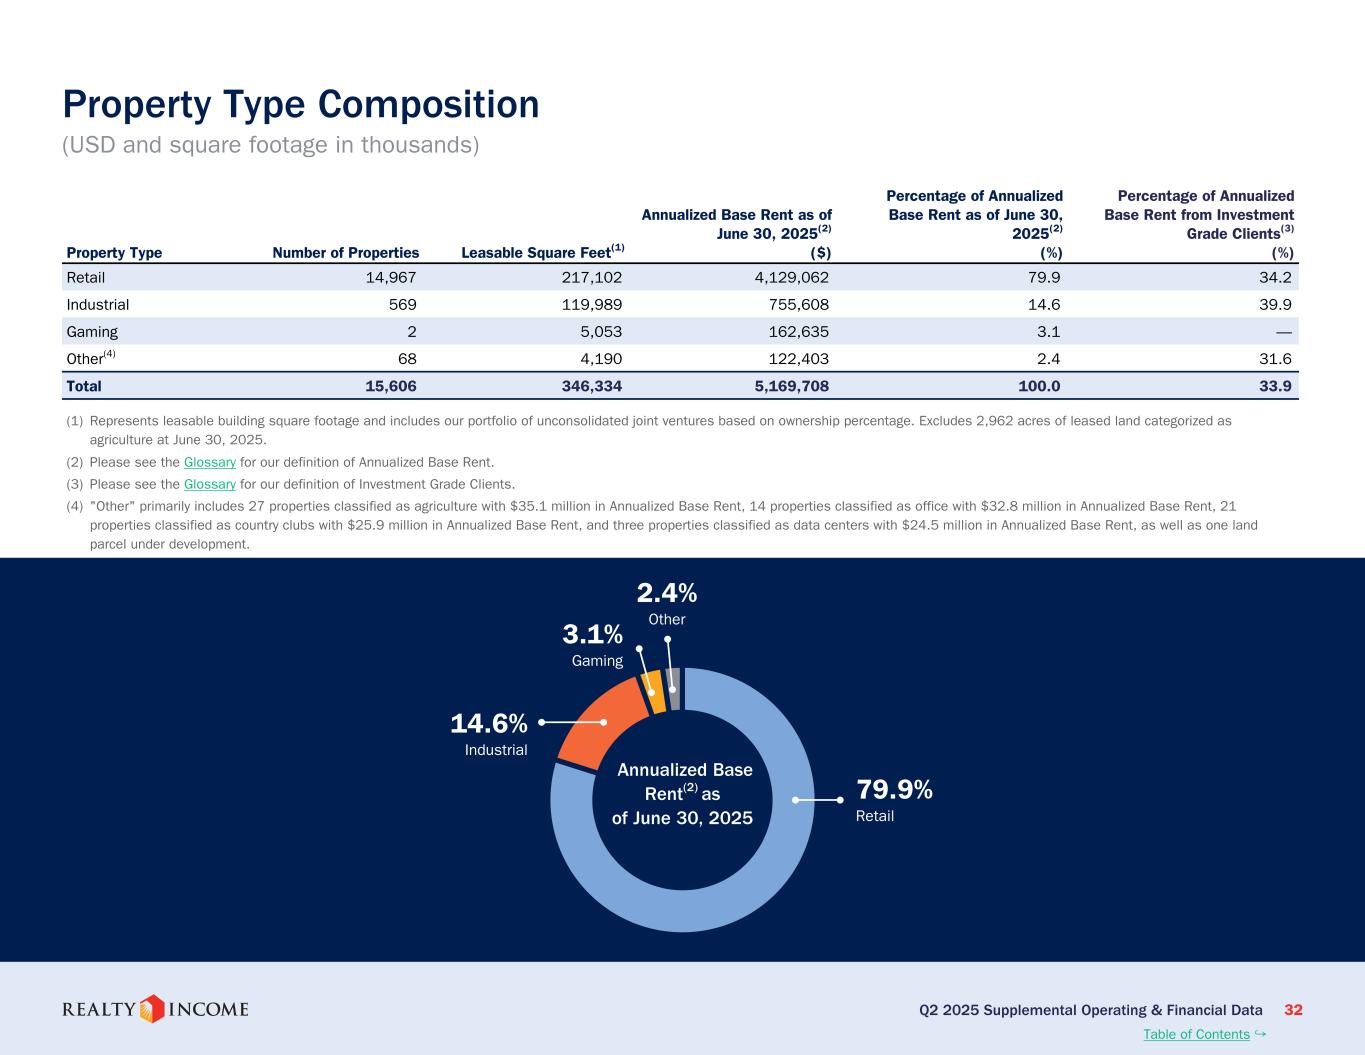
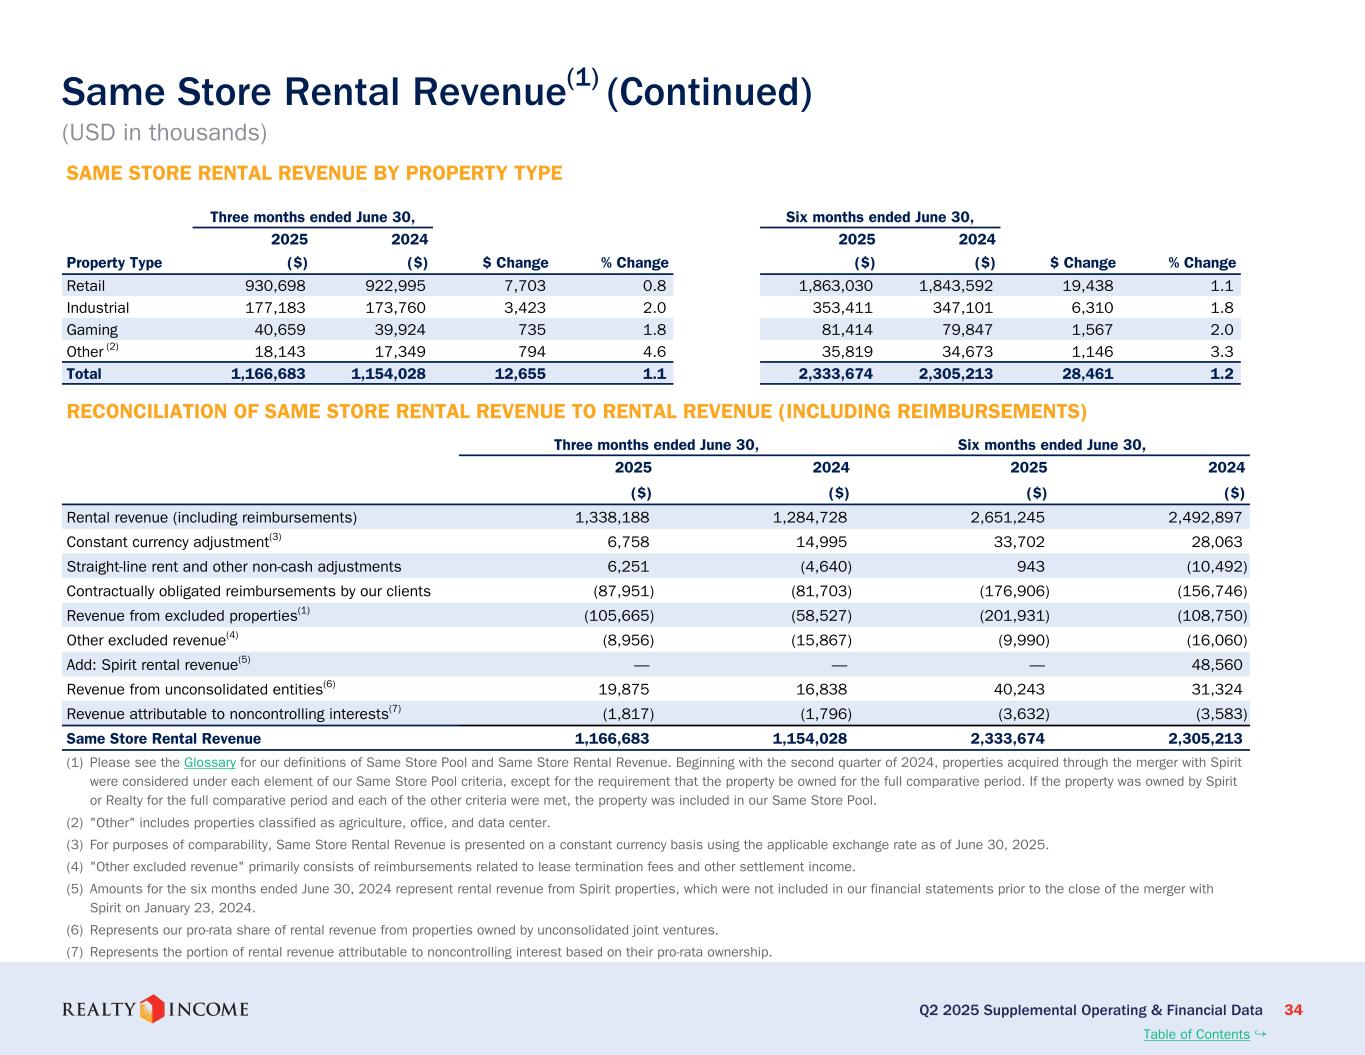
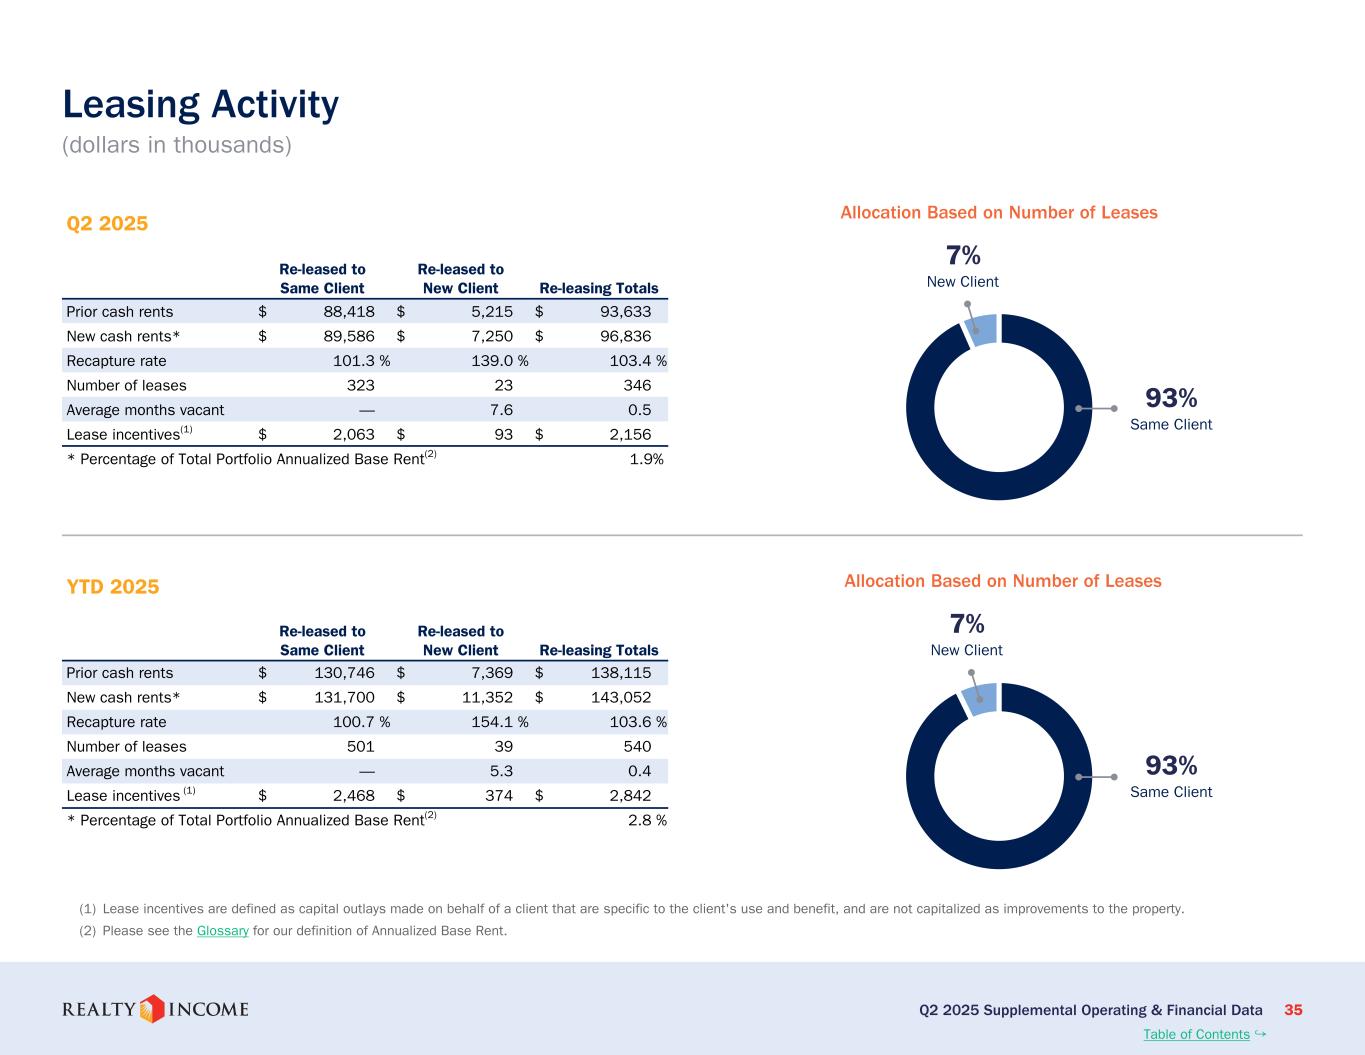
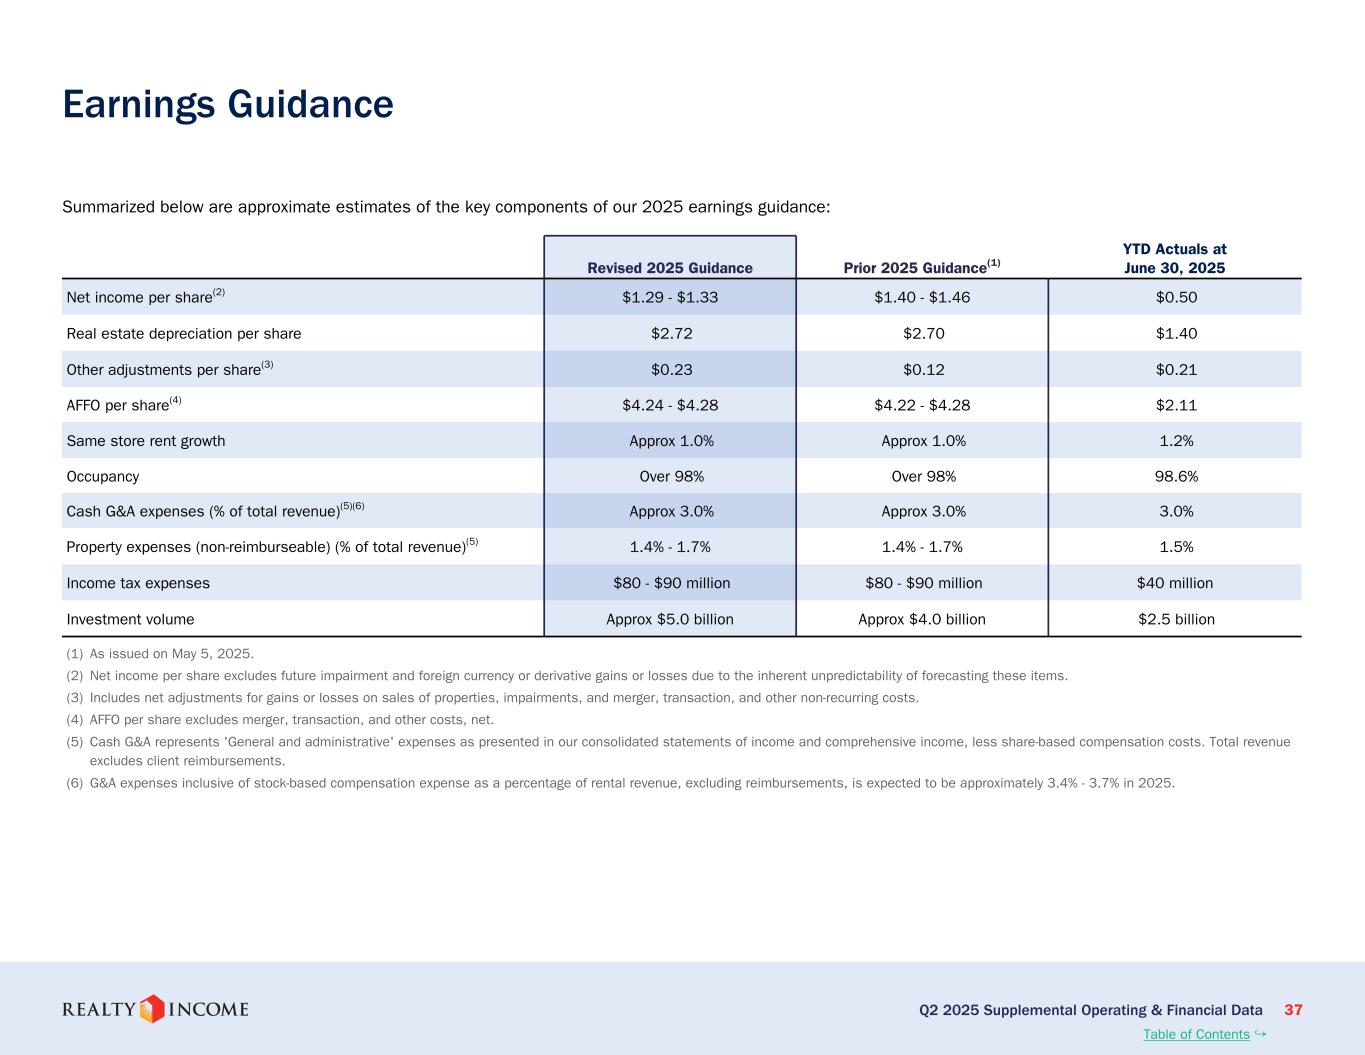
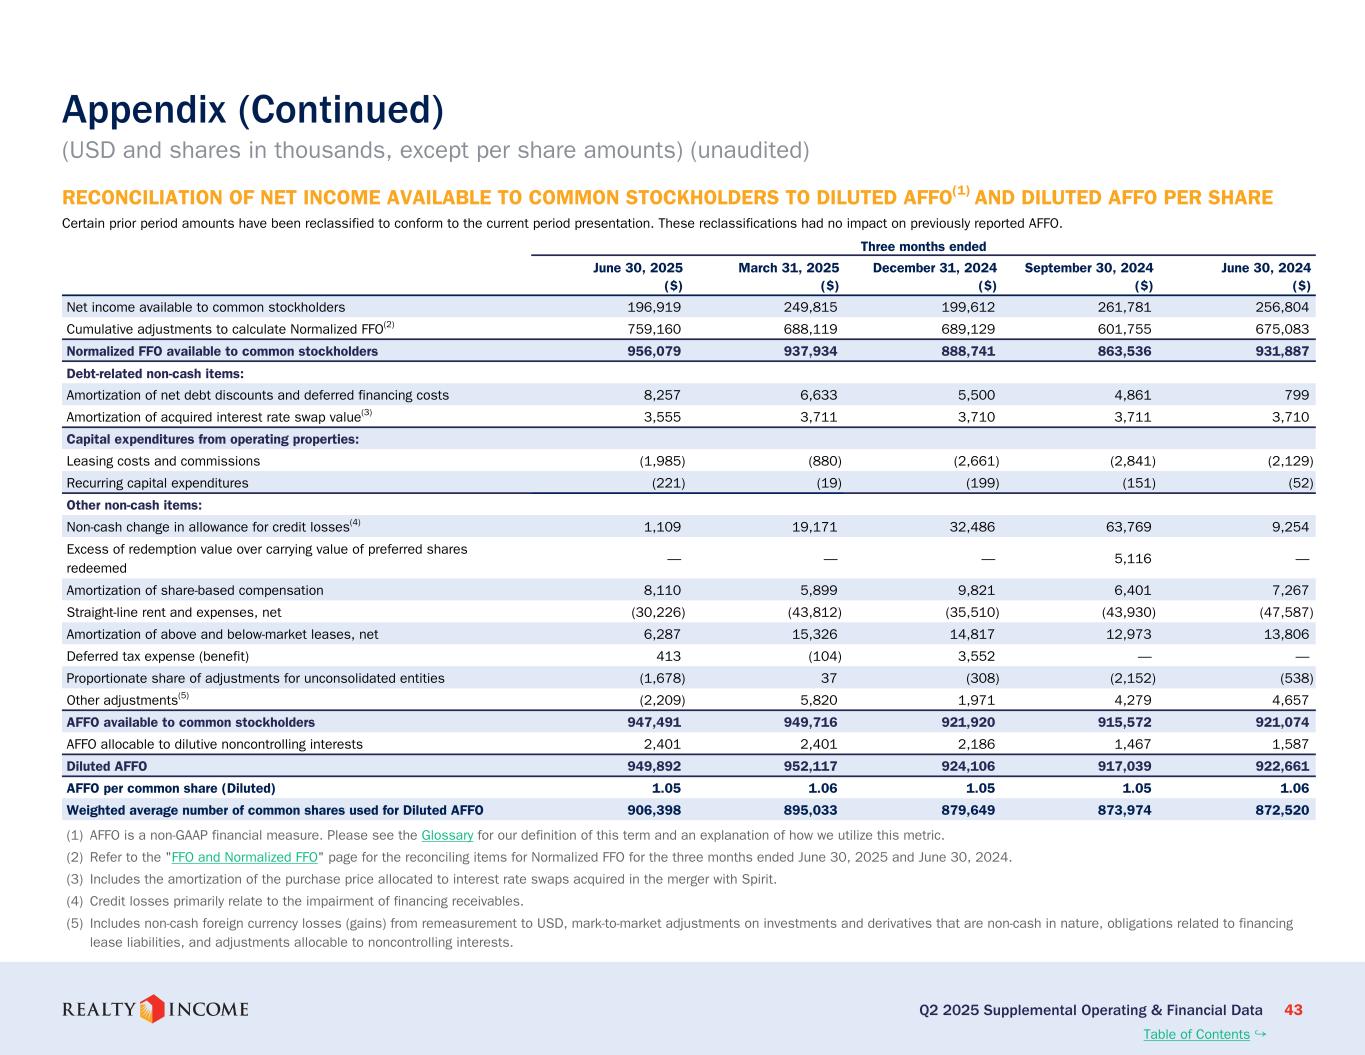
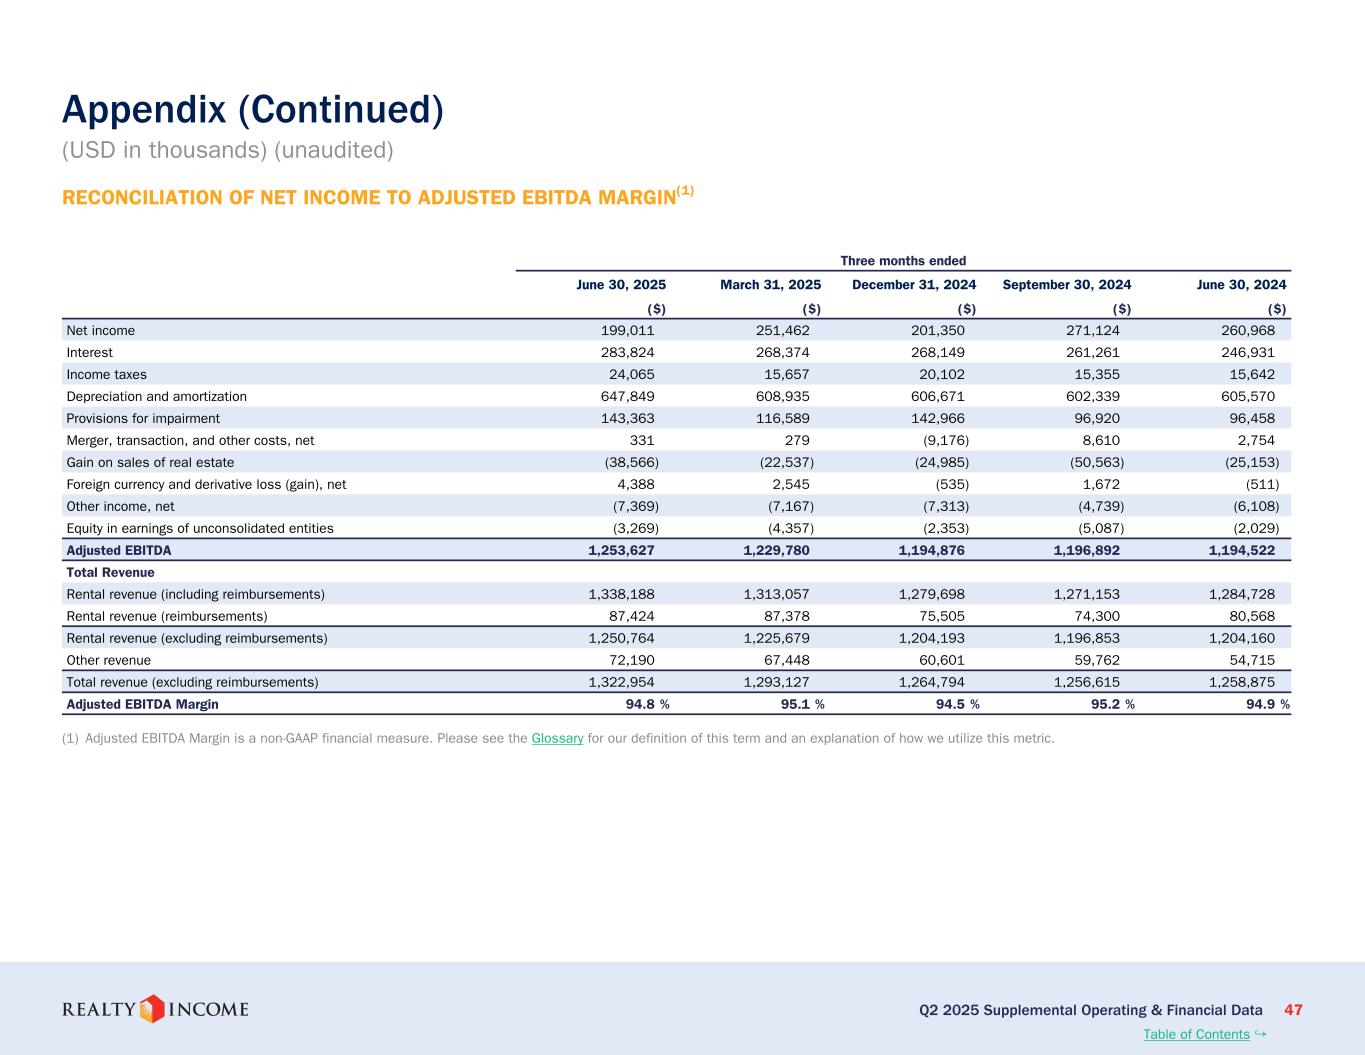
Thank you, Kelsey. Welcome, everyone. At Realty Income, the durable income we have historically delivered originates from the power of a data-driven platform. We have intentionally designed this platform to perform through a variety of economic conditions anchored by diversification and scale, predictive data analytics, a conservative balance sheet philosophy, and a disciplined investment strategy honed over decades. We believe Realty Income's exceptional ability to deliver stable and growing income across the full economic cycle, together with our impressive size, scale, and track record, positions us to capitalize on two key global megatrends. First, the growing demand for durable, income-oriented investment solutions driven by an aging global population and increased emphasis on income stability from both public and private investors. And second, the rising interest from corporations to pursue asset-light strategies through large portfolio acquisitions or sale-lease-backed transactions. Realty Income's differentiated expertise enables us to lean into these trends as we pursue adjacent growth verticals, including private capital and credit investments, while continuing to anchor our strategy in our core real estate net lease vertical, underpinned by our access to public equity. This approach allows us to capitalize on a broad range of emerging opportunities, delivering consistent income for our investors while further enhancing our menu of capital options for our clients. Turning to the details of our second quarter, our investment decisions reflected the strategic flexibility of our platform. We believe our business model enables us to look at opportunities substantially free from geographical or industrial constraints, allowing us to pursue the most optimal risk-adjusted returns. Globally, we invested $1.2 billion at a 7.2% weighted average initial cash yield, equating to a spread of 181 basis points over our short-term weighted average cost of capital. For acquisitions specifically, these investments have a weighted average lease term of approximately 15.2 years. This quarter, we sourced $43 billion in volumes, resulting in a selectivity ratio of less than 3%. The $43 billion sourced matches our source volume from all of 2024 and is the highest quarterly volume in the history of realty income. This is a testament to the size of our addressable market and our visibility to global net lease transaction opportunities, given the breadth and depth of our platform. Year-to-date, we have now sourced approximately $66 billion of investment opportunities, which puts us on track to eclipse our prior high watermark for annual sourced volume of $95 billion reached in 2022. 57% of the year-to-date volume has been sourced domestically, with the rest in Europe. Turning back to our investment volumes for the quarter, we again leaned into Europe, which accounted for $889 million, or 76% of our investment volume, at a 7.3% weighted average initial cash yield. Europe remains a compelling growth market, driven by a fragmented competitive landscape, a larger total addressable market than what is available in the United States, and a cost of debt capital that is currently more favorable, with Euro borrowing costs approximately of 120 basis points inside of U.S. dollar debt costs for 10-year notes as of today. Since entering the U.K. market in 2019, our disciplined underwriting and balance sheet strengths have enabled significant expansion across the continent, with Europe now representing 17% of our annualized base rent. This quarter, we expanded into our eighth European country, including a sale leaseback transaction involving Eko Okna in Poland, a leading manufacturer in the region. Transitioning to the U.S., we invested $282 million at a 7% weighted average initial cash yield. While transaction volumes have moderated domestically, this reflects selectivity, not a lack of opportunity, as we continue to prioritize long-term risk-adjusted returns over pace of deployment of capital. Across the portfolio, we are increasingly acting as a full-service capital provider to our clients, offering a variety of real estate capital solutions in addition to sale leasebacks, including credit solutions. With a 56-year operating history, we have long-standing relationships with high-quality operators worldwide, which creates opportunities to leverage these partnerships to offer tailored access to capital. Moving to our operations, the second quarter reflects the structural advantages of our business model, including portfolio diversification, built-in resilience across our top industries, and advanced data analytics capabilities. To that point, our proprietary predictive analytics tool, developed over the past seven years, inform decisions across sourcing, underwriting, lease negotiations, and asset management. We believe this level of embedded intelligence allows us to be proactive operators and reinforce the reliability of our long-term cash flows. As of quarter-end, our portfolio comprised over 15,600 properties, spanning 91 industries and more than 1,600 clients. The naturally defensive nature of our leading sectors, including grocery and convenience stores, combined with our scale and diversification, position us to perform through a variety of economic environments. We ended the quarter with 98.6% portfolio occupancy, approximately 10 basis points ahead of the prior quarter, and above the historical median of 98.2% from 2010 to 2024. During the quarter, our rent recapture rate across 346 leases was 103.4%, representing 97 million of annual cash from prior cash rents, with 93% of leasing activity generated from renewals by existing clients. clients. And we remained active in our approach to optimize the portfolio. In the quarter, we sold 73 properties for total net proceeds of 117 million, of which 100 million was related to vacant properties. Overall, the stability of our results continues to demonstrate how the benefits of our platform enable us to stay agile, manage risk effectively, and drive long-term portfolio performance. Moving to our outlook for 2025, given the continued momentum in our acquisitions pipeline and our progress year-to-date, we are increasing our 2025 investment volume guidance to approximately $5 billion. In addition, we are raising the low end of our AFFO per share guidance, now anticipated to be in the range of $4.25 – sorry, $4.24 to $4.28. Within this forecast, we continue to see consistent tenant performance across our global portfolio. Our 2025 outlook contemplates approximately 75 basis points of potential rent loss, which is slightly higher than our historical experience, but consistent with our expectations going into the year. Much of this credit loss is the result of certain tenants acquired through public M&A transactions we have consummated in recent years. As of quarter end, our credit watch list stands at 4.6% of our annualized base rent, below the prior quarter, and with median client exposure of just three basis points. Despite these small challenges, we are grateful for the strong results produced from our asset management team on recent bankruptcy resolutions. As shared last quarter, we are pleased with a 94% recapture rate on our 132 ZIPs properties. And following at-home's Chapter 11 bankruptcy filing in mid-June of this year, we anticipate constructive resolutions. With that, I will turn it over to Jonathan.
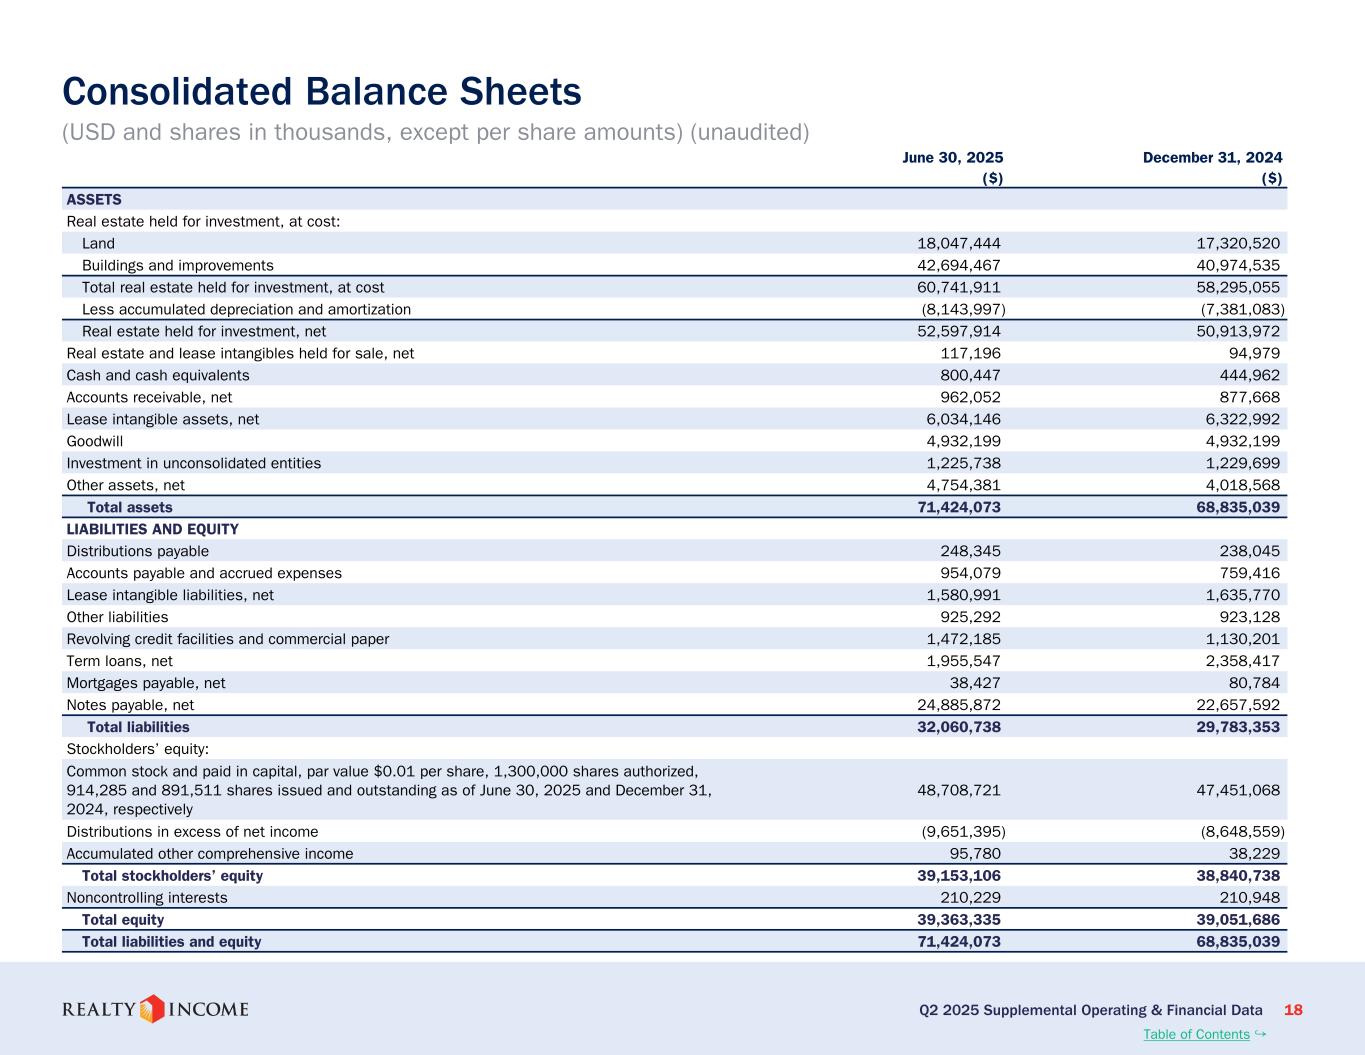
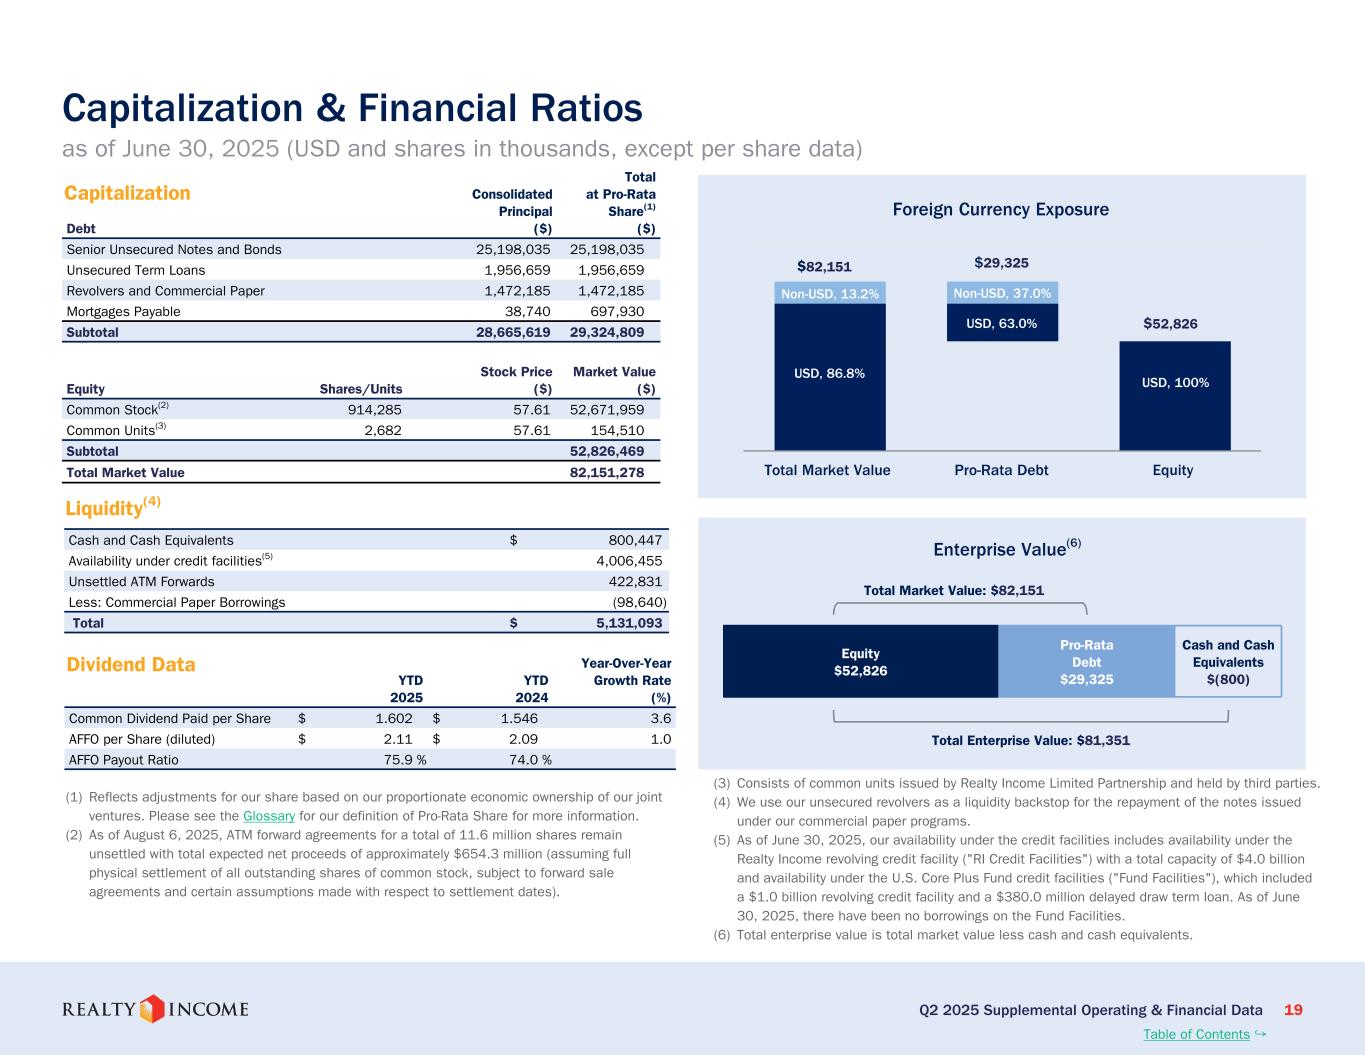
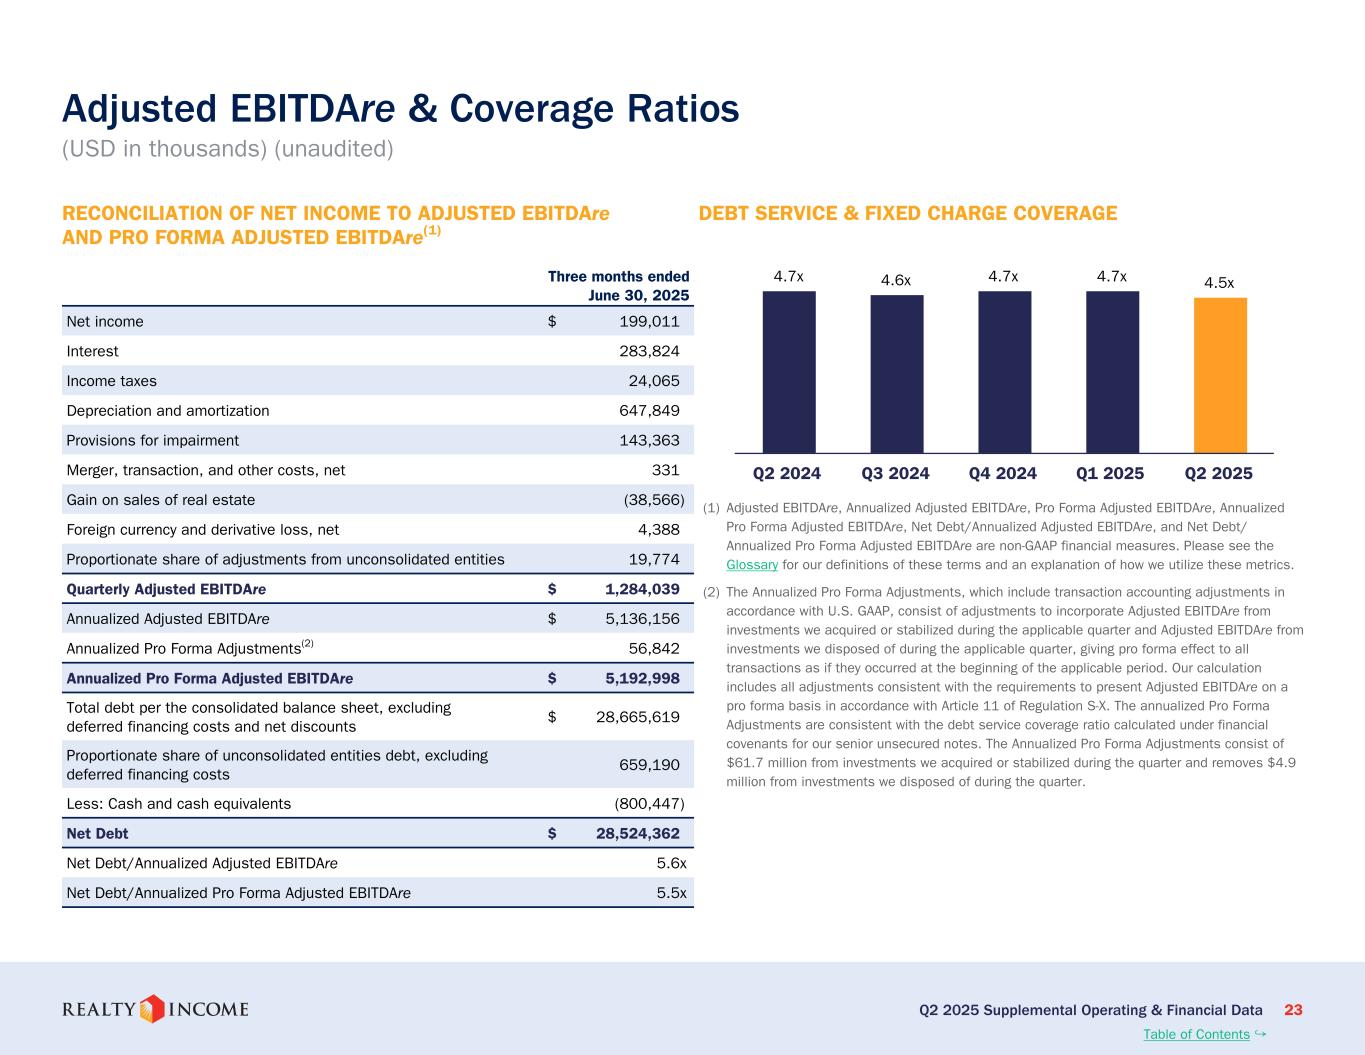
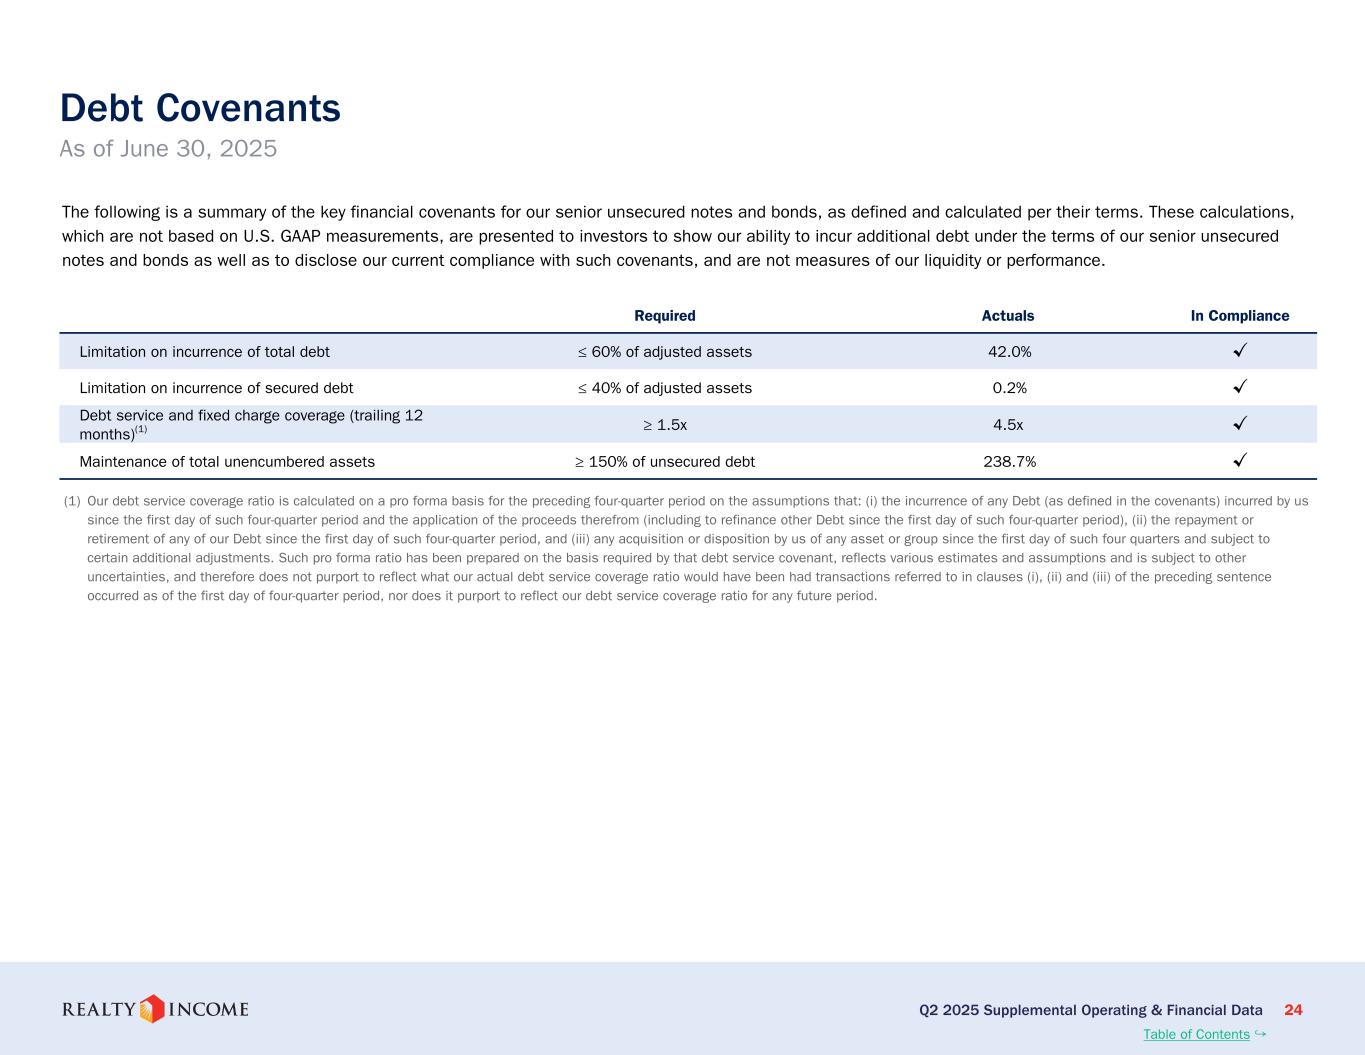
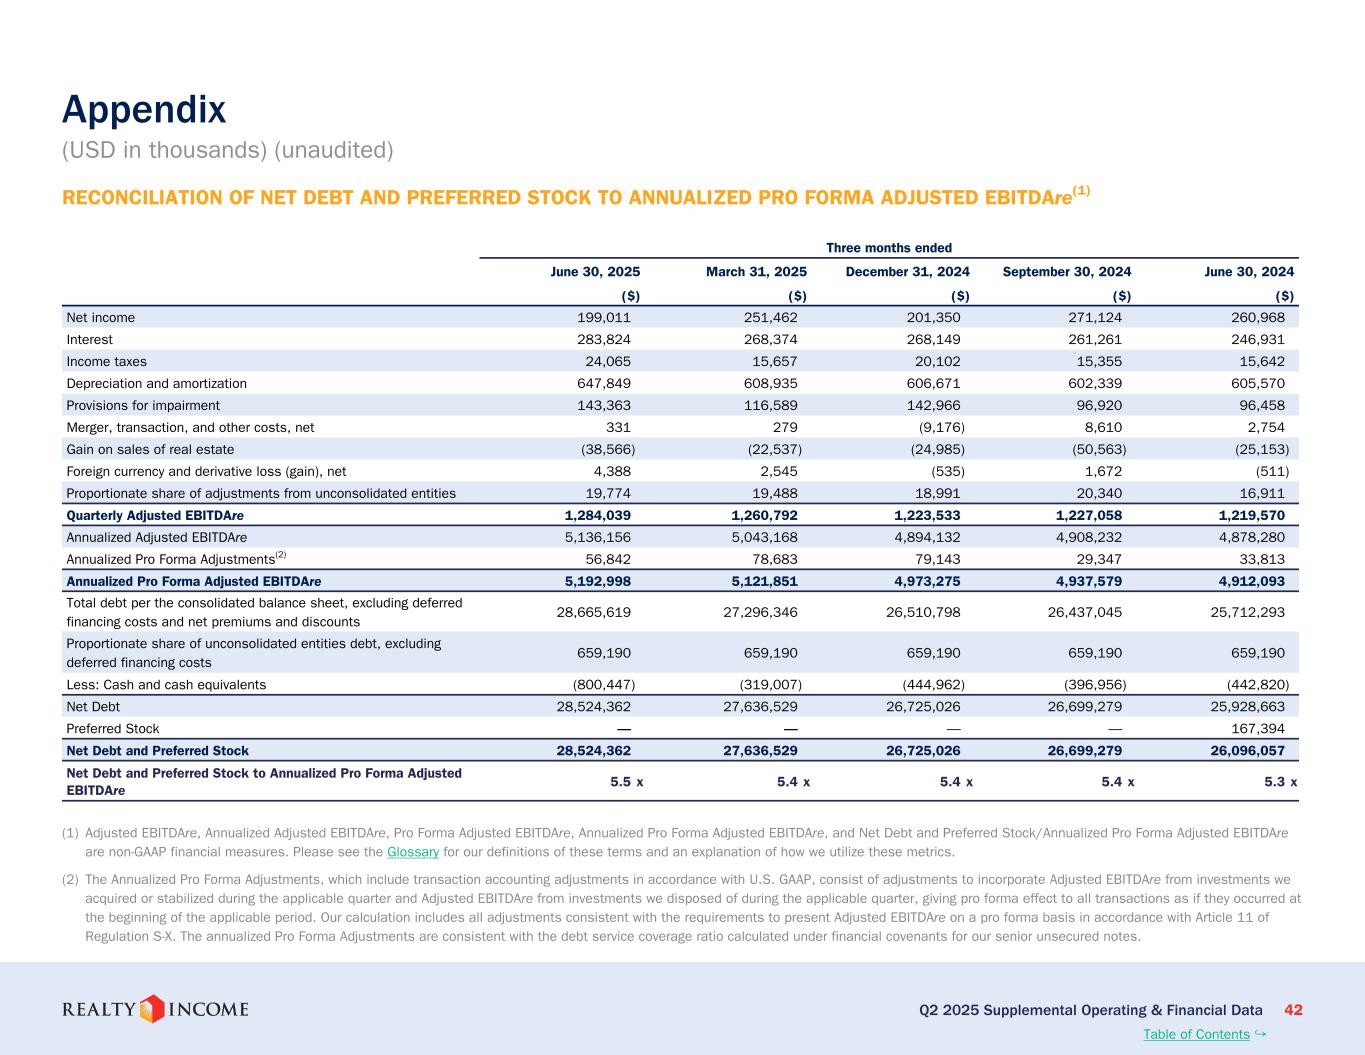
Thank you, Subit. Our capital markets activity remained active in the second quarter, and we view our liquidity and balance sheet as well-positioned to address our active investment pipeline. During the quarter, we raised $632 million of equity through our ATM at a weighted average stock price of $56.39 per share. And as of today, we have another $654 million of unsettled forward equity, which provides us with a solid runway to fund our investment activities for the remainder of the year. Given our updated investment volume guidance of $5 billion, Our implied second-half investment volume of $2.5 billion would require approximately $500 million of incremental external equity to remain leverage neutral after giving effect to the $654 million of equity already raised but not settled and an estimated $450 million of free cash flow for the second half of the year. In addition, our disposition pipeline is expected to accelerate as well, which would be expected to contribute meaningful equity-like proceeds to our sources of funding, further reducing our external equity need for the balance of the year. From a leverage standpoint, we finished the second quarter with net debt to annualize pro forma adjusted EBITDA of five and a half times, in line with our leverage target that we have methodically maintained. including our current outstanding forward equity we had 5.4 billion dollars of liquidity at quarter end which includes 800 million of cash and 4 billion dollars of availability under our 5.4 billion dollar credit facility looking forward the debt capital markets remain open and constructive across all three currencies particularly in the eurozone we consider a robust investment activity in Europe as a competitive advantage, creating additional net investment hedge capacity in euros, which avails us of more debt capacity in this low cost of capital currency. Additionally, the Ford FX rate from euros to U.S. dollars provides a favorable cost of carry that amplifies the organic growth of any net cash flow repatriated from our euro-denominated assets. Diversifying our sources of capital is a core strategic initiative as we scale our platform globally with the establishment of our evergreen U.S. Core Plus Fund serving as a key milestone. We are energized by the opportunity to monetize the value of our platform by managing real estate on behalf of third parties. By using an open-end fund structure to invest in net lease real estate, we believe we will have the opportunity to enhance acquisition investment spreads, bolstering returns for our public shareholders while providing attractive and stable long-term returns to our private capital partners, each by applying Realty Income's platform and experience to the structure. Given the highly scalable nature of our platform and the vast addressable market for net lease real estate, we see this initiative as a powerful driver of long-term value creation for Realty Income. After launching our formal marketing process in February, we have been pleased with the breadth and depth of interest from prominent institutional investors. We believe these investors clearly appreciate the strength of our platform, the resilience of our asset class, and the value created by our long operating history. Feedback has validated our fundamental view that scale matters, and we look forward to sharing more soon. I would now like to hand it back to Sumit to complete our prepared remarks. Thank you, Jonathan. We're confident that the
structural advantages we've cultivated, including scale, diversification, discipline, and data analytics, we'll continue to create value through a range of economic backdrops. Looking ahead, our focus remains on operational consistency and disciplined investment principles that have guided us throughout our 56-year operating history. Our long-term objective remains unchanged, deliver resilient and growing income through a diversified net lease platform. With meaningful scale and strategic flexibility, we believe we are well-positioned to remain selective in today's environment and deliver lasting value for shareholders over time. I would now like to open the call for questions. Operator? We will now begin the question and
Operator
answer session. Again, to ask a question, you may press star and then one on your touch-time phone. And if you're using a speakerphone, please pick up your handset before pressing the keys. To withdraw a question, you may press star and then two. At this time, we will pause just momentarily to assemble our roster. And our first question here will come from Brad Heffern with
RBC Capital Markets. Please go ahead. Yeah. Hi, everyone. Thanks for taking my questions. Sumit, you mentioned that you expanded into Poland in the second quarter. Can you walk through the opportunity you see in that market and maybe how it's similar or different to other areas in
Europe? Sure. Thank you for the question, Brad. Poland is a country that we have been talking about for about a year, year and a half. We are very excited by doing our first two transactions in Poland and getting it over the finish line in the second quarter. As you probably know, Brad, Poland is the second fastest growing GDP in Europe today. It is the eighth largest in terms of population, and sixth largest in terms of GDP growth in the European Union. And so that backdrop was the initial screen which sort of attracted us to the geography, to that particular country. And given some of the property laws, et cetera, that exists in that country, as well as our ability to efficiently structure the transaction, and the type of transactions that we've been following for a very long time made it a very compelling geography to expand into. The two transactions that we got over the finish line, one was with Echo Okna, and the other one was a grocery store operator, a Dutch grocery store operator. These were basically distribution centers and industrial assets that we invested in. And we are very excited about not only these two initial transactions that we executed, but the pipeline of transactions that we are starting to build in this country. So super excited about continuing to redefine the sandbox for ourselves. obviously that continues to contribute to yet another source of volume that we can we can source and some of which is starting to get reflected in the 43 billion of sourcing volume that we shared for the second quarter okay thank
you for that and then on the acquisition you know the only underlying guidance items that change was acquisitions I'm assuming those deals are accretive and so I'm just wondering you know why the loan low end moved up but then the high
end didn't change it's a it's a function of continued uh um you know conservatism on our part is one there continues to be a fair amount of uncertainty uh in terms of policies that are being instituted here in the u.s as well as in europe and and so for us you know we wanted to be as accurate as possible and we felt like it was important for us to move the bottom end by two cents, but yet leave the top end where it is, the increase in acquisition volume by a billion, as you can tell, it's going to be back-end loaded, second half loaded. And so the impact that one would experience from, and you correctly said these are all accreted transactions, we wouldn't be doing diluted transactions, you know, the impact of which won't be, you know, experienced in 2025, but certainly we'll be, you know, we'll see the
Operator
benefits of which in 2026. And our next question will come from Smeeds Rose with Citi. Please go
ahead. Hi, thanks. Good afternoon. I wanted to ask you a little more on the acquisitions as well, and really just if there were, I mean, it sounds like there's just a tremendous increase in this source volume that you mentioned at $43 billion, but with a less than 3%, it's like getting into an IU league school. I'm just kind of wondering, was the quality of what you saw not that good? Did you become more sort of picky, I guess, in terms of what you chose to invest in? Or I'm just sort of wondering, because your investment activity went down sequentially, but the sourcing, it sounds like, kind of really ballooned.
That's a great question. And, yes, we pride ourselves in being super selective. Yes, akin to the Ivy Leagues. But the main reason, Smead, was, look, at the end of the day, there was close to $3.7 billion of transactions that basically checked all of the boxes save for the initial yield. And that is the reason why we stepped away from pursuing those transactions. And so, yes, 3% does seem very low, but had we done that, $3.7 billion, it would be closer to what we've traditionally done, which is closer to 7% to 8% of the overall volume that we've looked at. And part of the reason why we are doing this private capital and looking at these other forms of capital that want to take advantage of the platform that we've built and we want to monetize the platform that we've built is to be able to do these transactions that we stepped away. So, yes, selectivity continues to be a governing factor, and our disciplined approach to making sure that anything that we do day one is accretive to the bottom line is part of the reason why we got $1.2 billion over the finish line rather than something much higher.
Thanks. And then I just wanted to follow up. You obviously remained very concentrated in Europe during the quarter as you did in the first quarter. Last quarter you talked about finding a number of retail park opportunities. Was that a significant part of your investing activity this quarter, or was there a particular asset class that you were able to execute on this quarter?
Yeah, great question. Actually, in the U.K., it was not the case that we did a whole lot of retail parks. A lot of it was in Ireland that we are continuing to grow our retail park portfolio. they continue to be a major source of uplift, both in the near term as well as long term. If you've been following the whole retail park resurrection, if you will, in the UK as well as in Ireland, etc., including Scotland, I would say, it's quite phenomenal. You know, a lot of positive factors are contributing tailwinds to this particular sector. Increasing rent, you know, concession rents are going away. Vacancy in Scotland today is actually inside of, for the first time in a very long time, of the rest of England. We are buying vacancies, and the uplift we are being able to capture on releasing those vacancies is part of what's contributing to value creation. So for a variety of reasons, we are super excited about, you know, this journey we were on of assimilating this portfolio of retail parks. But that window is now starting to sort of close a little bit. And we are the largest owners of retail parks in the U.K. today. And we are in the midst of putting together, you know, a presentation that we'll post on our website that will go into a lot of details around this. But that's been a very favorable investment thesis that we executed on over the last three years. Most of what we executed in Europe, going back to precisely the question you asked, was on the industrial side. Almost half of it was industrial, if you look at, you know, what we did. Some of it was, you know, we made a loan against an industrial asset as well in one of the primary markets in the U.K., as well as another loan that we made. And so that was the composition of what we did in Europe. And we are continuing to see, from a risk-adjusted basis, better opportunities in Europe, and part of it could be less competition, part of it could be we are playing in these multiple jurisdictions, part of it could be we are an established name in these jurisdictions, and therefore we are getting those first calls that's helping us drive this volume. And you should, and I know you didn't ask this question, but you should expect similar composition of total acquisitions between Europe versus U.S. in the near term,
Operator
especially in the third quarter. And our next question will come from Ron Camden with Morgan
Stanley. Please go ahead. Hey, just two quick ones. Just starting back on just tenant health, you guys have sort of done, I think, more work than most in terms of evaluating the impact of tariffs. Now that we're a couple months into it, just you remind me how you're sort of thinking about it. What's better than expected, what's worse than expected, and what's baked into the
guide for bad debt? Thanks. I would say, you know, the 4.6% watch list that we've shared with the market has basically taken into account all of the various outcomes that could come out of these, these, you know, tariffs that are being discussed in the market today. Look, we've always felt like some of the more susceptible industries, i.e. furnishing, you know, apparel, electronics, those are the industries that are going to be most impacted by tariffs. And thankfully, either we have very little to zero exposure to these types of industries in our U.S. portfolio. And so we feel like, you know, the numbers that we've shared, Ron, at this point, the 4.6 percent, and more importantly, the diversification within that 4.6. We have 114 clients that we are tracking that represent this 4.6 percent. The average is basically four basis points per client, that captures, you know, the potential outcomes. And so this diversification obviously gives us a lot more confidence. And some of the names that we've already discussed, names like at home, which we believe is at least one of the contributing factors to why they are struggling was their over-reliance. 70% of their product came from, were imported products, and a lot of it was from China. You know, that was one of the contributing factors to their performance, along with, obviously, the leverage levels that they were running the business at, et cetera. But that's already played out. And so we feel like we have bookended what the possible outcomes could be, client by client, industry by industry. the only variable is where will some of these tariffs land? But at this point, we feel like we've got it pretty well bookended in terms of what we've shared with the market.
My second question, just going back to the acquisitions, obviously we talked about the selectivity. We've also talked about, I think, 76% in Europe, which may be the biggest skew I certainly recall. Maybe I guess can you contextualize just the – Is that just a reflection of the better funding, better opportunity, and how do you compare and contrast sort of the Europe versus the U.S. market today?
Yeah, again, risk-adjusted, right? That's ultimately how we look at things. But one of the key advantages we have is access to, you know, European funds. And I'm sure, Ron, you're aware that, you know, we raised about $1.25 billion euros and the total all-in cost was 3.69%. And though we talked about in my prepared remarks of that being 130 basis points inside, 3.69 is closer to 1.6% inside of what we would be able to do in the 10-year unsecured bond. So that certainly is a contributing factor. But what is the product that we are buying? You know, if you're being able to buy long-term leases, 20-year leases, industrial product with businesses that are either the best operator within their sector or a leading operator within their sector, we feel like from a risk-adjusted return perspective, it's the right place to be. And there are a lot of factors that go into it, but, you know, it's not just the capital. It's not just the product. But the combination of the two makes it, you know, very, very impressive. I spoke about Echo Akna as one of the larger transactions we did in Poland. You know, the rent coverage is six times. And so when you see metrics like that and you're able to get it at initial yields, you know, like the way we were able to, I mean, it's very difficult to compete here in the U.S. Where even in secondary markets, industrial assets are trading in the mid-sixes. And that's – I'm being generous here. You know, they tend to go even more aggressive than that. So all of those factors contribute to us, you know, leaning a little bit more into Europe. And, again, I don't want the statement to be taken the wrong way. There's a bit more stability there, you know. There's a bit more stronger outlook to what's going to happen to interest rates, et cetera. And so I think transactions are a little bit more plentiful there than, you know, what we are seeing here in the U.S. It's just a lack of stability as well. So I think all of those factors go into why we are doing more in Europe. And, again, it accrues to our benefit that we have all these avenues created and we can lean into wherever we find the best opportunities. But thank you for that question.
Operator
And our next question will come from John Kilachowski with Wells Fargo. Please go ahead.
Thank you. Good afternoon. Maybe just the first one from me is on sort of the competitive landscape here. I think our broker contacts have highlighted that there are a lot of portfolio deals expected to come to market in the second half of this year. And we've also seen a fair share of private buyers get involved with Fundamental Elm Tree. I'm curious how you're seeing this sort of supply-demand dynamic here. What do you think the impact will be on yields for you and if there's the potential for a large portfolio that could take you maybe well above your guide?
John, obviously the last statement you made in your question is very true. Yes, if we end up doing a very large transaction, which has not been contemplated in our guidance, then yes, we will certainly go above the $5 billion. But let's talk a little bit about, you know, how you set up your question, which, by the way, is absolutely 100% accurate. There is a tremendous amount of demand for this product that we've been executing on for the last 56 years in the private market. You're absolutely right that companies like BlackRock that did the Elm Tree deal, you know, Starwood did the Fundamental deal, J.P. Morgan, and there are a couple of others, I think Morgan Stanley, they're creating their own net lease funds. Blackstone has obviously aggressively gone down the path of creating their own net lease fund. this is a testament to this product. And the way we are seeing it is the inbounds that we are getting from different pockets of capital wanting to utilize our platform to execute this strategy. For me, this is a win-win. I believe we are perfectly situated to be that platform that these pockets of capital can utilize to execute this very safe, very durable, very dependable, you know, business model. We oftentimes talk about, you know, we have a bond-like cash flow but equity-like growth. I mean, which other product gives you that? So I'm not surprised that you have more and more of these private platforms that are, you know, creating these net lease. Either they are creating it themselves organically or they're, you know, trying to do it through a partnership. So this is a good thing for our industry. More capital coming in, more stable capital coming into our business, I would add. And, you know, I believe that we are best suited or very well suited to be, you know, to take advantage of that. Will it create more competition? Will it push cap rates down? You know, but will they have the same level and maturity of underwriting that we have? I don't believe so. We've been competing with private capital sources, you know, at least in the last 10 years from the more established players. And, you know, the fact that the interest rate environment remains up in the air, you know, leverage is a big part of a lot of these strategies. And that continues to be something that we will benefit from most given our A minus A3 credit rating. And once we have these other channels that we are, you know, working on up and running, then we will also be able to address the volatility we see on our public equity side with some private sources of equity. And so I say bring it on. You know, it's going to sort of create more opportunities for a platform like ours to do large-scale deals. And that's one of the megatrends I talked about in my prepared remarks. More and more product is coming into the market. More and more companies are engaging and saying, you know, but we want the right partner. And it is not just, okay, we understand net lease. It's who's the right landlord that we trust who will hold these assets the long term. And there again, we stand out. So sorry, John, I know you asked a very specific question, But I wanted to provide this context to, you know, frame my megatrend, you know, comments that I made during my prepared remarks.
No, that was very helpful. I appreciate the thoughtful response. And the second one for me, I just want to make sure I heard you correctly in the opening remarks. It sounds like you reiterated the 75-bit credit loss guide. I was just hoping maybe you could talk about what you've experienced year to date and then what else is included in that number or if it's just sort of an open-ended source of conservatism?
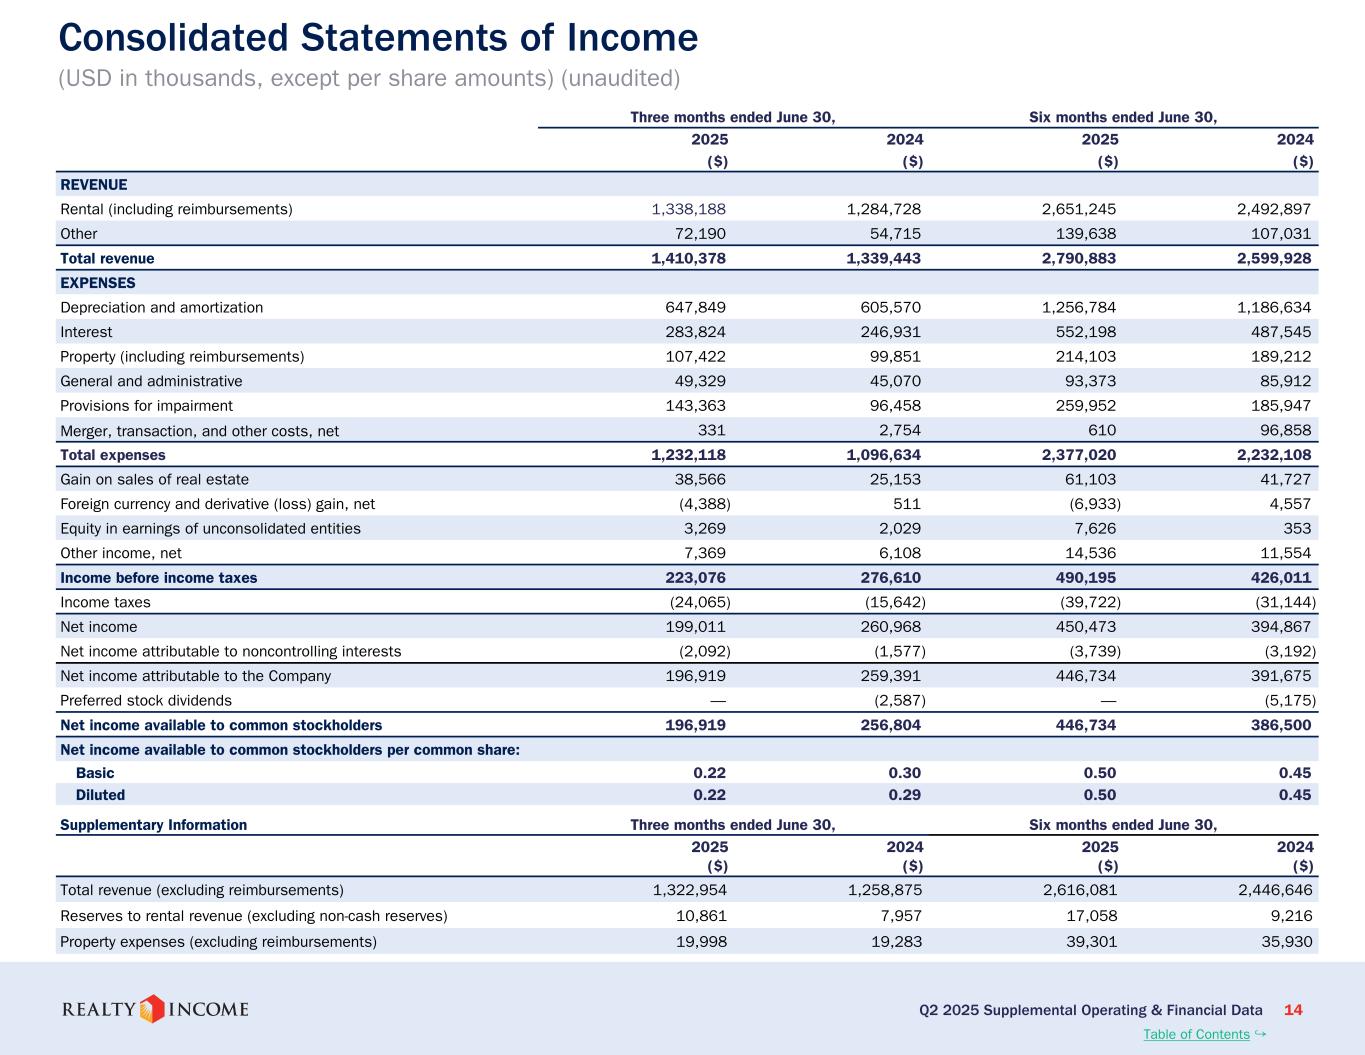
Hey, John, it's Jonathan. So on a year-to-date basis, we've recognized about $17 million in reserves. That is a number that represents about 65 basis points of rental revenue for the first half. We are indeed reiterating the 75 basis point number for the full year. And so, you know, as you think about the second half, we do have some identified credits that we've, you know, kind of set aside and have an expectation or a base model forecast for in terms of reserves we may or may not take. We feel like that's perhaps a little conservative. We also have a little bit of cushion on top of that. But the one thing I'll emphasize, that's a fully baked number. You know, that includes accounts receivable that we might charge off. that includes a rent associated with vacancy. It includes carrying costs associated with vacancy. And so this is a fully baked number. And, you know, you'll hopefully, you know, see us outperform that. But to be clear, we are reiterating that for the back half.
Operator
And our next question will come from Ryan Caviola from Green Street. Please go ahead.
Good afternoon. Thanks for taking my question. You know, just wanted to ask a question on what you're seeing on net lease industrial assets in Europe. versus, you know, kind of what you mentioned in the United States, how that surge of private capital interest had, you know, kind of affected pricing dynamics here. How is it different in Europe? I know that was the focus of the investments this quarter, and do you think, you know, that trend will continue?
That's a good question, Ryan. I just think lack of competition. We don't have the same, you know, number of potential buyers of assets with this, you know, wall of capital wanting to be invested in this particular sector, you know, pushing for transactions in Europe. I think that's a big part of it. So we can be a lot more rational about assets. The second piece I would say is relationships. Relationships means a lot more, in our opinion, in Europe than it does here. And so, you know, when you have the right relationships with developers, you have the right relationships with the operators, and they get to know you, it doesn't always come down to who's willing to pay the most. Certainty of close, desire to hold assets the long term, ability to do more repeat business. All of those factors, I think, also contribute to a much more, what I would call, a rational market for industrial transactions in Europe. Having said that, you know, cap rates are not the same across every jurisdiction. If you go to Germany, things are still pretty tight. And, you know, so we look for the right opportunities in places where we have the right yield so that day one we can point to accretion. And we've already talked about the, you know, the ability to finance these transactions with much lower cost of capital. So I think that's where the rational pricing comes into play, Ryan, in Europe versus here in the U.S. where there's just a lot more competition.
Appreciate that. And then I know you telegraphed the entry to Poland a few quarters back and were able to execute on that this quarter. Does that round out the countries of interest on that side of the globe for now Or are there still a few new countries you're looking at, or is that kind of a fluid situation?
I would say, you know, there are a few other Western countries in Europe that we are looking at opportunities, but we haven't been able to get over the finish line. Some in the Lux states, some in the Nordics, you know, but again, those are fair game. If we, you know, do a transaction, please don't be surprised. We'll obviously talk a lot about the details around those transactions. But otherwise, we are largely sort of, you know, identify the European strategy. But you use the word global. And so I don't want to discount our ability to continue to expand. Of course, we are going to do it as we did our European expansion. You know, we've always looked at our neighbors with Canada and Mexico as potential countries to expand into. And a lot of this uncertainty around trade dynamics might create opportunities for us. So, you know, those countries, too, would be fair game. But, look, the hurdle rate to go into a brand-new country for us is very, very high. And I hope we've proven to the market and to you, Ryan, that, you know, if we do decide to expand, it will be with a lot of forethought and with a thesis that we will share with you, you know, and that will be the precursor to us going into these countries.
Operator
And our next question will come from Greg McGinnis with Scotiabank. Please go ahead.
Hi, thanks for the questions. This is Elmer Chang on with Greg. First question is on the investment pipeline. Again, how much of the $43 million of deal volume you sourced during the quarter maybe represent larger portfolio deals that you have higher confidence in closing, say, maybe early next year instead of this year? And then how would you describe your ability to curate portfolios and also maintain pricing power in today's environment?
on those deals yeah it was 43 billion actually um i but um yeah it's it's tough to tell you know certainly there'll be a portion of that 43 billion that's not reflected in the 1.2 billion that we close this quarter that we will be closing in subsequent quarters so your question is a is a good one but i think the the the comment i made around approximately 3.7 billion of transactions that we walked away from because it didn't meet that initial spread remains intact. And our expectation is that given this expansion into new geographies and our advent into data centers, you know, some of these volume numbers are going to continue to track much higher just because we are now playing across a wider geographical footprint and additional asset types. So you should continue to see that, Elmer, and yes, and a portion of this we will certainly close in the subsequent quarters, but I can't go into any more detail than that.
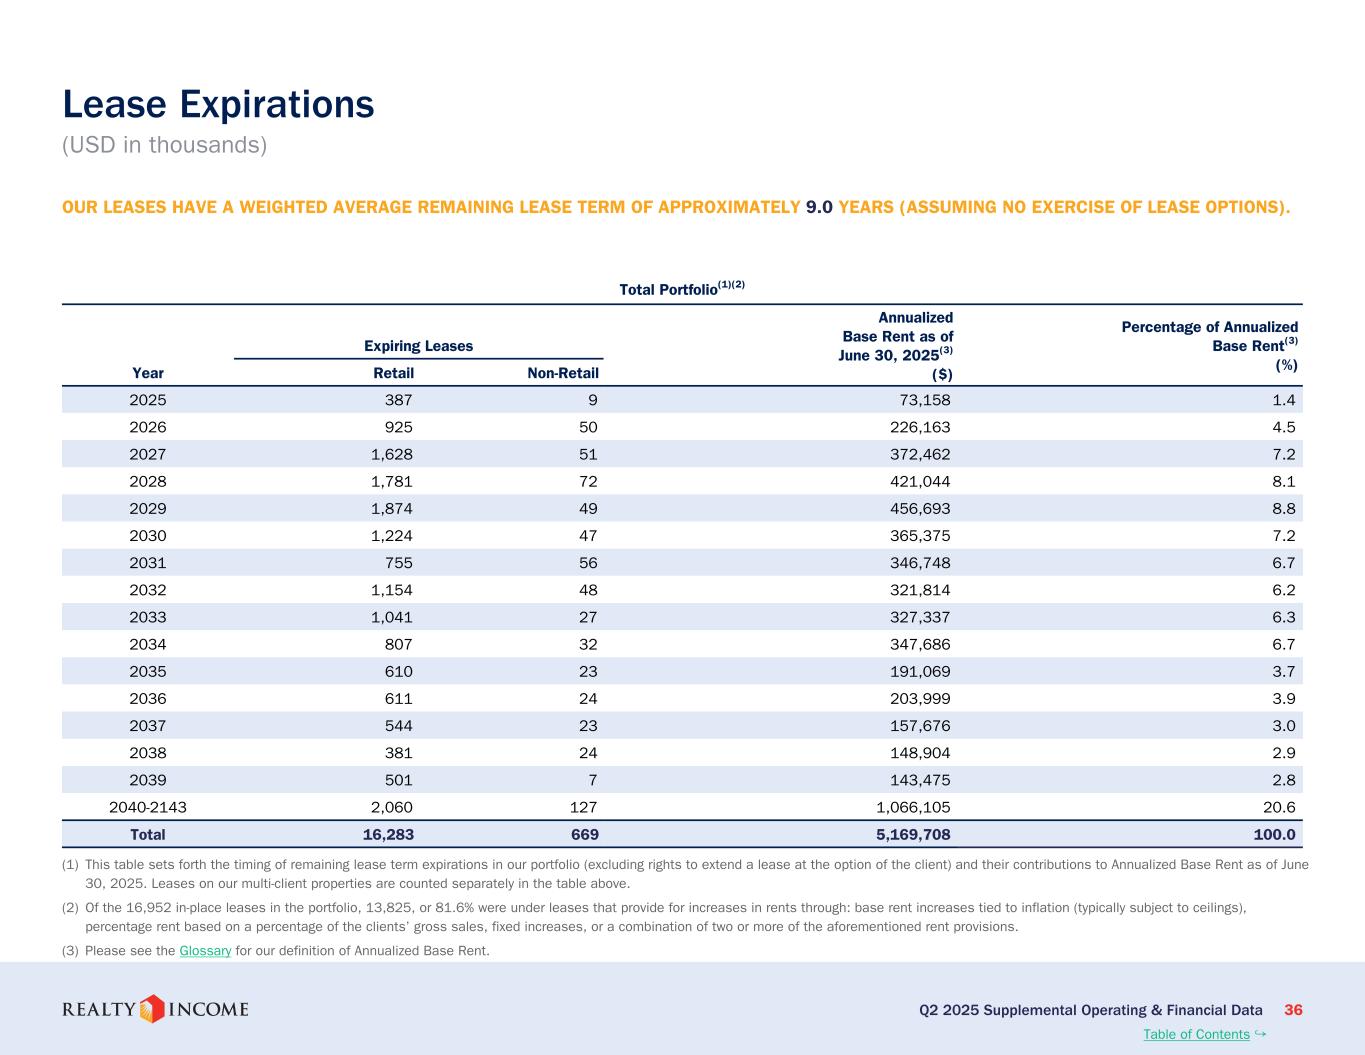
Okay. Yeah. Thanks for that correction. And second question is on lease expirations. You have about 6% of ABR expiring this year, next year. What percentage of that bucket represents non-core assets that you've identified for capital recycling opportunities? And how accretive would you expect those potential sales to be as you look to source more investment opportunities?
That's a good question. Look, anytime we have a lease rollover, we basically go through the economic analysis of if the existing client does not exercise their renewal rights, then we have a couple of routes to pursue. One is, can we find an alternative tenant, and can we find them, you know, quickly enough to justify, you know, that particular route? A second route could be, can we reposition this asset for a highest and best use, which, you know, we are happy to do and we are currently doing within our development pipeline? And then as a third outcome is to sell it vacant because we have realized the full economic value and holding on to this asset creates, you know, costs that, you know, holding costs that is not justifiable, and so we try to sell it vacant just to be very efficient. So once we've gone through that, and this is where our data analytic tools are very useful along with the experience of our asset management team we execute on one of those three strategies immediately but the point I want to make is we're not waiting till a particular lease is within the last three months or six months of expiration you know if I were to speak with our asset management team they're working on assets that may be rolling over not only in 2026 but some even in 2027, if it's with the same client and they have a wider swath of assets. And oftentimes, you know, what you might see today, you know, the expirations in 26, 27, I think in 26, it's close to 4.5% in that zip code. You know, by the end of this year, you'll see that 4% has already come down considerably because we've already resolved, you know, those 2026 assets within the last six months of 2025. And that's the cadence to a lot of these expirations. Are they unique expirations next year? I don't believe so. You know, this is pretty much folks that we've had plenty of experience with. Could there possibly be one or two assets that we've inherited through our M&A transactions that, you know, we don't have a beyond that one asset, we don't have multiple assets leased to them? Yes, that's always possible, and every year we run into that, but I don't believe that that's going to be a disproportionate share of what is expiring next year, or for the remainder of this year, for that matter. And our next question will come from
Operator
Hendel St. Just with Mizuho. Please go ahead. Hey, guys. Good afternoon. A couple quick ones
from me here. First, I guess, maybe, John, can you talk about, I guess, how you're thinking or You're looking, feeling about the overall balance sheet, your growth liquidity here in the current environment, and also how you're thinking about the various funding sources, free cash flow, equity, the revolver dispositions under near-term opportunities.
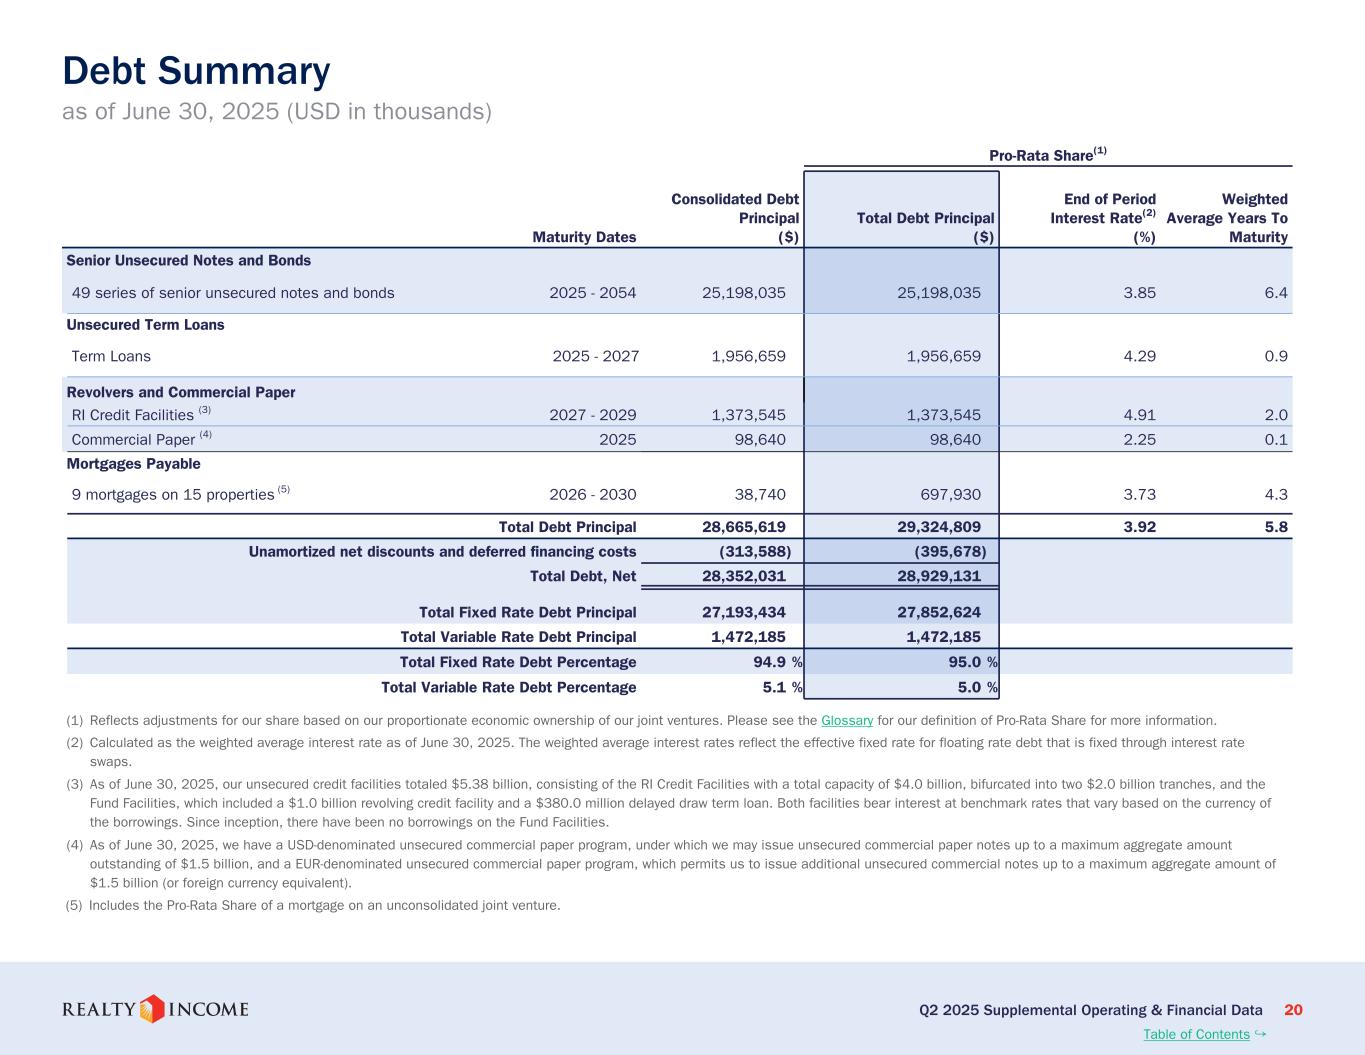
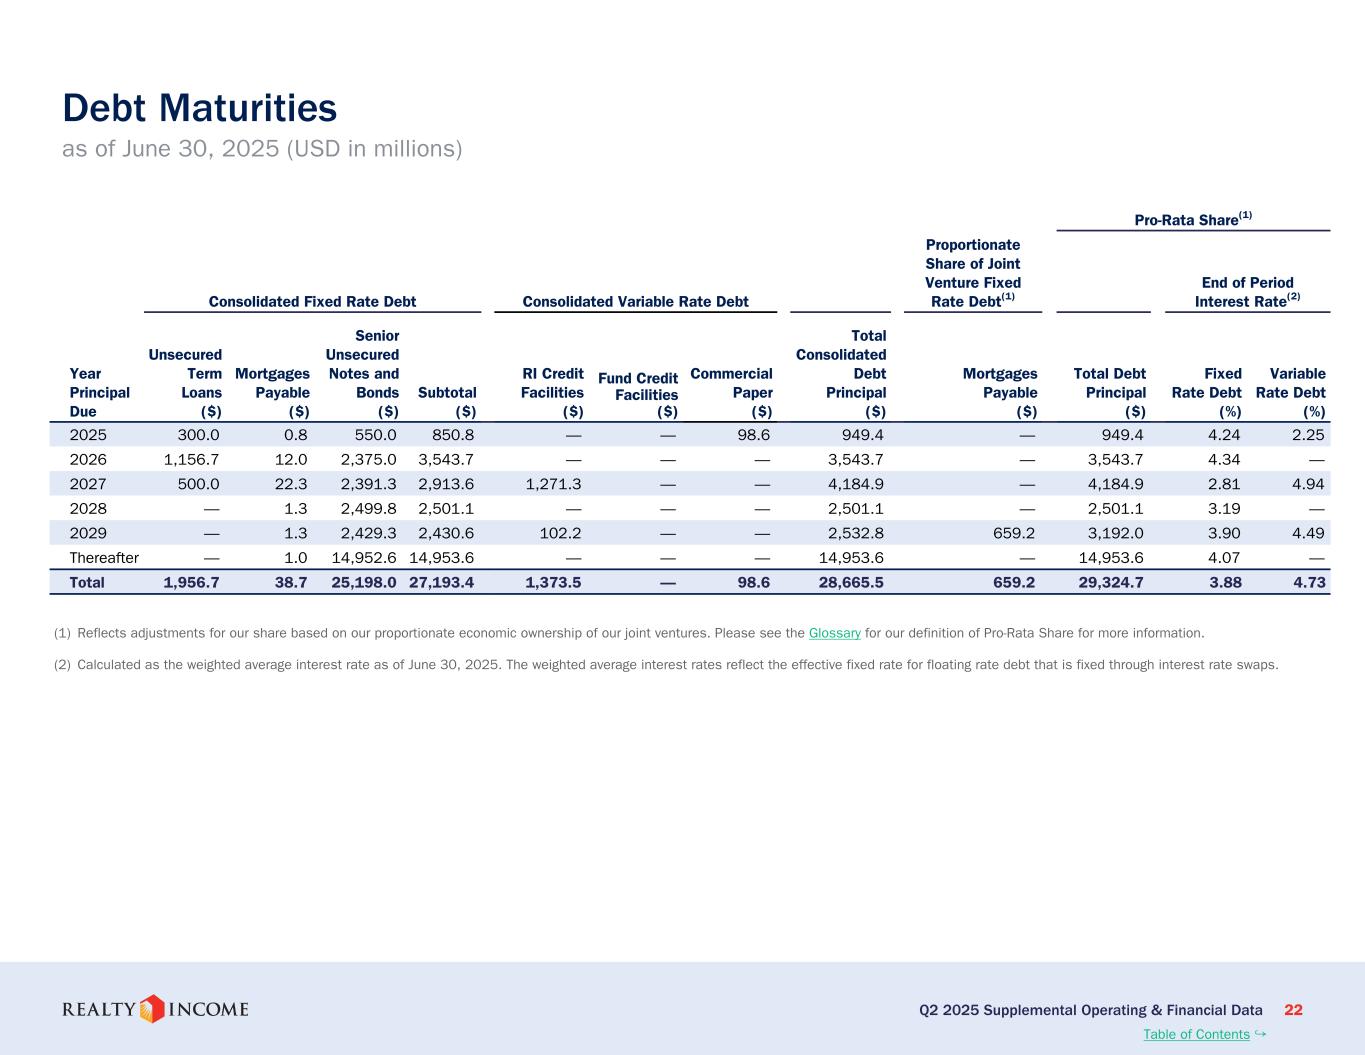
Yeah, I feel very good about it. Obviously, we had a very successful year of bond offering in June. It was about 1.1 billion euro. It was over 5X subscribed. We were very excited about just the lineup and the sponsorship that we got. And, you know, that gives us a little confidence on a go-forward basis. We do have some debt maturities that are coming up. You know, we do have about $850 million for the balance of the year. We have a $5.4 billion line. And, you know, as of quarter end, net of cash was only about $700 million drawn. So plenty of capacity there for us to be incredibly patient. The European pipeline, as we've talked about today, continues to grow, which, you know, I love hearing because that just means we're getting closer to issuing more usual denominated debt. And, you know, we had $800 million of cash at quarter end. And so you start adding up all of these tailwinds, not to mention the $654 million of unsettled forward equity. And, you know, there's very little equity that we have to go out there and raise externally to our acquisitions guidance. The $450 million of free cash flow is on top of that, and we haven't talked about dispositions volume, and our asset management team continues to be extremely active on that front. So, yes, $850 million of maturities coming out for the rest of the year sounds like a big number, But, you know, we have a multitude of sources to take care of that, and, you know, we're very programmatic about keeping our leverage at quarter end in that five-and-a-half times level and the level of predictability we get from this cash flow that allows us to do that.
And then maybe one more. We saw some additional disclosure about the different return thresholds in the private fund platform. Sounds like you guys are slowly, steadily moving the ball forward here. So I guess I'm curious where we are overall in the process. When should we expect to launch? And I'm really curious how much of the 3.7 that you passed on during the second quarter for the on-balance sheet that would have met the thresholds for the fund.
So, Hendel, you know, bear with us for a little bit because, you know, this is a process. There's only so much we can share at this junction. You know, there's a level of extreme due diligence that happens from the investor side. But I think you've been able to pick up from our commentary that we've made substantial progress and, you know, even better than we would have hoped to start the year. The type of return thresholds, we've talked about this before, you know, what's right for private capital is something that has a great IRR profile over the long term, you know, 10 years plus, but may not necessarily have that year one yield. And, you know, of that three-plus billion that we talked about, you know, that was the primary reason why we had to pass on it. And so the expansion of the buy box by virtue of having tools like this that aren't thinking about this notion of year-one investment spread, they're thinking about true underwriting real estate over the long term and thinking about it from an IRR standpoint. You know, we're not sacrificing IRR. There's just a different trajectory towards it, and that's really how we're thinking about what will go to private capital.
Operator
And our next question will come from Wes Gulladay with Baird.
Please go ahead. Hello, everyone. I just want to kind of build off that last question and answer. When you look at the opportunity and the constraints of the third-party capital, it doesn't seem like sourcing deal volume will be an issue. And so, I guess, where would the constraints be? Would it be a constraint, or could you get a higher close rate? How should we think about that?
Wes, a portion of your question got lost, but I think you were talking about where would the constraints be, and you qualified that question by saying that it's not going to be sourcing volume. So if we heard you right, that is 100% true. We're not opportunity constrained. That's the beauty of this platform. So what will be one of the constraining factors for this channel is the amount of capital that we are able to raise, you know, to be able to execute the strategy. So, so far, so good. More to come on that. But, you know, we are very excited about where we stand in the process today.
Operator
Our next question will come from Michael Goldsmith with UBS. Please go ahead.
Good afternoon. Thanks a lot for taking my questions. Retail concentration and acquisitions step down from about 72% to 47% in the quarter. So I know this will vary from period to period, but is there anything to read in that? Is that a function of opportunities? Is it a function of continued interest in diversifying the portfolio? Just trying to understand where your interest in acquisitions lies.
Good question, Michael. And, yes, it was very opportunistic. We just found more transactions within the industrial sector and on the credit side that fit our box better than continuing to pursue retail. But it is going to vary. You know, retail still dominates 80% of our overall portfolio and will continue to be a big part of, you know, of what we do going forward.
And as a follow-up, I think you mentioned in a response, you know, your pursuit of different geographies, and you brought up data centers. So I just wanted to talk a little bit about what you're seeing from that asset class, the opportunities to acquire further there, and just, like, your overall interest in moving deeper to data centers from here.
Yeah. So, Michael, our interest in data centers remains intact, continues to accelerate, but the selectivity in that particular area also continues to remain intact. And so, look, as long as we find the right partners, as long as we find the right locations and ultimate clients sitting in those assets, we would be very interested in deploying large swaths of capital into that space, but we are not going to compromise our selectivity. We have been approached to do certain transactions, and it just doesn't meet our selectivity box, if you will. But look, again, even on that particular area, we made an investment in the first quarter, and we hope to continue to cultivate that particular relationship. And, you know, we are looking forward to it bearing fruit in the future.
Operator
Our next question will come from Jason Wayne with Barclays. Please go ahead.
Yeah, just lease expirations ticked up a bit quarter over quarter. I'm just wondering if you could break down how much of that was due to leases rejected in bankruptcies?
I don't think we have that data, Jason. It's a good question. But, you know, it was circa 100 million plus minus of lease expirations. And, you know, and if I remember correctly, 93%, we had a very high number of existing clients renewing their leases. So I'm not sure, you know, how many of that remaining 7% were bankruptcy-driven, you know, re-leases or what have you. But I think it was still very much dominated by our natural flow of expirations that occurred in the second quarter. But this number, and by the way, I've been talking about this for the last four or five years now, will continue to increase. You know, and this is where I genuinely believe that our asset management team and our data-driven approach to resolving leases, et cetera, is going to start to become yet another driver of value creation for us. And, you know, over the last, I don't know how many years, but if you look at our lease renewals and our leasing spreads, they have been consistently in the 103 to 104 to 105 And it really is a function of what I just said. It's the experience of the team and the tools that we've created to help assist the team in negotiating transactions. So instead of it being something that we are concerned about, we are actually looking forward to this continued increase in the volume of dollars that are going through a renewal process on a year-in, year-out basis. Next year, it's fairly muted, but in 2027, 2028, we are looking forward to those years.
Right, and then just on the Dollar Tree sale of family dollar, I'm just wondering how many family dollars there actually are, you know, included into the Dollar Tree exposure, and if that's contemplated in your guidance for the rest of the year.
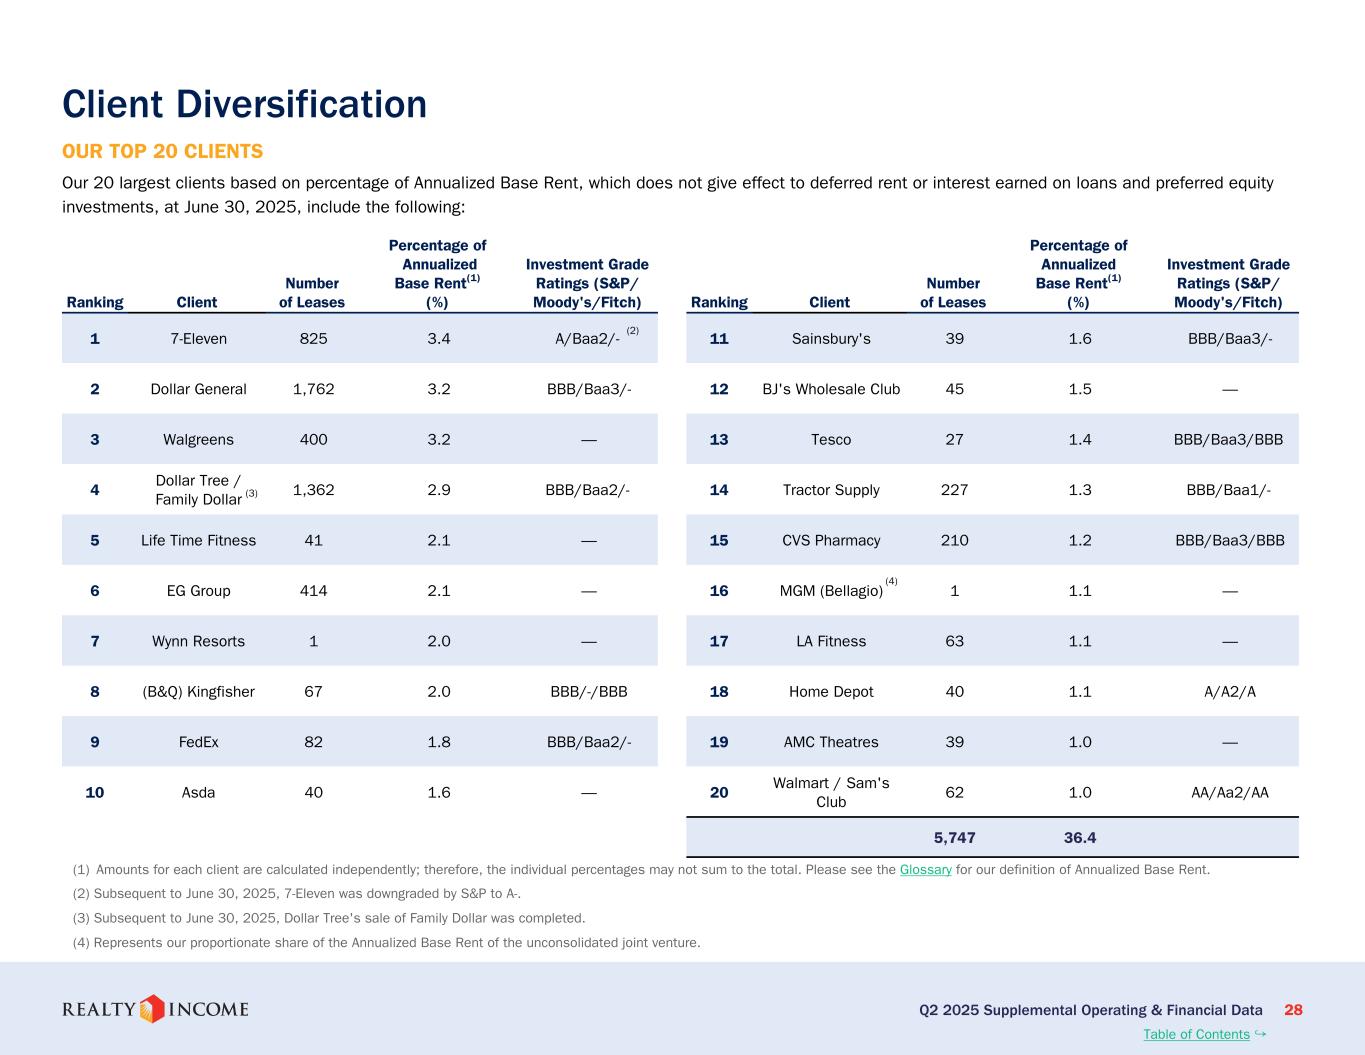
Yeah, that's a good question. So, rough numbers, please don't hold me to the precision. It's, you know, the total exposure from Dollar Tree, Family Dollar was circa 3%. Post this separation, it will be 2% is going to go with the Family Dollar and 1%. These are rough, okay, directionally accurate. 1% will be Dollar Tree. Over the next year and a half, so through 2026, there's only 10 basis points of expirations coming through for Family Dollar, or 10 basis points coming through for Dollar Tree. This is through 2026. So that's the near-term exposure we have to those two flags.
Operator
Our next question will come from Dan Bjorn with Bank of America. Please go ahead.
Good afternoon. Just one from me. Are you starting to see an uptick in interest from U.S. buyers for the European deals you're looking at?
We have certainly seen a couple of private entrants into the European market. So, yes, we are starting to see interest from American investors wanting to expand into Europe. Thank you. Thank you.
Operator
And our next question will come from Linda Tsai with Jeffries. Please go ahead.
Hi. Can you delve more into the increase in the sourcing activity of $43 billion? You know, what accounted for that? Are you shifting your investment parameters, or did AI play a role in how you're sourcing?
That's a great question, Linda. I never thought about using AI. So the channels of sourcing, they have not changed. The asset types, et cetera, they have not changed. Poland is certainly a new entrant that is now going to contribute and has potentially contributed to the $43 billion. But as more and more data center opportunities start to come in, you know, that is going to help with the sourcing numbers being what they are. So that is certainly a contributing factor. But I wouldn't say that we have started to evolve the sourcing channels. But I think you shared with us an avenue that perhaps we should lean into.
Great. And then my second question is, you said the mix of Europe versus domestic investments would be similar next quarter. Do you think the initial weighted average cash yields would look similar as well?
I would say they will be similar to slightly better.
Operator
And our next question will come from Upul Rana with KeyBank Capital Markets. Please go ahead.
Thanks for taking my question. It looks like the probability of a Fed rate cut is likely in September, and it seems like there's a growing pressure for further rate cuts if not this year, but it could occur next year. I'm just wondering if this could potentially change your strategy as it relates to Europe versus U.S. investments.
Again, a great question, Upul. And, you know, if you follow the way our stock trades, it is highly negatively correlated to interest rates. So if interest rates, in your, you know, opinion does come down, it should have potentially, and I'm assuming that the 10-year comes down as well, it should have a positive impact on our cost of equity through the public channels. And so our ability to do some of those deals that we passed up on, the $3.7 billion, you know, would increase. So, yes, it could change our, you know, ability to do more here in the U.S. But it's still very unclear to me as to whether, you know, interest rates will be cut and or even if it is cut, if it will have a disproportionate impact on the 10-year.
Okay, great. That was helpful. And then, you know, it looks like your dispositions in your vacant assets increase sequentially. You know, I just wanted to get your sense of how much more you have to do to get to a level you're comfortable with. You know, you mentioned dispositions broadly increasing in your prepared remarks, but any additional color there would be helpful.
Sure. What we have said and we are reiterating this quarter is that it will be very similar to what we've done last year.
Operator
And our next question will come from Eric Ordon with BMO Capital Markets. Please go ahead.
Hey, good afternoon. Jonathan, I just want to go back to your comments around FX. I was hoping that you could talk a little bit more about the hedging strategy that you guys are currently pursuing today, and then if there's any potential tailwind given the relative strength between the EU and USD built into the guidance today. Thank you.
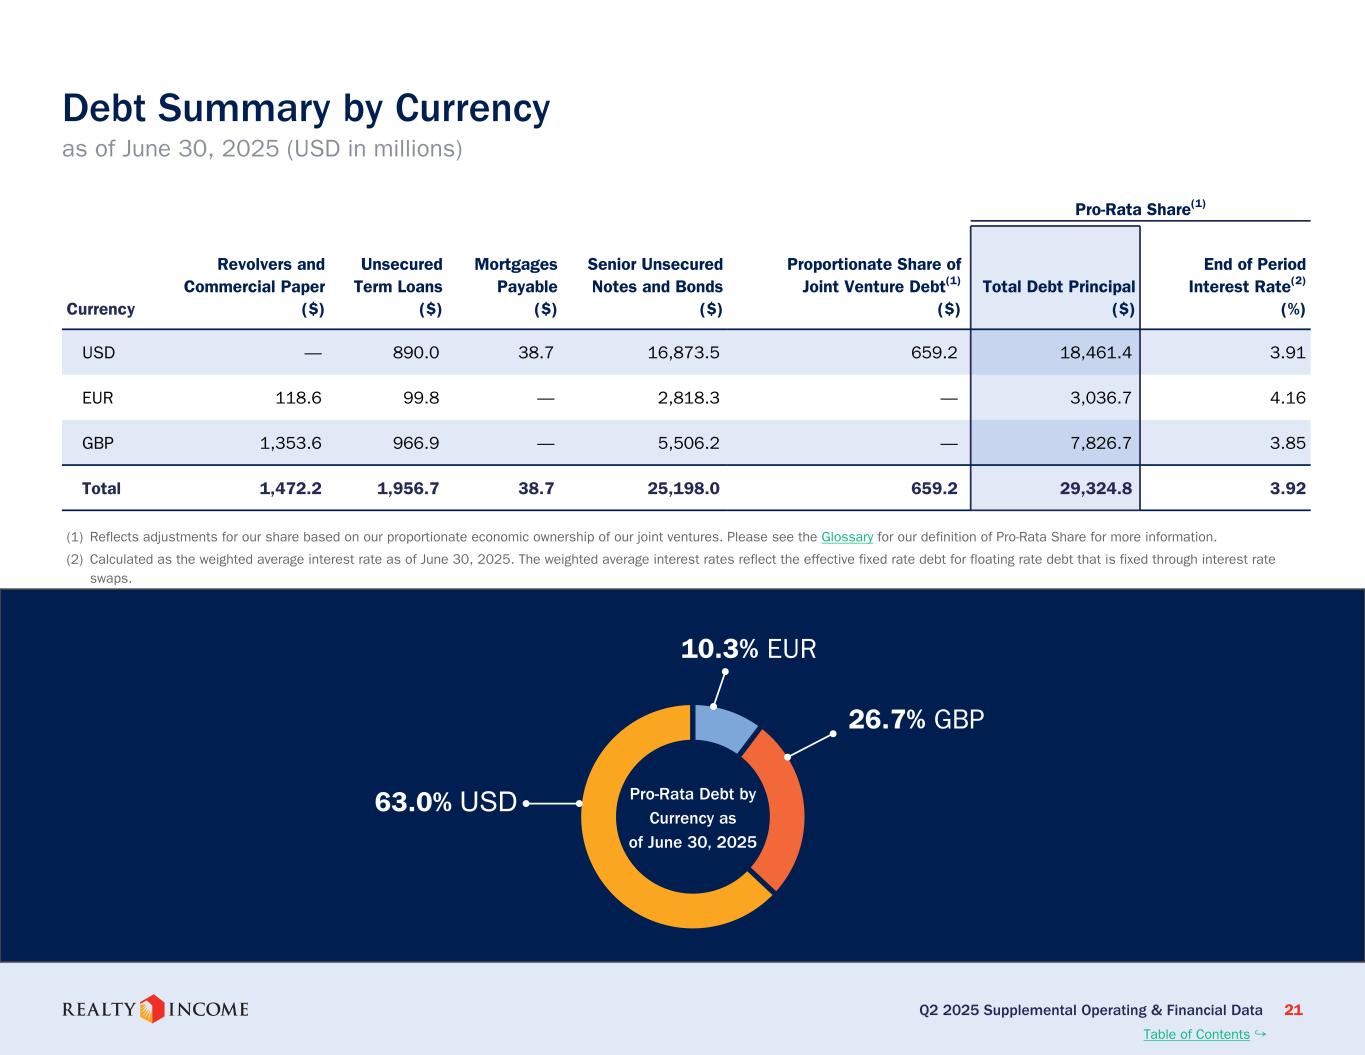
Sure. Thanks, Eric. I think, first of all, to provide context, we have a formal hedging policy that forces us to have a level of discipline. We're not allowed to take too much risk one way or another. And so from a balance sheet standpoint, from an FX hedging perspective, we're pretty evenly matched from an assets and liability standpoint, especially in Euro. And another thing that i would share is you know i referenced the ford fx curve um you may not recall but in 2019 when we did enter uh the international realm uh we did a 15-year cross-currency swap and that was because you know the forward curve between the dollar and sterling was extremely attractive and so that's an option that we have you know available to us uh but you know i think for us, you know, we try and take as much discretion out of it by virtue of always having some level of, you know, hedged earnings, if you will, locked in. We never want to have a quarter where we're talking about FX headwinds or tailwinds. We want to focus on the core business, and I think we've been successful in that so far. All right. Thank you very much. I appreciate it.
Operator
And with that, we will conclude our question and answer session. I'd like to turn the conference back over to Sumit Roy for any closing remarks.
Thank you all for joining us today. We look forward to speaking soon and seeing you at conferences in the coming weeks. Thank you, Joe.
Operator
The conference has now concluded. Thank you for attending today's presentation. You may now disconnect your lines.