Operator
Good day. And welcome to the Realty Income Fourth Quarter 2024 Earnings Conference Call. All participants will be in listen-only mode. Please note today's event is being recorded. I would now like to turn the conference over to Kelsey Mueller, Vice President, Investor Relations. Please go ahead. Thank you for joining us today for Realty Income.
2024 fourth quarter and full year operating results conference call. Discussing our results will be Sumit Roy, President and Chief Executive Officer, and Jonathan Pong, Chief Financial Officer and Treasurer. During this conference call, we will make statements that may be considered forward-looking statements under federal securities law. The company's actual future results may differ significantly from the matters discussed in any forward-looking statements. We will disclose in greater detail the factors that may cause such differences in the company's filing on Form 10-Ks. During the Q&A portion of the call, we will be observing a two-question limit. If you would like to ask additional questions, you may reenter the queue. I will now turn the call over to our CEO, Sumit Roy. Thank you, Kelsey.
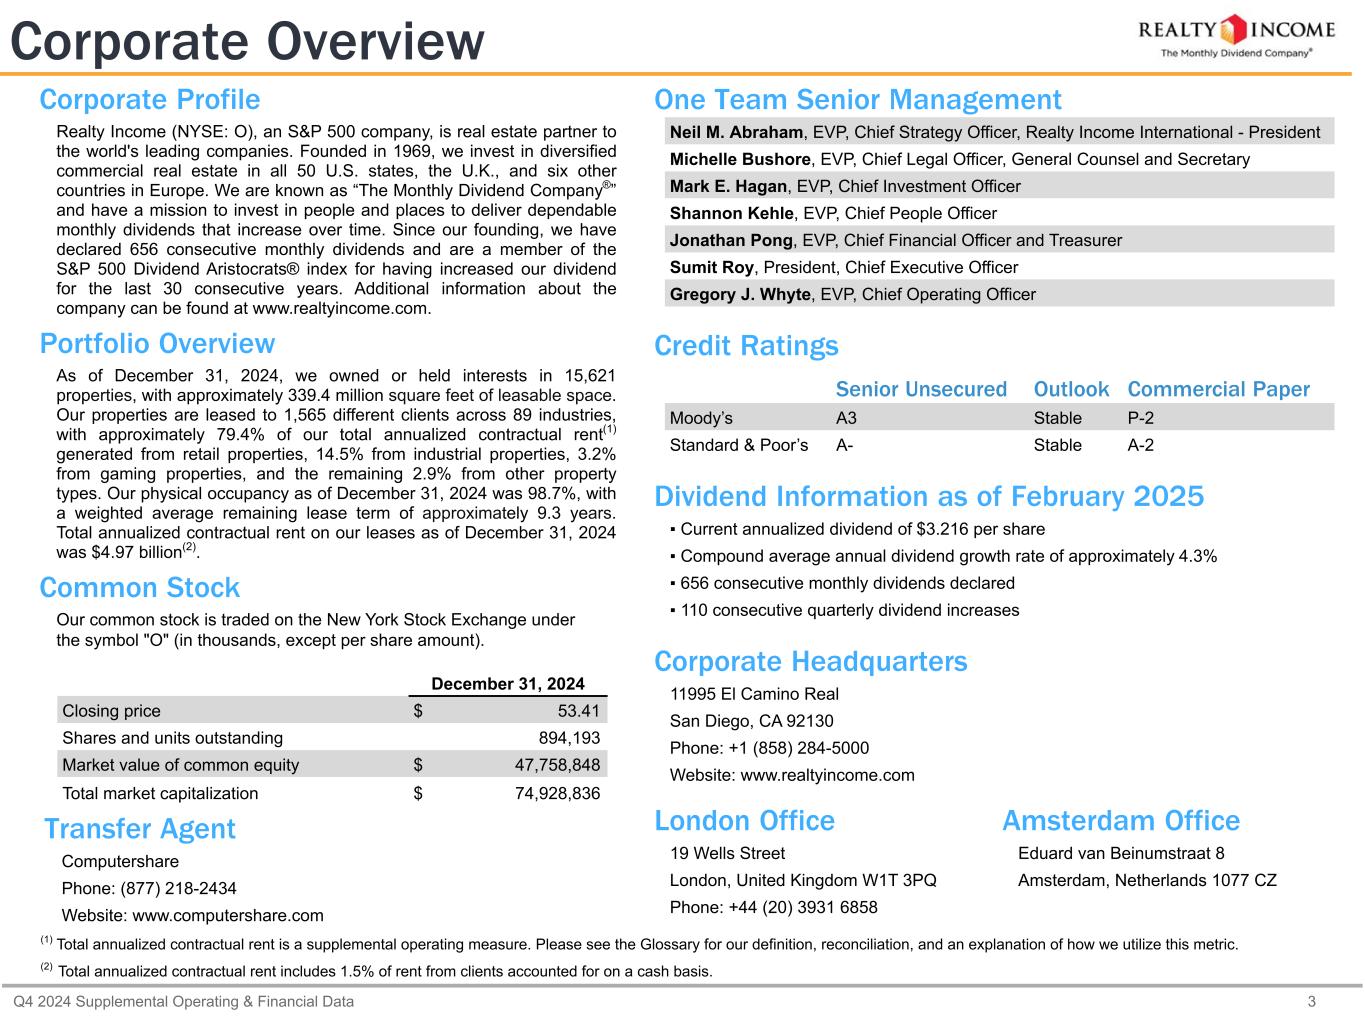
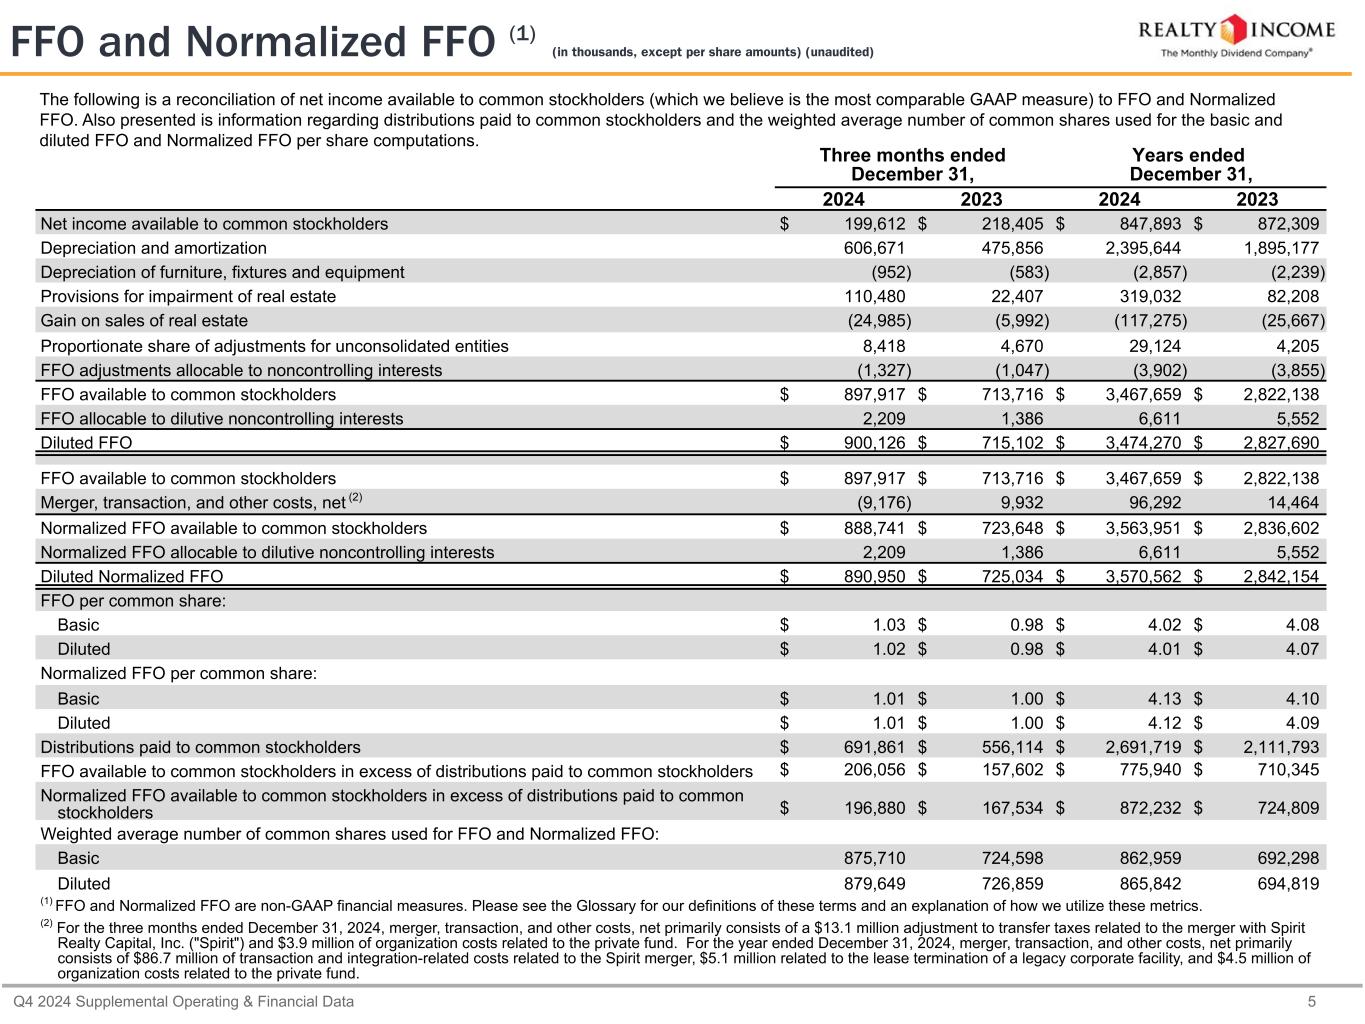
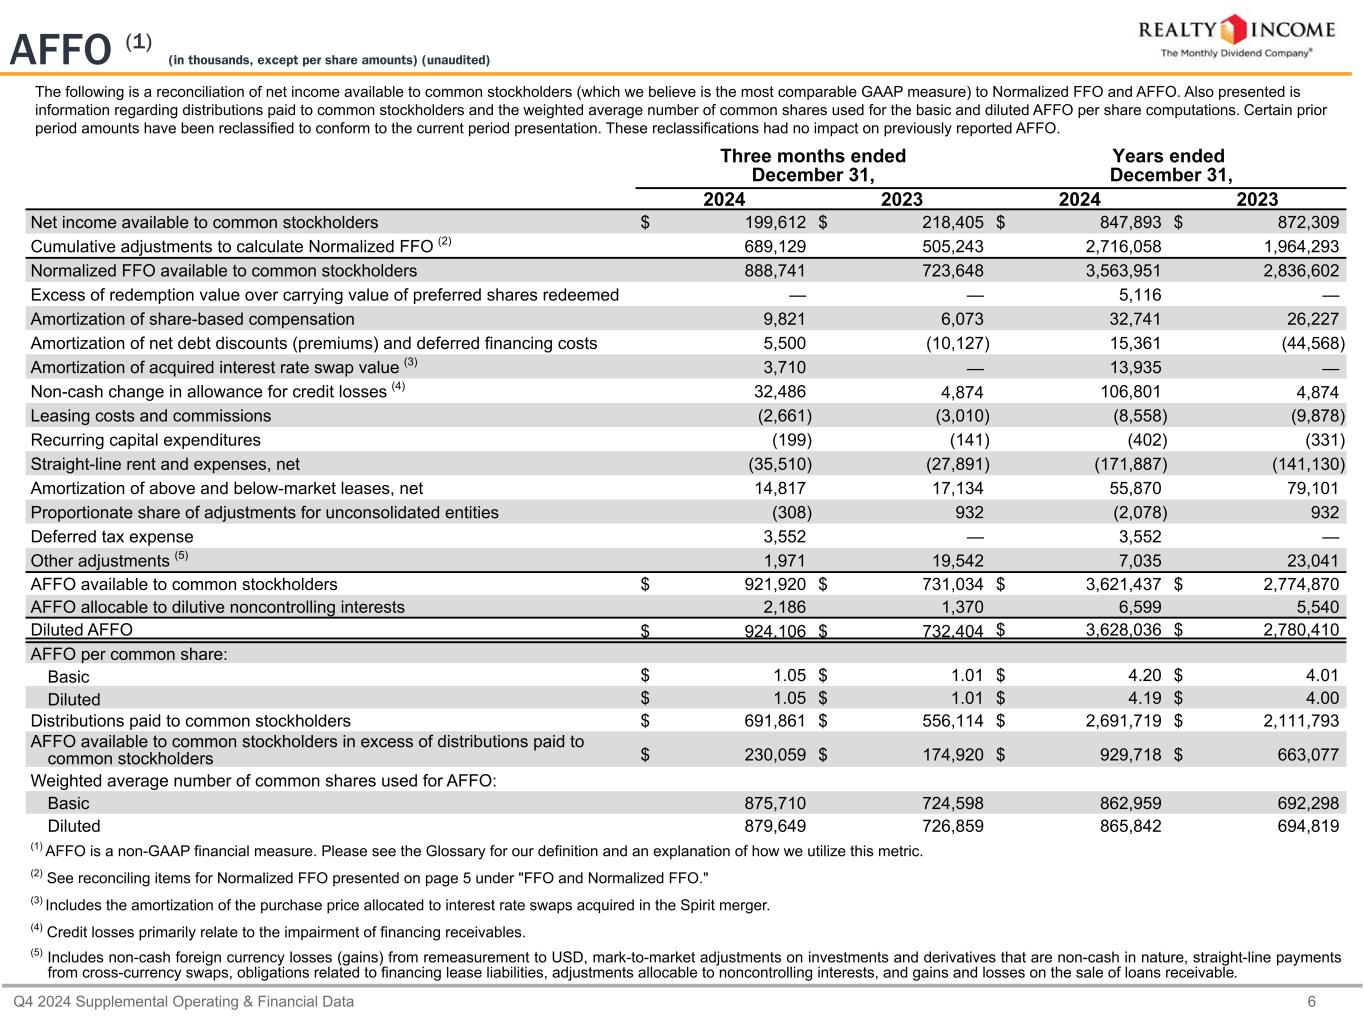
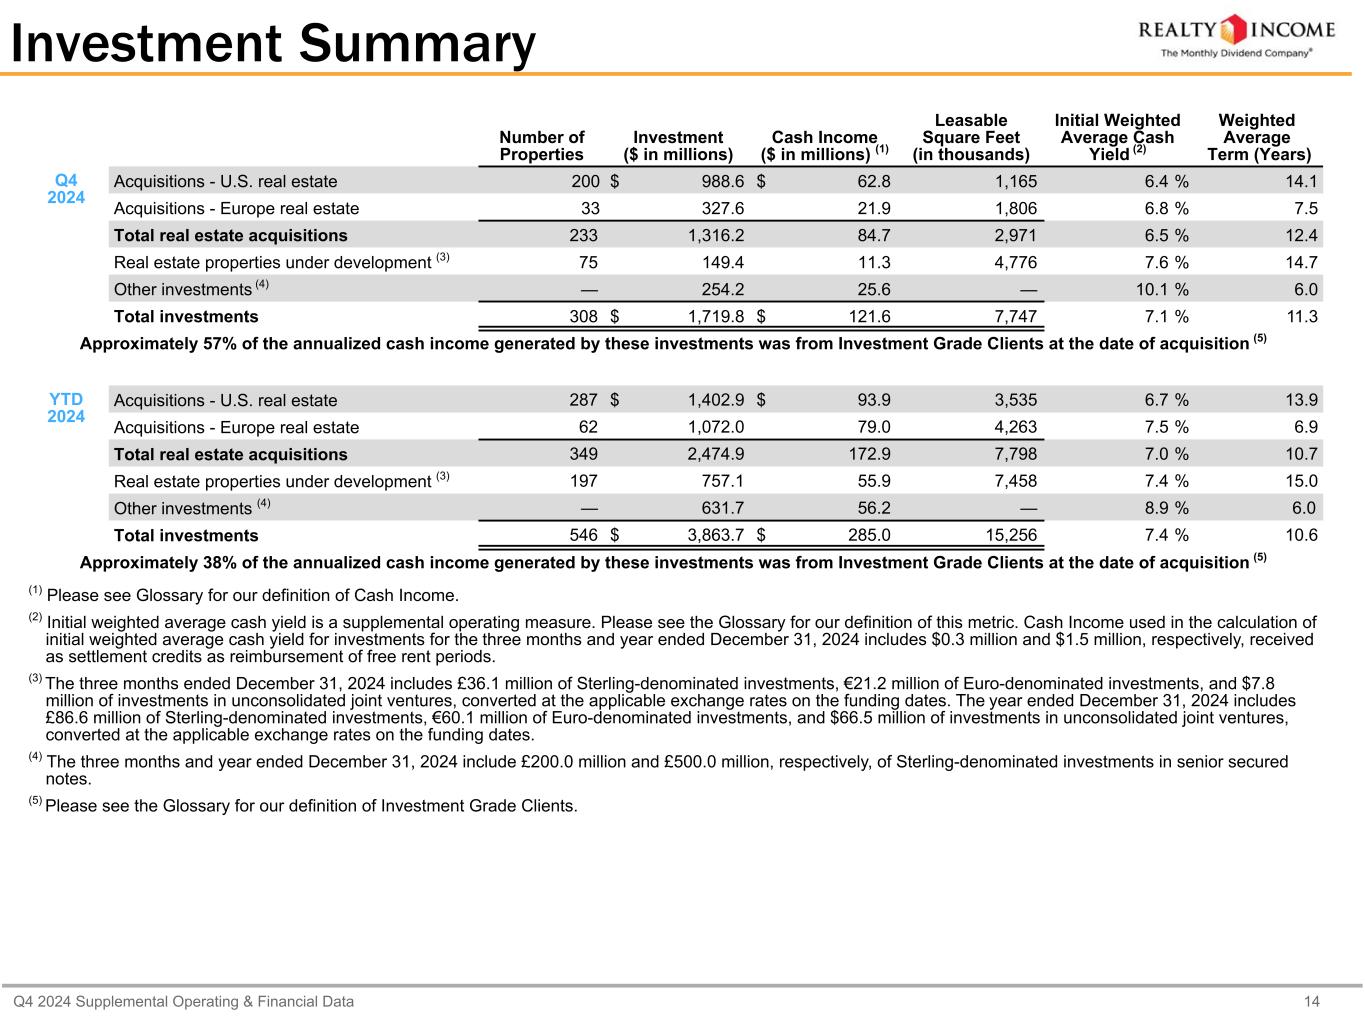
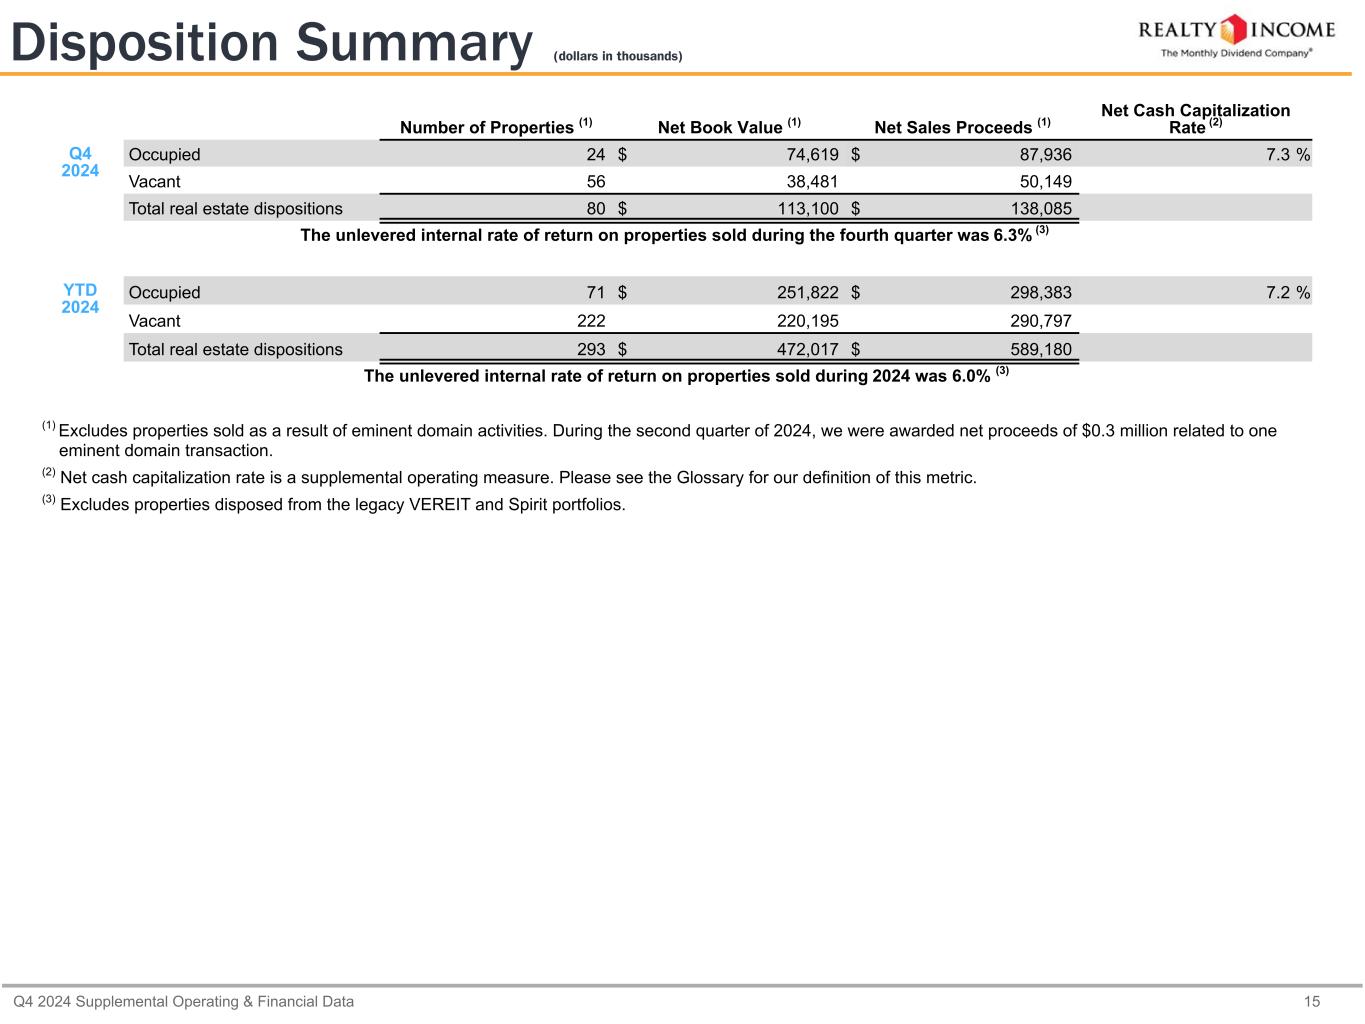
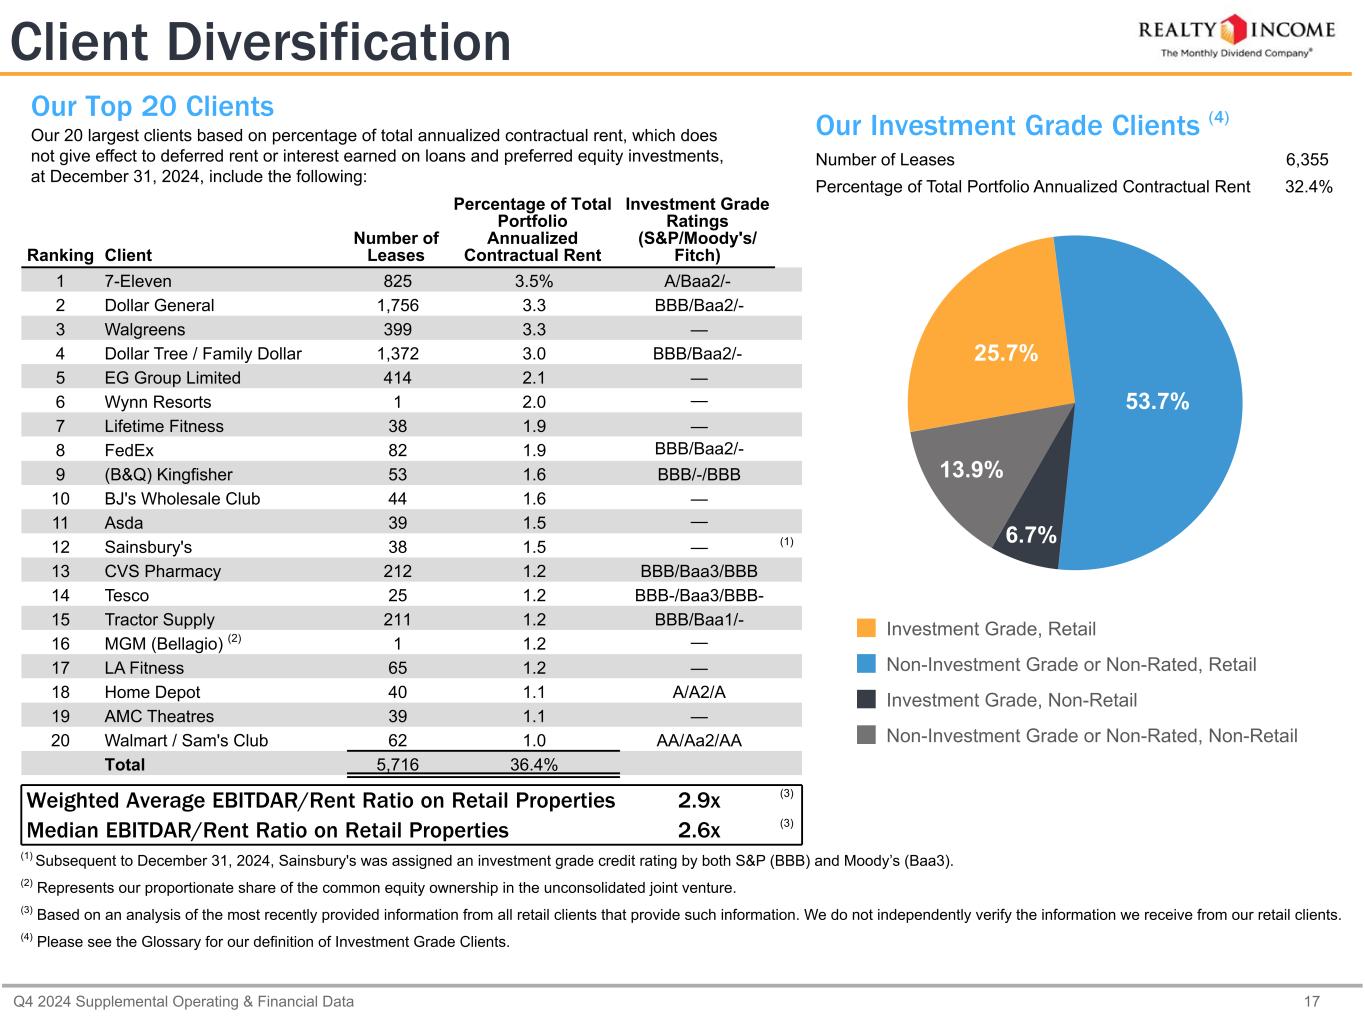
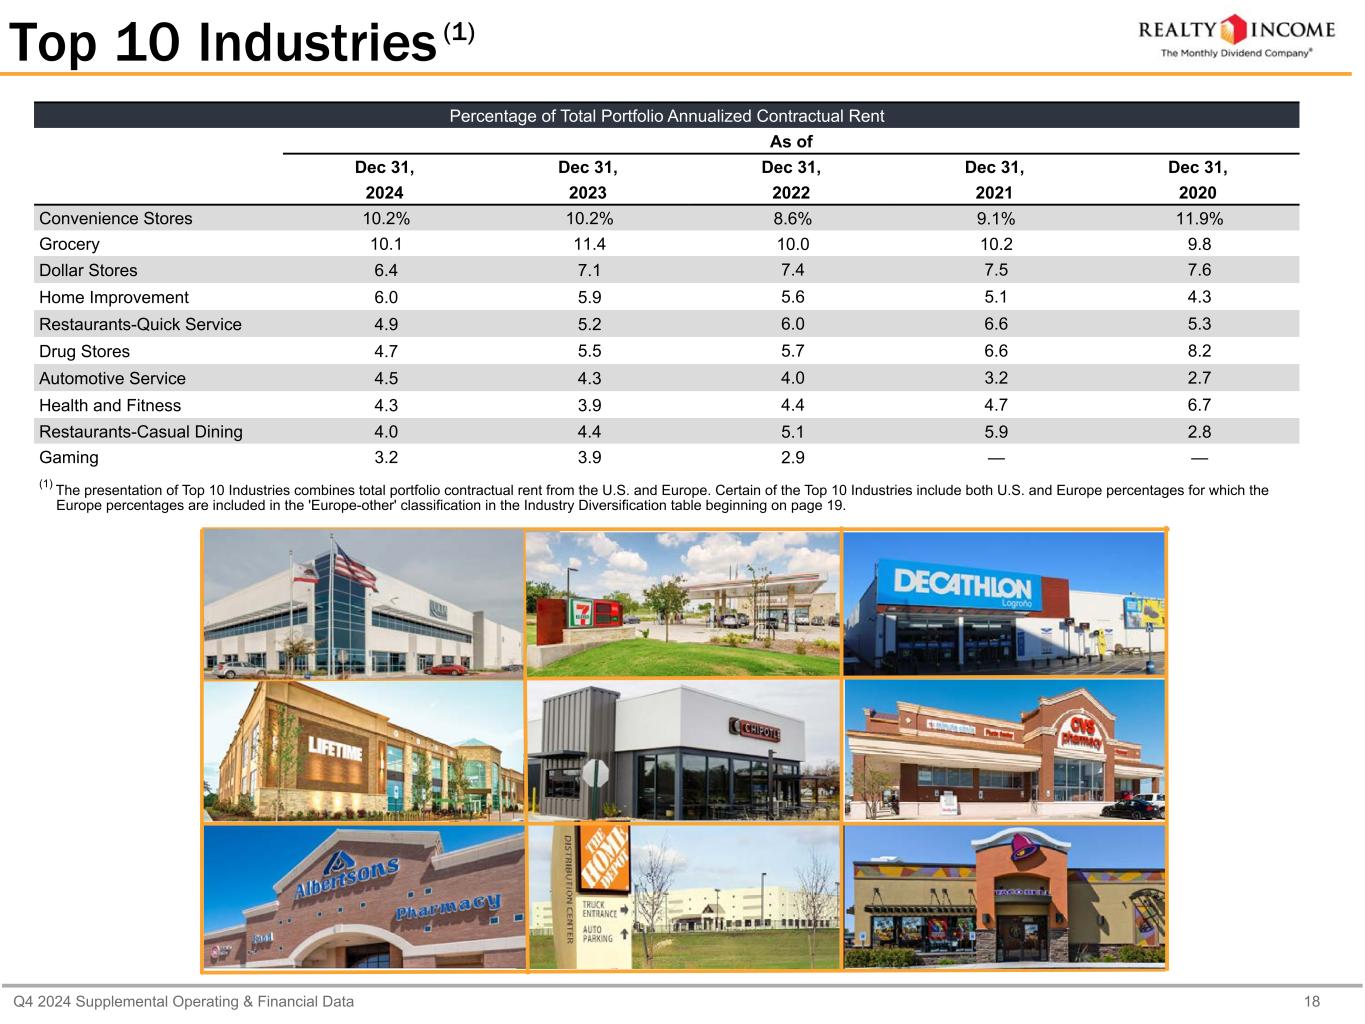
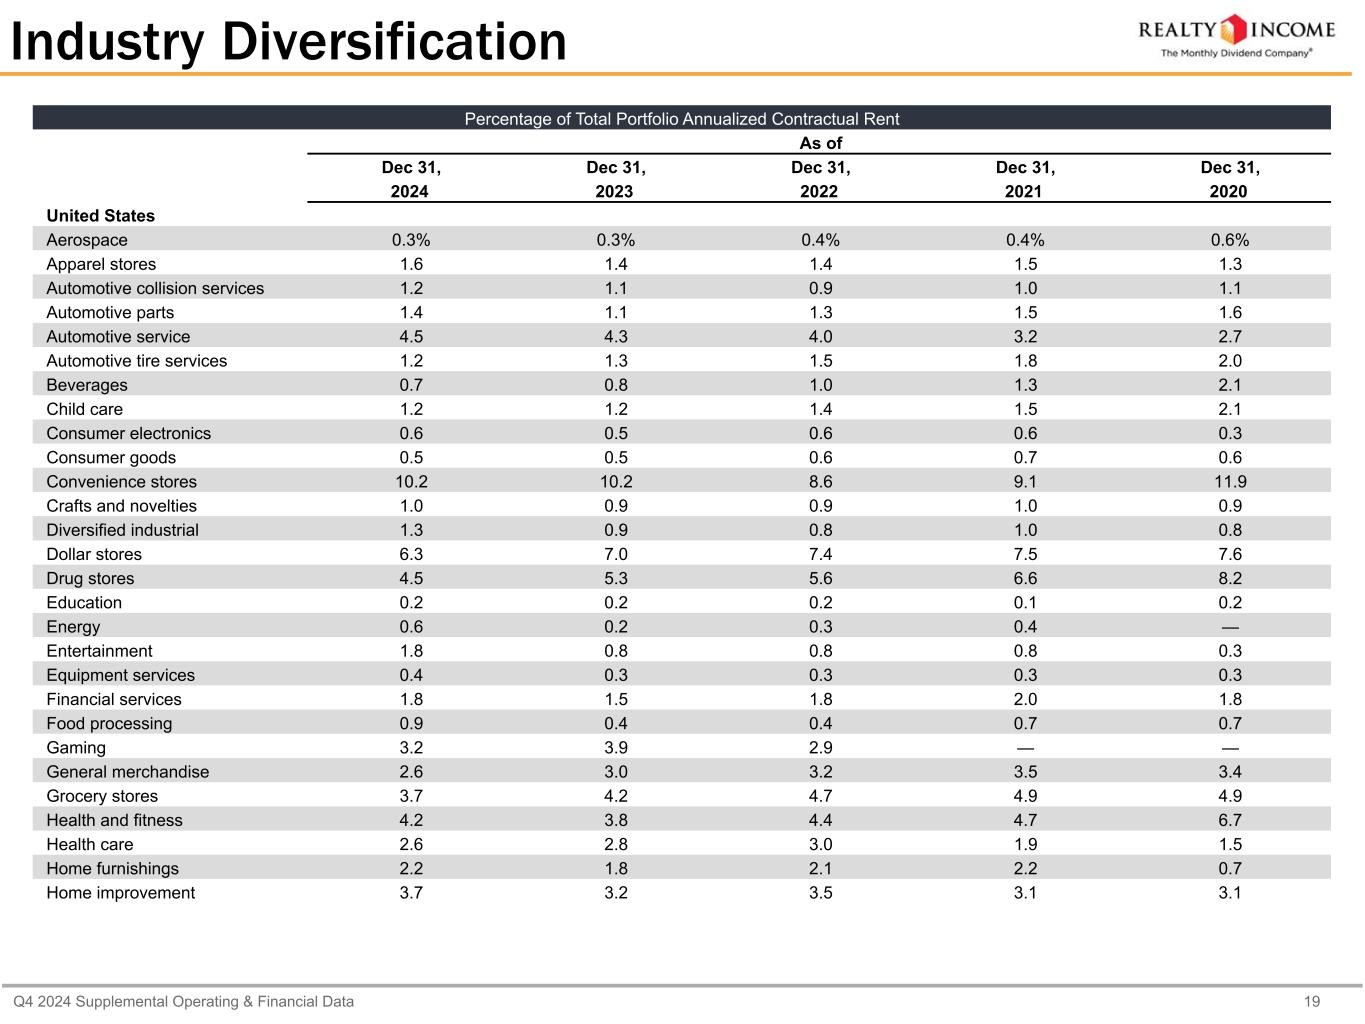
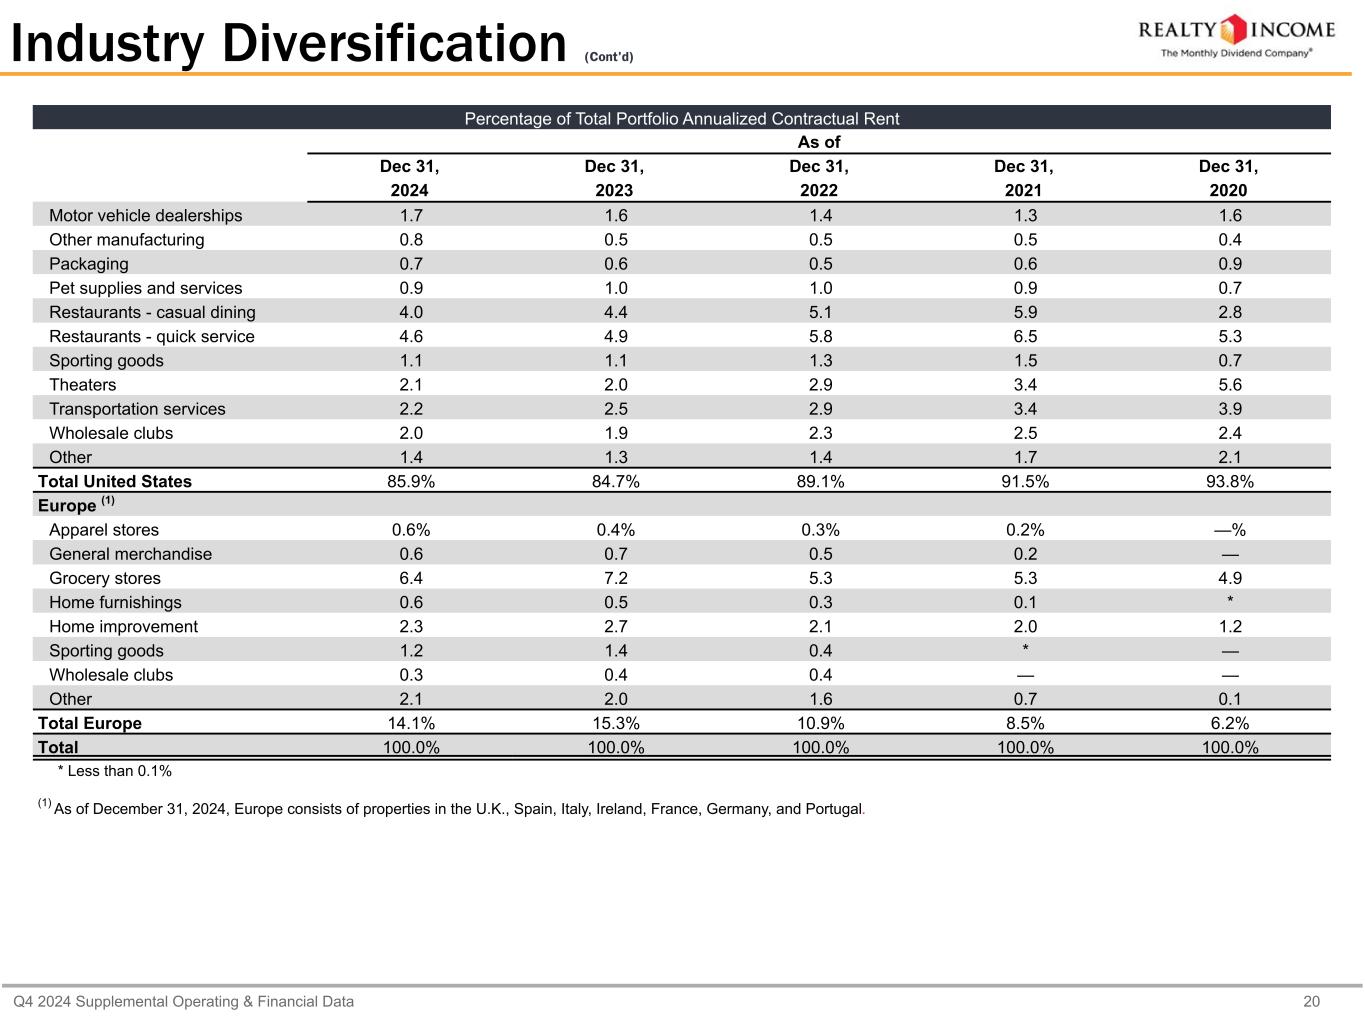
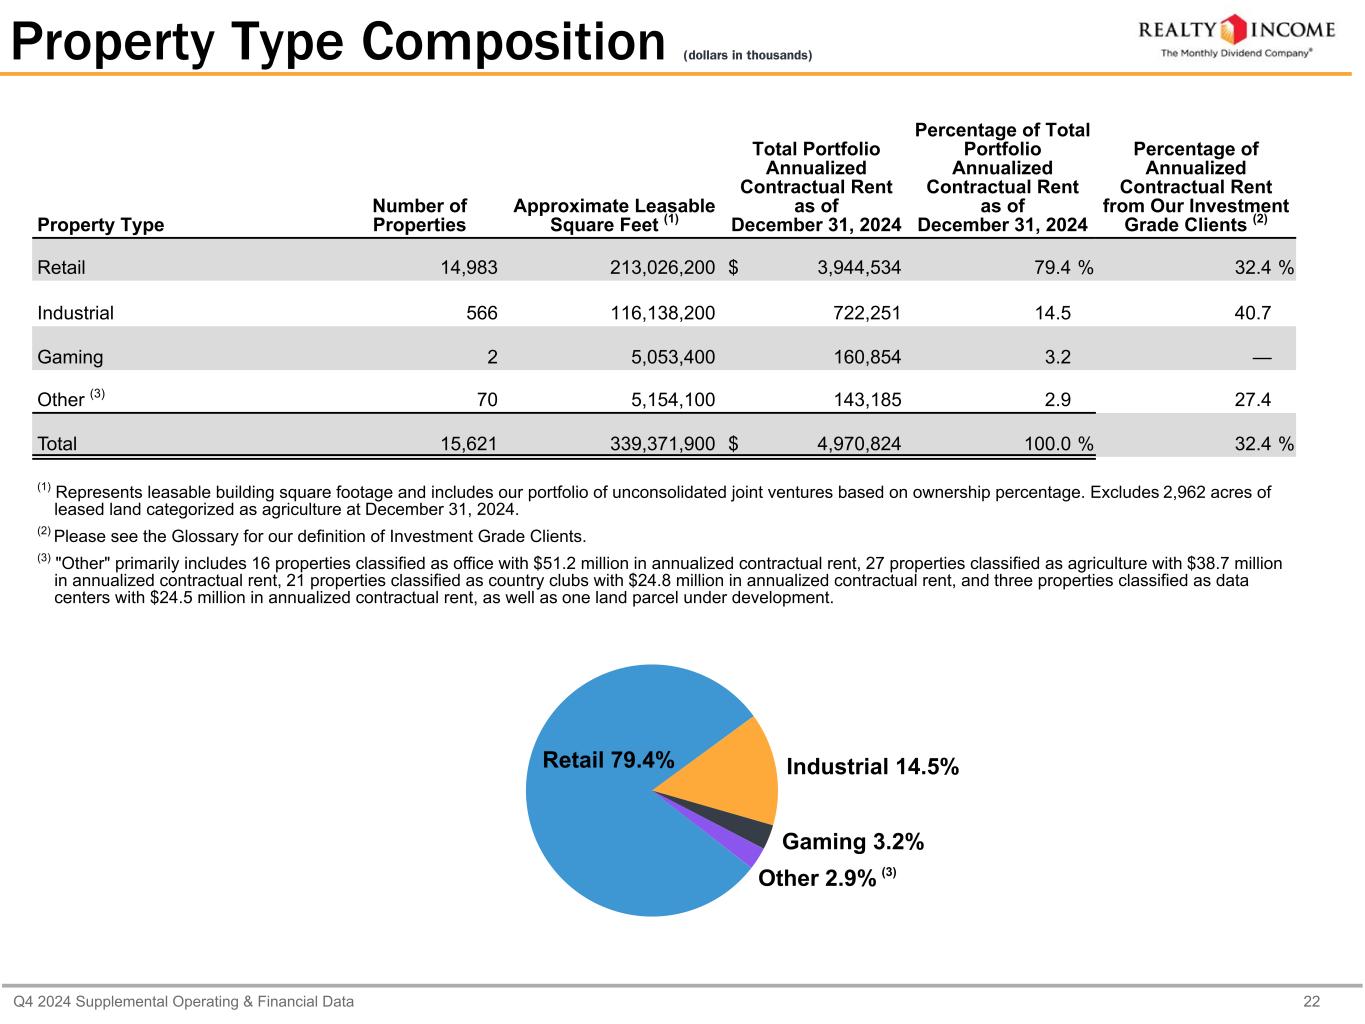
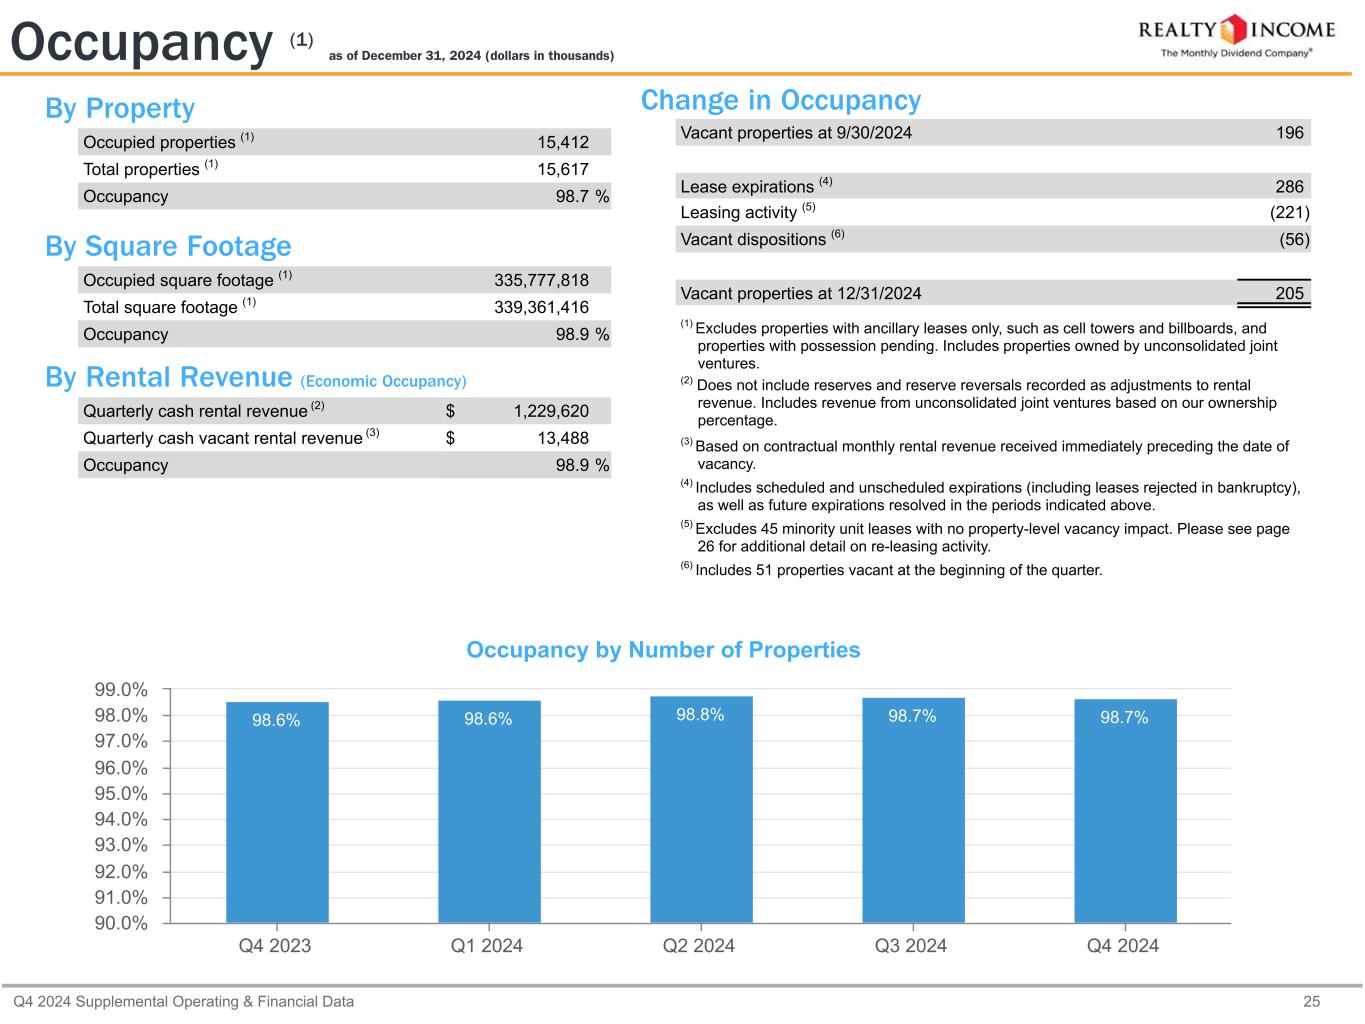
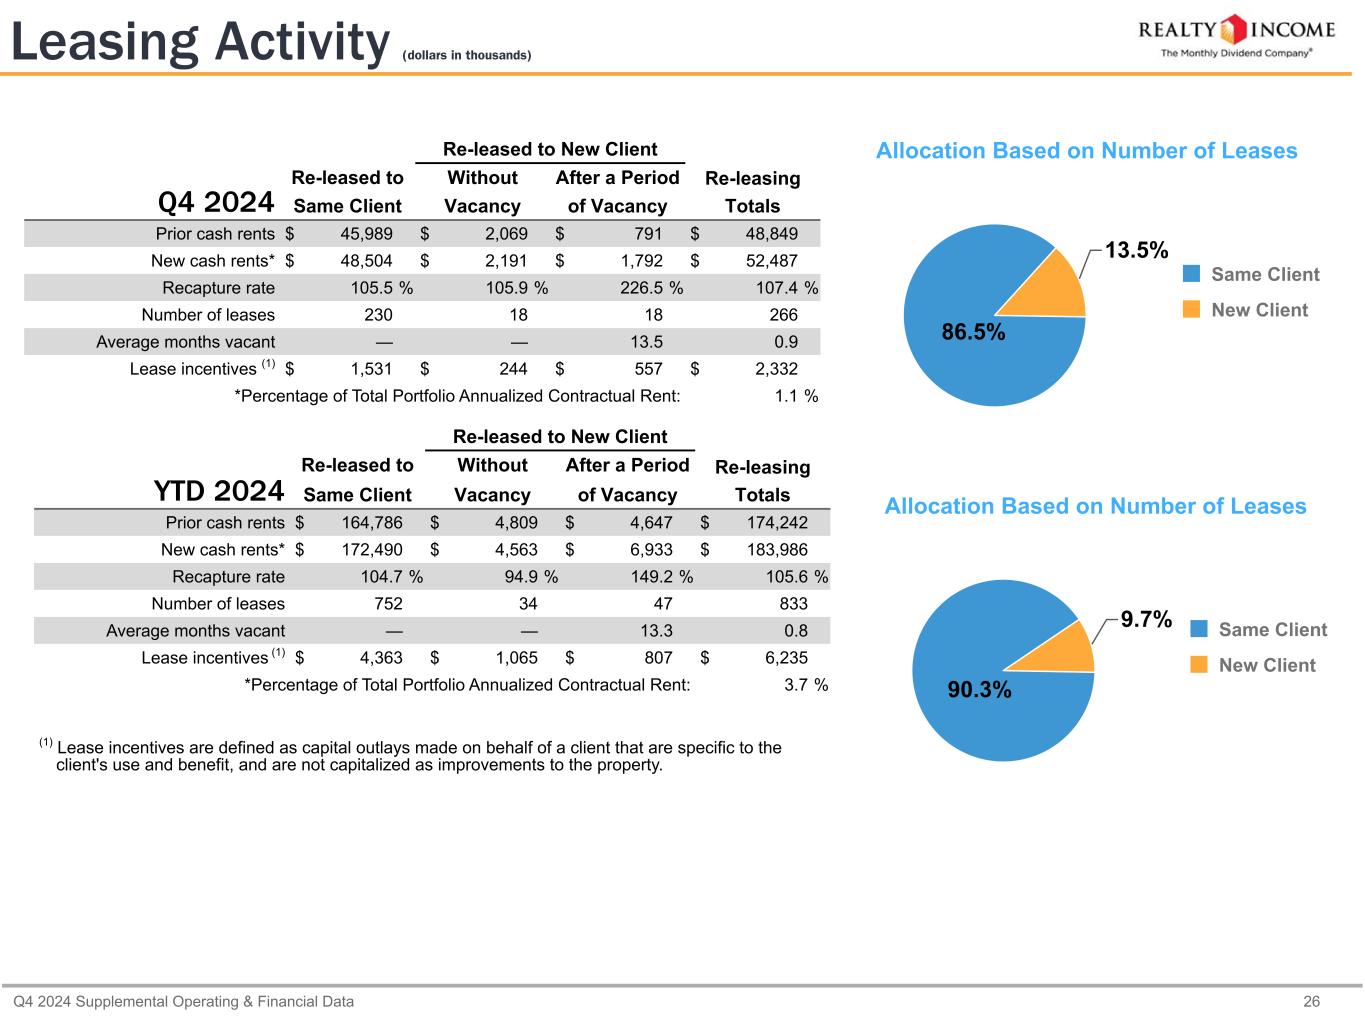
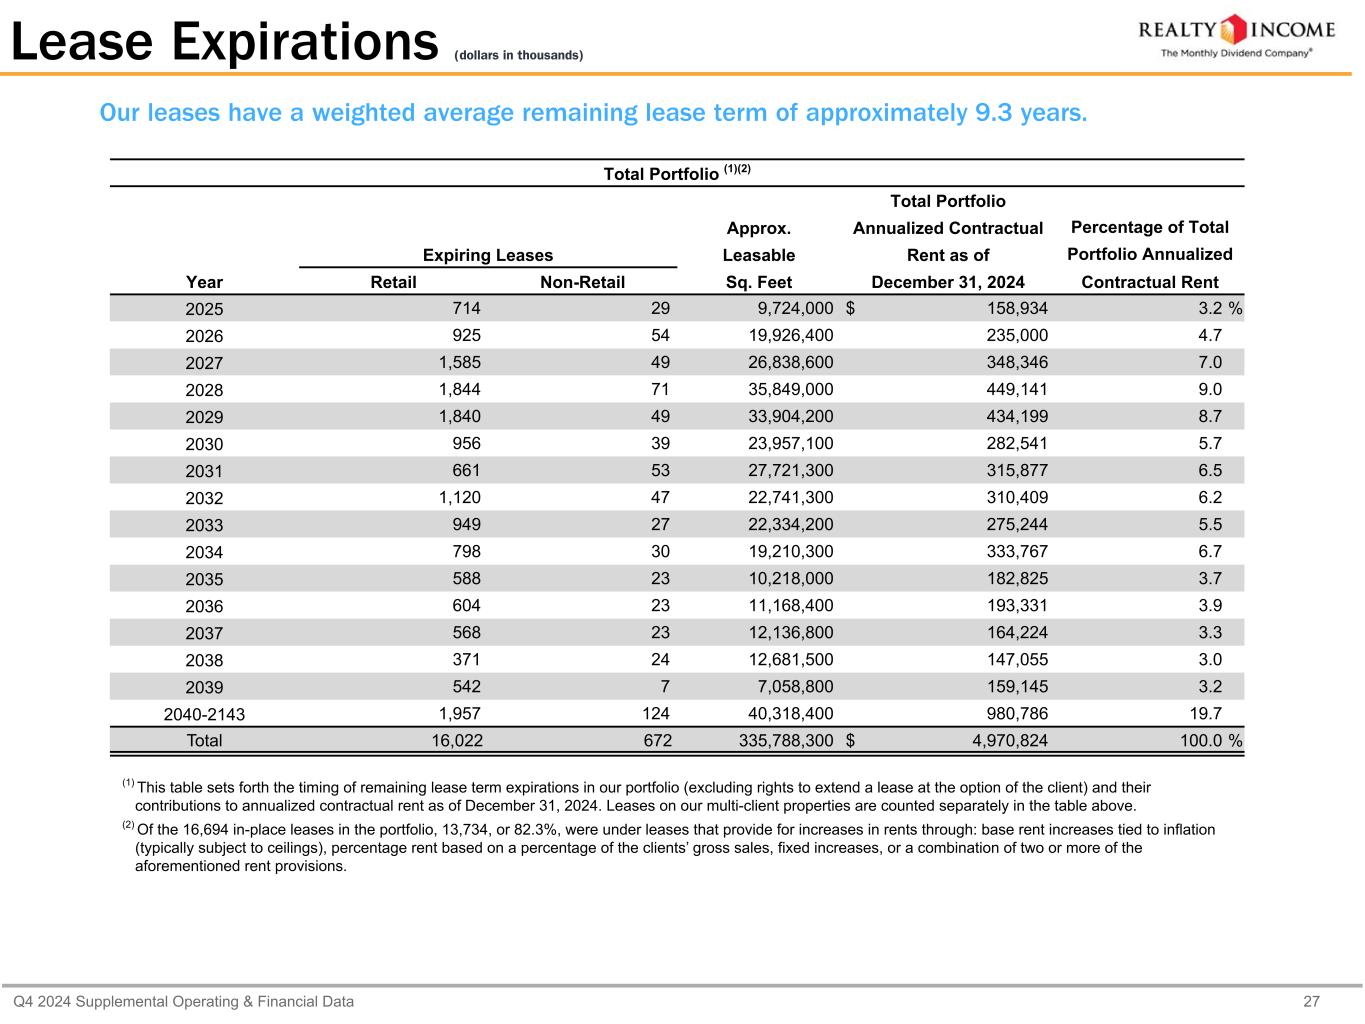
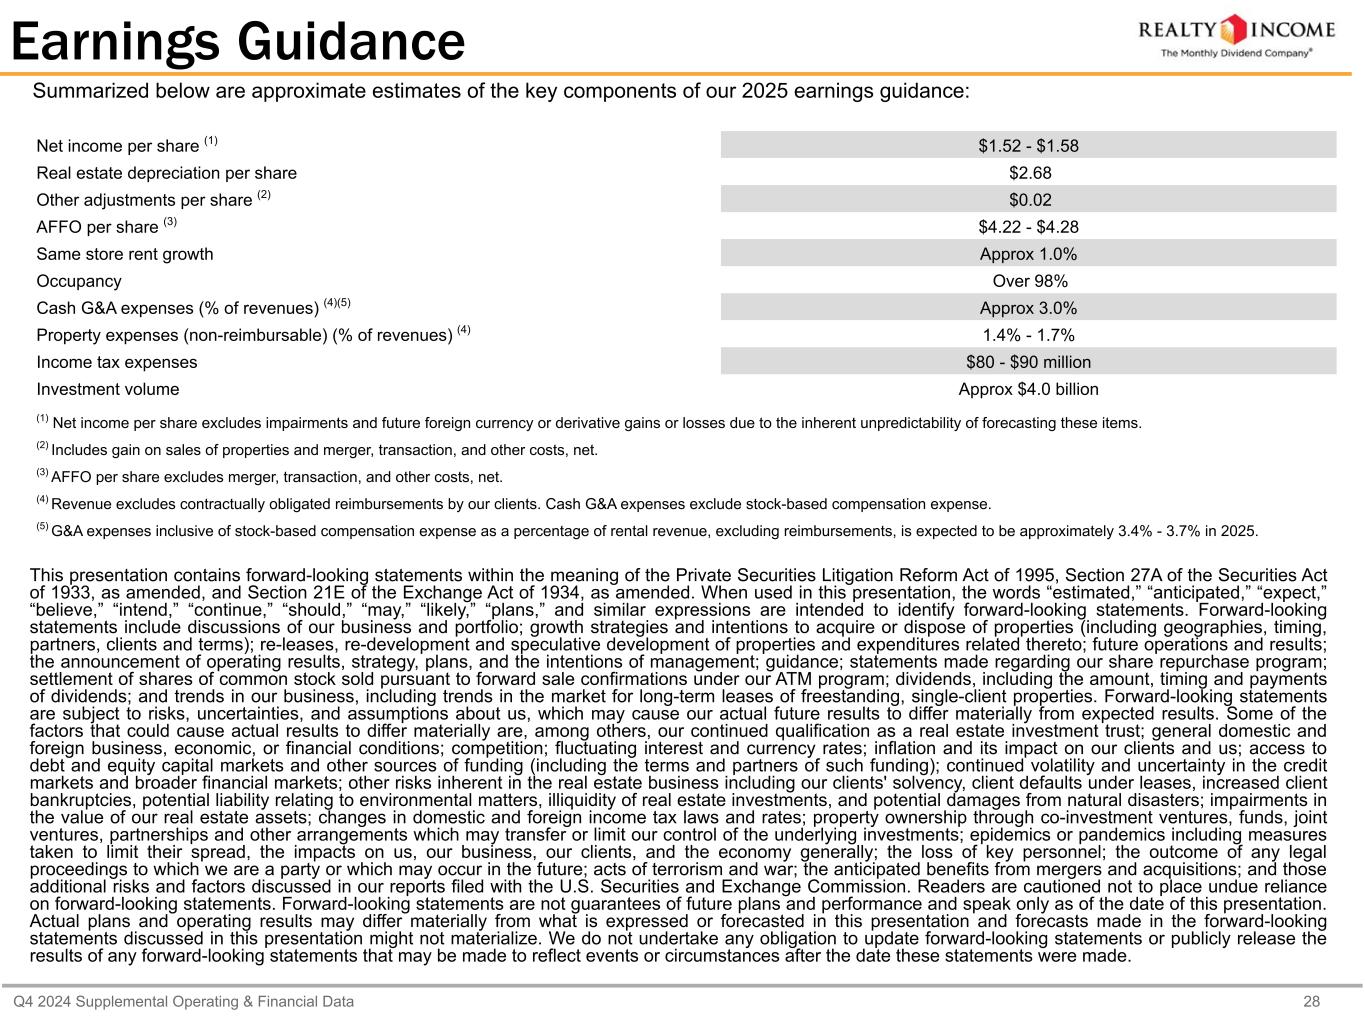
Welcome, everyone. In 2024, Realty Income achieved AFFO per share growth of 4.8%, marking our fourteenth consecutive year of growth. This combined with our 5.4% dividend yield for investors resulted in a total operational return of 10.2% for the year. Over our thirty years history as a public company, our annual total operational return has averaged approximately 11%, with no year posting a negative return, as we remain true to our commitment to deliver steady reliable returns to our shareholders. For today's call, we'll move through three key themes that we believe define our ongoing long-term success. First, a proven track record of results and returns. Second, our confidence in continuing to drive growth in our core business over time. And third, the opportunities our platform provides to enter new avenues to generate further value for our shareholders. Moving to our first theme, our proven track record. Our 2024 results are a testament to the platform we have built. One that is able to deliver against a variety of macroeconomic backdrops, underscored by positive AFFO per share increases every year in our thirty-year history as a public company, save one. Throughout the year, we remained disciplined in our capital allocation strategy, investing $3.9 billion at a 7.4% weighted average initial cash yield. We funded these investments with attractively priced capital resulting in a 243 basis points investment spread, exceeding our historical average of 150 basis points. Turning to the details of the fourth quarter. Our differentiated business model and unique competitive advantages continue to support the company's strong results. We delivered fourth quarter AFFO per share of $1.05, representing growth of 4%. In the quarter, we invested $1.7 billion into high-quality opportunities at a 7.1% weighted average initial cash yield, a 7.5% straight-line yield assuming CPI growth of 2%. Within these investments, approximately 57% of the annualized cash income generated was from investment-grade clients. We completed 73 discrete transactions, including six transactions with total considerations over $50 million, with one being over $500 million, which together represented nearly 80% of our investment volume. The range of size of these transactions highlights the unparalleled depth and breadth of our sourcing and acquisition platform. In the US, we invested $1.1 billion at a 6.4% weighted average initial cash yield and weighted average lease term of approximately 14 years. And in Europe, we invested $650 million at an 8.2% weighted average initial cash yield and a weighted average lease term of approximately 7 years. In total, these investments were completed at a spread of 155 basis points over our short-term weighted average cost of capital, supported by approximately $230 million in adjusted funds from operations after dividend payments. Turning to operations, we have built a diversified portfolio of over 15,600 properties with high-quality clients that have proven resilient through various economic cycles and continue to deliver stable returns. This combined with our proven and experienced asset management team saw us deliver another year of great returns. By leveraging the vast amount of proprietary portfolio data we possess, paired with our internal predictive analytic tools, we believe we have strengthened our decision-making and have further enhanced our capabilities as reflected in the fourth quarter results. We ended the quarter with 98.7% portfolio occupancy in line with the prior quarter. Our entry capture rate on 266 lease renewals was 107.4%, generating approximately $52 million in new annualized cash rent. Since 1996, we have successfully resolved over 5,800 expiring leases at a 103% recapture rate. We continue to expand and develop our predictive analytics tool platform, which is an important component in the analysis of acquisitions, and increasingly drive the strategy on dispositions. Through our ongoing capital recycling strategy, we regularly assess our portfolio to identify and optimize growth opportunities. Dispositions, when strategically appropriate, not only enhance the quality of our portfolio but unlock organic sources of capital, allowing us to reinvest in higher quality assets to fuel long-term value growth. To that end, in the fourth quarter, we sold 80 properties for total net proceeds of $138 million, of which $50 million was related to vacant properties. For the full year, we had net proceeds of $589 million from the sale of 294 properties, supporting an increasingly active capital recycling program which we expect to continue in 2025. Moving to our second theme, we remain confident in our ability to continue driving growth in our core business over time. As we look to 2025, we see an attractive pipeline of investment opportunities across a broad scope of property types, industries, and geographies. Based on current investment spreads, and visibility to the deal pipeline, we forecast approximately $4 billion in investment volume for the year. We are well-positioned to increase capital deployment based on transactions we see in the marketplace. For the year, we expect AFFO per share in the range of $4.22 to $4.28, representing 1.4% growth at the midpoint. This outlook incorporates the following assumptions. On the tenant side, our forecast includes a provision for 75 basis points of potential rent loss as well as an impact from the move out of a large office tenant. The majority of these impacts stem from properties acquired through M&A transactions which we underwrote as part of those deals knowing we are well-positioned to maximize real estate value, given our size and scale. These items result in a $0.04 negative effect on AFFO this year, but also represent an opportunity to cycle out of underperforming clients into stronger clients in robust industries. Given favorable market dynamics across retail and industrial real estate, we anticipate strong releasing outcomes with the expectation to recapture rent at a level consistent with our historical leverage. Additionally, in 2024, we recognized $21 million in nonrecurring lease termination fees representing a $0.02 AFFO benefit to 2024 that we do not assume repeats in our current 2025 forecast. And we are within the NetLeaf page. Throughout 2024, we further solidified our position as a trusted real estate partner to the world's leading companies. We strengthened our partnerships through repeat business with long-standing clients and top global names including 7-Eleven, Morrisons, and Carrefour. To that end, in the fourth quarter, we closed a $770 million sale-leaseback transaction with 7-Eleven, which is now our top client at 3.5% of our annualized rent. This transaction showcases our ability to source, underwrite, and close high-quality sale-leasebacks while our size, scale, and relationship-driven approach allow us to absorb large transactions at attractive valuations. This deal marks one of six sale-leaseback transactions with 7-Eleven in our history, a partnership that began almost a decade ago. Another avenue for future growth is our recently announced private capital initiative, an opportunity to further leverage our proven platform to expand our investment opportunities. We look forward to sharing updates on our progress with the fund business as we move through the year. Overall, we believe Realty Income's strategic position, financial discipline, and diversified portfolio continue to provide stability and long-term growth. With that, I would like to turn it over to Jonathan to discuss our financial results in more detail. Thanks, Sumit.
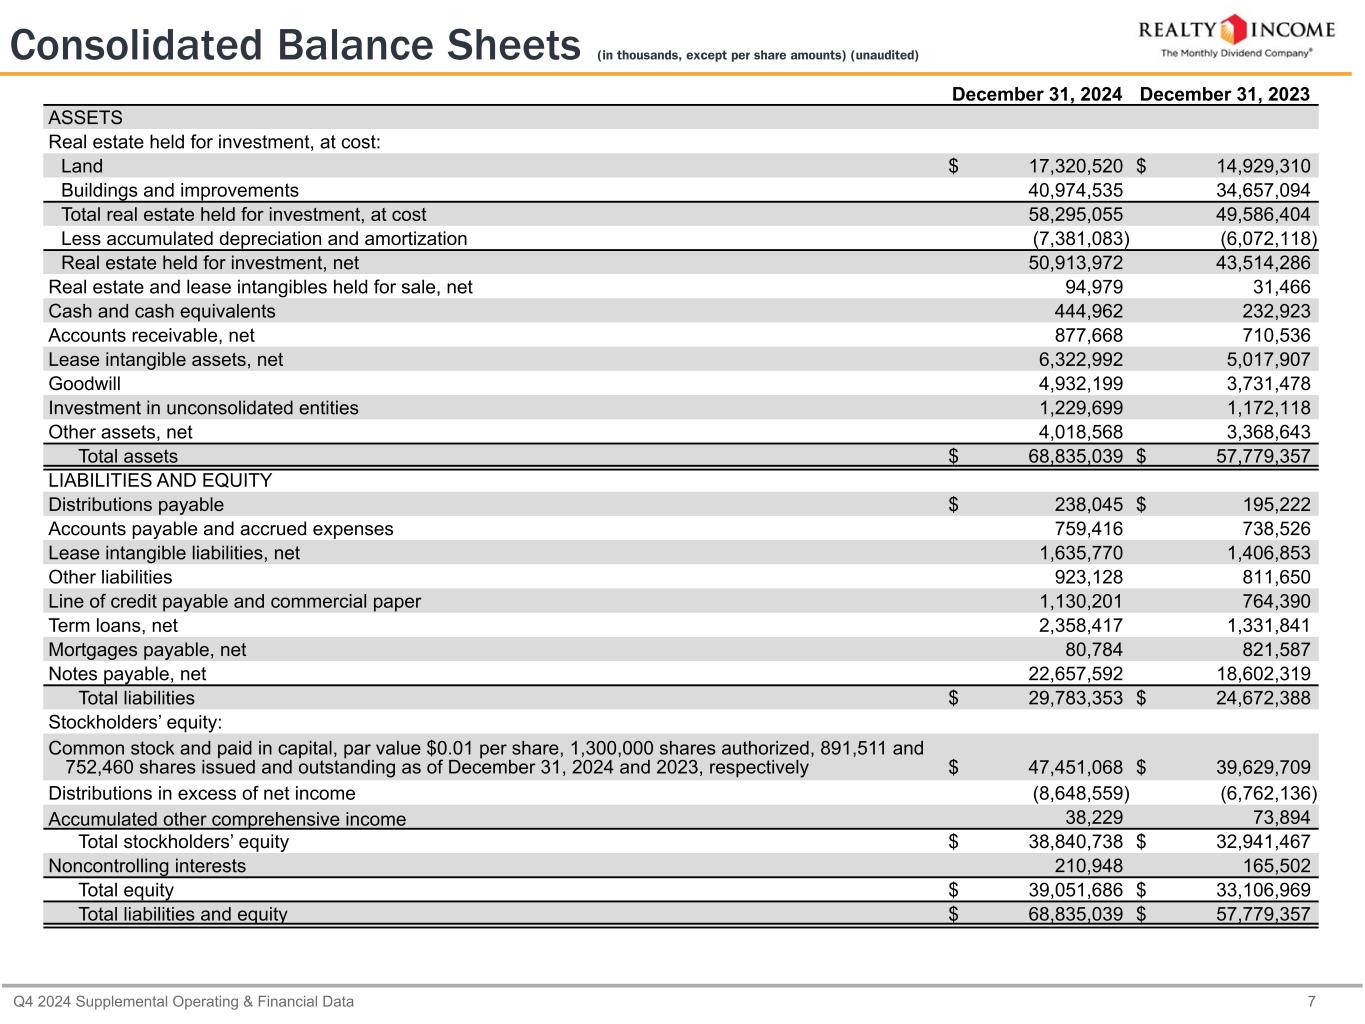
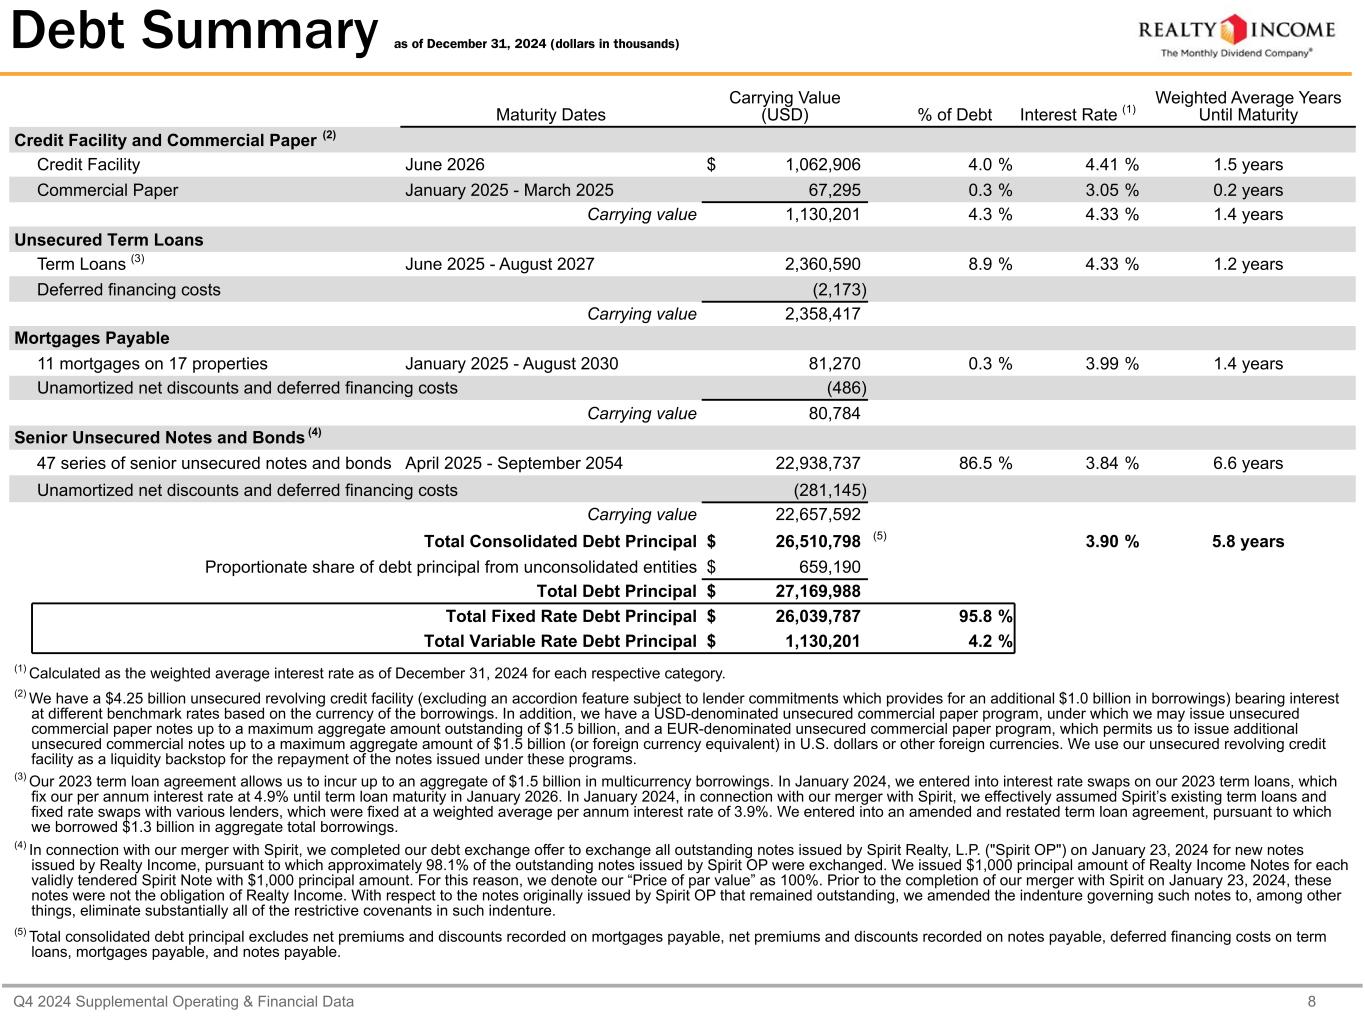
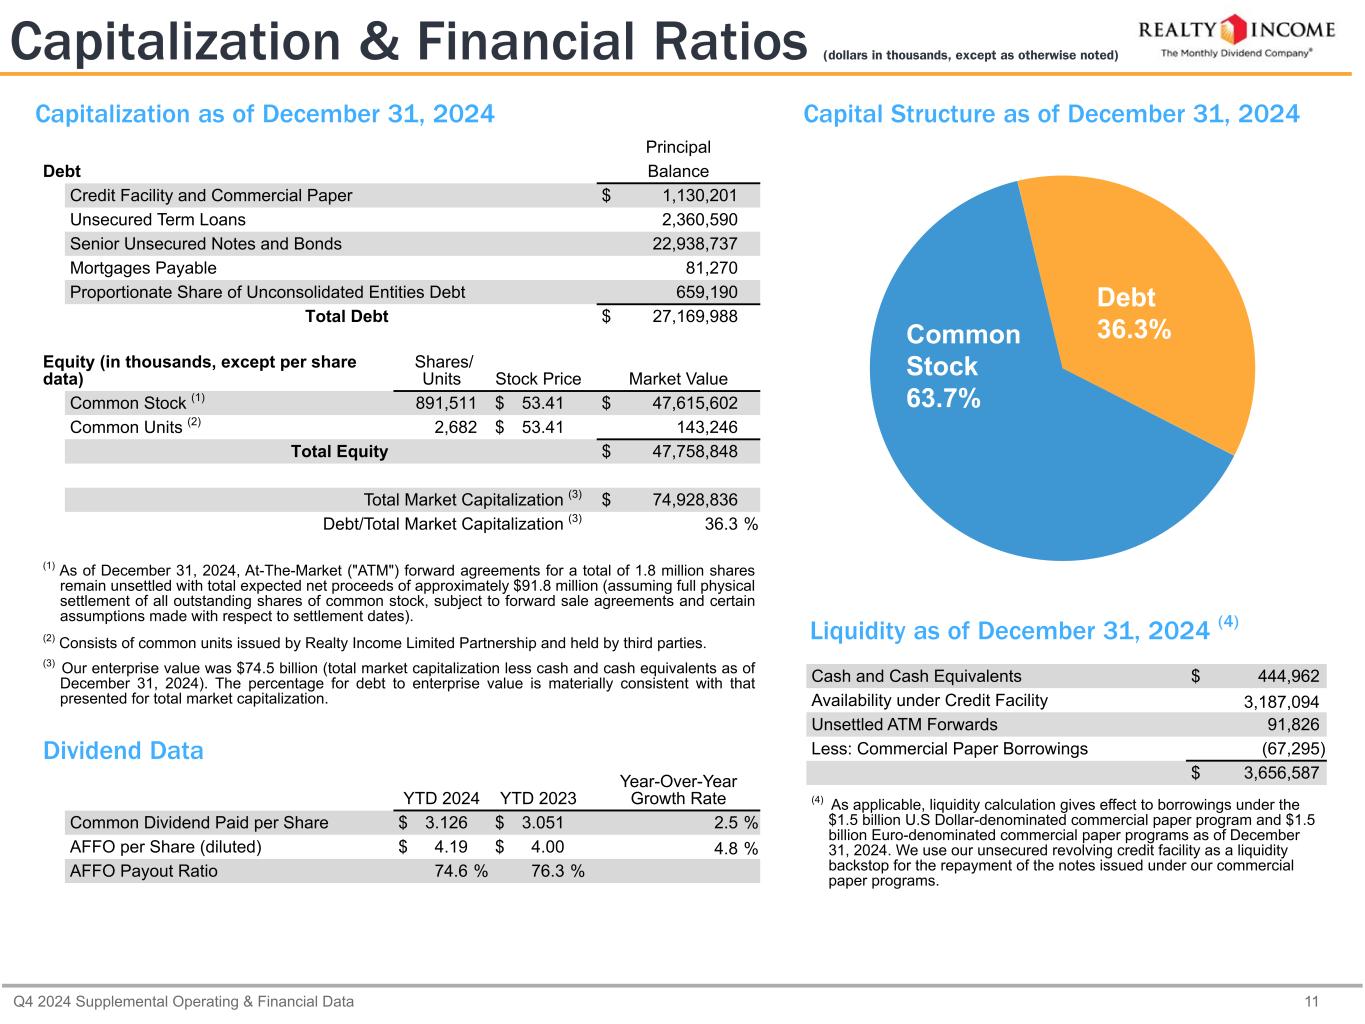
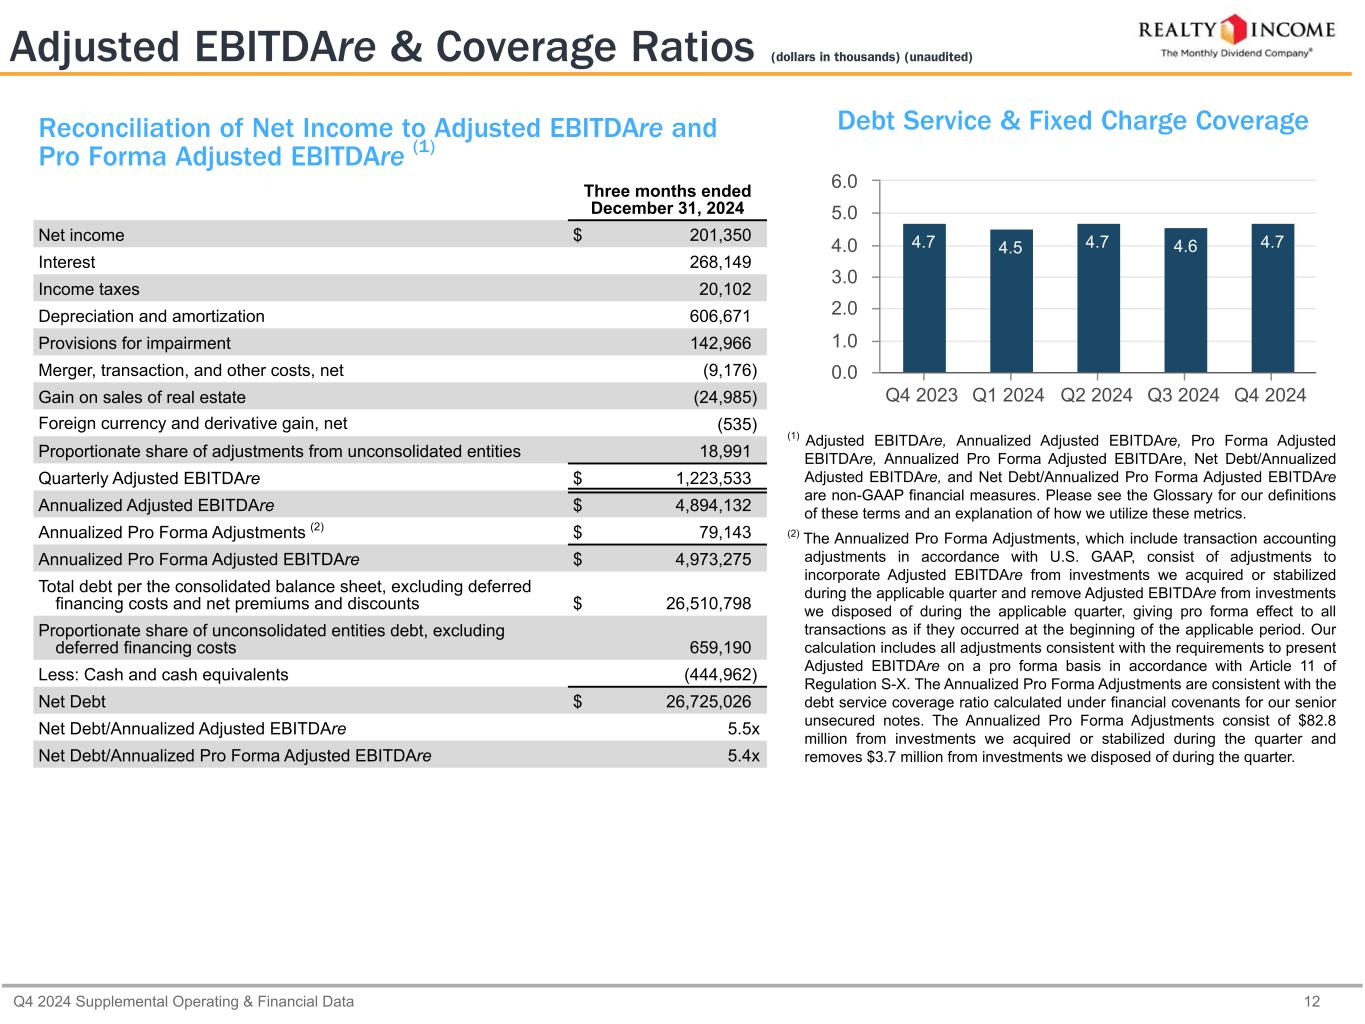
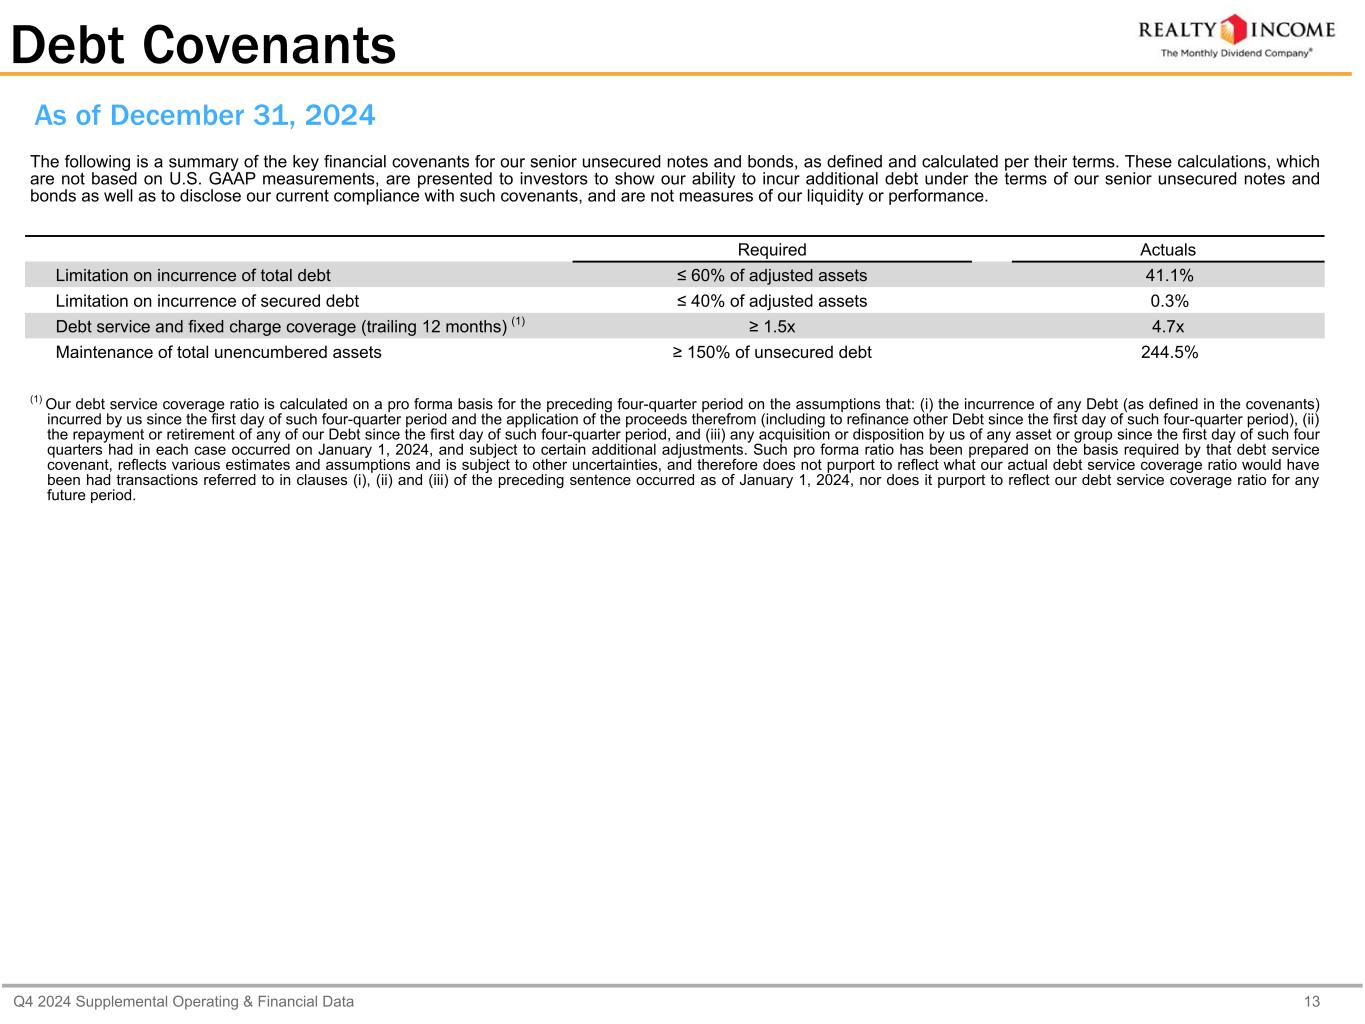
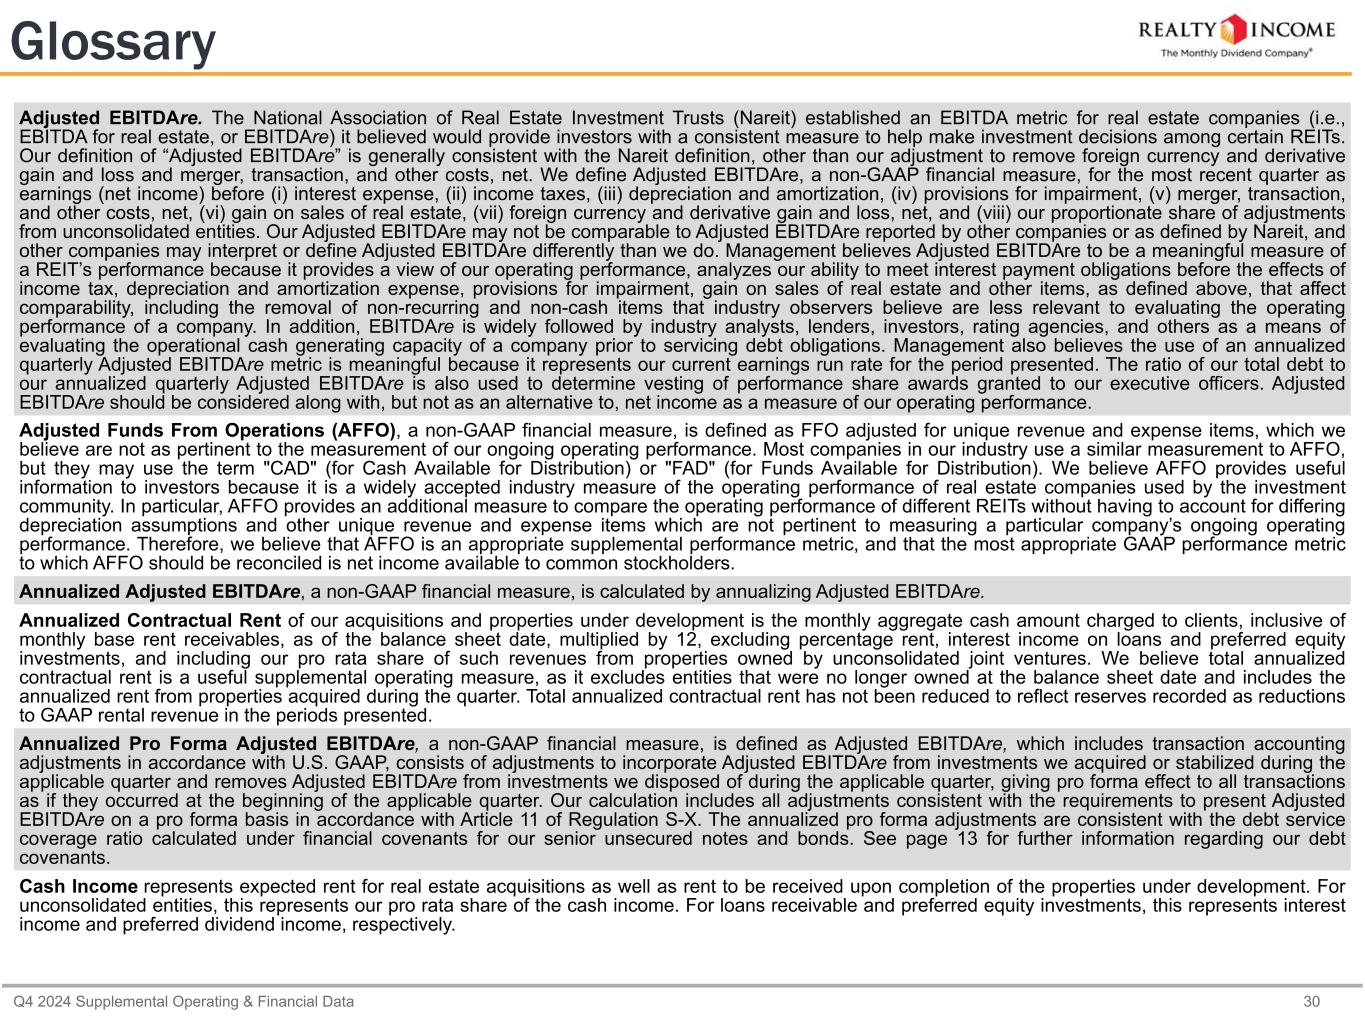
And we remain confident that our unique platform and the investments we are making in the team will continue to generate consistently strong operating results. From a balance sheet standpoint, we are well-positioned to remain active capital allocators with ample liquidity and modest leverage as we finish the year with net debt to annualized pro forma adjusted EBITDA of 5.4 times. Our fixed charge coverage ratio of 4.7 times remains consistent with the 4.5 to 4.7 range delivered in 2023 and 2024. At quarter-end, we held $3.7 billion of liquidity, including $445 million in cash, unsettled forward equity, and unused capacity on our $4.25 billion revolving line of credit. Our exposure to variable rate debt remains limited, representing only 4.2% of our outstanding debt principal at year-end. The consistency of our cash flow and stability of our balance sheet remains a strength of our platform and contributes to our long track record of increases to the monthly dividend. We are proud to remain one of 66 companies in the S&P 500 Dividend Aristocrats Index, for having increased our dividend for thirty consecutive years. Our most recent increase will take effect for the March monthly dividend payment, representing a 1.5% increase of its current monthly dividend and a 4.5% increase over the year-ago period. This is our 129th dividend increase and our 656th consecutive monthly dividend declared since our 1994 listing, and we remain grateful for the long-standing support of our income-oriented shareholders. The scale and depth of our cash flow diversification and the income-oriented nature of our investments result in lower earnings volatility throughout economic cycles and make our platform unique in both the broader real estate industry and the investment market at large. We'd be remiss without also acknowledging the talent, experience, and commitment of almost 500 professionals globally who dedicate themselves to growing and protecting the dividend. In our view, the combination of these features uniquely positions Realty Income to leverage this ecosystem to drive capital partnerships in the years to come. As mentioned in our earnings press release, our board authorized the common stock repurchase program for $2 billion in value. To be clear, we intend for any stock repurchase activity to be leverage neutral as we intend to utilize proceeds from asset dispositions or free cash flow to fund any activity on the program. While we remain confident in our ability to source, underwrite, and close on high-quality investment opportunities at accretive spreads or cost of capital, it seems appropriate for us to have this tool available to deploy capital in an agile manner should the opportunity present itself. I'd now like to hand back to Sumit to complete our prepared remarks.
Thank you, Jonathan. In closing, our 2024 performance highlights a proven track record of results supported by the stability of our portfolio, our talented and experienced team members, and our strong balance sheet. We aspire to be the real estate partner to the world's leading companies. And the relationships we have built over many years continue to add value to our company, as demonstrated during the fourth quarter. Looking forward, our pipeline remains active and the opportunities to partner with operators who are the best at what they do are encouraging, a testament to the value our company offers. I would now like to open the call for questions. Operator?
Operator
Thank you. We will now begin the question and answer session. At this time, we will pause momentarily to assemble our roster.
Speaker 4
And today's first question comes from Fereal Grenad with BOA. Please go ahead.
Hi. Thank you so much for taking my question. I first want to ask about your cap rates and expectations going forward and your current line of sight, how are you seeing cap rates trend? And how does that apply to your cost of capital today? Good question, Fereal. I would assume that based on the pipeline that we currently have, that the cap rates are going to be right around where we averaged in 2024.
Speaker 4
Okay. Thank you. And also in terms of capital recycling, I'm curious how you're thinking about that. I know end of 2024, you were able to give a little guidance. How much of capital recycling would you see funding your acquisitions going forward? Or if you have any other color to share.
Yeah. It's a little early in the year to give complete guidance and visibility on that front, but you can assume for modeling purposes.
Speaker 5
And our next question today comes from John Kilichowski with Wells Fargo. Please go ahead. Thank you. Good afternoon. Maybe if we could start on the share repurchase program. I'm curious. What's the threshold for you where those shares or, you know, where your equity becomes a little more attractive than other options for your, you know, your capital. And are any repurchases contemplated in guide?
So, John, you know, this is a function of what we are seeing in the market today. If you look at what's happened in the last four months since the Fed started the reduction in rates, in October, we got to our fifty-two-week high at almost $65. Literally within three months, we were down to $51. And with that backdrop where, you know, the fundamentals of our business is not necessarily this is a tool that we feel like we should have. I just want to be super clear that we will only use our free cash flow from operations and disposition proceeds to do buybacks on a leverage-neutral basis. And it is an option that we believe we needed to have for the next three years, which is what our board has sanctioned. In the event we continue to see this level of volatility in the market. At the end of the day, we are investors. And if the best economic decision is to buy the stock back given the volatility that we are experiencing, then that is one that we will choose to do. But the expectation and hope is that we don't have to lean on this tool. But it's one that we felt like we needed to have available to us.
Speaker 5
Got it. And then maybe if I could just jump to the health of the overall portfolio here looking at the guide. The non-reimbursable expense is picking up a little bit from last year and, you know, your provision for bad debt at seventy-five bps I want to say last year, you were closer to the thirty bp range. I'm curious if these numbers are more a function of conservatism on your part for starting the year or if you're seeing something in the market from your tenants that's making you want to be a little more cautious just as far as tenant credit is concerned.
Hey, John. For your first question, the guidance that we do have is 1.4 to 1.7% for unreimbursed property expenses. That is closer to a new run rate, albeit we do have some assumption there for carry costs associated with vacant properties. And so, you know, we obviously hope to outperform that. We did come towards the lower end of that range for 2024. But I think on the high end, closer to the 1.7, it's really just the unknown associated with how quickly we can offload some of the vacancies. Now as it relates to the bad debt expense, for 2024, we did finish close to fifty basis points in terms of bad debt expense as a percentage of revenue. So the seventy-five is a bit of an uptick. You know, as Sumit mentioned in prepared remarks, there aren't really any surprises. There's a handful of three tenants that comprise the majority of that. And these are primarily tenants that we underwrote as part of prior M&A transactions. So a little bit of conservatism. I think it's just, you know, to get these properties back and in many of these cases, we expect to do quite well on their recapture. There could be some short-term disruption, but I think overall, you know, nothing to be overly concerned about from our perspective.
Operator
Thank you. Our next question comes from Greg McGinniss with Scotiabank. Please go ahead.
Speaker 6
Hey, good afternoon. The transaction market, from where you stand today, how are you thinking about kind of the split between US versus Europe versus credit investments for the year?
Yes. It's too early to tell Greg, but clearly, where we saw opportunities last year for the borders was in Europe and the UK. That's where we did the majority of the transactions. That quickly changed when the cost of capital environment and the markets changed. There were more sellers willing to come to market. Our cost of capital had improved, and we were able to transact transactions at a spread that was acceptable to us for the risk we were inheriting. We ended the year about a fifty-fifty split between international and the US. I will tell you that, you know, sitting here today, that split is probably where we'll end up for the year in 2025, but I do want to caveat it by saying it is a little early. And given where we were literally two months ago, it again goes back to the kind of platform that we have, the pipeline that we were able to generate, and how quickly we were able to generate that pipeline is a testament to what we keep talking about in terms of a very differentiated business model vis-a-vis anybody else out there. And that's what gives us the confidence to have come out with a $4 billion, you know, guidance on the acquisition front. It's a combination of the pipeline that we already have, the visibility that we already have. That's why I was able to answer the question around, you know, cap rates where we think we are going to end up for the year in 2025. And credit investments will certainly be a part and parcel of this makeup, but it won't be disproportionate to, you know, what we have achieved in 2024, it'll be in a similar ZIP code. But that's the visibility that we have today.
Speaker 6
Okay. And could you just give us some info in terms of your progress on further investments into Continental Europe, which countries you've kind of moved into as you've built out the team in London and Amsterdam, and what kind of excites you about the opportunities there right now?
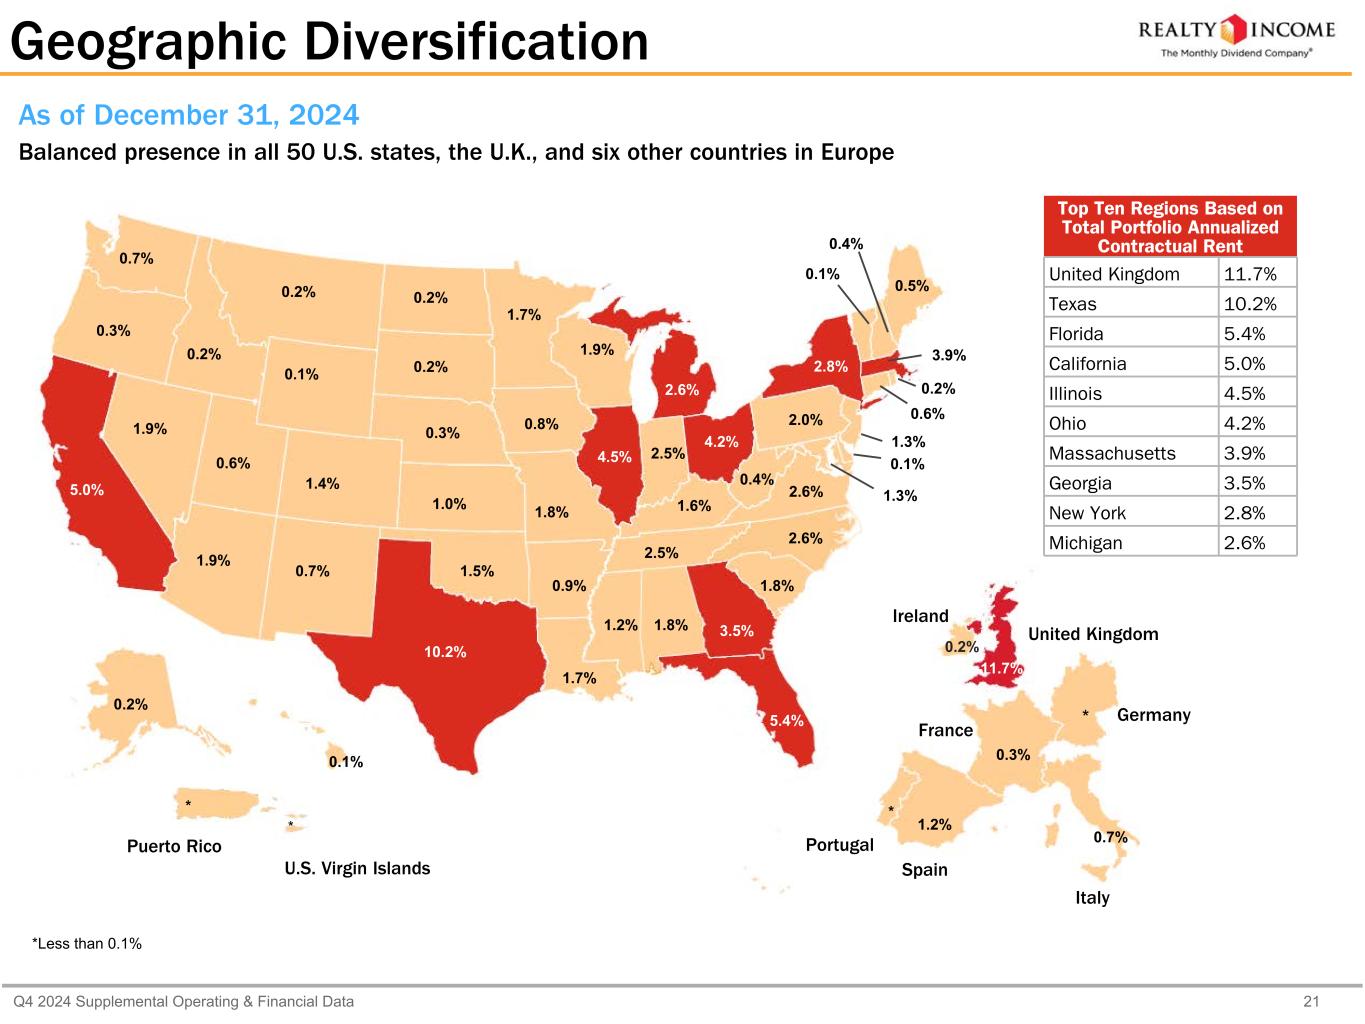
Yeah. That's a great question, Greg. It is this continued establishment of a very mature and is part of the reason why, you know, our G&A load remains right around where it has been for the last year, year and a half. It's because we are continuing to build out the team in both the UK as well as in Amsterdam. And that is what's going to allow us to continue to scale once the permanent team is in place. So in terms of new geography, there are no new that we have entered into that hasn't been fully disclosed. I think Poland was the last one that we had identified as a market that we wanted to go into. But a lot of what where we invested in the fourth quarter, we're the same market that we already entrenched in. The UK was the majority and Spain was the second country that we had a few investments in the fourth quarter. But, you know, it's the same countries that we already established our footprint in. Decathlon obviously allowed us to expand. The geographies that we were in included Germany and Portugal. But outside of that, France, Italy, Spain, UK, Ireland, and Poland. Those are the countries that we are focused on.
Speaker 6
Great. Thank you.
Operator
Thank you. And our next question today comes from Brian Caijolo with Green Street. Please go ahead.
Speaker 7
Good morning. Thanks for taking my question. With announcements during the fourth quarter that other REITs are expanding into the private fund space, does this alter your view on competition in that arena and recognizing that those REITs aren't different property sectors, how do you gauge private capital appetite for net lease assets versus other real estate assets?
Brian, in some ways, this is a reaffirmation of the strategy that we announced. Look, we pride ourselves in being a very transparent company. We try to talk to our investor base prior to doing anything. And that's what we chose to do during the last quarter announcement. Was to signal to the market that this is a natural extension of the business, which is to tap into the private sources. We believe that we have a place in the core plus arena within this space. It's a perfect entry point for private investors to get into and really leverage a platform that we bring of circa five hundred people that has been maturing over the last fifty-five years. Along with, you know, tools that we've developed. I believe that we have a place. And look, we've just launched our marketing process. The data room is open. We are super excited about this particular area of the business. And the fact that other, you know, operators, very successful operators who are choosing to come into this space is really an affirmation of the strategy that we have laid out. So we feel good. We'll get our share of capital. We'll keep you abreast like we always do of how we are progressing. But we feel like this is such a massive place in terms of just the quantum of capital available that for us to not move into that area, would not allow us to continue to execute some of what we've talked about, which is, you know, diversifying our sources of equity capital. And so far so good.
Speaker 7
That's it for me. Thanks for the color.
Operator
Thank you. And our next question today comes from Ronald Kamdem with Morgan Stanley. Please go ahead.
Speaker 8
Hey, just two quick ones for me. Just going back to the pipeline, just wondering if there's any sort of larger sort of deals in there, or is it all pretty granular maybe if you can comment on sort of the data centers and the gaming verticals and what the activity is looking like there.
Great question, Ronald. So look. In the pipeline that we currently have, we don't have a very large transaction, and we define a very large transaction of, you know, $500 million and above. These are, you know, run-of-the-mill, right down the fairway type, you know, opportunities and we are very happy to have built a pretty robust pipeline. In terms of the asset types, you mentioned gaming and you mentioned data centers. I'll take gaming first. Look, gaming is by its very nature, very episodic. We do have a couple of conversations ongoing. You know, there's obviously a lot of interest in your own backyard, Ron, as you know. We'll see how all of that plays out, but we think that that has a very long fuse attached to it in terms of, you know, getting things over the finish line. The data center space is a very interesting space. It's one that we are very excited about. But at the same time, we are incredibly deliberate about who we want to partner with, what are the leases that we want to be exposed to, which markets are we willing to sign up for, and most importantly, who are the operators slash developers that we want to, you know, create a long-term relationship with. We've all seen news of, you know, Microsoft and some other very large hyperscale that's coming out saying they're going to walk away from certain developments, etcetera. Those are the types of things that just continue to make us very diligent in terms of, you know, who we want to ultimately work with. And the discussions that we are having and the ones that we are deciding to forward are the ones that, you know, we feel very confident about in terms of their competency, in terms of their track record. And not borrowed track records, but their actual track record as an institute and their ability to deliver product. Those have become very important in our underwriting process. And at the end of it all, it's the physical real estate, where is it located, you know, who is it being developed for? What is the kind of leases? Because no two leases in the data center space are the same. And obviously, we've learned that through multiple discussions that we've had. So we believe that, you know, cloud services, AI, will continue to drive a lot of the demand for data centers. But we have to be hyper-selective in terms of which ones do we want to invest in and with whom. So that's my thinking on the data center space.
Speaker 8
Really helpful. And then my second one is just on the bad debt guidance of seventy-five basis points. Was there a write-down in the quarter on straight-line rents just as an aside? But the question is really this year just sort of a unique outsized year or is that and should we be expecting that to sort of normalize as you roll the calendar? Or is it sort of a longer bit of a longer tail as sort of the portfolio that you acquired continues to roll through. Thanks.
Hey, Ron. On your first question, you're right. For the fourth quarter, there was a straight-line rent write-down. It was primarily associated with the three tenants. So it was about an $8 million or so impact. And so that is one reason why the straight line was a little bit lower than our run rate in Q4. As it relates to the go-forward trajectory of that expense load. I think as we get closer towards the midpoint and end of the year, we'll obviously narrow the range a bit. Right now, it's late February and, you know, given that a lot of these potential reserves are concentrated in three tenants that represent about three cents per share potential reserve. You know, we are just having a wide range of outcomes for those. But certainly, as we get more information, I think, you know, we would expect to hopefully bring that down and narrow our conservatism on that.
Operator
Thank you. Our next question comes from Smedes Rose at Citi. Please go ahead.
Speaker 9
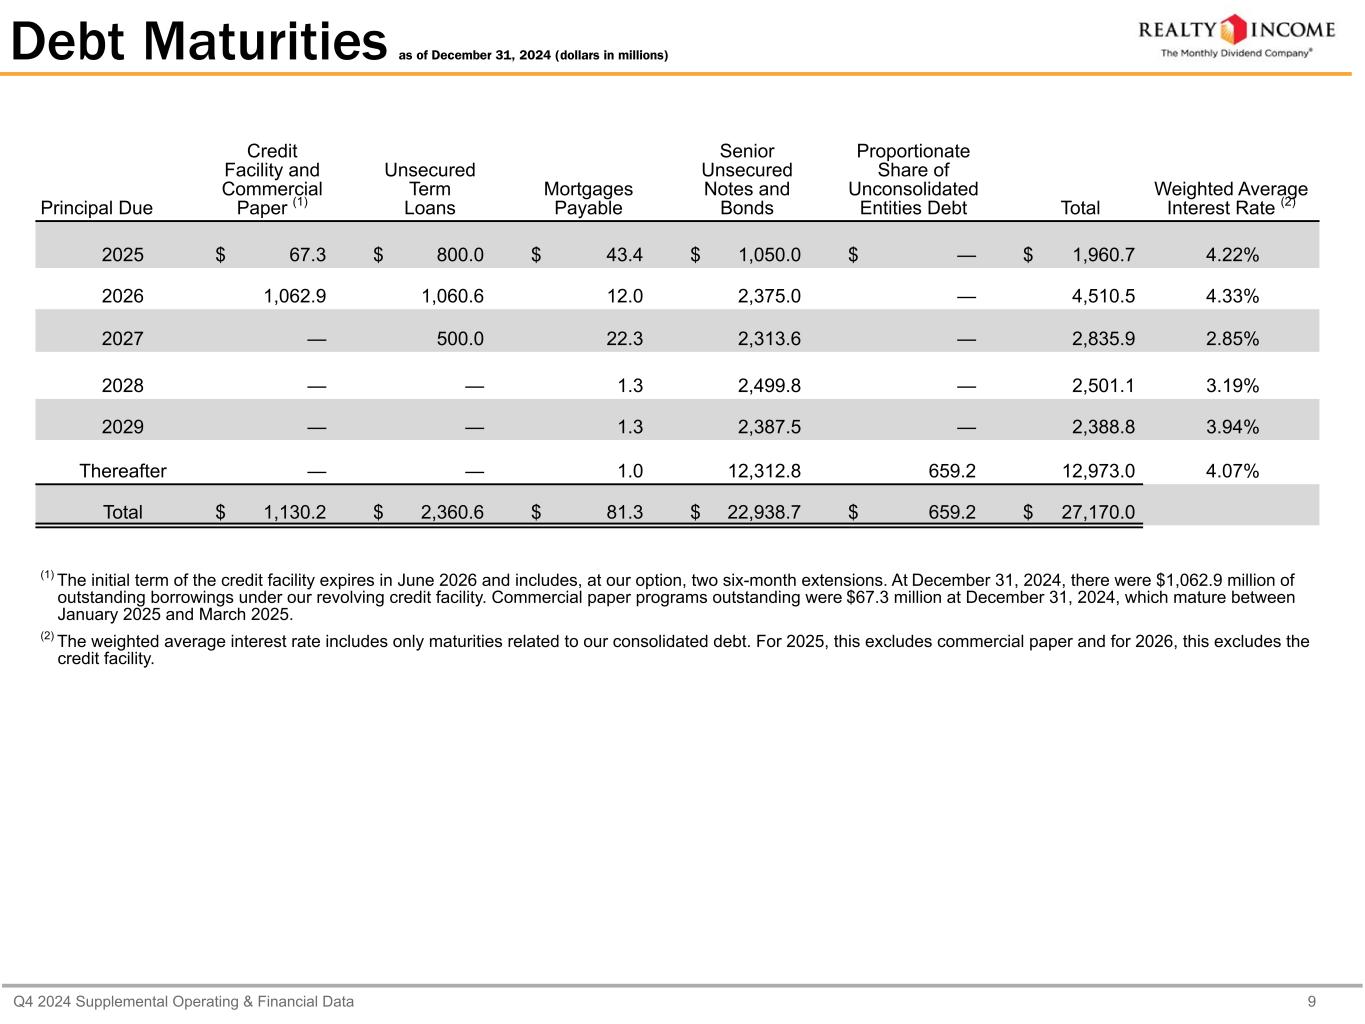
Hey, good afternoon. This is Maddie Fargis on for Smedes. Just on the debt side, it looks like you have just under $2 billion of debt maturing in 2025. Can you talk a little bit about your plan to address securities? And then maybe looking ahead, do your debt coming due over the next couple of years as well?
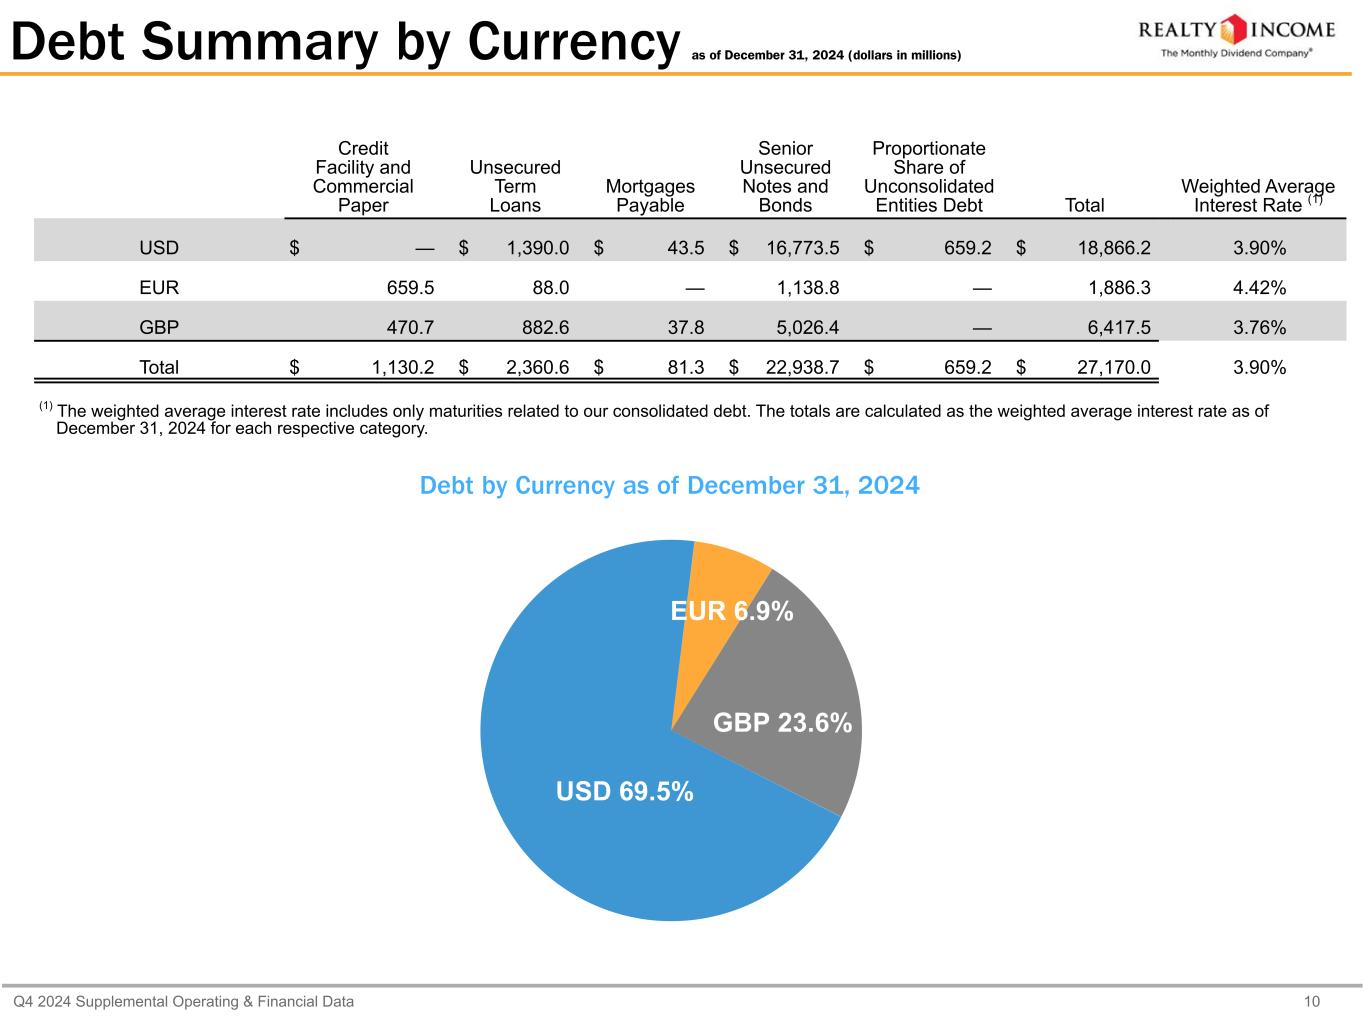
Hey, Matty. You know, we have intentionally staggered our maturities in any given year. That's been very much an intentional process. I think when you look at this year, the $1.9 billion are still coming due, you know, at 4.2%, give or take. Right now, if we were to go out at our US dollar, of financing this is all on a ten-year unsecured basis, you're probably looking around 5.3. In Sterling, it's probably 5.6, and then in euros, perhaps 3.8. So a lot of it is going to depend on the currency in which we refi, but you know, you assume it's dollar pricing and dollar debt, you know, maybe a hundred basis point or so. Headwind. Okay. And, you know, assuming half your convention because maturity date is around the midpoint of the year on average. Perhaps that's a penny of dilution for 2025. Think as we go forward, you know, we've been through many cycles. We've seen a lot of different interest rate environments. We've seen it be a headwind in recent years. We've seen it absolutely be a tailwind a decade before that. And I think having that staggered maturity schedule and having the options, frankly, to tap into three different currencies gives us the flexibility, the optionality, and the ability to be patient to wait for that right bite. So that's how we're going to continue to manage our maturity risk, we also have, of course, a $4.25 billion revolver. That allows us, again, you know, to have ample sources of liquidity so that we don't feel pressure to go out and do a deal on a certain day, week, or quarter.
Speaker 9
Great. Thank you. And then just circling back on guidance quickly. Your guidance range for the income tax expense it looks like it comes in higher than full year 2024. Can you talk a little bit about what's maybe driving that increase some puts and takes there?
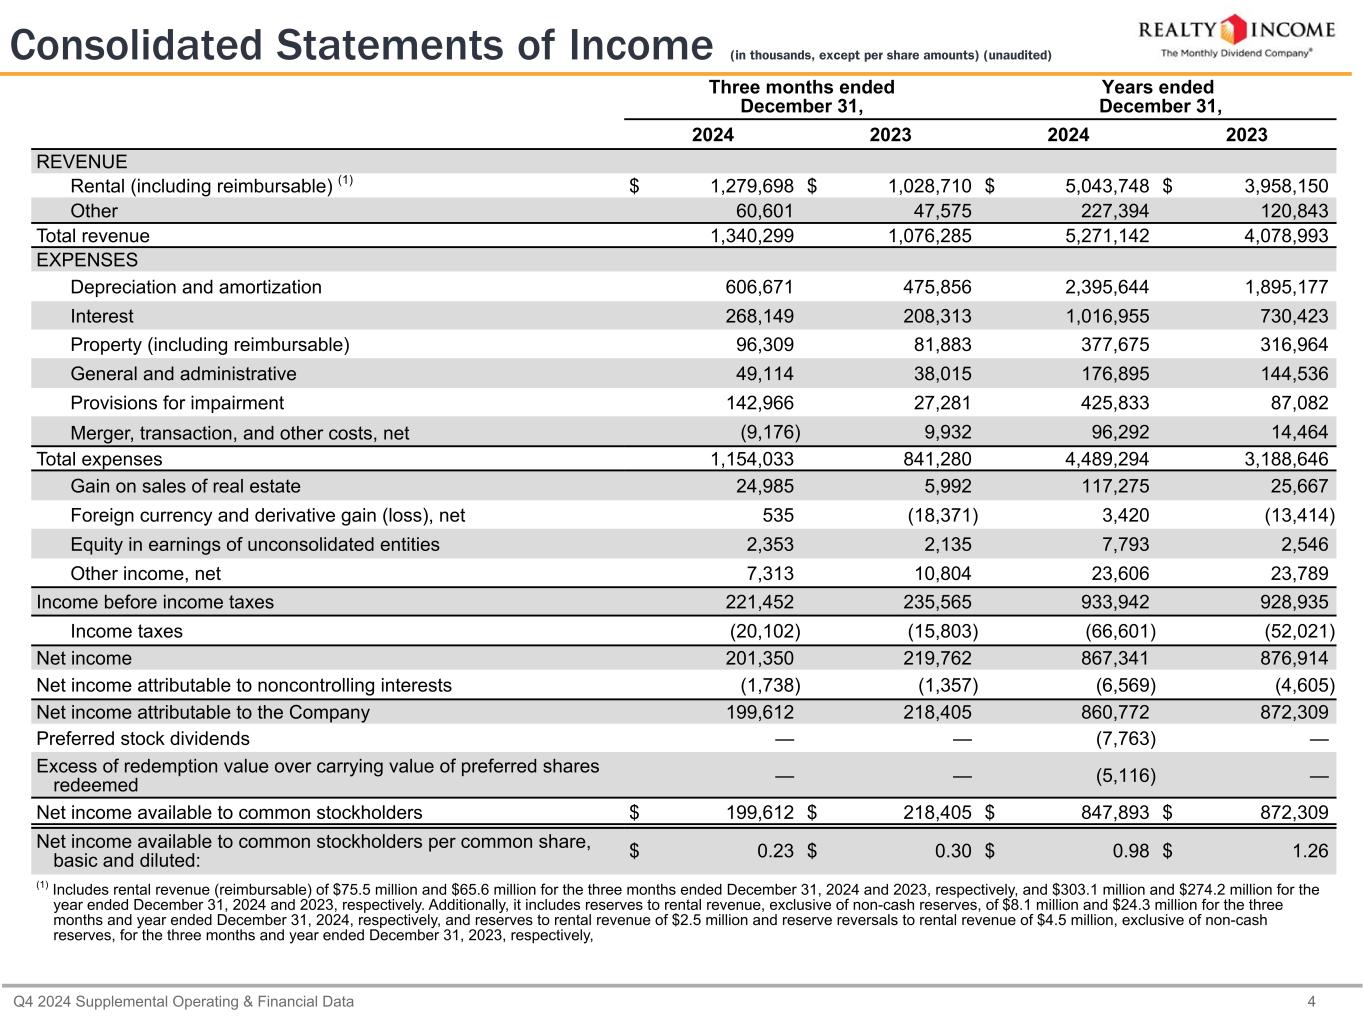
Sure. So, you know, we've had an active year on the European side. Particularly in the UK. In the UK, you know, we do we are subject to a statutory tax rate. That you know, we've minimized down into around 10, 11% of NOI at this point. And you know, as we built up that European platform and you know, buy properties in the UK, you are gonna start seeing that run rate and income taxes creep up. So we did $66 million income taxes in 2024. And that's really translating kind of that 80 to 90 run rate. And if you look at the Q4, income tax number, you know, that essentially shows what that new quarterly run rate will be. Would emphasize that for every transaction that we bring to investment committee, we are always capturing the impact of income taxes in our underwriting. Both on a short-term basis as well as from a long-term underwritten IRR basis.
Speaker 9
Great. Thank you.
Operator
Thank you. And our next question comes from Brad Heffern with RBC Capital Markets. Please go ahead.
Speaker 10
Hey, Rick. Thanks. Sumit, you mentioned in the prepared comments the sale-leaseback was 7.11 in the quarter. I'm assuming that was a relatively low cap rate. So I'm just curious if you could talk about the trade-off there between quality initial spread and those assets potentially fit in better with the private capital vehicle?
There's a lot in what you just asked Brad. So I'll try to go through each one. I'm not gonna specifically talk about 7-Eleven's cap rate. But as you know, the entire US transaction that we did, which was about, north of a billion dollars, was at a 6.4 cap rate. And clearly, that dominated, you know, what we did that quarter. And the other point I'm gonna make is we feel very confident that we were able to get this particular portfolio at at least a hundred basis points discount to where these assets trade. If you look at just even in 2024, and you look at the number of assets that 7-Eleven assets, that have a fourteen-year, fifteen-year walt and by the way, you'll get about forty-five transaction hits there. You will see what the average cap rate is. It's in the very low five. And obviously, they range from, you know, the high fours to probably the mid-five. That's the range of where these assets trade. And so look, this is our sixth sale-leaseback with 7-Eleven. They chose to work with us and it's again a testament to what we stand for. So we are very happy about this particular portfolio. You asked the second question or you implied something about would this have been better suited for the fund business. The answer is yes. I don't know about better suited, but it would certainly be just a fine transaction given the overall return profile that this particular transaction has for the fund business, but we are very comfortable with it being on balance sheet. The point I would make is a slightly different one. We sourced about $43 billion worth of transactions in 2024. We did about $3.9 billion in investments in this year. And our belief is that had we, the fund business, up and running, we could have done two extra. Because there were certain transactions we chose to walk away from which checked almost all the boxes except for the initial spread that we need to be able to do things on balance sheet. That is where why we say that the fund business is complementary. It supplements what we are able to do in the on the public side and can truly take advantage of a platform that we've built which is why we are so excited about being able to, you know, raise capital on the private side, and have that act as a complement to, you know, what we have achieved on the public side. Thanks for asking the question.
Speaker 10
Yes. Thanks for that. And then maybe for Jonathan, on the office move out, you talked about in the prepared comments. First of all, is that the entire $0.04 that you mentioned or was that just a portion of it? And then more broadly, I know it's a small part of the portfolio, but is this the biggest potential surprise in the office portfolio, or is there the potential for more headwinds on that front?
So I wouldn't say it's the $0.04. It was, you know, really concentrated in one asset, but there were a handful. And that impact was more on the one and a half cents range for 2025. As it relates to everything else, you know, keep in mind a lot of the office that we have brought in has come from M&A. We do not see at this junction anything that rises to that level of materiality. We have been tracking this portfolio on this one particular asset for some time, so it didn't come as a surprise. The timing of that happened late in the year, and so the annualized impact that does show up.
Operator
Thank you. Our next question comes from Michael Goldsmith. Yes. Go ahead.
Speaker 11
Hi. This is Catherine Graves on for Michael. Thanks for taking my questions. My first, just a couple of specifics on changes to the portfolio this quarter. You already touched on your thoughts about data centers and then the gaming vertical, but I saw your industrial exposure also increased a bit in the quarter. So just wondering if you can provide any color on opportunities that you're seeing in that space going forward and sort of what the appetite is for investigating further in the industrials vertical.
Yeah. Industrial continues to be a focus for the team, and we will continue to look for opportunities to invest in industrial assets. The truth of the matter is that, you know, they trade at levels that we can't always participate in. So the exposure that we are increasing on the industrial side is largely coming from development, expansions, and projects that we have underway with partners who are developing assets for us. That we are leasing out. And so that's the way we are trying to continue to play on the industrial side. But it should come as no surprise when you do see us being able to participate and buy industrial assets that is certainly a focus of ours. And, you know, our asset management team can attest that that's where a lot of the mark to market on the rents are coming in and they're coming in way above what our current rents are, and we create a lot of value doing that. So that will continue to be part and parcel of our business strategy going forward.
Speaker 11
Got it. Thank you. That's very helpful. And then my second question, given that we could have been in this period of elevated bankruptcies in the US, I'm just wondering if there are any consumer or retail trends that you're particularly paying attention to as you monitor your portfolio as you sort of navigate this period of elevated tenant credit issues. So just wondering your thoughts about that.
Yeah. That's a great question. Obviously, there are a lot of things going on. The macro backdrop is not very conducive for especially retailers who have a stretched balance sheet, etcetera. And so we're keeping a very close eye on that. To further exacerbate that situation, we have an uncertainty around, you know, what are the tariffs going to look like? How is that going to impact certain businesses? And, obviously, depending on the type of retail business you have, tariffs can be a big impact or a not so big impact. You know, on the area of media, you know, where you have a lot of consumer goods like televisions, stereos, etcetera. Sixty percent of that tends to come from China. And so if there is a tariff, you know, those retailers that are exposed to that if they are unable to pass through the higher cost, you know, they better have a good balance sheet. Otherwise, it's gonna be difficult for them to absorb that. And so that's the general trend, and I'm just picking on a very, you know, consumer electronics is a very specific example. But you can extrapolate that across all these other sectors. You know, apparel is a big one. You know, China actually exports thirty-four percent of the apparel to the world. Thankfully, in the US, it's only twenty-two, twenty-three percent. So it's not gonna be quite as acute. But those that are disproportionately, you know, exposed to that peak are ones that we are keeping a closer eye on. And those are much more of a thematic element. It's not specific to our portfolio. That we, you know, that we are focused on. The downstream impact of all of this uncertainty is certainly, you know, leads us to be a lot more cautious. That's the reason for our conservatism, if you will, on, you know, being overly aggressive in a year that is clouded with uncertainty.
Speaker 11
Very helpful. Thank you for the time.
Operator
And the next question today comes from Jay Kornreich with Wedbush. Please go ahead.
Speaker 12
Hey, thanks much. Good afternoon. Just starting with going back to the private capital fund, as you've had several additional months to assess how it would take form after initially announcing it, are there any updates you can provide us to the initial size you foresee for it and when you anticipate beginning?
Jay, too early to tell. We literally opened the data room last week. We've had a few initial meetings. So far, so good. Like I said, as we progress, we keep you up to speed on how things are progressing. But too early to tell in terms of target size.
Speaker 12
Okay. Understood. And then just one more. As we think about funding for this year, let's say you have $92 million of unsettled forward equity, $45 million of cash, they're just, you know, with the guidance showing $4 billion of acquisitions intended for, just would be curious to hear a thought on how you plan to on the acquisition pipeline and if you would raise equity at current trading levels.
Yes, Jay. I think when you look at the combination of cash, cash, and the unsettled forwards, and you also keep in mind that we do have around $850 million of annual free cash flow, you do have equity-like sources of capital that, you know, covers us for close to the first $2 billion of buying power. We also have a disposition program where, as you saw last year, $591 million is a significant increase in our run rate. That also becomes a tool for us to recycle capital. And so when you're left with, you know, that residual funding need, if you will, we made certain assumptions into our forecast and our model in terms of what's that weighted average cost of capital is. And the reason why we came out with a $4 billion number, you know, isn't just a random number. It's a number that, you know, we feel confident in being able to achieve at certain cap rates or yields that allow us to do deals on an accretive basis year one. So I think that's one way of saying that, you know, we index into a current cost of capital maybe even a little more conservative than even that. And we know that on the top line, you know, we are targeting deals and seeing a pipeline of deals where we know we can get acceptable spreads.
Speaker 12
They're helpful. Thank you.
Operator
Thank you. And our next question today comes from Ravi Baidu with Mizuho. Please go ahead.
Speaker 13
Hi there. Can you offer some color on tenant credit? Which tenants or categories are currently on your watch list? What are the embedded reserves? And does the seventy-five bit reserve that you mentioned earlier include only known store closures or bankruptcy at this point or any does it include any speculative bankruptcies or short sales? Thank you.
Okay. So I'll take your last question. You know, rent losses this year. The seventy-five bips that we've mentioned definitely has general reserves, you know, areas that we just don't know what could go wrong given some of the commentary I've made around the volatility in the macro environment as well as uncertainty around, you know, where some of the policies are gonna go. I would say that there's a fair amount of generous of in there, and there's a fair amount of conservatism. Even on the identified names that Jonathan went through, in terms of, you know, what we actually think the impact will be with those names. So that's the commentary on the, you know, the bad debt expense. In terms of our credit watch list, our credit watch list is right around 4.8% today. And that is slightly higher than the third quarter, again, reflective of what we've already talked about in terms of the uncertainty, etcetera, etcetera. And we are keeping a close eye on that particular watch list, and we will continue to modify it as we go forward. But that is our current understanding of where credit events could happen. And, again, just because something is on the watch list doesn't event. In fact, one of the names came off our credit watch list last year. In the fourth quarter, and there were a few that were added just based on, you know, what we think could happen on the tariff front and which businesses could get impact. That's how the credit watch list has been created.
Operator
Thank you. And the next question comes from Upal Rana with KeyBanc Capital Markets. Please go ahead.
Speaker 14
Great. Thanks for taking my question. Just on the fourth quarter, you saw the cap rates compress by thirty basis points. Just curious what drove the compression there and what does that tell us about the competition in the transaction market today?
Yeah. Upal, I think, look, the comments I made around coming out of the third quarter into the fourth quarter, the Fed starting to reduce rates. There was an expectation of continued reduction. There was an expectation on where some of the interest rates were going to settle out. That obviously pushed the cost of capital higher, and I think all of that allowed potential sellers to come to market. There was a meeting of the reservation price. Those transactions got done. That certainly had a downward pressure on the overall cap rate, but we are talking about twenty basis points from 7.3, 7.4 to 7.1. At the end of the day, but I think the second point you made about competition, there is more and more competition coming on the private side. And these are incredibly large asset managers who are starting to understand the benefits of net lease investing. And for me, that's just an again, an affirmation of a business model that has this profile of delivering steady growth, very predictable stability, over very long periods of time. And so we welcome the institutionalization of this space and we feel very confident in our ability to continue to leverage a flat. We to lean on relationships that we built on. You know, eighty percent of everything we do is repeat business with repeat clients. That's pretty powerful. You know. And so the fact that all of these clients are coming in, these potential investors are coming into the space is a good thing but we feel like we are very well positioned to take advantage of our fair share.
Speaker 14
Okay. Great. That was helpful. And then I appreciate the items that you highlighted that's impacting AFFO per share in 2025, but curious what needs to happen for you to achieve the high end of your guidance there?
Upal, I think it really comes down to where we end up landing on the reserve side. You know, given that we are expecting seventy-five basis points of rent, and, you know, you can do the math on what that represents. You know, every nine million dollars is a penny. Right, based off of our share count. So it really comes down to that. It also comes down, obviously, to where the ten-year yield is. We know how correlated our stock is. The ten-year one of the most correlated in the S&P. But obviously, getting a little bit of relief on that front should help our spreads. And I think just frankly, stability in the rate market for, you know, our potential clients and sellers to see that, you know, there is a stabilized market. We know where the rates are going. We feel like there's some stability. In our cost of capital, the volume, you know, will come back in at levels that hopefully finds an equilibrium that allows us to outperform in the $4 billion. I would say it's really just of those two factors and also our ability to, you know, rid ourselves of vacant properties that do have significant carry costs because that is one of the drivers of, you know, our guidance of 1.4 to 1.7% on reimbursed property expense margins.
But I think the point that you made about a more stable backdrop, that's a key point for us, you know. Our ability to generate transactions and to source transactions, Upal, is barnard. And if we just have a stable backdrop, and I don't care if the tenure is at a five percent zip code or at a four and a half or a four and a quarter. We just want stability. And once that happens, I think our ability to generate a robust pipeline, we just showed it to you in the last quarter of what we can do with a, you know, backdrop that is a bit more stable. And I think that's what we are hoping for. The rest of it will all play itself out. But in terms of driving growth, is one of the biggest drivers.
Speaker 14
Okay. Great. Thank you.
Operator
And our next question today comes from Jason Wang with Barclays. Please go ahead.
Speaker 15
Thanks for the question. Development spending was down and development yields were up. Year over year in 2024. Just wondering what drove that how much development is included in guidance this year, and what the underwriting assumptions are for new developments?
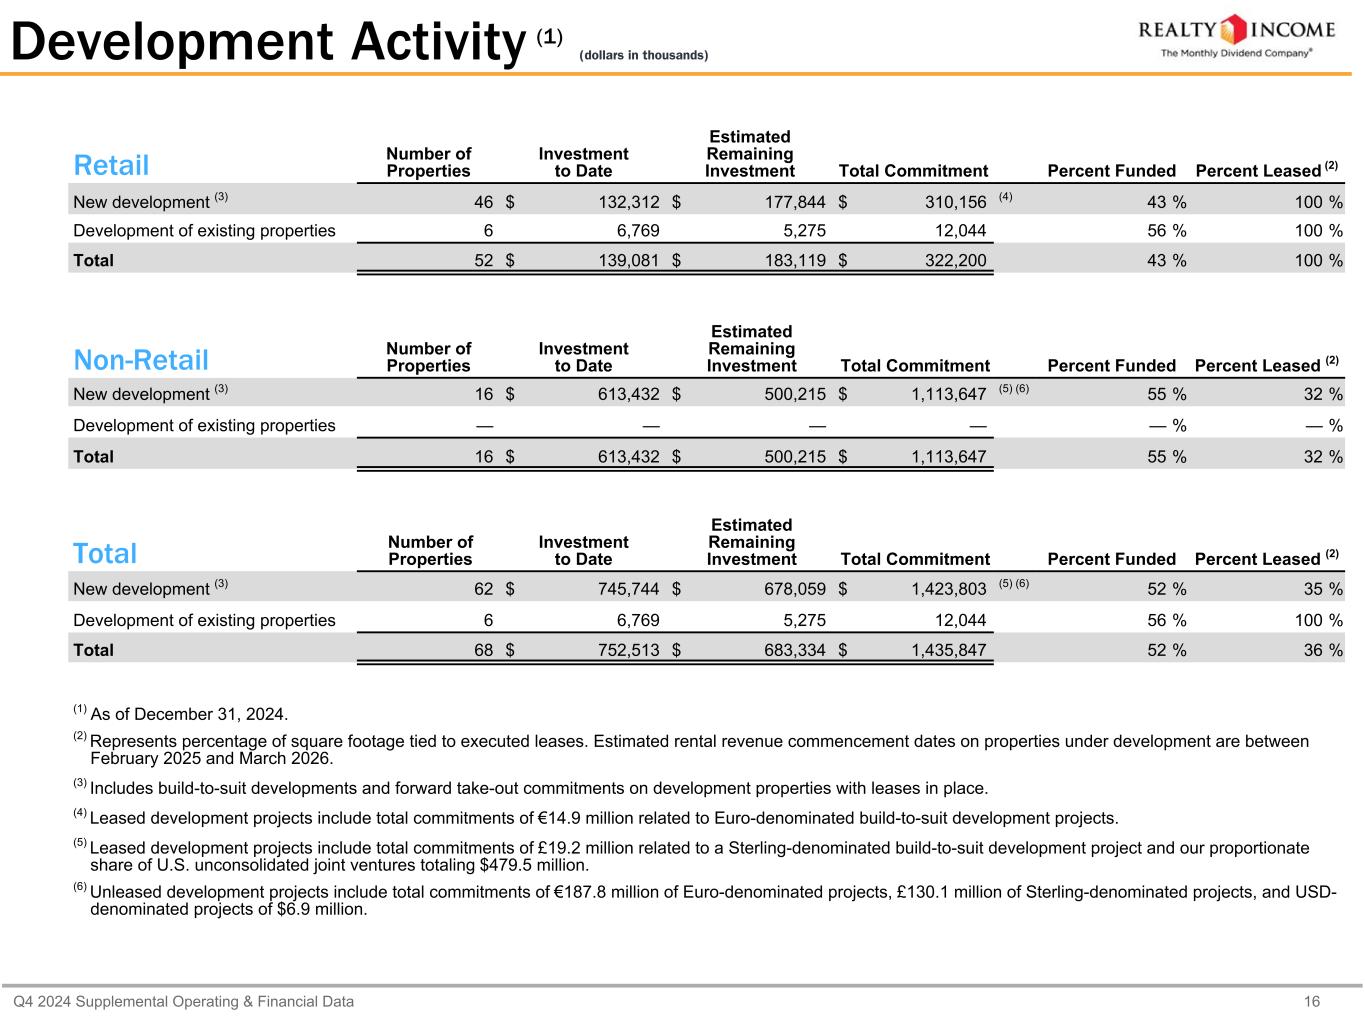
The reason why, you know, investment yields on development keeps going up, it's really a function of the vintage of when these developments were being originated. And as the older vintage developments are getting delivered, that cap rate, that yields on that development should go up. Because it's much more reflective of, you know, what the market is today versus what it was in 2023 or, you know, early 2023. And so I think that's just a function of, you know, resetting all of our development and some of the most of the development that's closing today were generated maybe a year ago where the markets were already telling you that there's gonna be a fair amount of volatility. So that's the reason for the higher yields. In terms of, you know, the pipeline and how much of this development, you know, is is constitute that. It's gonna be similar to what we did in 2024, you know, development, again, these tend to be repeat businesses with clients that we have a very deep relationship with. And they have chosen to do reverse build to suit or build to suit with us primarily because in this environment, they want somebody with stability, etcetera, and that's that's. And so I think the proportion should be similar to 2024 is how I would underwrite a Jason. And you know, and hopefully, the yield question I've addressed it satisfactorily.
Speaker 15
Yeah. That's helpful. Thanks.
Operator
And our next question comes from Alec Feygin with Baird. Please go ahead.
Speaker 16
Hey, guys. Thank you for taking my question. To follow-up on something that was talked about in the 3Q or maybe 2Q call, but have you guys gotten the space back from the C-store tenant? And if you have, what's the current assumption for what happens to that space that's embedded in guidance?
Yes. So, absolutely, we've got our space back. And we are not going to speak to what continues to happen on the legal front, but we essentially have most of the space back, if not all of the space back. And we are in the midst of and we were already in parallel having discussions with other very established C-store operators, and we are in the midst of getting that over the finish line.
Speaker 16
Got it. Thank you. That's all for me.
Operator
And our next question comes from Teo Okusanya with Deutsche Bank. Please go ahead.
Speaker 17
Yes. Good morning out there. In regards to the tenant watch list and tenant credit in general, could you talk a little bit about how you're looking at that? From the US, the rest of Europe perspective. And then it says Europe constitute any unit or part of that anyway?
That's a great question, Teo. Obviously, you know, given the vintage in Europe, there is a lot less contribution from Europe on the watch list. Having said that, there were certain assets we intentionally pursued knowing that some of these clients, and I'll give you two examples, Corporate Ride was one and Homebase was another. That we wanted to get back. And we already had parallel discussions with other clients that wanted that particular location. And so as an asset management active asset management strategy, we pursued assets that had those two particular clients as, you know, in those assets. And the resolution has been pretty remarkable. In terms of when we did get those back and our ability to recapture rents well north of the expiring rents or the in-place rent is the strategy behind why we did it. But those are intentional strategies. Outside of that, we, you know, it's very pristine. And we don't have any names from Europe that happen to be on the watch list.
Speaker 17
Gotcha. Thank you.
Operator
Thank you. This concludes our question and answer session. I'd like to turn the conference back over to Sumit Roy for any closing remarks.
Well, thank you for joining us today. And we appreciate all the questions. We look forward to meeting you in the upcoming conferences. Have a great day.
Operator
Thank you. The conference is now concluded, and we thank you all for attending today's presentation. You may now disconnect your lines and have a wonderful day.