Operator
Good day, and thank you for standing by. Welcome to the Prague Holdings Q1 Earnings Conference Call. At this time, all participants are in listen-only mode. At this speaker's presentation, there will be a question and answer session. To ask a question during the session, you will need to press star 11 on your telephone. You will then hear an automated message advising your hand is raised. To withdraw your question, please press star 11 again. Please be advised that today's conference is pre-recorded. I would like to hand the conference over to your first speaker today, John Ball. Vice President of Investor Relations. Please go ahead.
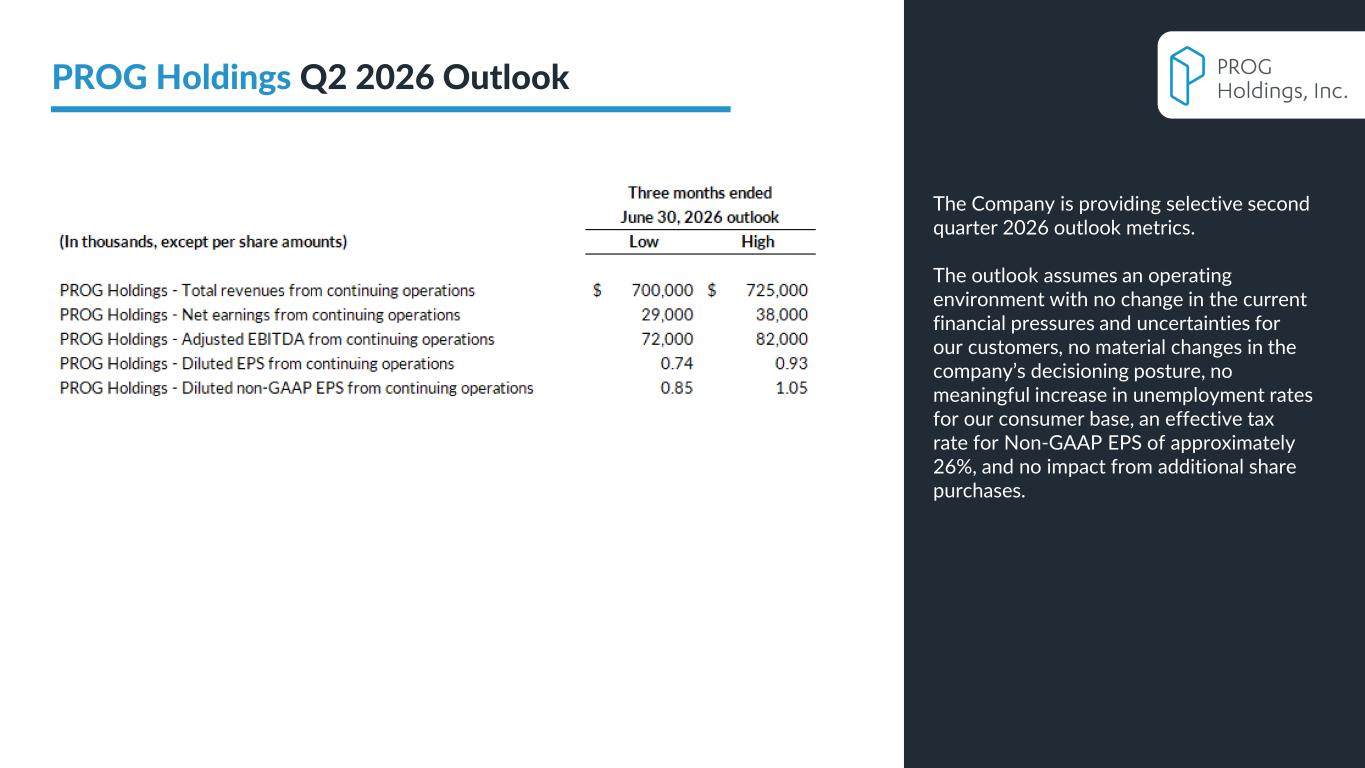
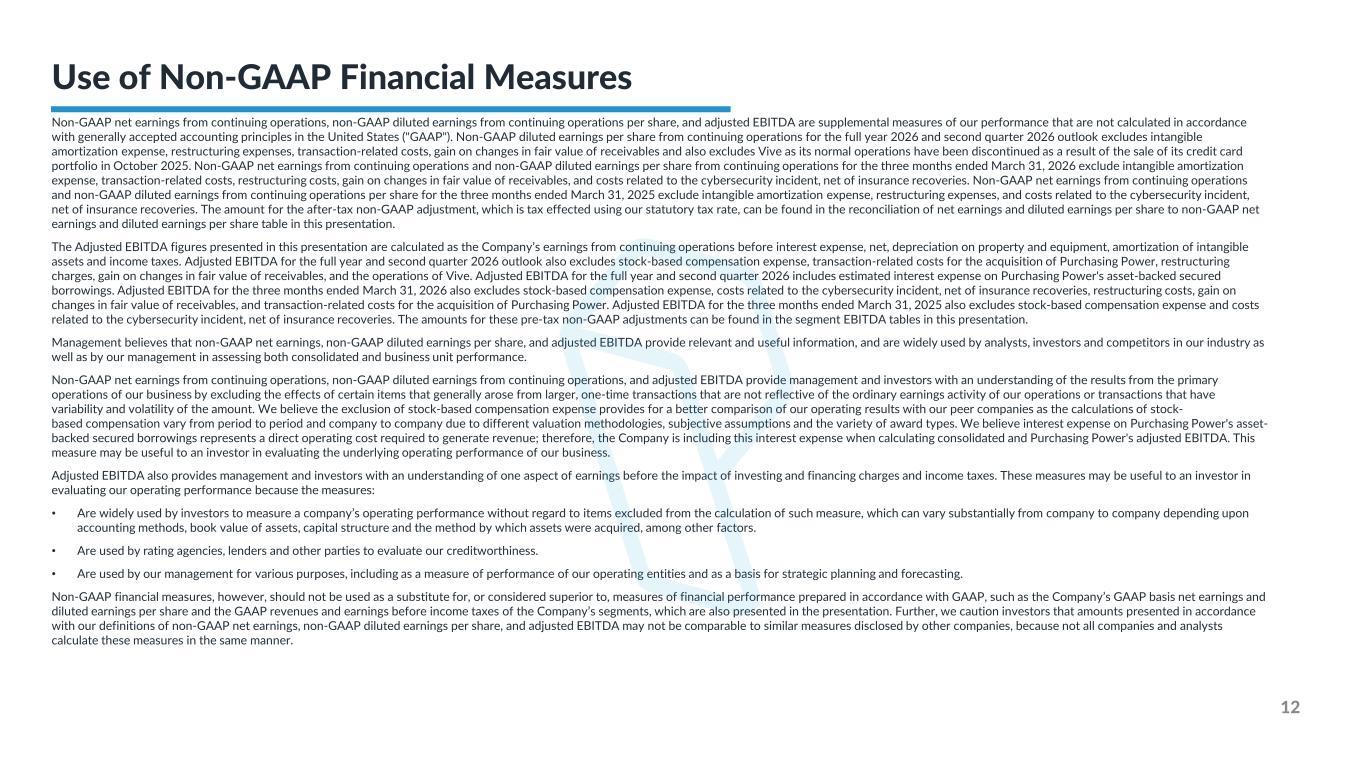
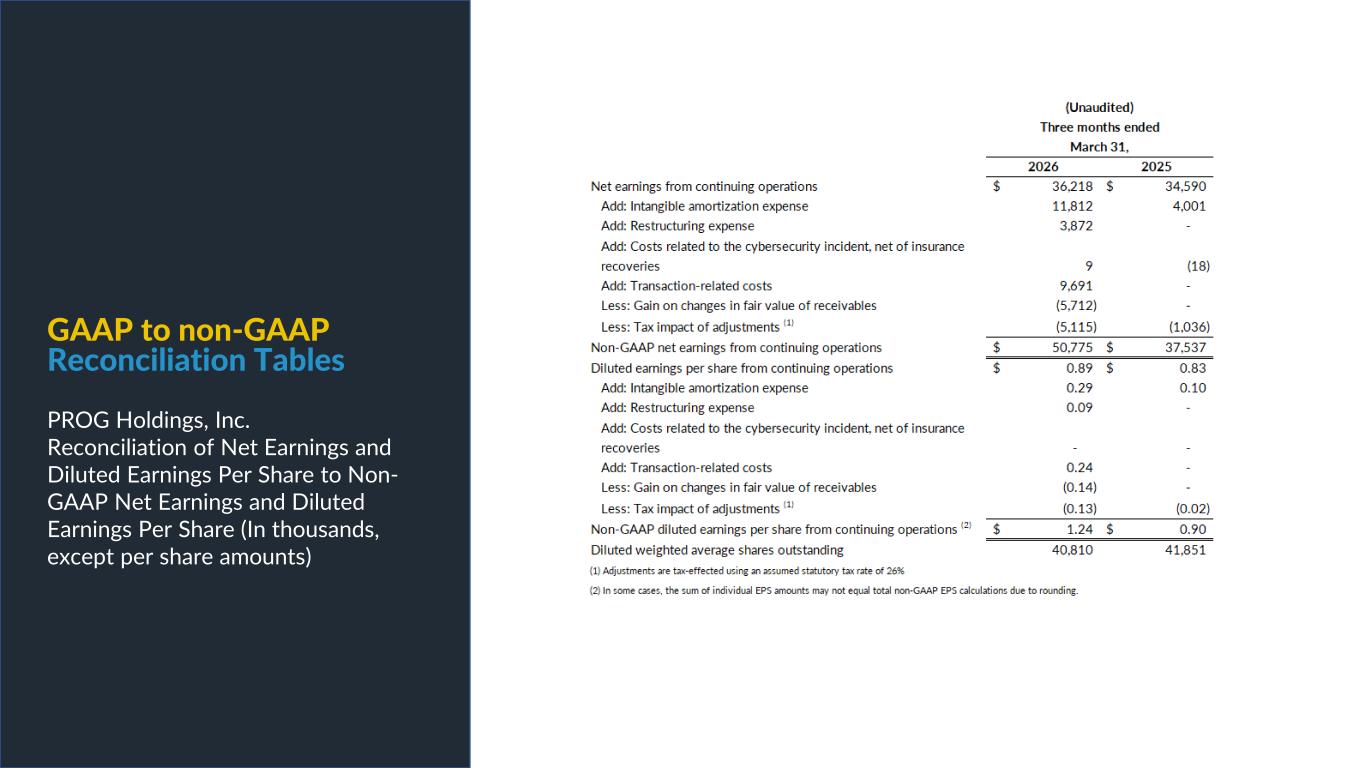
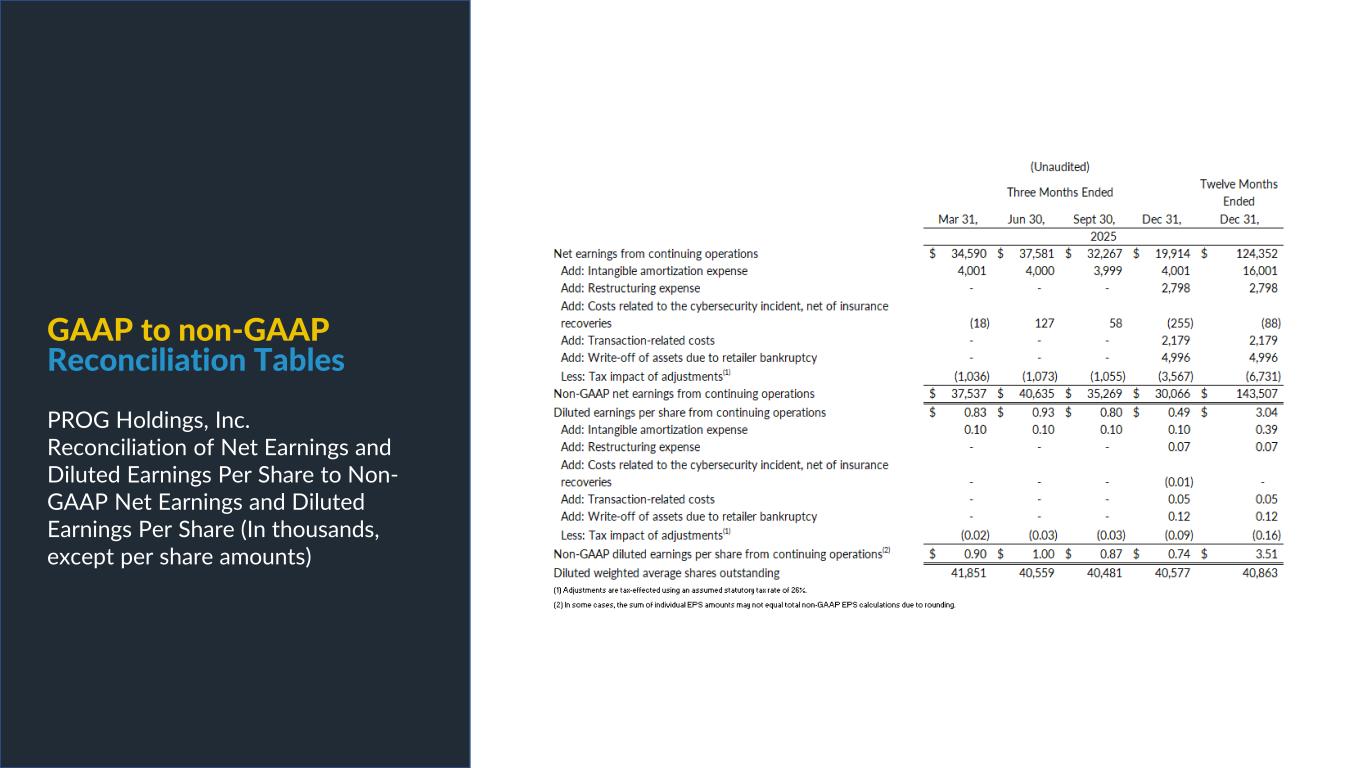
Thank you and good morning everyone. Welcome to the Prague Holdings first quarter 2026 earnings call. Joining me this morning are Steve Michaels, Prague Holdings President and Chief Executive Officer, and Brian Garner, our Chief Financial Officer. Many of you have already seen a copy of our earnings release issued this morning which is available on our Investor Relations website, investor.progholdings.com. During this call, certain statements we make will be forward-looking, including comments regarding our revised 2026 full-year outlook and our outlook for the second quarter of 2026. Listeners are cautioned not to place undue emphasis on forward-looking statements we make today, all of which are subject to risks and uncertainties which could cause actual results to differ materially from those contained in the forward-looking statement. We undertake no obligation to update any such statements. On today's call, we will be referring to certain non-GAAP financial measures, including adjusted EBITDA and non-GAAP EPS, which have been adjusted for certain items which may affect the comparability of our performance with other companies. These non-GAAP measures are detailed in the reconciliation tables included with our earnings release. The company believes that these non-GAAP financial measures provide meaningful insight into the company's operational performance and cash flows and provides these measures to investors to help facilitate comparisons of operating results with prior periods and to assist them in understanding the company's ongoing operational performance. With that, I would like to turn the call over to Steve Michaels, Prague Holdings President and Chief Executive Officer.
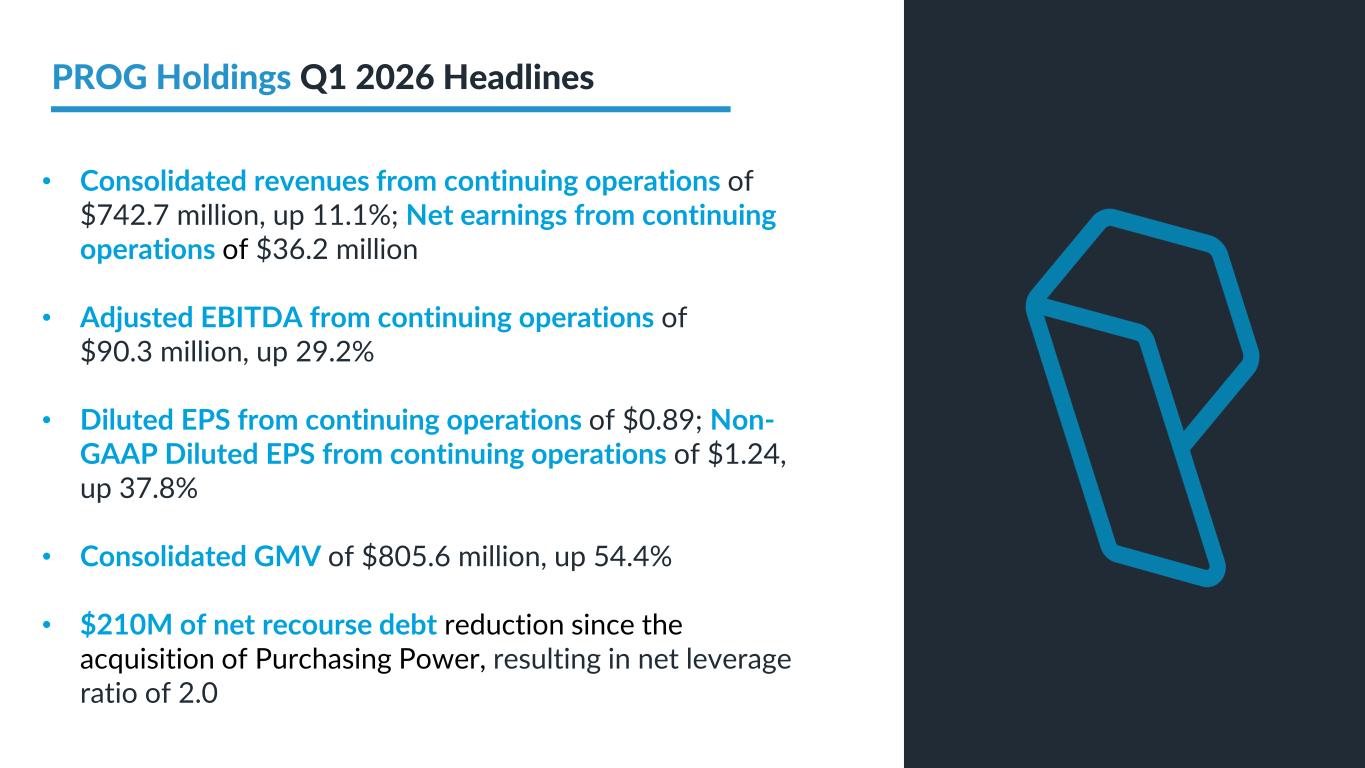
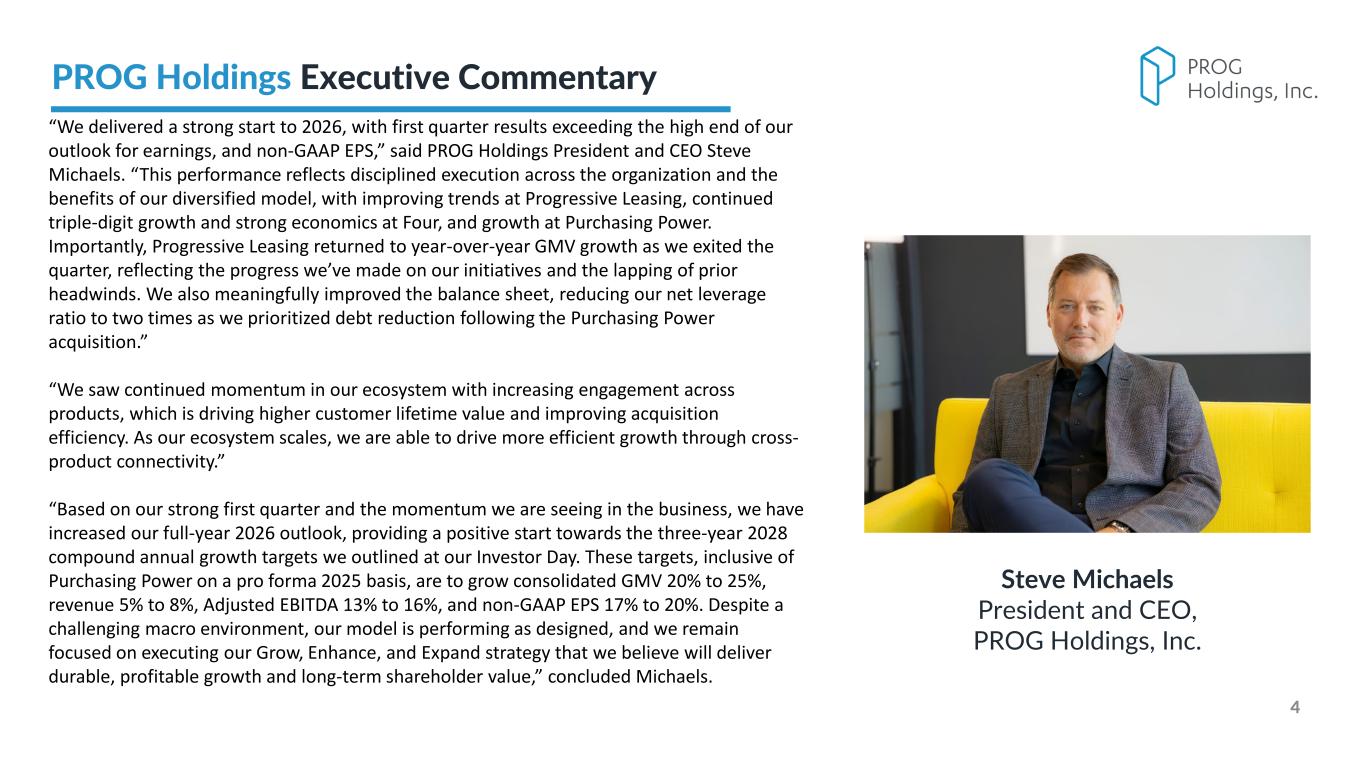
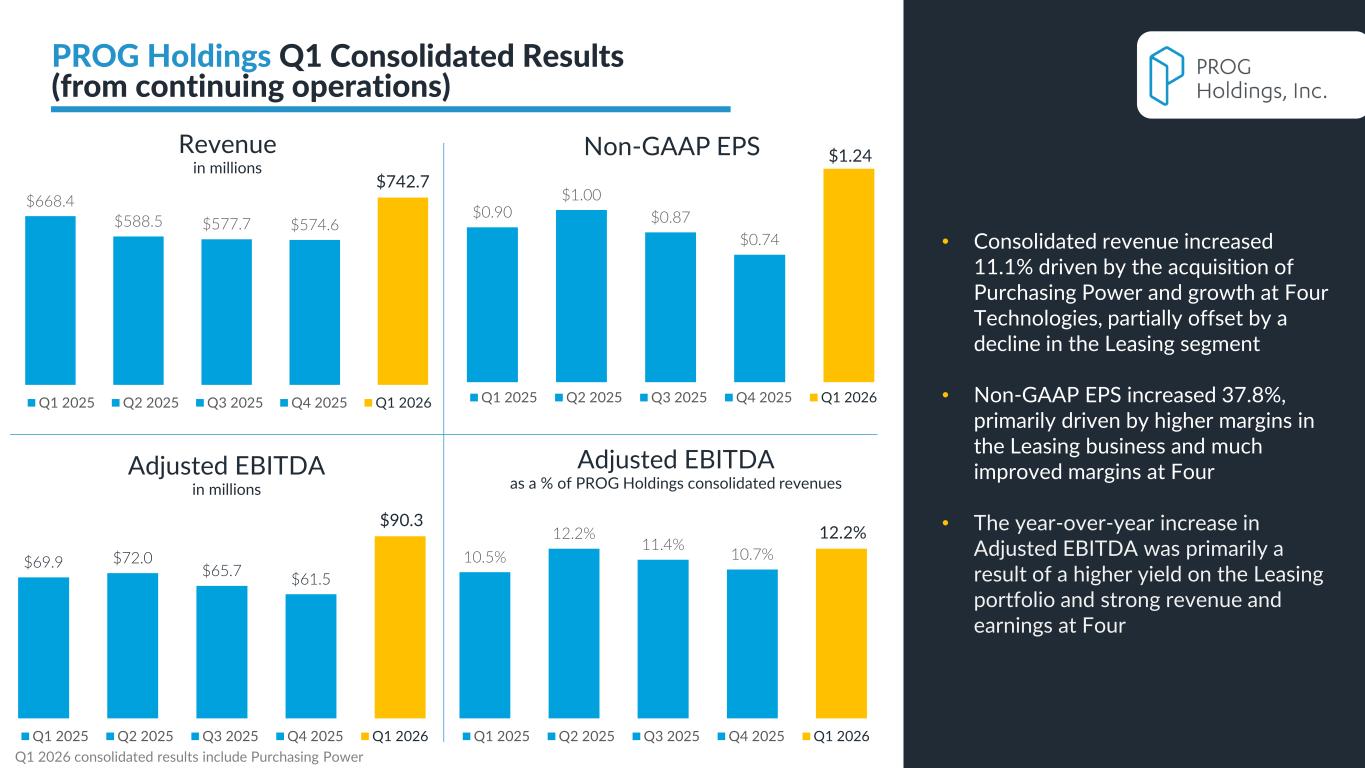
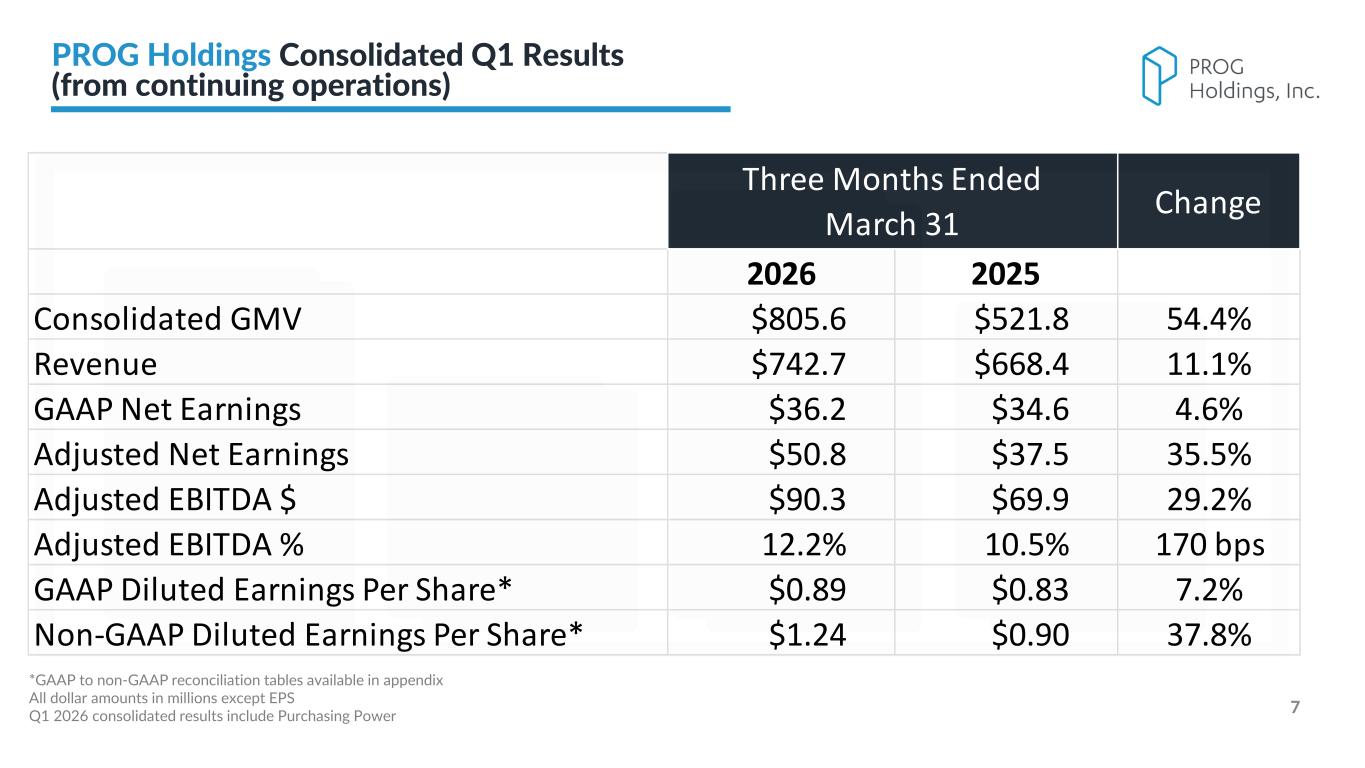
Steve? Thanks, John. Good morning, everyone, and thank you for joining us. I'll start by saying we delivered a strong first quarter. We were very happy with the start to the year and the momentum we're seeing in the business. Our results came in at the high end of our revenue outlook and exceeded the top end of our outlook for earnings and non-GAAP EPS. This outperformance reflects the discipline of our operating model and strong execution across the organization, supported by higher-than-expected GMV with improved economics at 4, as well as better portfolio yield at progressive leasing, primarily due to lower-than-expected utilization of 90-day purchase options. In an environment where the geopolitical and macroeconomic situation presents challenges, including from rising gas prices, our model performed as designed. This consistency is a direct result of how we built and managed this business over time. Let me provide some additional color on the quarter before walking through our strategic priorities. As I mentioned in February, we have begun framing growth through the lens of consolidated GMV, which grew 54% in Q1 compared to the same period last year. These results reflect the addition of purchasing power and the triple-digit growth of four. As our portfolio of solutions expands, GMV is generated through multiple products across leasing, four, and purchasing power, and this consolidated view better reflects the full scale of our platform. It's a great example of how we are deploying an integrated ecosystem of solutions to better reach underserved individuals and families. Starting with progressive leasing, GMV for the first quarter came in at 2.2% below the same period last year. However, trends improved meaningfully as the quarter progressed, with January down high single digits, February down low single digits, and March up low single digits. As a reminder, throughout last year, our leasing business faced GMV headwinds from deliberate tightening actions and the bankruptcy of big lots. As we lapped both of those headwinds, particularly through February, leasing's GMV trends inflected positively in March. From a GMV standpoint, the quarter played out largely as expected, and we are excited to exit the quarter on a growth trajectory. Ford's GMV for the quarter was 134% higher year-over-year. Customer demand for our BNPL product remains robust, and importantly, we are seeing that growth translate into attractive economics and profitability, which I'll discuss in more detail shortly. Purchasing Power's Q1 GMV grew double digits at 10.3% year-over-year. This growth was due to favorable performance within existing employer accounts. We also added several new employer clients during the quarter, bringing tens of thousands of new eligible employees onto the platform and supporting future growth. Consolidated revenue came in at $743 million, representing 11% year-over-year growth. This performance was primarily as a result of the addition of purchasing power, along with growth at four, and partially offset by a revenue decline at progressive leasing due to a lower portfolio size throughout the quarter. Consolidated adjusted EBITDA was $90.3 million, and non-GAAP EPS was $1.24, both exceeding the high end of our outlook. This outperformance was fueled by better-than-expected portfolio yield and customer payment performance at progressive leasing, as well as increased customer demand and profitability at four. To summarize the quarter, we delivered results above expectations, saw improving GMV trends while maintaining portfolio health at leasing, drove profitable triple-digit growth with improving economics at four, achieved double-digit GMV growth at purchasing power, and continued to execute against our ecosystem strategy. Before we shift into our strategic priorities, I want to briefly address the broader environment and how it informs our updated outlook. The consumer we serve remains resilient. but they are facing real challenges gas prices are elevated and there is increased uncertainty in the macro backdrop we remain committed to continue to deliver consistent portfolio performance across all our businesses and managing costs prudently to achieve our earnings outlook our track record demonstrates our ability to adapt quickly and we will do so as conditions evolve Let me now turn to our three strategic pillars, Grow, Enhance, and Expand, to share some highlights from the quarter. Starting with the Grow pillar, we saw encouraging traction at progressive leasing and purchasing power, with remarkable growth at four, which collectively resulted in consolidated GMV being up 54% year-over-year. For leasing, Q1 applications grew double digits year-over-year, and GMV trends improved sequentially month-over-month, with March up low single digits compared to the prior year. In addition to lapping the tightening actions from early 2025, these results reflect our investments in technology to enhance customer experience and in marketing to promote engagement across both new and existing customers. You heard about many of these initiatives at our recent Investor Day, and we're pleased to say that they are continuing to have a positive impact on our business. Our long-term distribution base of exclusive retail partners with approximately 70% of Progressive Leasing GMV secured into the 2030s provides a durable foundation for growth as we also gain balance of share within existing key retail partners. Additionally, our direct-to-consumer efforts spanning both marketing and digital channels have been meaningful drivers of growth. Within marketing at Progressive Leasing, we leaned into customer acquisition, partner marketing and cross-product campaigns, which drove increased engagement and incremental GMV. We focused further up the funnel while maintaining flat acquisition costs year-over-year. At the same time, our outreach channels, including email, SMS, and push notifications, generated incremental GMV, reinforcing healthy consumer demand and improving return on ad spend. On the digital front, Prague Marketplace delivered another notable quarter, growing a 169% year-over-year. We are scaling this channel through ongoing product enhancements, increased traffic, and improved conversion. Our e-commerce channel also grew meaningfully due to deeper integrations with retail partners and improved digital checkout experiences. experiences. Q1 e-commerce GMV was 25.7% of total progressive leasing GMV, up from 16.8% in the same period last year and the highest first quarter mix to date. Shifting to four, we delivered another triple digit growth quarter, our 10th in a row, with performance powered by both customer acquisition and engagement. The team rolled out AI driven product enhancements that simplify the shopping experience and average order values increased year-over-year. Monthly active users more than doubled compared to a year ago, reflecting growing consumer interests. On the marketing side, spend was deployed efficiently to support growth, maintaining a healthy balance between paid and organic customer acquisition. Finally, purchasing power delivered double-digit GMV growth, reinforcing the strength of its model and its strategic role within our ecosystem. This payroll deduction model represents a differentiated distribution moat, serving employees who value predictable, convenient purchasing options through their paycheck. We remain in the early stages of deeper integration, including introducing purchasing power to our retail partner employee bases and leveraging addressable employer relationships to expand leasing distribution. Over time, we believe this opportunity represents a meaningful incremental growth lever. From a marketing perspective, early media testing at Purchasing Power is showing encouraging results, demonstrating our ability to improve penetration within the eligible population. Under the enhanced pillar, our investments in improving both customer and retailer experiences are progressing, with several initiatives beginning to deliver positive results. Our AI-driven lease eligibility engine is scaling meaningfully. We've expanded our leasing product catalog and improved response times from three seconds down to a tenth of a second. At the same time, we are advancing customer experience enhancements that are driving higher conversion. We deployed multiple AI-driven improvements across our marketplace, including an AI chatbot assistant, enhanced payments navigation, and a new AI-powered checkout flow that simplifies and streamlines the transaction process. These marketplace enhancements have delivered an approximately 20 percentage point improvement in checkout conversion versus the prior experience, while also lowering cost to serve and improving operational efficiency. The focus remains clear. enhance the customer experience to support higher customer lifetime value while improving the economics of the business. Under the expand pillar, 4 is scaling and purchasing power is growing double digits in line with expectations as integration efforts advance. We remain intensely focused on strengthening our ecosystem. 4 executed at a high level, delivering 142% revenue growth in Q1-2026, the 10th consecutive quarter of triple-digit GMV in revenue growth. Q1-GMV reached $280 million, more than doubling Q1-2025, and March's 2026 GMV of $108 million was the second-highest month in company history. Customer engagement trends remain favorable, with average purchase frequency of approximately five transactions per quarter and more than 130% growth in active shoppers year-over-year. New shoppers grew approximately 80% year-over-year, representing expansion of the platform's customer base. FORR's subscription model remains a key driver, with 4-plus subscribers continuing to contribute approximately 80% of total GMV. Ford's take rate, defined as revenue generated as a percentage of GMV over the trailing 12-month period, remained consistent at approximately 10%, indicating positive monetization efficiency as the business scales. From a profitability standpoint, Ford generated adjusted EBITDA of $12.9 million in Q1 2026, already exceeding full-year 2025 adjusted EBITDA of $9.9 million. Q1 adjusted to EBITDA margin was 37%, reflecting the benefits of scale. While Q1 is seasonally the highest margin quarter following elevated GMV from the holiday period, the business continues to demonstrate meaningful operating leverage. MoneyApp, our cash advance product, grew revenue over 50% in the first quarter and continues to play an important role as both an engagement and cross-sell driver within our ecosystem. Growth was as a result of higher average advance sizes, as well as early traction from a new product we introduced in December called Top-Ups, which allows qualifying customers to responsibly access additional funds on top of an existing advance. While still early, Top-Ups are beginning to generate incremental revenue and represent another avenue for us to deepen customer engagement and expand the platform over time. our ecosystem strategy is gaining traction at our investor day in march i highlighted that cross-product engagement is a strategic priority because we believe it is a key component of long-term growth and value creation we are seeing progress from our ecosystem first approach with customers increasingly engaging across multiple products driving higher lifetime value and improved acquisition efficiency four is currently our most connected product often serving as an entry point and engagement driver across our platform progressive leasing showed the most meaningful improvement in cross-product engagement during the quarter with more of its customers interacting with other offerings notably we also drove the largest overlap and fastest growth in overlap between progressive leasing and four customers. Before turning over to Brian, let me touch on capital allocation. Our priorities remain unchanged. Invest in the business, pursue strategic M&A, and return excess capital to shareholders through share repurchases and dividends. In February, I told you that in the near term, we will focus on prioritizing debt reduction as we work toward our long-term net leverage target of one and a half to two times. and we did. During the quarter, we paid down $210 million in recourse debt, ending Q1 with a net leverage ratio of two times. To summarize the quarter, we delivered results above expectations, led by consistent execution and improving demand trends across the business. Importantly, these results were achieved while continuing to invest in our strategic priorities, advancing our direct consumer capabilities, scaling our digital channels, and deepening integration across our platform. Overall, our distribution moat, diversified ecosystem, and data-driven decisioning capabilities position us well to perform across a range of environments. I firmly believe the best chapters of Prague's story are still ahead of us. With that, I'll turn the call over to Brian.
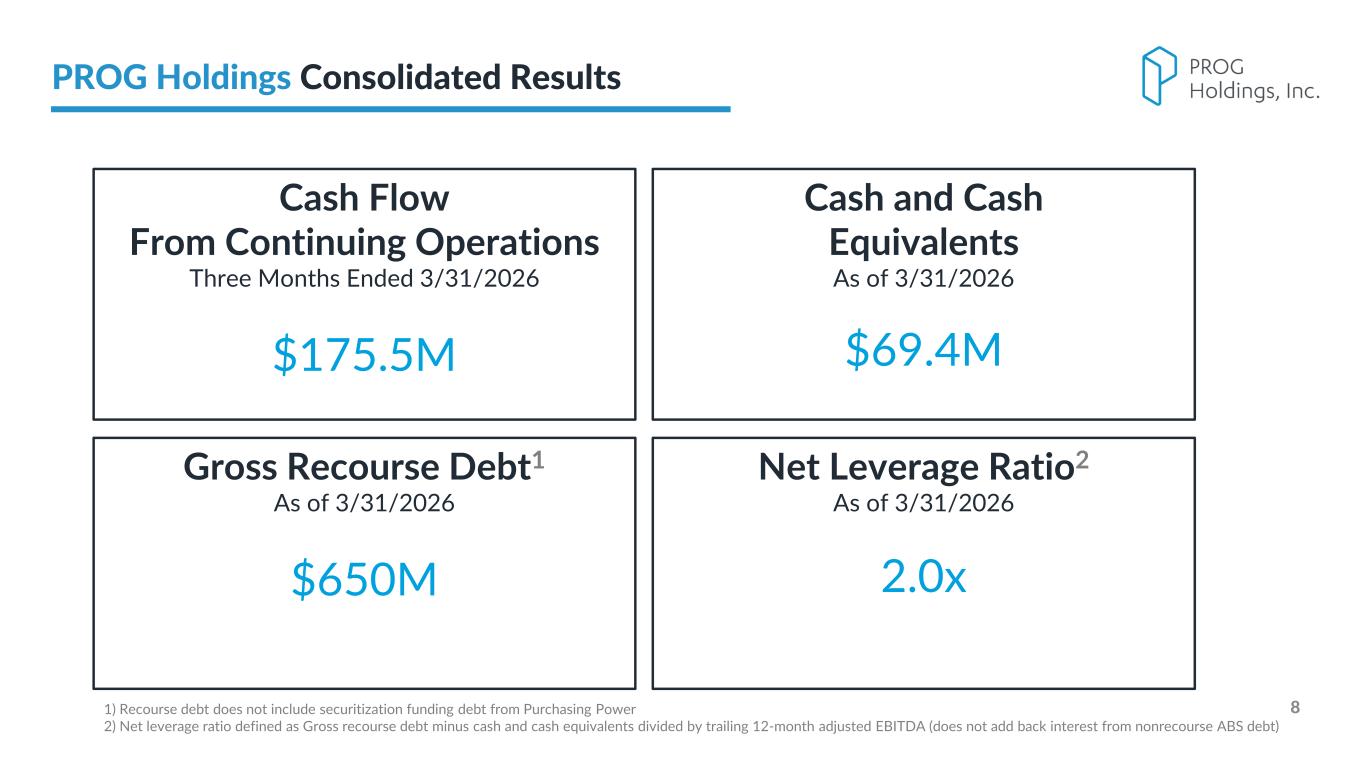
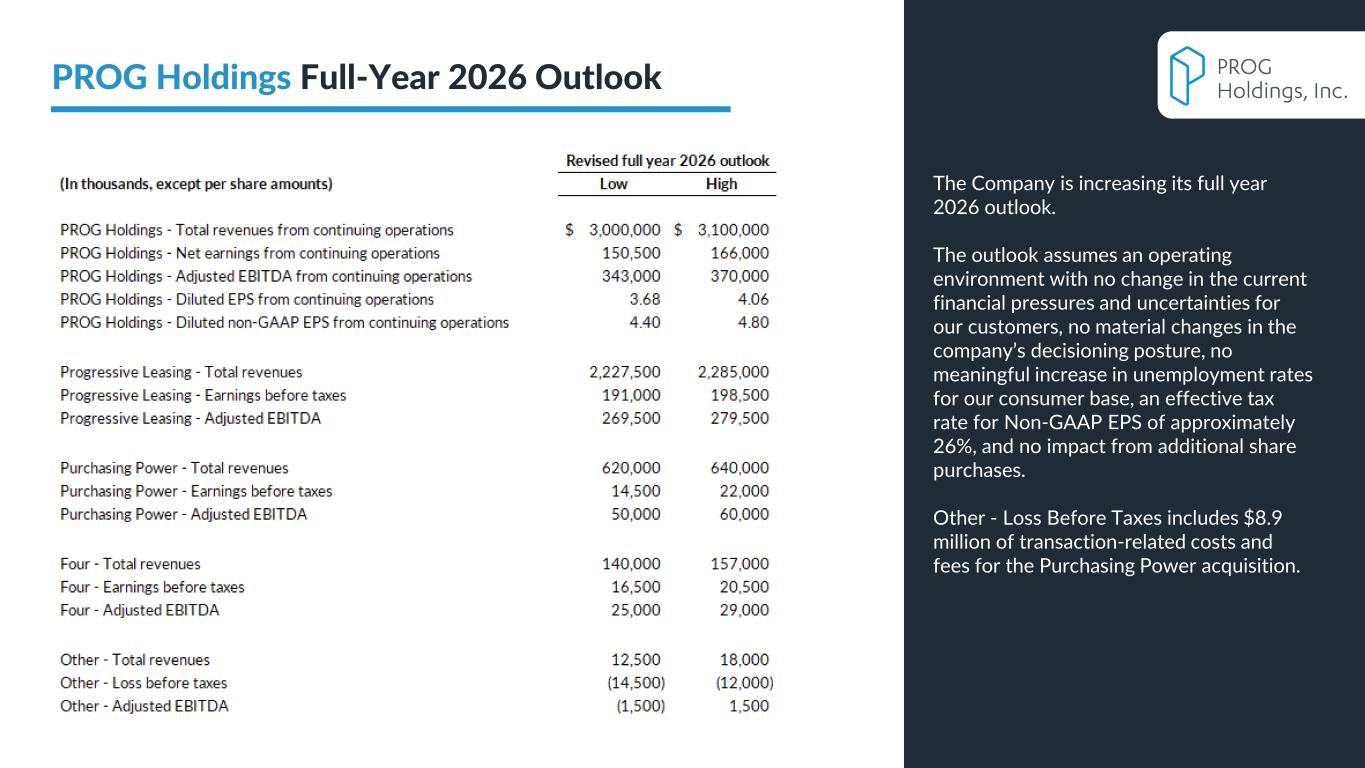
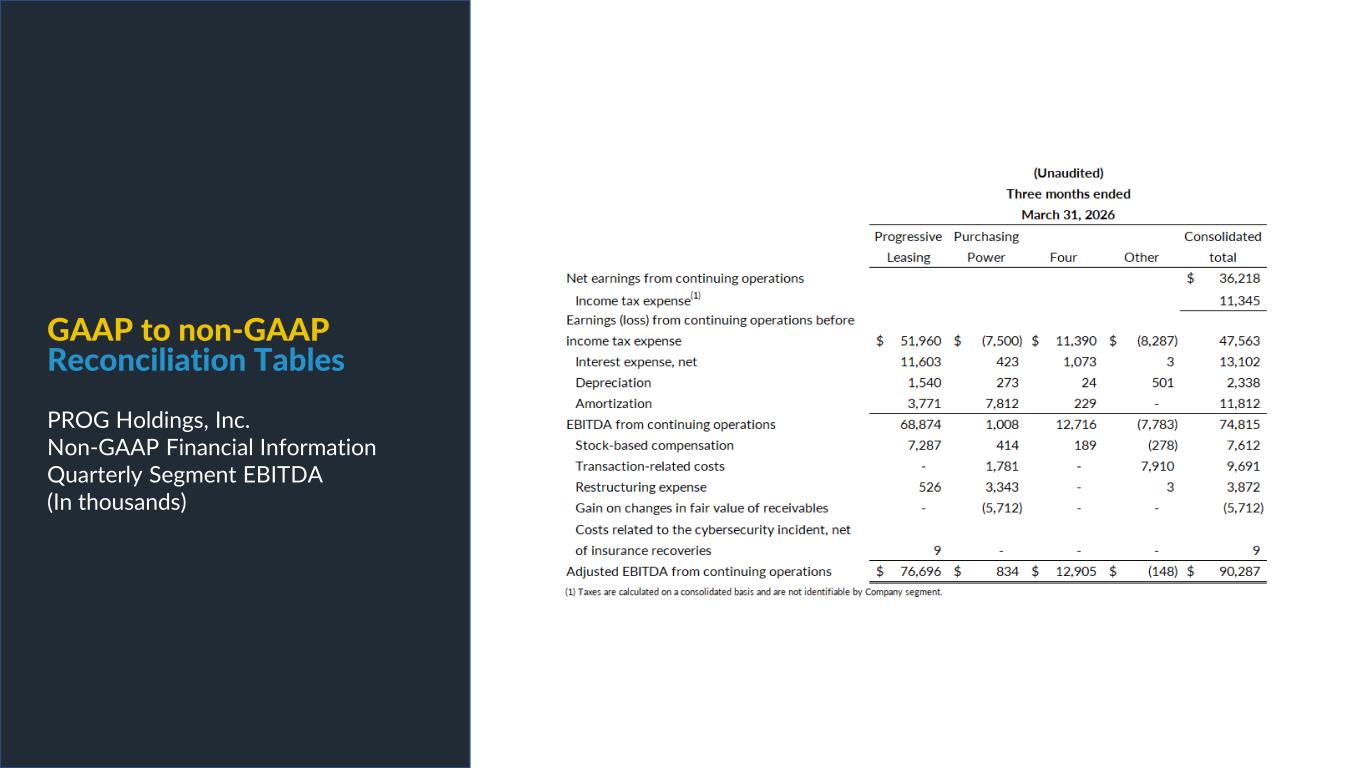
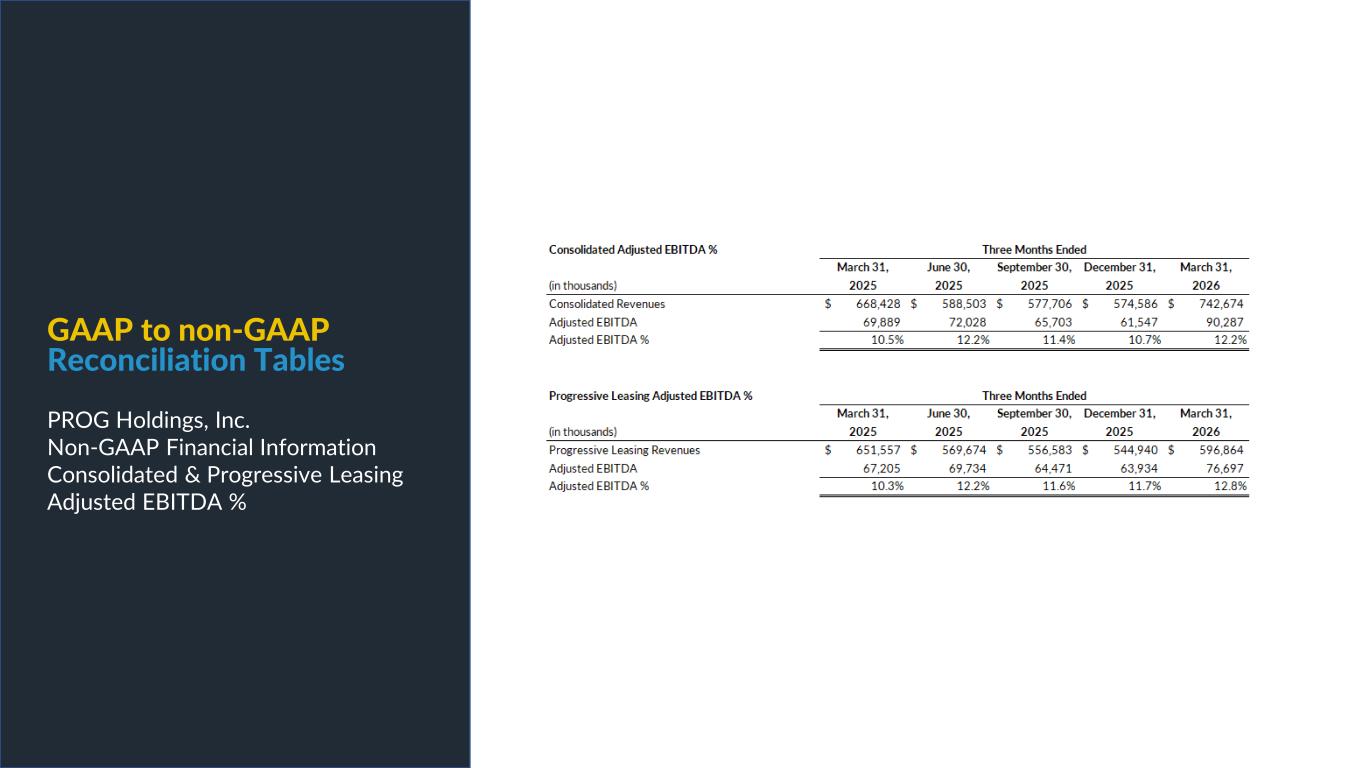
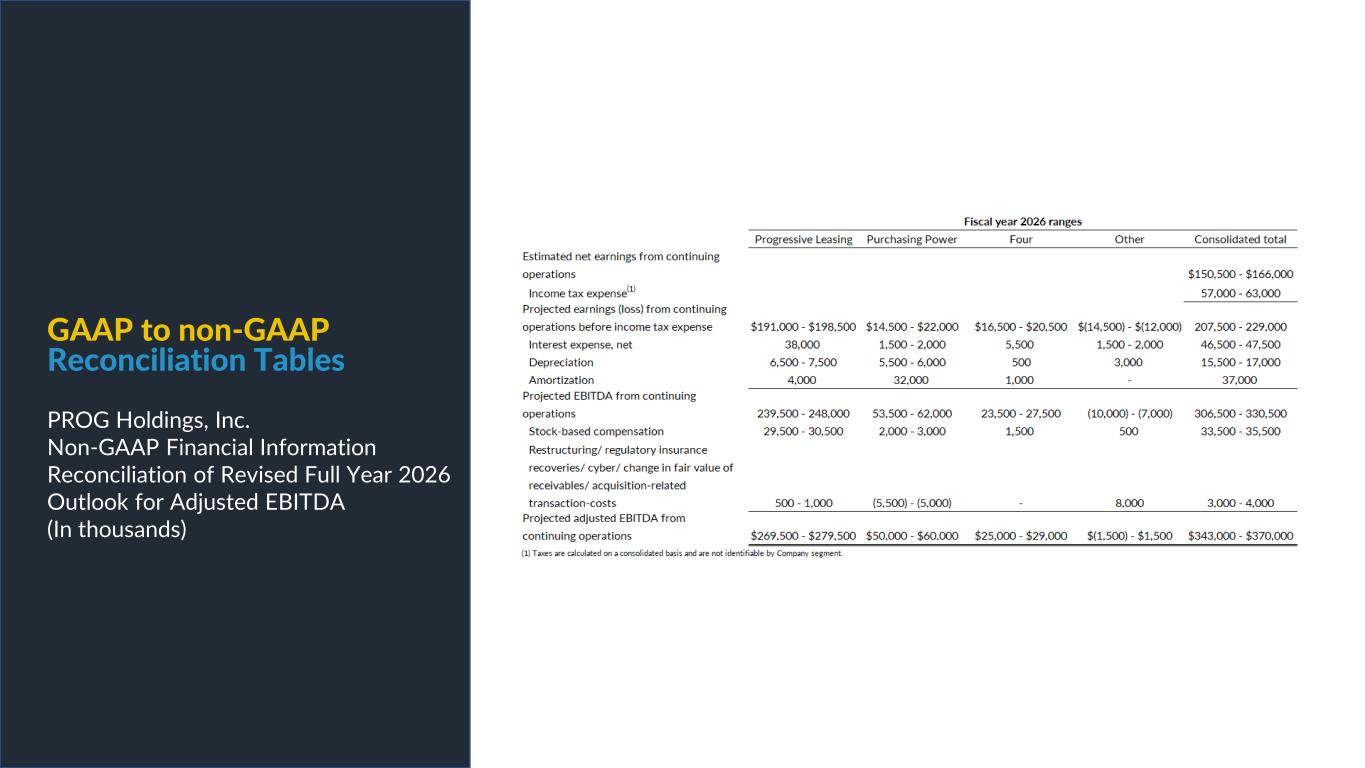
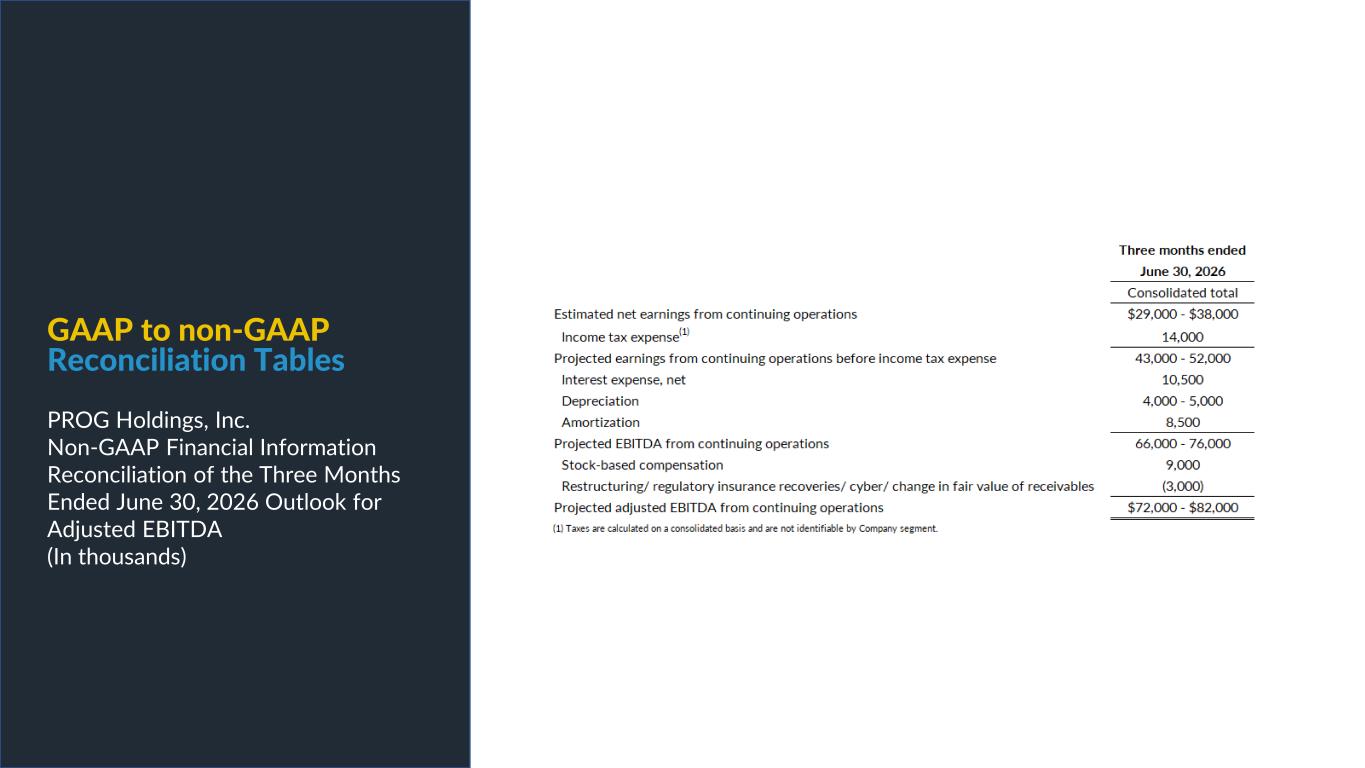
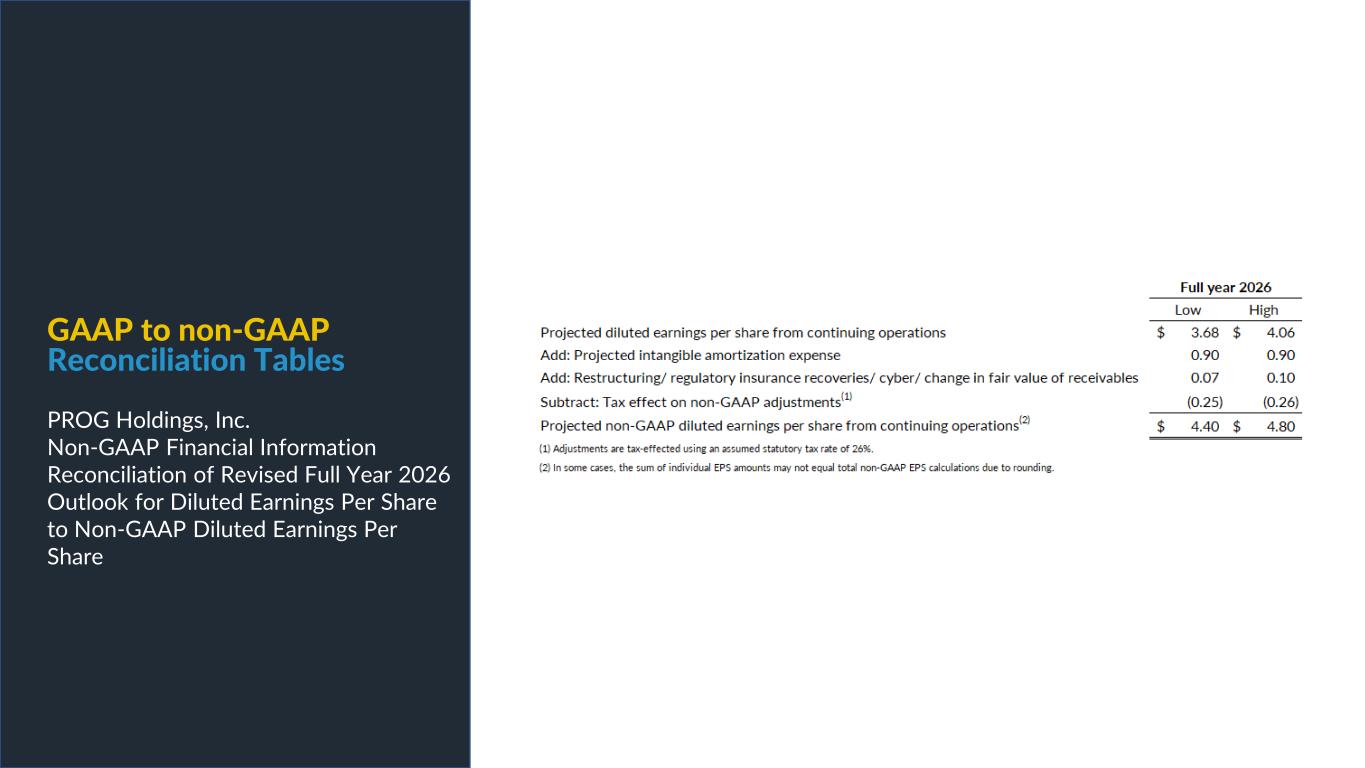
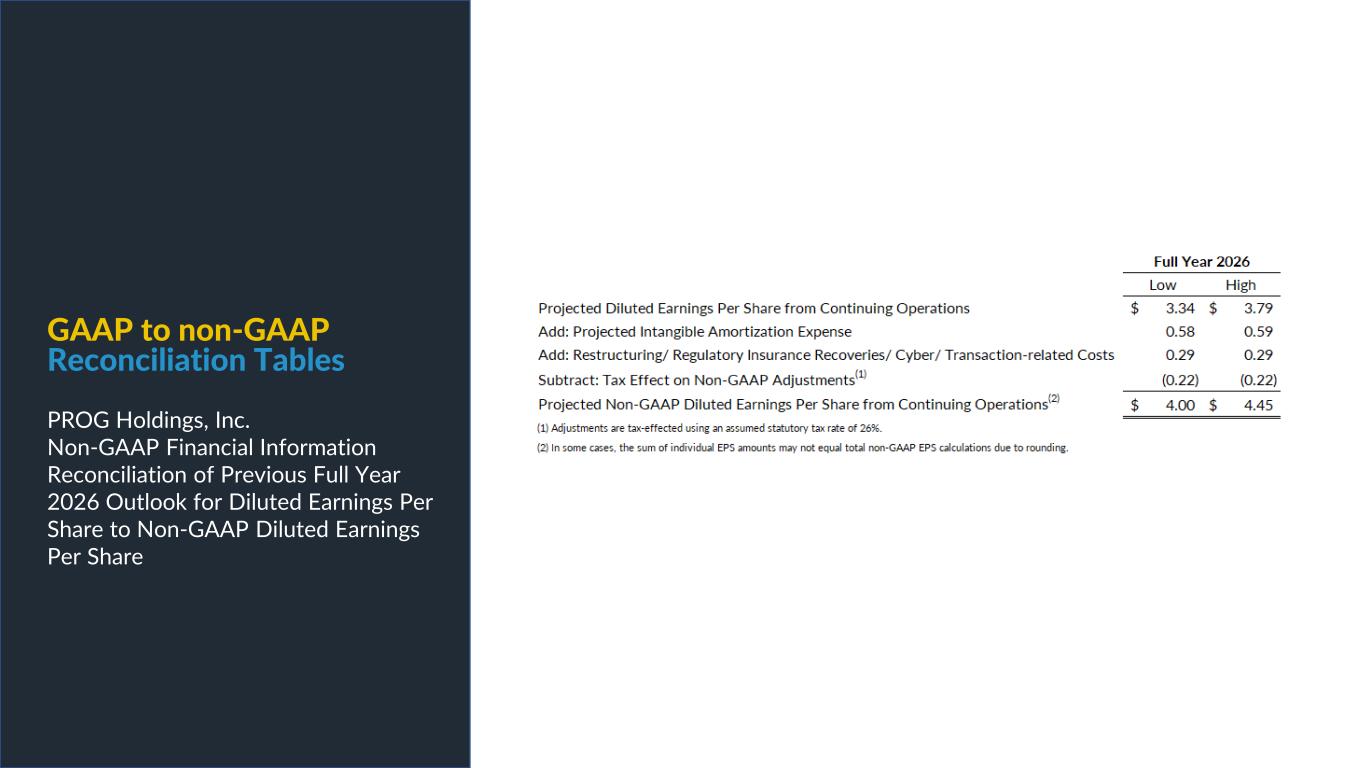
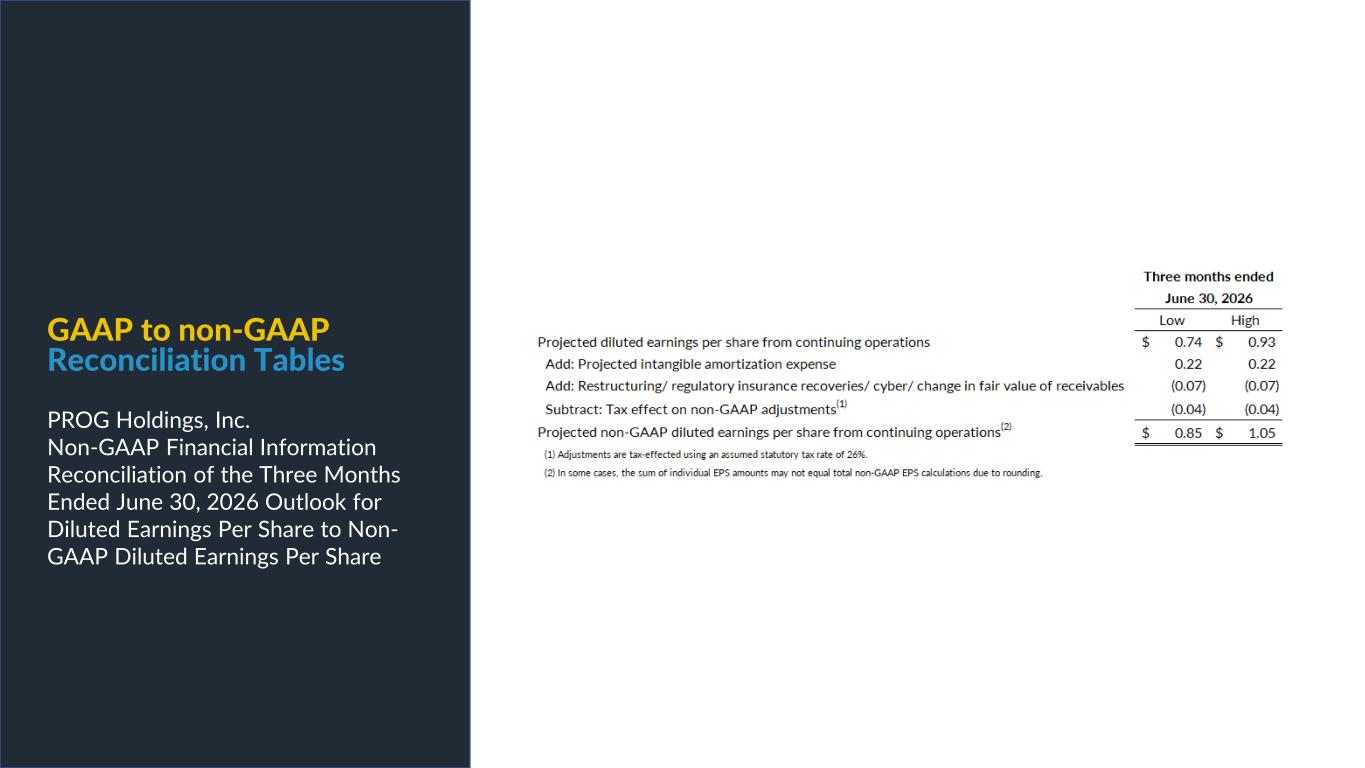
Brian? thanks steve and good morning everyone our strong performance in the first quarter was broad-based and reflects disciplined execution across each of our businesses as well as some margin favorability from consumer behavior in the leasing segment in a short period of time we made significant progress against our goal of deleveraging following the purchasing power acquisition and as we exit the quarter we are within our target net leverage range of one and a half to two times i'll begin with our q1 results of progressive leasing followed by four technologies pershing power and then move to consolidated results i'll close with an update on our balance sheet capital allocation and our revised full year 2026 outlook while more broadly consumer demand across several discretionary categories remains pressured our teams executed well on the areas within our control including targeted growth initiatives decisioning expense discipline and capital deployment enabling us to deliver results ahead of expectations and reinforcing the underlying opportunities within the business starting with progressive leasing first quarter gmv came in at 393 million representing a 2.2 decline year-over-year which was in line with our expectations as steve outlined this performance reflects two primary factors in the first half of the quarter the tightening actions we implemented last year to preserve portfolio performance and the lapping of remaining gmv from big lots following their bankruptcy as we progress through the quarter and move past these headwinds gmv trends improved sequentially returning to low single digit growth in march revenue for the progressive leasing segment was 597 million in the first quarter down 8.4 percent year-over-year primarily result of a smaller average lease portfolio throughout the quarter The lower gross leased asset balance, which is down 9.4% entering the quarter compared to a year ago, created a headwind to Q1 revenue. We ended the first quarter with a portfolio size down 5.4% year over year. As we executed against our growth initiatives of progressive leasing, we expect this portfolio headwind to subside and the revenue compare will become less difficult as the year progresses. Additionally, utilization of the 90-day early purchase option, which is seasonally high in Q1 due to tax refund season, came in lower than expected for the quarter and below 2025. While an environment where fewer customers electing to exercise their 90-day purchase option represents a revenue headwind in the period, over time we expect total revenue, gross profit, and margins to trend favorably. Gross margin for progressive leasing was 31.5 percent in the quarter up 210 basis points year over year margin expansion stemmed from improved portfolio yield and a higher proportion of customers choosing to remain in their lease agreements longer which in part ties to a lower 90-day purchase option activity lease merchandise write-offs came in at 7.3 percent of lease revenue within our targeted annual range of 68 percent and a 10-basis point improvement from the Q1 2025 rate of 7.4%. This result reflects the benefits of the tightening actions taken a year ago, and we have been largely comfortable with the trends we have seen since those changes. As we've consistently emphasized, protecting portfolio health remains our top priority, and we are closely monitoring payment behavior, delinquencies, and vintage-level performance, and we are pleased with what we have seen year-to-date. Progressive leasing's SG&A for the quarter was $81.3 million, or 13.6% of revenue, compared to 12.6% in Q1 of 2025, and was flat in total SG&A dollars spent, even as we invest selectively in areas that support long-term growth, including technology modernization, customer experience, and AI initiatives. As we've demonstrated over time, we remain focused on balancing near-term expense discipline with investments that enhance the durability and scalability of the business. Adjusted EBITDA for progressive leasing was $77 million, or 12.9% of revenue, at the high end of our long-term target range of 11% to 13%, representing a 260 basis point improvement year over year. This performance was primarily the result of operational execution, including managing portfolio performance and yield, partially offset by the revenue headwind of a smaller lease portfolio throughout the quarter. Turning to four technologies, Q1 GMV reached $280 million, representing growth of 134% year-over-year and marking the 10th consecutive quarter of triple-digit GMV growth. March alone generated $108 million in GMV, the second highest month in company history. Revenue of $35 million exceeded expectations, growing 142% year-over-year. Adjusted EBITDA was $12.9 million, representing a margin of 37%. I would note the Q1 is the strongest margin period for four, and throughout the remainder of the year, I expect margins to moderate to the range implied in the revised outlook for the segment underlying economics are improving and we remain highly encouraged by the performance of the business across both growth and profitability metrics finally switching to purchasing power q1 gmv was 132.7 million representing 10.3 percent growth revenue for purchasing power was 107.1 million first quarter with adjusted ebitda of 0.8 million consistent with the near breakeven results we expected as a reminder Purchasing Power seasonally generates a greater proportion of its revenue and earnings in the back half of the year, particularly in the fourth quarter. Integration efforts are on track, and we remain encouraged by the progress we are making across both front-end and back-end synergies, as well as its strategic fit within our broader ecosystem. Transitioning to consolidated results, we delivered strong GMV growth with continuing operations increasing 54% year-over-year to $806 million, driven by the addition of purchasing power and growth at four. Revenue from continuing operations grew 11.1% year-over-year to $742.7 million, reflecting the addition of purchasing power and triple-digit growth at four technologies, partially offset by the revenue decline in progressive leasing. From an earnings perspective for continuing operations. Consolidated adjusted EBITDA was 90.3 million or 12.2 percent of revenue and non-GAAP diluted EPS was one dollar and 24 cents both exceeding the high end of our February outlook and delivering 29 and 38 percent year-over-year growth respectively. Turning to the balance sheet we ended the first quarter with 69.4 million of unrestricted cash and total available liquidity of $419.4 million, including our revolving credit facility. We ended the quarter with $650 million of recourse debt. Since closing the acquisition, we paid down recourse debt by $210 million, resulting in a net leverage ratio of two times trailing 12-month adjusted EBITDA. As a reminder, this ratio excludes the non-recourse ABS debt used to fund purchasing power operations, does not add back the associated interest expense to adjusted EBITDA and only includes the purchasing power adjusted EBITDA since the acquisition. Importantly, net leverage was approximately two and a half times immediately following the acquisition on January 2nd of 2026. Since then, our focus has been on integrating purchasing power and driving meaningful deleveraging and we have made material progress in the quarter, bringing net leverage back within our long-term target range of one and a half to two times. As we move through the balance of the year, we expect to remain below two turns. We returned capitalist shareholders in the first quarter through our quarterly dividend paying 14 cents per share, a 7.7% increase from the prior year quarter. I would now like to touch on a few key aspects of our second quarter and revised full-year outlook which was provided in this morning's earnings release. Despite their macroeconomic challenges, we believe our GMV momentum at a consolidated level will carry into the remainder of the year. The improving leasing GMV trends positively impact the gross leased asset balance, which is a leading indicator of future period revenue. Four is delivering strong growth with improving economics, and purchasing power is just getting started on realizing its GMV and margin potential. Portfolio performance at leasing is expected to remain healthy as we actively manage yields while balancing GMV growth. We expect full-year 2026 leased merchandise write-offs to remain within our targeted annual range of 6% to 8%. Our revised consolidated outlook for 2026 raises expectations on both revenue and earnings from continuing operations, reflecting the Q1 outperformance in our confidence in executing at a high level through the rest of the year. We are already making progress against the three-year 2028 compound annual growth rate framework we outlined in the investor day. Q1 was a strong and encouraging start to this journey. Our revised consolidated outlook for continuing operations for 2026 calls for revenues in the range of $3 to $3.1 billion, adjusted EBITDA in the range of $343 to $370 million, and non-GAAP EPS in the range of $4.40 to $4.80. This outlook assumes an operating environment with no change in the current financial pressures and uncertainties for our customer, no material changes in the company's decisioning posture, no meaningful increase in the unemployment rates for our customer base, an effective tax rate for non-GAAP EPS of approximately 26 percent, and no impact from additional share repurchases. To summarize, Q1 was a great start to the year with broad-based outperformance across our businesses and disciplined execution in the areas within our control we delivered improving trends of progressive leasing sustained high growth and expanding profitability of four and early progress with purchasing power as integration continues at the same time we strengthened the balance sheet bringing net leverage back within our targeted range while maintaining a prudent approach to capital allocation as we look ahead we remain focused on driving profitable growth managing portfolio performance while executing against our strategic priorities and navigating a still uncertain macro environment. I'll turn the call back over to the operator for questions. Operator?
Operator
Thank you. At this time, we'll conduct a question and answer session. As a reminder to ask a question, you need to press star 11 on your telephone and wait for your name to be announced. To withdraw your question, please press star 11 again. Due to the interest of time, please limit yourself to one question and a follow-up. Please stand by or we compile the Q&A roster. And our first question comes from the line of Kyle Joseph Stevens. Your line is now open.
Hey, good morning, guys. Congrats on that. Really strong start to the year. Steve, we'd love to kind of pick your brain on macro. Obviously, a lot of moving parts throughout the quarter. Initially, we were expecting higher tax refunds, and then you get into March and higher gas prices. But just kind of walk us through the moving parts of macro and maybe how those impact your businesses differently. You know, we're no longer just focused on leasing, obviously. Four had a really good quarter, and we're obviously new on the purchasing power side of things. So just a little bit of macro kind of evolution through the quarter and differing impacts across the businesses.
Yeah, thanks, Kyle. I guess I would start by saying that, you know, we do have this multiple product ecosystem, but they do have connections in that they serve a very similar customer across the product. So to the extent that the macro overlay has an impact, it's not identical, but it's, you know, directionally similar across the products. And we have the benefit of being able to see it, see the customer behavior and, you know, the influence on the customers across those products and can use that to help um you know as insights into all the products as the quarter played out and you you called out a few of those things um you know we're always used to preparing for a tax season um we thought the tax season was going to be higher tax season actually played out about as we expected it was it was higher um but not maybe as high as some people were reporting back in August, September, October time frame for our customer. Certainly, refunds were up across the board, but for our customer, they were up somewhere in the whatever high singles to low doubles range. And that was about what we were planning for. And as Brian said in his remarks, we did see in the leasing business less or fewer customers choosing to exercise their 90-day purchase option. And we've seen that over time in different cycles when customers might be making different decisions about the liquidity the tax season brings. They're making payments to stay current, but not necessarily accelerating a payoff of an obligation. And that played out. Some of the other products don't exactly have that kind of accelerated repayment early, you know, during the tax season. So there's less of an impact outside of leasing. Certainly gas prices during the month of March became a bigger story. The consumer is stressed but resilient. I mean, I think that's the common refrain. We're watching all of our early indicators, you know, intensely, and we're seeing basically evidence of that stress but resilience and so we feel good about where we're positioned the the tightening and leasing that we did in first quarter of 25 has I think served us well and position the portfolio to be able to withstand some of some of the stress so we're you know we saw a really good first quarter and you know we're we're watching the numbers closely and watching the early indicators, but poised for some good momentum to continue.
Got it. That was broad-based, but I appreciate you covering it all. Just one follow-up from me. Obviously, a tough retail environment, even going into the year and then layering in gas prices. Just kind of want to get an update on your discussions with retail partners, kind of given now you have a bigger suite of products and given some more incremental headwinds for retailers. Thanks.
Yeah, I mean, that's kind of more of the same on the retail, especially in, you know, consumer durables that the leasing business addresses. And, you know, our biz dev teams are doing a good job. They've had some wins in the back half of 2025 and have, you know, a very, very good pipeline of retailers of all sizes that we think we're making progress with from a sales stage progression standpoint. So, you know, we continue to believe that our suite of products with leasing at the retail level being the largest one are things that can help retailers. We are having increased conversations about a multiple product solution with various retailers, bringing forward into the mix or on the purchasing power side, bringing other products to employers to be able to offer additional value to their employees on that voluntary benefit platform. So we look forward to continuing to really dive into that ecosystem strategy and business development in our B2B2C businesses, specifically leasing and purchasing power, is a big part of it.
Great. Thanks very much for taking my questions.
Operator
Thank you. One moment for our next question. Our next question comes from the line of Bobby Griffin or Redmond James. Your line is now open.
Good morning, guys. Thanks for taking the question, and congrats on a good start to the year. I guess, Steve, I want to first ask, like, when you've seen that customer behavior before with, like, lower expected 90-day buyouts, has that historically given you kind of any insights into what the customer does for the back half of the year? Is there anything to, like, learn or kind of how that plays out and what the health of that customer is when you see that?
Yeah, I'll start, and Brian can certainly fill in the gaps. But there's no perfect kind of corollary, but we have seen in the past, specifically in 2023, coming off of a really tough 22 from an inflation standpoint, but also a pretty material tightening that we did in the leasing business, we saw a very low 90-day buyout take rate on our customers. And then what we saw was those customers kind of just, they stayed in their leases longer, which is a theme that we've talked about for a couple quarters here on the leasing business. So not doing a 90-day, you know, in that time period, 23 did not indicate or necessarily mean that the customer was going to do a straight roller through the buckets and end up having elevated charge-offs. They ended up paying deeper into their lease and maybe doing an early buyout, maybe, you know, later in the lease or going to full term. Certainly, some do end up in charge-offs, but we saw from a margin standpoint that this was a margin-positive kind of trade-off because, as you know, 90-day is a very low margin outcome for us, and the deeper they go in the lease is better. So, we're watching that closely to see what the kind of the next action is. If the 90-day window expires, which a lot of it did in March because of the holiday uptick in leasing activity, and it expires unexercised, what happens and how do those customers continue to pay us? And so far, we're pleased with the roll rates and other indicators in the portfolio health.
And we're not expecting a mirror of 23, but we are looking to that period to to help with our forecasting yeah i would just add i mean it is the right question is you just kind of evaluate consumer health overall and you know we talked about 210 basis point improvement gross margin at leasing in the quarter primarily driven by this this dynamic and i think what's reflected in our in our outlook is is a view that this is going to be a net positive for us that the that the the tailwinds from lower 90 days uh you might see you might see some pressure and maybe some uh you know uh potentially some some delinquency trends that you watch but i'm not anticipating that they are they're anything significant we saw write-offs come down uh 10 basis points year over year and so as you see us increase our outlook and and at leasing specifically we expect this kind of disposition dynamic and a shift towards lower 90 days to be a net positive for the P&L over the course of the year.
Okay, that's helpful. I appreciate the details. And then maybe lastly for me, just on the actual GMB trends within progressive leasing side, you know, flip back positive to in the quarter, can you unpack a little, is that just a function of the comparisons, or is that, you know, actually a sign of kind of inflections in consumer trends or whatnot? And I guess I'm just asking it in context. I believe you did call out double-digit growth in apps, which would probably reflect some of the, you know, comparisons dynamic, too, with the big lot. So just trying to understand what is more comparison-driven or if it's, you know, an inflection on that consumer engaging with the product and maybe starting to see a little trend improvement.
Yeah, we're pleased with the trends as we exited the quarter, specifically as the quarter progressed. Like we talked about, it was kind of down high singles in January when we had both of those two discrete headwinds still in force and then improved to down low singles in February as we lapped those things during the month and then up low singles in March. And if you remember kind of through most of 2025, we call that what the GMV trends would have been were it not for those two headwinds. And we were in kind of the low to mid singles as air quotes the rest of the business that did actually decline in Q4 down to only up one percent absent those headwinds. So much of it is kind of how the business has been performing absent those headwinds over the last several quarters. But we're also seeing some strength in our digital channels. We talked about Marketplace being up again 169%. E-commerce as a percentage of total leasing GMV up at 25.7% and the highest first quarter mix to date. and also some various projects that we got over the goal line with existing retailers to help to improve that integration and improve balance of sale. So there's a mix of freeing up from the lapping. There's also some things that are positively trending in our execution. The apps are a strong point, but apps have to turn into approvals that have to turn into conversions and those things vary by channel. But we're pleased with how we exited the quarter and how it sets us up for the rest of the year.
That's a lot here in 2Q. Thanks, Bobby.
Operator
Thank you. One moment for our next question. Our next question comes from the line of Hongwen. TV calendar line is now open.
Thank you, guys, and congrats on the quarter. Just a quick one from me. So you mentioned about some of the cost-selling synergies between leasing and purchasing power. I think it's still in the early days, but can you give us some of the flavors of the conversation that you are having? Are you seeing a lot of inbound engagement from both sides of the enterprises? And I have a follow-up.
Yeah, I mean, that's definitely part of our plan. It was identified during diligence, and we plan to execute on it. We talked a little bit about it during investor day. But we believe that the deep and long relationships that we have with retailers on the leasing side are fertile ground for us on the biz dev side for purchasing power, and those efforts are underway. Purchasing power has several employer clients that happen to be retailers that we believe could benefit from offering leasing to their customers. And those discussions are happening as well as augmenting the purchasing power offering with additional products that our intelligence says their employees are already consuming in the broader market. And so if we can deliver that to them, you know, as a voluntary benefit, we think that's a big benefit and differentiator for purchasing power to help with the sales, you know, motion in those employer clients. But we're pleased and we're excited about the opportunity. But as you called out, we're very early in the integration because we're still just a few months post-closing.
Got it. Maybe one for Brian. So you guys have now returned back to your targeted leverage range, although at the high end, I think historically you guys have done opportunistic buybacks. So I guess, I mean, when can we expect you guys to kind of get back into the market and buy back shares at these prices? Thank you.
Yeah, you know, we haven't given any plans specifically to our buyback cadence. I think what I'd offer is you saw here in Q1 with the highly cash generative period, our ability to deploy capital against the deleveraging. And as we look forward over the course of the year into Q2 and Q3, I think you continue to see some cash generation during those periods. What I think is on the horizon in Q4 is now you have these three businesses and progressively seeing purchasing power in four that, you know, are seasonally heavy in Q4 in terms of their – in terms of the GMV concentration in the fourth quarter and the utilization of cash in that period. so i think the calculus is just kind of going through our capital allocation priorities of investing the business first um before we look to those uh kind of share repurchase uh type type options um we're sizing up that fourth quarter and just kind of you know assessing the cash needs during that period but that's really the that's really the calculus um and to the extent that we have excess uh capital we'll we'll go through that decision making process obviously um we're bullish on, you know, where we think this business is going. And Sherry Purchase has been a part of our repertoire in the past and we'll continue to evaluate them.
Got it. Thank you. And congrats on the quarter. Thank you.
Operator
Thank you. One moment for our next question. And our next question comes from the line of Anthony Chacombo of Luke Capital Markets. Your line is now open.
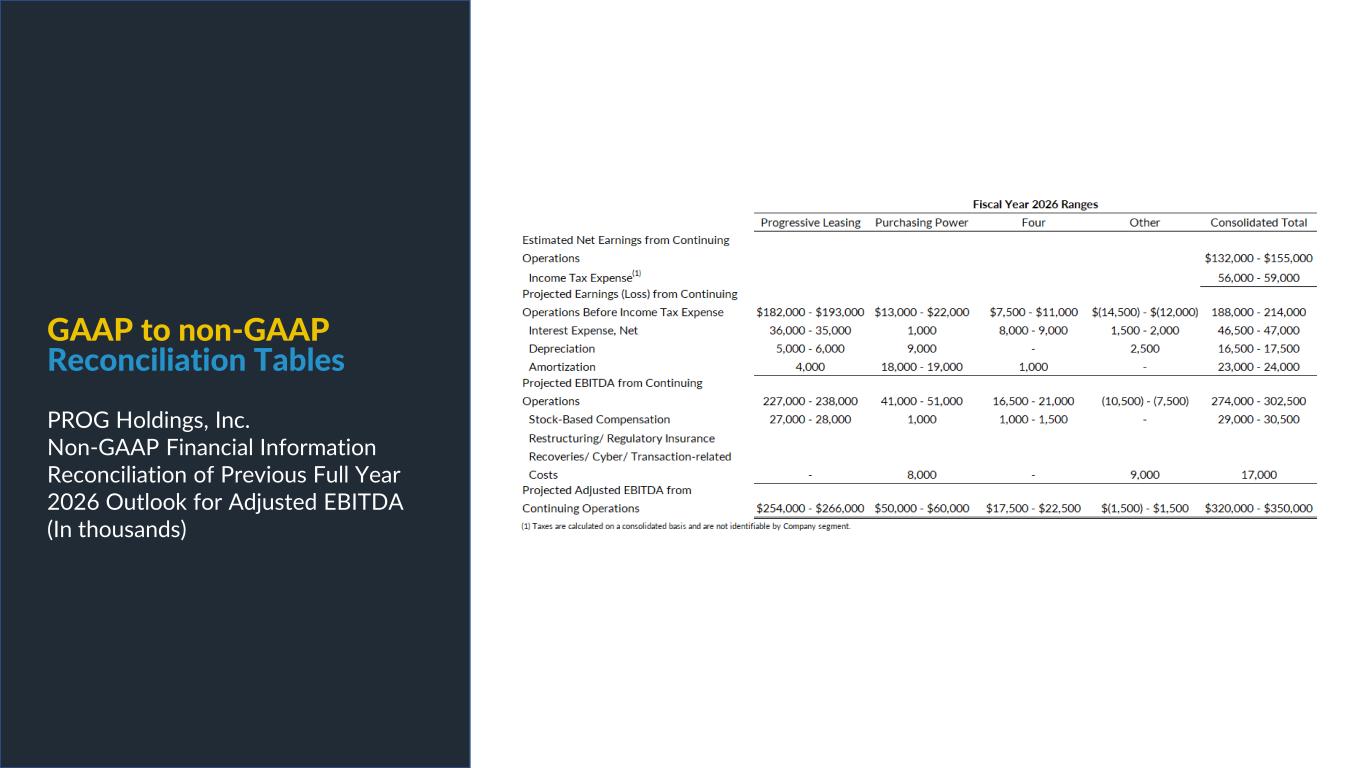
Good morning. Thank you for taking my question. and let me add my congrats on a strong start to the year as well. So I just had a question on four, incredibly impressive performance there. As I look at the revised guidance, so if I take kind of the midpoint of the adjusted EBITDA and the revenue, it would imply that the EBITDA margin in the previous outlook was called like about 15.1%, and that goes up now to about 18.2%. You know, given the fact that the take rate is consistent, I'm assuming that that's just greater scale in terms of that higher EBITDA margin, or is there something else there as well?
Yeah, thanks, Anthony. We're very pleased with the start to the year, but also the position it's in and what we think we can accomplish with it. And you're right, we did increase our view as to the margin expansion that we could achieve this year versus last year, you know, as we set about executing on that path towards, you know, a more mature state that we think is materially north of where we'll be in 26. And it is largely due to scale, but I would say that this team at four is doing an outstanding job of doing more with the same and in some cases doing more with less. They have leaned into AI in a very aggressive way and are not only achieving, you know, customer facing improvements and innovation, but also back office savings. And so it is a scale play, but it's also an efficiency play, and just the subscription strength and stickiness, or said another way, lack of churn has been a bright spot, and that revenue is very high-quality revenue that flows through to earnings in a meaningful way. got it okay and then i just have to ask my um my obligatory question uh in terms of the uh retail partner pipeline and progressive leasing yeah thank you um yeah i mean as i i think i was saying uh to kyle it we're the biz dev team is is is really really doing a great job they're um they're out there they're talking they had some wins in the in the back half of 25 that We'll pay us dividends here in 26, and the pipeline is full with retailers of all sizes. You know, we're constantly getting new doors out in the SMB space, and that's kind of a different team than the folks that are hunting the super regionals and the enterprise accounts. But we're very pleased. We've got a great offering and a great way to tell the story. The ecosystem strategy reinforces that story, even though it might be a leasing conversation. We have, you know, more earned authority around this customer and have more products. So those are all helping us have some successes. And, you know, it's our expectation that we'll have some more wins here this year in 26. Keep up the good work, guys. Thanks, Anthony.
Operator
Thank you. One more for our next question. Our next question comes from the line of Hal Goach of P-Body Securities. Your line is now open.
Congratulations on a three-for-quarter. With the acquisition of purchasing power and, I think, you know, hitting the asset-backed market for some of their receivables, you've got some new items on your income statement, gain on sale-based receivables, gain on change of fair value of receivables. And I'm wondering if you'd just give us some color on how we should think about, So, you know, any thumb rules you should use in modeling for those types of line items in your income statement going forward since you've got this new business and needs a little bit of flushing out for us to help us predict the future with it.
Yeah, I'll start and then I'll turn it over to the expert, Brian. But you're right, and we appreciate that. I will call out the difference in the two things that you specifically mentioned. The gain-of-sale of age lease receivables is not purchasing power-related. That's on the leasing side, and we did that in Q4 of last year and again in Q1 of this year, and we had not done that historically, but I would point that to you. That is not a one-time thing. That is going to be a recurring motion that we're in. It's probably not going to be to the same quantum as Q4 and Q1 moving forward, but we do have an inventory of items that are not items, but charge off leases that we have been working internally that we will then turn to sell into the open market. So that would be something that we consider to be a recurring item.
I'm going to let Brian talk about the purchasing power side because there is some purchase price accounting and fair value stuff that is that we have um excluded out of or we've we've not had it in uh you know adjusted EBITDA for the for the reasons of uh it's not kind of an ongoing thing yeah um yeah it's really that line is is related to the acquired receivables from purchasing power and they were fair valued um on the data acquisition and really what that line represents is just a uh continued evaluation of the of the fair value of those receivables um and you know you might see a a few million bucks in in any given period and but like steve said this is really a this is really a more of a technical accounting dynamic and and bleeding through from the fair value on on the uh the acquisition date and so we have we've made the decision to to adjust it out of um or add it back for to adjusted EBITDA um to uh you know for for more of a consistent uh presentation so um it's hard to it's hard to give you any any guidance on exactly how that's going to move a lot of that has to do with with collection activity and what actually occurs relative to what we thought was going to be the value at acquisition date um but i don't expect
it to be you know material in any given period it should be speed flight adjustments each quarter okay terrific and the first point that steve mentioned is this are these more like you know monies received on basically a recovery basis from from selling past due accounts is that is that basically what it is that i hear that correctly there's a sorry you know So aged lease receivables, so receivables that we charged off, you know, in some cases years ago, and we sell them to a third party, and, you know, and it's not, you know, the dollars are sizable, but the percent, the pennies on the dollar are not that big. But then they go out and they they attempt collection efforts. It's not a consignment. It's an actual sale where they we don't like share in the we get our money up front and then they go out and do their attempt to collect. Understood. OK.
And, you know, if I could ask you, I know, understand, like, you know, on the buy now, pay later, Q1 is a very big quarter because a lot of the payments from a very heavy holiday season come in the first quarter. You have the subscription, so your take rate's, you know, good. But your margins in the first quarter are, like, were better than most people in the industry already. And I'm just wondering if there's, like, a – if this is – are margins reflected on maybe not being fully burdened with the corporate overhead? Does that make sense? If – the margins are quite high, and I'm just trying to figure out if, like, Like, you know, if this was a standalone company, it'd be lower because there'd be more corporate overhead associated with it.
Yeah, I mean, if it was, I think that's fair. But, you know, the margins are high. I mean, a 37% EBITDA margin was, you know, is impressive. But as you pointed out, Q1 is the seasonally high quarter. And as Anthony pointed out, like our guide implies, you know, something in the range of half of that for the full year. And so that, you know, so that, you know, that shows that we're still in the scaling phase and haven't reached the maturity of some of the pure play competitors that are out there. but we believe that the progression from loss-making in 24 to low teams in 25 with margin expansion in 26 paints a nice picture of our ability to get up to those margin levels of the pure-play competitors.
All right. Excellent. Thank you very much, guys. Thanks, Al.
Operator
Thank you. One moment for our next question. Our next question comes from the line of Brad Thomas of Cubane Capital Markets.
Your line is now open. good morning and congrats on the next quarter here guys um i wanted to just follow up on the gmv growth that you're seeing at the end of the quarter within progressive leasing and just curious if you could speak to perhaps you know the uh your confidence level that we may be at an inflection point here and may be able to continue to drive growth in that gmv and 2q and through the balance of the year and then just how we should think about the timing potentially of the portfolio flipping to growth again and when prog leasing revenues could then flip to growth again?
Yeah, thanks, Brad. I'll start, and Brian can talk about the gross lease assets portfolio, but actually the GLA is part of my answer. We don't guide specifically to GMV on a quarter-by-quarter basis, but I think that in order to achieve the revenue guide that we did put out for the leasing business, it would need to imply that we followed similar trends coming out of Q1 into the balance of the year. But on the revenue side, a lot of that will be exactly what you called out, the portfolio size. And we made some good progress here this quarter, but I'll let Brian kind of chime in on that.
Yeah, I think what I'd highlight there is starting the quarter, Brad, our portfolio size, which is the key driver of revenue, was down 9.4% start. And we made progress, as Steve has articulated, kind of stuff functioning up our GMV trajectory. And so we ended the quarter down 5.4%. um the the net um sorry 9.4 to 5.4 the net impact of revenue in the period was revenue was down 8.4 percent and so there's a there's a pretty good corollary between kind of the average portfolio size year over year and where revenue is trending and so you kind of extend that trend line into into q2 and q3 and what we've got kind of implied in in our revenue for progressive leasing for the for the uh for the rest of the year i think what you said would really have to play out which is we'd have to see continued uh improvement in that trajectory the gross lease asset balance continuing to make progress towards uh towards growing year over year as the as the year moves on in order for us to to hit that that revenue uh target and so i like the trends there i think it's we're taking it month by month and and continue to make progress but i think as we as we now pass these difficult comps that you know i feel like we've been talking about for forever with day lots and the tightening action i think we can now you know have a an easier conversation just about the apples to apples periods a year over year and i think they're they're trending favorably so um i don't think it's i don't think it's too far down the road before before we're seeing that portfolio size larger year-over-year.
That's very helpful. And if I could ask a follow-up around the cash flow generation, Brian, I apologize if I missed it in your prepared remarks, but what does the guidance imply for free cash flow this year? Can you remind us if there's anything that's sort of maybe one-timey that wouldn't repeat as we look to cash flow next year?
And then it seems like you could, you know, boost margins nicely if you paid off some of this funding debt. you considering paying that off thanks yeah it's a good question uh so so just a couple things we haven't provided uh free cash flow guidance but what i what i will say is if you just kind of take it quarter by quarter here here in the first quarter post acquisition on january 2nd we were able to pay down total debt of 254 million dollars and so very heavy cash generative quarter it gives a lot of optionality and as we've stated you know out the gate here our prioritization is deleveraging back to our our targets as we look forward to q2 and q3 i think both of those quarters will will be slightly cash generative and give us additional optionality around either further deleveraging or uh you know evaluating putting the cash elsewhere q4 is and i i mentioned this to to huang is is you know where there's going to be you know a net cash need i anticipate just with with the growth that really these three businesses are demonstrating right now and that's not talking about money app which is also showing some uh encouraging trends and so i think i think we've kind of got that that lens that we're looking through in the cash decisions that we're making, but net-net, you know, highly cash-centered, even in a growth, heavy growth anticipation for four, and then purchasing power, double digits, and progressive leasing turning the corner on growth. So, the one-time aspect that I would just highlight, and we've spoken about it um on prior calls and that's with with respect to the the obva and you know that's i wouldn't even call that necessarily one time because given that that is is permanent in the law that's going to continue to benefit us but we did have a 20 million dollar uh tax refund that just under 20 million dollars that we we ended up getting here in q1 relative to 2025 that that was additive, and the OBBA is going to continue to benefit the rest of the year just as it reduces our overall tax liability. And we've sized that rough benefit of about $100 million for the 2026 period. So that's, I think, a tailwind, obviously, from a cash perspective. But going forward, I think we've got a lot of action out. You asked about the funding debt, the ABS debt, that's tied to purchasing power, you know, our view is that that is an important tool for purchasing power right now. I think it's an efficient model for them to be able to borrow against the receivables that they're generating and help us from just a capital efficiency standpoint. So, obviously, as long as the ABS market is, you know, favorable to us and the rates that we've disclosed here in our queue, you can see them by tranche. They're relatively favorable for us, and I think we, you know, continue marching down that path. No plans to pull those back meaningfully in the near term at least.
That's very helpful. Thank you so much.
Operator
Thank you. This concludes the question-and-answer session. I'll now turn it back to Steve Michaels, President and CEO, for closing remarks.
Thank you very much for joining us today. We delivered a strong first quarter with improving trends across the businesses, and we're entering the balance of the year with real momentum. I want to thank all of the team members across Prague Nation for the execution we've seen, as well as our retail partners and employer clients and our customers for trusting us. I firmly believe the best chapters of Prague's story are still ahead of us.
Operator
Thank you for your participation in today's conference. This does conclude the program. You may now disconnect.