Operator
Good morning, and welcome to the Priority Commerce Second Quarter 2026 Earnings Call. All participants will be in listen-only mode. Should you need assistance, please signal a conference specialist by pressing the star key followed by zero. After today's remarks, there will be an opportunity to ask questions. To ask a question, you may press star, then one on your touchdown phone. To withdraw your question, please press star, then two. Please note this event is being recorded. I would now like to turn the conference over to Megan Mayra. Please go ahead.
Good morning and thank you for joining us. With me today are Tom Priori, Chairman and Chief Executive Officer of Priority Commerce and Tim O'Leary, Chief Financial Officer. Before giving our prepared remarks, I would like to remind all participants that our comments today will include forward-looking statements which involve a number of risks and uncertainties that may cause actual results to differ materially from our forward-looking statements. The company undertakes no obligation to update or revise the forward-looking statements, whether as a result of new information, future events, or otherwise. We provide a detailed discussion of the various risk factors in our SEC findings, and we encourage you to review these findings. Additionally, we may refer to non-GAAP measures, including but not limited to EBITDA and adjusted EBITDA during the course. Reconciliations of our non-GAAP performance and liquidity measures to the appropriate GAAP measures can be found in our press release and SEC filings available in the Investor section of our website. Before I turn the call over to Tom, I would like to say that on today's call, we will only be discussing priorities, financial and operating results in our case. We will not be commenting on or answering questions related to the Special Committee's ongoing evaluation of the Take Private proposal. Please continue to refer to the company's prior press releases for the latest on that topic. With that, I would like to turn the call over to our Chairman and CEO, Tom Fiori.
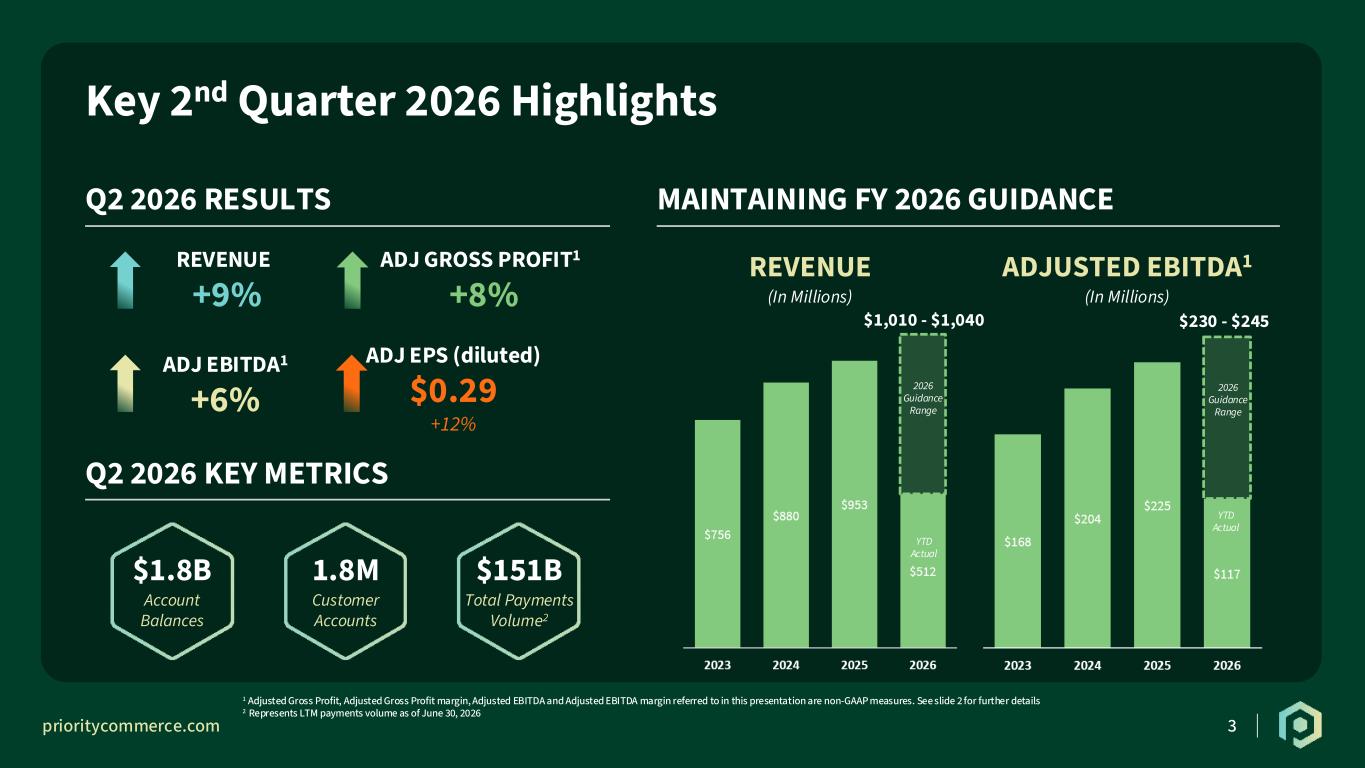
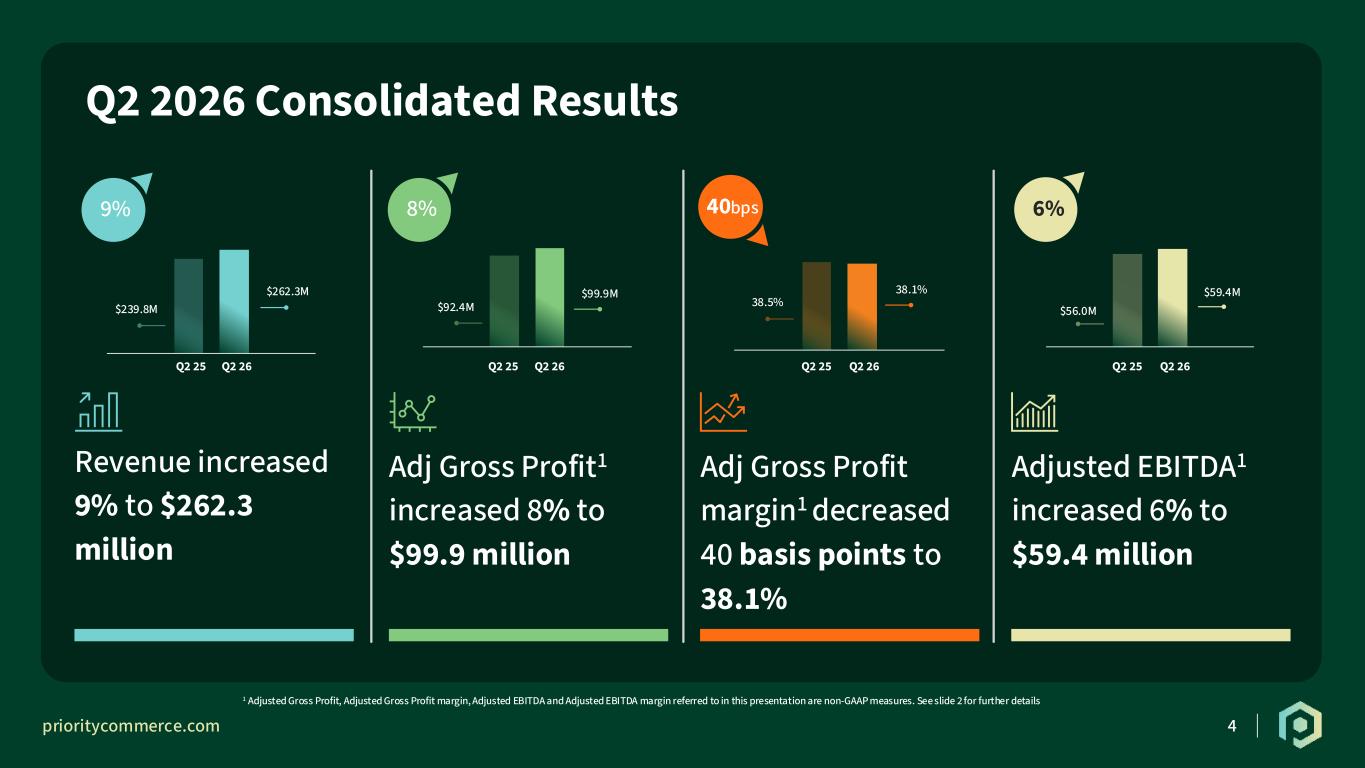
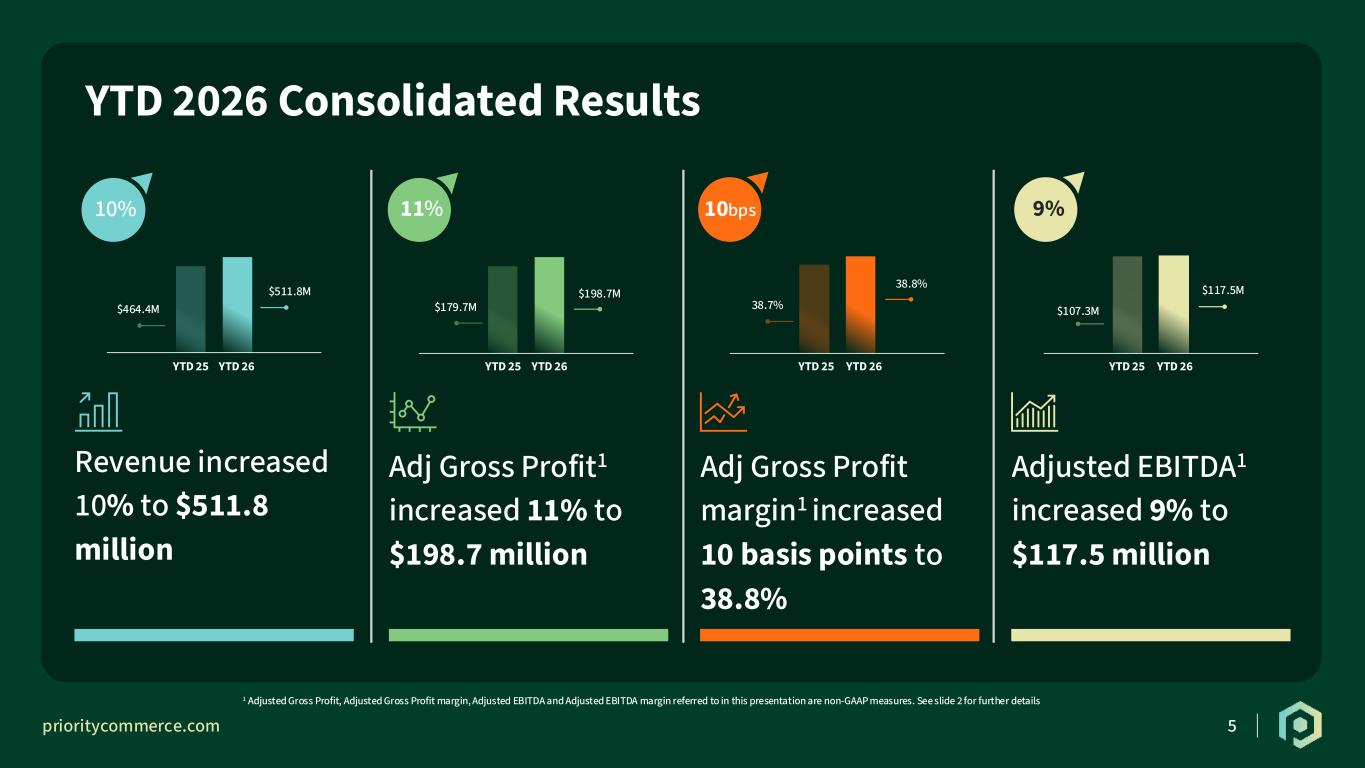
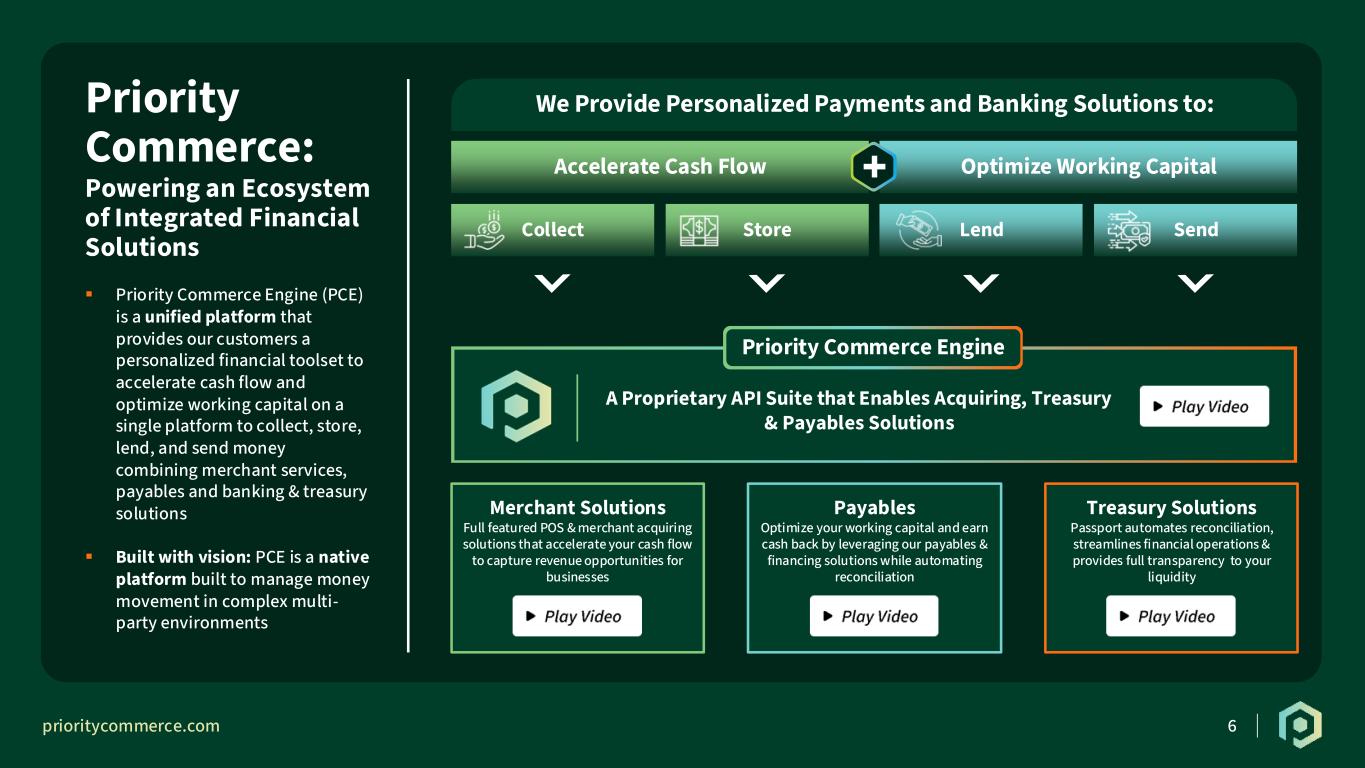
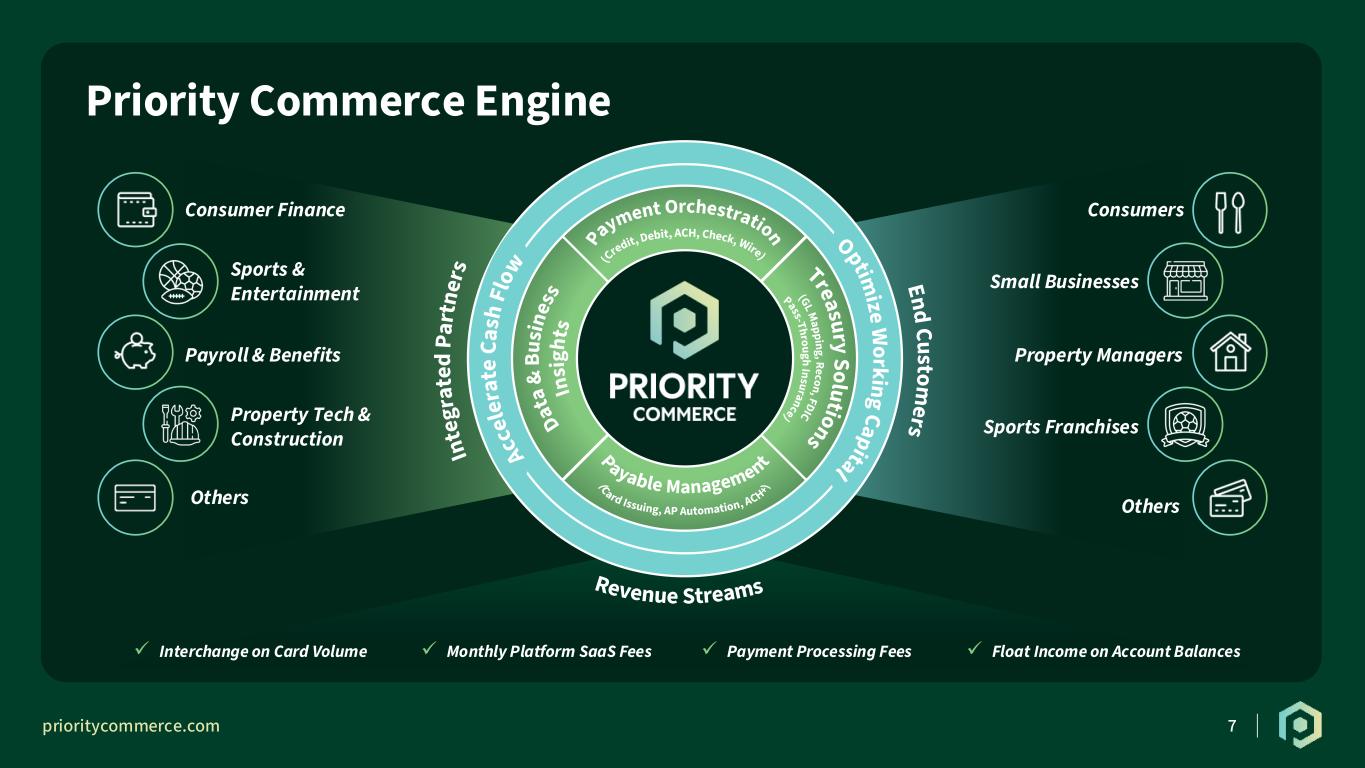
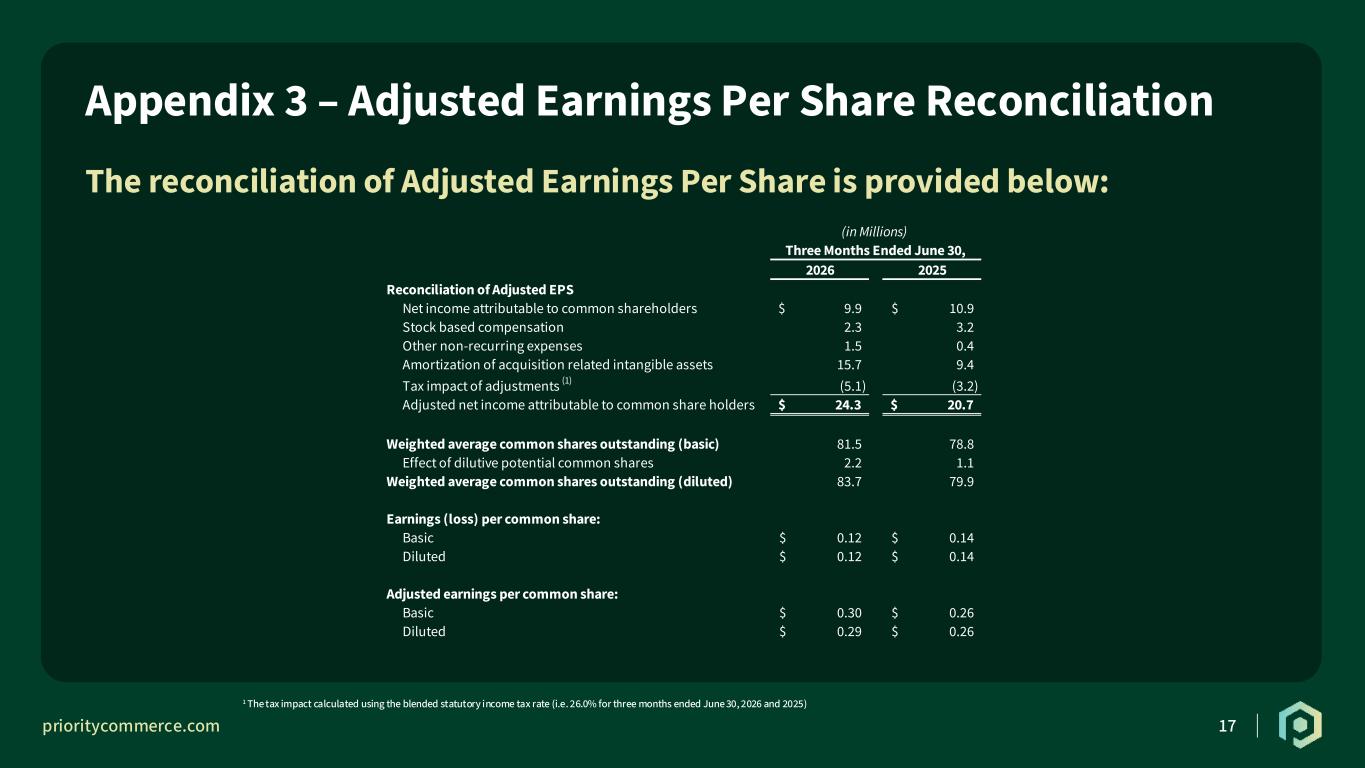
Thank you, Meghna, and thanks to everyone for joining us this morning for our second quarter 2026 earnings call. I'll begin today's call by highlighting our aggregate second quarter performance and outlook before handing the call over to Tim, who will provide segment-level performance, key trends, and developments across our business segments and Priority overall. This morning, we reported solid growth in both revenue and profits for the second quarter. As summarized on slide three, Priority had a strong Q2 by every key financial metric, growing net revenue by over 9%, generating adjusted gross profit and adjusted EBITDA growth of 8% and 6% respectively, and increasing adjusted EPS by 12% year-over-year to $0.29. We ended the quarter with 1.8 million total customer accounts operating on our commerce platform, which is up almost 13% from Q2 last year. Annual transaction volume of $151 billion increased by 8%, and average account balances under administration grew by 26% to $1.8 billion compared to last year's second quarter. Tim will provide more context on the full year outlook later in the call, but I can reflect that the value of our diverse partners and customer experience with our unified commerce platform provides continued confidence that we will sustain the momentum in our merchant solutions, payables, and treasury solution segments. Based on this momentum, we are maintaining our full-year financial guidance, but expect to be at the higher end of our revenue range and lower end of our gross profit and adjusted EBITDA ranges, reflecting continued investment and mixed-related margin pressure that Tim will detail. Turning our attention to aggregate Q2 results on slide 4, revenue of $262.3 million increased 9% from the prior year. This led to an 8% increase in adjusted gross profit to $99.9 million and a 6% improvement in adjusted EBITDA to $59.4 million. Highlighted on slide 5, our steady Q2 performance contributed to year-to-date revenue growth of 10% to $511.8 million, fueling an 11% increase in adjusted gross profit to $198.7 million, and just over a 9% improvement in adjusted EBITDA to $117.5 million. For those of you who are new to Priority, Slides 6 and 7 highlight our vision for connected commerce. The Priority Commerce platform is purpose-built to streamline collecting, storing, lending, and sending money. It delivers a flexible financial tool set for merchant acquiring, payables, and treasury solutions designed to accelerate cash flow and optimize working capital for businesses. I would encourage you to play the short one-to-two-minute videos embedded in the product links on the slide to get a deeper appreciation of why customers are consistently partnering with priority to reach their commerce goals and why we're emerging as a go-to solution provider for embedded commerce and finance solutions. Slide seven highlights a typical partner experience with our commerce API's orchestration capabilities for payments and treasury solutions. They enable partners to use a commerce surface tailored to their specific needs. Customers connecting via our API can access all routes for digital payment acceptance, create traditional and virtual bank accounts, issue physical and virtual debit cards, enable lockbox for checks, configure single vendor and advanced bulk vendor payments, and many other commerce options to create new revenue and operating efficiency. We continue to standardize payment operations and key operation workflows across diverse industry segments where money movement and treasury tools are critical to the value chain to broaden and diversify our revenue sources while maintaining our cost discipline. Our focused execution explains why priority consistently performed across varying economic cycles. Our customers and current market conditions reinforce our belief in our mission to deliver single-point commerce solutions that provide businesses with one view and total command of their financial environment. At this point, I'd like to hand it over to Tim, who will provide further insights into the health of our business segments, along with current trends in each, that factored into our second quarter results and our confidence for sustained performance in 2026.
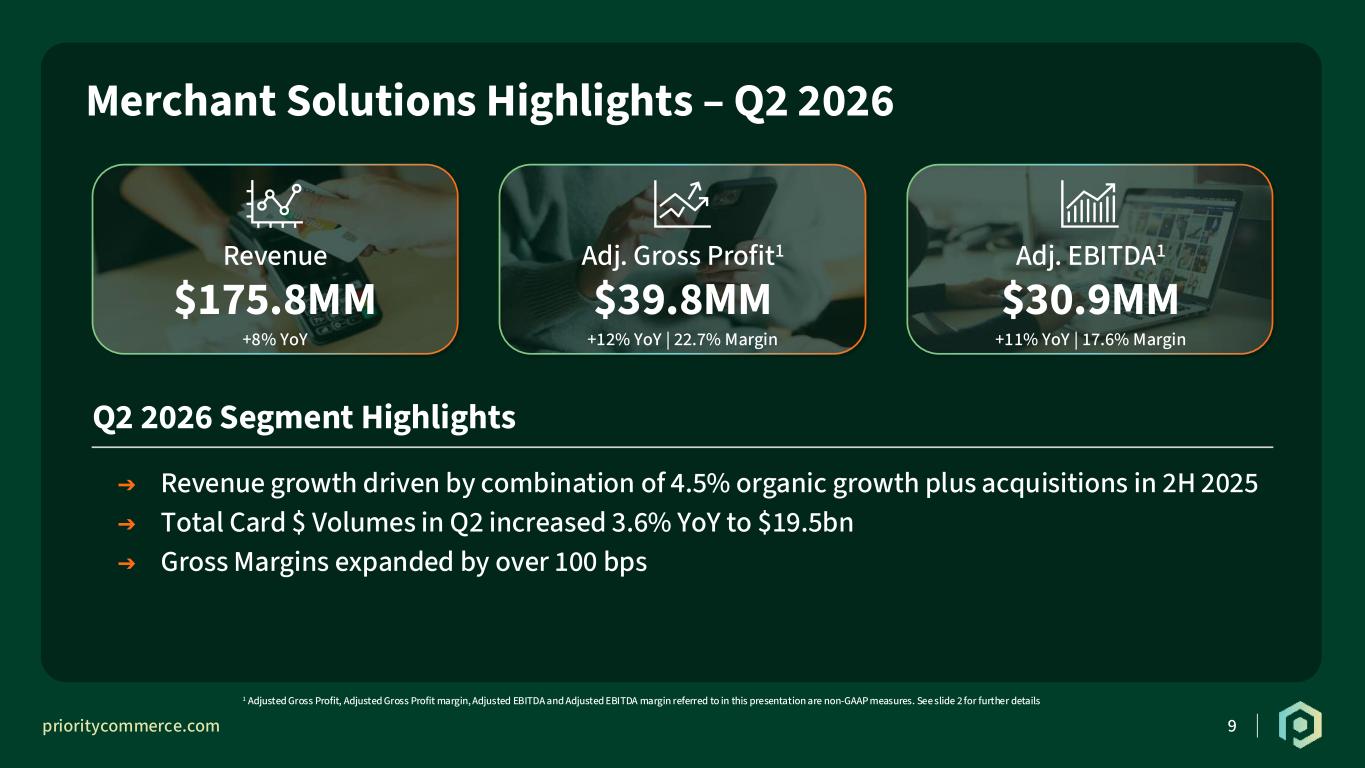
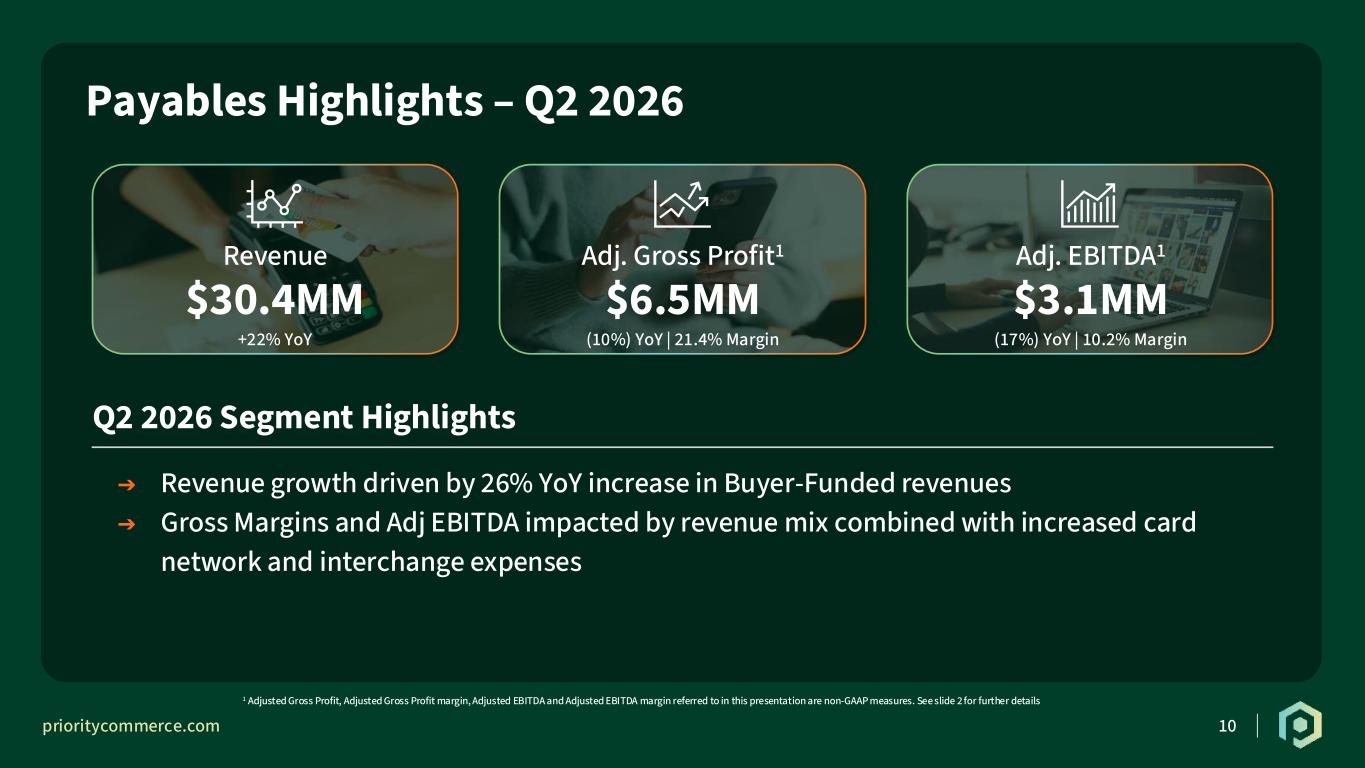
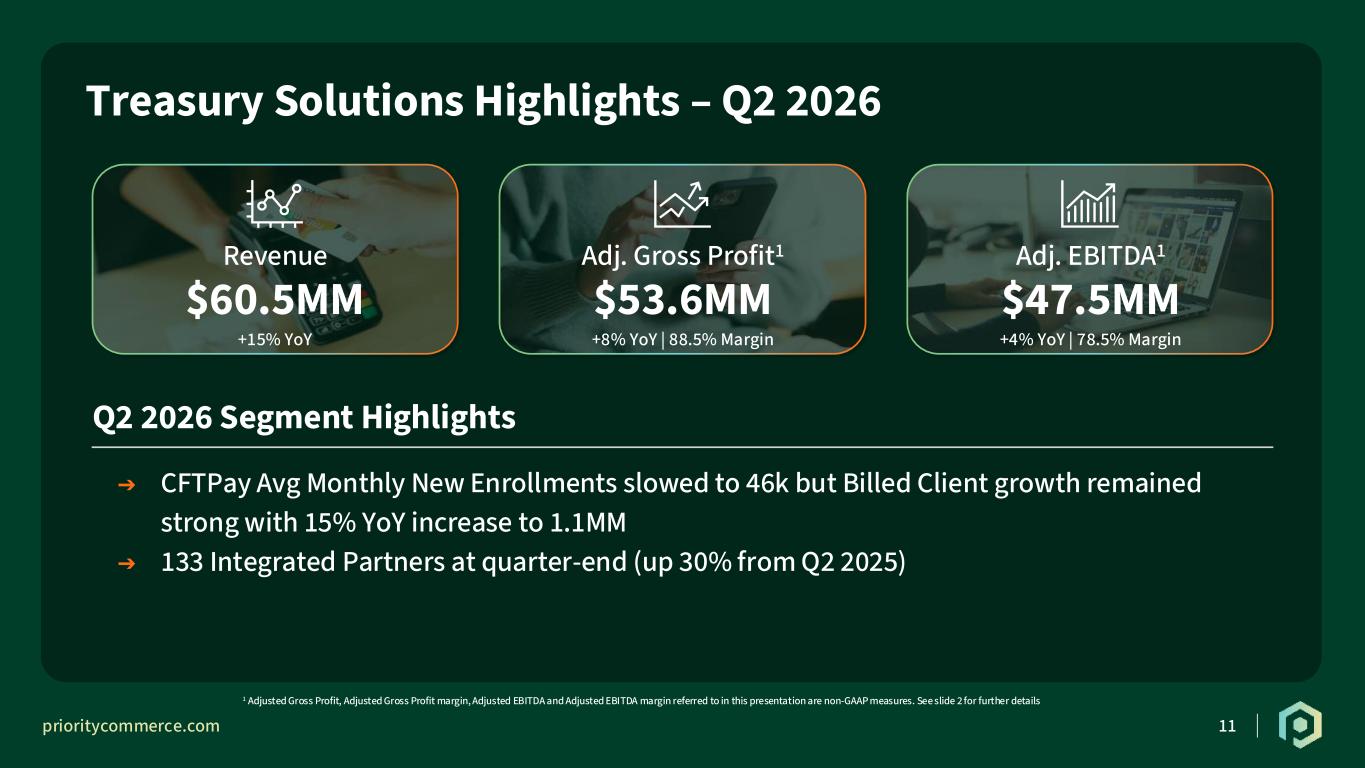
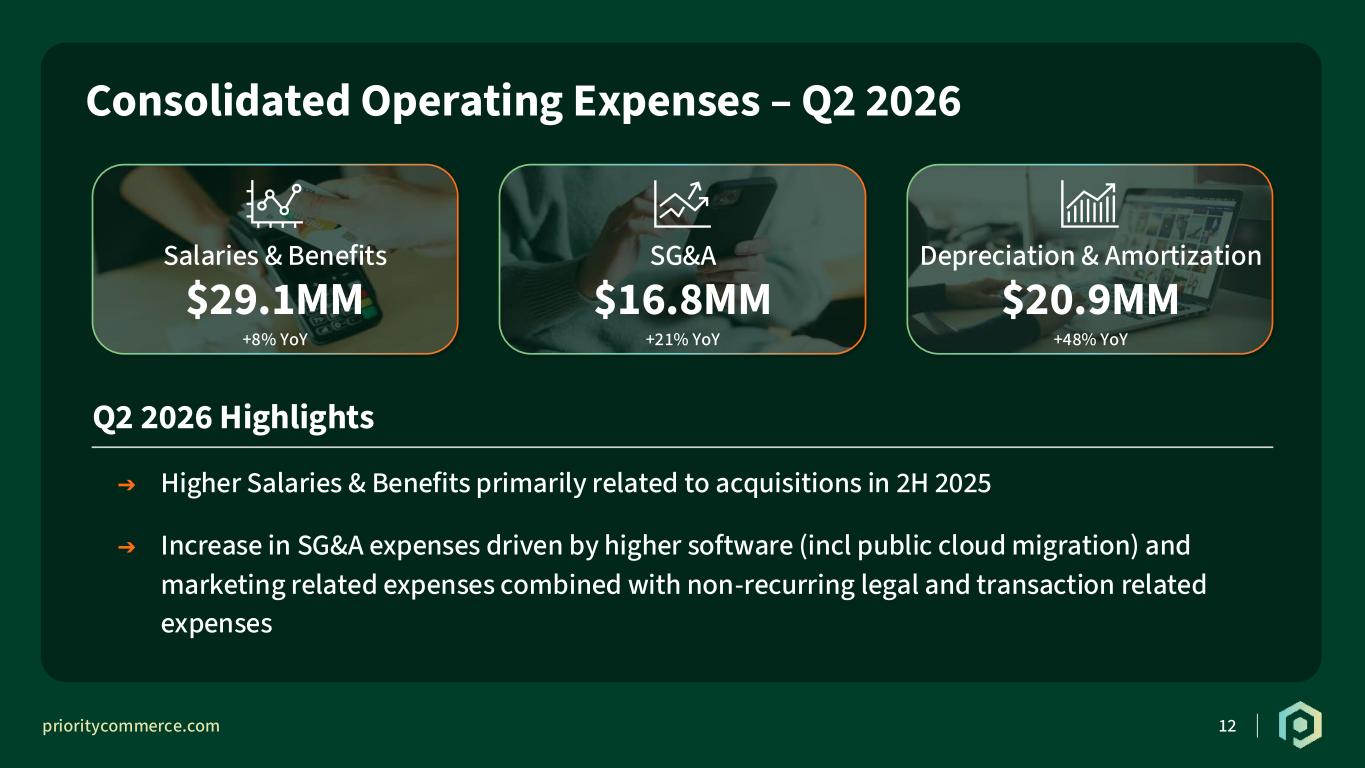
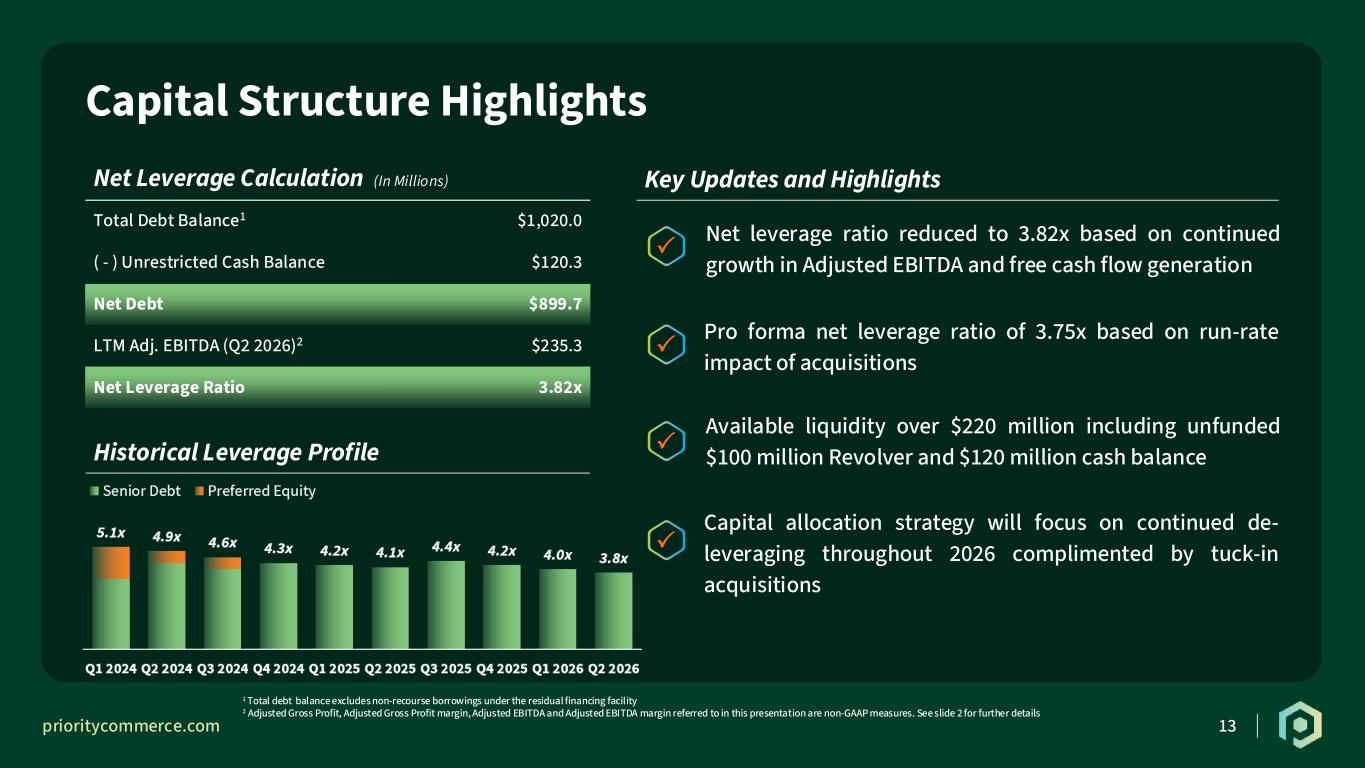
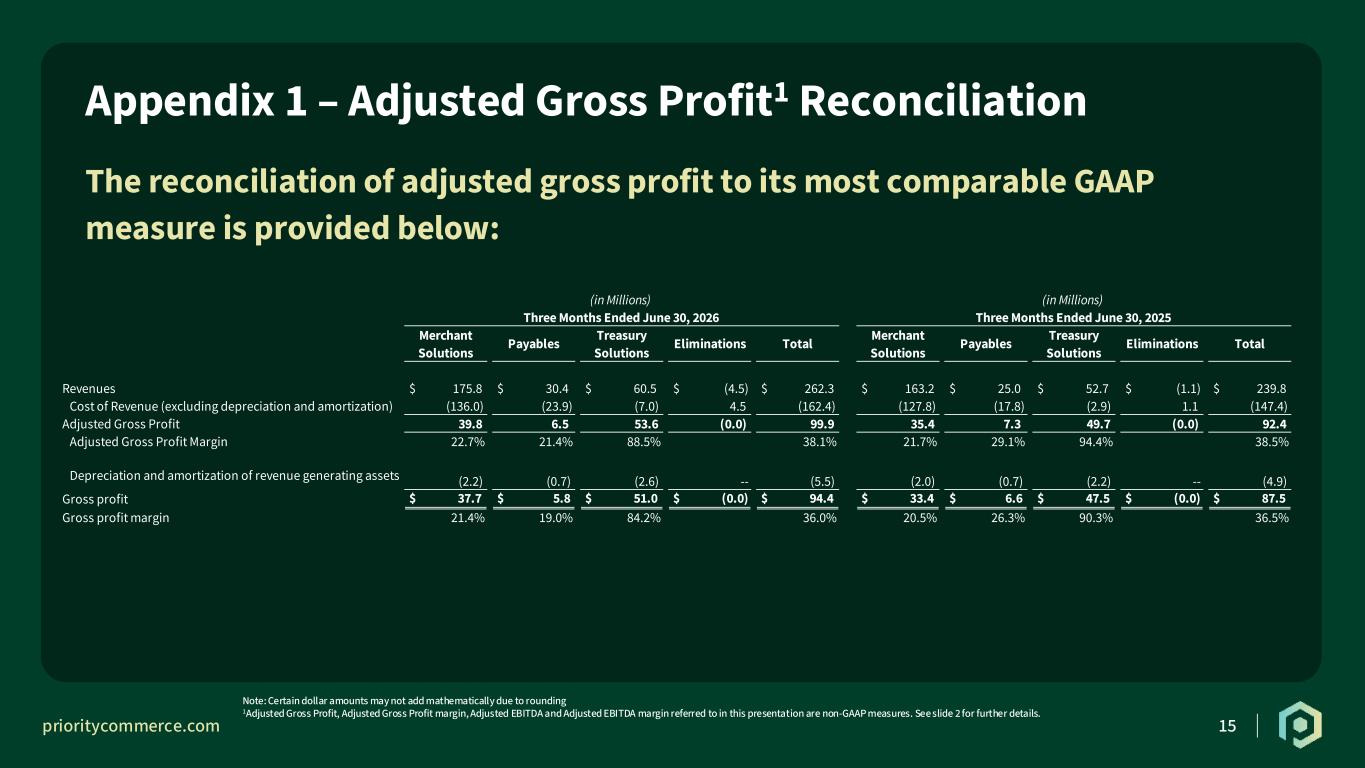
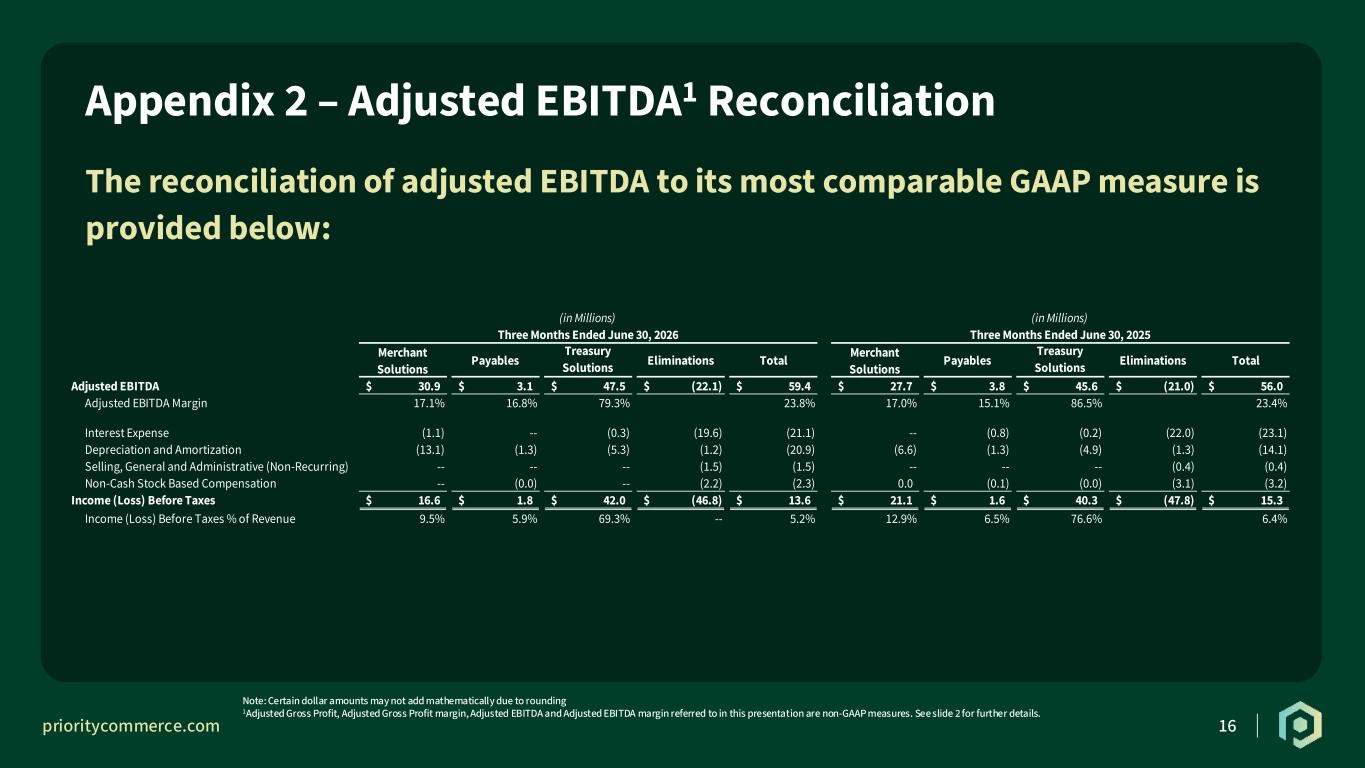
Thank you, Tom, and good morning, everyone. We had solid overall financial performance in the second quarter across each of our operating segments, which resulted in Q2 reported revenue growth of 9.4%, including organic growth of 7.2% on a consolidated basis. This growth was fueled by strong 21.6% growth in payables and 14.9% growth in Treasury solutions, complemented by 7.7% growth in merchant solutions, which included 4.5% organic growth. Strong continued growth in payables and Treasury solutions resulted in 66% of our total adjusted gross profit coming from those two segments when you compare to trailing fall-month results on an organic basis. Moving now to the segment-level results in more detail, I'll start with Merchant Solutions on slide nine. Merchant Solutions generated Q2 revenue of $175.8 million, which is $12.5 million, or 7.7% higher than last year's second quarter. Revenue growth was a mix of 4.5% organic growth, complemented by the boom in DMS acquisitions completed in the second half of 2025. As a reminder, and as we move into the back half of the year, we'll have partial third-quarter impact from Boom, which closed on August 18th last year, and Q4 will then provide a clean year-over-year comparison as the DMS acquisition closed on October 1st of last year. Total card volume in Merchant Solutions was $19.5 billion for the quarter, which is up 3.6% from the prior year. Within that aggregate volume, we saw overall strength in wholesale trade and retail, but it was a mixed bag within the broader retail category as convenience stores, gas stations, and food stores were up, while home furnishings and building materials were down. We also continued to see some softness in construction and restaurants, which improved from Q1, but were down on a year-over-year basis. Adjusted gross profit for the second quarter was $39.8 million, which is up $4.4 million, or 12.4% from Q2 of last year. Gross margins of 22.7% are over 100 basis points higher than the comparable quarter last year due to the boom in DMS acquisitions, partially offset by the impact of higher residual expenses in the portfolio. Lastly, adjusted EBITDA was $30.9 million, which is up $3.1 million, or 11.3% compared to last year. Moving to the payable segment, revenue of $30.4 million was 21.6% higher than Q2 of last Buyer-funded revenues grew 26.3% year-over-year to $25.3 million, while supplier-funded revenues grew 2.6% year-over-year to $5.1 million. Adjusted gross profit was $6.5 million in the quarter, which is a 10.4% decrease from the prior year. For the quarter, gross margins were 21.4%, which is down 760 basis points compared to last year's second quarter. The decline is the result of larger enterprise-level customers operating at lower overall initial margin profiles, increased card network and interchange expenses, and continued shift in revenue mix with buyer-funded revenues reported at lower gross margins, given gap requirements to recognize revenue on a gross versus net basis. The payable segment contributed $3.1 million of adjusted EBDA during the quarter, which is a $660,000, or 17.5% decrease in last year. Operating expenses before D&A were down slightly in the quarter compared to last year, with the decline in adjusted EBITDA resulting from the lower gross margin in the buyer-funded business unit. Moving to the Treasury solution segment, Q2 revenue of $60.5 million was an increase of $7.9 million, or 14.9%, over the prior year second quarter. Revenue growth was driven by slower but stable new enrollment trends in CFT pay and a 15% increase in the number of billed clients to over 1.1 million combined with a 30% year-over-year increase in the number of integrated partners along with organic growth from existing Passport program managers. Higher account balances in both CFT pay and Passport were able to more than offset the impact of lower interest rates in the quarter compared to Q2 of last year. As a result of those factors, adjusted gross profit for the segment increased by 7.7% to 53.6 million, while adjusted gross profit margins were 88.5% for the quarter. Gross margins were approximately 590 basis points lower than the prior year second quarter due to continued mix shift resulting from over 125% revenue growth in Passport and almost 400% revenue growth in Priority Tech Ventures, both of which operate at lower gross margins than the CFT Pay platform, where margins have remained very stable. Adjusted EBITDA for the quarter was $47.5 million, an increase of $2 million, or 4.3% year-over-year, as high single-digit growth in CFT Pay was partially offset by investments we continue to make in newer vertical software assets within Priority Tech Ventures. Moving to consolidated operating expenses, salaries and benefits of 29.1 million increased by 2.1 million, or 7.7%, compared to Q2 of last year, and was up slightly on a sequential basis compared to Q1. The year-over-year increase was primarily driven by an increase in acquisition-related headcount additions. SG&A of 16.8 million increased by 2.9 million, or 20.8%, compared to Q2 of last year, and was down sequentially compared to Q1. The year-over-year increase was because of higher cloud and software expenses, an increase in marketing spend, and certain non-recurring legal and transaction-related expenses. Depreciation and amortization was higher this quarter related to the accelerated depreciation of certain DMS assets. Going forward, we expect quarterly DNA to return to more normalized levels. With respect to our capital structure on page 13, debt at the end of the quarter remained at $1.02 billion, and we ended the quarter with over $220 million of available liquidity, including all $100 million of borrowing capacity available under our revolving credit facility, and $120.3 million of cash on the balance sheet. With respect to free cash flow, we generated $27.4 million of free cash flow in the quarter, based on adjusted EBITDA of $59.4 million, less $7.1 million of CapEx, $21.1 million of interest expense, and $3.8 million of income taxes. For the LTM period into June 30th, adjusted EBITDA of $235.3 million combined with net debt of $899.7 million resulted in net leverage of 3.8 times a quarter end, which is down from four times at the end of Q1. For further comparison, if you were to include the run rate impact of acquisitions, pro-forma net leverage would have been 3.75 times at quarter end. From a capital allocation standpoint, we will focus on continued deleveraging throughout the balance of 2026, but we'll also continue to evaluate tuck-in acquisitions in attractive verticals or new markets. The last topic I'll address before turning it back over to Tom relates to our financial guidance for the full year. Based on strong revenue trends in the first half of the year and visibility into favorable trends continuing in the second half of the year, we're maintaining our revenue guidance range of $1.01 to $1.04 billion and expect to be at the higher end of that range. As noted earlier, we are seeing some margin pressures across all three operating segments related to business mix, higher residual expenses, increased card network and interchange expenses, and continued investments in new vertical software assets and priority tech Ventures. Considering these factors in tandem with strong revenue expectations, we are maintaining our forecasted gross profit range of $405 to $425 million and our adjusted EBITDA range of $230 to $245 million, and we expect to be at the lower end of those respective ranges. As we move through Q3 and have enhanced visibility into our full-year results, we will provide further guidance on our Q3 earnings call. With that, I'll now turn the call back over to Tom for his closing comments.
Thank you, Tim. Before concluding, I wanted to reflect on observations we shared during our Q4 2025 earnings call. During it, I noted our continued focus toward optimizing the Priority Commerce Engine and API as a foundational moat, purpose-built to operate core payments and financial workflow applications in our key industry verticals. Leveraging our commerce engine for payments and treasury solutions, we can deliver one view of a business's financial environment with total command of their cash flow. Customers can see all modalities of payments reconciled in a single view and utilize sophisticated banking and treasury tools to optimize their working capital without the responsibilities of managing compliance, regulations, or risk. We continue to build out the surface layers for these key verticals and are seeing the success of this focus. As just a few examples, Priority Commerce Sports continues to accelerate. We recently announced the Pittsburgh Steelers as our first NFL franchise, and Texas Rangers in Major League Baseball, with others across all five major sports leagues waiting in the wings to go live. In a recent press release, Doug Stuber, Vice President of Finance for the Pittsburgh Steelers, summarized how our commerce platform is serving the changing expectations of finance teams in sports for more connected financial operations. He noted Priority Commerce offered the combination of payments technology and passport treasury orchestration and collaborative approach we were looking for, making them the clear choice. As another example, Priority Commerce Automotive is now the endorsed partner by 19 state automotive dealership associations, with Florida and California recently announcing their support. Additional enterprise wins we've gathered in areas like hospitality and healthcare reinforce our belief in the appeal of our connected payments and treasury capabilities to solve operational pain points and deliver new revenue opportunities to our customers. And needless to say, executing our vision for the future of commerce cannot be manifested without the focused execution of my colleagues at Priority, who continue to work incredibly hard to deliver results. Your commitment and dedication to continuous improvement is providing our partners and customers with a consistent reminder that they made the right choice to partner with Priority. Last, we continue to appreciate the ongoing support of our investors and analysts, and for those in attendance who are new to Priority for taking the time to participate in today's call. Operator, we'd like to now open the call for questions.
Operator
Thank you. We will now begin the question and answer session. To ask a question, you may press star then 1 on your touch zone phone. If you're using a speakerphone, please pick up your handset before pressing the keys. To withdraw your question, please press star then 2. At this time, we'll pause momentarily to assemble a roster.
Operator
And our first question comes from Wasu Goval from KBW.
Operator
Please go ahead.
Hi, thank you for taking my question. I guess I wanted to ask about the gross margin pressure that you talked about, particularly in the payables and treasury solutions, where it seems to be a little bit more intense. If you just pull up and look out into the medium term, how should we expect those gross margins to evolve as these businesses scale more?
Hi, Vasu. Thanks for the question. If you think about this quarter, the payables pressure we saw was really a combination of two factors. First and foremost was mixed shift, as we continue to see much higher growth from the buyer-funded revenue stream, which, as I noted, comes in at lower gross margins given the gross reporting requirement we have from a GAAP revenue standpoint. So that's going to automatically put some pressure on margins given that reporting format. And then we also had a number of large enterprise customers where, as we've talked about historically the last several quarters, we're seeing success going up market into larger enterprise customers. Some of those are coming on at lower initial margins. We're looking at those as opportunities where those customers have a lot of other needs. So beyond just the payables components, it's working with them on banking and treasury and adding other services into there and expanding the margins. So that process is still ongoing. So we're optimistic we'll see some margin stabilization there as we continue to see higher growth in payables. and buyer-funded revenues, pushing margins down, being offset by a combination of cross-sell opportunities into some of those similar customers. On the Treasury side, it's going to continue to see margin compression naturally as the CFTPay platform has been very stable from a gross margin standpoint. It's really a growth factor with the other Treasury solutions expanding at triple-digit growth rates, and those are operating at meaningfully lower gross margins. Those margins are more in the 30% to 40% gross margin range. So as those businesses continue to trend on a very favorable growth note, we'll see natural margin compression in the Treasury business. So I think over time, you'll see that business get closer to 80% gross margins, but that's going to be on the success of what we're seeing in priority tech ventures and fast forward.
Great. That's super helpful. And then if I may ask one on just the merchant acquiring business, as we think about the second half, I know you'd started to see some macro headwinds in the back part of last year. So as we begin to lap those, should we expect some acceleration in growth there? And then any way to quantify how much macro is still weighing on the growth, I guess, in that business today?
I think we saw certainly a macro slowdown last year in the back half where organic growth was down in the, you know, the 3% range. You know, this quarter we're 4.5% organic growth. So, you know, we continue to execute, you know, in that market. We'll see some natural organic pressure or overall pressure in Q4, right, as we anniversary the acquisitions from last year. But we're still, you know, very much on track towards our full year guide there, right? We had mentioned, you know, 6% to 9% overall growth. I'm sorry, 6% to 8% growth in merchants with 3% to 4% organic, we feel like we're running well on track for that on the organic side. And even if you just took the Q2 revenue numbers and repeated that in Q3 and Q4, we'll be well within the revenue guide for merchant solutions.
Thank you very much, and I'll hop back in queue.
Just one other point I just want to note that we didn't speak to is the I know you watch this very closely, but Masterfront and Visa did push through some price increases at the interchange level, and those just occurred last quarter. So there's some reconciliation of those, how we may treat those from a pricing standpoint that I think will factor into the second half of the year. But that was a source of pressure on margins. You know, cost of goods sold just went up because of interchange increases.
That makes sense. Thank you for the color.
Operator
And the next question comes from Hal Goach from B. Riley. Please go ahead.
Hey, guys. Just wanted to ask about the accounting change on the buyer-funded payables, supplier-funded payables. Is that a big driver? Is that a majority of the mixed shift in margins in that segment?
And to be clear, it's not a change in accounting. Ever since we acquired the plastic business, we've had to account for their revenue on a gross basis since we're the merchant of record. So we account for gross, and then our cost of sales there is interchange. So as that business becomes a more and more meaningful portion of payables on a revenue basis, it's going to run at lower margins because of that accounting aspect. And if you think about the revenue mix, The buyer-funded piece grew 26% this quarter and is becoming a majority of the revenue stream within payables. From a gross profit basis, those two businesses, buyer-funded and supplier-funded, are a little more even with each other because of the accounting nature, but the buyer-funded revenue stream is the vast majority on a revenue basis.
If you think about it, it's a little counterintuitive. We're kind of being punished, in a sense, margin-wise, for the growth of that business just because of the way the accounting works. So if you kind of drill it down, can we sell more buyer-funded, which I think this speaks to the agility of the solution that customers, customers, particularly upmarket customers, are looking to use card strategies as a source of working capital in ways that they may not have considered in the past and normally would look to a revolving credit line. And this is more efficient. So we're seeing the success of that narrative. And then coupled with that increase in buyer-funded utilization, MasterCard and Visa both pushed through cost increases in interchange. So, you know, there's some squeeze in the cost of goods sold as that's being utilized. And because of the fact of, you know, the accounting treatment that Tim mentioned, it's a bit of a double whammy.
Well, I'll tell you, on your merchant side, I mean, I think you're, you know, I don't know if you saw Global Payments, you know, it's breaking out by segment. And I think your SMB performance is very comparable, if not better. I think that's a positive sign that you've got a solid business there in the SMB, which you often forget about, given the growth in payables in Treasury.
Thank you. and the next question comes from jacob stefan from lake street capital markets please go ahead yeah hey guys um maybe just to start for me uh on the treasury margin uh you know just 800 basis points of compression year over year um i guess how much of that is is passport versus you know tech ventures or just kind of lower yields on deposits maybe if you could help break that out for us?
Operator
It's not lower rates in deposits.
We outgrew the lower rates this year compared to last year in Q2 with just deposit growth, and the CFT pay margins have remained very constant. So it's really a mixed shift with Passport and Priority Tech Ventures broadly, and they may move quarter to quarter based on some of the revenue mix within those businesses, whether it's, you know, transactional revenue or, you know, float revenue, but consider those as in the, you know, 30 to 40%, you know, gross margins. And, you know, Passport grew 125% year over year in the quarter, and Priority Tech Ventures revenue grew, you know, almost 400%. So as those businesses continue to become a more meaningful portion of the revenue and treasury solutions, you're going to see natural margin compression. But we actually view that as a as a positive thing over time, because that just means we're having success, you know, with those other treasury solutions outside of just the core CFTPay platform.
Got it. Very helpful. Maybe just touching on CFTPay then, you know, average monthly enrollments were down year over year, but, you know, your average build clients grew pretty nicely. I guess, when does that kind of enrollment trend start to ultimately show up in the treasury segment?
I think it's a macro environment component now as we think about our partners from a referral standpoint and how they see the environment and where they want to invest dollars from a marketing standpoint to capture new enrollments. So they're always going to look at their customer acquisition costs and whether they're getting a return on that marketing spend. In this macro environment, they've pulled back a little bit on the marketing spend and they've seen a little bit slower enrollments. So it's a combination of that macro environment, and then we continue to look at adding new partners to the platform. We already have large market share in that arena, so it's a very sticky business, as we've talked about in the past. So it's tough to win new customers. It's also very difficult to lose customers. So you're not going to see a lot of shift from a partner standpoint, and it's really the macro environment that's controlling the new enrollment growth right now. But, you know, we continue to see, you know, strong performance there. Obviously, bill clients continues to grow, which is a, you know, larger driver of revenue for us than the new enrollments. And then we're also, you know, managing interest rates, you know, very effectively with our strategies around that.
Got it. I appreciate all the color.
Operator
Again, if you have a question, please press star, then one. And our next question comes from Brian Bergen from Cowan. Please go ahead.
Hey, guys. Good morning. Thank you. So on profitability, maybe I'll ask this a different way on the margin. So if you step back at a high level, are you able to bucket perhaps temporary costs versus costs that hang around in the structural run rate? I get the mixed dependent factors that are going to influence gross margin and payables and treasuries. But putting that aside, what would you say are temporary headwinds or investment step ups? I heard things like tech, marketing, the network costs that you're going to have to laugh for a bit. But if we try to simplify all this, is there a way to summarize how those short-term versus lasting factors in total will move forward as we think about EBITDA margin?
Yes, I think the EBITDA margins are probably less impacted than what we've talked about. So most of what we've discussed with the mix, some of the incremental costs we've seen from the card network and interchange changes, that's all hitting at the gross margin level. So if you look at flow-through from gross to adjusted EBITDA, it's been pretty consistent. We've managed expenses extremely well. So we do have some one-time items in the first half of the year, whether it's related to the special committee or some of the increased public cloud expenses. But that was less of a factor overall. It's really the gross margin item, which some of those are going to be recurring items as we continue to invest. And where you're going to see a change over time is using the real estate that we've collected with some of these larger enterprise customers to ultimately drive margins with continuing to cross-sell and having those same clients be on banking and treasury, or if they're on banking and treasury or acquiring now, having payables be the cross-sell opportunity. So it's using the platform to its fullest extent with those large enterprise customers that's going to be the driver of margins.
Understood. On merchant solutions, so I know that the 8% revenue growth in 2Q benefited from roughly 350 bps from acquisition. I know 3Q still has a partial contribution from boom. Can you just maybe help quantify what that might be remaining? And as we think forward, is the current mid-single-digit organic growth rate a reasonable run rate for merchant?
We believe it is. We're continuing to see success there. So we do think that that mid-single-digit, I think we initially guided a 3% to 4% organic growth. I think that's still the appropriate level to think about longer term for that business. And from a margin standpoint, you know, we think we're going to be relatively consistent from where we sit today, you know, through the balance of the year as you think about the margin profile in merchant.
Brian, the other thing I would just call out, just, you know, transparent about some of the partnerships that we're building out, right? They're just, you know, they're larger in nature, right? Signing up, Pittsburgh Steelers, attaching to, you know, high-volume ticketing and, you know, other activities in stadiums. So, you know, our goal is to continue with that success. You'll, you know, you're going to see it impact, you know, our revenue growth rate. We'll keep a lookout for new logos, and you'll have a real good set.
Okay. Yeah, that's a good point. You had some nice wins there. My last kind of question or maybe statement is obviously on the unresolved special committee assessment. I understand you can't say much, but this is clearly overhanging fundamental performance. And I guess the question or unknown is whether there's particular milestones the board is assessing or some time frame by which this is meant to be completed by. Because obviously until something changes there, it seems to preclude share movement. And this is effectively one of the only things that current investors are keyed in on.
Operator
So certainly a consideration for the board here. Thanks, guys.
Operator
This concludes our question and answer session. I would like to turn the conference back over to Tom Priori for any closing remarks.
Well, Tim and I just want to thank everyone for your participation in today's call. And hopefully the results continue to reflect, you know, sustained focus on execution. And we'll look forward to reporting back again in the near future.
Operator
The conference has now concluded. Thank you for attending today's presentation. You may now disconnect.