Operator
Stand by. Your meeting is about to begin. Good afternoon, ladies and gentlemen. Welcome to the TransCat third quarter fiscal year 2026 financial results conference call. As a reminder, today's conference is being recorded. It is now my pleasure to introduce your host for today, Mr. John Howe, Senior Director of Financial Planning and Analysis. Please go ahead, sir.
Thank you, operator, and good afternoon, everyone. We appreciate your time and your interest in TransCAD. With me here on the call today is our President and CEO, Lee Rudeau, and our Chief Financial Officer, Tom Barbato. We will begin the call with some prepared remarks, and then we will open the call for questions. Our earnings release crossed the wire after markets closed this afternoon. Both the earnings release and the slides that we will reference during our prepared remarks can be found on our website, TransCat.com, in the investor relations section. If you would, please refer to slide two. As you are aware, we may make forward-looking statements during the formal presentation and Q&A portion of this teleconference. These statements apply to future events, which are subject to risks and uncertainties, as well as other factors that could cause the actual results to differ materially from where we are today. These factors are outlined in the news release as well as in the documents filed by the company with the SEC. You can find those on our website where we regularly post information about the company as well as on the SEC's website at sec.gov. We undertake no obligation to publicly update or correct any of the forward-looking statements contained in this call, whether as a result of new information, future events, or otherwise, except is required by law please review our forward-looking statements in conjunction with these precautionary factors additionally during today's call we will discuss certain non-gap measures which we believe will be useful in evaluating our performance you should not consider the presentation of this additional information in isolation or as a substitute for results prepared in accordance with gap we've provided reconciliations of non-gap to compare gap measures in the tables accompanying the earnings release. With that, I'll turn the call over to Lou.
Okay. Thank you, John. Good morning, everyone. We appreciate you joining us on the call today. Transcat delivered strong performance across our entire business portfolio in the third Consolidated revenue was up 26% to $83.9 million, driven by double-digit revenue growth in both our distribution and service segments. Our organic service growth returned to more historic levels, growing 7%. Consolidated gross profit grew 28%, and gross margins expanded 60 basis points. Adjusted EBITDA grew $2.2 million, or 27.2% in the quarter, to $10.1 million. Our strong third quarter financial results were driven by four key factors. One, strong demand for our core calibration services in the highly regulated end markets we serve, including life science, aerospace and defense, and energy. Two, our unique value proposition and differentiated brand. Three, significant growth and positive mix change in our instrument rental channel. And four, the strong performance by both our recently acquired companies, Martin Calibration and ESCO Calibration. The acquisitions expand TransCAD's geographic footprint and technical capabilities. We're working very closely with both companies to accelerate the capture of both sales and cost synergies. I want to take a moment and thank our entire TransCAD team for their ability to execute well and drive meaningful growth despite what continues to be an uncertain geopolitical and policy environment. They're an impressive group. Turning to our service results in the third quarter, as I mentioned, organic growth grew 7% and contributed to an overall growth in our service segment of 29%. The quarter marked our 67th straight quarter of year-over-year growth, almost 17 years. As we anticipated, and despite a fair amount of continued economic uncertainty, realization of service orders that were delayed in the first two quarters of our fiscal year began to trend positive in the third quarter. The trend was most evident in the highly regulated life science space and the airspace and defense markets. Demand for transcat services remained high, and we expect the growth momentum established in the third quarter to continue through the fourth quarter as we close out our fiscal Service margins declined in the third quarter, but that is not uncommon in periods when we are onboarding elevated levels of new customers. Depending on the size and complexity of the new business, as we've seen in the past, we would expect productivity and cost to normalize over time. Overall, the service segment continues to have a substantial runway ahead for growth, both organically and through acquisition. So at the last 10 plus years, we've demonstrated our ability to identify, acquire, integrate, and synergistically grow accretive acquisitions. This will continue to be an important element of our go forward growth strategy. Turning to distribution in the third quarter, distribution revenue grew 20% from high demand in both rentals and product sales. Gross margin expanded 330 basis points versus prior year, driven primarily by an increase in the mix of higher margin rental revenue within the distribution segment. With that, I'll turn things over to Tom for a more detailed look at our third quarter financial results.
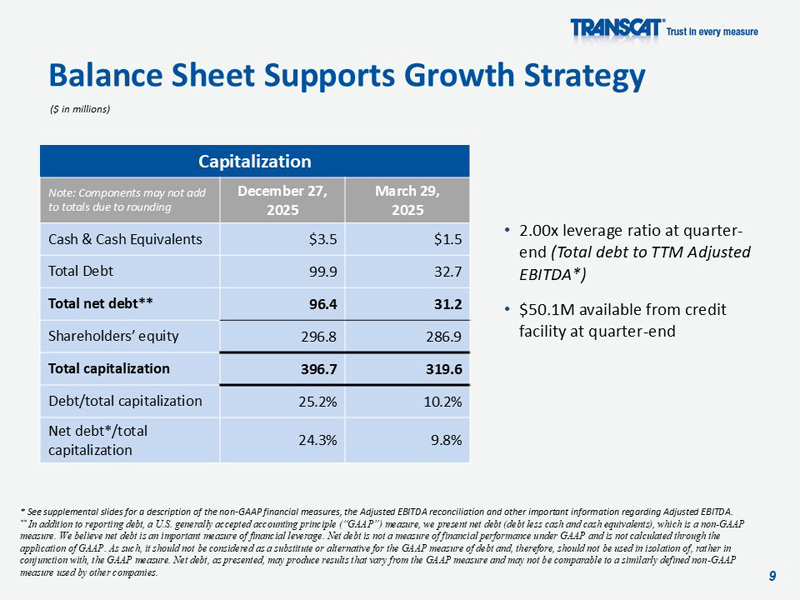
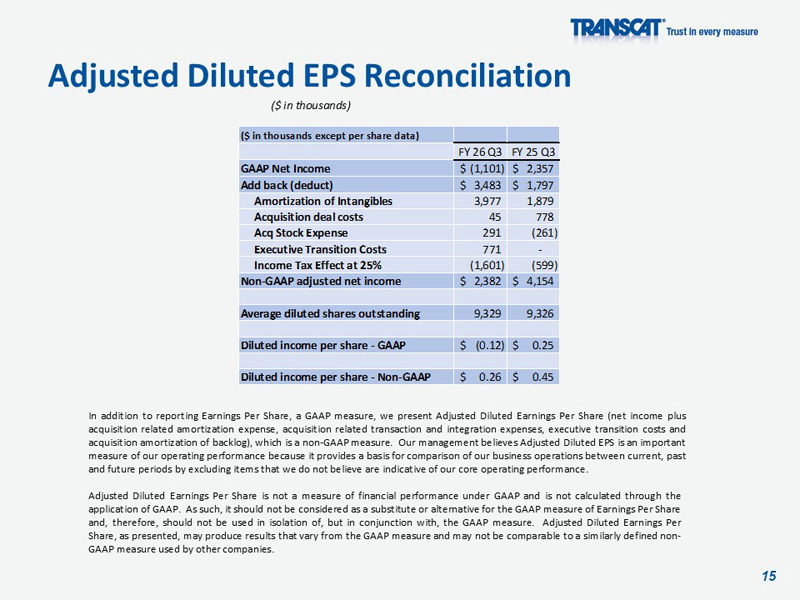
Thanks, Lee. I'll start on slide four, the earnings act, which provides detail regarding our revenue on a consolidated basis and by segment for the third quarter of fiscal 2026. Third quarter consolidated revenue of $83.9 million was up 26% versus the prior year, and full segments grew double digits. Looking at it by segments, service revenue grew 29%, with organic revenue growth of 7%, and the balance of the growth the result of the Martin Calibration and ESCO Calibration acquisitions. Turning to distribution, revenue of $30.2 million grew 20%, driven by strong performance in both traditional product sales and rentals. Turning to slide five, our consolidated gross profit for the second quarter of $25.3 million was up 28% from the prior year. Service gross profit increased 25% from the prior year. We continue to leverage higher levels of technician productivity in our differentiated value proposition, but service gross margins historically lag as we incur startup costs related to the onboarding and new customers. Distribution segment gross profit of $9.8 million was up 34% with 330 basis points gross margin expansion, driven by growth in the higher margin rental channel. Turning to slide six, Q3 net loss of $1.1 million decreased versus prior year, driven by higher amortization expense related to both the Martin and ESCO calibration acquisitions, the two largest in TransCAT's history, as well as higher levels of interest expense and one-time charges related to the execution of the CEO succession plan. Our search committee is evaluating both internal and external candidates for our next CEO, and the process is nearing completion. In addition, we report adjusted diluted earnings per share to normalize for the impact of upfront and ongoing acquisition-related costs, as well as costs that are not directly tied to ongoing operations. Q3 adjusted diluted earnings per share was $0.26. Flipping the slide 7 where we show our adjusted EBITDA and adjusted EBITDA margin. We use adjusted EBITDA which is non-GAAP to gauge the performance of our business because we believe it is the best measure of our operating performance and ability to generate cash. As we continue to execute on our acquisition strategy, this metric becomes even more important to highlight, as it does adjust for one-time deal-related transaction costs, as well as increased levels of non-cash expenses that will hit our income statement from acquisition purchase accounting. Third quarter consolidated adjusted EBITDA of $10.1 million increased 27% from the same quarter in the prior year, with 10 basis points of margin expansion. As always, a reconciliation of adjusted EBITDA to operating income and net income could be found in the supplemental section of this presentation moving to slide eight operating cash flow was slightly lower versus prior year is net cash from operations increase but was offset by higher capital expenditures capex is in line with expectations and continues to be centered around service segment capabilities rental pool assets technology and future growth projects Slide 9 highlights our strong balance sheet. At quarter end, we had total debt of $99.9 million, $50.1 million available for borrowing under the secured revolving credit facility and a leverage ratio of 2x. The growth in adjusted EBITDA and associated margin enabled TransCAD to continue a sequential reduction in our leverage ratio. We believe we are well positioned to grow both organically and through acquisition. Lastly, our 10Q was filed today after the market closed. With that, I'll turn it back to you, Lee.
Thank you, Tom. In the third quarter, we returned to more historic organic service growth levels by achieving 7% growth, and we are off to a good start in the fourth quarter as we continue to experience an increased level of customer activity, strong retention, and realization of new business. For these reasons, we reaffirm our fourth quarter organic service revenue growth expectations to be in the high single digit range. As fiscal 2026 comes to a close, we anticipate our results for the year will once again be a testament to our resilience and our differentiated business model that is anchored by recurring revenue streams driven by both regulation and the high cost of failure. We maintain a strong and stable balance sheet that supports our demonstrated growth strategy, our ability to acquire and integrate companies that increase our geographic footprint and capabilities or just bolt on to existing infrastructure. This drives both consistent value and synergistic growth opportunities. We have a strong acquisition pipeline that will enable opportunities to expand our adjustable markets and increase market share. Over the past couple of years, we've invested in leadership, technology, and overall process improvement. We are well positioned to the age of AI as our data sets are much improved and already contributing to incremental business insights that make TransCat a very difficult company to compete with. We believe our investments are and will continue to drive differentiation for TransCat and can foster our ability to continue to generate sustainable long-term value for our shareholders. With that, operator, we can open the line for questions.
Operator
Ladies and gentlemen, at this time, if you do have any questions, please press star one at this time. If you find your question has been addressed, you may remove yourself from the queue by pressing star two. Once again, that's star one for questions. We go first this afternoon to Greg Palm of Craig Hallam. Greg, please go ahead. Your line is open.
Yeah, thanks. Congrats on getting back to that high single-digit revenue growth in the quarter for service segment. You know, maybe starting there, it would be nice if you could just maybe sort of bucket out the various drivers that enabled you to return to that growth. It sounded like it was, you know, just sort of a ramp-up of everything you've been talking about, but I'm not sure if there was anything specific you wanted to highlight.
No, Greg, I mean, I think as we talked about in the past, you know, we, some of these decisions have been delayed. You know, we had kind of coming into the quarter, you know, we had, you know, some income paper in some cases, and we knew that those would ramp throughout the quarter. There were other deals we anticipated would come to fruition, and they did. So, you know, we feel good about the performance.
I think we did what we said. you know we were going to do and you know we expect as Lee mentioned in his prepared remarks you know that'll continue into in the Q4 okay and you know these startup costs which I know you've incurred in the past so that's that's nothing new but are you able to quantify you know how big of a headwind that was I don't know if it was related to you know CBL specifically or something different and just from a you know a timeline or what we should expect in the near term when when does all that stuff start to normalize or I guess when does the the new business winds you know fall off and those just become
normalized going forward yeah I mean we're not you know we're not talking you know huge dollars I would just say you know you could do some simple math and look at the difference between where we were and you know if we were if we were flat or slightly accretive from a from a margin standpoint right it's not huge numbers but it's just the reality of onboarding you know new customers and you know that for us the most important thing is to make sure that as we you know start these new partnerships that we get off to a good start we're doing things right we're we're treating the customers right and we're doing everything we can to you know start a start a good relationship and and you You know, there's – in often cases, there's a reason why, you know, these customers are moving to Transcap, right? They want things done right. They want things done with a higher level of quality, and that's our focus in making sure we get off to the right start.
And, Greg, I would add to that, you know, the way we view some of these large customers and really all of our customers, some of them have a real high lifetime value. And so making sure they get off to the right start is a priority for us. And sometimes there's some costs associated with that that just go away over a couple quarters. And you mentioned CBLs. We saw that in the past, right? So this is not dissimilar.
Okay. And then, you know, lastly, distribution, you know, was another obviously really strong quarter of revenue growth.
Can you maybe talk to us a little bit about what you're doing there in the AI, you know, the data center slash power gen markets? and then just broadly speaking is there a longer term opportunity on the calibration services you know segment you know again longer term yeah I mean you know I think what are we doing I mean we're I think we're executing very well on the distribution side both on the traditional you know equipment sale side as well as rentals and as we've talked about also you know we made a conscious effort 18 or 24 months ago to to really invest fairly heavily in rentals for products used in I'll just say the power generation power conditioning power management space which you know aligns very well not only with data centers but you know EV charging needs and that sort of thing and it's really you know serving as well I think you know from a product sales standpoint we're positioned well to support those same end markets and and there absolutely are you know recurring calibration opportunities that that you know are and will continue to come along you know with with those end markets so I think it's a you know an area where we're excited for I mean it's a yeah I mean you read about it every day in the news right so I think the fact that we've We've got alignment, and we're kind of going aggressively after the business is an opportunity for us.
Okay. All right. Appreciate the caller. Thanks. Thank you, Greg.
Operator
Thank you. We go next now to Max Michaelis at Lake Street Capital Markets. Max, please go ahead. Your line is open.
Hey, guys. Thanks for taking my question. I want to go back to the service growth. Congratulations on returning to high single-digit growth at 7%. We look at Q4 2026, do you expect to see an acceleration thing to get better from the 7% or should we expect to kind of be in the same sort of range? And then when we think about beyond next quarter, how are the conversations been with customers around new business, I guess, going out into fiscal year 27?
Yeah, Max, it's Tom. So, I would just say that, you know, we're committed to the high single-digit guidance that we've provided for Q4. You know, I think when you look at Q4 and you look at, you know, last year was a really strong Q4 for us as well, right, so we're kind of building off a big number, right, and you know, we're comfortable in that high single-digit range. You know, when we look beyond Q4, you know, we're not getting any specific guidance at this point but you know I will we'll just say that you know our pipeline our new business pipeline continues to be you know strong and you know we like where we're positioned and you know we're we think we've got you know the pipeline to support you know continued growth going forward okay that makes sense and then I guess maybe around MA what are you seeing in the space and And maybe could we expect to see sort of, I guess, remind us where sort of the geographic
locations you guys are looking to get into and kind of maybe where you're at and sort of the progress there.
Yeah. So, the gaps that we always talk about, right, at this point there's four, you know, this time last year, 18 months ago, it would have been six, right? But we filled some of those holes. but Northern California is an area we want to be. Dallas, you know, we'd love to be in the Atlanta area, and then the Mid-Atlantic, you know, kind of Baltimore area is a void for us. We're able to service it from other, you know, locations, but there's enough business there that, you know, we'd like to physically be there. And then, you know, there's, you know, when we talk about other, you know there's other opportunities to you know follow our customers right and we're always looking at that and whether it's you know you know potentially you know we've we've we've recently expanded our presence in Ireland right and that's going you know very well for us you know there could be other you know potential opportunities you know in Europe there could be other potential opportunities as an example in North America or Central America to, you know, just make sure that, you know, we're properly servicing and we have the locations of service our existing customer base properly.
And then just the last one for me is around gross margin. I know you mentioned in the last question about sort of costs and something you've dealt with in the past. But if we look at next quarter, and I know you're taking on a lot of new business, Is some of the costs you incurred this quarter in sort of preparation for the new business in the next quarter, we're going to see similar gross margins probably from the service segment next quarter.
Yeah. I mean, I'll just say that our gross margins in Q4 are always the highest margins of the year, right? So as an example, last year in Q4, we were at 36.2%, you know, margins. But, you know, I would say that, you know, we incurred, you know, startup costs, you know, this quarter related to, you know, the revenue increase. I think, you know, there'll be new customers that are on board next quarter. But as we kind of said in our prepared remarks, right, I mean, that'll normalize. It's not – we're not talking years out, right? We're talking, you know, normalizing over the next, you know, few quarters and seeing margin expansion.
Operator
Thank you. Just a quick reminder, ladies and gentlemen, Star 1, please, for questions today. We go next now to Ted Jackson of Northland. Ted, please go ahead.
Thanks very much, and I reiterate congratulations on the quarter.
I got two or three questions for you. I want to talk a little bit first about kind of the longer term and if you think about So going out a couple of years, there's, you know, a lot of shifts with regards to administration-driven spending. You know, so if you think about life sciences, which is your kind of your bread and butter, your core vertical, your favorite place to play, you know, and you look at a lot of efforts to drive pharmaceutical manufacturing in the United States, you know, you've seen, you Lilly is going to spend $30 billion to put manufacturing in Alabama, Pennsylvania, Texas, Virginia. AstraZeneca has pledged $50 billion. Amgen's talking about opening up new facilities in the Midwest and the Atlantic seaboard. When I hear all this kind of stuff, it seems to me that this is a really substantial amount of wind in your sails if you look out, say, five years and beyond. And so, I mean, like how would an investor over the long term think about this stuff? How do you guys think about it and kind of handicap it? And then like maybe in kind of perspective, and I know every manufacturing plant's different, but when you get into like a new plant, say, like in the Wall Street Journal last week, You know, one of the really plans was decided in terms of where it was going to be in Pennsylvania. You know, something like that when it's built, what's the revenue opportunity for a company like TransCat when it happens? That's my first question. And actually, since I've added, there's a similar, my second question really is the same thing, but just on defense, you know, it's a little less specific, but I mean, if you look at the defense spending, you know, I mean, they're talking about, you know, one $1.5 trillion of spending next year, and if you look at some of the major contractors like Lockheed and RTX and Northrop, I mean, they're talking about like 30% increases in their tap back. So, maybe a similar discussion with regards to aerospace and defense, that's my first Ted, this is Lee.
So, I'll take a shot at this and certainly Tom can fill in, but you're spot on. It's pretty simple for us. any on-shoring of manufacturing in the regulated business spaces is always going to be good for TransCAD. So AstraZeneca, of course, they're on our radar. You mentioned Lilly, they're on our radar. This is good for us. And to the degree that it comes true, comes to fruition, and then over the next couple of years, we'll be ready and we'll be working to gain that business, right? No question. And when you look at the life cycle of a project, a capital project, it kind of starts from the building of the actual physical plant all the way through to buying equipment, commissioning equipment, validating equipment, ultimately calibrating equipment for an upstart, and then calibrating equipment as time goes by on a regular basis. There's probably a half a dozen phases. TransCAD is capable of participating in most of those. Obviously, calibration is our bread and butter. We do commissioning and validation as well, and it's always on our radar to look for those opportunities. So, we'll call them capital projects. So, yes, we can participate. I think over time, as we expand our addressable market, we'll be able to participate even more, but it's right down our wheelhouse for most of that work, and it is on our radar, and onshore is good. As far as defense goes, same basic story there, right? A lot of the defense contractors like Lockheed have their own in-house calibration lab, And so, in that case, we'll do their overflow work, we could do their standards, and occasionally we actually do the work in any particular plant. But the more defense contracting work there is, the bigger the government gets from that perspective. That's a highly regulated space, which means it's a good space for TransCAP.
Yeah, and I think you specifically referenced their CapEx budgets and the increases in CapEx budgets. The more equipment that's out there, that's good for TransCAP, right? and you know the ultimate you know kind of brass ring for us is that recurring revenue right so you know we've got a broad we've got a broad offering the broadest in the industry right that allows us to participate in all of those you know aspects of a you know a new plant being built but the brass ring for us is clearly the recurring revenue streams and that's the calibration work that takes place there.
But like the bread and butter business that you guys operate in, I mean, you talk about it every quarter, 60 plus quarters of growth. You have been able to grow your business organically, for conversation's sake, we'll just call it 7%, for years, which just says your business grows at 7%. When you see this kind of stuff happening, does it make you recalibrate what you think if you could grow organically if it comes to pass? I mean, is there a case to be made that, you know, we get, you know, towards the end of the decade and, you know, the organic growth rate for TransCat might tick up because you're seeing all this investment and all the, you know, has, you know, like there's, I don't know, like a pig in the Python as these things are coming online?
Well, I mean, there's two ways I look at that. One is to say, you know, even over the past 10 years, and maybe we've averaged 8% growth over the last five there are quarters and there have been quarters when we have double-digit growth so that's not impossible for us to do that and you know i would expect that you're going to see that at different points we're comfortable in the high single-digit range because it just makes sense for us and that's where we are more consistently in that range than above that you know we have quarters when we're not when we don't meet our goals and remember also i mean We're a bigger company today. When we started 2011, I think we had $30 million of calibration, but today it's $230 million in that range. And so the number gets bigger, and obviously to grow on a larger base, a larger number is a challenge too. But I think Tom and I and the entire management team, when we look at our strategic planning, organic and inorganically, we're thinking to ourselves, we don't see a reason why we They can't, you know, get in the high similarities or range on a pretty darn consistent basis. So I think it includes all the variables that you're mentioning.
Okay. And then just my final question for you is just jumping over to the CEO search and you put a charge in it, you know, you're – could you just kind of, you know, is it fair to Do you expect to see the conclusion of your efforts during this quarter? Would we have some clarity by the time you report your fourth quarter?
I think that's a reasonable expectation.
And then what would there be, given the charge, which was a new line item within the pro forma earnings, will we see additional one-time expenses associated with that surge in the fourth quarter?
There will be some additional expenses in the fourth quarter, yes.
Okay. I'll let other people take over. Thanks very much for answering my questions. All right, Ted. Appreciate it.
Operator
Thank you. And gentlemen, it appears we have no further questions this afternoon.
I'd like to turn the conference back to you, Mr. Howe, for any closing or concluding remarks. thank you all for joining us for today's call we look forward to sharing more on our story at upcoming investor events including facility tours institutional investor conferences and non-deal road shows across key cities throughout the united states in the spring of 2026. if we were unable to answer any of your questions please reach out to our ir firm mz group who would be more than happy to assist thanks again for your interest Thank you, gentlemen.
Operator
Again, that will conclude today's TransCat third quarter fiscal year 2026 financial results call. Again, thank you so much for joining us, everyone. We wish you all a great day.