Operator
Welcome to Western Alliance Bank Corporation's fourth quarter and full year 2025 earnings call. You may also view the presentation today via webcast through the company's website at www.westernalliancebankcorporation.com. I would now like to turn the call over to Myles Pondelich, Director of Investor Relations and Corporate Development. Please go ahead.
Thank you. Welcome to Western Alliance Bank's fourth quarter 2025 conference call. Our speakers today are Ken Vecchione, President and Chief Executive Officer, and Vishal Adnani, Chief Financial Officer. Before I hand the call over to Ken, please note that today's presentation contains forward-looking statements which are subject to risks, uncertainties, and assumptions. Except if it's required by law, the company is not undertaking any obligation to update any forward-looking statements. For a more complete discussion of the risks and uncertainties that could cause actual results that differ materially from any forward-looking statements, please refer the company's SEC filings, including the Form 8-K filed yesterday, which are available on the company's website. Now, for opening remarks, I'd like to turn the call over to Ken Vecchione.
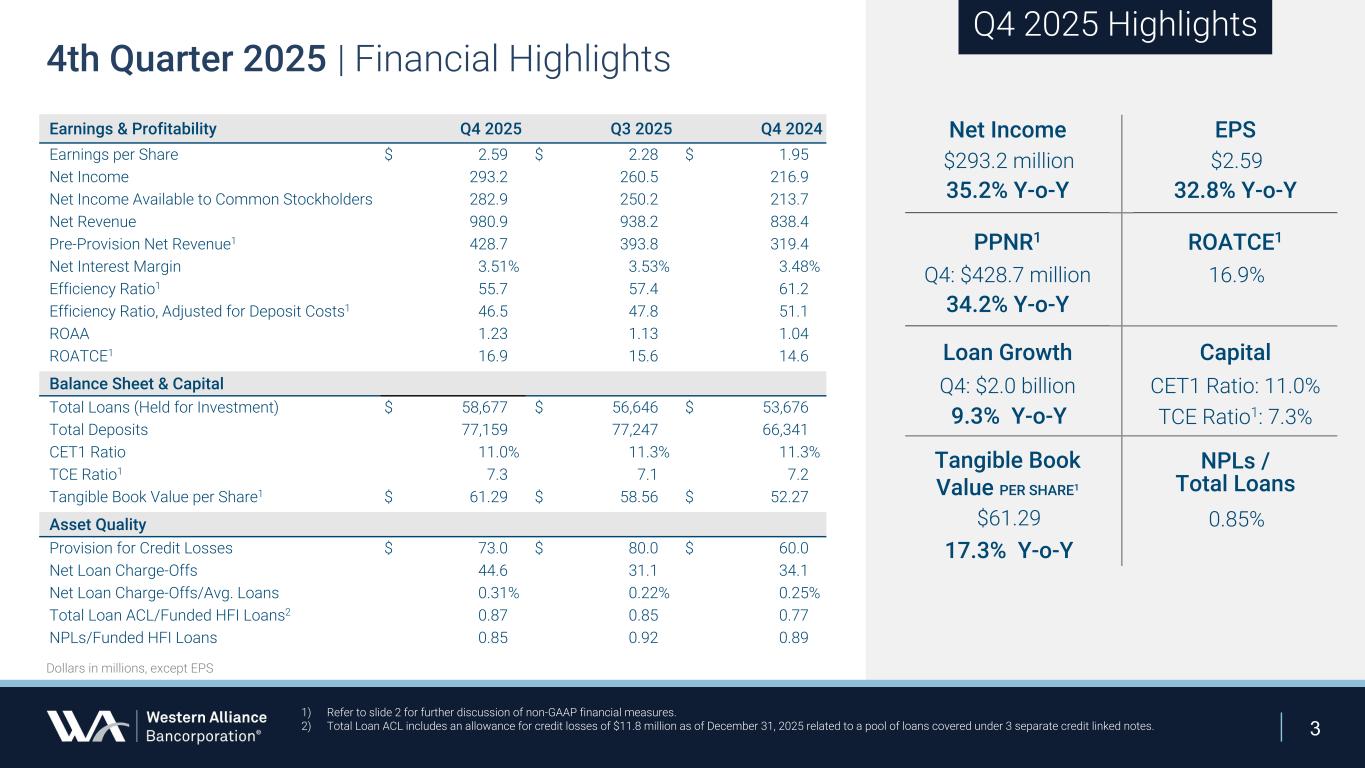
Thank you, Miles. Good afternoon, everyone. I'll make some brief comments about our fourth quarter and full year 2025 performance before handing the call over to our new Chief Financial Officer, Vishal Adani, to discuss our financial results and drivers in more detail. I'll then close our prepared remarks by reviewing our 2026 outlook. Dale Givens, now backed by popular demand, and our new Chief Banking Officer for Deposit Initiatives and Innovation, and Tim Bruckner, will join us for Q&A. Western Lines closed 2025 with strong momentum, delivering record quarterly financial results and broad-based performance across the franchise. We saw robust loan growth, reduced seasonal deposit outflows, positive net interest income trends, stable NIM, rising fee income, and continued expansion in PPNR, all while maintaining steady asset quality and demonstrating meaningful operating leverage. In the fourth quarter, net interest income, net revenue, and PPNR all reached record levels. EPS for the quarter was $2.59, up 33% from prior year. Return on average assets were 1.23%. Return on average Tangible Common Equity was 16.9%, and Tangible Book Value per Share rose 17% year-over-year to $61.29. For the full year, we generated diversified HFI loan growth of $5 billion, or 9% across regional banking and our specialized C&I verticals. Deposits increased $10.8 billion, or 16%, supported by strong regional banking inflows and approximately 40% growth in our specialty escrow businesses, which Dale is now leading. Manager's income rose 8.4% on a linked quarter annualized basis, driven by loan growth and higher average earning assets, and accompanied by a stable margin. We continue to build momentum in commercial banking fees. Cross-selling treasury management, commercial products, and digital escrow disbursement services drove a 77% increase in service charges and fees in 2025. Q4 mortgage banking revenues did not experience a large seasonal decline, and hence were only down $5 million compared to prior quarter. Our Juris Banking team delivered a standout quarter, completing the first round of more than 17 million digital payments in connection with the Facebook Cambridge Analytica Consumer data privacy settlement, the largest in U.S. history, demonstrating the power of our comprehensive disbursement platform. Mortgage banking fundamentals continue to firm and quarterly results exceeded expectations despite typical seasonal softness. We are constructive on this business heading into 2026 due to the current administration's focus on delivering affordable homeownership, potential capital relief on MSRs, and continued mortgage rate reductions, which point to a stronger results for this business. Operating leverage was a major theme in 2025, with net revenue growth outpacing non-interest expense growth by four times. Our multi-year investments to prepare for large financial institution status are serving us well, And even if the Category 4 threshold remains unchanged, we expect to cross $100 billion in assets by year-end 2026 without a notable step-up in expenses. Asset quality remains steady in Q4, with total criticized assets declining by $8 million and staying well below mid-year levels. We are working to proactively resolve non-accrual balances with meaningful improvement expected by the end of the second quarter. We expect net charge-offs to remain elevated in the first half of the year as we work through non-accrual loans with reserves adjusting modestly as our mix shifts towards higher return C&I growth. However, these actions reinforce the strength of our credit discipline and should enhance our powerful risk-adjusted earnings engine supported by an expanding revenue base and operating leverage. We are well-positioned for 2026 and excited about our organic growth opportunities. With that, Vishal will now walk you through our results in more detail.
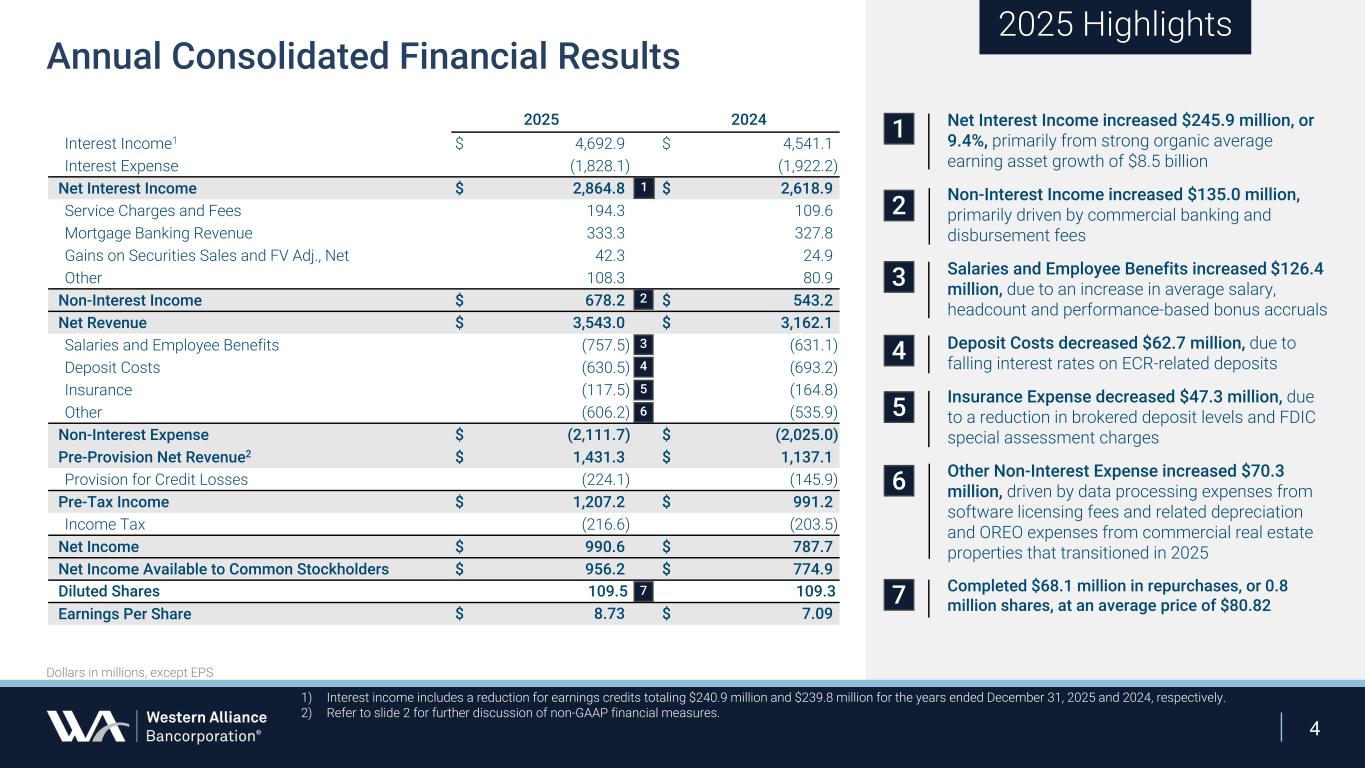
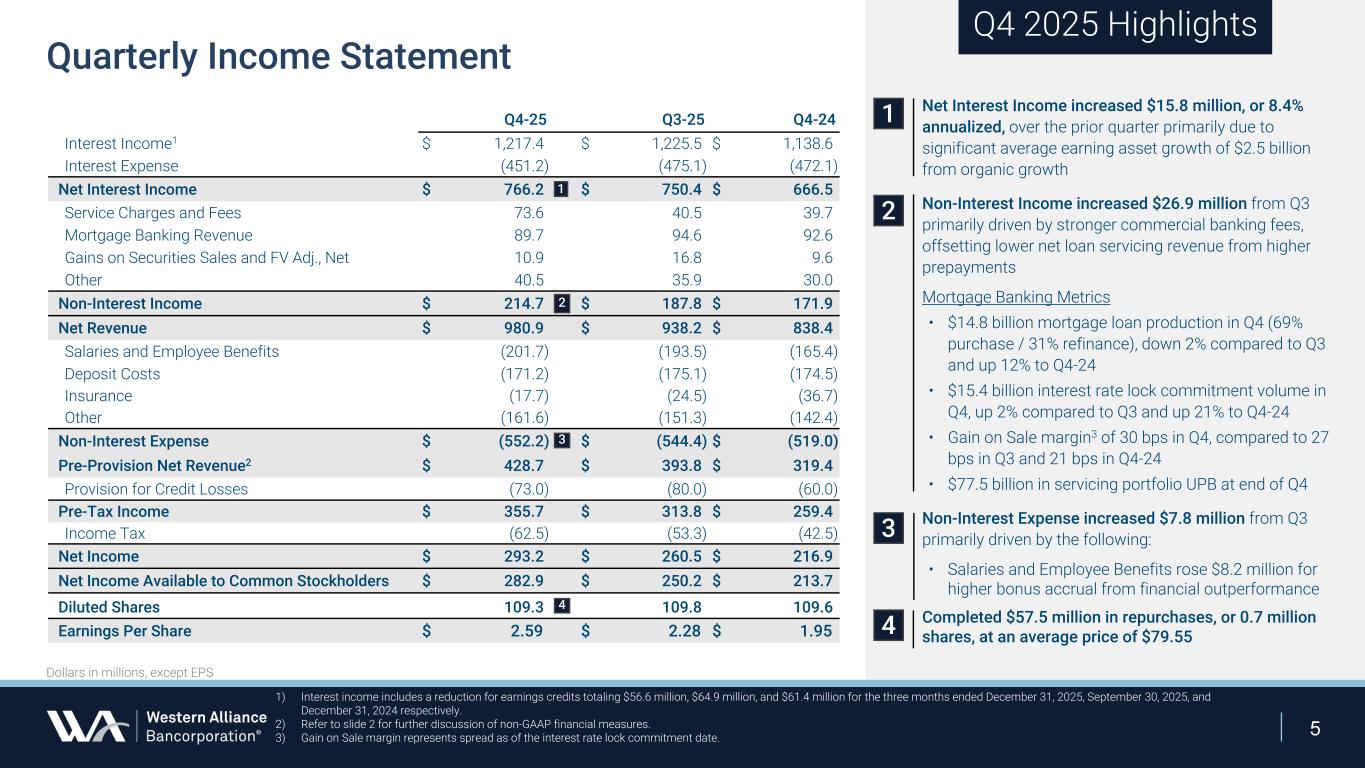
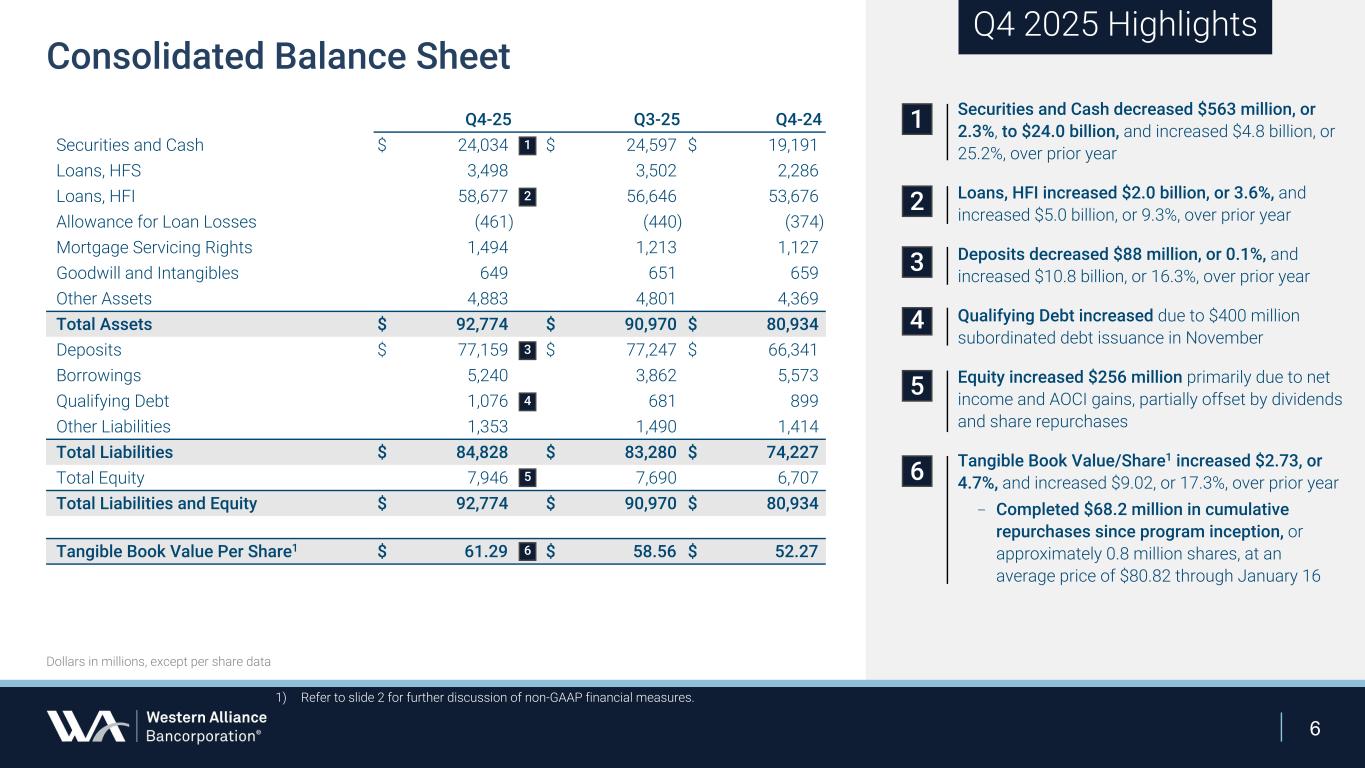
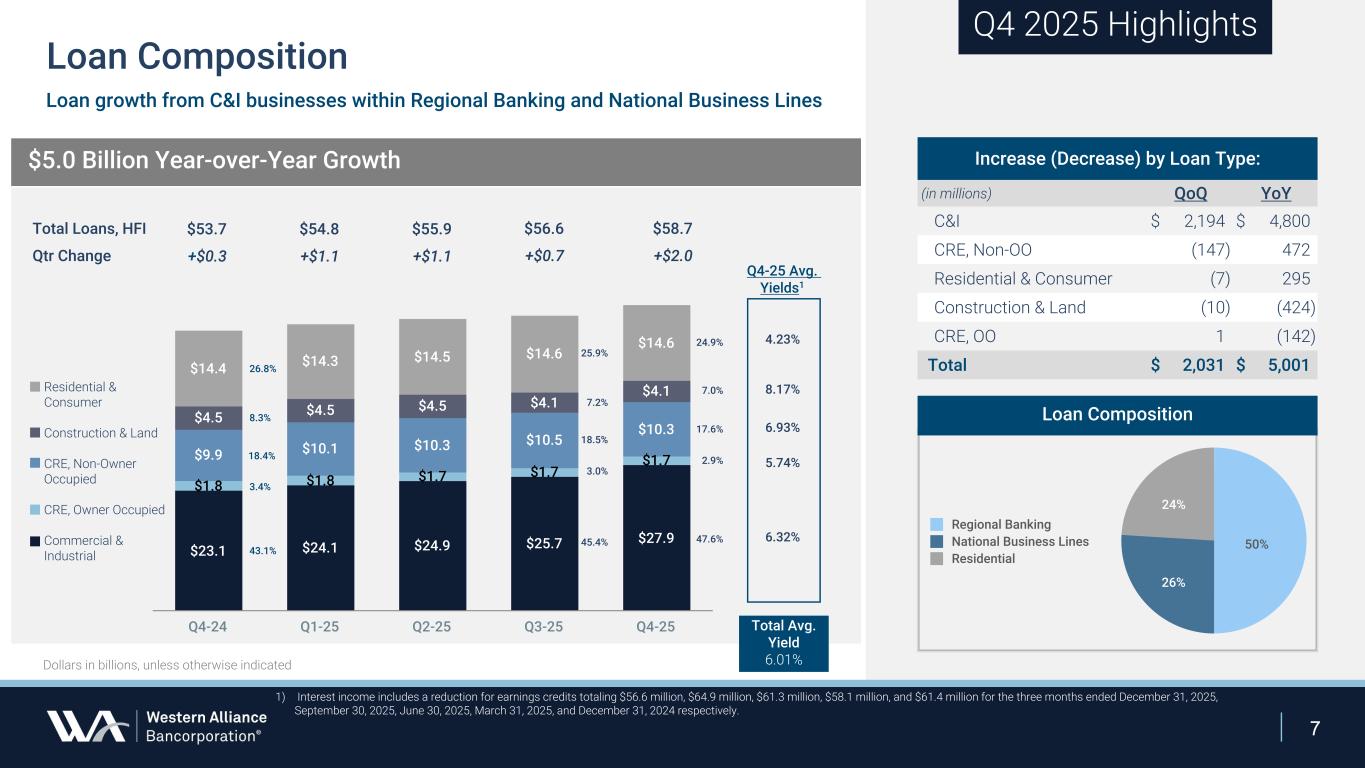
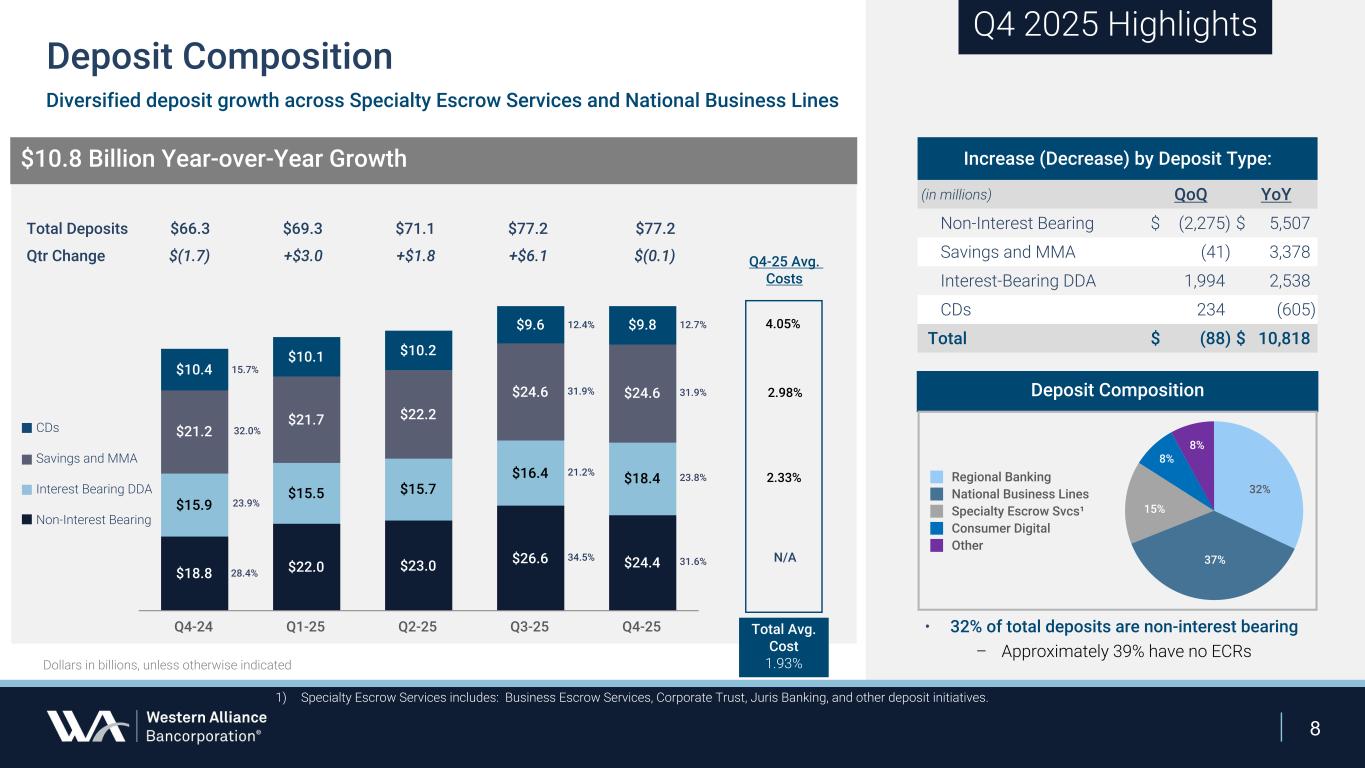
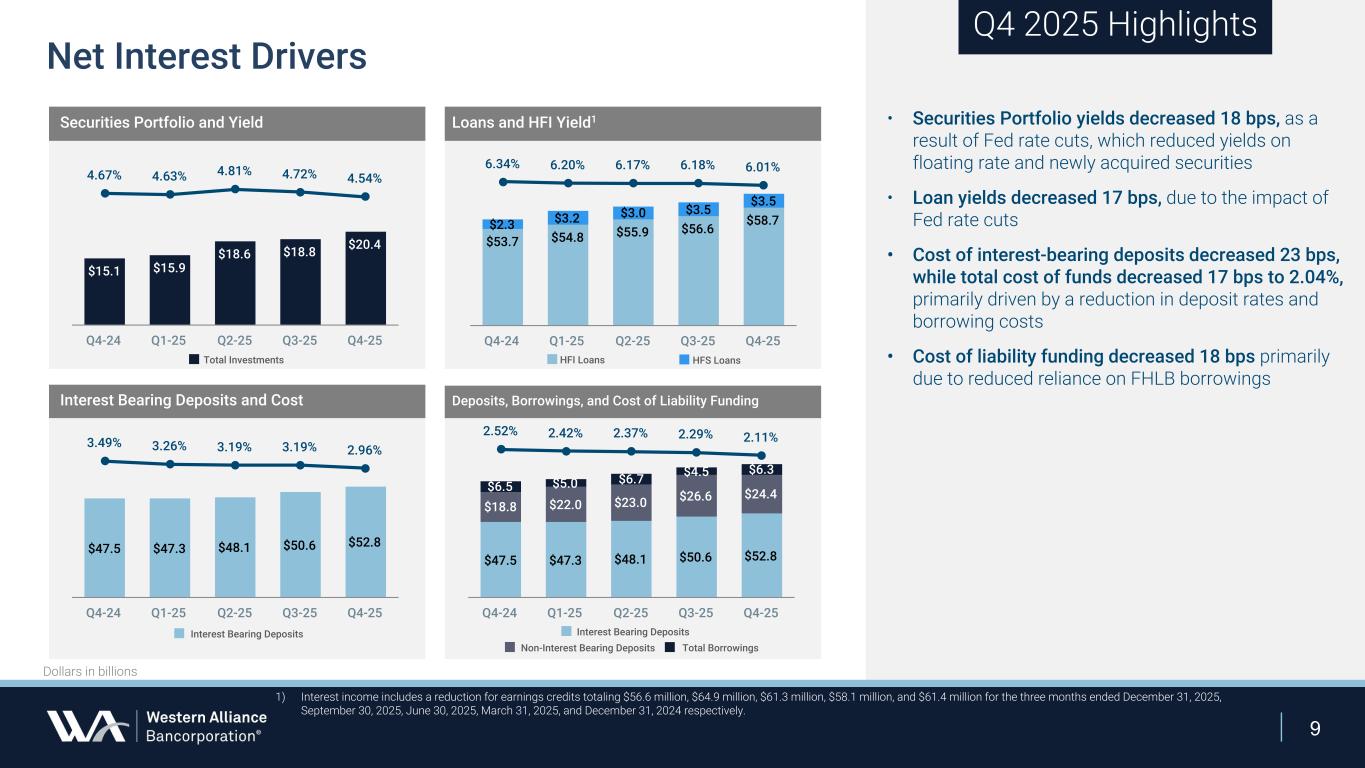
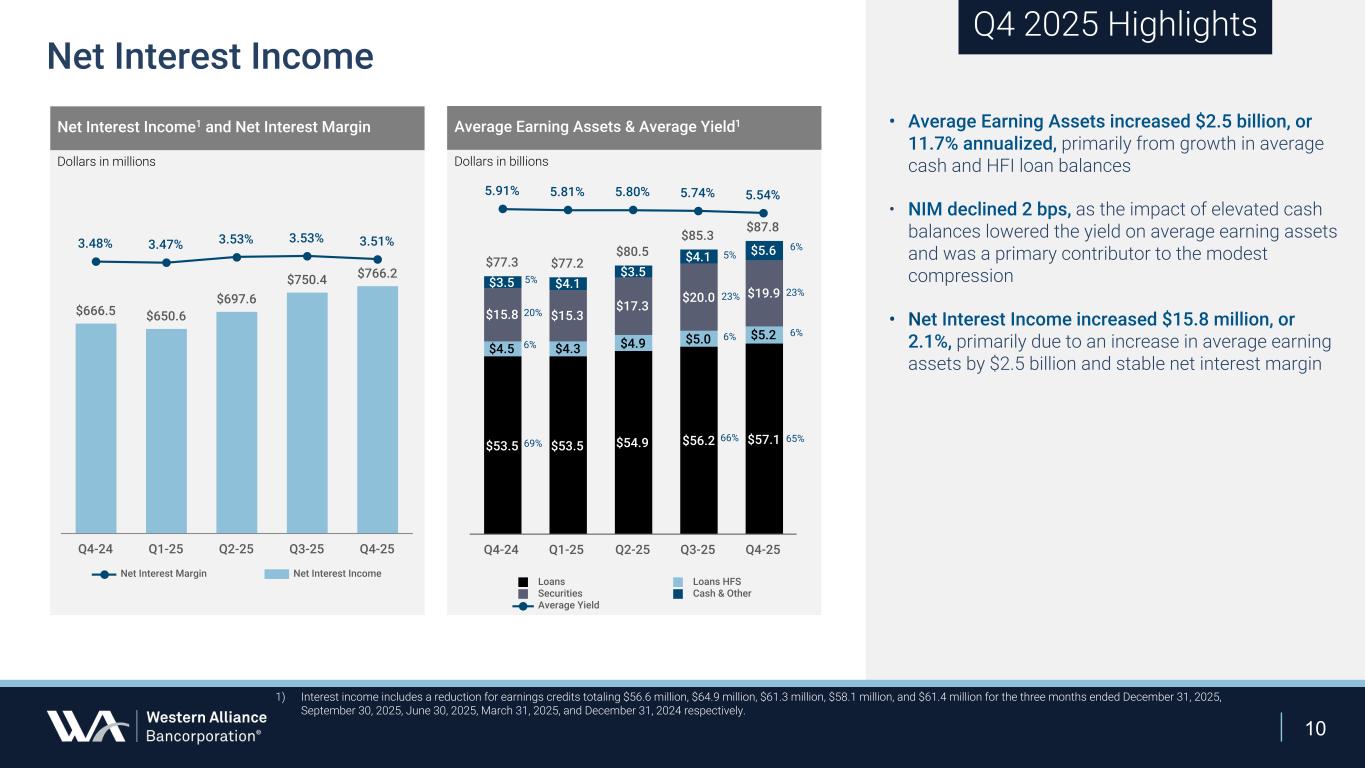
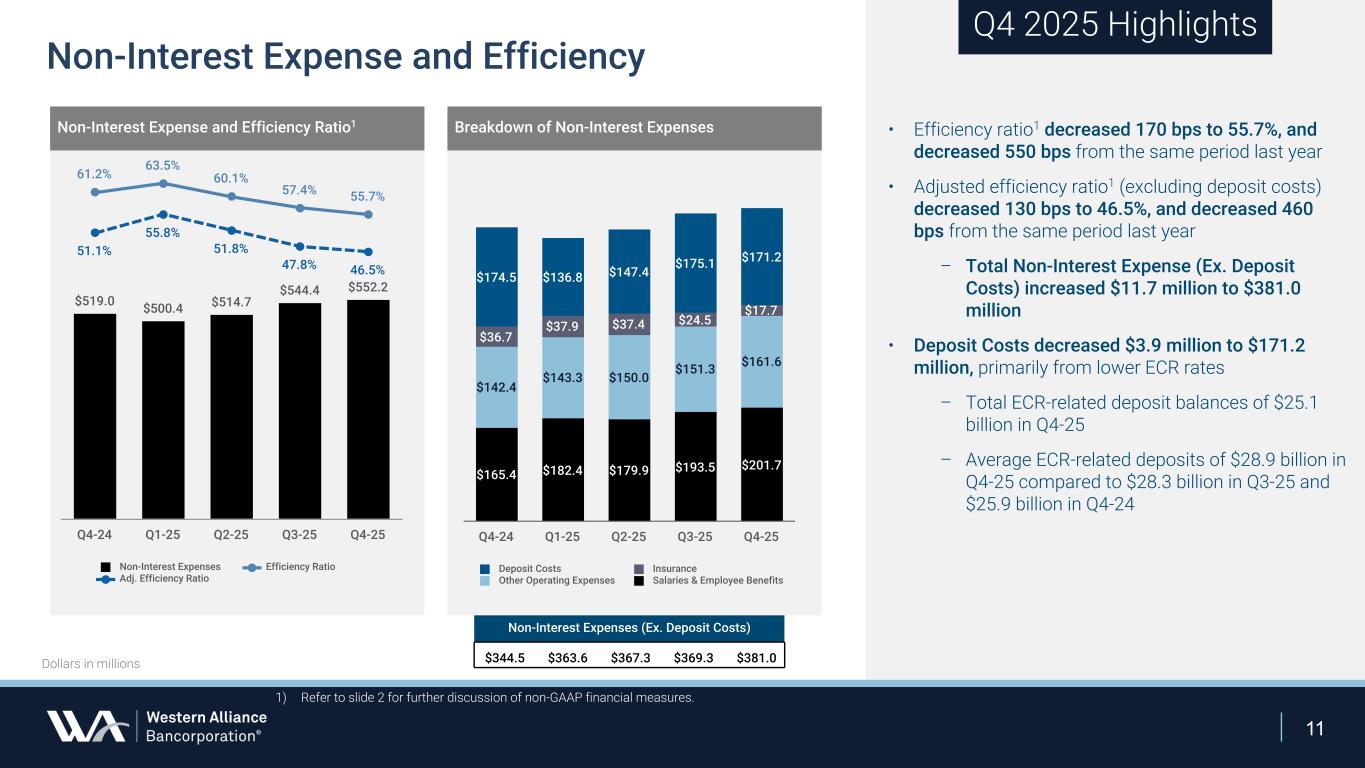
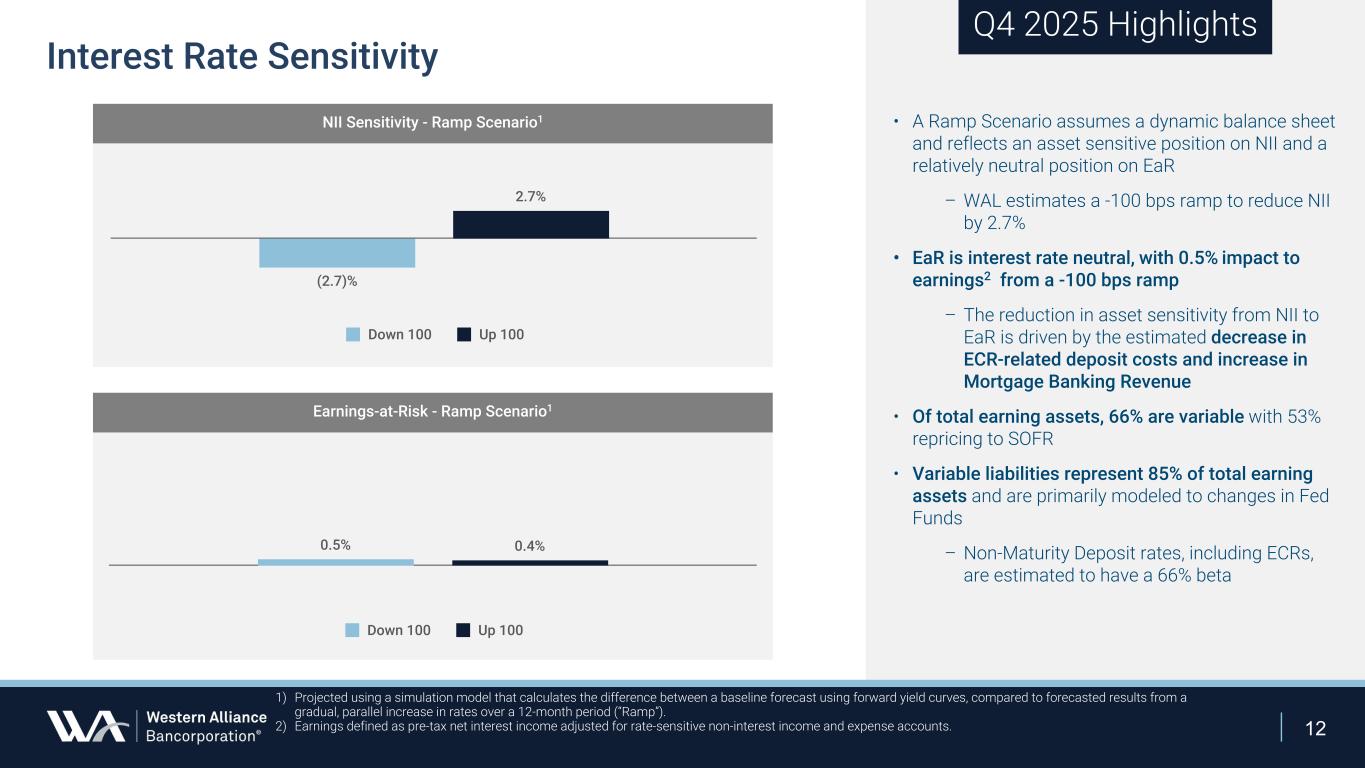
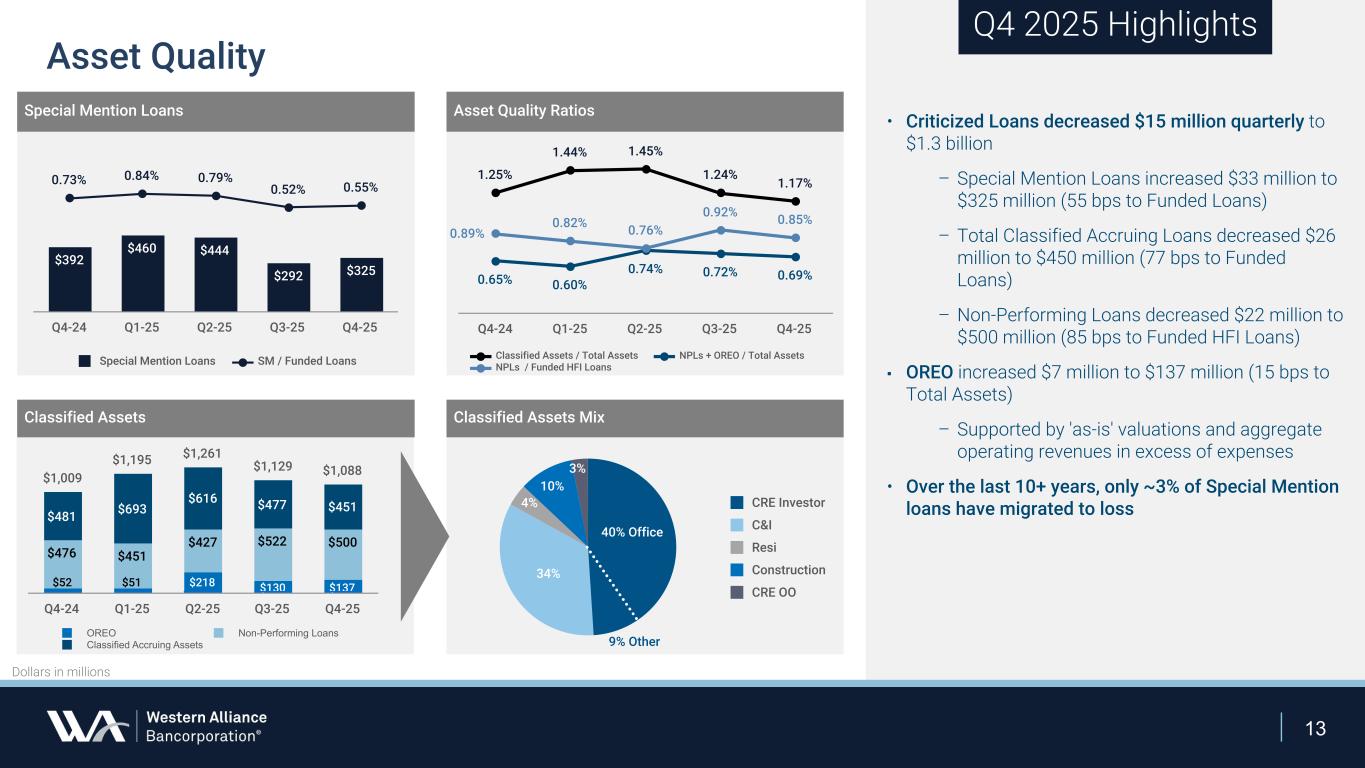
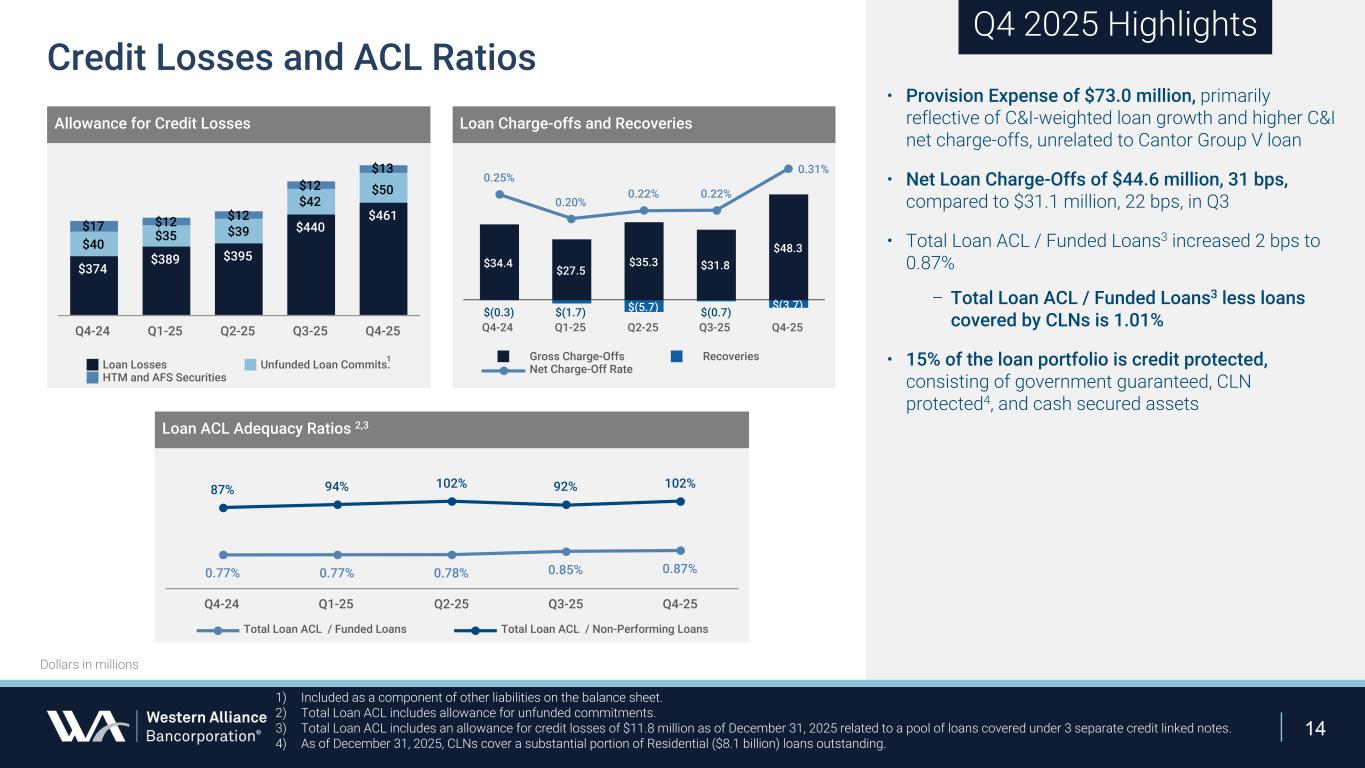
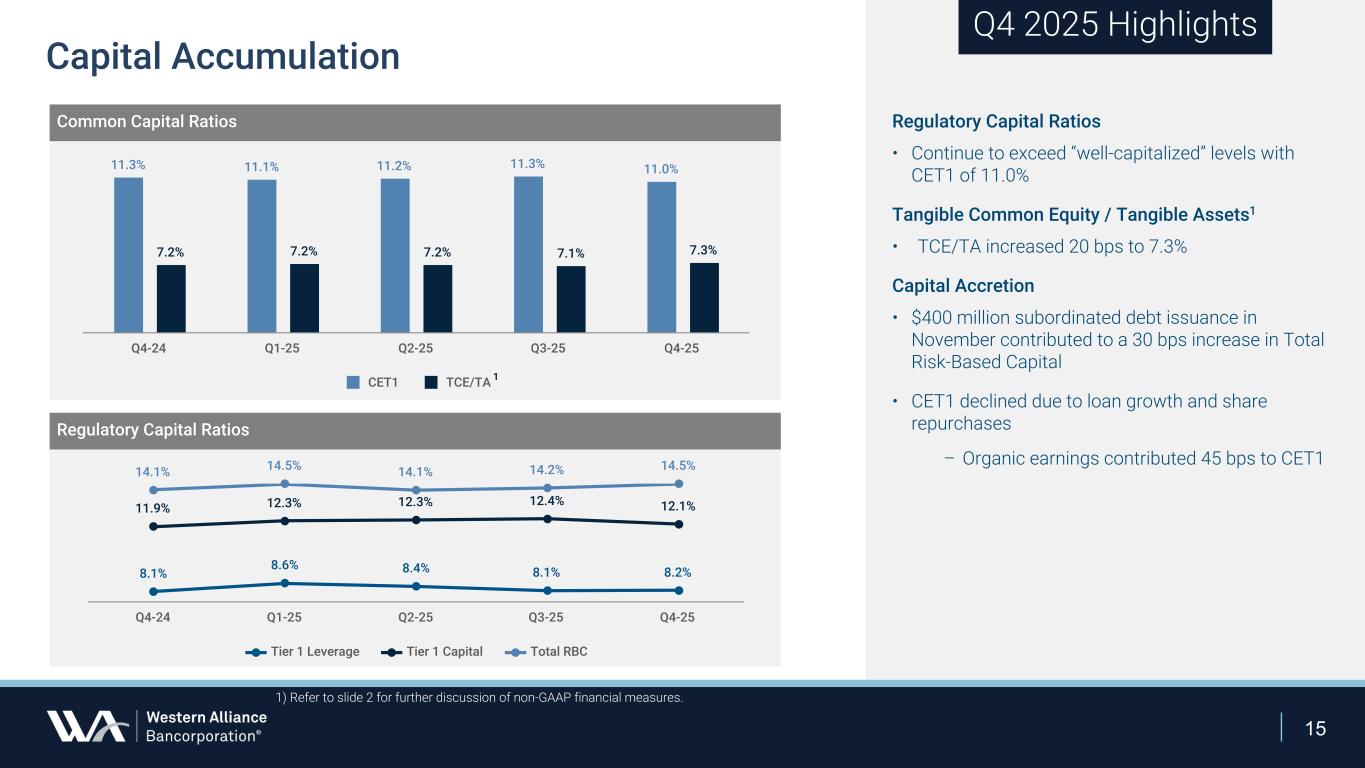
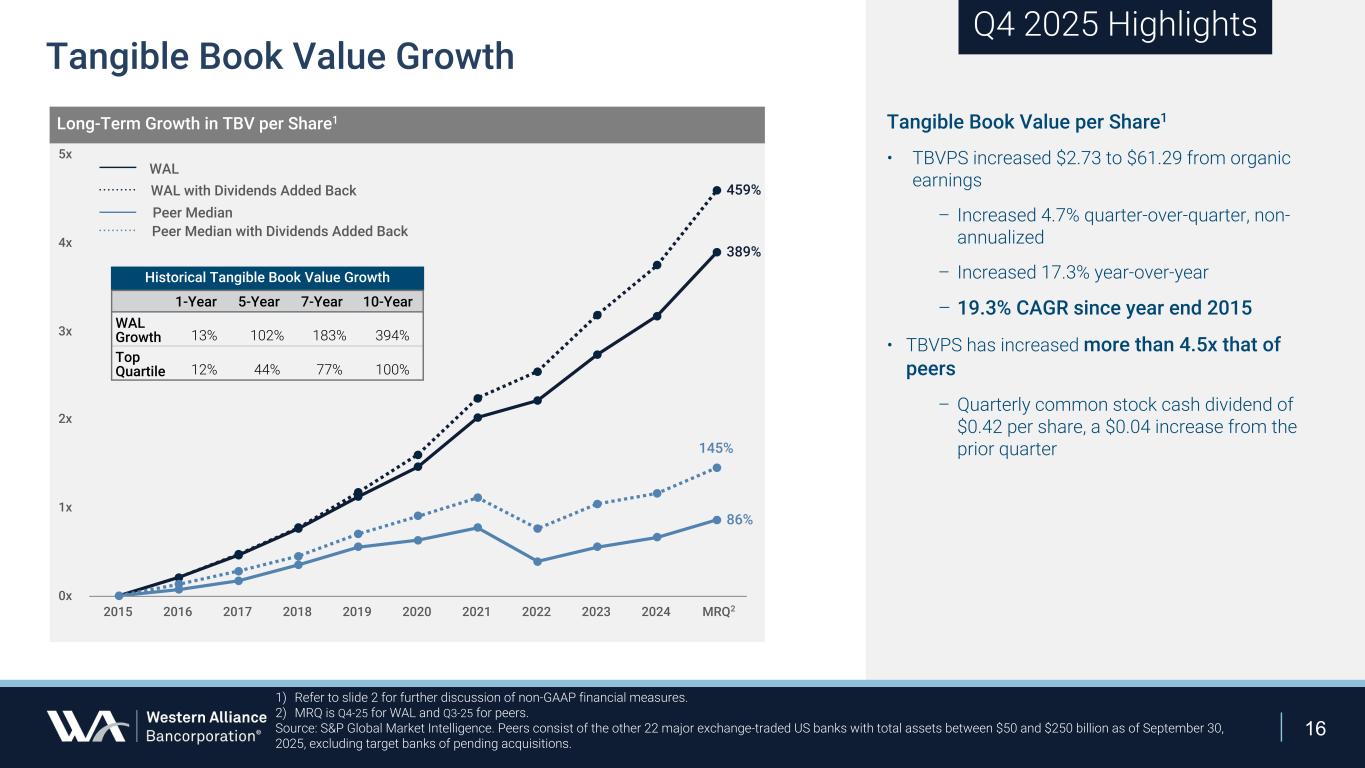
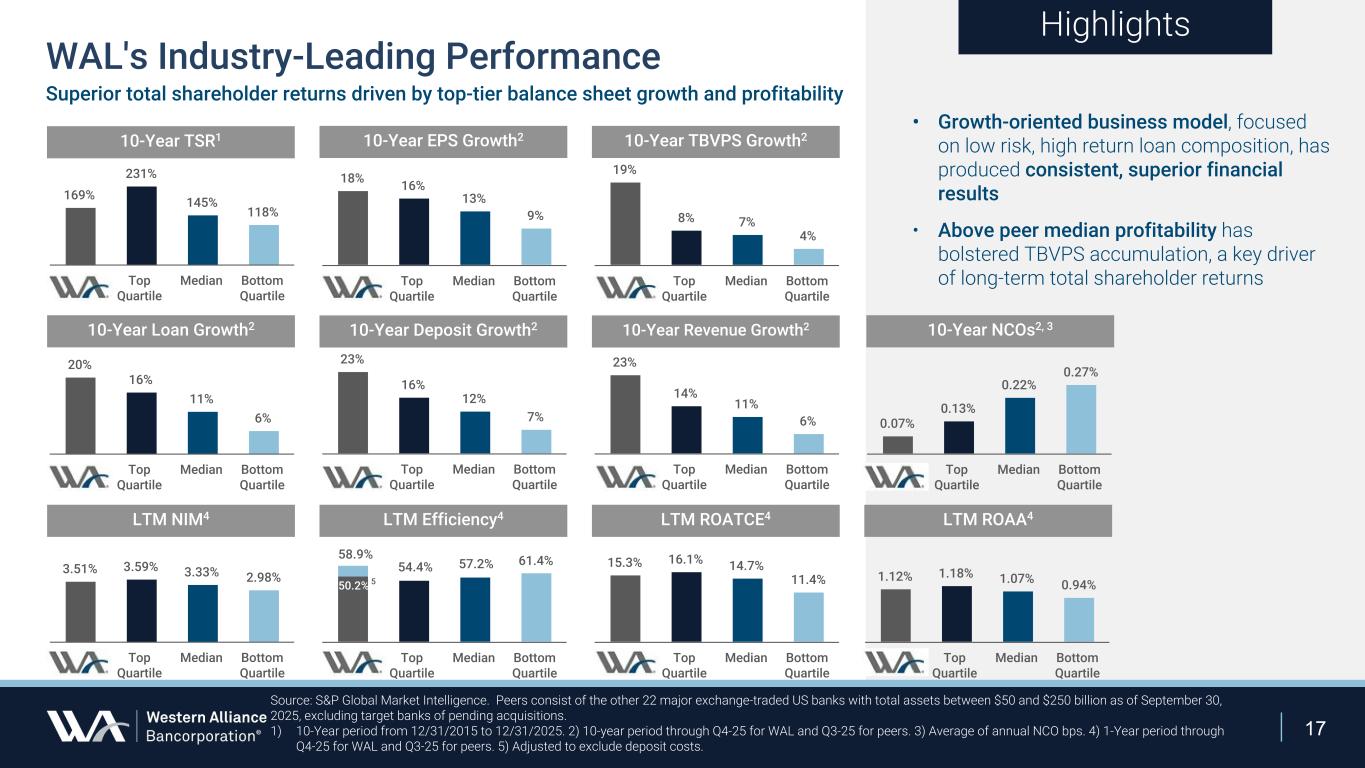
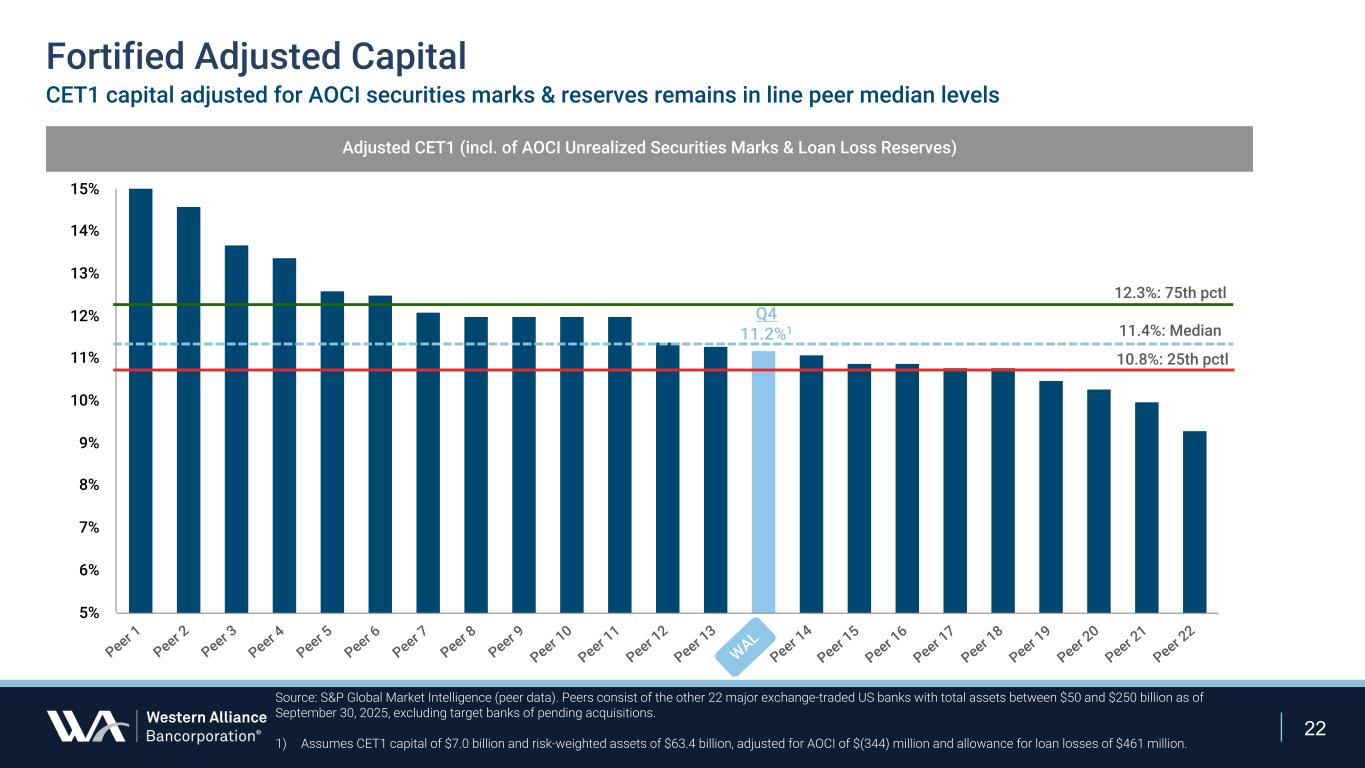
Thanks, Ken. Turning to slide four, in 2025, Western Alliance produced record net interest income of $2.9 billion, net revenue of $3.5 billion, and pre-provision net revenue of $1.4 billion. Net income available to common shareholders was $956 million, and EPS was $8.73. Net revenue and pre-provision net revenue increased 12% and 26% respectively from the prior year, demonstrating the continued successful execution of the bank's organic growth strategy. Non-interest income rose 25%, primarily driven by stronger commercial banking and disbursement fees. as mortgage banking remained essentially flat and in line with our prior expectations. Non-interest expense growth slowed to 4%. Lower deposit costs and reduced insurance expense were key drivers of this moderate expense growth and reinforced our operating leverage. These factors were key to strong annual EPS growth of 23%. Now, shifting to slide 5, record net interest income of $766 million grew $16 million, or 8%, on a linked-quarter annualized basis as a result of strong organic loan growth, leading to higher average earning asset balances, while NIM remained relatively steady from the prior quarter. Non-interest income rose 14% from Q3 to approximately $215 million from stronger commercial banking and disbursement fees. We experienced continued firming and mortgage banking revenue during what is typically a softer quarter. Loan servicing revenue was slightly down from accelerated MSR amortization as prepayment speeds increased with recent lower mortgage rates, which has benefited gain on sale income. Non-interest expense increased about $8 million from the prior quarter to $552 million. Overall, we delivered solid operating leverage this quarter, with net revenue growing nearly 5%, which outpaced the 1% growth in non-interest expense. Pre-provision net revenue of $429 million marked another record quarter. Provision expense of $73 million declined $7 million from Q3 to account for stronger loan growth, the continued remixing of the portfolio into C&I categories, as well as the replenishment of net charge-off. Turning to balance sheet on slide 6, HFI loans grew a robust $2 billion in the quarter, bringing full-year loan growth to $5 billion, which matched our 2025 full-year guidance. Deposit growth across regional banking, specialty escrow services, and HOA remained strong and helped offset typical seasonal pressure in mortgage warehouse. Notably, mortgage warehouse deposits performed better than expected, reflecting our efforts to improve stability by increasing the share of more durable principal and interest escrow balances. As a result, total deposits were essentially flat for the quarter. For the full year, deposits exceeded expectations by a wide margin, increasing $10.8 billion or nearly $2.5 billion above our revised guidance from last quarter. In late November, we successfully issued $400 million of subordinated debt to bolster our total capital ratio. Overall, total assets expanded by $1.8 billion from Q3 to approximately $93 billion. Total equity ended the year at $8 billion, supported by organic earnings and an improved AOCI position, partially offset by higher dividends and the initiation of share repurchases. Tangible book value per share continued its upward trajectory, rising 17.3% year over year. Turning to slide seven, loan growth accelerated in Q4, increasing $2 billion from the prior quarter or $5 billion for the year. Regional banking posted about $1 billion of loan growth with leading contributions from innovation banking, in-market commercial banking and hotel franchise finance. These businesses made consistent, sizable contributions to overall loan growth throughout the year. Additionally, if you look at the chart in the upper right corner, you'll see most of our quarterly and annual growth came from C&I. Mortgage warehouse and MSR financing were leading loan growth contributors from the national business line. Now, looking at slide eight, impressive deposit growth in 2025 was driven by a notable acceleration in regional banking deposits across both in-market commercial banking and innovation banking, along with continued momentum in specialty escrow services and HOA. To put numbers on it, in Q4, regional banking deposits grew 1.4 billion, of which 500 million came from innovation banking, while specialty escrow services deposits rose over 850 million, and HOA deposits increased over 400 million. As noted earlier, the small decline in period end deposits from Q3 reflected strength in these businesses, largely offsetting expected mortgage warehouse outflows. This is a notable improvement from the $1.7 billion net quarterly deposit decline experienced in Q4 2024. Turning to slide nine here, turning to our net interest drivers, interest-bearing deposit costs fell 23 basis points from reduced costs across product categories. Solid average balance growth in lower-cost interest-bearing DBA and savings and money market deposits reflect this deposit cost optimization. Overall, liability funding costs also declined, compressing 18 basis points from the prior quarter from lower borrowing costs. Looking at average earning assets, the securities yield declined 18 basis points from Q3 to 454 from lower rates on a relatively stable average balance. The HFI loan yield compressed 17 basis points following the resumption of FOMC rate cuts in September, which continued in Q4 with two additional 25 basis point reductions. Looking at slide 10, net interest income rose $16 million from Q3 to $766 million, driven by strong loan growth that pushed average earning assets $2.5 billion higher. The modest two basis point compression in net interest margin to 351 stemmed primarily from a 20 basis point decline in the yield on average earning assets from higher cash balances, along with the impact of lower loan and security yields. The outperformance of deposit growth led to the spike in average cash balances, which we expect to revert to more normalized levels going forward. Turning to slide 11, non-interest expense only increased 1% quarter over quarter. Deposit costs of $171 million resulted from higher average balances in deposit businesses such as HOAs. The Q4 efficiency ratio of 55.7% and the adjusted efficiency ratio of 46.5% both fell about 5 points year over year. Looking just at non-deposit cost effects, the quarterly increase reflects higher corporate bonus accrual related to our financial performance, partially offset by lower FDIC assessments. As has been reported by other banks, we also recognize a reduction in the FDIC special assessment, which lowered the insurance expense by about $7.5 million. Concurrent with this benefit, AmeriHome recognized mortgage servicing deconversion costs of a like amount. Now, looking at slide 12, we remain asset sensitive on a net interest income basis, but essentially interest rate neutral on an earnings at risk basis in a ramp scenario. This offset is supported by projected deposit cost decline and an increase in mortgage banking revenue based upon our rate cut forecast of 25 basis point cuts in April and July. Turning to slide 13, asset quality remains stable. Criticized assets decreased nominally from Q3 and totaled $1.4 billion. Reductions in classified accruing assets and non-accrual loans were partially offset by modest increases in special mention loans at Oreo. Turning to slide 14, quarterly net charge-offs were $44.6 million, or 31 basis points of average loans. Provision expense of $73 million was primarily a function of strong CNI-driven loan growth and net charge-off replenishment. Our allowance for funded loans moved about $20 million higher from the prior quarter to $461 million. The total loan ACL to funded loans ratio edged up two basis points to 87. Our total ACL fully covers non-performing loans at 102% and rose 10 points from the prior quarter. Now looking at slide 15, our tangible common equity to tangible assets ratio increased approximately 20 basis points from September 30th to 7.3% from strong earnings growth, while our CET1 ratio edged down to 11 at our target level. Our solid capital levels are indicative of our ability to generate sufficient capital organically, support robust balance sheet growth, while returning value to shareholders through share repurchases. We also issued $400 million of subordinated debt at the bank level in late November that augmented our total capital to 14.5%. We repurchased about 0.7 million shares during the quarter, or 57.5 million, at a weighted average share price of $79.55. Turning to slide 16, tangible book value per share increased $2.73 from September 30th to $61.29, from strong growth in organic retained earnings and complemented by a 16% improvement in our AOCI position. Since initiating our share buyback program in September, we have repurchased over 0.8 million shares to date and have utilized just over 68 million of the current 300 million authorization. Our quarterly cash dividend was hiked four cents during the quarter. Consistent upward growth in tangible book value per share remains a hallmark of Western Alliance and has exceeded peers by four and a half times over the past decade. Turning to slide 17, Western Alliance has been a consistent leader in creating shareholder value over the medium and long term. We have provided on this page 11 metrics we believe are key factors in driving leading financial results, strong profitability, and sustainable franchise value that ultimately compounds tangible book value and produces long-term superior total shareholder return. For the last 10 years, our ETF growth and tangible book value per share accumulation have ranked in the top quartile relative to peers. We're also the leader in 10-year EPS, tangible book value, loan, deposit, and revenue growth compared to peers. Lastly, ROATCE growth in the last two quarters has made solid progress toward achieving top quartile performance. I'll now hand the call back to Ken.
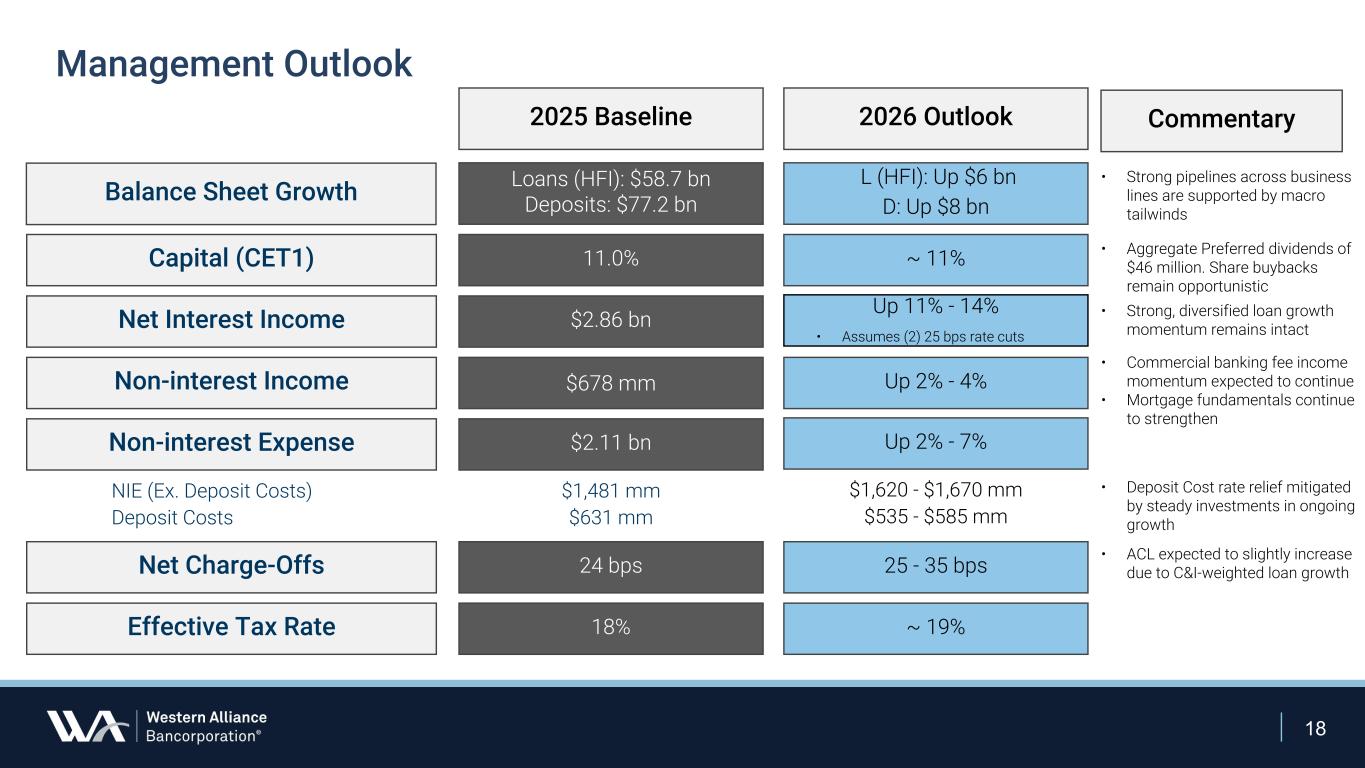
Thanks, Vishal. Given the strong macroeconomic tailwinds we continue to see, including an increasingly pro-growth regulatory stance, constructive sentiment across our commercial client base, and improving visibility on rate normalization, we remain confident in another year of strong earnings momentum for Western Alliance. Our 2026 outlook is as follows. We enter 2026 with strong loan pipelines across business lines, supported by a healthier macro backdrop and what we view as increasingly accommodative regulatory and political environments. These factors avoid the risk appetite of our commercial customers. As a result, we expect loan growth of $6 billion and deposit growth of $8 billion. We continue to feel confident operating with CET1 around 11%. With our strong organic earnings trajectory, we expect to continue opportunistic share repurchases subject to market pricing while maintaining capital broadly in line with current levels. Our strong loan growth outlook combined with continued opportunities to lower funding costs supports our expectation for net interest income growth of 11% to 14%. We assume two 25 basis point rate cuts in this outlook. We also expect modest expansion in net interest margin throughout the year, driven by ongoing remixing into higher return C&I categories and sustained momentum in core deposit growth. We expect non-interest income to grow between 2% to 4% off an elevated starting point, the building momentum exhibited in service charges and fees, and the constructive environment for mortgage points to continued growth in non-interest income. The combination of these emerging tailwinds favor a more robust revenue environment for mortgage and MSR-related income, even as we continue to operate with a conservative forecast. Non-interest expense will rise, but primarily as a function of scale and targeted investments that support top-line growth and operational efficiency. For 2026, total operating expenses are expected to increase between 2% and 7% for the year. Deposit costs are projected to decline again between $535 million to $585 million from continued rate relief. Operating expenses, excluding deposit costs, are expected to be between $1.62 billion and $1.67 billion, reflecting continued investments in several new business lines and future technology. Looking at asset quality, we expect net charge-offs between 25 and 35 basis points as we proactively reduce non-accrual balances over the next couple of quarters. As I discussed in my opening remarks, with the ongoing loan growth shift into C&I, the reserve level should adjust as the mix evolves. Our risk-adjusted PPNR trajectory remains strong, and we are confident in continued robust EPS growth. Finally, we project our full year 2026 effective tax rate to be approximately 19%. At this time, Vishal, Dale, Tim, and I look forward to your questions.
Operator
We will now begin the question and answer session. If you would like to ask a question today, please do so now by pressing star followed by the number 1 on your telephone keypad. If you change your mind or you feel like your question has already been answered, you can press start followed by 2 to remove yourself from the queue. To allow everyone a chance during Q&A, we ask that you please limit yourself to one question and one follow-up. Our first question today comes from the line of Andrew Terrell with Stevens. Andrew, please go ahead.
I was open to maybe start on just the balance sheet growth guidance. Obviously, you know, loans up $6 billion in 26, deposits up $8 billion unchanged versus kind of your 2026 expectations, 2025 expectations. You know, you gave a lot of positive commentary about the momentum. I'm just wondering why, you know, maybe not a higher loan and deposit growth guidance, or do you feel like you're being conservative this year?
Yeah, well, number one, One, our loan growth and deposit growth as projected leads the peer group, and I'll just point that out. That's one. Number two, what you see here is all organic growth, which is very important. Number three, we are de-emphasizing certain areas of our loan portfolio, i.e., mostly we're doing less in residential loan growth. So as that runs off, it puts more pressure on the other areas to accommodate the runoff And I guess number four is that, you know, $6 billion and $8 billion seems about right. And as we continue to move forward throughout the year, if the projections are proving to be conservative, we will adjust accordingly. But going into this year, $6 to $8 billion will produce something along the order of a consensus EPS that's out there today in the $10.38 range, which is about 19% EPS growth, which is, again, leading the peer group for any bank for organic growth. I actually think maybe leading the peer group even for banks that have had M&A activity during the course of the year. Great.
Thank you. And then, Ken, just on the charge-off commentary as well, it sounds like the charge-offs could be a little bit front half loaded. I guess just should we think about first-half charge-offs as potentially above your full-year guided range before, you know, normalizing back to that 20 basis point type level that you've been guiding to previously as we move into the back average? How should we think about the timing of charge-offs or magnitude throughout the year?
Yeah, I would say, you know, I would think about the range as the midpoint coming into the year for modeling purposes at 30. You could see it a little bit higher than that in the first half of the year as we look to get rid of a number of non-accrual loans that have been on our books. That is our effort to bring that number down well below our loan loss reserve, and we think that will be good for the business. It's good business overall, and it will be healthy for PE expansion and improving our market capitalization. So we are doing that. I think you saw some of that in Q4. Charge costs were a little bit higher than maybe you thought. But classified and criticized loans remain flat in terms of visibility into the first half of the year. We have a number of properties designated to be either upgraded or sold or notes sold or properties sold. And the hard part will be to determine whether or not a lot of that happens in Q1 or Q2. There's, as you know, a lot of paperwork that goes along with that and negotiations. But we do have a confident level that by the end of the Q2, the non-accrual loans will be down.
Operator
Thank you. Our next question comes from Chris McGrathie with KBW. Chris, please go ahead.
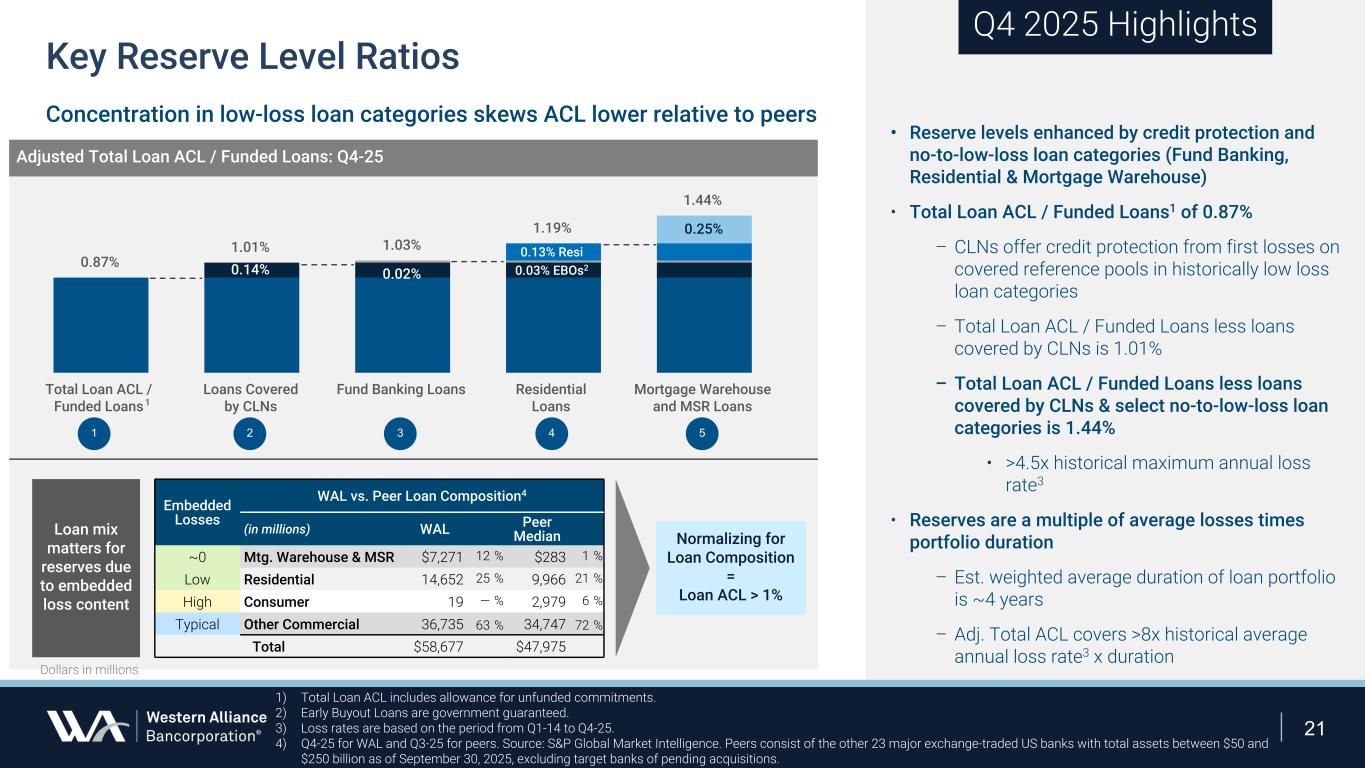
Good morning. Ms. Alden, maybe you could talk about the strength in non-interest income, a big service charge number in the quarter. Again, I want to make sure I understand the sustainability of it. Because what's in that line? And obviously, I heard you on mortgage, but any near-term expectations for mortgages in a seasonally tough quarter?
Happy to take that one. I think the big one there is the service charges. Two primary drivers in that. Chris, the first one is treasury management. We've made a lot of investments in that, and we continue to see a pickup in that on the cross-sell there. And then the second one is going to be what Ken and I mentioned in the prepared remarks. there's a big improvement in fee income related to the digital disbursement business, right? So we did handle, you know, one of the largest settlements, the Facebook, Cambridge Analytica, and we're actually, when you get the settlement, we're distributing it to the end claimants, and there's, you know, fees associated with that. So it's going to depend on what that business looks like going forward, but we've already had, you know, other settlements that have come in, so we do feel positive on where that line is going in terms of sustaining that trajectory. On the mortgage side, I think Ken hits this well.
Let me – I'll take that. So, first, good morning there, Chris. We are constructive on the mortgage business, as I said, as we begin 2026. And we see several tailwinds that could provide additional alpha earnings to our 2026 projections. As a starting point, we are assuming a 10% year-over-year increase in total mortgage fee-related revenues. However, if several of the administrations make housing affordable programs take hold, combined with favorable regulatory changes and a lower interest rate environment, we think AmeriHome could outperform these projections. As a data point, and it's an early data point, so I caution everyone on this, but as a data point, entering the year here, we expect Q1 total mortgage revenues to be nearly equal Q4 results. But I'll tell you that January's volumes and margins, as of close of business last night, were presently trending above our planning assumptions. So a little conservative on the mortgage income. It's based on some tailwinds, which we think are going to come. We'll wait. Those happen to be whether or not there's access to 401K funds or the GSTs buying $200 billion more mortgage bonds. We also see certain areas of the United States seeing supply exceed demand. So we think some housing pricing may come down, certainly in the southeast. And we expect a couple of rate cuts, certainly with potentially a more sympathetic Fed chair in May. So with all that going on, I'll think that's the economic and administration tailwinds that we have. There's also a couple of regulatory tailwinds, and we're going to wait to see what happens here. But it's our understanding coming out of Q1 that the FRB may give us additional guidance on MSRs. And the two things that we're looking at is, one, will the FRB reexamine the MSR 25% cap to CET1 capital? And if they do that, that will allow us to either hold on to – that will allow us to hold on to more MSR receivables. And those have a double-digit yield to them. and so we like that. On the other hand, there's another consideration, which is to change the risk weighting of the MSR asset, which you know is two and a half times to one. If that comes down, that will either free us up to hold on to more MSRs, or it could allow us to buy back more stock, or support more growth, to the first question today that we received, or we just let it go to capital and we build a higher capital base. So we have some things going on here that, you know, potentially could be very strong as it relates to the mortgage business. So a little wait and see, but we have some optimism and I'm trying to restrain it, but I'm hoping that it does come to fruition.
That was great. Thanks, Ken. And just as a follow-up for the NII, 11 to 14 percent with the two cuts. I guess what puts you at the high end versus the low end?
The higher end is the average earning assets. If that comes in and grows at a faster pace, we had a great Q4. Our average earning assets in Q4 were up $2.5 billion. So that was fabulous. And usually it all depends on the loan and deposit growth and when it comes in. That's the hottest thing for us to forecast on an average basis. We can usually get it right on an ending quarter basis, but on an average basis, it's always the one thing that's a little bit softer for us to predict. But, you know, we're confident that that range is good, and, you know, I would think it's 12 percent or greater as a floor if I was modeling.
We're also hopeful that on the deposit side, that the categories that are lower cost to us that would pull down our average cost and expand the margin are some of the ones that we're going to be focusing on in terms of digital assets, our trust company, and business escrow services in particular.
Operator
Thank you. Our next question comes from David Smith with Truist Securities. David, please go ahead.
Hey, good morning. Good morning. Can you give us an update on your ECR deposit expectations. How do you expect the mix of ECR within total deposits to shift with $8 billion of growth in the outlook for this year? And then can you also give an update about how the mix inside of ECR is shifting? Like, is there less mortgage warehouse, more settlement services, and how does this affect the ECR rate paid and your beta to changes in short rates over the next year? Thank you.
I'll start and the team can add. The first thing I say is when you think about the ECR deposits to our total deposits today, if you think about it on average basis, it's around 37% today. If you think about end of period, it's around 33%, right? So about a third. When you think about what that mix shift is going forward on the $8 billion in deposit growth, I think you can largely expect it to hold constant from a mix perspective. We're obviously hoping to push more of that towards the non-ECR. But I think as the forecast stands today and things will move around, I think you can assume the mix is going to move pretty consistent with where we are today. When you think about the beta on the ECRs, we would say, you know, think about a 65 to 70% beta on those ECR deposits, but appreciate, you know, there's very specific businesses that drive that, right? On the mortgage warehouse side, that's more like 100% beta. When you think about the HOA, think like 35 to 40% beta, and then you've got jurists. So there's a mix of different things in there that hopefully that gives you a little bit of sense of, you know, what the mix is and what the deposit betas are for the ECRs.
Yeah, I'll just add one other thing, too, and I'll tie it back to the first question, which was, gee, we thought your deposit growth would even be greater than $8 billion. We're coming into the year projecting warehouse lending as a division to have flat deposit growth, and what we're trying to do is remix that so that deposit growth comes from the cheaper deposit. Now, one of the things that's interesting here, and this will tie into the mortgage fee income question that Chris asked as well, in Q4, we did $1.5 billion better, meaning our deposits in warehouse lending were $1.5 billion higher than we expected because of the mortgage activity and the refinancing activity that was occurring. So one of the things that's hot – so what's the good news about that? Well, if there's a lot of refinancing activity, deposit levels should be up for warehouse lending going forward. So, that's something to consider. But also, with that type of refinancing activity, it should give more volume opportunities to AmeriHome. What it means to your question is, even though we're coming into the year flat for warehouse lending in terms of deposit growth, you could see it spike up accordingly with the volume growth and the movement in that industry.
Thanks. And then just as a follow-up, how are spreads trending on new loan origination? And Have you seen any changes from competition there?
You know, we're sort of ending the year or the spot rate now at the end of the year is about the same, as you see in the book. You know, there isn't a day that we don't wake up and have competition and have to worry about yield coming from different players. as the economy gets better and more banks get aggressive to start driving in their organic growth. That, of course, puts a little bit of pressure on us. For us, we keep a tighter lid on the operating expenses while we continue to invest in future businesses for future revenue growth. So if we have to give up a little bit in yield to get loan growth, so be it. Well, as long as it's safe and sound and credible, credits, we will go ahead and do that. Tim, do you want to add anything about what's happening on the regional side?
Yeah, what we're really seeing is our specialty business lines are insulating us a bit. There's a definite flight to quality in the market. And our specialties have well-established relationships, control environments, and structures where folks are doing business with us for something other than rate. I think that's really important. And we're seeing the strongest growth in those deep channels.
Operator
Thank you. The next question comes from Jared Short with Barclays. Jared, please go ahead.
Hi, thanks. Maybe sticking on the deposit side, good morning. Any update, Dale, early update on some of the initiatives you're working on? Because it feels like, you know, maybe there's a little more of a margin tailwind from the funding side as we look at that NII guide.
Sure. Well, maybe I'll just run through them. You know, I really do think these are – really have awesome opportunities in front of them. I love the bank. I've been here a long time. But I think some of the more interesting things are likely to happen in some of these sectors. You know, the first one is our HOA group. But we talked about, you know, how well that's done. The bank's about 30 years old. This has been around about half that time. It started at zero and is now the largest HOA provider in the country. Notably, for the past eight years, every quarter they've exceeded their new record balance for them. And that consistency we think is important, and we think we're out in front. And, frankly, we want to be pulling away from where we're going to be going going forward. And they're going to have strong performance in 2026. The next one is our Juris Banking Operation. We talked about that with a combination with digital disbursements. That's already received some color during this call. We're the largest class action mass sort of claims settlement entity in the country. We've now expanded that into providing banking services for basically law firms nationwide. We expect to triple their loan volume in 2026. Our digital asset group, we're serving our clients 24-7. which is, of course, digital asset markets are open 24-7. I'm a big believer in kind of the tokenization of everything, and we want to be out in front and facilitating that process. Our trust company, you know, we started that, you know, three years ago. In under three years, we are now broken into the top ten of the largest CLO trustees worldwide. And they have doubled basically in 2025, and we think they're going to be doubling again in 2026. And our business escrow services function, you know, that's where we provide services to ease the M&A process for private companies selling to either public or private ones for, you know, collection of funds, disbursement, and also holding on to earn outs and rex and warranties. So in total, we think these are going to grow about three times as fast as the bank overall, north of 30% in growth, and most of these have notably lower costs than what we're incurring in our other deposit channels. As Mortgage Warehouse, you know, is the largest one for some of the ETRs, and that one, as Ken mentioned, will be holding relatively flat, we expect.
Okay, great. I appreciate all that detail. I guess shifting back to the credit question with the expectations for higher charge-offs at the beginning as you work through some of those NPLs, how should we think about provisioning and the allowance with that background?
Yeah, sure. Happy to jump in there. In terms of where the allowance is for funded loans on the HFI balance today, it's 78 basis That's about flat quarter over quarter, up about eight basis points from 70 a year ago. As we think about where that's going next year, I think you can see that allowance drift up a little bit, maybe into the low 80s, and that's largely just a function of, as we said, we see the loan growth mainly coming on the CNI side, so there will be a little bit of a remixing as we do that. And then in terms of the charge-off, the other piece to get to the provisions, how you can back into it, it's exactly what Ken said. You've got the 25 to 30-disc guidance for the full year. We think right now it's going to be around that midpoint. So hopefully that gives you the data points you need.
Operator
Thank you. Our next question comes from Casey Hare with Autonomous. Casey, please go ahead.
Great. Thanks. Good morning, everyone. So, I want to follow up on the NAMM outlook. Candidate, you said you expect it up throughout 26, and it sounds like it's positive makeshift on the loan side, moving to more, you know, less resi and more higher yielding C&I and the deposit side. As Dale just mentioned, the growth in lower cost deposits. Just wondering, you know, any color you comprise, like what C&I categories are you growing faster and sort of the yields around them? And then these growth in lower cost deposit channels, is this going to up the deposit beta in a meaningful way? You're trying to get a better sense on the magnitude of NIM expansion.
Yeah. Okay. Starting on the liability side on the deposits, I think if you look at the numbers for Q4, you can see how much we were down in CDs, and so we immediately took our CD funding down and that helped our deposit costs decline. We will continue to do that through 2026, and that will give some support to NIM. Let me just say about NIM, it's not going to jump up dramatically, but it's going to slowly cascade up throughout the year, okay? Remember, we have two rate cuts embedded in there as well, all right? For planning purposes, I would always assume NIM is flat, but it does have a slight gentle stream upward to the right. We also are accentuating the business's growth that Dale is running. And these businesses price more attractively than our traditional deposits. One of the things Dale didn't fully touch on, and I may just throw it over to him in a second, is in our digital asset group, the fact that we now do 24-7 interbank trading. And for that, we get a premium, i.e., a larger discount in what we pay for funding. I'll give that to Dale in just one second. To combine on the other side of the balance sheet, I'll take something that Tim Bruckner said, which is the business lines of lot banking, hotel financing, resort financing, even private credit. All those yields are holding on to where they are. I won't say we have pricing power, but we have the ability to bring in volume based on the pricing that we're holding. And so you'll see more volume come out of those groups in 2026. Dale, did you want to say anything about IBT at all?
Yeah, let me just describe what we're doing on this IBT 24-7 that I alluded to and can't amplify it on. I mean, my analogy is it's like the Spider Gold Trust. Spider Gold Trust is the largest, you know, gold repository in the ETF in the world. And what you do is you just buy and sell your ETF. You don't have to actually own the gold anymore. Well, we're not holding gold, but we're holding U.S. dollars. And these clients can come to us and 24-7, unlike the ETF, which only turns when the markets are open, 24-7, they can, you know, convert money, you know, to U.S. dollars or from U.S. dollars to, you know, to any kind of where they are. And that service level is important, and there's things like this in our other businesses as well that lead to lower funding costs. It's because we're providing services that are not widely available, and as a result, you know, we're going to actually have a lower beta, not a higher beta on these types of things. I might note that, you know, our deposit growth in 2025 was actually a little bit better than maybe it's advertised. You haven't seen this yet, but our broker deposits fell by more than a billion dollars on top of that. So, the $10.8 billion is already net. It's more like $12. So, I think we really outperformed this last year. I know our guidance for 2026, and I feel like we're going to be able to meet that guidance for sure.
Okay, great. And then just one more on expenses. So, if I look at the core expense growth, actually, the ECR deposit costs, it implies about a 9% to 13% growth. I understand that you guys got a lot going on. But is there wiggle room if the deposit cost relief does not materialize, meaning you could maybe flex that lower?
Sorry, the question is, can deposit costs go lower to drive down year-over-year operating expense growth?
Yes, the expense growth acts the deposit costs, right? So that implies 9% to 13% growth. If deposit cost relief doesn't kind of materialize the way you guys, can you flex that core expense lower?
Yeah. So embedded in our expectations is that there is no change to LFI guidance. So we've got the full boat of expenses embedded in there that we need to spend in order to meet the $100 billion threshold. Now, if the LFI guidance is moved up from 100 to some larger number, some say 150, some say it will be 250, then the dollars that we spend there will be reduced. Will not be eliminated, but will clearly be reduced because there are certain things that we want to get to and we think are better for the company. So we have room there. We also have room in looking at business expansion and revenue initiatives. But I'll tell you, the secret to our success and the secret to our growth is that we always work on new businesses or new products and services, new business lines, so that we can develop an S-curve, so that, you know, two years from now, some of the things we're working on begins to take form and you drive higher revenue. The stuff that Dale mentioned with the IDT network, we started working on that two years ago, all right? And so now it's coming to fruition, and we think it's going to drive future success. Juris banking, we worked on four to five years ago. BES, three to four years ago. So all these businesses have taken time. Go back, and only because Dale's here, I'll say HOA, we worked on 12 years ago, all right? And we did it in such a way that we're now the number one market share leader in HOA, and we continue to pump out significant deposit growth there as well. So my answer to you is, can we flex on things? Of course. But we're going to balance that with what's good for the short term and what's really good for the long term. And so far, we've done a fairly good job of managing short-term and long-term expectations and driving in long-term growth, whether it be on the balance sheet or in fee income as well.
Operator
Thank you. The next question comes from Janet Leigh with TD Cohen. Please go ahead, Janet.
So, it appears that some of the confidence in your 2026 ECR deposit cost guide is coming from a remix of ECR deposits into lower costs and away from mortgage warehouse for the time Are you able to share the composition of ECR deposits among mortgage warehouse, HOA versus I believe those are the three biggest today versus, let's say, the end of the year or what your internal targets might be?
No, that makes me feel very uncomfortable just because of the competitive environment we're in. I mean, in terms of ranking them, warehouse lending is the biggest, followed by HOA, followed by jurors, and that's what I would tell you. But absent of that, I'm not going to provide what our deposit levels are for any one of those businesses. I'm sorry.
Okay. That's fair. And your ACL ratio going up from 78 basis point to low 80s by the end of this year, you said it's really driven by the CNI loan growth and NCO replenishment, and I guess the non-account cleanup. Is there any update you could share on either Cantor or First Brands on that note?
Yeah. Let me handle First Brands first. And it's really, our loan is not to First Brands, but it is to Point Bonita, which is a subsidiary of Jefferies. That loan continues to pay down at an accelerated pace. Last quarter, I think we said it was about $168 million outstanding. Today, it sits at $124 million outstanding. So, it went from a 19% advance rate against receivables to investment-grade retailers to about 14% to 15%. And so, we have good visibility into that. That continues to pay down. That is a past loan, and we're not carrying much concern about that. It's behaving as expected, and as I said, the payments are coming in a little bit faster than what we modeled, and so we're very pleased there. As it relates to Cantor, as you can imagine, I am going to be somewhat limited as to what I can say because of the ongoing legal action that we have but we have gotten a put in a receiver into the business and that was that with the support of the two ultra high net worth individuals that receiver has ordered all the appraisals for all the properties we are expecting those appraisals to come in in early March once Once we see what those appraisals are, we'll have a better understanding of the value of the collateral relative to the outstanding loan. The outstanding loan is $98 million, and then we can proceed from there. So, at this point, that's all that I can really tell you what we're up to. But we hope to have a better insight, better clarity when we present our first quarter numbers.
Operator
Thank you. The next question comes from Ibrahim Phunwala with Bank of America. Ibrahim, please go ahead.
Thank you. I guess maybe just one more on credit. So you provided good clarity in terms of the charge of provisioning outlook. Ken, is the takeaway also that you don't expect classified, like special mentions went up a little bit this quarter, like are you feeling good about the pipeline in terms of credit metrics should keep improving from here, or what could kind of cause any incremental deterioration that could surprise to the downside, if you can talk about that?
Yeah, so ASQAL remains stable, and there have been several notable areas of improvement. First, the number of new or rising credits has declined, so that's a positive. We also are seeing an increased willingness from the borrowers to collaborate and work to measurably reduce non-accrual loans by mid-year. You know, we always had this mantra, Tim Bruckner sitting across from me. He started it when he was Chief Credit Officer of Early Identification and Early Elevation. Our new Chief Credit Officer, Lynn Herndon, has taken that and modified it just slightly. early identification, early elevation, and now accelerated resolution. And so we are working to do that in order to move the classified and criticized numbers down. I will say they are clearly down from second quarter. And an interesting to note is that when we look at our credit quality and we look at, for example, classified loans to tier one capital plus ACL for Q4, that stands at 11.7%. But that compares very favorably to our peer group, $50 to $250 billion. And we're using Q3 peer median. So you have to give me a little bit of leeway here since we haven't calculated everything for Q4. But that stands at 14.7. We're at 300 basis points better. All right? So we do, our asset quality is improving. We came up off the floor of nearly zero losses. And so it looks a little bit worse than it is. But we're running with our guidance about equal to or slightly below where the peer group is. Tim Brockton, I don't know if I said too much. I don't know if you want to add anything to that. I think that's a great synopsis.
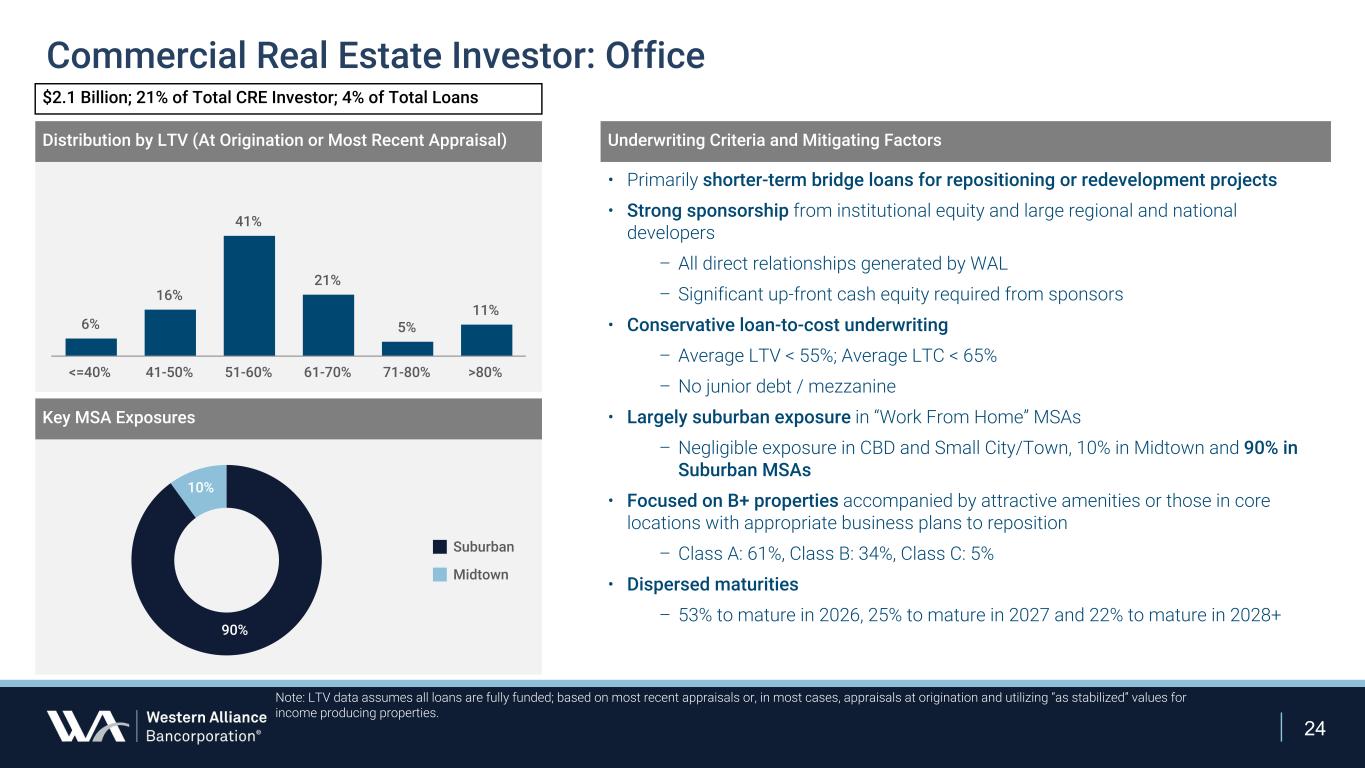
The focus, as we continue to communicate, was on office loans identified, I think, first discussed with this group in Q123. We've had ongoing discussion. There's a finite inventory of those loans, as we've continued to reference, and it's shrinking. And the classified office loans are down a third from mid-year 2025. And we have deliberate strategies at the asset level around each asset. The elevation brings our executive management team to bear on every situation. And those loans are marked to as is values, less liquidation costs. So, we feel that that takes the beta out as we work through resolution.
That was good, Kala. And again, just a separate question. I think, Ken, you talked about all the things over the years you've done to build the pipeline for future growth.
As we think about deposits, does inorganic make any sense at all for Western Alliance when we think about maybe transforming the distribution network, having a greater branch footprint are all of those things something that you think about or just given the momentum you have on organic growth all of that would be a huge distraction well I think the last part of your statements true it would be a huge distraction and when we first of all we do think about it we should think about it and it is a discussion point among this the senior members of the team one of the things we consider when we when we look at alternative inorganic opportunities is return on management's time. And if we went and did anything, would it take away from all the organic growth that we have? We think we're unique with this organic growth. We think it's important. We think it comes with less execution and operational risks. And I'll tell you the truth, it's certainly a lot more fun trying to grow a business and go into different products and services or regions than it is to sit on a call and announce, guess what? We just converted our general ledger and we're very excited about it uh so the entrepreneurial spirit here at the bank is more towards organic growth having said that if something fell into our lap that was able to make us bigger and better okay that's the key i i look at a lot of deals that are done for people wanting to get bigger all right what we are our criteria is bigger and better. So if there was a bigger and better that helped get us into a series of deposit lines that could reduce deposit costs, we'd be very excited to look at something like that. But bigger for big's sake, I think, would take away from the organic momentum that we have.
You know, Ken mentioned earlier that we have, you know, based upon the estimates out there for 2026, you know, one of the strongest EPS growth targets out there. And so the challenge, one of the challenge is to look at somebody else is to say, gosh, you know, we're growing at, you know, 19 percent. What is everyone else going to be doing and how that might be diluted because our growth is so strong and that not necessarily reflected in RPE?
Operator
Thank you. The next question comes from Matthew Clark with Piper Sandler. Matthew, please go ahead.
Hey, good morning. Thanks. Just want to circle back to the service charge line. Can you maybe quantify how much the Facebook disbursement fees were this quarter and it sounds like you've got some settlements coming to help you know mitigate that headwind going forward but how should we think about kind of a sustainable run rate there before we see you know some seasonality again in the fourth quarter yeah unfortunately we're not going to be able to give you any numbers around the settlement and what we generated in terms of the income.
Okay. That's number one. And number two, the thing about settlements, they're hard to predict for us quarter by quarter. You know, the Cambridge settlement, we actually thought was going to happen earlier in the year. And so when we get awarded these mandates, we feel great about them, but it's hard for us to predict when they're going to come in. We take a best guess, of course. And so we're not going to be able to give you any very specific data on that. It exposes us to too much competitive risk here. Sorry.
Okay. And then just on the interest-bearing deposit costs, you had a 55% beta this quarter. Could you give us the spot rate on deposits at the end of the year and then your outlook for that data going forward?
Yeah, sure. Happy to. So, the spot rate on interest-bearing deposits is 281, and that's down from the average rate for the quarter of 296, right? If you're already seeing it come down very nicely, and in terms of where it goes going from here, I'd put it in that mid-50s range is probably the right place when you think about that bucket.
Operator
Thank you. The next question comes from Gary Tenner with DA Davidson. Please go ahead.
Thanks. Good morning. I just had one quick follow-up to clarify the earlier question on the non-deposit cost expense growth for the year. So it sounds like from what you're saying, if I interpret it correctly, any flexibility there is around the cap 4 threshold more than any tethering of that expense growth to the revenue side, right? Investment for longer-term opportunities. Is that the right way?
And then the second question, just I guess also a follow-up on that commercial business or the commercial banking fee line, maybe just even any first quarter cents. I mean, it's kind of a blend of 3Q, 4Q, kind of the more reasonable expectation than anything.
Servicing fees, is that the question?
I think that's fair. I mean, it is going to fade from Q4 numbers. We can't really guide the checks out to where it's going to go. It is lumpy, but the pipeline for future transactions that we'd be out there in front in terms of helping facilitate disbursements looks good. But this was the largest case basically in U.S. history with 17 million claimants, and so that is going to be diminished in Q1, Q2.
Operator
Thank you. The next question comes from David Chiaverini with Jeffries. David, please go ahead.
Hi, thanks for taking the question. So I had a follow-up on the IBT network and tokenized deposits. There's been a lot of talk about the strong growth in stablecoins and the potential to disrupt banking deposits. Is it fair to say the IBT network is competing with stablecoins, and can you talk about the client uptake?
I don't think it competes. I think it complements. I mean, at the end of the day, you know, people still want, you know, to have fiat currency or be able to figure out how they can get back to fiat in quick order. And so, you know, what stable coins do is like my analogy has been McDonald's. And I don't think you're ever going to, you know, drive through a McDonald's and see, you know, a price of a Big Mac and, you know, in Satoshi's. But you're going to see it in U.S. dollars, and you're going to be able to pay for it with USDC with your phone with a flash. And in the background, we're there and saying, okay, so here's something, a thing that came in on USDC, delivery of that, and then what's going to be going out is to, you know, is U.S. dollars. Within our walled garden, working with stable chlorine providers, we facilitate that. We complement what they do more than compete.
Perfect. Thank you for that. And then I wanted to ask about average earning asset growth, particularly on securities portfolio and held-for-sale loans. Any commentary there? Is it right to think about average earning asset growth similarly to deposit growth?
Well, yeah, deposit growth will drive average earning asset growth. You're absolutely right there.
I mean, we're liability-based in terms of the value of the franchise. You know, we always have been. I think if you get it the other way around, you tend to push on credit underwriting. So, you know, we have a strong deposit growth at low cost, gives us opportunities to make good loans, move into, you know, high-quality securities, whatever that might be.
Operator
Thank you. Our next question comes from Bernard von Kizicki with Deutsche Bank. Please go ahead.
Hey, guys. Good morning. On the $535 to $585 million in ECR-related deposit costs you expect for 4-year 26, you've been rate dependent in the past, and now you're moving to shifting to lower ECR-related balances. Could you provide some sensitivity on the ECR costs if we get two rate cuts versus if the Fed is on pause from here.
You'll still be able to, you know, work on it. I think we're able to drive it down as well, but obviously it will not go down as much if we don't see those rate cuts, right? I think that will help us move it down further. So I think you can see that being a little bit more sticky if we don't see a drop in rates from here.
On loan growth, the $6 billion for your 26, so you noted the strong pipelines across business lines, and you noted the C&I will continue to lead the way. Just curious, any color you can share on how big CRE could be a contributor, given some of the expected maturities expected in 4-year 26?
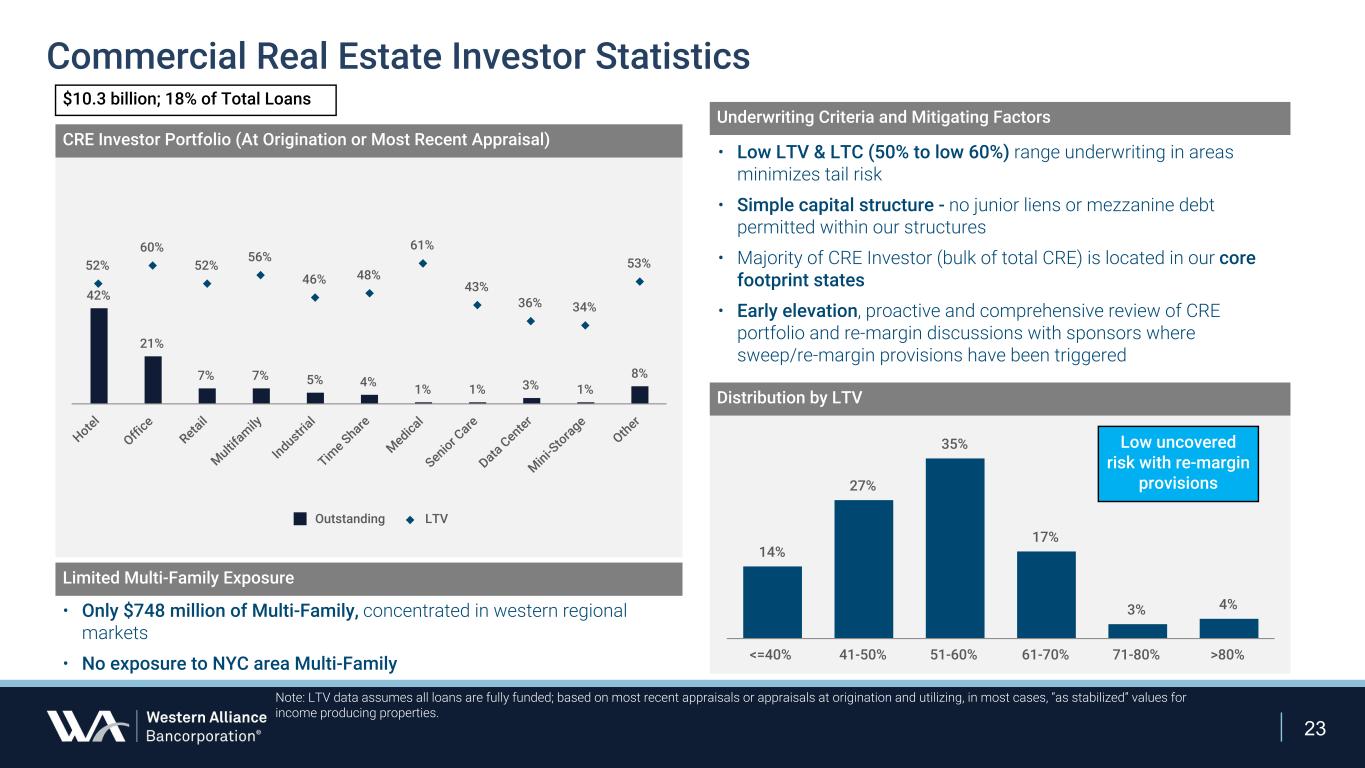
So, in 2025, you can see that we curtailed our growth and pressed out, in some cases, CRE loans as a percentage of total loans. They decreased. In 2026, we're not projecting significant dependence on CRE and our total growth numbers. So we call it a modest increase. The preponderance of the increase is coming from our commercial strategy based and segment based business strategies where we're aligning our fee based and treasury products with the credit discipline that we have and really with that garnering a broader, driving a broader spectrum of revenue. So you won't see a significant increase coming from CRE for those reasons.
Operator
Thank you. Our final question today comes from Anthony Elian with JPMorgan. Please go ahead. Your line is now open.
Your CET1 is 11% as a 4Q, which is at your target for this year. I know on the Outlook slide you say buybacks remain opportunistic, but should we expect buybacks to take a step back relative to the $57 million you did in 4Q, given you're already at your target for a CET1? Yeah.
So 11% is where we feel comfortable. Would we like that to rise? Yes. In regards of the stock buyback, we don't have anything really layered into our models. We're there in case there's a disruption in the market. We think the capital that we need needs to be there to support the $6 billion in loan growth. And if there's any weakness in the $6 billion in loan growth, then we can switch and support with the EPS goals by buying back the stock. But it wouldn't be something I'd model in, and if we reported that we bought back some stock, it's because we had an opportunity to buy at a discount price vis-a-vis the market.
Okay, and then on the ECR, so I get your guide, 535 to 585 this year, But is there a scenario where you can actually see that expense rise from last year or else it's to the $630 million? If I just think you're not getting as much relief this year from lower rates with only a couple of cuts, you call out the steady investments you have in growth on slide 18, and the ECR mix from Vishal's comments on the $8 billion of deposit growth is expected to stay constant. So I just think about those items as limiting some of the relief you're expected to get on ECR costs.
The first thing I'd say is, you know, part of that just at the beginning, remember, We did have a rate cut at the end of last year. So not all of that is actually based into where the current rates are. So I think you can continue to see some trend down there. And then we're going to continue pushing on the mix, right, appreciating what it is. It's hard to kind of say exactly for the year where this is going to land out. So trying to give you some broad-level parameters here. But we're going to continue to push, and the business is very focused on trying to drive down those costs.
You know, the irony here is that it could be higher than our guide if we have a very strong mortgage market, which is going to result in refis. And those balances that now have, you know, a refi coming in or a sale of a house, those come through and those can add, you know, hundreds of millions of dollars to those balances in short order. That would actually be a good problem to have. Now we've got more deposits, you know, from this sector that we're actually kind of controlling a little bit, have more of an opportunity to tamp down their pricing, but you still could have a higher dollar number. So there's a way that we missed that actually results in better value creation.
Operator
Thank you. Those are all the questions we have time for today and so I'll turn the call back to Ken Vecchione for closing remarks.
We're very pleased with the quarter, very proud of what we produced here and we thank you for taking the time to join us today to talk about our results and we look forward to talking to you again in a couple months for the Q1 results. Thank you and happy and healthy new year to everyone.
Operator
Thank you everyone for joining us today. This concludes our call and you may now disconnect your lines.