
W. P. Carey Inc 8-K, filed Feb 10, 2026
W. P. Carey Inc. (WPC)
8-K
2026-02-10
For: 2026-02-10
View Original
Added on
April 10, 2026
About this 8-K
W. P. Carey Inc filed this 8-K on February 10, 2026.
Items reported
- Item 2.02: Financial results
- Item 7.01: Regulation FD disclosure
- Item 9.01: Financial statements and exhibits
UNITED STATES SECURITIES AND EXCHANGE COMMISSION
Washington, D.C. 20549
FORM 8-K
CURRENT REPORT
Pursuant to Section 13 or 15(d) of the Securities Exchange Act of 1934
Date of report (Date of earliest event reported): February 10, 2026

(Exact Name of Registrant as Specified in its Charter)
| (State or other jurisdiction of incorporation) | (Commission File Number) | (IRS Employer Identification No.) | |||||||||
| (Address of principal executive offices) | (Zip Code) | ||||||||||
Registrant’s telephone number, including area code: (212 ) 492-1100
(Former name or former address, if changed since last report.)
Check the appropriate box below if the Form 8-K filing is intended to simultaneously satisfy the filing obligation of the registrant under any of the following provisions:
Securities registered pursuant to Section 12(b) of the Act:
| Title of each class | Trading Symbol(s) | Name of each exchange on which registered | ||||||||||||
Indicate by check mark whether the registrant is an emerging growth company as defined in Rule 405 of the Securities Act of 1933 (§230.405 of this chapter) or Rule 12b-2 of the Securities Exchange Act of 1934 (§240.12b-2 of this chapter).
Emerging growth company ☐
If an emerging growth company, indicate by check mark if the registrant has elected not to use the extended transition period for complying with any new or revised financial accounting standards provided pursuant to Section 13(a) of the Exchange Act. ☐
Item 2.02 Results of Operations and Financial Condition.
On February 10, 2026 , W. P. Carey Inc. (the “Company”) issued an earnings release announcing its financial results for the quarter ended December 31, 2025. A copy of the earnings release is attached as Exhibit 99.1.
The information furnished pursuant to this Item 2.02, including Exhibit 99.1, shall not be deemed to be “filed” for the purposes of Section 18 of the Securities Exchange Act of 1934, as amended (the “Exchange Act”), or otherwise subject to the liability of that Section, and shall not be incorporated by reference into any filing under the Securities Act of 1933, as amended (the “Securities Act”), or the Exchange Act.
Item 7.01 Regulation FD Disclosure.
On February 10, 2026 , the Company made available certain unaudited supplemental financial information at December 31, 2025. A copy of this supplemental information is attached as Exhibit 99.2.
On February 10, 2026 , the Company posted its fourth quarter investor presentation on its website at http://www.wpcarey.com. A copy of the investor presentation is also attached as Exhibit 99.3.
The information furnished pursuant to this Item 7.01, including Exhibits 99.2 and 99.3, shall not be deemed to be “filed” for the purposes of Section 18 of the Exchange Act, or otherwise subject to the liability of that Section, and shall not be incorporated by reference into any filing under the Securities Act or the Exchange Act.
Item 9.01 Financial Statements and Exhibits.
(d) Exhibits
| Exhibit No. | Description | |||||||
| 99.1 | ||||||||
| 99.2 | ||||||||
| 99.3 | ||||||||
| 104 | Cover Page Interactive Data File (embedded within the Inline XBRL document). | |||||||
SIGNATURES
Pursuant to the requirements of the Securities Exchange Act of 1934, the registrant has duly caused this Report to be signed on its behalf by the undersigned, thereunto duly authorized.
| W. P. Carey Inc. | |||||||||||
| Date: | By: | /s/ ToniAnn Sanzone | |||||||||
| ToniAnn Sanzone | |||||||||||
| Chief Financial Officer | |||||||||||
Exhibit 99.1

W. P. Carey Announces Fourth Quarter and Full Year 2025 Financial Results
New York, NY – February 10, 2026 – W. P. Carey Inc. (NYSE: WPC) (W. P. Carey or the Company), a net lease real estate investment trust, today reported its financial results for the fourth quarter and full year ended December 31, 2025.
Financial Highlights
| 2025 | |||||||||||
Fourth Quarter | Full Year | ||||||||||
| Net income attributable to W. P. Carey (millions) | $148.3 | $466.4 | |||||||||
| Diluted earnings per share | $0.67 | $2.11 | |||||||||
| AFFO (millions) | $281.1 | $1,098.2 | |||||||||
| AFFO per diluted share | $1.27 | $4.97 | |||||||||
•2026 AFFO guidance range of between $5.13 and $5.23 per diluted share announced, based on anticipated full-year investment volume of between $1.25 billion and $1.75 billion
•Fourth quarter cash dividend of $0.920 per share, equivalent to an annualized dividend rate of $3.68 per share, up 4.5% year over year
Real Estate Portfolio
•Record annual investment volume of $2.1 billion for 2025, including $625.1 million completed during the fourth quarter
•Year-to-date investment volume of $312.4 million
•Active capital investments and commitments of $238.3 million scheduled to be completed in 2026, including three projects totaling $50.0 million completed year to date
•Gross disposition proceeds of $1.5 billion for 2025, including $507.0 million completed during the fourth quarter
•Year-to-date gross disposition proceeds of $60.2 million
•Contractual same-store rent growth of 2.4% year over year
Balance Sheet and Capitalization
•$422.6 million of equity sold under the Company’s ATM program subject to forward sale agreements during 2025, all of which currently remains available for settlement
W. P. Carey Inc. 12/31/2025 Earnings Release 8-K – 1
MANAGEMENT COMMENTARY
“2025 was a year of meaningful progress for W. P. Carey, as execution of our business model translated into strong performance and laid the foundation for attractive, sustainable growth,” said Jason Fox, Chief Executive Officer.
“The momentum we built throughout the year has carried into 2026. Healthy year‑to‑date investment volume and an active pipeline are supported by our ability to draw on multiple sources of accretive equity capital — with the vast majority of our anticipated 2026 equity needs already accounted for. Furthermore, we expect to maintain an internal growth rate that’s among the best in the net lease sector, contributing a meaningful proportion of our overall AFFO growth.
“At the midpoint, our initial AFFO guidance implies growth in the low-to-mid 4% range, even as we maintain a conservative stance toward both investment volume and potential credit-related rent loss.”
QUARTERLY FINANCIAL RESULTS
Revenues
•Revenues, including reimbursable costs, for the 2025 fourth quarter totaled $444.5 million, up 9.4% from $406.2 million for the 2024 fourth quarter.
◦Lease revenues increased primarily due to net investment activity and rent escalations.
◦Income from finance leases and loans receivable increased primarily as a result of net investment activity.
◦Operating property revenues decreased primarily due to the sale of 63 self-storage operating properties and a student housing operating property, as well as the conversion of four self-storage operating properties to net leases during 2025.
Net Income Attributable to W. P. Carey
•Net income attributable to W. P. Carey for the 2025 fourth quarter was $148.3 million, up 215.5% from $47.0 million for the 2024 fourth quarter, due primarily to lower mark-to-market losses recognized on the Company’s shares of Lineage, a higher gain on sale of real estate and the accretive impact of net investment activity, partly offset by lower gains from remeasurement of foreign debt.
Adjusted Funds from Operations (AFFO)
•AFFO for the 2025 fourth quarter was $1.27 per diluted share, up 5.0% from $1.21 per diluted share for the 2024 fourth quarter, primarily reflecting the accretive impact of net investment activity and rent escalations, partly offset by outstanding rents collected during the 2024 fourth quarter in connection with a disposition during that period.
Note: Further information concerning AFFO, which is a non-GAAP supplemental performance metric, is presented in the accompanying tables and related notes.
Dividend
•On December 15, 2025, the Company reported that its Board of Directors increased its quarterly cash dividend to $0.920 per share, equivalent to an annualized dividend rate of $3.68 per share, representing a 4.5% increase compared to the 2024 fourth quarter. The dividend was paid on January 15, 2026 to shareholders of record as of December 31, 2025.
W. P. Carey Inc. 12/31/2025 Earnings Release 8-K – 2
FULL YEAR FINANCIAL RESULTS
Revenues
•Revenues, including reimbursable costs, for the 2025 full year totaled $1.72 billion, up 8.9% from $1.58 billion for the 2024 full year.
◦Lease revenues increased primarily due to net investment activity and rent escalations.
◦Income from finance leases and loans receivable increased primarily as a result of investment activity, partly offset by the disposition of the U-Haul portfolio during the 2024 first quarter.
◦Operating property revenues decreased primarily due to the sale of 63 self-storage operating properties and a student housing operating property during 2025, as well as the conversion of three self-storage operating properties to net leases during 2024 and four during 2025.
Net Income Attributable to W. P. Carey
•Net income attributable to W. P. Carey for the 2025 full year totaled $466.4 million, up 1.2% from $460.8 million for the 2024 full year, due primarily to a higher gain on sale of real estate, lower mark-to-market losses recognized on the Company’s shares of Lineage and the accretive impact of net investment activity, partly offset by higher losses from remeasurement of foreign debt, a gain on change in control of interests recognized in connection with the Company’s acquisition of a third-party joint venture partner’s interest in nine self-storage operating properties during 2024 and higher impairment charges.
AFFO
•AFFO for the 2025 full year was $4.97 per diluted share, up 5.7% from $4.70 per diluted share for the 2024 full year, primarily reflecting the accretive impact of net investment activity and rent escalations.
Note: Further information concerning AFFO, which is a non-GAAP supplemental performance metric, is presented in the accompanying tables and related notes.
Dividend
•Dividends declared during 2025 totaled $3.620 per share, an increase of 3.7% compared to total dividends declared during 2024 of $3.490 per share.
AFFO GUIDANCE
•For the 2026 full year, the Company expects to report AFFO of between $5.13 and $5.23 per diluted share, based on the following key assumptions:
(i) investment volume of between $1.25 billion and $1.75 billion;
(ii) disposition volume of between $250 million and $750 million;
(iii) total general and administrative expenses of between $103 million and $106 million;
(iv) property expenses, excluding reimbursable tenant costs, of between $56 million and $60 million; and
(v) tax expense (on an AFFO basis) of between $45 million and $49 million.
Note: The Company does not provide guidance on net income. The Company only provides guidance on AFFO and does not provide a reconciliation of this forward-looking non-GAAP guidance to net income due to the inherent difficulty in quantifying certain items necessary to provide such reconciliation as a result of their unknown effect, timing and potential significance. Examples of such items include impairments of assets, gains and losses from sales of assets, and depreciation and amortization from new acquisitions.
W. P. Carey Inc. 12/31/2025 Earnings Release 8-K – 3
REAL ESTATE PORTFOLIO
Investments
•During the 2025 fourth quarter, the company completed investments totaling $625.1 million, bringing total investment volume for the year ended December 31, 2025 to a record $2.1 billion.
•Year to date through February 10, 2026, the Company completed investments totaling $312.4 million, comprising sale-leasebacks and acquisitions totaling $262.4 million and the completion of capital investments and commitments totaling $50.0 million.
•As of December 31, 2025, the Company had 13 capital investments and commitments totaling $238.3 million scheduled to be completed during 2026 (including three projects totaling $50.0 million completed year to date, as noted above). In addition, the Company has two capital investments and commitments totaling $101.5 million scheduled to be completed during 2027.
Dispositions
•During the 2025 fourth quarter, the Company disposed of 44 properties for gross proceeds totaling $507.0 million, bringing total dispositions for the year ended December 31, 2025, to 128 properties for gross proceeds totaling $1.5 billion.
•2025 fourth quarter dispositions included the sales of 31 self-storage operating properties for gross proceeds totaling $323.2 million, bringing total sales of self-storage operating properties for the year ended December 31, 2025, to 63 properties for gross proceeds totaling $784.0 million.
•Year to date through February 10, 2026, the company disposed of four properties for gross proceeds totaling $60.2 million.
Contractual Same-Store Rent Growth
•As of December 31, 2025, contractual same-store rent growth was 2.4% year over year, on a constant currency basis.
Rent Loss from Tenant Credit Events
•For the 2025 full year, the Company experienced rent loss from tenant credit events totaling $6.4 million.
Composition
•As of December 31, 2025, the Company’s net lease portfolio consisted of 1,682 properties, comprising 183 million square feet leased to 371 tenants, with a weighted-average lease term of 12.0 years and an occupancy rate of 98.0%. In addition, the Company owned 11 self-storage operating properties, four hotel operating properties and one student housing operating property, totaling approximately 1.3 million square feet.
BALANCE SHEET AND CAPITALIZATION
Liquidity
•As of December 31, 2025, the Company had total liquidity of $2.2 billion, primarily comprising $1.6 billion of available capacity under its Senior Unsecured Credit Facility (net of amounts reserved for standby letters of credit), in addition to cash and cash equivalents, cash held at qualified intermediaries and available net proceeds under unsettled forward equity sale agreements.
Forward Equity
•During 2025, the Company sold 6,258,496 shares of common stock under its ATM program subject to forward sale agreements, at a weighted-average gross price of $67.53 per share, representing total gross proceeds of approximately $422.6 million, all of which currently remains available for settlement.
W. P. Carey Inc. 12/31/2025 Earnings Release 8-K – 4
•Sales of common stock subject to forward sale agreements in 2025 included 3,501,126 shares sold during the fourth quarter at a weighted-average gross price of $67.23 per share, representing total gross proceeds of approximately $235.4 million.
* * * * *
Supplemental Information
The Company has provided supplemental unaudited financial and operating information regarding the 2025 fourth quarter and certain prior quarters, including a description of non-GAAP financial measures and reconciliations to GAAP measures, in a Current Report on Form 8-K filed with the Securities and Exchange Commission (SEC) on February 10, 2026, and made available on the Company’s website at ir.wpcarey.com/investor-relations.
* * * * *
Live Conference Call and Audio Webcast Scheduled for Wednesday, February 11, 2026 at 12:00 p.m. Eastern Time
Please dial in at least 10 minutes prior to the start time.
Date/Time: Wednesday, February 11, 2026 at 12:00 p.m. Eastern Time
Call-in Number: 1 (877) 465-1289 (U.S.) or +1 (201) 689-8762 (international)
Live Audio Webcast and Replay: www.wpcarey.com/earnings
* * * * *
W. P. Carey Inc.
W. P. Carey ranks among the largest net lease REITs with a well-diversified portfolio of high-quality, operationally critical commercial real estate, which includes 1,682 net lease properties covering approximately 183 million square feet as of December 31, 2025. With offices in New York, London, Amsterdam and Dallas, the company remains focused on investing primarily in single-tenant, industrial, warehouse and retail properties located in the U.S. and Europe, under long-term net leases with built-in rent escalations.
www.wpcarey.com
* * * * *
W. P. Carey Inc. 12/31/2025 Earnings Release 8-K – 5
Cautionary Statement Concerning Forward-Looking Statements
Certain of the matters discussed in this communication constitute forward-looking statements within the meaning of the Securities Act of 1933 and the Securities Exchange Act of 1934, both as amended by the Private Securities Litigation Reform Act of 1995. The forward-looking statements include, among other things, statements regarding the intent, belief or expectations of W. P. Carey and can be identified by the use of words such as “may,” “will,” “should,” “would,” “will be,” “goals,” “believe,” “project,” “expect,” “anticipate,” “intend,” “estimate” “opportunities,” “possibility,” “strategy,” “maintain” or the negative version of these words and other comparable terms. These forward-looking statements include, but are not limited to, statements made by Mr. Jason Fox regarding investment pipeline, access to capital, internal growth and expectations for future AFFO growth. These statements are based on the current expectations of our management, and it is important to note that our actual results could be materially different from those projected in such forward-looking statements. There are a number of risks and uncertainties that could cause actual results to differ materially from the forward-looking statements. Other unknown or unpredictable risks or uncertainties, like the risks related to fluctuating interest rates, the impact of inflation and tariffs on our tenants and us, the effects of pandemics and global outbreaks of contagious diseases, and domestic or geopolitical crises, such as terrorism, military conflict, war or the perception that hostilities may be imminent, political instability or civil unrest, or other conflict, and those additional risk factors discussed in reports that we have filed with the SEC, could also have material adverse effects on our future results, performance or achievements. Discussions of some of these other important factors and assumptions are contained in W. P. Carey’s filings with the SEC and are available at the SEC’s website at http://www.sec.gov, including Part I, Item 1A. Risk Factors in W. P. Carey’s Annual Report on Form 10-K for the fiscal year ended December 31, 2025. Investors are cautioned not to place undue reliance on these forward-looking statements, which speak only as of the date of this communication, unless noted otherwise. Except as required under the federal securities laws and the rules and regulations of the SEC, W. P. Carey does not undertake any obligation to release publicly any revisions to the forward-looking statements to reflect events or circumstances after the date of this communication or to reflect the occurrence of unanticipated events.
Institutional Investors:
Peter Sands
1 (212) 492-1110
institutionalir@wpcarey.com
Individual Investors:
W. P. Carey Inc.
1 (212) 492-8920
ir@wpcarey.com
Press Contact:
Anna McGrath
1 (212) 492-1166
amcgrath@wpcarey.com
* * * * *
W. P. Carey Inc. 12/31/2025 Earnings Release 8-K – 6
W. P. CAREY INC.
Consolidated Balance Sheets
(in thousands, except share and per share amounts)
| December 31, | |||||||||||
| 2025 | 2024 | ||||||||||
| Assets | |||||||||||
| Investments in real estate: | |||||||||||
| Land, buildings and improvements — net lease and other | $ | 14,451,306 | $ | 12,842,869 | |||||||
| Land, buildings and improvements — operating properties | 286,079 | 1,198,676 | |||||||||
| Net investments in finance leases and loans receivable | 1,171,886 | 798,259 | |||||||||
In-place lease intangible assets and other | 2,466,199 | 2,297,572 | |||||||||
Above-market rent intangible assets | 668,707 | 665,495 | |||||||||
| Investments in real estate | 19,044,177 | 17,802,871 | |||||||||
Accumulated depreciation and amortization (a) | (3,578,330) | (3,222,396) | |||||||||
| Assets held for sale, net | 3,327 | — | |||||||||
| Net investments in real estate | 15,469,174 | 14,580,475 | |||||||||
| Equity method investments | 310,178 | 301,115 | |||||||||
| Cash and cash equivalents | 155,329 | 640,373 | |||||||||
| Other assets, net | 1,068,480 | 1,045,218 | |||||||||
| Goodwill | 987,071 | 967,843 | |||||||||
| Total assets | $ | 17,990,232 | $ | 17,535,024 | |||||||
| Liabilities and Equity | |||||||||||
| Debt: | |||||||||||
| Senior unsecured notes, net | $ | 6,950,261 | $ | 6,505,907 | |||||||
| Unsecured term loans, net | 1,196,366 | 1,075,826 | |||||||||
| Unsecured revolving credit facility | 435,417 | 55,448 | |||||||||
| Non-recourse mortgages, net | 140,646 | 401,821 | |||||||||
| Debt, net | 8,722,690 | 8,039,002 | |||||||||
| Accounts payable, accrued expenses and other liabilities | 670,038 | 596,994 | |||||||||
Below-market rent and other intangible liabilities, net | 104,055 | 119,831 | |||||||||
| Deferred income taxes | 151,820 | 147,461 | |||||||||
| Dividends payable | 207,487 | 197,612 | |||||||||
| Total liabilities | 9,856,090 | 9,100,900 | |||||||||
Preferred stock, $0.001 par value, 50,000,000 shares authorized; none issued | — | — | |||||||||
Common stock, $0.001 par value, 450,000,000 shares authorized; 219,145,876 and 218,848,844 shares, respectively, issued and outstanding | 219 | 219 | |||||||||
| Additional paid-in capital | 11,830,737 | 11,805,179 | |||||||||
| Distributions in excess of accumulated earnings | (3,539,592) | (3,203,974) | |||||||||
| Deferred compensation obligation | 80,239 | 78,503 | |||||||||
| Accumulated other comprehensive loss | (253,346) | (250,232) | |||||||||
| Total stockholders’ equity | 8,118,257 | 8,429,695 | |||||||||
| Noncontrolling interests | 15,885 | 4,429 | |||||||||
| Total equity | 8,134,142 | 8,434,124 | |||||||||
| Total liabilities and equity | $ | 17,990,232 | $ | 17,535,024 | |||||||
________
(a)Includes $2.1 billion and $1.8 billion of accumulated depreciation on buildings and improvements as of December 31, 2025 and 2024, respectively, and $1.5 billion and $1.4 billion of accumulated amortization on lease intangibles as of December 31, 2025 and 2024, respectively.
W. P. Carey Inc. 12/31/2025 Earnings Release 8-K – 7
W. P. CAREY INC.
Quarterly Consolidated Statements of Income
(in thousands, except share and per share amounts)
| Three Months Ended | |||||||||||||||||
| December 31, 2025 | September 30, 2025 | December 31, 2024 | |||||||||||||||
| Revenues | |||||||||||||||||
| Real Estate: | |||||||||||||||||
| Lease revenues | $ | 389,154 | $ | 372,087 | $ | 351,394 | |||||||||||
| Income from finance leases and loans receivable | 26,716 | 26,498 | 16,796 | ||||||||||||||
| Operating property revenues | 18,379 | 26,771 | 34,132 | ||||||||||||||
| Other lease-related income | 8,137 | 3,660 | 1,329 | ||||||||||||||
| 442,386 | 429,016 | 403,651 | |||||||||||||||
| Investment Management: | |||||||||||||||||
| Asset management revenue | 1,085 | 1,218 | 1,461 | ||||||||||||||
| Other advisory income and reimbursements | 1,076 | 1,069 | 1,053 | ||||||||||||||
| 2,161 | 2,287 | 2,514 | |||||||||||||||
| 444,547 | 431,303 | 406,165 | |||||||||||||||
| Operating Expenses | |||||||||||||||||
| Depreciation and amortization | 145,339 | 125,586 | 115,770 | ||||||||||||||
| Impairment charges — real estate | 39,690 | 19,474 | 27,843 | ||||||||||||||
| General and administrative | 25,899 | 23,656 | 24,254 | ||||||||||||||
| Reimbursable tenant costs | 19,371 | 14,562 | 15,661 | ||||||||||||||
| Property expenses, excluding reimbursable tenant costs | 13,859 | 14,637 | 12,580 | ||||||||||||||
| Operating property expenses | 11,863 | 15,049 | 16,586 | ||||||||||||||
| Stock-based compensation expense | 8,650 | 11,153 | 9,667 | ||||||||||||||
| Merger and other expenses | 478 | 1,021 | (484) | ||||||||||||||
| 265,149 | 225,138 | 221,877 | |||||||||||||||
| Other Income and Expenses | |||||||||||||||||
| Interest expense | (75,431) | (75,226) | (70,883) | ||||||||||||||
| Gain on sale of real estate, net | 52,791 | 44,401 | 4,480 | ||||||||||||||
Other gains and (losses) (a) | (10,131) | (31,011) | (77,224) | ||||||||||||||
| Earnings from equity method investments | 4,109 | 2,361 | 302 | ||||||||||||||
Non-operating income (b) | 2,516 | 3,030 | 13,847 | ||||||||||||||
| (26,146) | (56,445) | (129,478) | |||||||||||||||
| Income before income taxes | 153,252 | 149,720 | 54,810 | ||||||||||||||
| Benefit from (provision for) income taxes | 1,310 | (8,495) | (7,772) | ||||||||||||||
| Net Income | 154,562 | 141,225 | 47,038 | ||||||||||||||
Net income attributable to noncontrolling interests (c) | (6,243) | (229) | (15) | ||||||||||||||
| Net Income Attributable to W. P. Carey | $ | 148,319 | $ | 140,996 | $ | 47,023 | |||||||||||
| Basic Earnings Per Share | $ | 0.67 | $ | 0.64 | $ | 0.21 | |||||||||||
| Diluted Earnings Per Share | $ | 0.67 | $ | 0.64 | $ | 0.21 | |||||||||||
| Weighted-Average Shares Outstanding | |||||||||||||||||
| Basic | 220,469,827 | 220,562,909 | 220,223,239 | ||||||||||||||
| Diluted | 221,169,776 | 221,087,833 | 220,577,900 | ||||||||||||||
| Dividends Declared Per Share | $ | 0.920 | $ | 0.910 | $ | 0.880 | |||||||||||
__________
(a)Amount for the three months ended December 31, 2025 is primarily comprised of a mark-to-market unrealized loss for our investment in shares of Lineage of $11.7 million and non-cash unrealized gains on non-hedging derivatives of $1.1 million.
(b)Amount for the three months ended December 31, 2025 is comprised of a dividend of $2.8 million from our investment in shares of Lineage, interest income on deposits of $1.0 million and realized losses on foreign currency exchange derivatives of $1.3 million.
(c)Amount for the three months ended December 31, 2025 includes a noncontrolling interest’s $6.0 million share of a gain on sale of real estate.
W. P. Carey Inc. 12/31/2025 Earnings Release 8-K – 8
W. P. CAREY INC.
Full Year Consolidated Statements of Income
(in thousands, except share and per share amounts)
| Years Ended December 31, | |||||||||||
| 2025 | 2024 | ||||||||||
| Revenues | |||||||||||
| Real Estate: | |||||||||||
| Lease revenues | $ | 1,479,204 | $ | 1,331,788 | |||||||
| Income from finance leases and loans receivable | 90,948 | 73,262 | |||||||||
| Operating property revenues | 112,531 | 146,813 | |||||||||
| Other lease-related income | 24,561 | 20,334 | |||||||||
| 1,707,244 | 1,572,197 | ||||||||||
| Investment Management: | |||||||||||
| Asset management and other revenue | 4,957 | 6,597 | |||||||||
| Other advisory income and reimbursements | 4,284 | 4,224 | |||||||||
| 9,241 | 10,821 | ||||||||||
| 1,716,485 | 1,583,018 | ||||||||||
| Operating Expenses | |||||||||||
| Depreciation and amortization | 521,127 | 487,724 | |||||||||
| General and administrative | 100,672 | 98,969 | |||||||||
| Impairment charges — real estate | 70,367 | 43,595 | |||||||||
| Reimbursable tenant costs | 68,743 | 55,975 | |||||||||
| Operating property expenses | 60,177 | 70,866 | |||||||||
| Property expenses, excluding reimbursable tenant costs | 53,825 | 49,677 | |||||||||
| Stock-based compensation expense | 39,894 | 40,894 | |||||||||
| Merger and other expenses | 2,247 | 4,457 | |||||||||
| 917,052 | 852,157 | ||||||||||
| Other Income and Expenses | |||||||||||
| Interest expense | (291,256) | (277,367) | |||||||||
| Other gains and (losses) | (232,107) | (137,988) | |||||||||
| Gain on sale of real estate, net | 193,793 | 74,822 | |||||||||
| Earnings from equity method investments | 18,009 | 17,926 | |||||||||
| Non-operating income | 16,951 | 52,236 | |||||||||
| Gain on change in control of interests | — | 31,849 | |||||||||
| (294,610) | (238,522) | ||||||||||
| Income before income taxes | 504,823 | 492,339 | |||||||||
| Provision for income taxes | (31,908) | (31,709) | |||||||||
| Net Income | 472,915 | 460,630 | |||||||||
| Net (income) loss attributable to noncontrolling interests | (6,556) | 209 | |||||||||
| Net Income Attributable to W. P. Carey | $ | 466,359 | $ | 460,839 | |||||||
| Basic Earnings Per Share | $ | 2.11 | $ | 2.09 | |||||||
| Diluted Earnings Per Share | $ | 2.11 | $ | 2.09 | |||||||
| Weighted-Average Shares Outstanding | |||||||||||
| Basic | 220,501,239 | 220,168,325 | |||||||||
| Diluted | 221,112,343 | 220,520,457 | |||||||||
| Dividends Declared Per Share | $ | 3.620 | $ | 3.490 | |||||||
W. P. Carey Inc. 12/31/2025 Earnings Release 8-K – 9
W. P. CAREY INC.
Quarterly Reconciliation of Net Income to Adjusted Funds from Operations (AFFO) (Unaudited)
(in thousands, except share and per share amounts)
| Three Months Ended | |||||||||||||||||
| December 31, 2025 | September 30, 2025 | December 31, 2024 | |||||||||||||||
| Net income attributable to W. P. Carey | $ | 148,319 | $ | 140,996 | $ | 47,023 | |||||||||||
| Adjustments: | |||||||||||||||||
| Depreciation and amortization of real property | 144,641 | 124,906 | 115,107 | ||||||||||||||
| Gain on sale of real estate, net | (52,791) | (44,401) | (4,480) | ||||||||||||||
| Impairment charges — real estate | 39,690 | 19,474 | 27,843 | ||||||||||||||
Proportionate share of adjustments to earnings from equity method investments (a) | 2,255 | 2,271 | 2,879 | ||||||||||||||
Proportionate share of adjustments for noncontrolling interests (b) (c) | 5,958 | (82) | (79) | ||||||||||||||
| Total adjustments | 139,753 | 102,168 | 141,270 | ||||||||||||||
FFO (as defined by NAREIT) Attributable to W. P. Carey (d) | 288,072 | 243,164 | 188,293 | ||||||||||||||
| Adjustments: | |||||||||||||||||
| Straight-line and other leasing and financing adjustments | (20,758) | (20,424) | (24,849) | ||||||||||||||
| Tax (benefit) expense – deferred and other | (11,708) | (1,215) | 96 | ||||||||||||||
Other (gains) and losses (e) | 10,131 | 31,011 | 77,224 | ||||||||||||||
| Stock-based compensation | 8,650 | 11,153 | 9,667 | ||||||||||||||
| Amortization of deferred financing costs | 4,888 | 4,874 | 4,851 | ||||||||||||||
| Above- and below-market rent intangible lease amortization, net | 941 | 4,363 | 10,047 | ||||||||||||||
| Other amortization and non-cash items | 589 | 587 | 557 | ||||||||||||||
| Merger and other expenses | 478 | 1,021 | (484) | ||||||||||||||
Proportionate share of adjustments to earnings from equity method investments (a) | (43) | 2,194 | 2,266 | ||||||||||||||
Proportionate share of adjustments for noncontrolling interests (b) | (116) | (99) | (62) | ||||||||||||||
| Total adjustments | (6,948) | 33,465 | 79,313 | ||||||||||||||
AFFO Attributable to W. P. Carey (d) | $ | 281,124 | $ | 276,629 | $ | 267,606 | |||||||||||
| Summary | |||||||||||||||||
FFO (as defined by NAREIT) attributable to W. P. Carey (d) | $ | 288,072 | $ | 243,164 | $ | 188,293 | |||||||||||
FFO (as defined by NAREIT) attributable to W. P. Carey per diluted share (d) | $ | 1.30 | $ | 1.10 | $ | 0.85 | |||||||||||
AFFO attributable to W. P. Carey (d) | $ | 281,124 | $ | 276,629 | $ | 267,606 | |||||||||||
AFFO attributable to W. P. Carey per diluted share (d) | $ | 1.27 | $ | 1.25 | $ | 1.21 | |||||||||||
| Diluted weighted-average shares outstanding | 221,169,776 | 221,087,833 | 220,577,900 | ||||||||||||||
W. P. Carey Inc. 12/31/2025 Earnings Release 8-K – 10
W. P. CAREY INC.
Full-Year Reconciliation of Net Income to Adjusted Funds from Operations (AFFO) (Unaudited)
(in thousands, except share and per share amounts)
| Years Ended December 31, | |||||||||||
| 2025 | 2024 | ||||||||||
| Net income attributable to W. P. Carey | $ | 466,359 | $ | 460,839 | |||||||
| Adjustments: | |||||||||||
| Depreciation and amortization of real property | 518,414 | 485,088 | |||||||||
| Gain on sale of real estate, net | (193,793) | (74,822) | |||||||||
| Impairment charges — real estate | 70,367 | 43,595 | |||||||||
| Gain on change in control of interests | — | (31,849) | |||||||||
Proportionate share of adjustments to earnings from equity method investments (a) | 8,400 | 11,871 | |||||||||
Proportionate share of adjustments for noncontrolling interests (b) | 5,716 | (379) | |||||||||
| Total adjustments | 409,104 | 433,504 | |||||||||
FFO (as defined by NAREIT) Attributable to W. P. Carey (d) | 875,463 | 894,343 | |||||||||
| Adjustments: | |||||||||||
| Other (gains) and losses | 232,107 | 137,988 | |||||||||
| Straight-line and other leasing and financing adjustments | (75,589) | (80,899) | |||||||||
| Stock-based compensation | 39,894 | 40,894 | |||||||||
| Amortization of deferred financing costs | 19,172 | 18,845 | |||||||||
| Above- and below-market rent intangible lease amortization, net | 11,488 | 26,144 | |||||||||
| Tax benefit – deferred and other | (10,885) | (4,245) | |||||||||
| Other amortization and non-cash items | 2,315 | 2,303 | |||||||||
| Merger and other expenses | 2,247 | 4,457 | |||||||||
Proportionate share of adjustments to earnings from equity method investments (a) | 2,374 | (3,531) | |||||||||
Proportionate share of adjustments for noncontrolling interests (b) | (343) | (354) | |||||||||
| Total adjustments | 222,780 | 141,602 | |||||||||
AFFO Attributable to W. P. Carey (d) | $ | 1,098,243 | $ | 1,035,945 | |||||||
| Summary | |||||||||||
FFO (as defined by NAREIT) attributable to W. P. Carey (d) | $ | 875,463 | $ | 894,343 | |||||||
FFO (as defined by NAREIT) attributable to W. P. Carey per diluted share (d) | $ | 3.96 | $ | 4.06 | |||||||
AFFO attributable to W. P. Carey (d) | $ | 1,098,243 | $ | 1,035,945 | |||||||
AFFO attributable to W. P. Carey per diluted share (d) | $ | 4.97 | $ | 4.70 | |||||||
| Diluted weighted-average shares outstanding | 221,112,343 | 220,520,457 | |||||||||
(a)Equity income, including amounts that are not typically recognized for FFO and AFFO, is recognized within Earnings from equity method investments on the consolidated statements of income. This represents adjustments to equity income to reflect FFO and AFFO on a pro rata basis.
(b)Adjustments disclosed elsewhere in this reconciliation are on a consolidated basis. This adjustment reflects our FFO or AFFO on a pro rata basis.
(c)Amount for the three months ended December 31, 2025 includes a noncontrolling interest’s $6.0 million share of a gain on sale of real estate.
(d)FFO and AFFO are non-GAAP measures. See below for a description of FFO and AFFO.
(e)Amount for the three months ended December 31, 2025 is primarily comprised of a mark-to-market unrealized loss for our investment in shares of Lineage of $11.7 million and non-cash unrealized gains on non-hedging derivatives of $1.1 million.
W. P. Carey Inc. 12/31/2025 Earnings Release 8-K – 11
Non-GAAP Financial Disclosure
Funds from Operations (FFO) and Adjusted Funds from Operations (AFFO)
Due to certain unique operating characteristics of real estate companies, as discussed below, the National Association of Real Estate Investment Trusts (NAREIT), an industry trade group, has promulgated a non-GAAP measure known as FFO, which we believe to be an appropriate supplemental measure, when used in addition to and in conjunction with results presented in accordance with GAAP, to reflect the operating performance of a REIT. The use of FFO is recommended by the REIT industry as a supplemental non-GAAP measure. FFO is not equivalent to, nor a substitute for, net income or loss as determined under GAAP.
We define FFO, a non-GAAP measure, consistent with the standards established by the White Paper on FFO approved by the Board of Governors of NAREIT, as restated in December 2018. The White Paper defines FFO as net income or loss computed in accordance with GAAP, excluding gains or losses from the sale of certain real estate, impairment charges on real estate or other assets incidental to the company’s main business, gains or losses on changes in control of interests in real estate and depreciation and amortization from real estate assets; and after adjustments for unconsolidated partnerships and jointly owned investments. Adjustments for unconsolidated partnerships and jointly owned investments are calculated to reflect FFO on the same basis.
We also modify the NAREIT computation of FFO to adjust GAAP net income for certain non-cash charges, such as amortization of real estate-related intangibles, deferred income tax benefits and expenses, straight-line rent and related reserves, other non-cash rent adjustments, non-cash allowance for credit losses on loans receivable and finance leases, stock-based compensation, non-cash environmental accretion expense, amortization of discounts and premiums on debt and amortization of deferred financing costs. Our assessment of our operations is focused on long-term sustainability and not on such non-cash items, which may cause short-term fluctuations in net income but have no impact on cash flows. Additionally, we exclude non-core income and expenses, such as gains or losses from extinguishment of debt, gains or losses on the mark-to-market fair value of equity securities, merger and acquisition expenses, spin-off expenses, and income and expenses associated with our captive insurance company. We also exclude realized and unrealized gains/losses on foreign currency exchange rate movements (other than those realized on the settlement of foreign currency derivatives), which are not considered fundamental attributes of our business plan and do not affect our overall long-term operating performance. We refer to our modified definition of FFO as AFFO. We exclude these items from GAAP net income to arrive at AFFO because they are not the primary drivers in our decision-making process and excluding these items provides investors with a view of our portfolio performance over time and makes it more comparable to other REITs. AFFO also reflects adjustments for unconsolidated partnerships and jointly owned investments. We use AFFO as one measure of our operating performance when we formulate corporate goals, evaluate the effectiveness of our strategies and determine executive compensation.
We believe that AFFO is a useful supplemental measure for investors to consider because we believe it will help them better assess the sustainability of our operating performance without the potentially distorting impact of these short-term fluctuations. However, there are limits on the usefulness of AFFO to investors. For example, impairment charges and unrealized foreign currency exchange rate losses that we exclude may become actual realized losses upon the ultimate disposition of the properties in the form of lower cash proceeds or other considerations. We use our FFO and AFFO measures as supplemental financial measures of operating performance. We do not use our FFO and AFFO measures as, nor should they be considered to be, alternatives to net income computed under GAAP, alternatives to net cash provided by operating activities computed under GAAP, or indicators of our ability to fund our cash needs.
W. P. Carey Inc. 12/31/2025 Earnings Release 8-K – 12
Exhibit 99.2
W. P. Carey Inc.
Supplemental Information
Fourth Quarter 2025
Terms and Definitions
As used in this supplemental package, the terms “W. P. Carey,” “WPC,” “we,” “us” and “our” include W. P. Carey Inc., its consolidated subsidiaries and its predecessors, unless otherwise indicated. Other terms and definitions are as follows:
| REIT | Real estate investment trust | ||||
| U.S. | United States | ||||
| ABR | Contractual minimum annualized base rent | ||||
| ASC | Accounting Standards Codification | ||||
| NAREIT | National Association of Real Estate Investment Trusts (an industry trade group) | ||||
| CPI | Consumer price index | ||||
| EUR | Euro | ||||
| EURIBOR | Euro Interbank Offered Rate | ||||
| SOFR | Secured Overnight Financing Rate | ||||
| TIBOR | Tokyo Interbank Offered Rate | ||||
| CORRA | Canadian Overnight Repo Rate Average | ||||
| SONIA | Sterling Overnight Index Average | ||||
Important Note Regarding Non-GAAP Financial Measures
This supplemental package includes certain “non-GAAP” supplemental measures that are not defined by generally accepted accounting principles (“GAAP”), including funds from operations (“FFO”); adjusted funds from operations (“AFFO”); earnings before interest, taxes, depreciation and amortization (“EBITDA”); adjusted EBITDA; pro rata cash net operating income (“pro rata cash NOI”); normalized pro rata cash NOI; same-store pro rata rental income; cash interest expense; and cash interest expense coverage ratio. FFO is a non-GAAP measure defined by NAREIT. Reconciliations of these non-GAAP financial measures to their most directly comparable GAAP measures are provided within this supplemental package. In addition, refer to the Disclosures Regarding Non-GAAP and Other Metrics section in the Appendix for a description of these non-GAAP financial measures and other metrics.
Amounts may not sum to totals due to rounding.
W. P. Carey Inc.
Supplemental Information – Fourth Quarter 2025
| Table of Contents | |||||
| Overview | |||||
| Financial Results | |||||
| Balance Sheets and Capitalization | |||||
| Real Estate | |||||
| Investment Activity | |||||
| Appendix | |||||
W. P. Carey Inc.
Overview – Fourth Quarter 2025
| Summary Metrics | |||||
As of or for the three months ended December 31, 2025.
| Financial Results | |||||||||||||||||||||||||||||
| Revenues, including reimbursable costs – consolidated ($000s) | $ | 444,547 | |||||||||||||||||||||||||||
| Net income attributable to W. P. Carey ($000s) | 148,319 | ||||||||||||||||||||||||||||
| Net income attributable to W. P. Carey per diluted share | 0.67 | ||||||||||||||||||||||||||||
Normalized pro rata cash NOI ($000s) (a) (b) | 378,094 | ||||||||||||||||||||||||||||
Adjusted EBITDA ($000s) (a) (b) | 366,674 | ||||||||||||||||||||||||||||
AFFO attributable to W. P. Carey ($000s) (a) (b) | 281,124 | ||||||||||||||||||||||||||||
AFFO attributable to W. P. Carey per diluted share (a) (b) | 1.27 | ||||||||||||||||||||||||||||
| Dividends declared per share – current quarter | 0.920 | ||||||||||||||||||||||||||||
| Dividends declared per share – current quarter annualized | 3.680 | ||||||||||||||||||||||||||||
| Dividend yield – annualized, based on quarter end share price of $64.36 | 5.7 | % | |||||||||||||||||||||||||||
Dividend payout ratio – for the year ended December 31, 2025 (c) | 72.8 | % | |||||||||||||||||||||||||||
| Balance Sheet and Capitalization | |||||||||||||||||||||||||||||
| Equity market capitalization – based on quarter end share price of $64.36 ($000s) | $ | 14,104,229 | |||||||||||||||||||||||||||
Net debt ($000s) (d) | 8,647,567 | ||||||||||||||||||||||||||||
| Enterprise value ($000s) | 22,751,796 | ||||||||||||||||||||||||||||
| Total consolidated debt ($000s) | 8,722,690 | ||||||||||||||||||||||||||||
Gross assets ($000s) (e) | 20,076,687 | ||||||||||||||||||||||||||||
Liquidity ($000s) (f) | 2,211,837 | ||||||||||||||||||||||||||||
Net debt to enterprise value (b) | 38.0 | % | |||||||||||||||||||||||||||
Net debt to adjusted EBITDA (annualized) (a) (b) | 5.9x | ||||||||||||||||||||||||||||
Net debt to adjusted EBITDA (annualized) – inclusive of unsettled forward equity (a) (b) (g) | 5.6x | ||||||||||||||||||||||||||||
| Total consolidated debt to gross assets | 43.4 | % | |||||||||||||||||||||||||||
| Total consolidated secured debt to gross assets | 0.7 | % | |||||||||||||||||||||||||||
Cash interest expense coverage ratio (a) (b) | 5.2x | ||||||||||||||||||||||||||||
Weighted-average interest rate – for the three months ended December 31, 2025 (b) | 3.2 | % | |||||||||||||||||||||||||||
Weighted-average interest rate – as of December 31, 2025 (b) | 3.1 | % | |||||||||||||||||||||||||||
Weighted-average debt maturity (years) (b) | 4.3 | ||||||||||||||||||||||||||||
| Moody's Investors Service – issuer rating | Baa1 (stable) | ||||||||||||||||||||||||||||
| Standard & Poor's Ratings Services – issuer rating | BBB+ (stable) | ||||||||||||||||||||||||||||
| Real Estate Portfolio (Pro Rata) | |||||||||||||||||||||||||||||
ABR – total portfolio ($000s) (h) | $ | 1,553,312 | |||||||||||||||||||||||||||
| Number of net-leased properties | 1,682 | ||||||||||||||||||||||||||||
Number of operating properties (i) | 16 | ||||||||||||||||||||||||||||
Number of tenants – net-leased properties | 371 | ||||||||||||||||||||||||||||
| ABR from top ten tenants as a % of total ABR – net-leased properties | 18.8 | % | |||||||||||||||||||||||||||
ABR from investment grade tenants as a % of total ABR – net-leased properties (j) | 21.9 | % | |||||||||||||||||||||||||||
Contractual same-store growth (k) | 2.4 | % | |||||||||||||||||||||||||||
| Net-leased properties – square footage (millions) | 183.5 | ||||||||||||||||||||||||||||
| Occupancy – net-leased properties | 98.0 | % | |||||||||||||||||||||||||||
| Weighted-average lease term (years) | 12.0 | ||||||||||||||||||||||||||||
| Investment volume – current quarter ($000s) | $ | 625,110 | |||||||||||||||||||||||||||
| Dispositions – current quarter ($000s) | 506,954 | ||||||||||||||||||||||||||||
| Maximum commitment for capital investments and commitments expected to be completed during 2026 ($000s) | 238,269 | ||||||||||||||||||||||||||||
________
 | Investing for the Long Run® | 1 | |||||||
W. P. Carey Inc.
Overview – Fourth Quarter 2025
(a)Normalized pro rata cash NOI, adjusted EBITDA, AFFO and cash interest expense coverage ratio are non-GAAP measures. See the Disclosures Regarding Non-GAAP and Other Metrics section in the Appendix for a description of our non-GAAP measures and for details on how certain non-GAAP measures are calculated.
(b)Presented on a pro rata basis. See the Disclosures Regarding Non-GAAP and Other Metrics section in the Appendix for a description of pro rata.
(c)Represents dividends declared per share divided by AFFO per diluted share on a year-to-date basis.
(d)Represents total pro rata debt outstanding less consolidated cash and cash equivalents and cash held at qualified intermediaries. See the Components of Net Asset Value section for information about cash held at qualified intermediaries. See the Disclosures Regarding Non-GAAP and Other Metrics section in the Appendix for a description of pro rata.
(e)Gross assets represent consolidated total assets before accumulated depreciation on buildings and improvements. Gross assets are net of accumulated amortization on in-place lease intangible assets of $993.7 million and above-market rent intangible assets of $498.1 million.
(f)Represents (i) availability under our Senior Unsecured Credit Facility (net of amounts reserved for standby letters of credit), (ii) consolidated cash and cash equivalents, (iii) cash held at qualified intermediaries, and (iv) available proceeds under our forward equity sale agreements. See the Components of Net Asset Value section for information about cash held at qualified intermediaries.
(g)Reflects the impact of 6,258,496 shares of unsettled forward equity as of December 31, 2025, as if they had been settled for cash at a weighted-average net settlement price of $65.85 per share.
(h)See the Disclosures Regarding Non-GAAP and Other Metrics section in the Appendix for a description of ABR.
(i)Comprised of 11 self-storage properties, four hotels and one student housing properties.
(j)Percentage of portfolio is based on ABR, as of December 31, 2025. Includes tenants or guarantors with investment grade ratings (15.4%) and subsidiaries of non-guarantor parent companies with investment grade ratings (6.5%). Investment grade refers to an entity with a rating of BBB- or higher from Standard & Poor’s Ratings Services or Baa3 or higher from Moody’s Investors Service. See the Disclosures Regarding Non-GAAP and Other Metrics section in the Appendix for a description of ABR.
(k)See the Same-Store Analysis section for a description of contractual same-store growth.
| Investing for the Long Run® | 2 | |||||||
W. P. Carey Inc.
Overview – Fourth Quarter 2025
| Components of Net Asset Value | |||||
In thousands.
Normalized Pro Rata Cash NOI (a) (b) | Three Months Ended Dec. 31, 2025 | ||||||||||||||||
| Net lease properties | $ | 374,909 | |||||||||||||||
Self-storage and other operating properties (c) | 3,185 | ||||||||||||||||
Total normalized pro rata cash NOI (a) (b) | $ | 378,094 | |||||||||||||||
| Balance Sheet – Selected Information (Consolidated Unless Otherwise Stated) | As of Dec. 31, 2025 | ||||||||||||||||
| Assets | |||||||||||||||||
Book value of real estate excluded from normalized pro rata cash NOI (d) | $ | 292,589 | |||||||||||||||
| Cash and cash equivalents | 155,329 | ||||||||||||||||
Las Vegas retail complex construction loan (e) | 245,884 | ||||||||||||||||
| Other secured loans receivable, net | 35,783 | ||||||||||||||||
| Other assets, net: | |||||||||||||||||
| Straight-line rent adjustments | $ | 466,658 | |||||||||||||||
Investment in shares of Lineage (a cold storage REIT) (f) | 167,526 | ||||||||||||||||
Cash held at qualified intermediaries (g) | 80,874 | ||||||||||||||||
| Deferred charges | 77,420 | ||||||||||||||||
| Taxes receivable | 57,193 | ||||||||||||||||
| Non-rent tenant and other receivables | 49,118 | ||||||||||||||||
| Office lease right-of-use assets, net | 47,719 | ||||||||||||||||
| Restricted cash, including escrow (excludes cash held at qualified intermediaries) | 36,189 | ||||||||||||||||
| Deferred income taxes | 33,151 | ||||||||||||||||
| Prepaid expenses | 10,998 | ||||||||||||||||
| Leasehold improvements, furniture and fixtures | 10,846 | ||||||||||||||||
Rent receivables (h) | 2,410 | ||||||||||||||||
| Securities and derivatives | 1,845 | ||||||||||||||||
| Due from affiliates | 996 | ||||||||||||||||
| Other | 25,537 | ||||||||||||||||
| Total other assets, net | $ | 1,068,480 | |||||||||||||||
| Liabilities | |||||||||||||||||
Total pro rata debt outstanding (b) (i) | $ | 8,883,770 | |||||||||||||||
| Dividends payable | 207,487 | ||||||||||||||||
| Deferred income taxes | 151,820 | ||||||||||||||||
| Accounts payable, accrued expenses and other liabilities: | |||||||||||||||||
| Prepaid and deferred rents | $ | 185,865 | |||||||||||||||
| Accounts payable and accrued expenses | 175,668 | ||||||||||||||||
| Operating lease liabilities | 144,252 | ||||||||||||||||
| Tenant security deposits | 54,877 | ||||||||||||||||
| Accrued taxes payable | 45,319 | ||||||||||||||||
| Securities and derivatives | 18,435 | ||||||||||||||||
| Other | 45,622 | ||||||||||||||||
| Total accounts payable, accrued expenses and other liabilities | $ | 670,038 | |||||||||||||||
________
(a)Normalized pro rata cash NOI is a non-GAAP measure. See the Disclosures Regarding Non-GAAP and Other Metrics section in the Appendix for a description of our non-GAAP measures and for details on how they are calculated.
(b)Presented on a pro rata basis. See the Disclosures Regarding Non-GAAP and Other Metrics section in the Appendix for a description of pro rata.
(c)Other operating properties include four hotels and one student housing property.
(d)Represents the value of real estate not included in normalized pro rata cash NOI, such as vacant assets, in-progress build-to-suit properties, real estate under construction for certain expansion projects at existing properties and a common equity interest in the Harmon Retail Corner in Las Vegas.
(e)Represents a construction loan for a retail complex in Las Vegas, Nevada, which is included in Equity method investments (as an equity method investment in real estate) on our consolidated balance sheets. See the Investment Activity – Investment Volume section for additional information about this investment.
(f)Our investment in 5,546,547 shares of Lineage is valued on the balance sheet using the closing share price at the end of each quarter, net of an estimated sponsor promote.
| Investing for the Long Run® | 3 | |||||||
W. P. Carey Inc.
Overview – Fourth Quarter 2025
(g)Comprised of proceeds from certain dispositions that have been designated for future 1031 exchange transactions.
(h)Comprised of rent receivables that were substantially collected as of the date of this report.
(i)Excludes unamortized discount, net totaling $39.2 million and unamortized deferred financing costs totaling $30.1 million as of December 31, 2025.
| Investing for the Long Run® | 4 | |||||||
W. P. Carey Inc.
Financial Results
Fourth Quarter 2025

| Investing for the Long Run® | 5 | |||||||
W. P. Carey Inc.
Financial Results – Fourth Quarter 2025
| Consolidated Statements of Income – Last Five Quarters | |||||
In thousands, except share and per share amounts.
| Three Months Ended | |||||||||||||||||||||||||||||
| Dec. 31, 2025 | Sep. 30, 2025 | Jun. 30, 2025 | Mar. 31, 2025 | Dec. 31, 2024 | |||||||||||||||||||||||||
| Revenues | |||||||||||||||||||||||||||||
| Real Estate: | |||||||||||||||||||||||||||||
| Lease revenues | $ | 389,154 | $ | 372,087 | $ | 364,195 | $ | 353,768 | $ | 351,394 | |||||||||||||||||||
| Income from finance leases and loans receivable | 26,716 | 26,498 | 20,276 | 17,458 | 16,796 | ||||||||||||||||||||||||
| Operating property revenues | 18,379 | 26,771 | 34,287 | 33,094 | 34,132 | ||||||||||||||||||||||||
| Other lease-related income | 8,137 | 3,660 | 9,643 | 3,121 | 1,329 | ||||||||||||||||||||||||
| 442,386 | 429,016 | 428,401 | 407,441 | 403,651 | |||||||||||||||||||||||||
| Investment Management: | |||||||||||||||||||||||||||||
| Asset management revenue | 1,085 | 1,218 | 1,304 | 1,350 | 1,461 | ||||||||||||||||||||||||
| Other advisory income and reimbursements | 1,076 | 1,069 | 1,072 | 1,067 | 1,053 | ||||||||||||||||||||||||
| 2,161 | 2,287 | 2,376 | 2,417 | 2,514 | |||||||||||||||||||||||||
| 444,547 | 431,303 | 430,777 | 409,858 | 406,165 | |||||||||||||||||||||||||
| Operating Expenses | |||||||||||||||||||||||||||||
| Depreciation and amortization | 145,339 | 125,586 | 120,595 | 129,607 | 115,770 | ||||||||||||||||||||||||
| Impairment charges — real estate | 39,690 | 19,474 | 4,349 | 6,854 | 27,843 | ||||||||||||||||||||||||
| General and administrative | 25,899 | 23,656 | 24,150 | 26,967 | 24,254 | ||||||||||||||||||||||||
| Reimbursable tenant costs | 19,371 | 14,562 | 17,718 | 17,092 | 15,661 | ||||||||||||||||||||||||
| Property expenses, excluding reimbursable tenant costs | 13,859 | 14,637 | 13,623 | 11,706 | 12,580 | ||||||||||||||||||||||||
| Operating property expenses | 11,863 | 15,049 | 16,721 | 16,544 | 16,586 | ||||||||||||||||||||||||
| Stock-based compensation expense | 8,650 | 11,153 | 10,943 | 9,148 | 9,667 | ||||||||||||||||||||||||
| Merger and other expenses | 478 | 1,021 | 192 | 556 | (484) | ||||||||||||||||||||||||
| 265,149 | 225,138 | 208,291 | 218,474 | 221,877 | |||||||||||||||||||||||||
| Other Income and Expenses | |||||||||||||||||||||||||||||
| Interest expense | (75,431) | (75,226) | (71,795) | (68,804) | (70,883) | ||||||||||||||||||||||||
| Gain on sale of real estate, net | 52,791 | 44,401 | 52,824 | 43,777 | 4,480 | ||||||||||||||||||||||||
Other gains and (losses) (a) | (10,131) | (31,011) | (148,768) | (42,197) | (77,224) | ||||||||||||||||||||||||
| Earnings from equity method investments | 4,109 | 2,361 | 6,161 | 5,378 | 302 | ||||||||||||||||||||||||
Non-operating income (b) | 2,516 | 3,030 | 3,495 | 7,910 | 13,847 | ||||||||||||||||||||||||
| (26,146) | (56,445) | (158,083) | (53,936) | (129,478) | |||||||||||||||||||||||||
| Income before income taxes | 153,252 | 149,720 | 64,403 | 137,448 | 54,810 | ||||||||||||||||||||||||
| Benefit from (provision for) income taxes | 1,310 | (8,495) | (13,091) | (11,632) | (7,772) | ||||||||||||||||||||||||
| Net Income | 154,562 | 141,225 | 51,312 | 125,816 | 47,038 | ||||||||||||||||||||||||
Net (income) loss attributable to noncontrolling interests (c) | (6,243) | (229) | (92) | 8 | (15) | ||||||||||||||||||||||||
| Net Income Attributable to W. P. Carey | $ | 148,319 | $ | 140,996 | $ | 51,220 | $ | 125,824 | $ | 47,023 | |||||||||||||||||||
| Basic Earnings Per Share | $ | 0.67 | $ | 0.64 | $ | 0.23 | $ | 0.57 | $ | 0.21 | |||||||||||||||||||
| Diluted Earnings Per Share | $ | 0.67 | $ | 0.64 | $ | 0.23 | $ | 0.57 | $ | 0.21 | |||||||||||||||||||
| Weighted-Average Shares Outstanding | |||||||||||||||||||||||||||||
| Basic | 220,469,827 | 220,562,909 | 220,569,259 | 220,401,156 | 220,223,239 | ||||||||||||||||||||||||
| Diluted | 221,169,776 | 221,087,833 | 220,874,935 | 220,720,310 | 220,577,900 | ||||||||||||||||||||||||
| Dividends Declared Per Share | $ | 0.920 | $ | 0.910 | $ | 0.900 | $ | 0.890 | $ | 0.880 | |||||||||||||||||||
(a)Amount for the three months ended December 31, 2025 is primarily comprised of a mark-to-market unrealized loss for our investment in shares of Lineage of $11.7 million and non-cash unrealized gains on non-hedging derivatives of $1.1 million.
(b)Amount for the three months ended December 31, 2025 is comprised of a dividend of $2.8 million from our investment in shares of Lineage, interest income on deposits of $1.0 million and realized losses on foreign currency exchange derivatives of $1.3 million.
(c)Amount for the three months ended December 31, 2025 includes a noncontrolling interest’s $6.0 million share of a gain on sale of real estate.
| Investing for the Long Run® | 6 | |||||||
W. P. Carey Inc.
Financial Results – Fourth Quarter 2025
| FFO and AFFO, Consolidated – Last Five Quarters | |||||
In thousands, except share and per share amounts.
| Three Months Ended | |||||||||||||||||||||||||||||
| Dec. 31, 2025 | Sep. 30, 2025 | Jun. 30, 2025 | Mar. 31, 2025 | Dec. 31, 2024 | |||||||||||||||||||||||||
| Net income attributable to W. P. Carey | $ | 148,319 | $ | 140,996 | $ | 51,220 | $ | 125,824 | $ | 47,023 | |||||||||||||||||||
| Adjustments: | |||||||||||||||||||||||||||||
| Depreciation and amortization of real property | 144,641 | 124,906 | 119,930 | 128,937 | 115,107 | ||||||||||||||||||||||||
| Gain on sale of real estate, net | (52,791) | (44,401) | (52,824) | (43,777) | (4,480) | ||||||||||||||||||||||||
| Impairment charges — real estate | 39,690 | 19,474 | 4,349 | 6,854 | 27,843 | ||||||||||||||||||||||||
Proportionate share of adjustments to earnings from equity method investments (a) | 2,255 | 2,271 | 2,231 | 1,643 | 2,879 | ||||||||||||||||||||||||
Proportionate share of adjustments for noncontrolling interests (b) (c) | 5,958 | (82) | (82) | (78) | (79) | ||||||||||||||||||||||||
| Total adjustments | 139,753 | 102,168 | 73,604 | 93,579 | 141,270 | ||||||||||||||||||||||||
FFO (as defined by NAREIT) Attributable to W. P. Carey (d) | 288,072 | 243,164 | 124,824 | 219,403 | 188,293 | ||||||||||||||||||||||||
| Adjustments: | |||||||||||||||||||||||||||||
| Straight-line and other leasing and financing adjustments | (20,758) | (20,424) | (15,374) | (19,033) | (24,849) | ||||||||||||||||||||||||
| Tax (benefit) expense — deferred and other | (11,708) | (1,215) | 2,820 | (782) | 96 | ||||||||||||||||||||||||
Other (gains) and losses (e) | 10,131 | 31,011 | 148,768 | 42,197 | 77,224 | ||||||||||||||||||||||||
| Stock-based compensation | 8,650 | 11,153 | 10,943 | 9,148 | 9,667 | ||||||||||||||||||||||||
| Amortization of deferred financing costs | 4,888 | 4,874 | 4,628 | 4,782 | 4,851 | ||||||||||||||||||||||||
Above- and below-market rent intangible lease amortization, net | 941 | 4,363 | 5,061 | 1,123 | 10,047 | ||||||||||||||||||||||||
| Other amortization and non-cash items | 589 | 587 | 579 | 560 | 557 | ||||||||||||||||||||||||
| Merger and other expenses | 478 | 1,021 | 192 | 556 | (484) | ||||||||||||||||||||||||
Proportionate share of adjustments to earnings from equity method investments (a) | (43) | 2,194 | 309 | (86) | 2,266 | ||||||||||||||||||||||||
Proportionate share of adjustments for noncontrolling interests (b) | (116) | (99) | (80) | (48) | (62) | ||||||||||||||||||||||||
| Total adjustments | (6,948) | 33,465 | 157,846 | 38,417 | 79,313 | ||||||||||||||||||||||||
AFFO Attributable to W. P. Carey (d) | $ | 281,124 | $ | 276,629 | $ | 282,670 | $ | 257,820 | $ | 267,606 | |||||||||||||||||||
| Summary | |||||||||||||||||||||||||||||
FFO (as defined by NAREIT) attributable to W. P. Carey (d) | $ | 288,072 | $ | 243,164 | $ | 124,824 | $ | 219,403 | $ | 188,293 | |||||||||||||||||||
FFO (as defined by NAREIT) attributable to W. P. Carey per diluted share (d) | $ | 1.30 | $ | 1.10 | $ | 0.57 | $ | 0.99 | $ | 0.85 | |||||||||||||||||||
AFFO attributable to W. P. Carey (d) | $ | 281,124 | $ | 276,629 | $ | 282,670 | $ | 257,820 | $ | 267,606 | |||||||||||||||||||
AFFO attributable to W. P. Carey per diluted share (d) | $ | 1.27 | $ | 1.25 | $ | 1.28 | $ | 1.17 | $ | 1.21 | |||||||||||||||||||
| Diluted weighted-average shares outstanding | 221,169,776 | 221,087,833 | 220,874,935 | 220,720,310 | 220,577,900 | ||||||||||||||||||||||||
________
(a)Equity income, including amounts that are not typically recognized for FFO and AFFO, is recognized within Earnings from equity method investments on the consolidated statements of income. This represents adjustments to equity income to reflect FFO and AFFO on a pro rata basis.
(b)Adjustments disclosed elsewhere in this reconciliation are on a consolidated basis. This adjustment reflects our FFO or AFFO on a pro rata basis.
(c)Amount for the three months ended December 31, 2025 includes a noncontrolling interest’s $6.0 million share of a gain on sale of real estate.
(d)FFO and AFFO are non-GAAP measures. See the Disclosures Regarding Non-GAAP and Other Metrics section in the Appendix for a description of our non-GAAP measures.
(e)Amount for the three months ended December 31, 2025 is primarily comprised of a mark-to-market unrealized loss for our investment in shares of Lineage of $11.7 million and non-cash unrealized gains on non-hedging derivatives of $1.1 million.
| Investing for the Long Run® | 7 | |||||||
W. P. Carey Inc.
Financial Results – Fourth Quarter 2025
| Elements of Pro Rata Statement of Income and AFFO Adjustments | |||||
In thousands. For the three months ended December 31, 2025.
We believe that the table below is useful for investors to help them better understand our business by illustrating the impact of each of our AFFO adjustments on our GAAP statement of income line items. This presentation is not an alternative to the GAAP statement of income, nor is AFFO an alternative to net income as determined by GAAP.
Equity Method Investments (a) | Noncontrolling Interests (b) | AFFO Adjustments | ||||||||||||||||||
| Revenues | ||||||||||||||||||||
| Real Estate: | ||||||||||||||||||||
Lease revenues | $ | 6,069 | $ | (262) | $ | (19,093) | (c) | |||||||||||||
| Income from finance leases and loans receivable | 95 | (59) | (766) | |||||||||||||||||
| Operating property revenues | — | — | ||||||||||||||||||
| Other lease-related income | — | — | — | |||||||||||||||||
Investment Management: | ||||||||||||||||||||
| Asset management revenue | — | — | — | |||||||||||||||||
| Other advisory income and reimbursements | — | — | — | |||||||||||||||||
| Operating Expenses | ||||||||||||||||||||
| Depreciation and amortization | 2,027 | (83) | (146,687) | (d) | ||||||||||||||||
| Impairment charges — real estate | — | — | (39,690) | (e) | ||||||||||||||||
| General and administrative | 2 | — | — | |||||||||||||||||
| Reimbursable tenant costs | 631 | (57) | — | |||||||||||||||||
Property expenses, excluding reimbursable tenant costs | 588 | (40) | (464) | (e) | ||||||||||||||||
| Operating property expenses | — | — | (30) | (e) | ||||||||||||||||
Stock-based compensation expense | — | — | (8,650) | (e) | ||||||||||||||||
| Merger and other expenses | — | — | (478) | |||||||||||||||||
| Other Income and Expenses | ||||||||||||||||||||
| Interest expense | (803) | 1 | 4,934 | (f) | ||||||||||||||||
| Gain on sale of real estate, net | — | (6,042) | (46,749) | |||||||||||||||||
| Other gains and (losses) | — | 125 | 10,006 | (g) | ||||||||||||||||
| Earnings from equity method investments | (1,909) | — | 85 | (h) | ||||||||||||||||
| Non-operating income | (120) | — | — | |||||||||||||||||
| Benefit from income taxes | (84) | (3) | (11,611) | (i) | ||||||||||||||||
| Net income attributable to noncontrolling interests | — | 6,060 | — | |||||||||||||||||
________
(a)Represents the break-out by line item of amounts recorded in Earnings from equity method investments.
(b)Represents the break-out by line item of amounts recorded in Net income attributable to noncontrolling interests.
(c)Represents the reversal of amortization of above- or below-market lease intangibles of $0.9 million and the elimination of non-cash amounts related to straight-line rent and other of $20.0 million.
(d)Adjustment is a non-cash adjustment excluding corporate depreciation and amortization.
(e)Adjustment to exclude a non-cash item.
(f)Represents the elimination of non-cash components of interest expense, such as deferred financing costs, debt premiums and discounts.
(g)Primarily represents eliminations of gains (losses) on the mark-to-market fair value of equity securities, foreign currency exchange rate movements, changes in the non-cash allowance for credit losses on loans receivable and finance leases, and extinguishment of debt.
(h)Adjustments to include our pro rata share of AFFO adjustments from equity method investments.
(i)Primarily represents the elimination of deferred taxes.
| Investing for the Long Run® | 8 | |||||||
W. P. Carey Inc.
Financial Results – Fourth Quarter 2025
| Capital Expenditures | |||||
In thousands. For the three months ended December 31, 2025.
Turnover Costs (a) | |||||
| Tenant improvements | $ | 10,119 | |||
| Leasing costs | 2,501 | ||||
| Total Tenant Improvements and Leasing Costs | 12,620 | ||||
| Property improvements — net-lease properties | 3,749 | ||||
| Total Turnover Costs | $ | 16,369 | |||
| Maintenance Capital Expenditures | |||||
| Net-lease properties | $ | 5,135 | |||
| Operating properties | 1,637 | ||||
| Total Maintenance Capital Expenditures | $ | 6,772 | |||
________
(a)Turnover costs include the estimated landlord obligations in connection with the signing of a lease and exclude costs related to a first generation lease (for example, redevelopments and other capital commitments), which are included in the Investment Activity – Capital Investments and Commitments section.
| Investing for the Long Run® | 9 | |||||||
W. P. Carey Inc.
Balance Sheets and Capitalization
Fourth Quarter 2025
| Investing for the Long Run® | 10 | |||||||
W. P. Carey Inc.
Balance Sheets and Capitalization – Fourth Quarter 2025
| Consolidated Balance Sheets | |||||
In thousands, except share and per share amounts.
| December 31, | |||||||||||
| 2025 | 2024 | ||||||||||
| Assets | |||||||||||
| Investments in real estate: | |||||||||||
| Land, buildings and improvements — net lease and other | $ | 14,451,306 | $ | 12,842,869 | |||||||
| Land, buildings and improvements — operating properties | 286,079 | 1,198,676 | |||||||||
| Net investments in finance leases and loans receivable | 1,171,886 | 798,259 | |||||||||
In-place lease intangible assets and other | 2,466,199 | 2,297,572 | |||||||||
Above-market rent intangible assets | 668,707 | 665,495 | |||||||||
| Investments in real estate | 19,044,177 | 17,802,871 | |||||||||
Accumulated depreciation and amortization (a) | (3,578,330) | (3,222,396) | |||||||||
| Assets held for sale, net | 3,327 | — | |||||||||
| Net investments in real estate | 15,469,174 | 14,580,475 | |||||||||
| Equity method investments | 310,178 | 301,115 | |||||||||
| Cash and cash equivalents | 155,329 | 640,373 | |||||||||
| Other assets, net | 1,068,480 | 1,045,218 | |||||||||
| Goodwill | 987,071 | 967,843 | |||||||||
| Total assets | $ | 17,990,232 | $ | 17,535,024 | |||||||
| Liabilities and Equity | |||||||||||
| Debt: | |||||||||||
| Senior unsecured notes, net | $ | 6,950,261 | $ | 6,505,907 | |||||||
| Unsecured term loans, net | 1,196,366 | 1,075,826 | |||||||||
| Unsecured revolving credit facility | 435,417 | 55,448 | |||||||||
| Non-recourse mortgages, net | 140,646 | 401,821 | |||||||||
| Debt, net | 8,722,690 | 8,039,002 | |||||||||
| Accounts payable, accrued expenses and other liabilities | 670,038 | 596,994 | |||||||||
Below-market rent and other intangible liabilities, net | 104,055 | 119,831 | |||||||||
| Deferred income taxes | 151,820 | 147,461 | |||||||||
| Dividends payable | 207,487 | 197,612 | |||||||||
| Total liabilities | 9,856,090 | 9,100,900 | |||||||||
Preferred stock, $0.001 par value, 50,000,000 shares authorized; none issued | — | — | |||||||||
Common stock, $0.001 par value, 450,000,000 shares authorized; 219,145,876 and 218,848,844 shares, respectively, issued and outstanding | 219 | 219 | |||||||||
| Additional paid-in capital | 11,830,737 | 11,805,179 | |||||||||
| Distributions in excess of accumulated earnings | (3,539,592) | (3,203,974) | |||||||||
| Deferred compensation obligation | 80,239 | 78,503 | |||||||||
| Accumulated other comprehensive loss | (253,346) | (250,232) | |||||||||
| Total stockholders' equity | 8,118,257 | 8,429,695 | |||||||||
| Noncontrolling interests | 15,885 | 4,429 | |||||||||
| Total equity | 8,134,142 | 8,434,124 | |||||||||
| Total liabilities and equity | $ | 17,990,232 | $ | 17,535,024 | |||||||
________
(a)Includes $2.1 billion and $1.8 billion of accumulated depreciation on buildings and improvements as of December 31, 2025 and 2024, respectively, and $1.5 billion and $1.4 billion of accumulated amortization on lease intangibles as of December 31, 2025 and 2024, respectively.
| Investing for the Long Run® | 11 | |||||||
W. P. Carey Inc.
Balance Sheets and Capitalization – Fourth Quarter 2025
| Capitalization | |||||
In thousands, except share and per share amounts. As of December 31, 2025.
| Description | Shares | Share Price | Market Value | |||||||||||||||||||||||
| Equity | ||||||||||||||||||||||||||
| Common equity | 219,145,876 | $ | 64.36 | $ | 14,104,229 | |||||||||||||||||||||
| Preferred equity | — | |||||||||||||||||||||||||
| Total Equity Market Capitalization | 14,104,229 | |||||||||||||||||||||||||
Outstanding Balance (a) | ||||||||||||||||||||||||||
| Pro Rata Debt | ||||||||||||||||||||||||||
| Non-recourse mortgages | 235,284 | |||||||||||||||||||||||||
| Unsecured term loans (due February 14, 2028) | 616,194 | |||||||||||||||||||||||||
| Unsecured term loan (due April 24, 2029) | 587,500 | |||||||||||||||||||||||||
| Unsecured revolving credit facility (due February 14, 2029) | 435,417 | |||||||||||||||||||||||||
| Senior unsecured notes: | ||||||||||||||||||||||||||
| Due April 9, 2026 (EUR) | 587,500 | |||||||||||||||||||||||||
| Due October 1, 2026 (USD) | 350,000 | |||||||||||||||||||||||||
| Due April 15, 2027 (EUR) | 587,500 | |||||||||||||||||||||||||
| Due April 15, 2028 (EUR) | 587,500 | |||||||||||||||||||||||||
| Due July 15, 2029 (USD) | 325,000 | |||||||||||||||||||||||||
| Due September 28, 2029 (EUR) | 176,250 | |||||||||||||||||||||||||
| Due June 1, 2030 (EUR) | 616,875 | |||||||||||||||||||||||||
| Due July 15, 2030 (USD) | 400,000 | |||||||||||||||||||||||||
| Due February 1, 2031 (USD) | 500,000 | |||||||||||||||||||||||||
| Due February 1, 2032 (USD) | 350,000 | |||||||||||||||||||||||||
| Due July 23, 2032 (EUR) | 763,750 | |||||||||||||||||||||||||
| Due September 28, 2032 (EUR) | 235,000 | |||||||||||||||||||||||||
| Due April 1, 2033 (USD) | 425,000 | |||||||||||||||||||||||||
| Due June 30, 2034 (USD) | 400,000 | |||||||||||||||||||||||||
| Due November 19, 2034 (EUR) | 705,000 | |||||||||||||||||||||||||
| Total Pro Rata Debt | 8,883,770 | |||||||||||||||||||||||||
| Total Capitalization | $ | 22,987,999 | ||||||||||||||||||||||||
________
(a)Excludes unamortized discount, net totaling $39.2 million and unamortized deferred financing costs totaling $30.1 million as of December 31, 2025.
| Investing for the Long Run® | 12 | |||||||
W. P. Carey Inc.
Balance Sheets and Capitalization – Fourth Quarter 2025
| Debt Overview | |||||
Dollars in thousands. Pro rata. As of December 31, 2025.
| USD-Denominated | EUR-Denominated | Other Currencies (a) | Total | |||||||||||||||||||||||||||||||||||||||||||||||||||||||||||||||||
| Outstanding Balance | ||||||||||||||||||||||||||||||||||||||||||||||||||||||||||||||||||||
| Out-standing Balance (in USD) | Weigh-ted Avg. Interest Rate | Out-standing Balance (in USD) | Weigh-ted Avg. Interest Rate | Out-standing Balance (in USD) | Weigh-ted Avg. Interest Rate | Amount (in USD) | % of Total | Weigh-ted Avg. Interest Rate | Weigh-ted Avg. Maturity (Years) | |||||||||||||||||||||||||||||||||||||||||||||||||||||||||||
Non-Recourse Debt (b) (c) | ||||||||||||||||||||||||||||||||||||||||||||||||||||||||||||||||||||
Fixed (d) | $ | 107,667 | 4.8 | % | $ | 71,650 | 5.1 | % | $ | 20,780 | 4.6 | % | $ | 200,097 | 2.2 | % | 4.9 | % | 1.7 | |||||||||||||||||||||||||||||||||||||||||||||||||
| Floating | — | — | % | 35,187 | 3.8 | % | — | — | % | 35,187 | 0.4 | % | 3.8 | % | 0.3 | |||||||||||||||||||||||||||||||||||||||||||||||||||||
Total Pro Rata Non-Recourse Debt | 107,667 | 4.8 | % | 106,837 | 4.7 | % | 20,780 | 4.6 | % | 235,284 | 2.6 | % | 4.7 | % | 1.5 | |||||||||||||||||||||||||||||||||||||||||||||||||||||
Recourse Debt (b) (c) | ||||||||||||||||||||||||||||||||||||||||||||||||||||||||||||||||||||
| Fixed – Senior unsecured notes: | ||||||||||||||||||||||||||||||||||||||||||||||||||||||||||||||||||||
| Due April 9, 2026 | — | — | % | 587,500 | 2.3 | % | — | — | % | 587,500 | 6.6 | % | 2.3 | % | 0.3 | |||||||||||||||||||||||||||||||||||||||||||||||||||||
| Due October 1, 2026 | 350,000 | 4.3 | % | — | — | % | — | — | % | 350,000 | 3.9 | % | 4.3 | % | 0.8 | |||||||||||||||||||||||||||||||||||||||||||||||||||||
| Due April 15, 2027 | — | — | % | 587,500 | 2.1 | % | — | — | % | 587,500 | 6.6 | % | 2.1 | % | 1.3 | |||||||||||||||||||||||||||||||||||||||||||||||||||||
| Due April 15, 2028 | — | — | % | 587,500 | 1.4 | % | — | — | % | 587,500 | 6.6 | % | 1.4 | % | 2.3 | |||||||||||||||||||||||||||||||||||||||||||||||||||||
| Due July 15, 2029 | 325,000 | 3.9 | % | — | — | % | — | — | % | 325,000 | 3.7 | % | 3.9 | % | 3.5 | |||||||||||||||||||||||||||||||||||||||||||||||||||||
| Due September 28, 2029 | — | — | % | 176,250 | 3.4 | % | — | — | % | 176,250 | 2.0 | % | 3.4 | % | 3.7 | |||||||||||||||||||||||||||||||||||||||||||||||||||||
| Due June 1, 2030 | — | — | % | 616,875 | 1.0 | % | — | — | % | 616,875 | 7.0 | % | 1.0 | % | 4.4 | |||||||||||||||||||||||||||||||||||||||||||||||||||||
| Due July 15, 2030 | 400,000 | 4.7 | % | — | — | % | — | — | % | 400,000 | 4.5 | % | 4.7 | % | 4.5 | |||||||||||||||||||||||||||||||||||||||||||||||||||||
| Due February 1, 2031 | 500,000 | 2.4 | % | — | — | % | — | — | % | 500,000 | 5.6 | % | 2.4 | % | 5.1 | |||||||||||||||||||||||||||||||||||||||||||||||||||||
| Due February 1, 2032 | 350,000 | 2.5 | % | — | — | % | — | — | % | 350,000 | 3.9 | % | 2.5 | % | 6.1 | |||||||||||||||||||||||||||||||||||||||||||||||||||||
| Due July 23, 2032 | — | — | % | 763,750 | 4.3 | % | — | — | % | 763,750 | 8.6 | % | 4.3 | % | 6.6 | |||||||||||||||||||||||||||||||||||||||||||||||||||||
| Due September 28, 2032 | — | — | % | 235,000 | 3.7 | % | — | — | % | 235,000 | 2.7 | % | 3.7 | % | 6.7 | |||||||||||||||||||||||||||||||||||||||||||||||||||||
| Due April 1, 2033 | 425,000 | 2.3 | % | — | — | % | — | — | % | 425,000 | 4.8 | % | 2.3 | % | 7.3 | |||||||||||||||||||||||||||||||||||||||||||||||||||||
| Due June 30, 2034 | 400,000 | 5.4 | % | — | — | % | — | — | % | 400,000 | 4.5 | % | 5.4 | % | 8.5 | |||||||||||||||||||||||||||||||||||||||||||||||||||||
| Due November 19, 2034 | — | — | % | 705,000 | 3.7 | % | — | — | % | 705,000 | 7.9 | % | 3.7 | % | 8.9 | |||||||||||||||||||||||||||||||||||||||||||||||||||||
Total Senior Unsecured Notes | 2,750,000 | 3.6 | % | 4,259,375 | 2.6 | % | — | — | % | 7,009,375 | 78.9 | % | 3.0 | % | 4.7 | |||||||||||||||||||||||||||||||||||||||||||||||||||||
| Swapped to Fixed: | ||||||||||||||||||||||||||||||||||||||||||||||||||||||||||||||||||||
Unsecured term loan (due April 24, 2029) (e) | — | — | % | 587,500 | 2.8 | % | — | — | % | 587,500 | 6.6 | % | 2.8 | % | 3.3 | |||||||||||||||||||||||||||||||||||||||||||||||||||||
Unsecured term loan (due February 14, 2028) (e) | — | — | % | — | — | % | 363,569 | 4.7 | % | 363,569 | 4.1 | % | 4.7 | % | 2.1 | |||||||||||||||||||||||||||||||||||||||||||||||||||||
| Floating: | ||||||||||||||||||||||||||||||||||||||||||||||||||||||||||||||||||||
Unsecured revolving credit facility (due February 14, 2029) (f) | 258,000 | 4.4 | % | 66,976 | 2.6 | % | 110,441 | 3.3 | % | 435,417 | 4.9 | % | 3.9 | % | 3.1 | |||||||||||||||||||||||||||||||||||||||||||||||||||||
Unsecured term loan (due February 14, 2028) (g) | — | — | % | 252,625 | 2.7 | % | — | — | % | 252,625 | 2.9 | % | 2.7 | % | 2.1 | |||||||||||||||||||||||||||||||||||||||||||||||||||||
| Total Recourse Debt | 3,008,000 | 3.6 | % | 5,166,476 | 2.7 | % | 474,010 | 4.4 | % | 8,648,486 | 97.4 | % | 3.1 | % | 4.3 | |||||||||||||||||||||||||||||||||||||||||||||||||||||
Total Pro Rata Debt Outstanding | $ | 3,115,667 | 3.7 | % | $ | 5,273,313 | 2.7 | % | $ | 494,790 | 4.4 | % | $ | 8,883,770 | 100.0 | % | 3.1 | % | 4.3 | |||||||||||||||||||||||||||||||||||||||||||||||||
________
(a)Other currencies include debt denominated in British pound sterling, Canadian dollar and Japanese yen.
(b)Debt data is presented on a pro rata basis as of December 31, 2025. See the Disclosures Regarding Non-GAAP and Other Metrics section in the Appendix for a description of pro rata.
(c)Excludes unamortized discount, net totaling $39.2 million and unamortized deferred financing costs totaling $30.1 million as of December 31, 2025.
(d)Includes $81.2 million of non-recourse mortgage debt which is swapped to fixed-rate through mortgage maturity.
(e)Interest rate swap expiration date is December 31, 2027.
(f)We incurred interest on our Unsecured revolving credit facility at SOFR, TIBOR, CORRA, SONIA or EURIBOR, plus 0.735% for all base rates as of December 31, 2025. Each has a floor of 0.00% under the terms of our credit agreement. Availability under our Unsecured revolving credit facility (net of amounts reserved for standby letters of credit) was approximately $1.6 billion as of December 31, 2025.
(g)We incurred interest at EURIBOR, plus 0.80% on this Unsecured term loan as of December 31, 2025.
| Investing for the Long Run® | 13 | |||||||
W. P. Carey Inc.
Balance Sheets and Capitalization – Fourth Quarter 2025
| Debt Maturity | |||||
Dollars in thousands. Pro rata. As of December 31, 2025.
| Real Estate | Debt | |||||||||||||||||||||||||||||||||||||
Number of Properties (a) | Weighted-Average Interest Rate | Total Outstanding Balance (b) (c) | % of Total Outstanding Balance | |||||||||||||||||||||||||||||||||||
| Year of Maturity | ABR (a) | Balloon | ||||||||||||||||||||||||||||||||||||
| Non-Recourse Debt | ||||||||||||||||||||||||||||||||||||||
| 2026 | 23 | $ | 28,809 | 4.7 | % | $ | 105,969 | $ | 109,255 | 1.2 | % | |||||||||||||||||||||||||||
| 2027 | 3 | 1,272 | 4.2 | % | 28,534 | 28,835 | 0.4 | % | ||||||||||||||||||||||||||||||
| 2028 | 5 | 14,123 | 5.0 | % | 73,853 | 80,009 | 0.9 | % | ||||||||||||||||||||||||||||||
| 2029 | 3 | 1,464 | 4.0 | % | 10,911 | 11,767 | 0.1 | % | ||||||||||||||||||||||||||||||
| 2031 | 1 | 1,158 | 6.0 | % | — | 2,086 | — | % | ||||||||||||||||||||||||||||||
| 2033 | 1 | 2,393 | 5.6 | % | 1,648 | 3,332 | — | % | ||||||||||||||||||||||||||||||
Total Pro Rata Non-Recourse Debt | 36 | $ | 49,219 | 4.7 | % | $ | 220,915 | 235,284 | 2.6 | % | ||||||||||||||||||||||||||||
| Recourse Debt | ||||||||||||||||||||||||||||||||||||||
| Fixed – Senior unsecured notes: | ||||||||||||||||||||||||||||||||||||||
| Due April 9, 2026 (EUR) | 2.3 | % | 587,500 | 6.6 | % | |||||||||||||||||||||||||||||||||
| Due October 1, 2026 (USD) | 4.3 | % | 350,000 | 3.9 | % | |||||||||||||||||||||||||||||||||
| Due April 15, 2027 (EUR) | 2.1 | % | 587,500 | 6.6 | % | |||||||||||||||||||||||||||||||||
| Due April 15, 2028 (EUR) | 1.4 | % | 587,500 | 6.6 | % | |||||||||||||||||||||||||||||||||
| Due July 15, 2029 (USD) | 3.9 | % | 325,000 | 3.7 | % | |||||||||||||||||||||||||||||||||
| Due September 28, 2029 (EUR) | 3.4 | % | 176,250 | 2.0 | % | |||||||||||||||||||||||||||||||||
| Due June 1, 2030 (EUR) | 1.0 | % | 616,875 | 7.0 | % | |||||||||||||||||||||||||||||||||
| Due July 15, 2030 (USD) | 4.7 | % | 400,000 | 4.5 | % | |||||||||||||||||||||||||||||||||
| Due February 1, 2031 (USD) | 2.4 | % | 500,000 | 5.6 | % | |||||||||||||||||||||||||||||||||
| Due February 1, 2032 (USD) | 2.5 | % | 350,000 | 3.9 | % | |||||||||||||||||||||||||||||||||
| Due July 23, 2032 (EUR) | 4.3 | % | 763,750 | 8.6 | % | |||||||||||||||||||||||||||||||||
| Due September 28, 2032 (EUR) | 3.7 | % | 235,000 | 2.7 | % | |||||||||||||||||||||||||||||||||
| Due April 1, 2033 (USD) | 2.3 | % | 425,000 | 4.8 | % | |||||||||||||||||||||||||||||||||
| Due June 30, 2034 (USD) | 5.4 | % | 400,000 | 4.5 | % | |||||||||||||||||||||||||||||||||
| Due November 19, 2034 (EUR) | 3.7 | % | 705,000 | 7.9 | % | |||||||||||||||||||||||||||||||||
| Total Senior Unsecured Notes | 3.0 | % | 7,009,375 | 78.9 | % | |||||||||||||||||||||||||||||||||
| Swapped to Fixed: | ||||||||||||||||||||||||||||||||||||||
Unsecured term loan (due April 24, 2029) (d) | 2.8 | % | 587,500 | 6.6 | % | |||||||||||||||||||||||||||||||||
Unsecured term loan (due Feb 14, 2028) (d) | 4.7 | % | 363,569 | 4.1 | % | |||||||||||||||||||||||||||||||||
| Floating: | ||||||||||||||||||||||||||||||||||||||
Unsecured revolving credit facility (due February 14, 2029) (e) | 3.9 | % | 435,417 | 4.9 | % | |||||||||||||||||||||||||||||||||
Unsecured term loan (due February 14, 2028) (f) | 2.7 | % | 252,625 | 2.9 | % | |||||||||||||||||||||||||||||||||
| Total Recourse Debt | 3.1 | % | 8,648,486 | 97.4 | % | |||||||||||||||||||||||||||||||||
| Total Pro Rata Debt Outstanding | 3.1 | % | $ | 8,883,770 | 100.0 | % | ||||||||||||||||||||||||||||||||
________
(a)Represents the number of properties and ABR associated with the debt that is maturing in each respective year.
(b)Debt maturity data is presented on a pro rata basis as of December 31, 2025. See the Disclosures Regarding Non-GAAP and Other Metrics section in the Appendix for a description of pro rata. Total outstanding balance includes balloon payments and scheduled amortization for our non-recourse debt.
(c)Excludes unamortized discount, net totaling $39.2 million and unamortized deferred financing costs totaling $30.1 million as of December 31, 2025.
(d)Interest rate swap expiration date is December 31, 2027.
(e)We incurred interest on our Unsecured revolving credit facility at SOFR, TIBOR, CORRA, SONIA or EURIBOR, plus 0.735% for all base rates as of December 31, 2025. Each has a floor of 0.00% under the terms of our credit agreement. Availability under our Unsecured revolving credit facility (net of amounts reserved for standby letters of credit) was approximately $1.6 billion as of December 31, 2025.
(f)We incurred interest at EURIBOR, plus 0.80% on this Unsecured term loan as of December 31, 2025.
| Investing for the Long Run® | 14 | |||||||
W. P. Carey Inc.
Balance Sheets and Capitalization – Fourth Quarter 2025
| Senior Unsecured Notes | |||||
As of December 31, 2025.
Ratings
| Issuer | Senior Unsecured Notes | |||||||||||||||||||
| Ratings Agency | Rating | Outlook | Rating | |||||||||||||||||
| Moody's | Baa1 | Stable | Baa1 | |||||||||||||||||
| Standard & Poor’s | BBB+ | Stable | BBB+ | |||||||||||||||||
Senior Unsecured Note Covenants
The following is a summary of the key financial covenants for the Senior Unsecured Notes, along with our estimated calculations of our compliance with those covenants at the end of the period presented. These ratios are not measures of our liquidity or performance and serve only to demonstrate our ability to incur additional debt, as permitted by the covenants for the Senior Unsecured Notes.
| Covenant | Metric | Required | As of Dec. 31, 2025 | |||||||||||||||||
| Limitation on the incurrence of debt | "Total Debt" / "Total Assets" | ≤ 60% | 42.1% | |||||||||||||||||
| Limitation on the incurrence of secured debt | "Secured Debt" / "Total Assets" | ≤ 40% | 0.7% | |||||||||||||||||
Limitation on the incurrence of debt based on consolidated EBITDA to annual debt service charge | "Consolidated EBITDA" / "Annual Debt Service Charge" | ≥ 1.5x | 5.0x | |||||||||||||||||
| Maintenance of unencumbered asset value | "Unencumbered Assets" / "Total Unsecured Debt" | ≥ 150% | 230.5% | |||||||||||||||||
| Investing for the Long Run® | 15 | |||||||
W. P. Carey Inc.
Real Estate
Fourth Quarter 2025
| Investing for the Long Run® | 16 | |||||||
W. P. Carey Inc.
Real Estate – Fourth Quarter 2025
| Investment Activity – Investment Volume | |||||
Dollars in thousands. Pro rata. For the year ended December 31, 2025.
| Property Type(s) | Closing Date / Asset Completion Date | Gross Investment Amount | Investment Type | Lease Term (Years) (a) | Gross Square Footage | |||||||||||||||||||||||||||||||||||||||
| Tenant | Property Location(s) | |||||||||||||||||||||||||||||||||||||||||||
| 1Q25 | ||||||||||||||||||||||||||||||||||||||||||||
| Reddy Ice (59 properties) | Various, United States | Industrial, Warehouse | Feb-25 | $ | 136,022 | Sale-leaseback | 20 | 1,072,575 | ||||||||||||||||||||||||||||||||||||
| Las Vegas Retail Complex | Las Vegas, NV | Retail | Feb-25 | 5,000 | 47.5% Joint Venture Acquisition | 8 | 75,255 | |||||||||||||||||||||||||||||||||||||
Dollar General (4 properties) | Various, United States | Retail | Mar-25 | 8,474 | Acquisition | 15 | 42,388 | |||||||||||||||||||||||||||||||||||||
| Ernest Health | Mishawaka, IN | Specialty (Healthcare) | Mar-25 | 31,762 | Acquisition | 15 | 55,210 | |||||||||||||||||||||||||||||||||||||
Majestic Steel (b) | Blytheville, AR | Industrial | Mar-25 | 91,910 | Sale-leaseback | 24 | 513,633 | |||||||||||||||||||||||||||||||||||||
| 1Q25 Total | 273,168 | 16 | 1,759,061 | |||||||||||||||||||||||||||||||||||||||||
| 2Q25 | ||||||||||||||||||||||||||||||||||||||||||||
Linde + Wiemann (4 properties) (c) | Various, Germany (3 properties) and La Garriga, Spain | Industrial | Apr-25 | 42,981 | Sale-leaseback | 25 | 640,732 | |||||||||||||||||||||||||||||||||||||
| UNFI | Santa Fe Springs, CA | Warehouse | Apr-25 | 128,043 | Acquisition | 10 | 302,850 | |||||||||||||||||||||||||||||||||||||
| Berry Global | Evansville, IN | Industrial | Apr-25 | 8,150 | Renovation | 15 | N/A | |||||||||||||||||||||||||||||||||||||
Morato (9 properties) (c) | Various, Italy (7 properties) and Málaga and Burgos, Spain | Industrial | May-25 | 73,280 | Sale-leaseback | 20 | 1,159,154 | |||||||||||||||||||||||||||||||||||||
| Soteria | Chattanooga, TN | Industrial | Jun-25 | 20,247 | Sale-leaseback | 15 | 211,379 | |||||||||||||||||||||||||||||||||||||
Hertz (2 properties) | Newark, NJ and Boston, MA | Industrial | Jun-25 | 101,856 | Sale-leaseback | 20 | 81,664 | |||||||||||||||||||||||||||||||||||||
| TI Automotive (formerly ABC Technologies) | Galeras, Mexico | Industrial | Jun-25 | 4,843 | Expansion | 18 | 60,181 | |||||||||||||||||||||||||||||||||||||
Premium Brands (b) | McDonald, TN | Industrial | Jun-25 | 166,060 | Sale-leaseback | 25 | 356,960 | |||||||||||||||||||||||||||||||||||||
| 2Q25 Total | 545,460 | 19 | 2,812,920 | |||||||||||||||||||||||||||||||||||||||||
| 3Q25 | ||||||||||||||||||||||||||||||||||||||||||||
Valeo Foods (6 properties) (b) (c) | Various, United Kingdom (3 properties), Czech Republic (2 properties), and Slovakia (1 property) | Industrial | Jul-25 | 103,380 | Sale-leaseback | 25 | 1,354,721 | |||||||||||||||||||||||||||||||||||||
| Hertz | San Francisco, CA | Industrial | Jul-25 | 49,604 | Sale-leaseback | 20 | 69,200 | |||||||||||||||||||||||||||||||||||||
Dollar General (8 properties) | Various, United States | Retail | Jul-25; Aug-25 | 15,796 | Acquisition | 15 | 85,046 | |||||||||||||||||||||||||||||||||||||
Morrisons (2 properties) (c) | Loughborough and Ilkeston, United Kingdom | Retail | Jul-25 | 68,308 | Acquisition | 15 | 121,669 | |||||||||||||||||||||||||||||||||||||
| Sumitomo | Bedford, MA | Research and Development | Jul-25 | 44,000 | Redevelopment | 15 | N/A | |||||||||||||||||||||||||||||||||||||
| Ryerson | Houston, TX | Industrial | Jul-25 | 18,357 | Acquisition | 6 | 170,178 | |||||||||||||||||||||||||||||||||||||
Europe Snacks (4 properties) (c) | Various, France (3 properties) and Medina del Campo, Spain | Industrial | Jul-25 | 56,388 | Sale-leaseback | 20 | 726,538 | |||||||||||||||||||||||||||||||||||||
Enel (35 properties) (c) | Various, Italy | Industrial, Warehouse | Aug-25 | 81,900 | Acquisition | 12 | 1,008,560 | |||||||||||||||||||||||||||||||||||||
AeriTek Global (4 properties) | Monterrey and San Juan del Rio, Mexico | Industrial | Aug-25 | 44,033 | Sale-leaseback | 20 | 525,044 | |||||||||||||||||||||||||||||||||||||
| Canadian Solar | Mesquite, TX | Industrial | Sep-25 | 92,271 | Acquisition | 10 | 756,668 | |||||||||||||||||||||||||||||||||||||
| EOS Fitness | Kissimmee, FL | Retail | Sep-25 | 14,338 | Acquisition | 20 | 42,000 | |||||||||||||||||||||||||||||||||||||
Polytainers (3 properties) (c) | Toronto and Markham, Canada; and Lee's Summit, MO | Industrial | Sep-25 | 67,170 | Sale-leaseback | 20 | 489,972 | |||||||||||||||||||||||||||||||||||||
| 3Q25 Total | 655,545 | 17 | 5,349,596 | |||||||||||||||||||||||||||||||||||||||||
| Investing for the Long Run® | 17 | |||||||
W. P. Carey Inc.
Real Estate – Fourth Quarter 2025
| Investment Activity – Investment Volume (continued) | |||||
Dollars in thousands. Pro rata. For the year ended December 31, 2025.
| Property Type(s) | Closing Date / Asset Completion Date | Gross Investment Amount | Investment Type | Lease Term (Years) (a) | Gross Square Footage | |||||||||||||||||||||||||||||||||||||||
| Tenant | Property Location(s) | |||||||||||||||||||||||||||||||||||||||||||
| 4Q25 | ||||||||||||||||||||||||||||||||||||||||||||
| Plaskolite | Compton, CA | Warehouse | Oct-25 | 5,937 | Acquisition | 21 | 23,925 | |||||||||||||||||||||||||||||||||||||
| NewEra Nobis (4 properties) | Various, United States | Specialty (Healthcare) | Oct-25 | 137,275 | Acquisition | 17 | 190,347 | |||||||||||||||||||||||||||||||||||||
| AeriTek Global | San Juan del Rio, Mexico | Industrial | Oct-25 | 9,999 | Sale-leaseback | 20 | 145,625 | |||||||||||||||||||||||||||||||||||||
| Dollar General (8 properties) | Various, United States | Retail | Oct-25; Dec-25 | 15,986 | Acquisition | 15 | 83,334 | |||||||||||||||||||||||||||||||||||||
Novus Foods (b) | Delphos, OH | Industrial | Oct-25 | 8,693 | Sale-leaseback | 26 | 66,023 | |||||||||||||||||||||||||||||||||||||
| Tidal Wave | New Hartford, NY | Retail (Car Wash) | Nov-25 | 5,084 | Sale-leaseback | 18 | 3,450 | |||||||||||||||||||||||||||||||||||||
RKW (c) | Wasserburg am Inn, Germany | Industrial | Dec-25 | 27,142 | Sale-leaseback | 20 | 235,010 | |||||||||||||||||||||||||||||||||||||
Enel (2 properties) (c) | Cesena and Gela, Italy | Industrial, Warehouse | Dec-25 | 2,218 | Acquisition | 12 | 30,393 | |||||||||||||||||||||||||||||||||||||
| Life Time Fitness (10 properties) | Various, United States | Retail | Dec-25 | 321,826 | Acquisition | 10 | 1,254,645 | |||||||||||||||||||||||||||||||||||||
Ontime (4 properties) (c) | Navarra and Zaragoza, Spain | Warehouse | Dec-25 | 80,020 | Sale-leaseback | 20 | 728,147 | |||||||||||||||||||||||||||||||||||||
Fraikin (c) | Various, France | Industrial | Dec-25 | 5,947 | Renovation | 17 | N/A | |||||||||||||||||||||||||||||||||||||
| Solar Projects | Various, United States | Various | Dec-25 | 3,892 | Solar Projects | N/A | N/A | |||||||||||||||||||||||||||||||||||||
| 4Q25 Total | 624,019 | 14 | 2,760,899 | |||||||||||||||||||||||||||||||||||||||||
| Year-to-Date Total | 2,098,192 | 17 | 12,682,476 | |||||||||||||||||||||||||||||||||||||||||
| Property Type | Loan Origination | Loan Maturity Date | Funding | Outstanding | Maximum Commitment | |||||||||||||||||||||||||||||||||||||||||||||
| Description | Property Location | Current Quarter | Year to Date | |||||||||||||||||||||||||||||||||||||||||||||||
Construction Loan (d) | ||||||||||||||||||||||||||||||||||||||||||||||||||
SW Corner of Las Vegas & Harmon (e) (f) | Las Vegas, NV | Retail | Jun-21 | 2026 | $ | — | $ | 3,170 | $ | 245,884 | $ | 256,887 | ||||||||||||||||||||||||||||||||||||||
SE Corner of Las Vegas & Harmon (g) | Las Vegas, NV | Retail | Nov-24 | 2026 | 476 | 1,556 | 18,367 | 23,449 | ||||||||||||||||||||||||||||||||||||||||||
SE Corner of Las Vegas & Elvis Presley (g) | Las Vegas, NV | Retail | Nov-24 | 2026 | 615 | 2,370 | 17,417 | 25,000 | ||||||||||||||||||||||||||||||||||||||||||
| Total | 1,091 | 7,096 | 281,668 | 305,336 | ||||||||||||||||||||||||||||||||||||||||||||||
| Year-to-Date Total Investment Volume | $ | 2,105,288 | ||||||||||||||||||||||||||||||||||||||||||||||||
________
(a)Total lease terms are based on weighted-average ABR for the investments as of the respective period ends.
(b)This investment is accounted for as a loan receivable within Net investments in finance leases and loans receivable on our consolidated balance sheets, in accordance with ASC 310, Receivables and ASC 842, Leases.
(c)Amount reflects the applicable exchange rate on the date of the transaction.
(d)The borrowers for these construction loans retain certain loan maturity extension options.
(e)This construction loan is accounted for as an equity method investment on our consolidated balance sheets, in accordance with U.S. GAAP. Interest income is recognized within Earnings from equity method investments on our consolidated statements of income.
(f)Loan outstanding and maximum commitment reflect a repayment of $5.0 million to us during the year ended December 31, 2025.
(g)These construction loans are accounted for as secured loans receivable within Net investments in finance leases and loans receivable on our consolidated balance sheets, in accordance with U.S. GAAP. Interest income is recognized within Income from finance leases and loans receivable on our consolidated statements of income.
| Investing for the Long Run® | 18 | |||||||
W. P. Carey Inc.
Real Estate – Fourth Quarter 2025
Investment Activity – Capital Investments and Commitments (a) | |||||
Dollars in thousands. Pro rata.
| Primary Transaction Type | Property Type | Expected Completion / Closing Date | Additional Gross Square Footage | Lease Term (Years) (b) | Funded During Three Months Ended Dec. 31, 2025 (c) | Total Funded Through Dec. 31, 2025 | Maximum Commitment / Gross Investment Amount | |||||||||||||||||||||||||||||||||||||||||||||||||||||||
| Tenant | Location | Remaining | Total | |||||||||||||||||||||||||||||||||||||||||||||||||||||||||||
Janus International (d) (e) | Surprise, AZ | Build-to-Suit | Industrial | Q1 2026 | 131,753 | 20 | $ | 5,430 | $ | 19,968 | $ | 761 | $ | 20,729 | ||||||||||||||||||||||||||||||||||||||||||||||||
Hedin Mobility Group (d) (f) (g) | Amsterdam, The Netherlands | Build-to-Suit | Retail | Q1 2026 | 62,810 | 22 | 17,636 | 17,636 | — | 17,636 | ||||||||||||||||||||||||||||||||||||||||||||||||||||
Scania (f) | Oskarshamn, Sweden | Build-to-Suit | Warehouse | Q1 2026 | 204,645 | 15 | 8,894 | 14,285 | 3,263 | 17,548 | ||||||||||||||||||||||||||||||||||||||||||||||||||||
EOS Fitness (d) (e) | Surprise, AZ | Build-to-Suit | Retail | Q1 2026 | 40,000 | 20 | 1,993 | 7,948 | 3,697 | 11,645 | ||||||||||||||||||||||||||||||||||||||||||||||||||||
| Nord Anglia | Houston, TX | Expansion | Education | Q2 2026 | 13,150 | 20 | 12 | 12 | 8,488 | 8,500 | ||||||||||||||||||||||||||||||||||||||||||||||||||||
| Rocky Vista University | Billings, MT | Build-to-Suit | Education (Medical School) | Q3 2026 | 57,000 | 25 | 9,436 | 11,944 | 13,056 | 25,000 | ||||||||||||||||||||||||||||||||||||||||||||||||||||
TI Automotive (formerly ABC Technologies) (e) (f) | Brampton, Canada | Build-to-Suit | Industrial | Q3 2026 | 120,222 | 20 | 4,358 | 4,827 | 13,962 | 18,845 | ||||||||||||||||||||||||||||||||||||||||||||||||||||
NewEra Nobis (e) | Overland Park, KS | Expansion | Specialty (Healthcare) | Q3 2026 | 7,275 | 20 | 2,414 | 2,414 | 7,554 | 10,000 | ||||||||||||||||||||||||||||||||||||||||||||||||||||
AEG Presents (h) | Austin, TX | Build-to-Suit | Specialty | Q4 2026 | 56,403 | 30 | 3,850 | 8,182 | 39,374 | 47,556 | ||||||||||||||||||||||||||||||||||||||||||||||||||||
Novus Foods (e) | Delphos, OH | Build-to-Suit & Expansion | Industrial | Q4 2026 | 139,250 | 25 | 1,916 | 1,916 | 36,058 | 38,000 | ||||||||||||||||||||||||||||||||||||||||||||||||||||
| Untenanted | Atlanta, GA | Redevelopment | Warehouse | Q4 2026 | 99,000 | N/A | 36 | 147 | 11,532 | 11,679 | ||||||||||||||||||||||||||||||||||||||||||||||||||||
| Various | Various, US | Solar Projects | Various | Various | N/A | N/A | 2,178 | 4,231 | 6,900 | 11,131 | ||||||||||||||||||||||||||||||||||||||||||||||||||||
| Expected Completion Date 2026 Total | 931,508 | 23 | 58,153 | 93,510 | 144,645 | 238,269 | ||||||||||||||||||||||||||||||||||||||||||||||||||||||||
AEG Presents (h) | Portland, OR | Build-to-Suit | Specialty | Q1 2027 | 57,825 | 30 | 6,337 | 13,530 | 47,183 | 60,713 | ||||||||||||||||||||||||||||||||||||||||||||||||||||
| Untenanted | Atlanta, GA | Redevelopment | Warehouse | Q1 2027 | 432,800 | N/A | 340 | 960 | 39,812 | 40,772 | ||||||||||||||||||||||||||||||||||||||||||||||||||||
| Expected Completion Date 2027 Total | 490,625 | 30 | 6,677 | 14,490 | 86,995 | 101,485 | ||||||||||||||||||||||||||||||||||||||||||||||||||||||||
| Capital Investments and Commitments Total | 1,422,133 | 25 | $ | 64,830 | $ | 108,000 | $ | 231,640 | $ | 339,754 | ||||||||||||||||||||||||||||||||||||||||||||||||||||
________
(a)This schedule includes future estimates for which we can give no assurance as to timing or amounts. Completed capital investments and commitments are included in the Investment Activity – Investment Volume section. Funding amounts exclude capitalized construction interest.
(b)Total lease terms are based on weighted-average ABR for the investments expected upon completion.
(c)Total funding during the three months ended December 31, 2025 excludes $0.7 million spent on pre-development work for potential projects in various phases.
(d)These projects were completed in January 2026.
(e)We earn interest from this tenant, which is accrued through the construction period and deducted from the remaining commitment.
(f)Commitment amounts are based on the applicable exchange rate at period end.
(g)Project was funded upon completion and was contingent on building being constructed according to our standards.
(h)We own a 90% interest in these joint venture projects and amounts in this table represent our pro rata share.
| Investing for the Long Run® | 19 | |||||||
W. P. Carey Inc.
Real Estate – Fourth Quarter 2025
| Investment Activity – Dispositions | |||||
Dollars in thousands. Pro rata. For the year ended December 31, 2025.
| Tenant | Property Location(s) | Gross Sale Price | Closing Date | Property Type(s) | Gross Square Footage | |||||||||||||||||||||||||||
| 1Q25 | ||||||||||||||||||||||||||||||||
Hedin Mobility Group (2 properties) (a) | Eindhoven and Amsterdam, The Netherlands | $ | 16,593 | Jan-25 | Retail | 136,465 | ||||||||||||||||||||||||||
Pendragon (a) | Derby, United Kingdom | 2,158 | Jan-25 | Retail | 34,764 | |||||||||||||||||||||||||||
Pendragon (a) | Newport, United Kingdom | 752 | Jan-25 | Retail | 3,868 | |||||||||||||||||||||||||||
Vacant (formerly Pendragon) (a) | Milton Keynes, United Kingdom | 6,560 | Feb-25 | Retail | 25,942 | |||||||||||||||||||||||||||
Pendragon (a) | Portsmouth, United Kingdom | 1,506 | Feb-25 | Retail | 28,638 | |||||||||||||||||||||||||||
| Vacant (former Prima Wawona) | Reedley, CA | 21,500 | Mar-25 | Warehouse | 325,981 | |||||||||||||||||||||||||||
Hellweg (a) | Gronau, Germany | 3,569 | Mar-25 | Retail | 45,876 | |||||||||||||||||||||||||||
| Belk | Jonesville, SC | 77,194 | Mar-25 | Warehouse | 861,141 | |||||||||||||||||||||||||||
| 1Q25 Total | 129,832 | 1,462,675 | ||||||||||||||||||||||||||||||
| 2Q25 | ||||||||||||||||||||||||||||||||
Vita Euroland (a) | Gorinchem, The Netherlands | 8,488 | Apr-25 | Warehouse | 133,500 | |||||||||||||||||||||||||||
Accord Carton (2 properties) (b) | Alsip, IL | 20,757 | Apr-25 | Industrial | 471,890 | |||||||||||||||||||||||||||
Hellweg (3 properties) (a) | Ennepetal, Nordhausen, and Paderborn, Germany | 14,501 | May-25 | Retail | 198,002 | |||||||||||||||||||||||||||
| Vacant | Middleburg Heights, OH | 2,225 | May-25 | Industrial | 28,185 | |||||||||||||||||||||||||||
| TI Automotive (formerly ABC Technologies) | Saline, MI | 7,900 | May-25 | Industrial | 111,072 | |||||||||||||||||||||||||||
Memora Servicios Funerarios (26 properties) (a) | Various, Spain | 161,952 | Jun-25 | Specialty (Funeral Home) | 370,204 | |||||||||||||||||||||||||||
| Self-Storage Operating Properties (10 properties) | Various, United States | 111,525 | Jun-25 | Self-Storage (Operating) | 678,767 | |||||||||||||||||||||||||||
| Serco | San Diego, CA | 26,250 | Jun-25 | Research & Development | 157,721 | |||||||||||||||||||||||||||
Do It Best (formerly True Value) (c) | Mankato, MN | 10,605 | Jun-25 | Warehouse | 309,507 | |||||||||||||||||||||||||||
| 2Q25 Total | 364,203 | 2,458,848 | ||||||||||||||||||||||||||||||
| 3Q25 | ||||||||||||||||||||||||||||||||
| Self-Storage Operating Properties (22 properties) | Various, United States | 349,225 | Jul-25, Aug-25 | Self-Storage (Operating) | 1,797,870 | |||||||||||||||||||||||||||
Plantasjen (a) | Linkoping, Sweden | 7,408 | Jul-25 | Retail | 58,770 | |||||||||||||||||||||||||||
| Leipold | Windsor, CT | 6,600 | Jul-25 | Industrial | 40,362 | |||||||||||||||||||||||||||
Wagon Automotive (a) | Nagold, Germany | 18,221 | Aug-25 | Industrial | 305,437 | |||||||||||||||||||||||||||
Vacant (d) | St. Petersburg, FL | 7,000 | Sep-25 | Warehouse | 70,322 | |||||||||||||||||||||||||||
Hellweg (3 properties) (a) | Bünde, Guben, and Wuppertal, Germany | 28,834 | Sep-25 | Retail | 232,113 | |||||||||||||||||||||||||||
| Student Housing Operating Property | Austin, TX | 77,913 | Sep-25 | Student Housing (Operating) | 190,475 | |||||||||||||||||||||||||||
| 3Q25 Total | 495,201 | 2,695,349 | ||||||||||||||||||||||||||||||
| Investing for the Long Run® | 20 | |||||||
W. P. Carey Inc.
Real Estate – Fourth Quarter 2025
| Investment Activity – Dispositions (continued) | |||||
Dollars in thousands. Pro rata. For the year ended December 31, 2025.
| Tenant | Property Location(s) | Gross Sale Price | Closing Date | Property Type(s) | Gross Square Footage | |||||||||||||||||||||||||||
| 4Q25 | ||||||||||||||||||||||||||||||||
| TI Automotive (formerly ABC Technologies) | Southfield, MI | 470 | Oct-25 | Office | 16,752 | |||||||||||||||||||||||||||
Vacant (a) | Bad Wünnenberg, Germany | 5,339 | Oct-25 | Warehouse | 287,905 | |||||||||||||||||||||||||||
| Self-Storage Operating Properties (31 properties) | Various, United States | 323,221 | Oct-25, Nov-25, Dec-25 | Self-Storage (Operating) | 2,169,286 | |||||||||||||||||||||||||||
| Vacant | Mauldin, SC | 6,028 | Nov-25 | Warehouse | 72,600 | |||||||||||||||||||||||||||
Vacant (formerly Hellweg) (a) | Werl, Germany | 1,506 | Nov-25 | Retail | 66,672 | |||||||||||||||||||||||||||
Hellweg (2 properties) (a) | Quedlinburg and Leipzig, Germany | 16,281 | Dec-25 | Retail | 156,088 | |||||||||||||||||||||||||||
| Vacant | Chicago, IL | 14,000 | Nov-25 | Office | 159,600 | |||||||||||||||||||||||||||
| Vacant | Westlake, OH | 17,250 | Dec-25 | Warehouse | 408,251 | |||||||||||||||||||||||||||
COOP Ost SA (sold 90.1% controlling interest) (a) | Oslo, Norway | 101,610 | Dec-25 | Retail | 317,647 | |||||||||||||||||||||||||||
Hööks Hästsport AB (a) | Vantaa, Finland | 2,454 | Dec-25 | Retail | 17,115 | |||||||||||||||||||||||||||
| Lincoln Tech | Philadelphia, PA | 2,295 | Dec-25 | Education | 31,020 | |||||||||||||||||||||||||||
| Vacant | Kansas City, MO | 10,500 | Dec-25 | Warehouse | 414,680 | |||||||||||||||||||||||||||
| AMC | Pensacola, FL | 6,000 | Dec-25 | Retail | 73,971 | |||||||||||||||||||||||||||
| 4Q25 Total | 506,954 | 4,191,587 | ||||||||||||||||||||||||||||||
| Year-to-Date Total Dispositions | $ | 1,496,190 | 10,808,459 | |||||||||||||||||||||||||||||
________
(a)Amount reflects the applicable exchange rate on the date of the transaction.
(b)One of the properties was vacant on the date of the transaction.
(c)The lease at this property expired on the date of sale, which was June 30, 2025.
(d)Represents the disposition of a portion of this property.
| Investing for the Long Run® | 21 | |||||||
W. P. Carey Inc.
Real Estate – Fourth Quarter 2025
| Joint Ventures | |||||
Dollars in thousands. As of December 31, 2025.
| Joint Venture or JV (Principal Tenant) | JV Partnership | Consolidated | Pro Rata (a) | |||||||||||||||||||||||||||||||||||
| Asset Type | WPC % | Debt Outstanding (b) | ABR | Debt Outstanding (c) | ABR | |||||||||||||||||||||||||||||||||
Unconsolidated Joint Venture (Equity Method Investment) (d) | ||||||||||||||||||||||||||||||||||||||
Las Vegas Retail Complex (e) | Net lease | 47.50% | $ | 245,884 | $ | 22,592 | $ | 116,795 | $ | 10,731 | ||||||||||||||||||||||||||||
| Harmon Retail Corner | Common equity interest | 15.00% | 143,000 | — | 21,450 | — | ||||||||||||||||||||||||||||||||
Kesko Senukai (f) | Net lease | 70.00% | 100,534 | 18,105 | 70,374 | 12,674 | ||||||||||||||||||||||||||||||||
| Total Unconsolidated Joint Ventures | 489,418 | 40,697 | 208,619 | 23,405 | ||||||||||||||||||||||||||||||||||
Consolidated Joint Ventures (g) | ||||||||||||||||||||||||||||||||||||||
Fentonir (f) | Net lease | 94.90% | — | 2,948 | — | 2,798 | ||||||||||||||||||||||||||||||||
| McCoy Rockford | Net lease | 90.00% | — | 991 | — | 892 | ||||||||||||||||||||||||||||||||
| Iowa Board of Regents | Net lease | 90.00% | — | 707 | — | 636 | ||||||||||||||||||||||||||||||||
| Total Consolidated Joint Ventures | — | 4,646 | — | 4,326 | ||||||||||||||||||||||||||||||||||
Total Unconsolidated and Consolidated Joint Ventures | $ | 489,418 | $ | 45,343 | $ | 208,619 | $ | 27,731 | ||||||||||||||||||||||||||||||
________
(a)See the Disclosures Regarding Non-GAAP and Other Metrics section in the Appendix for a description of pro rata.
(b)Excludes unamortized discount, net totaling less than $0.1 million and unamortized deferred financing costs totaling $0.2 million as of December 31, 2025.
(c)Excludes unamortized discount, net totaling less than $0.1 million and unamortized deferred financing costs totaling less than $0.1 million as of December 31, 2025.
(d)Excludes ownership of limited partnership units of Carey European Student Housing Fund I, L.P. (an affiliate), which is accounted for as an equity method investment.
(e)Debt outstanding for this investment is comprised of a construction loan, which is excluded from our pro rata debt outstanding disclosed in the Debt Overview and Debt Maturity sections. See the Investment Activity – Investment Volume section for additional information about this investment. The asset is currently in lease-up and ABR reflects the current in-place leases. It does not reflect certain non-reimbursed expenses associated with the property, revenue generated from signage or interest income from our construction loan to the Las Vegas Retail Complex.
(f)Amounts are based on the applicable exchange rate at the end of the period.
(g)Excludes two consolidated joint venture build-to-suit projects with the same tenant in which we own a 90% ownership interest. These investments have no debt or ABR as of December 31, 2025.
| Investing for the Long Run® | 22 | |||||||
W. P. Carey Inc.
Real Estate – Fourth Quarter 2025
| Top 25 Tenants | |||||
Dollars in thousands. Pro rata. As of December 31, 2025.
| Tenant | Description | Number of Properties | ABR | ABR % | Weighted-Average Lease Term (Years) | |||||||||||||||||||||||||||
| Extra Space Storage | Net lease self-storage properties in the U.S. leased to publicly traded self-storage REIT | 43 | $ | 41,332 | 2.7 | % | 23.7 | |||||||||||||||||||||||||
Apotex (a) | Pharmaceutical R&D and manufacturing properties in the Greater Toronto Area leased to generic drug manufacturer | 11 | 33,448 | 2.2 | % | 17.2 | ||||||||||||||||||||||||||
| Life Time Fitness | Health and fitness facilities in the U.S. leased to premium athletic club operator | 12 | 32,450 | 2.1 | % | 7.9 | ||||||||||||||||||||||||||
Metro Italia (b) | Business-to-business retail stores in Italy leased to cash and carry wholesaler | 19 | 30,893 | 2.0 | % | 4.4 | ||||||||||||||||||||||||||
Fortenova (b) | Grocery stores and one warehouse in Croatia leased to European food retailer | 19 | 28,404 | 1.8 | % | 8.3 | ||||||||||||||||||||||||||
OBI (b) | Retail properties in Poland leased to German DIY retailer | 26 | 27,524 | 1.8 | % | 5.3 | ||||||||||||||||||||||||||
Fedrigoni (b) | Industrial and warehouse facilities in Germany, Italy and Spain leased to global manufacturer of premium packaging and labels | 16 | 25,517 | 1.6 | % | 17.9 | ||||||||||||||||||||||||||
TI Automotive (formerly ABC Technologies) (a) (c) | Automotive parts manufacturing properties in the U.S., Canada and Mexico leased to OEM supplier | 21 | 25,313 | 1.6 | % | 19.2 | ||||||||||||||||||||||||||
Eroski (b) | Grocery stores and warehouses in Spain leased to Spanish food retailer | 63 | 24,104 | 1.5 | % | 10.2 | ||||||||||||||||||||||||||
| Nord Anglia | K-12 private schools in Orlando, Miami and Houston leased to international day and boarding school operator | 3 | 23,599 | 1.5 | % | 18.7 | ||||||||||||||||||||||||||
| Top 10 Total | 233 | 292,584 | 18.8 | % | 13.5 | |||||||||||||||||||||||||||
| Berry Global | Manufacturing facilities in the U.S. leased to international producer and supplier of packaging solutions | 8 | 20,833 | 1.4 | % | 12.8 | ||||||||||||||||||||||||||
Quikrete (b) | Industrial facilities in the U.S. and Canada leased to concrete and building products manufacturer | 27 | 20,661 | 1.3 | % | 17.5 | ||||||||||||||||||||||||||
Kesko Senukai (b) | Distribution facilities and retail properties in Lithuania, Estonia and Latvia leased to European DIY retailer | 20 | 20,129 | 1.3 | % | 6.1 | ||||||||||||||||||||||||||
Pendragon (b) | Dealerships in the United Kingdom leased to automotive retailer | 46 | 19,035 | 1.2 | % | 12.8 | ||||||||||||||||||||||||||
| Advance Auto Parts | Distribution facilities in the U.S. leased to automotive aftermarket parts provider | 28 | 18,980 | 1.2 | % | 7.1 | ||||||||||||||||||||||||||
| Maker’s Pride (formerly Hearthside) | Production, packaging and distribution facilities in the U.S. leased to North American contract food manufacturer | 18 | 17,636 | 1.2 | % | 16.6 | ||||||||||||||||||||||||||
Hellweg (b) (d) | Retail properties in Germany leased to German DIY retailer | 19 | 17,223 | 1.1 | % | 14.6 | ||||||||||||||||||||||||||
| Dollar General | Retail properties in the U.S. leased to discount retailer | 126 | 17,199 | 1.1 | % | 13.5 | ||||||||||||||||||||||||||
Jumbo (b) | Logistics and cold storage warehouse facilities in the Netherlands leased to European supermarket chain | 5 | 16,907 | 1.1 | % | 6.0 | ||||||||||||||||||||||||||
Danske Fragtmaend (b) | Distribution facilities in Denmark leased to Danish freight company | 15 | 15,097 | 1.0 | % | 11.1 | ||||||||||||||||||||||||||
| Top 20 Total | 545 | 476,284 | 30.7 | % | 12.9 | |||||||||||||||||||||||||||
Intergamma (b) | Retail properties in the Netherlands leased to European DIY retailer | 36 | 14,955 | 0.9 | % | 7.6 | ||||||||||||||||||||||||||
| Do It Best (formerly True Value) | Distribution facilities and manufacturing facility in the U.S. leased to global hardware wholesaler | 6 | 13,801 | 0.9 | % | 6.0 | ||||||||||||||||||||||||||
| Dick’s Sporting Goods | Retail properties and single distribution facility in the U.S. leased to sporting goods retailer | 9 | 13,616 | 0.9 | % | 5.6 | ||||||||||||||||||||||||||
| Premium Brands | Food processing facility in Tennessee leased to global specialty food manufacturer | 1 | 12,616 | 0.8 | % | 24.6 | ||||||||||||||||||||||||||
| Canadian Solar | Distribution and manufacturing facilities in Dallas and Louisville leased to global renewable energy company | 2 | 12,255 | 0.8 | % | 10.3 | ||||||||||||||||||||||||||
Top 25 Total (e) | 599 | $ | 543,527 | 35.0 | % | 12.6 | ||||||||||||||||||||||||||
________
(a)ABR from these properties is denominated in U.S. dollars.
(b)ABR amounts are subject to fluctuations in foreign currency exchange rates.
(c)Of the 21 properties leased to TI Automotive, nine are located in Canada, six are located in the United States, and six are located in Mexico.
(d)On March 28, 2025, we executed an agreement giving us the right to terminate the leases at five properties on September 15, 2026 with ABR totaling $3.5 million.
(e)See the Disclosures Regarding Non-GAAP and Other Metrics section in the Appendix for a description of pro rata.
| Investing for the Long Run® | 23 | |||||||
W. P. Carey Inc.
Real Estate – Fourth Quarter 2025
| Diversification by Property Type | |||||
In thousands, except percentages. Pro rata. As of December 31, 2025.
| Total Net-Lease Portfolio | ||||||||||||||||||||||||||
| Property Type | ABR | ABR % | Square Footage (a) | Square Footage % | ||||||||||||||||||||||
| U.S. | ||||||||||||||||||||||||||
| Industrial | $ | 395,765 | 25.4 | % | 58,036 | 31.6 | % | |||||||||||||||||||
| Warehouse | 230,928 | 14.9 | % | 42,442 | 23.1 | % | ||||||||||||||||||||
Retail (b) | 136,708 | 8.8 | % | 6,382 | 3.5 | % | ||||||||||||||||||||
Other (c) | 183,656 | 11.9 | % | 9,452 | 5.2 | % | ||||||||||||||||||||
| U.S. Total | 947,057 | 61.0 | % | 116,312 | 63.4 | % | ||||||||||||||||||||
| International | ||||||||||||||||||||||||||
| Industrial | 200,103 | 12.9 | % | 25,720 | 14.0 | % | ||||||||||||||||||||
| Warehouse | 159,989 | 10.3 | % | 23,234 | 12.7 | % | ||||||||||||||||||||
Retail (b) | 211,331 | 13.6 | % | 16,473 | 9.0 | % | ||||||||||||||||||||
Other (c) | 34,832 | 2.2 | % | 1,759 | 0.9 | % | ||||||||||||||||||||
| International Total | 606,255 | 39.0 | % | 67,186 | 36.6 | % | ||||||||||||||||||||
| Total | ||||||||||||||||||||||||||
| Industrial | 595,868 | 38.3 | % | 83,756 | 45.6 | % | ||||||||||||||||||||
| Warehouse | 390,917 | 25.2 | % | 65,676 | 35.8 | % | ||||||||||||||||||||
Retail (b) | 348,039 | 22.4 | % | 22,855 | 12.5 | % | ||||||||||||||||||||
Other (c) | 218,488 | 14.1 | % | 11,211 | 6.1 | % | ||||||||||||||||||||
Total (d) | $ | 1,553,312 | 100.0 | % | 183,498 | 100.0 | % | |||||||||||||||||||
________
(a)Includes square footage for vacant properties.
(b)Includes automotive dealerships.
(c)Includes ABR from tenants with the following property types: education facility, specialty, self-storage (net lease), laboratory, research and development, hotel (net lease), office and land.
(d)See the Disclosures Regarding Non-GAAP and Other Metrics section in the Appendix for a description of pro rata.
| Investing for the Long Run® | 24 | |||||||
W. P. Carey Inc.
Real Estate – Fourth Quarter 2025
| Diversification by Tenant Industry | |||||
In thousands, except percentages. Pro rata. As of December 31, 2025.
| Total Net-Lease Portfolio | ||||||||||||||||||||||||||
Industry Type (a) | ABR | ABR % | Square Footage | Square Footage % | ||||||||||||||||||||||
| Packaged Foods & Meats | $ | 149,136 | 9.6 | % | 18,625 | 10.2 | % | |||||||||||||||||||
| Food Retail | 146,151 | 9.4 | % | 10,704 | 5.8 | % | ||||||||||||||||||||
| Home Improvement Retail | 96,221 | 6.2 | % | 11,937 | 6.5 | % | ||||||||||||||||||||
| Auto Parts & Equipment | 81,819 | 5.3 | % | 12,148 | 6.6 | % | ||||||||||||||||||||
| Automotive Retail | 78,203 | 5.0 | % | 7,079 | 3.9 | % | ||||||||||||||||||||
| Education Services | 60,532 | 3.9 | % | 2,747 | 1.5 | % | ||||||||||||||||||||
| Air Freight & Logistics | 51,599 | 3.3 | % | 7,982 | 4.3 | % | ||||||||||||||||||||
| Pharmaceuticals | 48,155 | 3.1 | % | 3,076 | 1.7 | % | ||||||||||||||||||||
| Leisure Facilities | 43,423 | 2.8 | % | 1,958 | 1.1 | % | ||||||||||||||||||||
| Industrial Machinery | 41,888 | 2.7 | % | 5,716 | 3.1 | % | ||||||||||||||||||||
| Self-Storage REITs | 41,332 | 2.7 | % | 3,170 | 1.7 | % | ||||||||||||||||||||
| Metal, Glass & Plastic Containers | 39,646 | 2.6 | % | 5,318 | 2.9 | % | ||||||||||||||||||||
| Trading Companies & Distributors | 37,752 | 2.4 | % | 8,663 | 4.7 | % | ||||||||||||||||||||
| Building Products | 31,086 | 2.0 | % | 6,653 | 3.6 | % | ||||||||||||||||||||
| Other Specialty Retail | 28,953 | 1.9 | % | 3,227 | 1.8 | % | ||||||||||||||||||||
| Paper Products | 25,517 | 1.6 | % | 4,458 | 2.4 | % | ||||||||||||||||||||
| Specialty Chemicals | 24,409 | 1.6 | % | 4,303 | 2.3 | % | ||||||||||||||||||||
| Diversified Support Services | 24,000 | 1.5 | % | 2,372 | 1.3 | % | ||||||||||||||||||||
| Construction Materials | 23,574 | 1.5 | % | 3,781 | 2.1 | % | ||||||||||||||||||||
| Food Distributors | 20,621 | 1.3 | % | 1,552 | 0.8 | % | ||||||||||||||||||||
| Construction Machinery | 19,645 | 1.3 | % | 2,528 | 1.4 | % | ||||||||||||||||||||
| Consumer Staples Merchandise Retail | 19,404 | 1.3 | % | 1,624 | 0.9 | % | ||||||||||||||||||||
| Passenger Ground Transportation | 18,970 | 1.2 | % | 850 | 0.5 | % | ||||||||||||||||||||
| Commodity Chemicals | 16,848 | 1.1 | % | 2,517 | 1.4 | % | ||||||||||||||||||||
| Hotels & Resorts | 16,556 | 1.1 | % | 1,073 | 0.6 | % | ||||||||||||||||||||
| Diversified Metals | 16,289 | 1.0 | % | 3,290 | 1.8 | % | ||||||||||||||||||||
Other (64 industries, each <1% ABR) (b) | 351,583 | 22.6 | % | 46,147 | 25.1 | % | ||||||||||||||||||||
Total (c) | $ | 1,553,312 | 100.0 | % | 183,498 | 100.0 | % | |||||||||||||||||||
________
(a)Industry classification is based on the Global Industry Classification Standard (GICS) framework.
(b)Includes square footage for vacant properties.
(c)See the Disclosures Regarding Non-GAAP and Other Metrics section in the Appendix for a description of pro rata.
| Investing for the Long Run® | 25 | |||||||
W. P. Carey Inc.
Real Estate – Fourth Quarter 2025
| Diversification by Geography | |||||
In thousands, except percentages. Pro rata. As of December 31, 2025.
| Total Net-Lease Portfolio | ||||||||||||||||||||||||||
| Region | ABR | ABR % | Square Footage (a) | Square Footage % | ||||||||||||||||||||||
| U.S. | ||||||||||||||||||||||||||
| Midwest | ||||||||||||||||||||||||||
| Illinois | $ | 66,036 | 4.3 | % | 9,455 | 5.2 | % | |||||||||||||||||||
| Ohio | 45,660 | 2.9 | % | 8,218 | 4.5 | % | ||||||||||||||||||||
| Indiana | 43,362 | 2.8 | % | 6,251 | 3.4 | % | ||||||||||||||||||||
| Michigan | 27,158 | 1.7 | % | 4,486 | 2.4 | % | ||||||||||||||||||||
| Wisconsin | 22,515 | 1.4 | % | 3,410 | 1.9 | % | ||||||||||||||||||||
Other (b) | 58,624 | 3.8 | % | 7,141 | 3.9 | % | ||||||||||||||||||||
| Total Midwest | 263,355 | 16.9 | % | 38,961 | 21.3 | % | ||||||||||||||||||||
| South | ||||||||||||||||||||||||||
| Texas | 93,471 | 6.0 | % | 11,702 | 6.4 | % | ||||||||||||||||||||
| Florida | 44,548 | 2.9 | % | 3,633 | 2.0 | % | ||||||||||||||||||||
| Tennessee | 39,281 | 2.5 | % | 4,572 | 2.5 | % | ||||||||||||||||||||
| Georgia | 30,302 | 2.0 | % | 4,529 | 2.5 | % | ||||||||||||||||||||
| Alabama | 23,484 | 1.5 | % | 3,607 | 2.0 | % | ||||||||||||||||||||
Other (b) | 29,031 | 1.9 | % | 3,072 | 1.7 | % | ||||||||||||||||||||
| Total South | 260,117 | 16.8 | % | 31,115 | 17.1 | % | ||||||||||||||||||||
| East | ||||||||||||||||||||||||||
| North Carolina | 41,210 | 2.7 | % | 8,852 | 4.8 | % | ||||||||||||||||||||
| Pennsylvania | 32,527 | 2.1 | % | 3,385 | 1.8 | % | ||||||||||||||||||||
| Kentucky | 29,768 | 1.9 | % | 4,485 | 2.4 | % | ||||||||||||||||||||
| Massachusetts | 28,681 | 1.8 | % | 1,344 | 0.7 | % | ||||||||||||||||||||
| New Jersey | 27,506 | 1.8 | % | 1,118 | 0.6 | % | ||||||||||||||||||||
| New York | 23,080 | 1.5 | % | 2,287 | 1.2 | % | ||||||||||||||||||||
| South Carolina | 19,531 | 1.3 | % | 4,413 | 2.4 | % | ||||||||||||||||||||
Other (b) | 37,266 | 2.4 | % | 5,359 | 2.9 | % | ||||||||||||||||||||
| Total East | 239,569 | 15.5 | % | 31,243 | 16.8 | % | ||||||||||||||||||||
| West | ||||||||||||||||||||||||||
| California | 76,277 | 4.9 | % | 5,375 | 2.9 | % | ||||||||||||||||||||
| Arizona | 22,548 | 1.5 | % | 2,372 | 1.3 | % | ||||||||||||||||||||
| Nevada | 17,861 | 1.1 | % | 485 | 0.3 | % | ||||||||||||||||||||
Other (b) | 67,330 | 4.3 | % | 6,761 | 3.7 | % | ||||||||||||||||||||
| Total West | 184,016 | 11.8 | % | 14,993 | 8.2 | % | ||||||||||||||||||||
| U.S. Total | 947,057 | 61.0 | % | 116,312 | 63.4 | % | ||||||||||||||||||||
| International | ||||||||||||||||||||||||||
| Italy | 78,315 | 5.0 | % | 9,941 | 5.4 | % | ||||||||||||||||||||
| The Netherlands | 68,092 | 4.4 | % | 6,847 | 3.7 | % | ||||||||||||||||||||
| Poland | 65,529 | 4.2 | % | 8,448 | 4.6 | % | ||||||||||||||||||||
| United Kingdom | 62,845 | 4.1 | % | 4,848 | 2.7 | % | ||||||||||||||||||||
Canada (c) | 59,680 | 3.8 | % | 5,737 | 3.1 | % | ||||||||||||||||||||
| Germany | 48,061 | 3.1 | % | 5,304 | 2.9 | % | ||||||||||||||||||||
| Spain | 42,550 | 2.7 | % | 4,251 | 2.3 | % | ||||||||||||||||||||
| Croatia | 29,330 | 1.9 | % | 2,063 | 1.1 | % | ||||||||||||||||||||
| France | 28,203 | 1.8 | % | 2,149 | 1.2 | % | ||||||||||||||||||||
Mexico (d) | 27,686 | 1.8 | % | 4,328 | 2.4 | % | ||||||||||||||||||||
| Denmark | 27,613 | 1.8 | % | 3,002 | 1.6 | % | ||||||||||||||||||||
Other (e) | 68,351 | 4.4 | % | 10,268 | 5.6 | % | ||||||||||||||||||||
| International Total | 606,255 | 39.0 | % | 67,186 | 36.6 | % | ||||||||||||||||||||
Total (f) | $ | 1,553,312 | 100.0 | % | 183,498 | 100.0 | % | |||||||||||||||||||
________
(a)Includes square footage for vacant properties.
(b)Other properties within Midwest include assets in Minnesota, Kansas, Iowa, Missouri, Nebraska, South Dakota and North Dakota. Other properties within South include assets in Louisiana, Arkansas, Oklahoma and Mississippi. Other properties within East include assets in Virginia, Maryland, Connecticut, West Virginia, New Hampshire and Maine. Other properties within West include assets in Utah, Oregon, Colorado, Washington, Montana, Hawaii, Idaho, Wyoming and New Mexico.
(c)$50.4 million (84%) of ABR from properties in Canada is denominated in U.S. dollars, with the balance denominated in Canadian dollars.
(d)All ABR from properties in Mexico is denominated in U.S. dollars.
(e)Includes assets in Lithuania, Slovakia, Belgium, the Czech Republic, Mauritius, Portugal, Austria, Latvia, Sweden, Finland, Japan, Estonia and Hungary.
(f)See the Disclosures Regarding Non-GAAP and Other Metrics section in the Appendix for a description of pro rata.
| Investing for the Long Run® | 26 | |||||||
W. P. Carey Inc.
Real Estate – Fourth Quarter 2025
| Contractual Rent Increases | |||||
In thousands, except percentages. Pro rata. As of December 31, 2025.
| Total Net-Lease Portfolio | ||||||||||||||||||||||||||
| Rent Adjustment Measure | ABR | ABR % | Square Footage | Square Footage % | ||||||||||||||||||||||
| Uncapped CPI | $ | 463,873 | 29.9 | % | 45,063 | 24.6 | % | |||||||||||||||||||
| Capped CPI | 287,266 | 18.5 | % | 39,446 | 21.5 | % | ||||||||||||||||||||
| CPI-linked | 751,139 | 48.4 | % | 84,509 | 46.1 | % | ||||||||||||||||||||
| Fixed | 749,236 | 48.2 | % | 91,454 | 49.9 | % | ||||||||||||||||||||
Other (a) | 47,489 | 3.1 | % | 3,524 | 1.9 | % | ||||||||||||||||||||
| None | 5,448 | 0.3 | % | 251 | 0.1 | % | ||||||||||||||||||||
| Vacant | — | — | % | 3,760 | 2.0 | % | ||||||||||||||||||||
Total (b) | $ | 1,553,312 | 100.0 | % | 183,498 | 100.0 | % | |||||||||||||||||||
________
(a)Represents leases which include a percentage rent component. Includes $41.3 million (2.7%) of ABR from a tenant (Extra Space Storage), which has both a percentage rent component and annual fixed rent increases in its lease.
(b)See the Disclosures Regarding Non-GAAP and Other Metrics section in the Appendix for a description of pro rata.
| Investing for the Long Run® | 27 | |||||||
W. P. Carey Inc.
Real Estate – Fourth Quarter 2025
| Same-Store Analysis | |||||
Dollars in thousands. Pro rata.
Contractual Same-Store Growth
Same-store portfolio includes leases on our net leased properties that were continuously in place during the period from December 31, 2024 to December 31, 2025. Excludes leases for properties that were acquired, sold or vacated, or were subject to lease renewals, extensions or modifications at any time that affected ABR during that period. For purposes of comparability, ABR is presented on a constant currency basis using exchange rates as of December 31, 2025.
| ABR | |||||||||||||||||||||||
| As of | |||||||||||||||||||||||
| Dec. 31, 2025 | Dec. 31, 2024 | Increase | % Increase | ||||||||||||||||||||
| Property Type | |||||||||||||||||||||||
| Industrial | $ | 459,515 | $ | 448,239 | $ | 11,276 | 2.5 | % | |||||||||||||||
| Warehouse | 344,394 | 337,278 | 7,116 | 2.1 | % | ||||||||||||||||||
Retail (a) | 296,542 | 289,364 | 7,178 | 2.5 | % | ||||||||||||||||||
Other (b) | 186,400 | 181,435 | 4,965 | 2.7 | % | ||||||||||||||||||
| Total | $ | 1,286,851 | $ | 1,256,316 | $ | 30,535 | 2.4 | % | |||||||||||||||
| Rent Adjustment Measure | |||||||||||||||||||||||
| Uncapped CPI | $ | 410,600 | $ | 400,362 | $ | 10,238 | 2.6 | % | |||||||||||||||
| Capped CPI | 255,067 | 248,507 | 6,560 | 2.6 | % | ||||||||||||||||||
| CPI-linked | 665,667 | 648,869 | 16,798 | 2.6 | % | ||||||||||||||||||
| Fixed | 573,289 | 561,635 | 11,654 | 2.1 | % | ||||||||||||||||||
Other (c) | 43,797 | 41,714 | 2,083 | 5.0 | % | ||||||||||||||||||
| None | 4,098 | 4,098 | — | — | % | ||||||||||||||||||
| Total | $ | 1,286,851 | $ | 1,256,316 | $ | 30,535 | 2.4 | % | |||||||||||||||
| Geography | |||||||||||||||||||||||
| U.S. | $ | 754,545 | $ | 737,812 | $ | 16,733 | 2.3 | % | |||||||||||||||
| Europe | 448,125 | 436,653 | 11,472 | 2.6 | % | ||||||||||||||||||
Other International (d) | 84,181 | 81,851 | 2,330 | 2.8 | % | ||||||||||||||||||
| Total | $ | 1,286,851 | $ | 1,256,316 | $ | 30,535 | 2.4 | % | |||||||||||||||
| Same-Store Portfolio Summary | |||||||||||||||||||||||
| Number of properties | 1,388 | ||||||||||||||||||||||
| Square footage (in thousands) | 154,073 | ||||||||||||||||||||||
| Investing for the Long Run® | 28 | |||||||
W. P. Carey Inc.
Real Estate – Fourth Quarter 2025
Comprehensive Same-Store Growth
Same-store portfolio includes net leased properties that were continuously owned and in place during the quarter ended December 31, 2024 through December 31, 2025 (including properties that were subject to lease renewals, extensions or modifications at any time during that period). Excludes properties that were acquired, sold or listed as capital investments and commitments (see Investment Activity – Capital Investments and Commitments section) during that period. For purposes of comparability, same-store pro rata rental income is presented on a constant currency basis using average exchange rates for the three months ended December 31, 2025. Same-store pro rata rental income is a non-GAAP measure. See the Disclosures Regarding Non-GAAP and Other Metrics section in the Appendix for a description of same-store pro rata rental income and for details on how it is calculated.
| Same-Store Pro Rata Rental Income | |||||||||||||||||||||||
| Three Months Ended | |||||||||||||||||||||||
| Dec. 31, 2025 | Dec. 31, 2024 | Increase | % Increase | ||||||||||||||||||||
| Property Type | |||||||||||||||||||||||
| Industrial | $ | 115,402 | $ | 112,633 | $ | 2,769 | 2.5 | % | |||||||||||||||
| Warehouse | 87,831 | 88,307 | (476) | (0.5) | % | ||||||||||||||||||
Retail (a) | 70,845 | 69,679 | 1,166 | 1.7 | % | ||||||||||||||||||
Other (b) | 45,044 | 46,259 | (1,215) | (2.6) | % | ||||||||||||||||||
| Total | $ | 319,122 | $ | 316,878 | $ | 2,244 | 0.7 | % | |||||||||||||||
| Rent Adjustment Measure | |||||||||||||||||||||||
| Uncapped CPI | $ | 104,162 | $ | 102,313 | $ | 1,849 | 1.8 | % | |||||||||||||||
| Capped CPI | 65,675 | 66,985 | (1,310) | (2.0) | % | ||||||||||||||||||
| CPI-linked | 169,837 | 169,298 | 539 | 0.3 | % | ||||||||||||||||||
| Fixed | 137,282 | 136,086 | 1,196 | 0.9 | % | ||||||||||||||||||
Other (c) | 10,967 | 10,430 | 537 | 5.1 | % | ||||||||||||||||||
| None | 1,036 | 1,064 | (28) | (2.6) | % | ||||||||||||||||||
| Total | $ | 319,122 | $ | 316,878 | $ | 2,244 | 0.7 | % | |||||||||||||||
| Geography | |||||||||||||||||||||||
| U.S. | $ | 188,281 | $ | 183,444 | $ | 4,837 | 2.6 | % | |||||||||||||||
| Europe | 111,381 | 114,452 | (3,071) | (2.7) | % | ||||||||||||||||||
Other International (d) | 19,460 | 18,982 | 478 | 2.5 | % | ||||||||||||||||||
| Total | $ | 319,122 | $ | 316,878 | $ | 2,244 | 0.7 | % | |||||||||||||||
| Same-Store Portfolio Summary | |||||||||||||||||||||||
| Number of properties | 1,314 | ||||||||||||||||||||||
| Square footage (in thousands) | 160,443 | ||||||||||||||||||||||
| Investing for the Long Run® | 29 | |||||||
W. P. Carey Inc.
Real Estate – Fourth Quarter 2025
The following table presents a reconciliation from lease revenues to same-store pro rata rental income:
| Three Months Ended | |||||||||||
| Dec. 31, 2025 | Dec. 31, 2024 | ||||||||||
| Consolidated Lease Revenues | |||||||||||
| Total lease revenues – as reported | $ | 389,154 | $ | 351,394 | |||||||
| Income from finance leases and loans receivable | 26,716 | 16,796 | |||||||||
| Less: Reimbursable tenant costs – as reported | (19,371) | (15,661) | |||||||||
| Less: Income from secured loans receivable | (664) | (332) | |||||||||
| 395,835 | 352,197 | ||||||||||
| Adjustments for Pro Rata Ownership of Real Estate Joint Ventures: | |||||||||||
| Add: Pro rata share of adjustments from equity method investments | 5,438 | 3,795 | |||||||||
| Less: Pro rata share of adjustments for noncontrolling interests | (264) | (185) | |||||||||
| 5,174 | 3,610 | ||||||||||
| Adjustments for Pro Rata Non-Cash Items: | |||||||||||
| Less: Straight-line and other leasing and financing adjustments | (20,758) | (24,849) | |||||||||
| Add: Above- and below-market rent intangible lease amortization | 941 | 10,047 | |||||||||
| Less: Adjustments for pro rata ownership | (48) | (1,265) | |||||||||
| (19,865) | (16,067) | ||||||||||
Adjustment to normalize for (i) properties not continuously owned since October 1, 2024 and (ii) constant currency presentation for prior year quarter (e) | (62,022) | (22,862) | |||||||||
| Same-Store Pro Rata Rental Income | $ | 319,122 | $ | 316,878 | |||||||
________
(a)Includes automotive dealerships.
(b)Includes ABR or same-store pro rata rental income from tenants with the following property types: education facility, specialty, self-storage (net lease), laboratory, research and development, hotel (net lease), office and land.
(c)Represents leases attributable to percentage rent.
(d)Includes assets in Canada, Mexico, Mauritius and Japan.
(e)This adjustment excludes amounts attributable to properties that were acquired, sold or listed as capital investments and commitments (see Investment Activity – Capital Investments and Commitments section) that were not continuously owned and in place during the quarter ended December 31, 2024 through December 31, 2025. In addition, for the three months ended December 31, 2024, an adjustment is made to reflect average exchange rates for the three months ended December 31, 2025 for purposes of comparability, since same-store pro rata rental income is presented on a constant currency basis.
| Investing for the Long Run® | 30 | |||||||
W. P. Carey Inc.
Real Estate – Fourth Quarter 2025
| Leasing Activity | |||||
Dollars in thousands. For the three months ended December 31, 2025, except ABR. Pro rata.
Lease Renewals and Extensions (a) | Property and Tenant Improvements (c) | Leasing Commissions | ||||||||||||||||||||||||||||||||||||||||||||||||
| ABR | ||||||||||||||||||||||||||||||||||||||||||||||||||
| Property Type | Square Feet | Number of Leases | Prior Lease | New Lease (b) | Rent Recapture | Incremental Lease Term | ||||||||||||||||||||||||||||||||||||||||||||
| Industrial | 1,333,295 | 3 | $ | 7,098 | $ | 7,347 | 103.5 | % | $ | 1,000 | $ | 833 | 10.2 years | |||||||||||||||||||||||||||||||||||||
| Warehouse | 804,849 | 2 | 6,116 | 5,816 | 95.1 | % | 3,495 | 2,294 | 9.5 years | |||||||||||||||||||||||||||||||||||||||||
| Retail | — | — | — | — | — | % | — | — | N/A | |||||||||||||||||||||||||||||||||||||||||
| Other | 323,278 | 1 | 6,876 | 6,876 | 100.0 | % | — | — | 3.3 years | |||||||||||||||||||||||||||||||||||||||||
| Total / Weighted Average | 2,461,422 | 6 | $ | 20,090 | $ | 20,039 | 99.7 | % | $ | 4,495 | $ | 3,127 | 7.7 years | |||||||||||||||||||||||||||||||||||||
| Q4 Summary | ||||||||||||||||||||||||||||||||||||||||||||||||||
Prior Lease ABR (% of Total Portfolio) | 1.3 | % | ||||||||||||||||||||||||||||||||||||||||||||||||
| New Leases | Property and Tenant Improvements (c) | Leasing Commissions | ||||||||||||||||||||||||||||||||||||
| ABR | ||||||||||||||||||||||||||||||||||||||
| Property Type | Square Feet | Number of Leases | New Lease (b) | New Lease Term | ||||||||||||||||||||||||||||||||||
| Industrial | — | — | $ | — | $ | — | $ | — | N/A | |||||||||||||||||||||||||||||
| Warehouse | 299,733 | 3 | 3,376 | 4,748 | 1,886 | 10.2 years | ||||||||||||||||||||||||||||||||
| Retail | 46,733 | 1 | 637 | 2,000 | 203 | 15.1 years | ||||||||||||||||||||||||||||||||
| Other | — | — | — | — | — | N/A | ||||||||||||||||||||||||||||||||
Total / Weighted Average (d) | 346,466 | 4 | $ | 4,013 | $ | 6,748 | $ | 2,089 | 11.0 years | |||||||||||||||||||||||||||||
_______
(a)Excludes lease extensions for a period of one year or less.
(b)New lease amounts are based on in-place rents at time of lease commencement and exclude any free rent periods.
(c)Property and tenant improvements include the estimated landlord obligations in connection with the signing of the lease.
(d)Weighted average refers to the new lease term.
| Investing for the Long Run® | 31 | |||||||
W. P. Carey Inc.
Real Estate – Fourth Quarter 2025
| Lease Expirations | |||||
Dollars and square footage in thousands. Pro rata. As of December 31, 2025.
Year of Lease Expiration (a) | Number of Leases Expiring | Number of Tenants with Leases Expiring | ABR | ABR % | Square Footage | Square Footage % | ||||||||||||||||||||||||||||||||
| 2026 | 19 | 20 | $ | 44,906 | 2.9 | % | 5,972 | 3.3 | % | |||||||||||||||||||||||||||||
| 2027 | 44 | 28 | 60,395 | 3.9 | % | 6,326 | 3.4 | % | ||||||||||||||||||||||||||||||
| 2028 | 45 | 27 | 67,268 | 4.3 | % | 7,419 | 4.0 | % | ||||||||||||||||||||||||||||||
| 2029 | 62 | 35 | 79,275 | 5.1 | % | 8,675 | 4.7 | % | ||||||||||||||||||||||||||||||
| 2030 | 32 | 26 | 39,625 | 2.6 | % | 3,793 | 2.1 | % | ||||||||||||||||||||||||||||||
| 2031 | 46 | 27 | 81,501 | 5.2 | % | 9,356 | 5.1 | % | ||||||||||||||||||||||||||||||
| 2032 | 45 | 23 | 54,804 | 3.5 | % | 7,244 | 4.0 | % | ||||||||||||||||||||||||||||||
| 2033 | 32 | 25 | 83,537 | 5.4 | % | 11,790 | 6.4 | % | ||||||||||||||||||||||||||||||
| 2034 | 59 | 27 | 96,161 | 6.2 | % | 9,464 | 5.2 | % | ||||||||||||||||||||||||||||||
| 2035 | 24 | 20 | 78,145 | 5.0 | % | 8,805 | 4.8 | % | ||||||||||||||||||||||||||||||
| 2036 | 45 | 21 | 66,933 | 4.3 | % | 7,891 | 4.3 | % | ||||||||||||||||||||||||||||||
| 2037 | 44 | 21 | 63,514 | 4.1 | % | 8,618 | 4.7 | % | ||||||||||||||||||||||||||||||
| 2038 | 46 | 13 | 28,148 | 1.8 | % | 2,766 | 1.5 | % | ||||||||||||||||||||||||||||||
| 2039 | 100 | 27 | 75,293 | 4.9 | % | 11,372 | 6.2 | % | ||||||||||||||||||||||||||||||
| Thereafter (>2039) | 302 | 115 | 633,807 | 40.8 | % | 70,247 | 38.3 | % | ||||||||||||||||||||||||||||||
| Vacant | — | — | — | — | % | 3,760 | 2.0 | % | ||||||||||||||||||||||||||||||
Total (b) | 945 | $ | 1,553,312 | 100.0 | % | 183,498 | 100.0 | % | ||||||||||||||||||||||||||||||
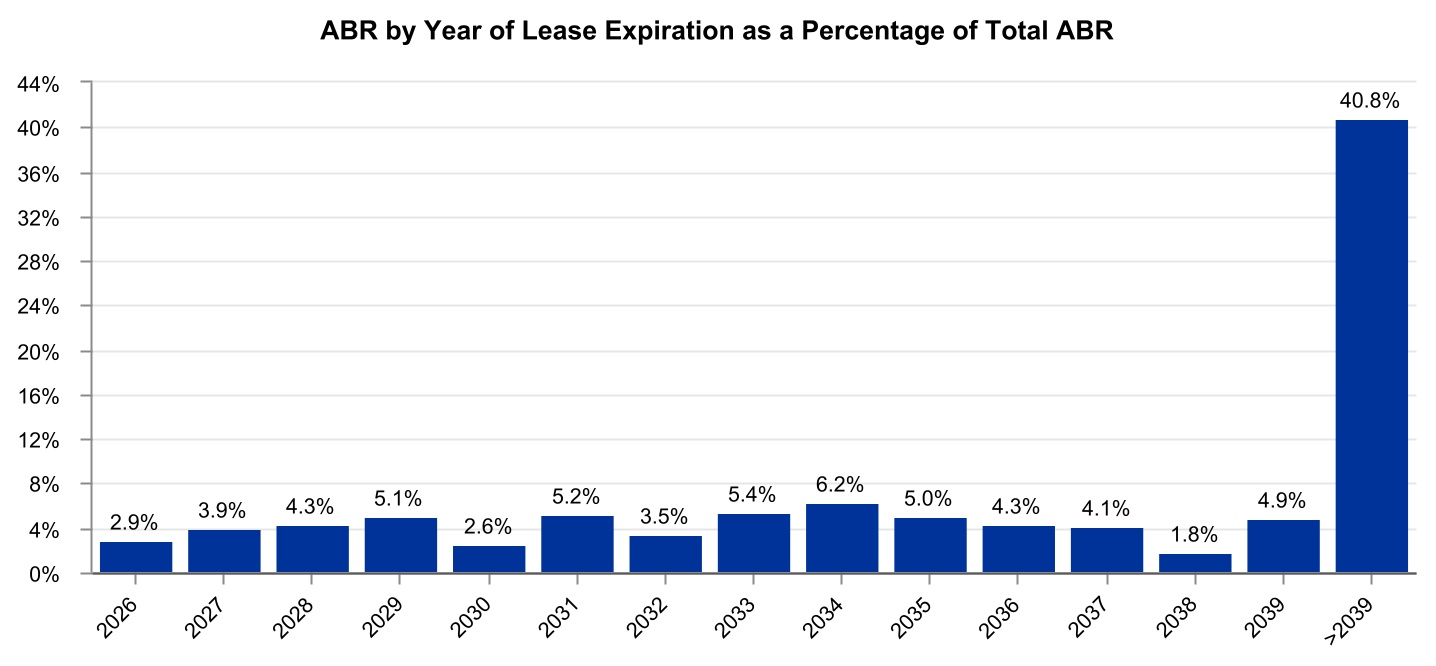
________
(a)Assumes tenants do not exercise any renewal options or purchase options.
(b)See the Disclosures Regarding Non-GAAP and Other Metrics section in the Appendix for a description of pro rata.
| Investing for the Long Run® | 32 | |||||||
W. P. Carey Inc.
Real Estate – Fourth Quarter 2025
| Self-Storage Operating Properties Portfolio | |||||
Square footage in thousands. Pro rata. As of December 31, 2025.
State / District | Number of Properties | Number of Units | Square Footage | Square Footage % | Period End Occupancy | |||||||||||||||||||||||||||
| Illinois | 10 | 4,822 | 666 | 90.1 | % | 87.4 | % | |||||||||||||||||||||||||
| Ohio | 1 | 598 | 73 | 9.9 | % | 89.0 | % | |||||||||||||||||||||||||
Total (a) | 11 | 5,420 | 739 | 100.0 | % | 87.6 | % | |||||||||||||||||||||||||
________
(a)See the Disclosures Regarding Non-GAAP and Other Metrics section in the Appendix for a description of pro rata.
| Investing for the Long Run® | 33 | |||||||
W. P. Carey Inc.
Appendix
Fourth Quarter 2025
| Investing for the Long Run® | 34 | |||||||
W. P. Carey Inc.
Appendix – Fourth Quarter 2025
| Normalized Pro Rata Cash NOI | |||||
In thousands.
| Three Months Ended Dec. 31, 2025 | |||||
| Consolidated Lease Revenues | |||||
| Total lease revenues – as reported | $ | 389,154 | |||
| Income from finance leases and loans receivable – as reported | 26,716 | ||||
| Less: Income from secured loans receivable | (664) | ||||
| Less: Consolidated Reimbursable and Non-Reimbursable Property Expenses | |||||
| Reimbursable property expenses – as reported | 19,371 | ||||
| Non-reimbursable property expenses – as reported | 13,859 | ||||
| 381,976 | |||||
| Plus: NOI from Operating Properties | |||||
| Self-storage revenues | 8,297 | ||||
| Self-storage expenses | (3,868) | ||||
| 4,429 | |||||
| Hotel revenues | 8,596 | ||||
| Hotel expenses | (7,356) | ||||
| 1,240 | |||||
| Student housing and other revenues | 1,486 | ||||
| Student housing and other expenses | (639) | ||||
| 847 | |||||
| 388,492 | |||||
| Adjustments for Pro Rata Ownership of Real Estate Joint Ventures: | |||||
| Add: Pro rata share of NOI from equity method investments | 4,812 | ||||
| Less: Pro rata share of NOI attributable to noncontrolling interests | (175) | ||||
| 4,637 | |||||
| 393,129 | |||||
| Adjustments for Pro Rata Non-Cash Items: | |||||
| Less: Straight-line and other leasing and financing adjustments | (20,758) | ||||
| Add: Above- and below-market rent intangible lease amortization | 941 | ||||
| Add: Other non-cash items | 615 | ||||
| (19,202) | |||||
Pro Rata Cash NOI (a) | 373,927 | ||||
Adjustment to normalize for net lease investments and dispositions (b) | 7,498 | ||||
Adjustment to normalize for operating property dispositions (b) | (3,331) | ||||
Normalized Pro Rata Cash NOI (a) | $ | 378,094 | |||
| Investing for the Long Run® | 35 | |||||||
W. P. Carey Inc.
Appendix – Fourth Quarter 2025
The following table presents a reconciliation from Net income attributable to W. P. Carey to Normalized pro rata cash NOI:
| Three Months Ended Dec. 31, 2025 | |||||
| Net Income Attributable to W. P. Carey | |||||
| Net income attributable to W. P. Carey – as reported | $ | 148,319 | |||
| Adjustments for Consolidated Operating Expenses | |||||
| Add: Operating expenses – as reported | 265,149 | ||||
| Less: Property expenses, excluding reimbursable tenant costs – as reported | (13,859) | ||||
| Less: Operating property expenses – as reported | (11,863) | ||||
| 239,427 | |||||
| Adjustments for Other Consolidated Revenues and Expenses: | |||||
| Add: Other income and (expenses) – as reported | 26,146 | ||||
| Less: Reimbursable property expenses – as reported | (19,371) | ||||
| Less: Other lease-related income – as reported | (8,137) | ||||
| Add: Benefit from income taxes – as reported | (1,310) | ||||
| Less: Asset management fees revenue – as reported | (1,085) | ||||
| Less: Other advisory income and reimbursements – as reported | (1,076) | ||||
| (4,833) | |||||
| Other Adjustments: | |||||
| Less: Straight-line and other leasing and financing adjustments | (20,758) | ||||
| Add: Adjustments for pro rata ownership | 10,895 | ||||
Adjustment to normalize for net lease investments and dispositions (b) | 7,498 | ||||
Adjustment to normalize for operating property dispositions (b) | (3,331) | ||||
| Add: Above- and below-market rent intangible lease amortization | 941 | ||||
| Less: Income from secured loans receivable | (664) | ||||
| Add: Property expenses, excluding reimbursable tenant costs, non-cash | 600 | ||||
| (4,819) | |||||
Normalized Pro Rata Cash NOI (a) | $ | 378,094 | |||
________
(a)Pro rata cash NOI and normalized pro rata cash NOI are non-GAAP measures. See the Disclosures Regarding Non-GAAP and Other Metrics section that follows for a description of our non-GAAP measures and for details on how pro rata cash NOI and normalized pro rata cash NOI are calculated.
(b)For properties acquired and capital investments and commitments completed during the three months ended December 31, 2025, the adjustment modifies our pro rata share of cash NOI for the partial period with an amount estimated to be equivalent to the additional pro rata share of cash NOI necessary to reflect ownership for the full quarter. For properties disposed of during the three months ended December 31, 2025, the adjustment eliminates our pro rata share of cash NOI for the period. If there is a rent abatement, we annualize the first monthly contractual base rent following the free rent period.
| Investing for the Long Run® | 36 | |||||||
W. P. Carey Inc.
Appendix – Fourth Quarter 2025
| Adjusted EBITDA – Last Five Quarters | |||||
In thousands.
| Three Months Ended | |||||||||||||||||||||||||||||
| Dec. 31, 2025 | Sep. 30, 2025 | Jun. 30, 2025 | Mar. 31, 2025 | Dec. 31, 2024 | |||||||||||||||||||||||||
| Net income | $ | 154,562 | $ | 141,225 | $ | 51,312 | $ | 125,816 | $ | 47,038 | |||||||||||||||||||
Adjustments to Derive Adjusted EBITDA (a) | |||||||||||||||||||||||||||||
| Depreciation and amortization | 145,339 | 125,586 | 120,595 | 129,607 | 115,770 | ||||||||||||||||||||||||
| Interest expense | 75,431 | 75,226 | 71,795 | 68,804 | 70,883 | ||||||||||||||||||||||||
| Gain on sale of real estate, net | (52,791) | (44,401) | (52,824) | (43,777) | (4,480) | ||||||||||||||||||||||||
| Impairment charges — real estate | 39,690 | 19,474 | 4,349 | 6,854 | 27,843 | ||||||||||||||||||||||||
Straight-line and other leasing and financing adjustments (b) | (20,758) | (20,424) | (15,374) | (19,033) | (24,849) | ||||||||||||||||||||||||
Other (gains) and losses (c) | 10,131 | 31,011 | 148,768 | 42,197 | 77,224 | ||||||||||||||||||||||||
| Stock-based compensation expense | 8,650 | 11,153 | 10,943 | 9,148 | 9,667 | ||||||||||||||||||||||||
| (Benefit from) provision for income taxes | (1,310) | 8,495 | 13,091 | 11,632 | 7,772 | ||||||||||||||||||||||||
| Above- and below-market rent intangible lease amortization | 941 | 4,363 | 5,061 | 1,123 | 10,047 | ||||||||||||||||||||||||
| Merger and other expenses | 478 | 1,021 | 192 | 556 | (484) | ||||||||||||||||||||||||
| Other amortization and non-cash charges | 467 | 465 | 458 | 442 | 436 | ||||||||||||||||||||||||
| 206,268 | 211,969 | 307,054 | 207,553 | 289,829 | |||||||||||||||||||||||||
| Adjustments for Pro Rata Ownership | |||||||||||||||||||||||||||||
| Real Estate Joint Ventures: | |||||||||||||||||||||||||||||
| Add: Pro rata share of adjustments for equity method investments | 2,961 | 5,220 | 3,312 | 2,309 | 5,975 | ||||||||||||||||||||||||
| Less: Pro rata share of adjustments for amounts attributable to noncontrolling interests | (429) | (430) | (308) | (179) | (214) | ||||||||||||||||||||||||
| 2,532 | 4,790 | 3,004 | 2,130 | 5,761 | |||||||||||||||||||||||||
Adjustment to normalize for intra-period acquisitions and dispositions (d) | 3,312 | 2,545 | 3,222 | 7,117 | 91 | ||||||||||||||||||||||||
Adjusted EBITDA (e) | $ | 366,674 | $ | 360,529 | $ | 364,592 | $ | 342,616 | $ | 342,719 | |||||||||||||||||||
________
(a)Comprised of items that we do not consider to be part of our core operating business plan or representative of our overall long-term operating performance, based on a number of factors, including the nature of the item and/or the frequency with which it occurs. We believe that these adjustments provide a more representative view of EBITDA from our core operating business and allow for more meaningful comparisons.
(b)Straight-line rent adjustments relate to our net-leased properties subject to operating leases.
(c)Primarily comprised of gains and losses on the mark-to-market fair value of equity securities, foreign currency exchange rate movements, changes in the non-cash allowance for credit losses on loans receivable and finance leases, and extinguishment of debt. Amounts from period to period will not be comparable due to unpredictable fluctuations in these gains and losses. Amount for the three months ended December 31, 2025 includes a mark-to-market unrealized loss for our investment in shares of Lineage of $11.7 million. Amount for the three months ended September 30, 2025 includes a mark-to-market unrealized loss for our investment in shares of Lineage of $22.6 million. Amount for the three months ended June 30, 2025 includes a mark-to-market unrealized loss for our investment in shares of Lineage of $69.0 million. Amount for the three months ended December 31, 2024 includes a mark-to-market unrealized loss for our investment in shares of Lineage of $90.4 million.
(d)Reflects pro forma adjustments for recurring revenues and expenses related to properties acquired or disposed of, and capital investments and commitments completed, during the applicable period, assuming all activity occurred at the beginning of the applicable period.
(e)Adjusted EBITDA is a non-GAAP measure. See the Disclosures Regarding Non-GAAP and Other Metrics section that follows for a description of our non-GAAP measures.
| Investing for the Long Run® | 37 | |||||||
W. P. Carey Inc.
Appendix – Fourth Quarter 2025
| Reconciliation of Net Debt to Adjusted EBITDA | |||||
In thousands.
| Three Months Ended | |||||
| Dec. 31, 2025 | |||||
Adjusted EBITDA (a) | $ | 366,674 | |||
| Adjusted EBITDA (Annualized) | $ | 1,466,696 | |||
| As of | |||||
| Dec. 31, 2025 | |||||
Total Pro Rata Debt Outstanding (b) | $ | 8,883,770 | |||
| Less: Cash and cash equivalents | (155,329) | ||||
Less: Cash held at qualified intermediaries (c) | (80,874) | ||||
| Net Debt | $ | 8,647,567 | |||
Less: Expected proceeds from unsettled forward equity (d) | (412,152) | ||||
| Net Debt – Inclusive of Unsettled Forward Equity | $ | 8,235,415 | |||
| Net Debt to Adjusted EBITDA (Annualized) | 5.9x | ||||
| Net Debt to Adjusted EBITDA (Annualized) – Inclusive of Unsettled Forward Equity | 5.6x | ||||
________
(a)Adjusted EBITDA is a non-GAAP measure. See the Disclosures Regarding Non-GAAP and Other Metrics section that follows for a description of our non-GAAP measures.
(b)Excludes unamortized discount, net totaling $39.2 million and unamortized deferred financing costs totaling $30.1 million as of December 31, 2025.
(c)Comprised of proceeds from certain dispositions that have been designated for future 1031 exchange transactions.
(d)Reflects 6,258,496 shares of unsettled forward equity as of December 31, 2025, as if they had been settled for cash at a weighted-average net settlement price of $65.85 per share.
| Investing for the Long Run® | 38 | |||||||
W. P. Carey Inc.
Appendix – Fourth Quarter 2025
| Disclosures Regarding Non-GAAP and Other Metrics | |||||
Non-GAAP Financial Disclosures
FFO and AFFO
Due to certain unique operating characteristics of real estate companies, as discussed below, NAREIT, an industry trade group, has promulgated a non-GAAP measure known as FFO, which we believe to be an appropriate supplemental measure, when used in addition to and in conjunction with results presented in accordance with GAAP, to reflect the operating performance of a REIT. The use of FFO is recommended by the REIT industry as a supplemental non-GAAP measure. FFO is not equivalent to, nor a substitute for, net income or loss as determined under GAAP.
We define FFO, a non-GAAP measure, consistent with the standards established by the White Paper on FFO approved by the Board of Governors of NAREIT, as restated in December 2018. The White Paper defines FFO as net income or loss computed in accordance with GAAP, excluding gains or losses from the sale of certain real estate, impairment charges on real estate or other assets incidental to the company’s main business, gains or losses on changes in control of interests in real estate and depreciation and amortization from real estate assets; and after adjustments for unconsolidated partnerships and jointly owned investments. Adjustments for unconsolidated partnerships and jointly owned investments are calculated to reflect FFO on the same basis.
We also modify the NAREIT computation of FFO to adjust GAAP net income for certain non-cash charges, such as amortization of real estate-related intangibles, deferred income tax benefits and expenses, straight-line rent and related reserves, other non-cash rent adjustments, non-cash allowance for credit losses on loans receivable and finance leases, stock-based compensation, non-cash environmental accretion expense, amortization of discounts and premiums on debt and amortization of deferred financing costs. Our assessment of our operations is focused on long-term sustainability and not on such non-cash items, which may cause short-term fluctuations in net income but have no impact on cash flows. Additionally, we exclude non-core income and expenses, such as gains or losses from extinguishment of debt, gains or losses on the mark-to-market fair value of equity securities, merger and acquisition expenses, spin-off expenses, and income and expenses associated with our captive insurance company. We also exclude realized and unrealized gains/losses on foreign currency exchange rate movements (other than those realized on the settlement of foreign currency derivatives), which are not considered fundamental attributes of our business plan and do not affect our overall long-term operating performance. We refer to our modified definition of FFO as AFFO. We exclude these items from GAAP net income to arrive at AFFO because they are not the primary drivers in our decision-making process and excluding these items provides investors with a view of our portfolio performance over time and makes it more comparable to other REITs. AFFO also reflects adjustments for unconsolidated partnerships and jointly owned investments. We use AFFO as one measure of our operating performance when we formulate corporate goals, evaluate the effectiveness of our strategies and determine executive compensation.
We believe that AFFO is a useful supplemental measure for investors to consider because we believe it will help them better assess the sustainability of our operating performance without the potentially distorting impact of these short-term fluctuations. However, there are limits on the usefulness of AFFO to investors. For example, impairment charges and unrealized foreign currency exchange rate losses that we exclude may become actual realized losses upon the ultimate disposition of the properties in the form of lower cash proceeds or other considerations. We use our FFO and AFFO measures as supplemental financial measures of operating performance. We do not use our FFO and AFFO measures as, nor should they be considered to be, alternatives to net income computed under GAAP, alternatives to net cash provided by operating activities computed under GAAP, or indicators of our ability to fund our cash needs.
Same-Store Pro Rata Rental Income
Same-store pro rata rental income is a non-GAAP financial measure that is intended to reflect the performance of our net leased properties. We define this as contractual rents from our leased properties. Same-store rental income excludes reimbursable tenant costs, amortization of intangibles and straight-line rent adjustments that are included in GAAP lease revenues. We present same-store rental income on a pro rata basis to account for our share of income related to unconsolidated joint ventures and noncontrolling interests. We believe that same-store pro rata rental income is a helpful measure that both investors and management can use to evaluate the financial performance of our leased properties. Same-store pro rata rental income should not be considered as an alternative to lease revenues as an indication of our financial performance or to cash flows as a measure of liquidity or our ability to fund all needs. The method by which we calculate and present same-store rental income and/or same-store pro rata rental income may not be directly comparable to the way other REITs present such metrics.
Pro Rata Cash NOI
Cash net operating income (“cash NOI”) is a non-GAAP financial measure that is intended to reflect the performance of our net leased and operating properties. We define cash NOI as cash rents from our leased and operating properties less non-reimbursable property expenses. Cash NOI excludes amortization of intangibles and straight-line rent adjustments that are included in GAAP lease revenues. We present cash NOI on a pro rata basis (“pro rata cash NOI”) to account for our share of income related to unconsolidated joint ventures and noncontrolling interests. We believe that pro rata cash NOI is a helpful measure that both investors and management can use to evaluate the financial performance of our leased and operating properties and it allows for comparison of our operating performance between periods and to other REITs. Pro rata cash NOI should not be considered as an alternative to net income as an indication of our financial performance or to cash flows as a measure of liquidity or our ability to fund all needs. The method by which we calculate and present cash NOI and/or pro rata cash NOI may not be directly comparable to the way other REITs present such metrics.
| Investing for the Long Run® | 39 | |||||||
W. P. Carey Inc.
Appendix – Fourth Quarter 2025
Normalized Pro Rata Cash NOI
Normalized pro rata cash NOI is pro rata cash NOI as defined above adjusted primarily to exclude our pro rata share of cash NOI from properties disposed of during the most recent quarter and to include a full quarter of pro rata cash NOI related to properties acquired or capital investments and commitments completed during the period, as applicable. If there is a rent abatement, we annualize the first monthly contractual base rent following the free rent period. We believe this measure provides a helpful representation of our net operating income from our in-place leased and operating properties.
Adjusted EBITDA
We believe that EBITDA is a useful supplemental measure to investors and analysts for assessing the performance of our business because (i) it removes the impact of our capital structure from our operating results and (ii) it is helpful when comparing our operating performance to that of companies in our industry without regard to such items, which can vary substantially from company to company. Adjusted EBITDA as disclosed represents EBITDA modified to include other adjustments to GAAP net income for certain non-cash charges, such as impairments, non-cash rent adjustments and unrealized gains and losses from our hedging activity. Additionally, we exclude gains and losses on sale of real estate, which are not considered fundamental attributes of our business plans and do not affect our overall long-term operating performance. We exclude these items from adjusted EBITDA because they are not the primary drivers in our decision-making process. Adjusted EBITDA reflects adjustments for unconsolidated partnerships and jointly owned investments. Adjusted EBITDA is also modified to reflect the pro forma impact of our investment and disposition activity, assuming all activity occurred at the beginning of the applicable period. This includes adjustments to recurring revenue and expenses related to properties acquired or disposed of, and capital investments and commitments completed, during the applicable period. Our assessment of our operations is focused on long-term sustainability and not on such non-cash and non-core items, which may cause short-term fluctuations in net income but have no impact on cash flows. We believe that adjusted EBITDA is a useful supplemental measure and representation of the performance of our business to investors and analysts, although it does not represent net income that is computed in accordance with GAAP. Accordingly, adjusted EBITDA should not be considered an alternative to net income or an indicator of our financial performance. EBITDA and adjusted EBITDA as calculated by us may not be comparable to similarly titled measures of other companies.
Cash Interest Expense
Cash interest expense is a non-GAAP financial measure equal to interest expense calculated in accordance with GAAP, plus capitalized interest and other non-cash amortization expense, less amortization of deferred financing costs and debt premiums/discounts, adjusted for pro rata ownership. See the definition of cash interest expense coverage ratio below for a reconciliation of cash interest expense to its most directly compared GAAP measure, interest expense.
Cash Interest Expense Coverage Ratio
Cash interest expense coverage ratio is a non-GAAP financial measure representing the ratio of Adjusted EBITDA to cash interest expense on a trailing 12 months basis. We believe this ratio is useful to investors as a supplemental measure of our ability to satisfy fixed interest expense obligations. Cash interest expense for the trailing 12 months as of December 31, 2025 is equal to $276.1 million, comprised of interest expense calculated in accordance with GAAP ($291.3 million), plus capitalized interest ($1.1 million) and other non-cash amortization expense ($0.1 million), less amortization of deferred financing costs and debt premiums/discounts ($19.2 million), adjusted for pro rata ownership ($3.1 million).
Other Metrics
Pro Rata Metrics
This supplemental package contains certain metrics prepared on a pro rata basis. We refer to these metrics as pro rata metrics. We have certain investments in which our economic ownership is less than 100%. On a full consolidation basis, we report 100% of the assets, liabilities, revenues and expenses of those investments that are deemed to be under our control or for which we are deemed to be the primary beneficiary, even if our ownership is less than 100%. Also, for all other jointly owned investments, which we do not control, we report our net investment and our net income or loss from that investment. On a pro rata basis, we generally present our proportionate share, based on our economic ownership of these jointly owned investments, of the assets, liabilities, revenues and expenses of those investments. Multiplying each of our jointly owned investments’ financial statement line items by our percentage ownership and adding or subtracting those amounts from our totals, as applicable, may not accurately depict the legal and economic implications of holding an ownership interest of less than 100% in our jointly owned investments.
ABR
ABR represents contractual minimum annualized base rent for our net-leased properties and reflects exchange rates as of December 31, 2025. If there is a rent abatement, we annualize the first monthly contractual base rent following the free rent period. ABR is not applicable to operating properties and is presented on a pro rata basis.
| Investing for the Long Run® | 40 | |||||||
50+ Years of Investing for the Long Run® 4Q25 W. P. Carey Inc. Investor Presentation Exhibit 99.3
Table of Contents Unless otherwise noted, all data in this presentation is as of December 31, 2025. Amounts may not sum to totals due to rounding. Overview Real Estate Portfolio Balance Sheet Corporate Responsibility 3 7 20 24
3 Overview
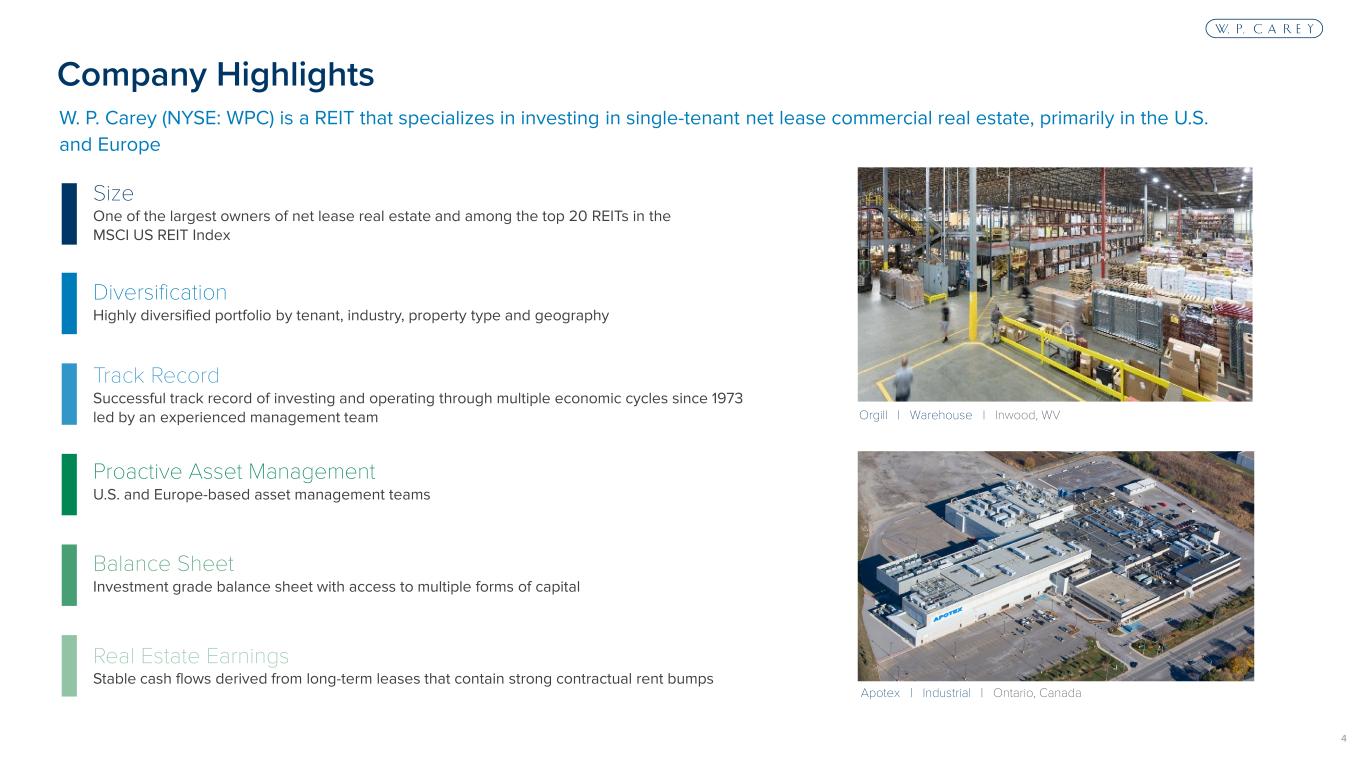
4 Size One of the largest owners of net lease real estate and among the top 20 REITs in the MSCI US REIT Index Diversification Highly diversified portfolio by tenant, industry, property type and geography Track Record Successful track record of investing and operating through multiple economic cycles since 1973 led by an experienced management team Proactive Asset Management U.S. and Europe-based asset management teams Balance Sheet Investment grade balance sheet with access to multiple forms of capital Real Estate Earnings Stable cash flows derived from long-term leases that contain strong contractual rent bumps W. P. Carey (NYSE: WPC) is a REIT that specializes in investing in single-tenant net lease commercial real estate, primarily in the U.S. and Europe Company Highlights Orgill | Warehouse | Inwood, WV Apotex | Industrial | Ontario, Canada
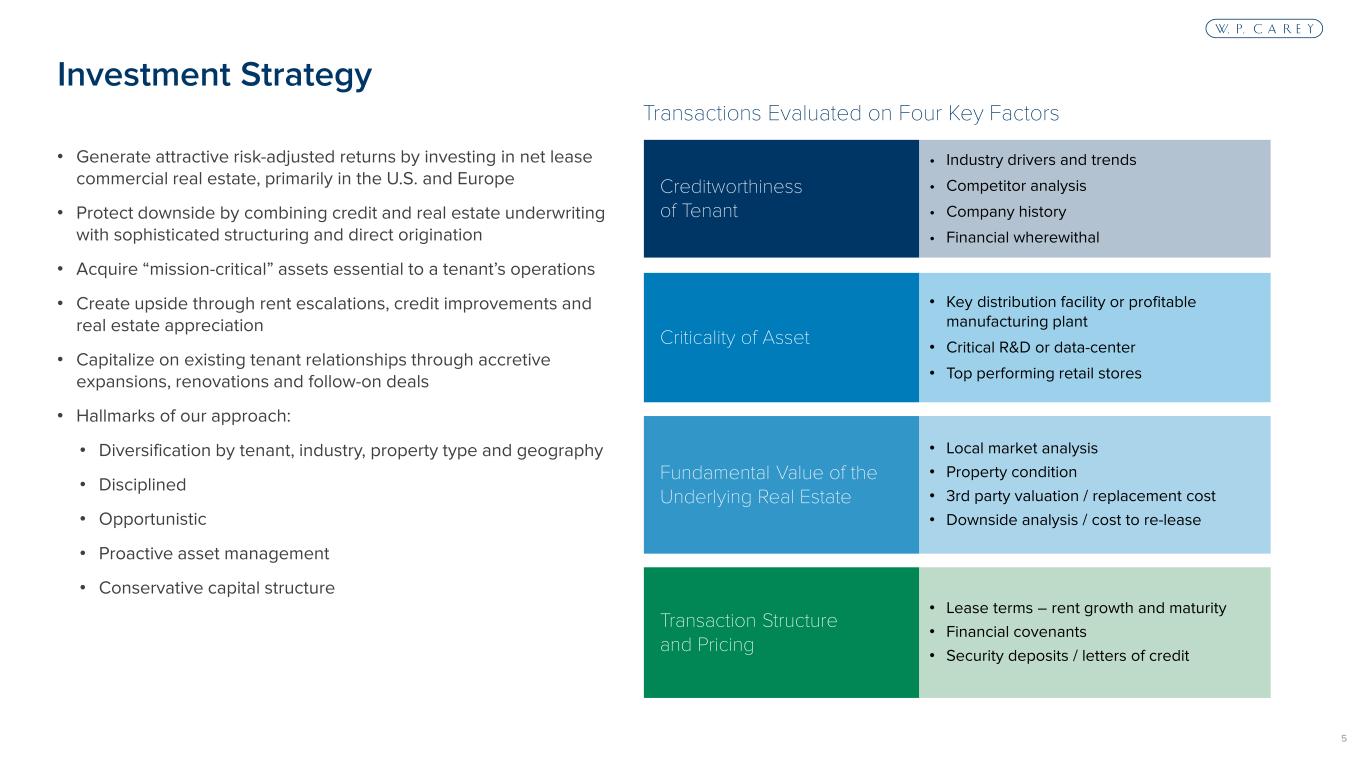
5 • Generate attractive risk-adjusted returns by investing in net lease commercial real estate, primarily in the U.S. and Europe • Protect downside by combining credit and real estate underwriting with sophisticated structuring and direct origination • Acquire “mission-critical” assets essential to a tenant’s operations • Create upside through rent escalations, credit improvements and real estate appreciation • Capitalize on existing tenant relationships through accretive expansions, renovations and follow-on deals • Hallmarks of our approach: • Diversification by tenant, industry, property type and geography • Disciplined • Opportunistic • Proactive asset management • Conservative capital structure Investment Strategy Transactions Evaluated on Four Key Factors Creditworthiness of Tenant • Industry drivers and trends • Competitor analysis • Company history • Financial wherewithal Criticality of Asset • Key distribution facility or profitable manufacturing plant • Critical R&D or data-center • Top performing retail stores Fundamental Value of the Underlying Real Estate • Local market analysis • Property condition • 3rd party valuation / replacement cost • Downside analysis / cost to re-lease Transaction Structure and Pricing • Lease terms – rent growth and maturity • Financial covenants • Security deposits / letters of credit
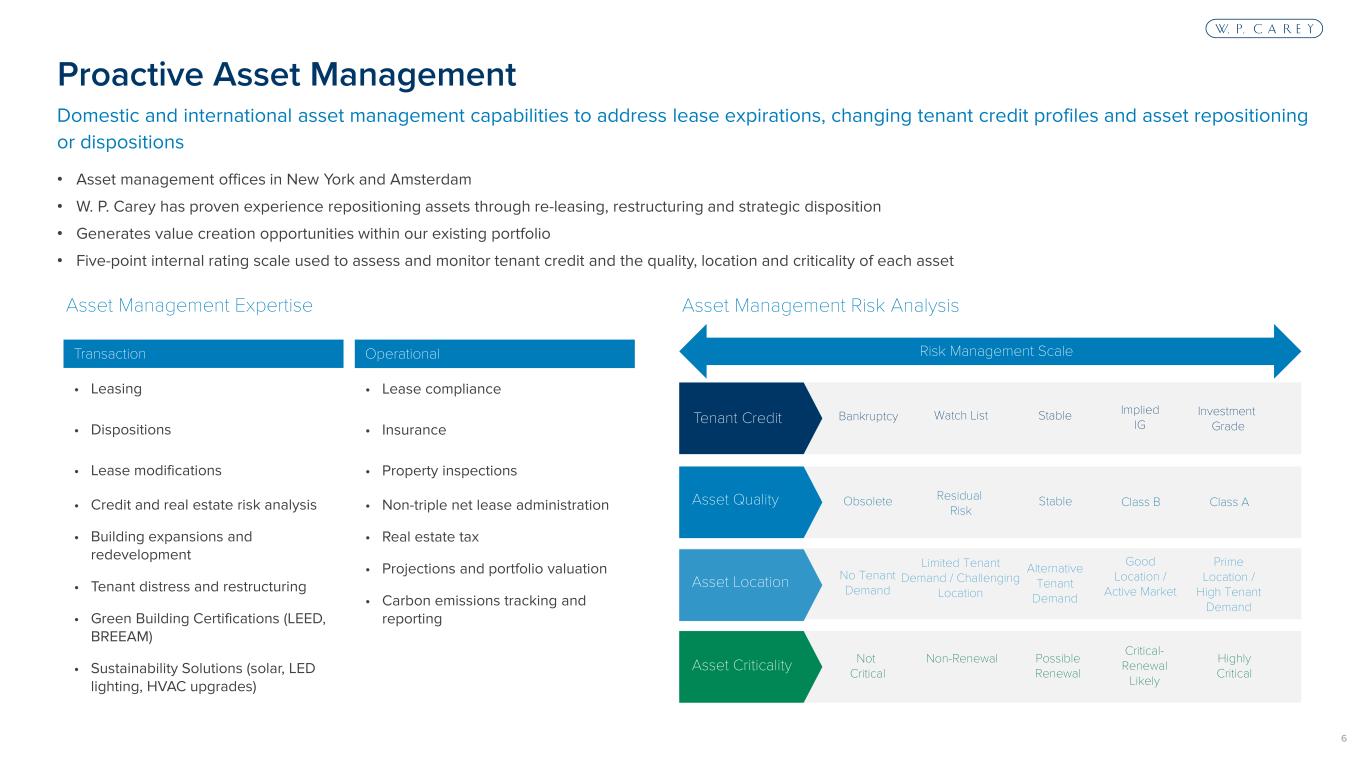
6 • Asset management offices in New York and Amsterdam • W. P. Carey has proven experience repositioning assets through re-leasing, restructuring and strategic disposition • Generates value creation opportunities within our existing portfolio • Five-point internal rating scale used to assess and monitor tenant credit and the quality, location and criticality of each asset Domestic and international asset management capabilities to address lease expirations, changing tenant credit profiles and asset repositioning or dispositions Proactive Asset Management Asset Management Risk AnalysisAsset Management Expertise Bankruptcy Watch List Implied IG Investment Grade StableTenant Credit Obsolete Residual Risk Stable Class B Class AAsset Quality Not Critical Non-Renewal Possible Renewal Critical- Renewal Likely Highly CriticalAsset Criticality Asset Location No Tenant Demand Limited Tenant Demand / Challenging Location Alternative Tenant Demand Good Location / Active Market Prime Location / High Tenant Demand Operational • Lease compliance • Insurance • Property inspections • Non-triple net lease administration • Real estate tax • Projections and portfolio valuation • Carbon emissions tracking and reporting Transaction • Leasing • Dispositions • Lease modifications • Credit and real estate risk analysis • Building expansions and redevelopment • Tenant distress and restructuring • Green Building Certifications (LEED, BREEAM) • Sustainability Solutions (solar, LED lighting, HVAC upgrades) Risk Management Scale

7 Real Estate Portfolio
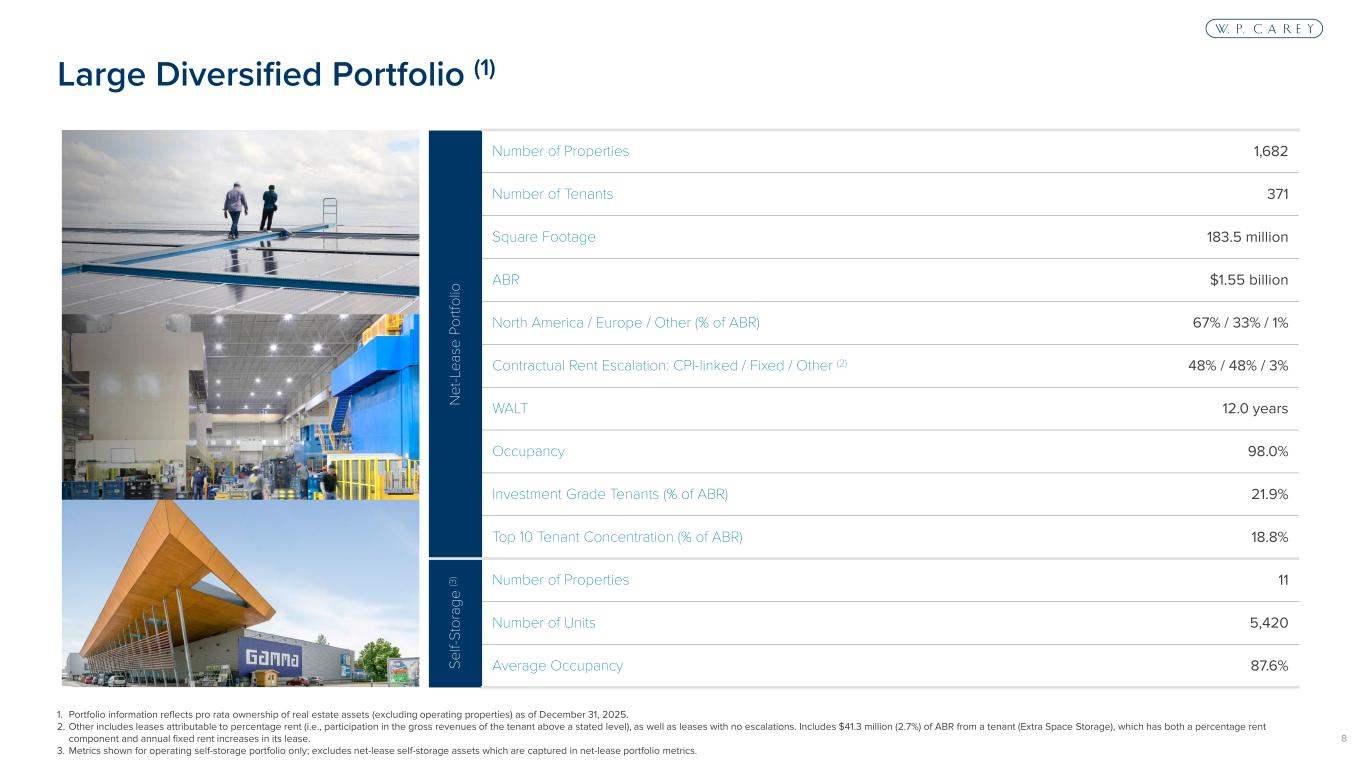
8 1. Portfolio information reflects pro rata ownership of real estate assets (excluding operating properties) as of December 31, 2025. 2. Other includes leases attributable to percentage rent (i.e., participation in the gross revenues of the tenant above a stated level), as well as leases with no escalations. Includes $41.3 million (2.7%) of ABR from a tenant (Extra Space Storage), which has both a percentage rent component and annual fixed rent increases in its lease. 3. Metrics shown for operating self-storage portfolio only; excludes net-lease self-storage assets which are captured in net-lease portfolio metrics. Large Diversified Portfolio (1) N et -L ea se P or tfo lio Number of Properties 1,682 Number of Tenants 371 Square Footage 183.5 million ABR $1.55 billion North America / Europe / Other (% of ABR) 67% / 33% / 1% Contractual Rent Escalation: CPI-linked / Fixed / Other (2) 48% / 48% / 3% WALT 12.0 years Occupancy 98.0% Investment Grade Tenants (% of ABR) 21.9% Top 10 Tenant Concentration (% of ABR) 18.8% Se lf- St or ag e (3 ) Number of Properties 11 Number of Units 5,420 Average Occupancy 87.6%
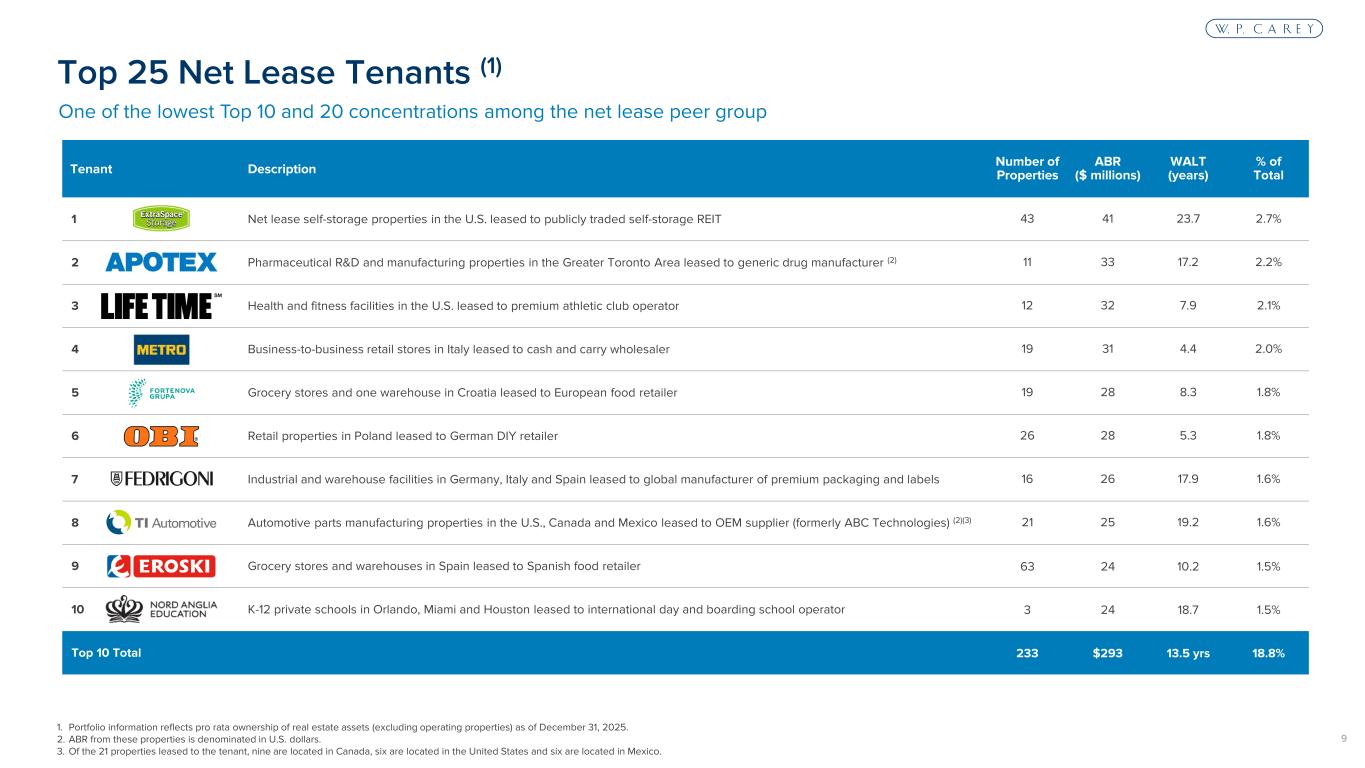
9 Tenant Description Number of Properties ABR ($ millions) WALT (years) % of Total 1 Net lease self-storage properties in the U.S. leased to publicly traded self-storage REIT 43 41 23.7 2.7% 2 Pharmaceutical R&D and manufacturing properties in the Greater Toronto Area leased to generic drug manufacturer (2) 11 33 17.2 2.2% 3 Health and fitness facilities in the U.S. leased to premium athletic club operator 12 32 7.9 2.1% 4 Business-to-business retail stores in Italy leased to cash and carry wholesaler 19 31 4.4 2.0% 5 Grocery stores and one warehouse in Croatia leased to European food retailer 19 28 8.3 1.8% 6 Retail properties in Poland leased to German DIY retailer 26 28 5.3 1.8% 7 Industrial and warehouse facilities in Germany, Italy and Spain leased to global manufacturer of premium packaging and labels 16 26 17.9 1.6% 8 Automotive parts manufacturing properties in the U.S., Canada and Mexico leased to OEM supplier (formerly ABC Technologies) (2)(3) 21 25 19.2 1.6% 9 Grocery stores and warehouses in Spain leased to Spanish food retailer 63 24 10.2 1.5% 10 K-12 private schools in Orlando, Miami and Houston leased to international day and boarding school operator 3 24 18.7 1.5% Top 10 Total 233 $293 13.5 yrs 18.8% One of the lowest Top 10 and 20 concentrations among the net lease peer group Top 25 Net Lease Tenants (1) 1. Portfolio information reflects pro rata ownership of real estate assets (excluding operating properties) as of December 31, 2025. 2. ABR from these properties is denominated in U.S. dollars. 3. Of the 21 properties leased to the tenant, nine are located in Canada, six are located in the United States and six are located in Mexico.
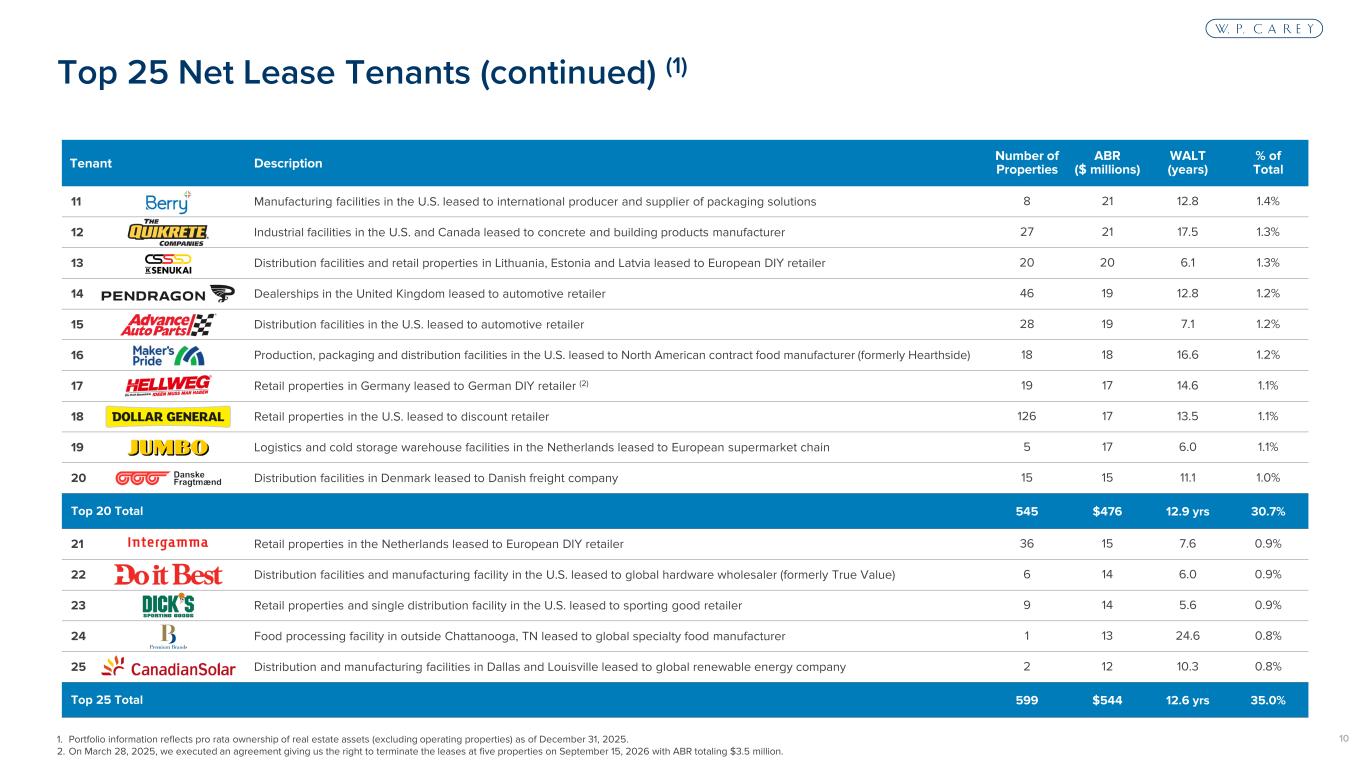
10 Tenant Description Number of Properties ABR ($ millions) WALT (years) % of Total 11 Manufacturing facilities in the U.S. leased to international producer and supplier of packaging solutions 8 21 12.8 1.4% 12 Industrial facilities in the U.S. and Canada leased to concrete and building products manufacturer 27 21 17.5 1.3% 13 Distribution facilities and retail properties in Lithuania, Estonia and Latvia leased to European DIY retailer 20 20 6.1 1.3% 14 Dealerships in the United Kingdom leased to automotive retailer 46 19 12.8 1.2% 15 Distribution facilities in the U.S. leased to automotive retailer 28 19 7.1 1.2% 16 Production, packaging and distribution facilities in the U.S. leased to North American contract food manufacturer (formerly Hearthside) 18 18 16.6 1.2% 17 Retail properties in Germany leased to German DIY retailer (2) 19 17 14.6 1.1% 18 Retail properties in the U.S. leased to discount retailer 126 17 13.5 1.1% 19 Logistics and cold storage warehouse facilities in the Netherlands leased to European supermarket chain 5 17 6.0 1.1% 20 Distribution facilities in Denmark leased to Danish freight company 15 15 11.1 1.0% Top 20 Total 545 $476 12.9 yrs 30.7% 21 Retail properties in the Netherlands leased to European DIY retailer 36 15 7.6 0.9% 22 Distribution facilities and manufacturing facility in the U.S. leased to global hardware wholesaler (formerly True Value) 6 14 6.0 0.9% 23 Retail properties and single distribution facility in the U.S. leased to sporting good retailer 9 14 5.6 0.9% 24 Food processing facility in outside Chattanooga, TN leased to global specialty food manufacturer 1 13 24.6 0.8% 25 Distribution and manufacturing facilities in Dallas and Louisville leased to global renewable energy company 2 12 10.3 0.8% Top 25 Total 599 $544 12.6 yrs 35.0% Top 25 Net Lease Tenants (continued) (1) 1. Portfolio information reflects pro rata ownership of real estate assets (excluding operating properties) as of December 31, 2025. 2. On March 28, 2025, we executed an agreement giving us the right to terminate the leases at five properties on September 15, 2026 with ABR totaling $3.5 million.
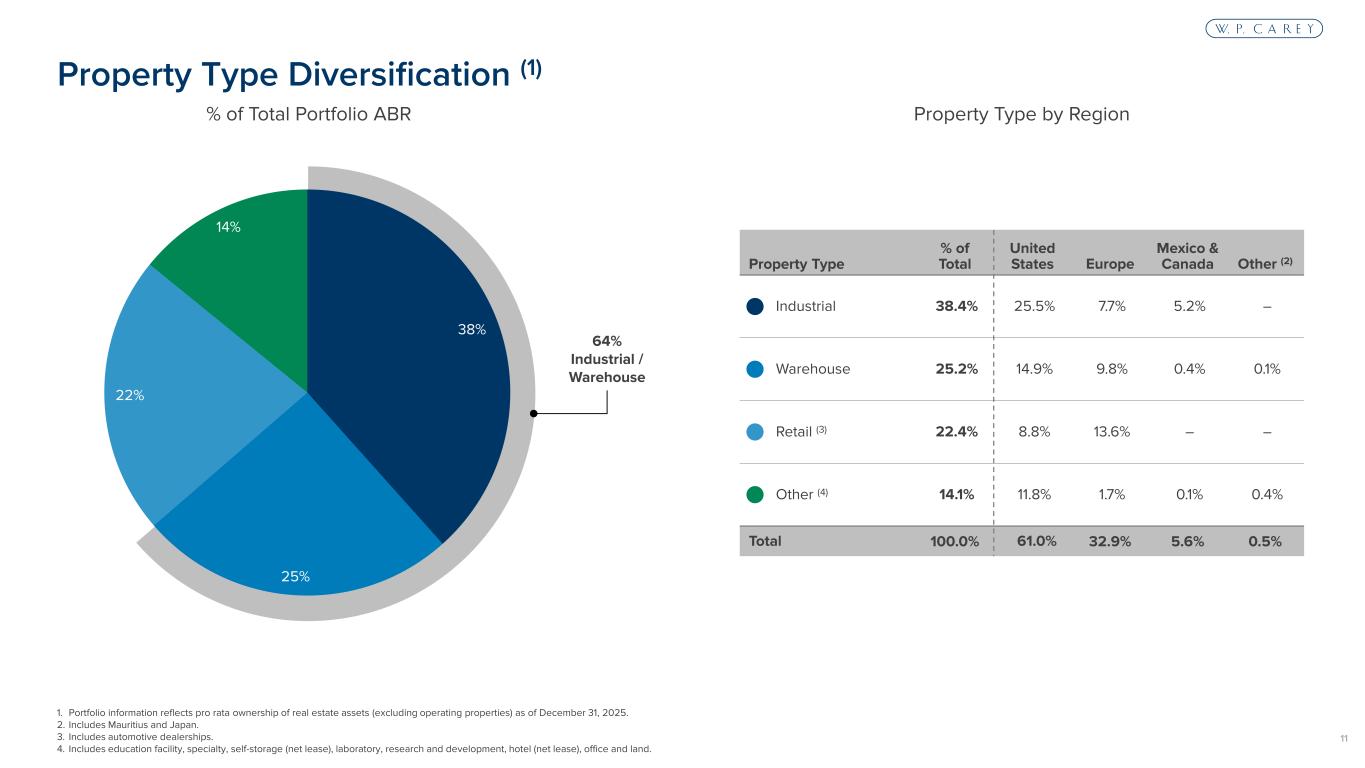
11 38% 25% 22% 14% Property Type Diversification (1) Property Type % of Total United States Europe Mexico & Canada Other (2) Industrial 38.4% 25.5% 7.7% 5.2% – Warehouse 25.2% 14.9% 9.8% 0.4% 0.1% Retail (3) 22.4% 8.8% 13.6% – – Other (4) 14.1% 11.8% 1.7% 0.1% 0.4% Total 100.0% 61.0% 32.9% 5.6% 0.5% 64% Industrial / Warehouse 1. Portfolio information reflects pro rata ownership of real estate assets (excluding operating properties) as of December 31, 2025. 2. Includes Mauritius and Japan. 3. Includes automotive dealerships. 4. Includes education facility, specialty, self-storage (net lease), laboratory, research and development, hotel (net lease), office and land. Property Type by Region% of Total Portfolio ABR
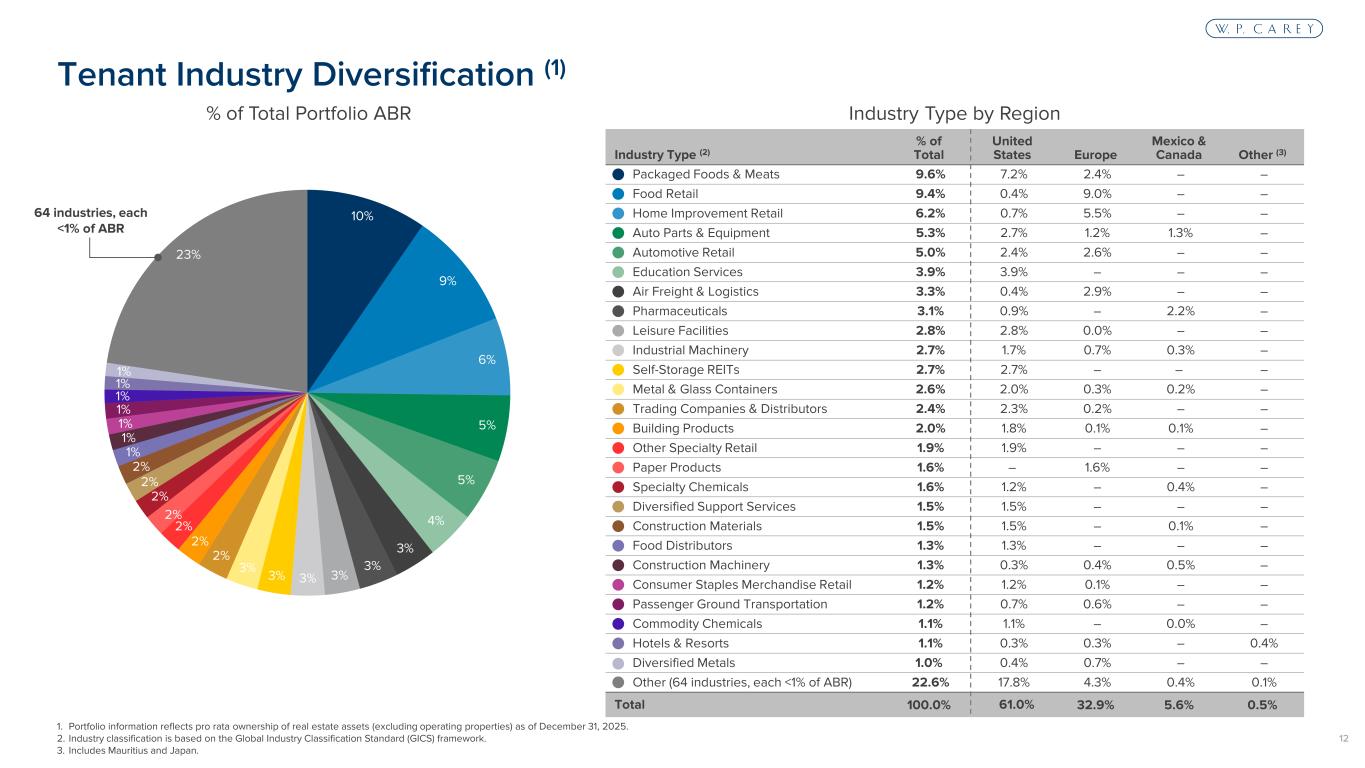
12 Industry Type (2) % of Total United States Europe Mexico & Canada Other (3) Packaged Foods & Meats 9.6% 7.2% 2.4% – – Food Retail 9.4% 0.4% 9.0% – – Home Improvement Retail 6.2% 0.7% 5.5% – – Auto Parts & Equipment 5.3% 2.7% 1.2% 1.3% – Automotive Retail 5.0% 2.4% 2.6% – – Education Services 3.9% 3.9% – – – Air Freight & Logistics 3.3% 0.4% 2.9% – – Pharmaceuticals 3.1% 0.9% – 2.2% – Leisure Facilities 2.8% 2.8% 0.0% – – Industrial Machinery 2.7% 1.7% 0.7% 0.3% – Self-Storage REITs 2.7% 2.7% – – – Metal & Glass Containers 2.6% 2.0% 0.3% 0.2% – Trading Companies & Distributors 2.4% 2.3% 0.2% – – Building Products 2.0% 1.8% 0.1% 0.1% – Other Specialty Retail 1.9% 1.9% – – – Paper Products 1.6% – 1.6% – – Specialty Chemicals 1.6% 1.2% – 0.4% – Diversified Support Services 1.5% 1.5% – – – Construction Materials 1.5% 1.5% – 0.1% – Food Distributors 1.3% 1.3% – – – Construction Machinery 1.3% 0.3% 0.4% 0.5% – Consumer Staples Merchandise Retail 1.2% 1.2% 0.1% – – Passenger Ground Transportation 1.2% 0.7% 0.6% – – Commodity Chemicals 1.1% 1.1% – 0.0% – Hotels & Resorts 1.1% 0.3% 0.3% – 0.4% Diversified Metals 1.0% 0.4% 0.7% – – Other (64 industries, each <1% of ABR) 22.6% 17.8% 4.3% 0.4% 0.1% Total 100.0% 61.0% 32.9% 5.6% 0.5% Tenant Industry Diversification (1) 1. Portfolio information reflects pro rata ownership of real estate assets (excluding operating properties) as of December 31, 2025. 2. Industry classification is based on the Global Industry Classification Standard (GICS) framework. 3. Includes Mauritius and Japan. 10% 9% 6% 5% 5% 4% 3% 3% 3%3%3% 3% 2% 2% 2% 2% 2% 2% 2% 1% 1% 1% 1% 1% 1% 1% 23% 64 industries, each <1% of ABR % of Total Portfolio ABR Industry Type by Region
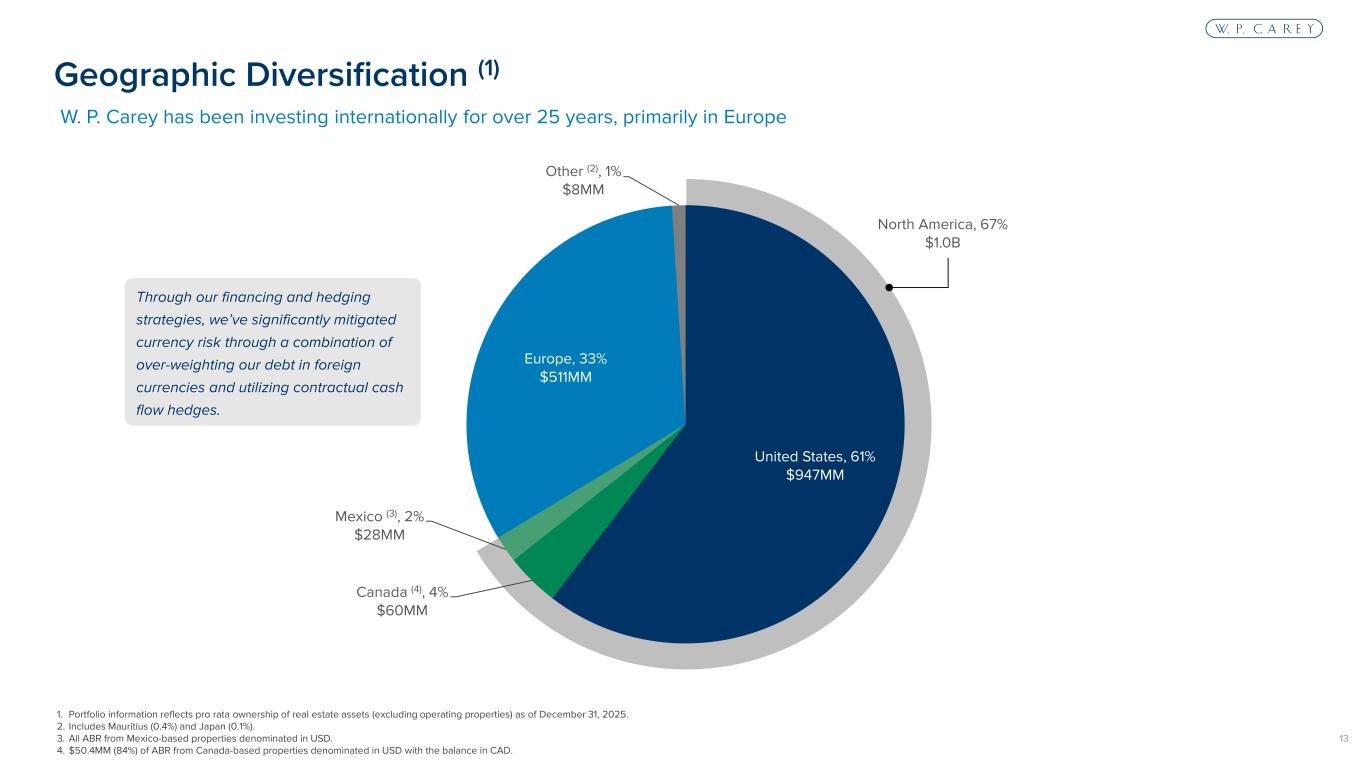
13 North America, 67% $1.0B United States, 61% $947MM Canada (4), 4% $60MM Mexico (3), 2% $28MM Europe, 33% $511MM Other (2), 1% $8MM 1. Portfolio information reflects pro rata ownership of real estate assets (excluding operating properties) as of December 31, 2025. 2. Includes Mauritius (0.4%) and Japan (0.1%). 3. All ABR from Mexico-based properties denominated in USD. 4. $50.4MM (84%) of ABR from Canada-based properties denominated in USD with the balance in CAD. W. P. Carey has been investing internationally for over 25 years, primarily in Europe Geographic Diversification (1) Through our financing and hedging strategies, we’ve significantly mitigated currency risk through a combination of over-weighting our debt in foreign currencies and utilizing contractual cash flow hedges.
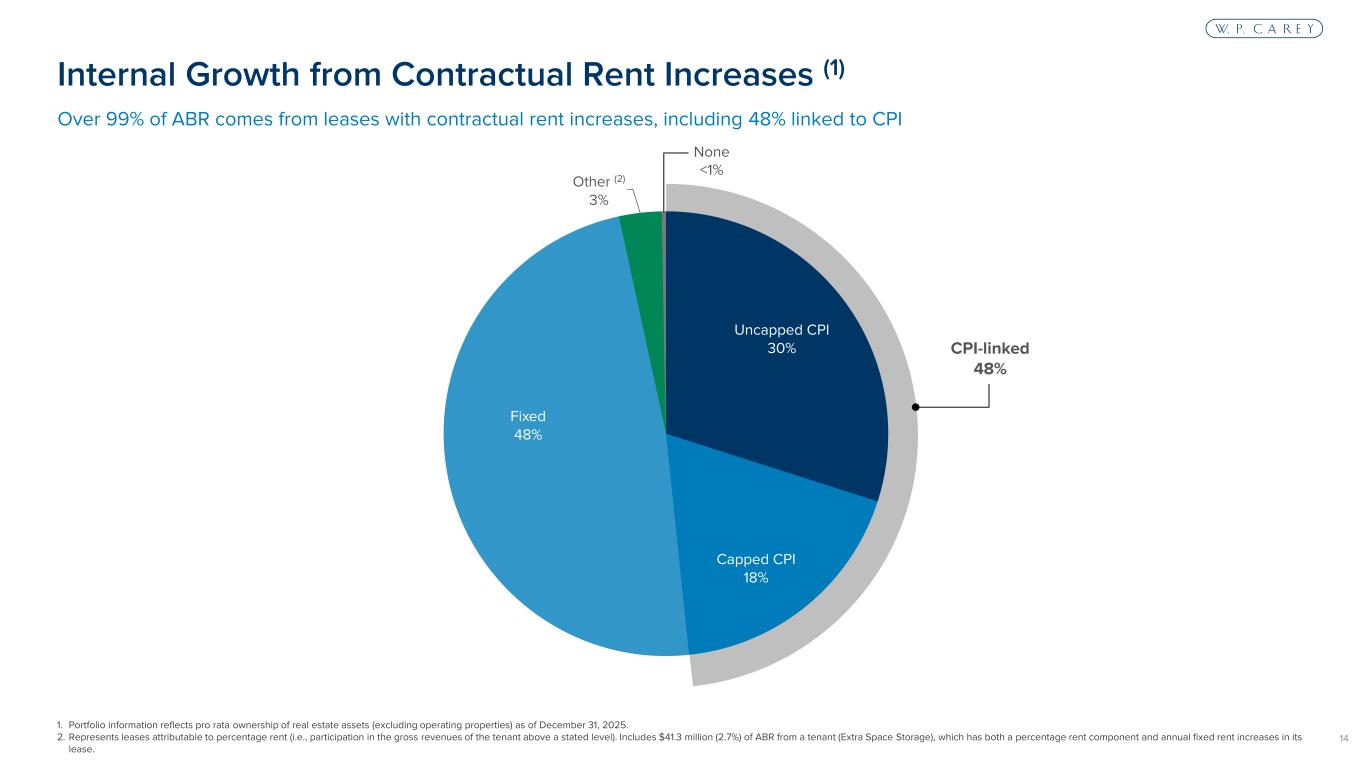
14 Uncapped CPI 30% Fixed 48% Capped CPI 18% Other (2) 3% CPI-linked 48% None <1% 1. Portfolio information reflects pro rata ownership of real estate assets (excluding operating properties) as of December 31, 2025. 2. Represents leases attributable to percentage rent (i.e., participation in the gross revenues of the tenant above a stated level). Includes $41.3 million (2.7%) of ABR from a tenant (Extra Space Storage), which has both a percentage rent component and annual fixed rent increases in its lease. Over 99% of ABR comes from leases with contractual rent increases, including 48% linked to CPI Internal Growth from Contractual Rent Increases (1)
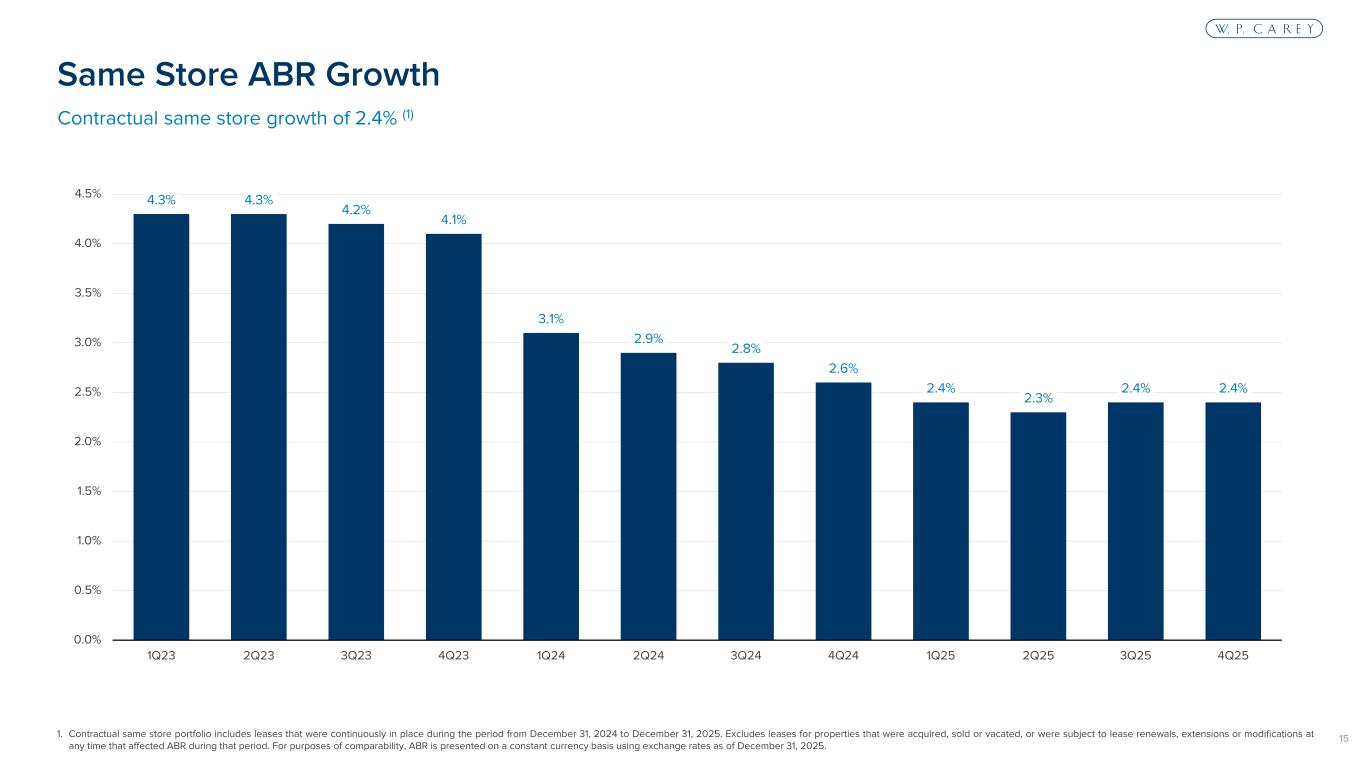
15 4.3% 4.3% 4.2% 4.1% 3.1% 2.9% 2.8% 2.6% 2.4% 2.3% 2.4% 2.4% 0.0% 0.5% 1.0% 1.5% 2.0% 2.5% 3.0% 3.5% 4.0% 4.5% 1Q23 2Q23 3Q23 4Q23 1Q24 2Q24 3Q24 4Q24 1Q25 2Q25 3Q25 4Q25 1. Contractual same store portfolio includes leases that were continuously in place during the period from December 31, 2024 to December 31, 2025. Excludes leases for properties that were acquired, sold or vacated, or were subject to lease renewals, extensions or modifications at any time that affected ABR during that period. For purposes of comparability, ABR is presented on a constant currency basis using exchange rates as of December 31, 2025. Contractual same store growth of 2.4% (1) Same Store ABR Growth
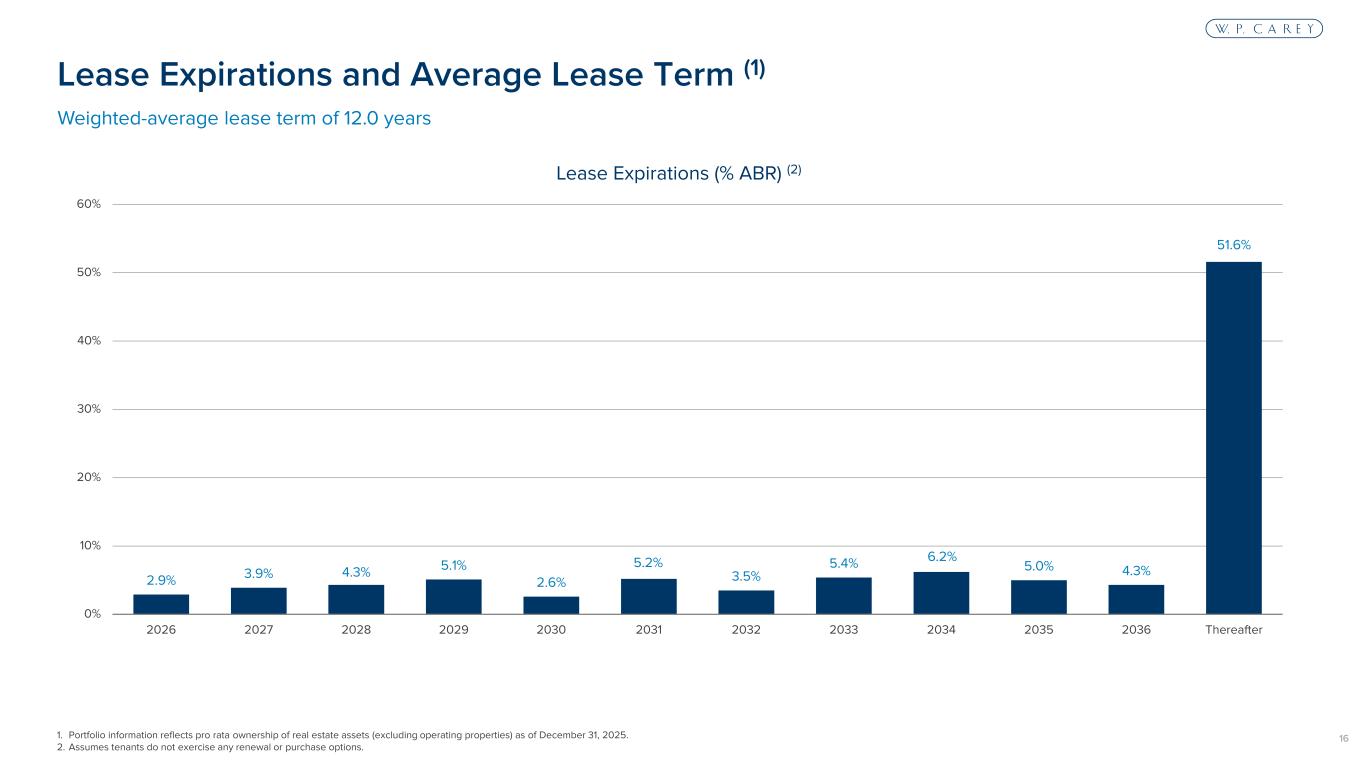
16 2.9% 3.9% 4.3% 5.1% 2.6% 5.2% 3.5% 5.4% 6.2% 5.0% 4.3% 51.6% 0% 10% 20% 30% 40% 50% 60% 2026 2027 2028 2029 2030 2031 2032 2033 2034 2035 2036 Thereafter 1. Portfolio information reflects pro rata ownership of real estate assets (excluding operating properties) as of December 31, 2025. 2. Assumes tenants do not exercise any renewal or purchase options. Weighted-average lease term of 12.0 years Lease Expirations and Average Lease Term (1) Lease Expirations (% ABR) (2)
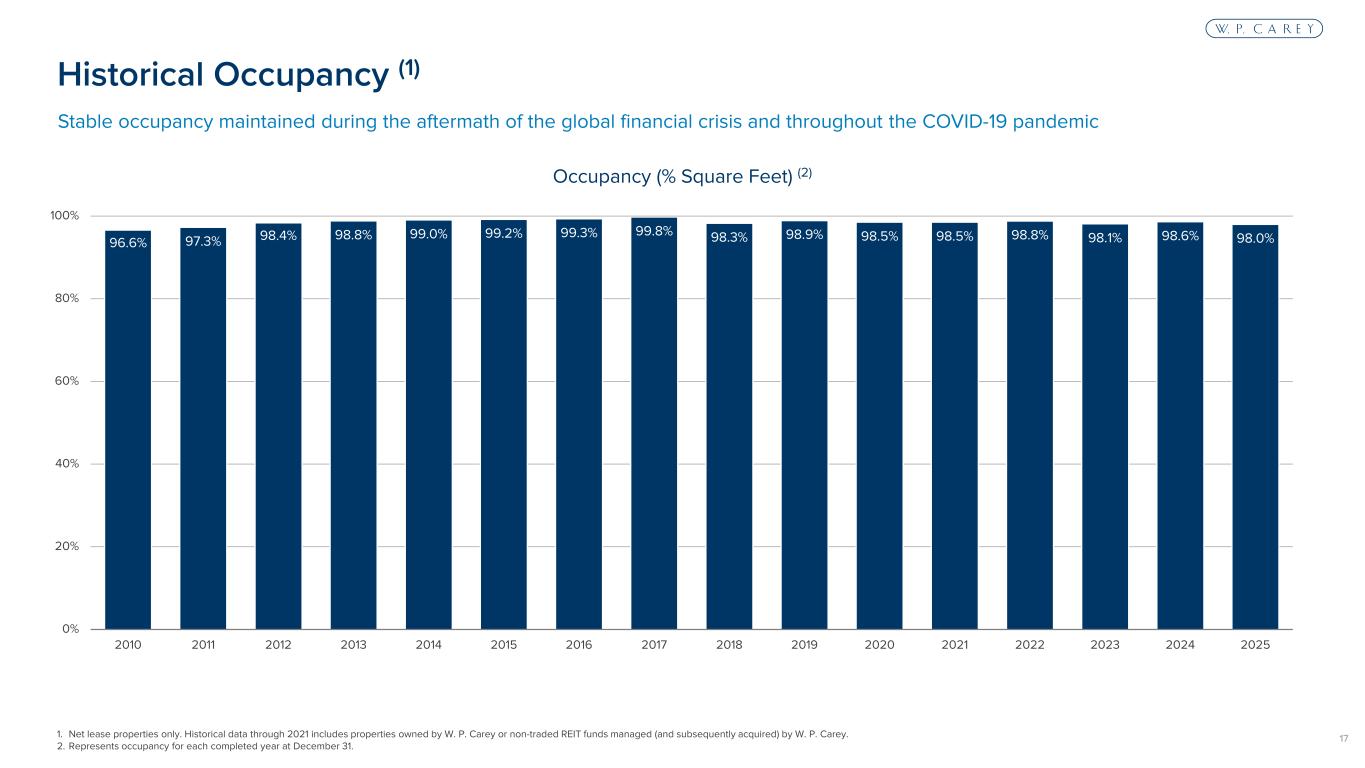
17 Historical Occupancy (1) 1. Net lease properties only. Historical data through 2021 includes properties owned by W. P. Carey or non-traded REIT funds managed (and subsequently acquired) by W. P. Carey. 2. Represents occupancy for each completed year at December 31. Stable occupancy maintained during the aftermath of the global financial crisis and throughout the COVID-19 pandemic 96.6% 97.3% 98.4% 98.8% 99.0% 99.2% 99.3% 99.8% 98.3% 98.9% 98.5% 98.5% 98.8% 98.1% 98.6% 98.0% 0% 20% 40% 60% 80% 100% 2010 2011 2012 2013 2014 2015 2016 2017 2018 2019 2020 2021 2022 2023 2024 2025 Occupancy (% Square Feet) (2)
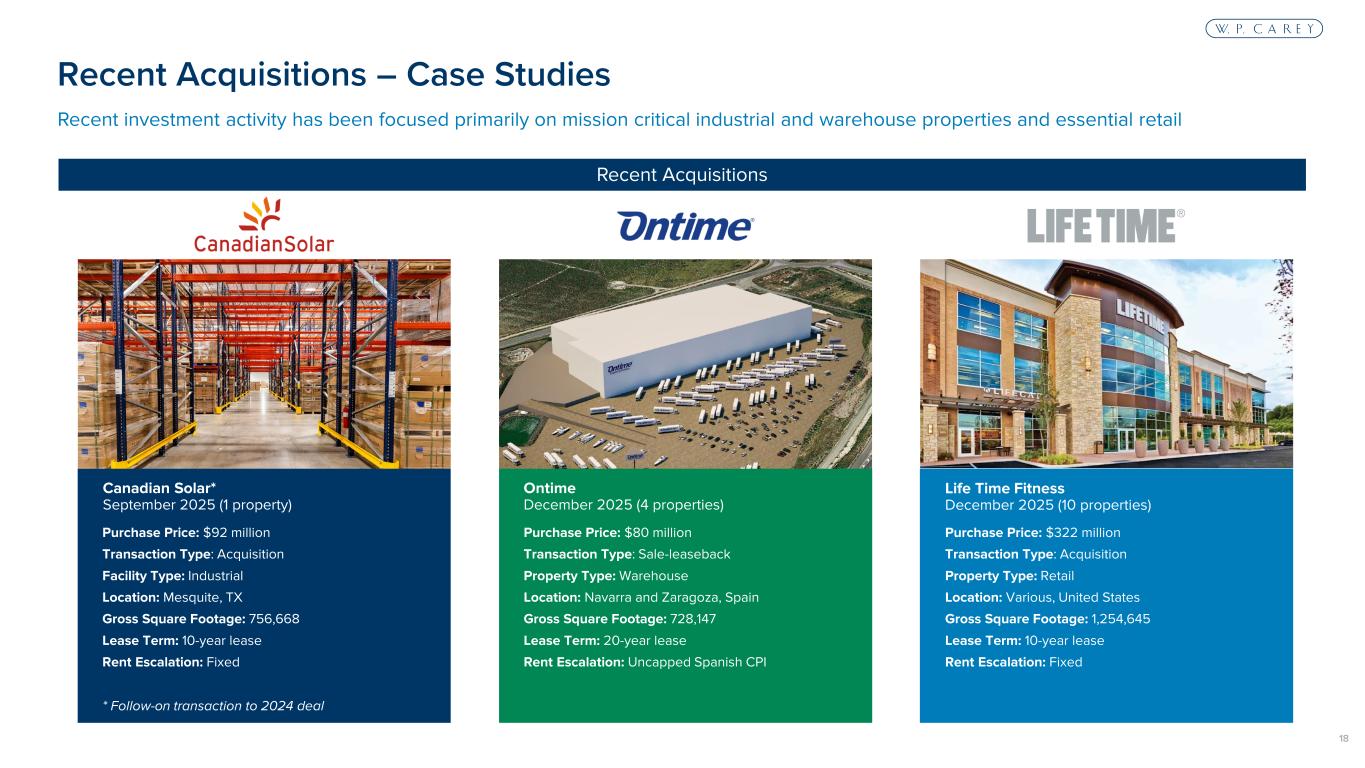
18 Recent investment activity has been focused primarily on mission critical industrial and warehouse properties and essential retail Recent Acquisitions Purchase Price: $92 million Transaction Type: Acquisition Facility Type: Industrial Location: Mesquite, TX Gross Square Footage: 756,668 Lease Term: 10-year lease Rent Escalation: Fixed * Follow-on transaction to 2024 deal Canadian Solar* September 2025 (1 property) Purchase Price: $80 million Transaction Type: Sale-leaseback Property Type: Warehouse Location: Navarra and Zaragoza, Spain Gross Square Footage: 728,147 Lease Term: 20-year lease Rent Escalation: Uncapped Spanish CPI Ontime December 2025 (4 properties) Life Time Fitness December 2025 (10 properties) Purchase Price: $322 million Transaction Type: Acquisition Property Type: Retail Location: Various, United States Gross Square Footage: 1,254,645 Lease Term: 10-year lease Rent Escalation: Fixed Recent Acquisitions – Case Studies
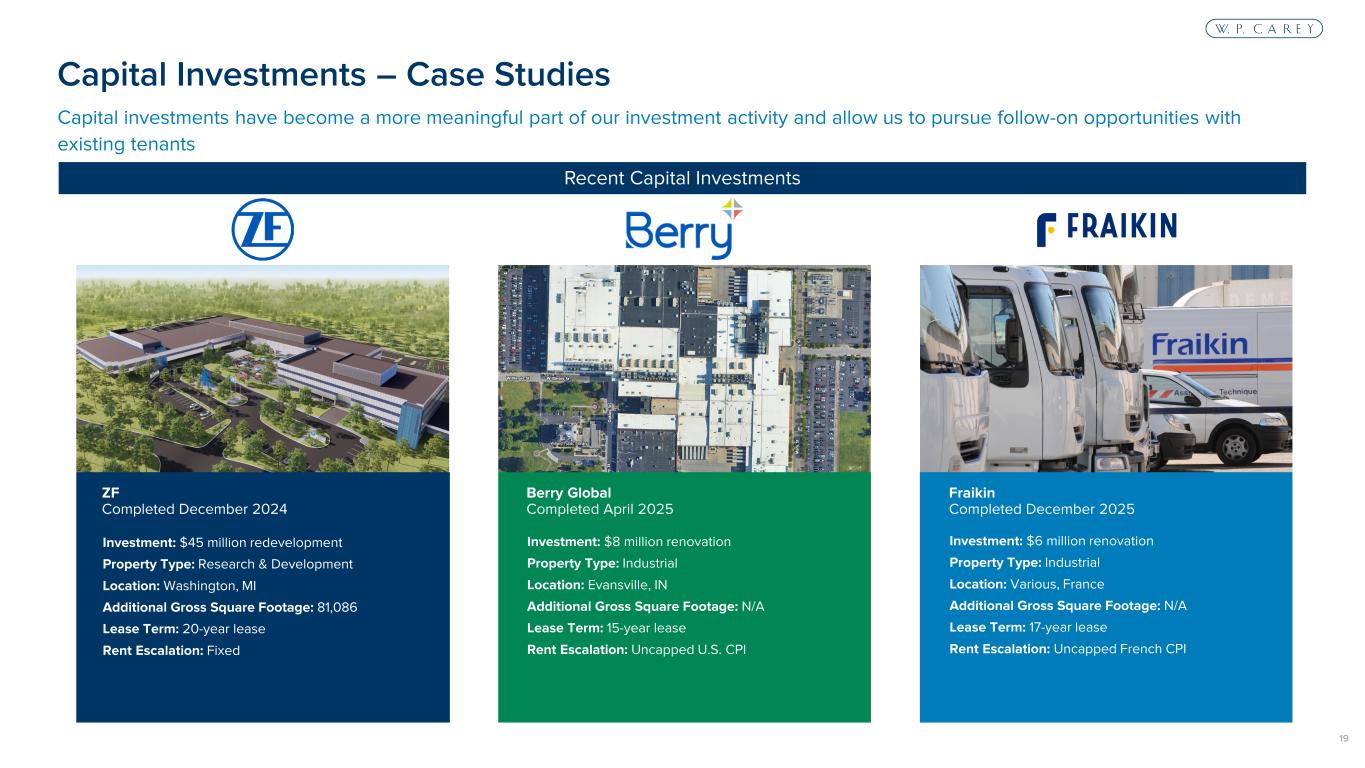
19 Capital investments have become a more meaningful part of our investment activity and allow us to pursue follow-on opportunities with existing tenants Recent Capital Investments Investment: $45 million redevelopment Property Type: Research & Development Location: Washington, MI Additional Gross Square Footage: 81,086 Lease Term: 20-year lease Rent Escalation: Fixed ZF Completed December 2024 Investment: $8 million renovation Property Type: Industrial Location: Evansville, IN Additional Gross Square Footage: N/A Lease Term: 15-year lease Rent Escalation: Uncapped U.S. CPI Berry Global Completed April 2025 Investment: $6 million renovation Property Type: Industrial Location: Various, France Additional Gross Square Footage: N/A Lease Term: 17-year lease Rent Escalation: Uncapped French CPI Fraikin Completed December 2025 Capital Investments – Case Studies
20 Balance Sheet
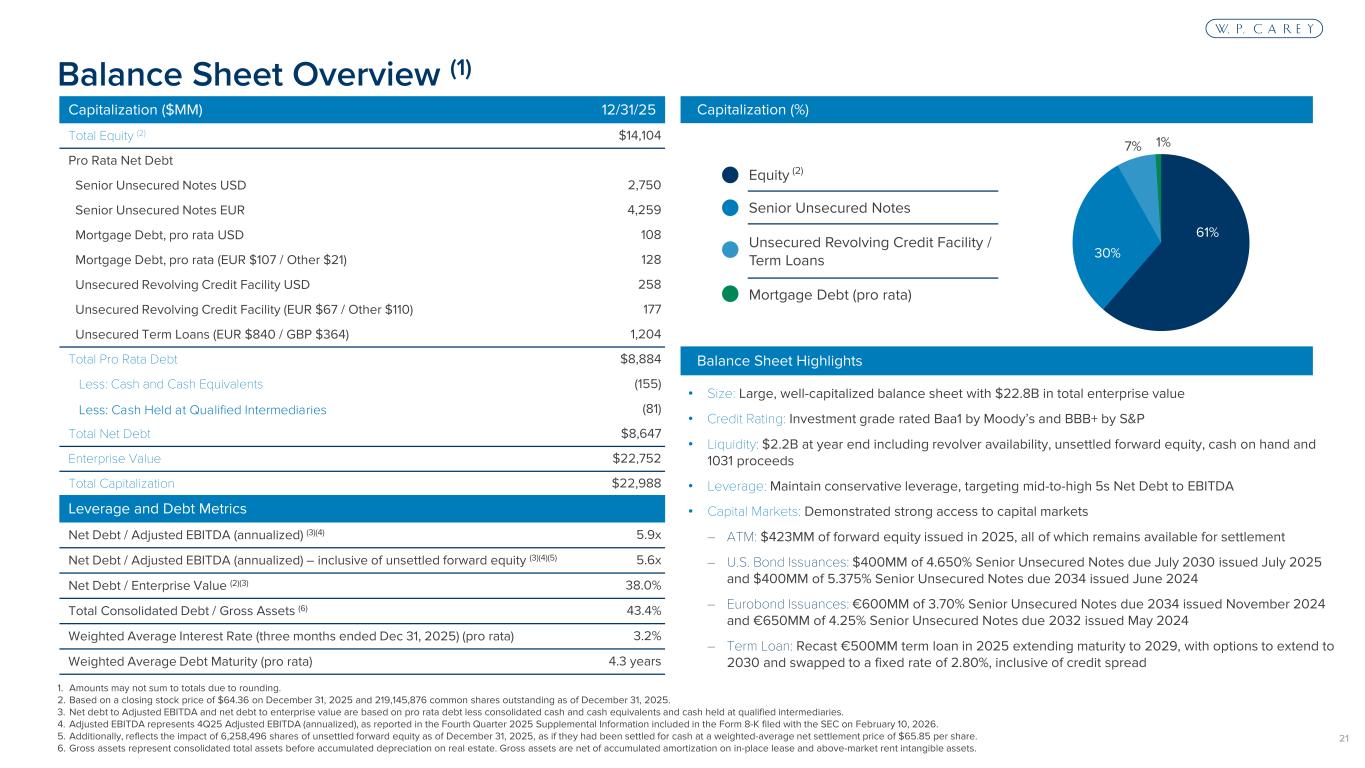
21 Capitalization ($MM) 12/31/25 Total Equity (2) $14,104 Pro Rata Net Debt Senior Unsecured Notes USD 2,750 Senior Unsecured Notes EUR 4,259 Mortgage Debt, pro rata USD 108 Mortgage Debt, pro rata (EUR $107 / Other $21) 128 Unsecured Revolving Credit Facility USD 258 Unsecured Revolving Credit Facility (EUR $67 / Other $110) 177 Unsecured Term Loans (EUR $840 / GBP $364) 1,204 Total Pro Rata Debt $8,884 Less: Cash and Cash Equivalents (155) Less: Cash Held at Qualified Intermediaries (81) Total Net Debt $8,647 Enterprise Value $22,752 Total Capitalization $22,988 Leverage and Debt Metrics Net Debt / Adjusted EBITDA (annualized) (3)(4) 5.9x Net Debt / Adjusted EBITDA (annualized) – inclusive of unsettled forward equity (3)(4)(5) 5.6x Net Debt / Enterprise Value (2)(3) 38.0% Total Consolidated Debt / Gross Assets (6) 43.4% Weighted Average Interest Rate (three months ended Dec 31, 2025) (pro rata) 3.2% Weighted Average Debt Maturity (pro rata) 4.3 years Capitalization (%) • Size: Large, well-capitalized balance sheet with $22.8B in total enterprise value • Credit Rating: Investment grade rated Baa1 by Moody’s and BBB+ by S&P • Liquidity: $2.2B at year end including revolver availability, unsettled forward equity, cash on hand and 1031 proceeds • Leverage: Maintain conservative leverage, targeting mid-to-high 5s Net Debt to EBITDA • Capital Markets: Demonstrated strong access to capital markets – ATM: $423MM of forward equity issued in 2025, all of which remains available for settlement – U.S. Bond Issuances: $400MM of 4.650% Senior Unsecured Notes due July 2030 issued July 2025 and $400MM of 5.375% Senior Unsecured Notes due 2034 issued June 2024 – Eurobond Issuances: €600MM of 3.70% Senior Unsecured Notes due 2034 issued November 2024 and €650MM of 4.25% Senior Unsecured Notes due 2032 issued May 2024 – Term Loan: Recast €500MM term loan in 2025 extending maturity to 2029, with options to extend to 2030 and swapped to a fixed rate of 2.80%, inclusive of credit spread Balance Sheet Highlights 61% 30% 7% 1% Equity (2) Senior Unsecured Notes Unsecured Revolving Credit Facility / Term Loans Mortgage Debt (pro rata) Balance Sheet Overview (1) 1. Amounts may not sum to totals due to rounding. 2. Based on a closing stock price of $64.36 on December 31, 2025 and 219,145,876 common shares outstanding as of December 31, 2025. 3. Net debt to Adjusted EBITDA and net debt to enterprise value are based on pro rata debt less consolidated cash and cash equivalents and cash held at qualified intermediaries. 4. Adjusted EBITDA represents 4Q25 Adjusted EBITDA (annualized), as reported in the Fourth Quarter 2025 Supplemental Information included in the Form 8-K filed with the SEC on February 10, 2026. 5. Additionally, reflects the impact of 6,258,496 shares of unsettled forward equity as of December 31, 2025, as if they had been settled for cash at a weighted-average net settlement price of $65.85 per share. 6. Gross assets represent consolidated total assets before accumulated depreciation on real estate. Gross assets are net of accumulated amortization on in-place lease and above-market rent intangible assets.
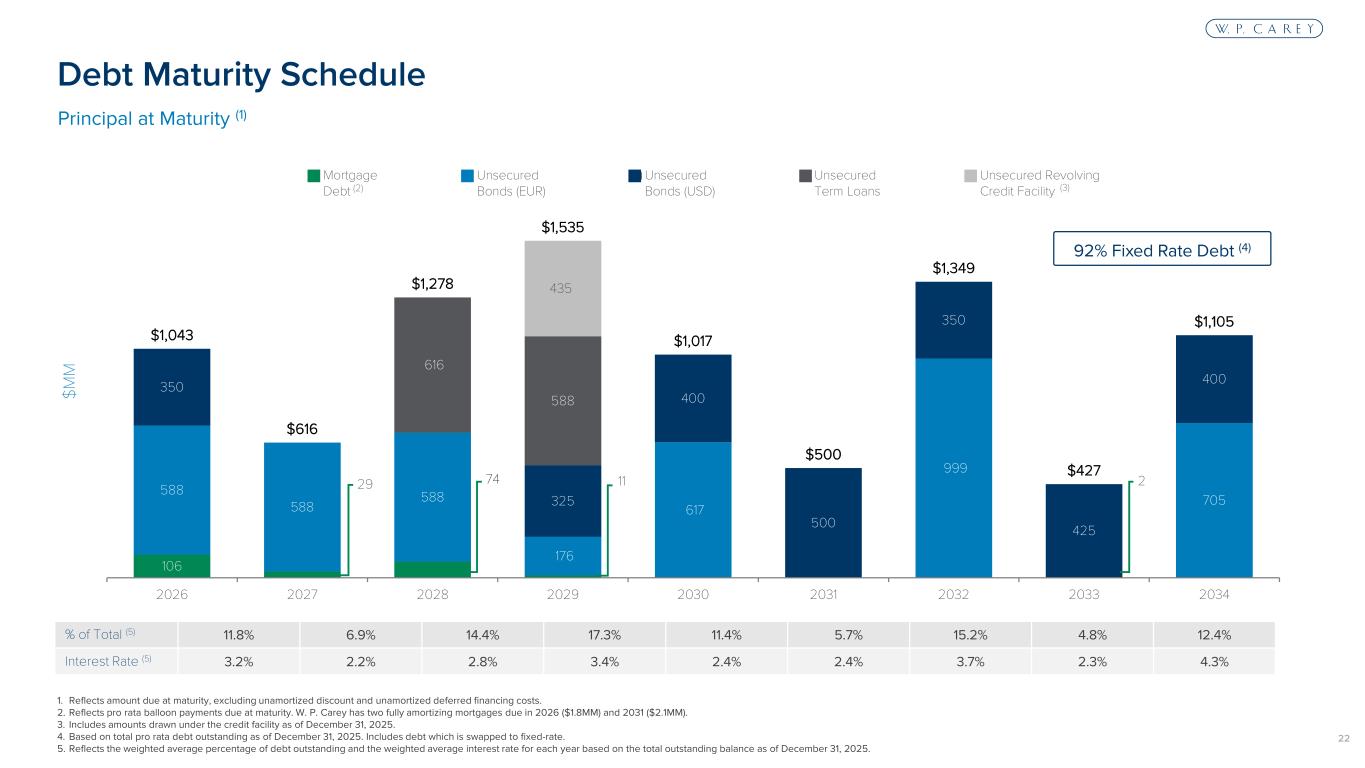
22 % of Total (5) 11.8% 6.9% 14.4% 17.3% 11.4% 5.7% 15.2% 4.8% 12.4% Interest Rate (5) 3.2% 2.2% 2.8% 3.4% 2.4% 2.4% 3.7% 2.3% 4.3% $M M 1. Reflects amount due at maturity, excluding unamortized discount and unamortized deferred financing costs. 2. Reflects pro rata balloon payments due at maturity. W. P. Carey has two fully amortizing mortgages due in 2026 ($1.8MM) and 2031 ($2.1MM). 3. Includes amounts drawn under the credit facility as of December 31, 2025. 4. Based on total pro rata debt outstanding as of December 31, 2025. Includes debt which is swapped to fixed-rate. 5. Reflects the weighted average percentage of debt outstanding and the weighted average interest rate for each year based on the total outstanding balance as of December 31, 2025. 106 29 74 11 2 588 588 588 176 617 999 705 350 325 400 500 350 425 400 616 588 435 $1,043 $616 $1,278 $1,535 $1,017 $500 $1,349 $427 $1,105 2026 2027 2028 2029 2030 2031 2032 2033 2034 Mortgage Debt Unsecured Bonds (EUR) Unsecured Bonds (USD) Unsecured Term Loans Unsecured Revolving Credit Facility(2) (3) Debt Maturity Schedule Principal at Maturity (1) 92% Fixed Rate Debt (4)
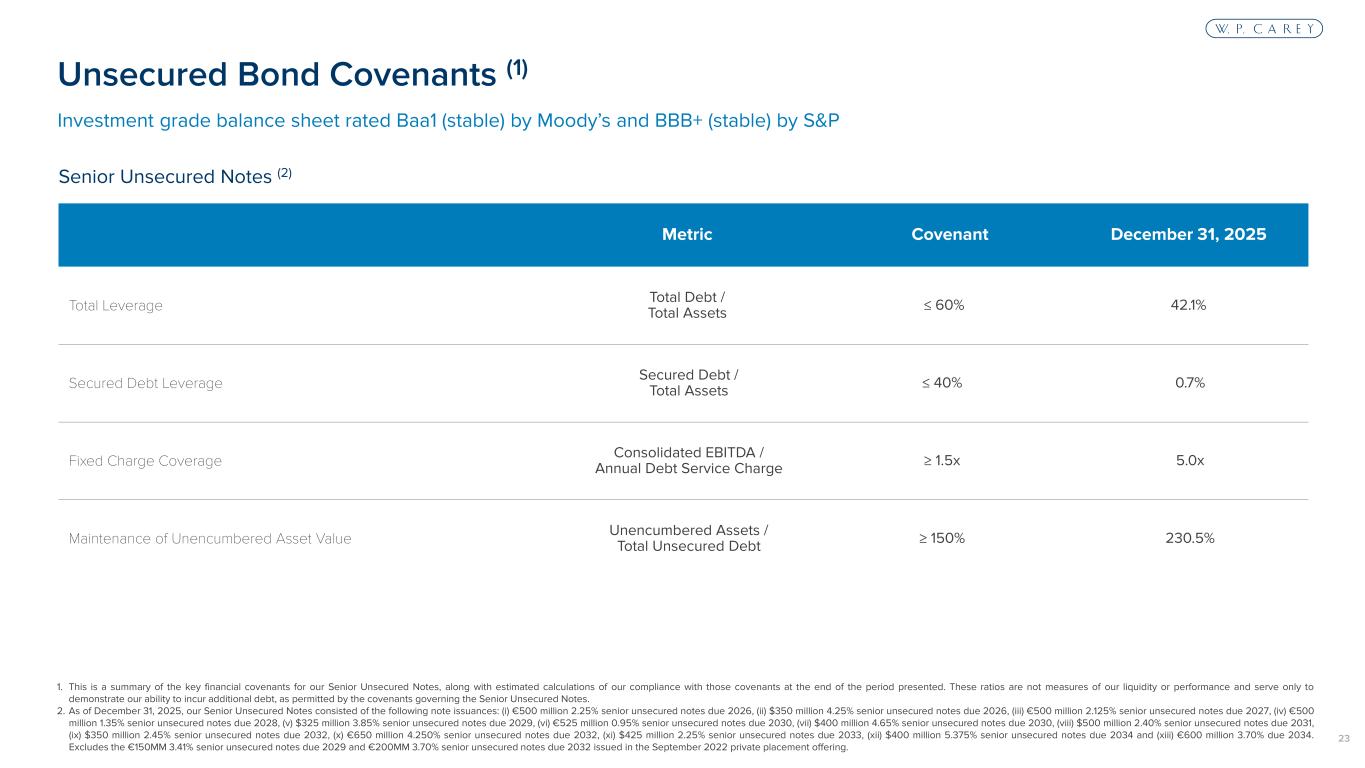
23 Metric Covenant December 31, 2025 Total Leverage Total Debt / Total Assets ≤ 60% 42.1% Secured Debt Leverage Secured Debt / Total Assets ≤ 40% 0.7% Fixed Charge Coverage Consolidated EBITDA / Annual Debt Service Charge ≥ 1.5x 5.0x Maintenance of Unencumbered Asset Value Unencumbered Assets / Total Unsecured Debt ≥ 150% 230.5% 1. This is a summary of the key financial covenants for our Senior Unsecured Notes, along with estimated calculations of our compliance with those covenants at the end of the period presented. These ratios are not measures of our liquidity or performance and serve only to demonstrate our ability to incur additional debt, as permitted by the covenants governing the Senior Unsecured Notes. 2. As of December 31, 2025, our Senior Unsecured Notes consisted of the following note issuances: (i) €500 million 2.25% senior unsecured notes due 2026, (ii) $350 million 4.25% senior unsecured notes due 2026, (iii) €500 million 2.125% senior unsecured notes due 2027, (iv) €500 million 1.35% senior unsecured notes due 2028, (v) $325 million 3.85% senior unsecured notes due 2029, (vi) €525 million 0.95% senior unsecured notes due 2030, (vii) $400 million 4.65% senior unsecured notes due 2030, (viii) $500 million 2.40% senior unsecured notes due 2031, (ix) $350 million 2.45% senior unsecured notes due 2032, (x) €650 million 4.250% senior unsecured notes due 2032, (xi) $425 million 2.25% senior unsecured notes due 2033, (xii) $400 million 5.375% senior unsecured notes due 2034 and (xiii) €600 million 3.70% due 2034. Excludes the €150MM 3.41% senior unsecured notes due 2029 and €200MM 3.70% senior unsecured notes due 2032 issued in the September 2022 private placement offering. Investment grade balance sheet rated Baa1 (stable) by Moody’s and BBB+ (stable) by S&P Senior Unsecured Notes (2) Unsecured Bond Covenants (1)
24 Corporate Responsibility
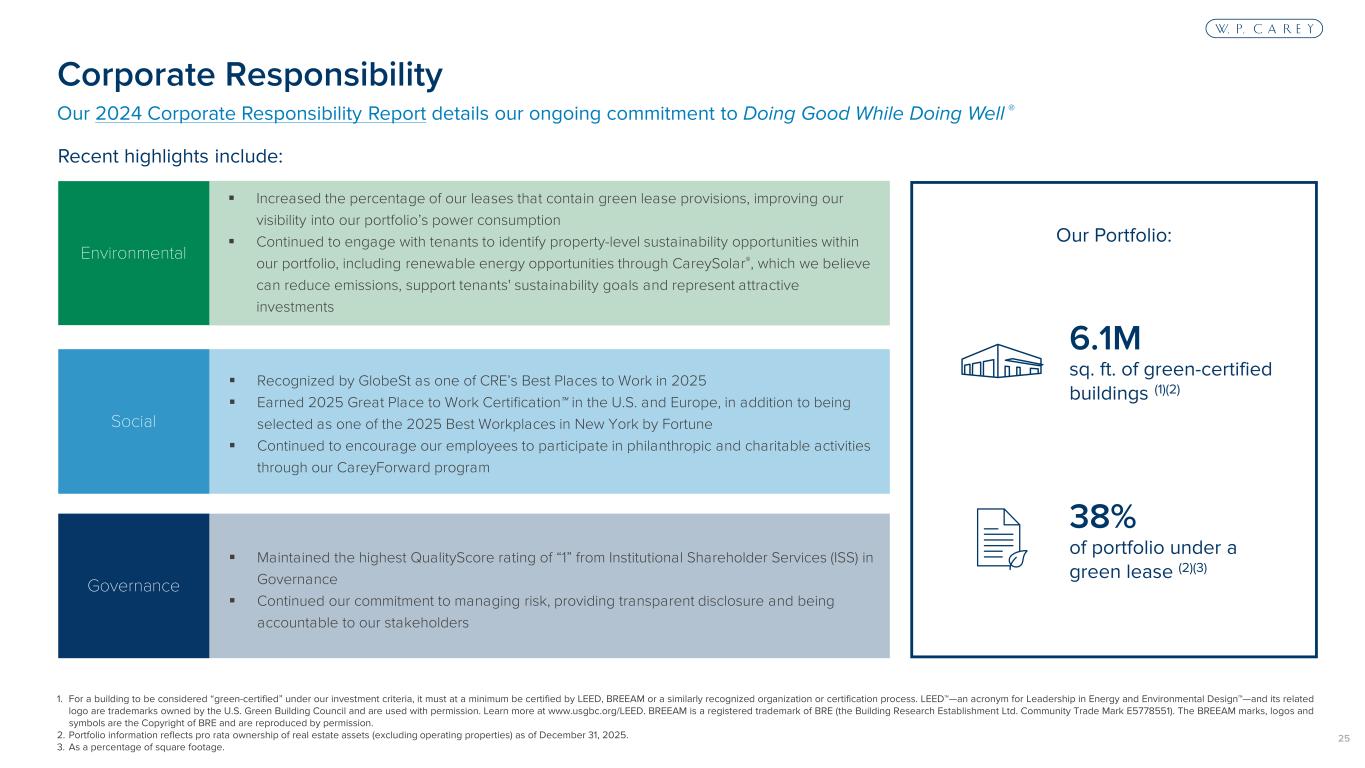
25 Our 2024 Corporate Responsibility Report details our ongoing commitment to Doing Good While Doing Well ® Corporate Responsibility Governance Social Environmental Recognized by GlobeSt as one of CRE’s Best Places to Work in 2025 Earned 2025 Great Place to Work Certification in the U.S. and Europe, in addition to being selected as one of the 2025 Best Workplaces in New York by Fortune Continued to encourage our employees to participate in philanthropic and charitable activities through our CareyForward program Maintained the highest QualityScore rating of “1” from Institutional Shareholder Services (ISS) in Governance Continued our commitment to managing risk, providing transparent disclosure and being accountable to our stakeholders Recent highlights include: Increased the percentage of our leases that contain green lease provisions, improving our visibility into our portfolio’s power consumption Continued to engage with tenants to identify property-level sustainability opportunities within our portfolio, including renewable energy opportunities through CareySolar®, which we believe can reduce emissions, support tenants' sustainability goals and represent attractive investments Our Portfolio: 1. For a building to be considered “green-certified” under our investment criteria, it must at a minimum be certified by LEED, BREEAM or a similarly recognized organization or certification process. LEED —an acronym for Leadership in Energy and Environmental Design —and its related logo are trademarks owned by the U.S. Green Building Council and are used with permission. Learn more at www.usgbc.org/LEED. BREEAM is a registered trademark of BRE (the Building Research Establishment Ltd. Community Trade Mark E5778551). The BREEAM marks, logos and symbols are the Copyright of BRE and are reproduced by permission. 2. Portfolio information reflects pro rata ownership of real estate assets (excluding operating properties) as of December 31, 2025. 3. As a percentage of square footage. 6.1M sq. ft. of green-certified buildings (1)(2) 38% of portfolio under a green lease (2)(3)
26 Certain of the matters discussed in this communication constitute forward-looking statements within the meaning of the Securities Act of 1933 (as amended, the “Securities Act”) and the Securities Exchange Act of 1934 (as amended, the “Exchange Act”), both as amended by the Private Securities Litigation Reform Act of 1995. The forward-looking statements include, among other things, statements regarding the intent, belief or expectations of the Company and can be identified by the use of words such as “may,” “will,” “should,” “would,” “will be,” “will continue,” “will likely result,” “believe,” “project,” “expect,” “anticipate,” “intend,” “estimate” “opportunities,” “possibility,” “strategy,” “maintain” or the negative version of these words and other comparable terms. These forward- looking statements include, but are not limited to, statements that are not historical facts. These statements are based on the current expectations of our management, and it is important to note that our actual results could be materially different from those projected in such forward-looking statements. There are a number of risks and uncertainties that could cause actual results to differ materially from the forward-looking statements. Other unknown or unpredictable risks or uncertainties, like the risks related to fluctuating interest rates, the impact of inflation and tariffs on our tenants and us, the effects of pandemics and global outbreaks of contagious diseases and domestic or geopolitical crises, such as terrorism, military conflict, war or the perception that hostilities may be imminent, political instability or civil unrest, or other conflict, and those additional risk factors discussed in reports that we have filed with the SEC, could also have material adverse effects on our future results, performance or achievements. Discussions of some of these other important factors and assumptions are contained in W. P. Carey’s filings with the SEC and are available at the SEC’s website at http://www.sec.gov, including Part I, Item 1A. Risk Factors in W. P. Carey’s Annual Report on Form 10-K for the fiscal year ended December 31, 2025. Investors are cautioned not to place undue reliance on these forward-looking statements, which speak only as of the date of this communication, unless noted otherwise. Except as required under the federal securities laws and the rules and regulations of the SEC, W. P. Carey does not undertake any obligation to release publicly any revisions to the forward-looking statements to reflect events or circumstances after the date of this communication or to reflect the occurrence of unanticipated events. All data presented herein is as of December 31, 2025 unless otherwise noted. Amounts may not sum to totals due to rounding. Past performance does not guarantee future results. Cautionary Statement Concerning Forward-Looking Statements
27 Non-GAAP Financial Disclosures Adjusted EBITDA We believe that EBITDA is a useful supplemental measure to investors and analysts for assessing the performance of our business because (i) it removes the impact of our capital structure from our operating results and (ii) it is helpful when comparing our operating performance to that of companies in our industry without regard to such items, which can vary substantially from company to company. Adjusted EBITDA as disclosed represents EBITDA modified to include other adjustments to GAAP net income for certain non-cash charges, such as impairments, non-cash rent adjustments and unrealized gains and losses from our hedging activity. Additionally, we exclude gains and losses on sale of real estate, which are not considered fundamental attributes of our business plans and do not affect our overall long-term operating performance. We exclude these items from adjusted EBITDA because they are not the primary drivers in our decision-making process. Adjusted EBITDA reflects adjustments for unconsolidated partnerships and jointly owned investments. Adjusted EBITDA is also modified to reflect the pro forma impact of our investment and disposition activity, assuming all activity occurred at the beginning of the applicable period. This includes adjustments to recurring revenue and expenses related to properties acquired or disposed of, and capital investments and commitments completed, during the applicable period. Our assessment of our operations is focused on long-term sustainability and not on such non-cash and non-core items, which may cause short-term fluctuations in net income but have no impact on cash flows. We believe that adjusted EBITDA is a useful supplemental measure and representation of the performance of our business to investors and analysts, although it does not represent net income that is computed in accordance with GAAP. Accordingly, adjusted EBITDA should not be considered an alternative to net income or an indicator of our financial performance. EBITDA and adjusted EBITDA as calculated by us may not be comparable to similarly titled measures of other companies. Other Metrics Pro Rata Metrics This presentation contains certain metrics prepared on a pro rata basis. We refer to these metrics as pro rata metrics. We have certain investments in which our economic ownership is less than 100%. On a full consolidation basis, we report 100% of the assets, liabilities, revenues and expenses of those investments that are deemed to be under our control or for which we are deemed to be the primary beneficiary, even if our ownership is less than 100%. Also, for all other jointly owned investments, which we do not control, we report our net investment and our net income or loss from that investment. On a pro rata basis, we generally present our proportionate share, based on our economic ownership of these jointly owned investments, of the assets, liabilities, revenues and expenses of those investments. Multiplying each of our jointly owned investments’ financial statement line items by our percentage ownership and adding or subtracting those amounts from our totals, as applicable, may not accurately depict the legal and economic implications of holding an ownership interest of less than 100% in our jointly owned investments. ABR ABR represents contractual minimum annualized base rent for our net-leased properties and reflects exchange rates as of December 31, 2025. If there is a rent abatement, we annualize the first monthly contractual base rent following the free rent period. ABR is not applicable to operating properties and is presented on a pro rata basis. Disclosures The following non-GAAP financial measures are used in this presentation