Operator
Greetings, and welcome to Zion Bank Corp's first quarter earnings conference call. At this time, all participants are in a listen-only mode. A question-and-answer session will follow the formal presentation. If anyone should require operator assistance during the conference, please press star zero on your telephone keypad. Please note that this conference is being recorded. It is now my pleasure to turn the conference over to Andrea Christofferson. Thank you. You may begin.
Thank you, Julian, and good evening, everyone. Welcome to our conference call to discuss Zions Bank Corporation's first quarter, 2026 results. My name is Andrea Christofferson, Director of Investor Relations. Before we begin, I would like to remind you that during this call, we will make forward-looking statements. Actual results may differ materially. We encourage you to review the forward-looking statements and non-GAAP disclosures in our press release and on slide two of today's presentation, which apply equally to statements made during this call. A copy of the earnings release and presentation are available at sciencebankcorporation.com. For our agenda today, Chairman and Chief Executive Officer Harris Simmons will provide opening remarks. Following Harris' comments, Chief Financial Officer Ryan Richards will review our financial results and outlook. Also with us today are Scott McClain, President and Chief Operating Officer, Derek Stewart, Chief Credit Officer, and Chris Kiriakakis, Chief Risk Officer. After our prepared remarks, we will hold a question and answer session. This call is scheduled for one hour. I will now turn the time over to Harris.
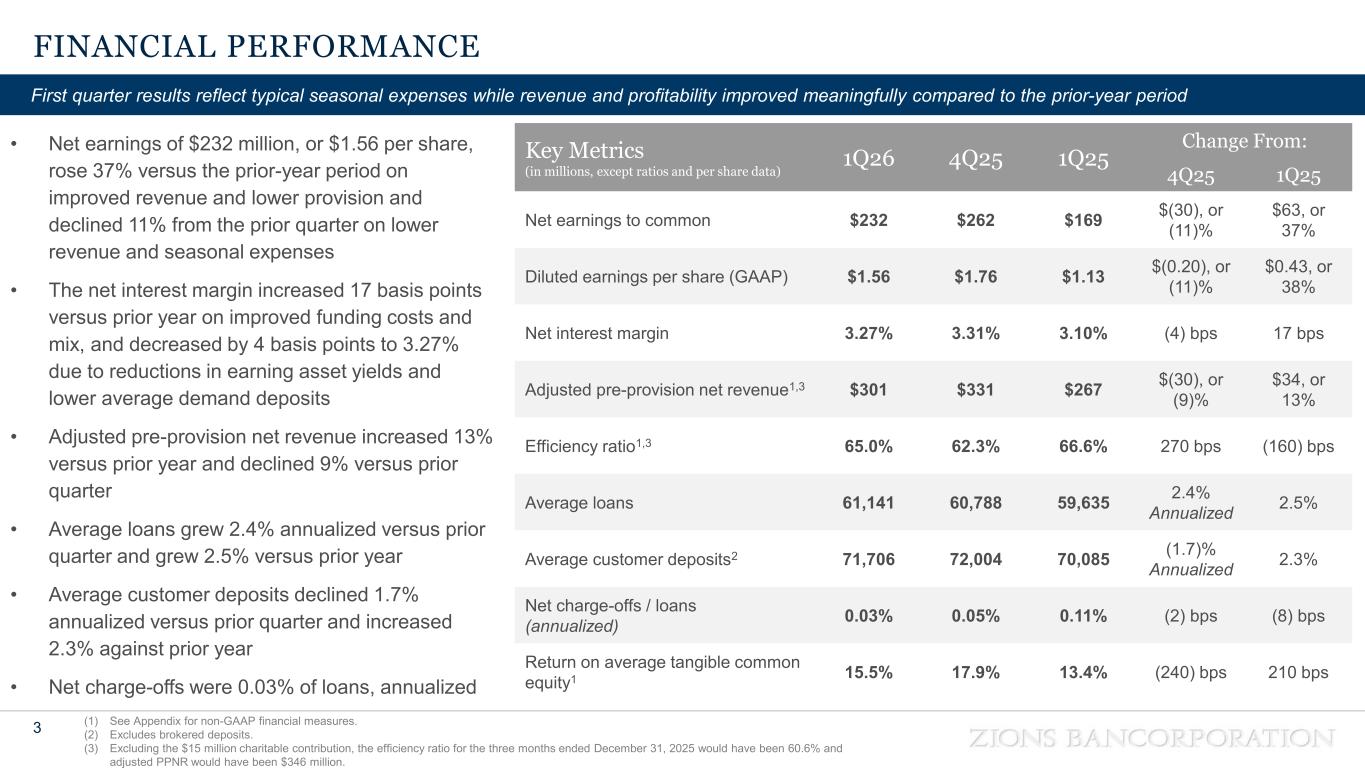
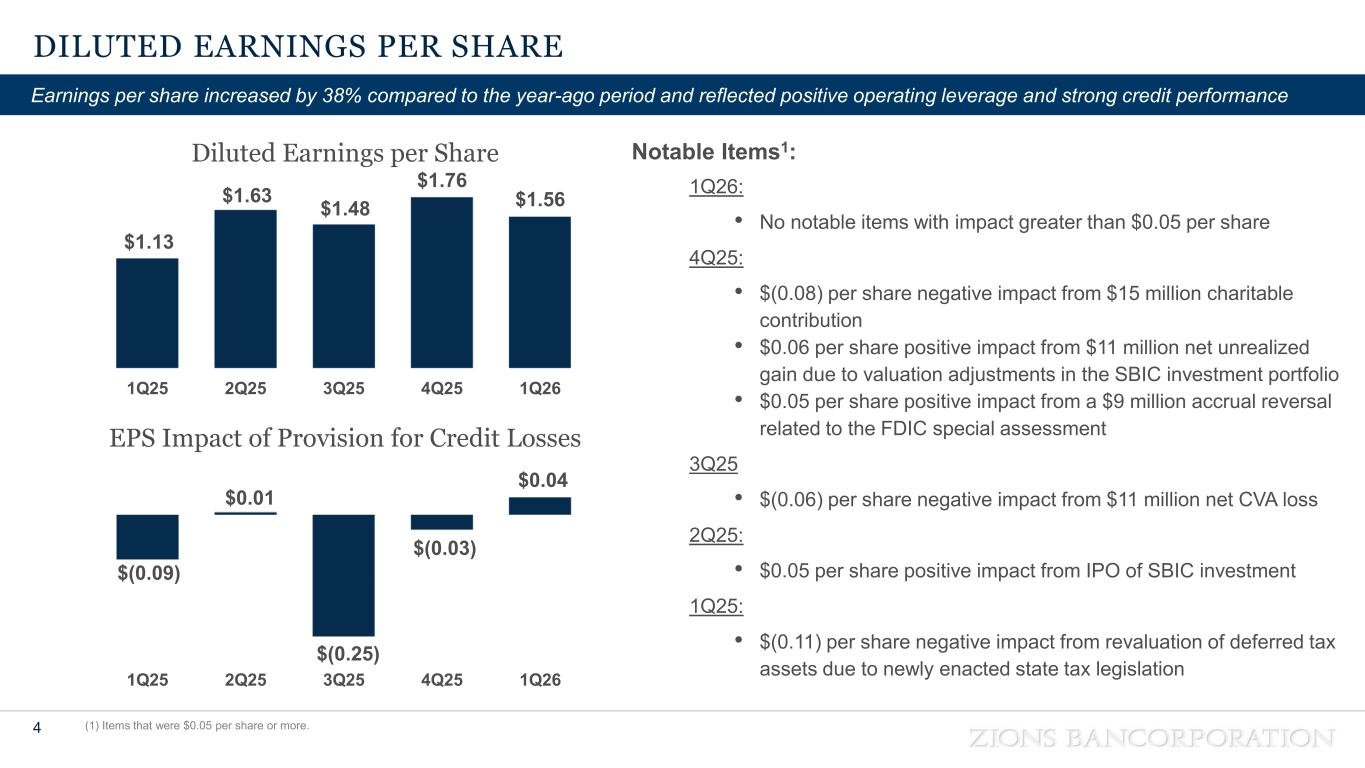
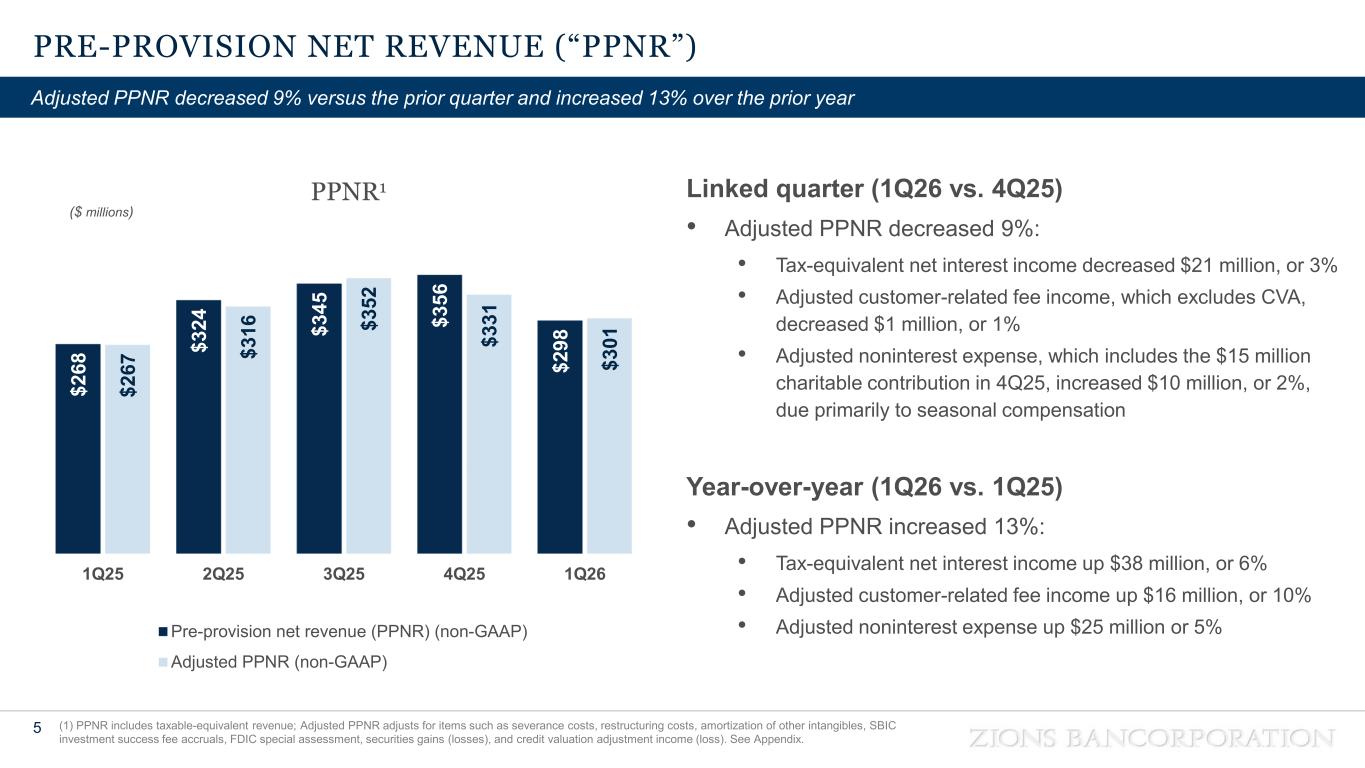
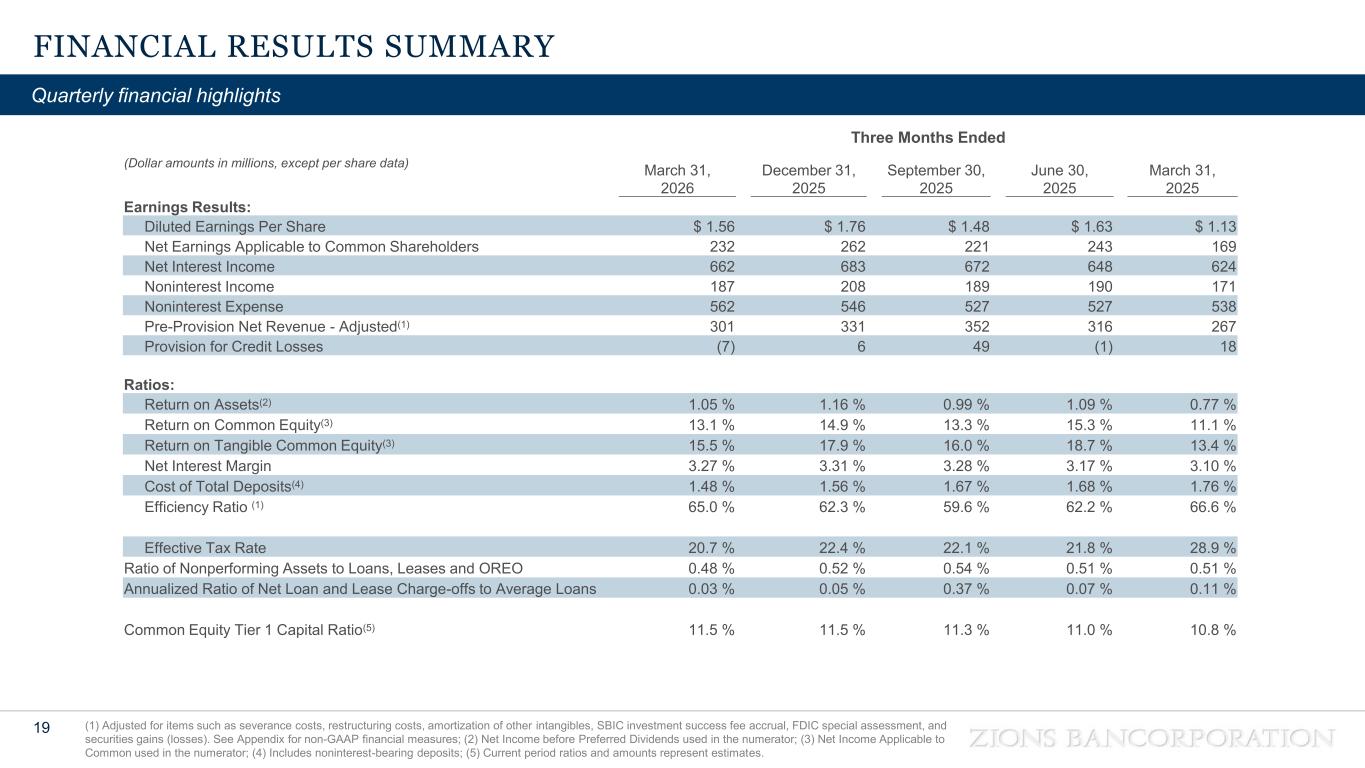
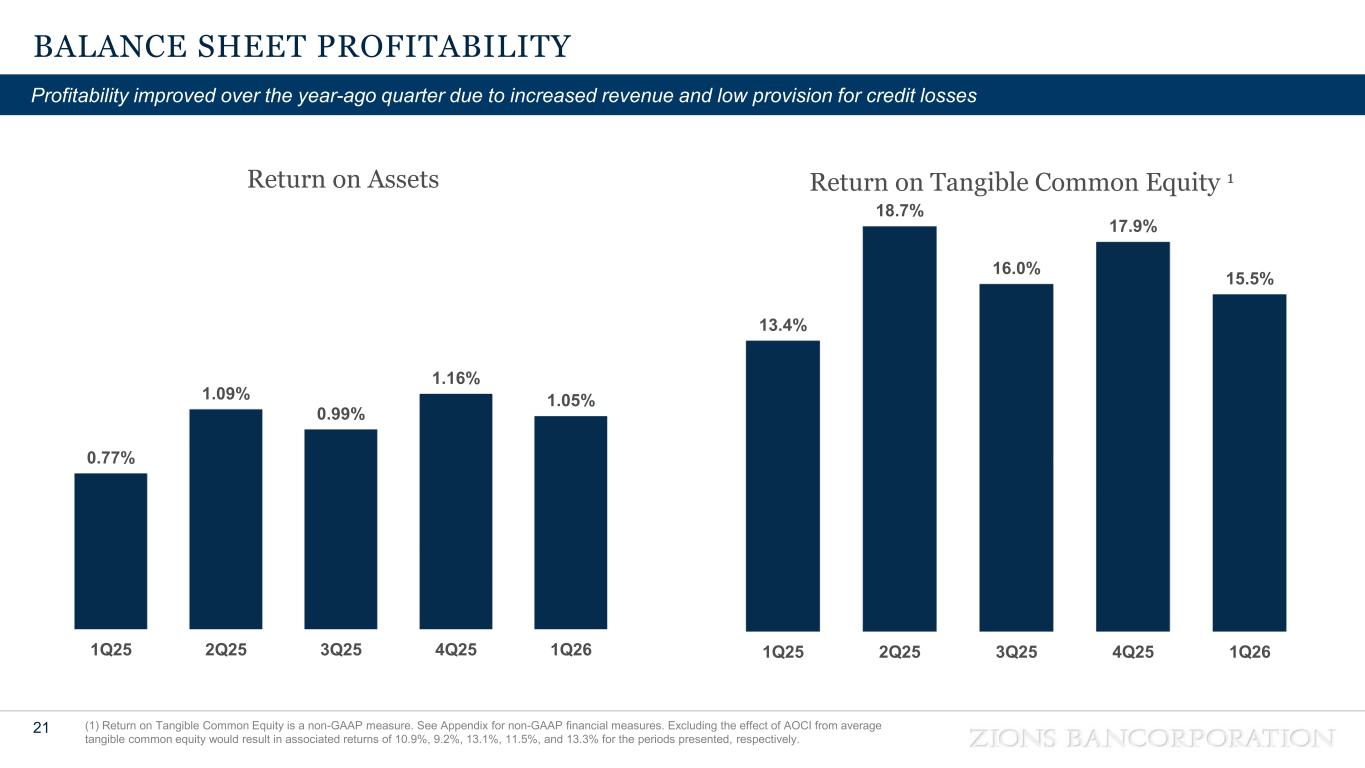
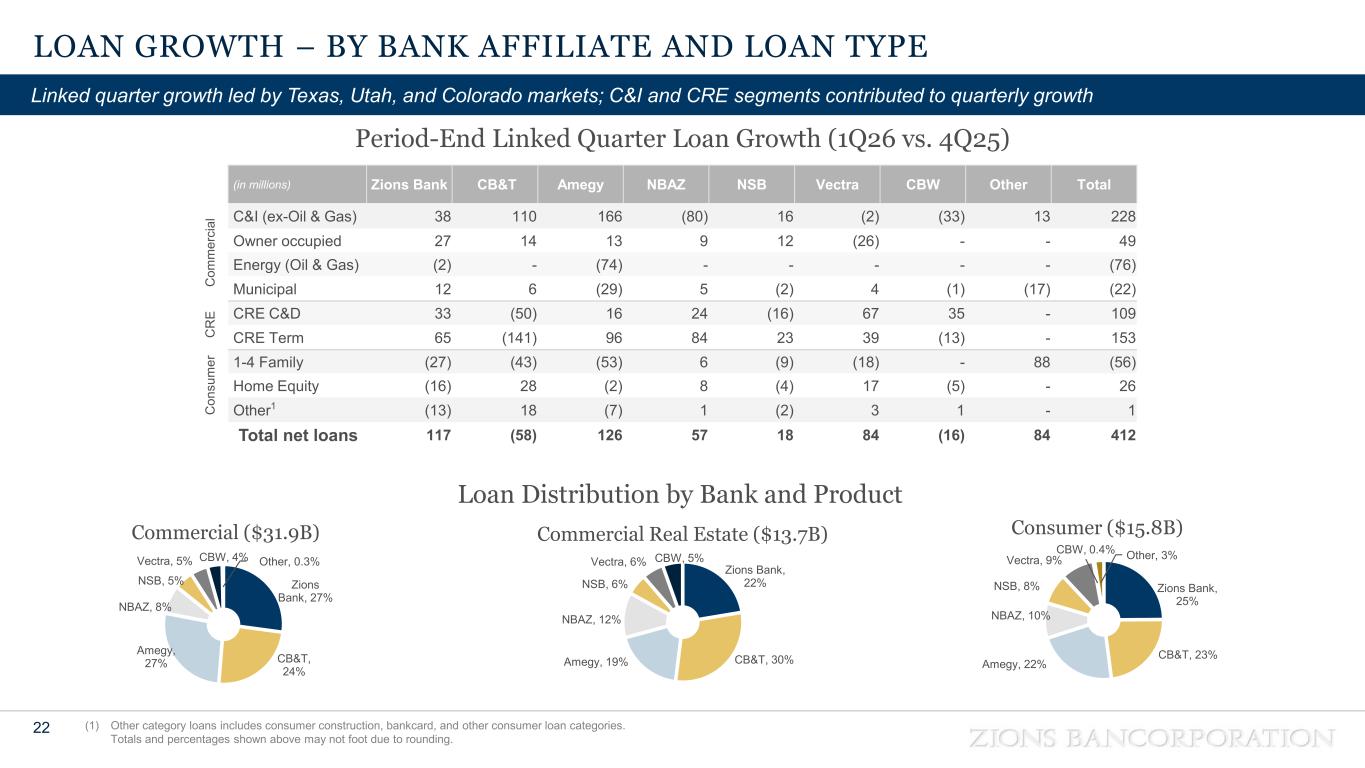
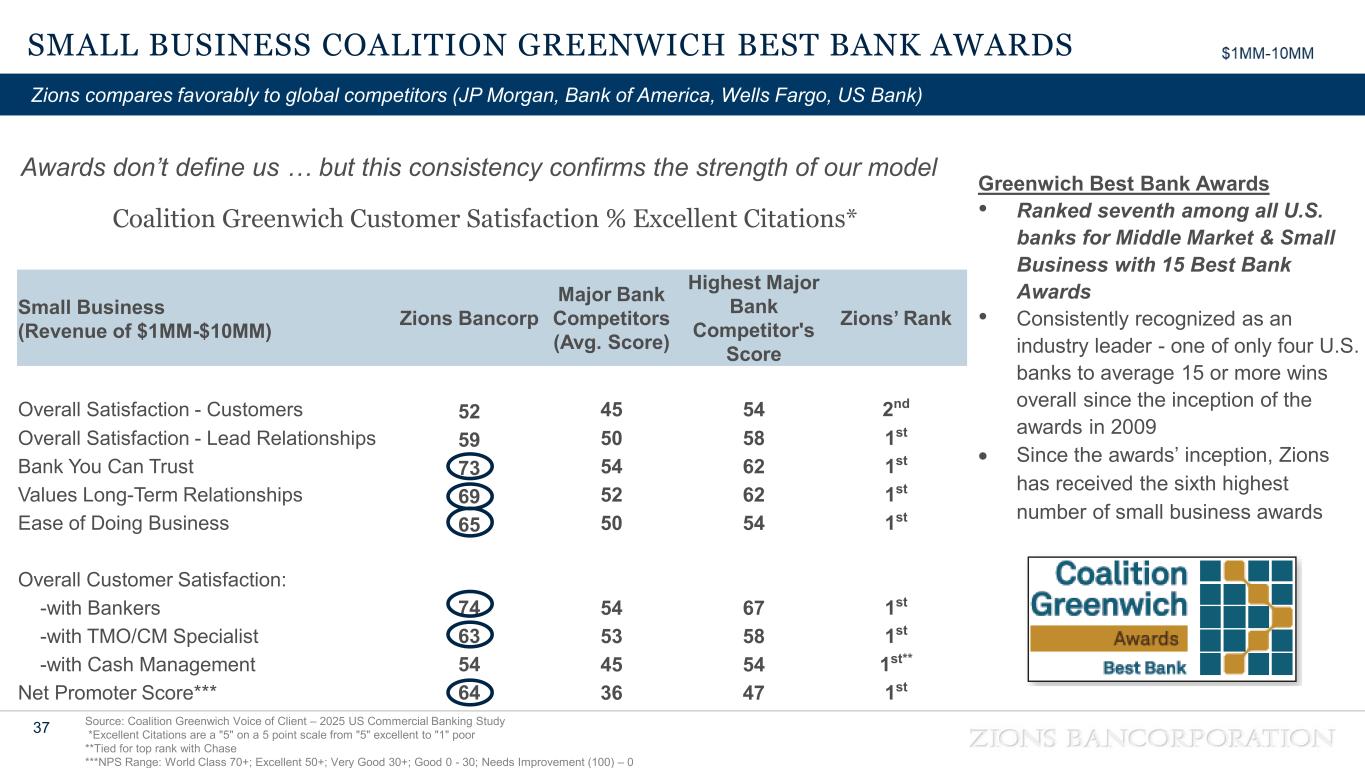
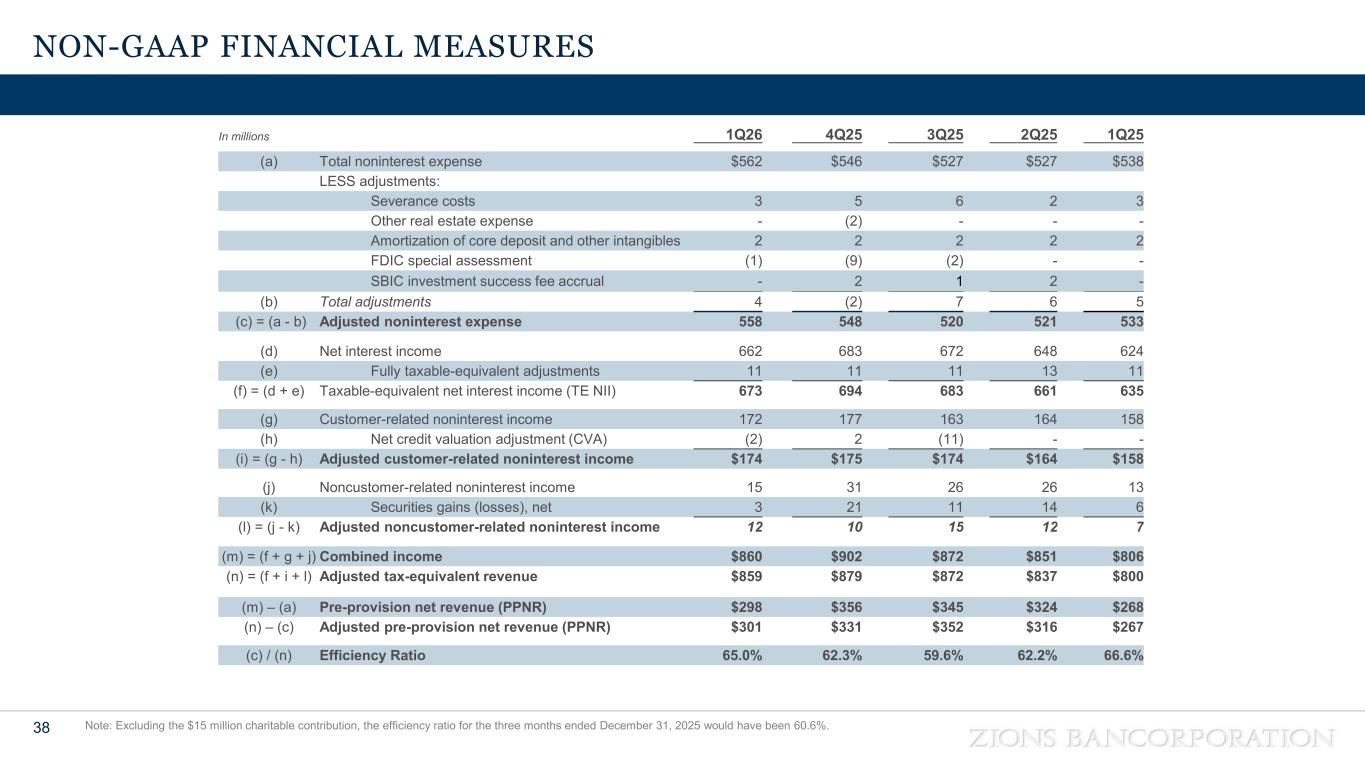
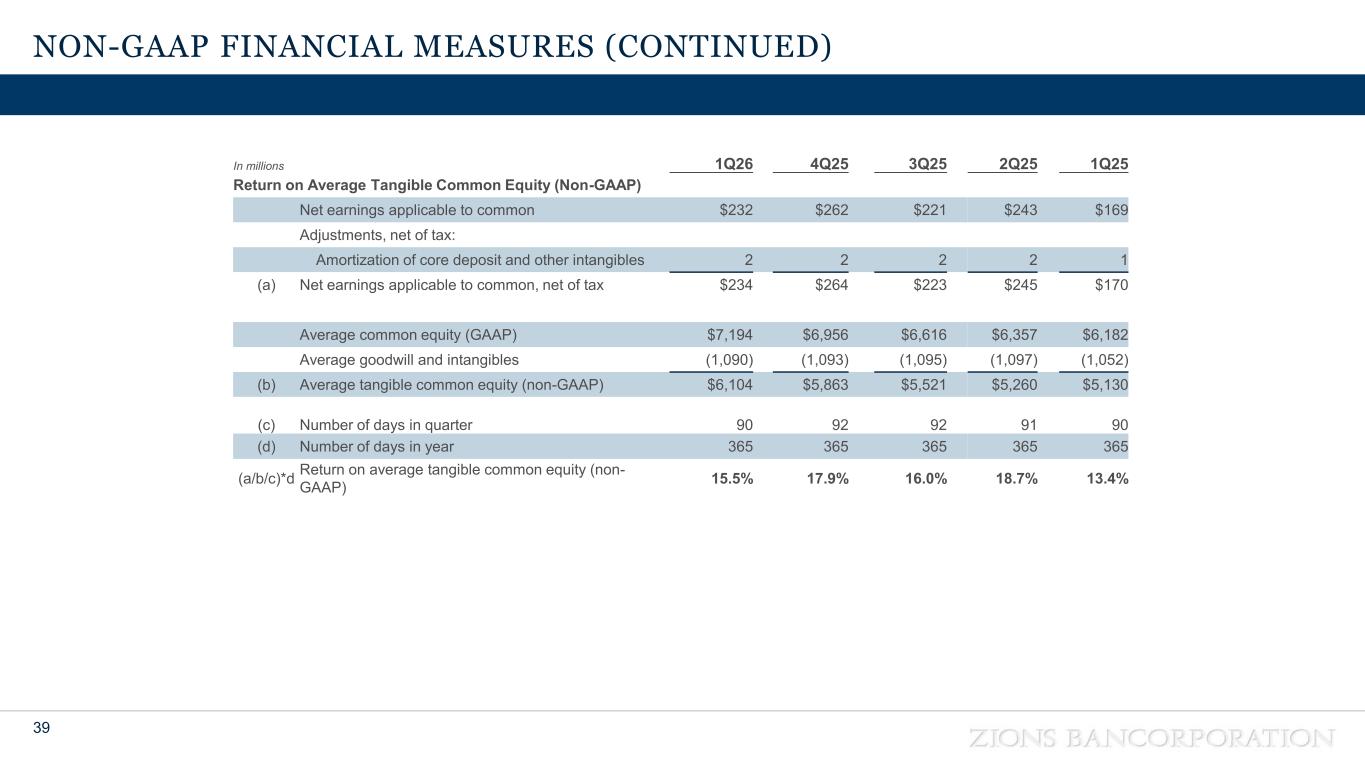
Thanks very much, Andrea, and good evening, everyone. We're reasonably pleased with our performance and financial results for the first quarter, which reflect meaningful year-over-year improvement and continued progress against our long-term strategic priorities our capital markets division continues to be an important driver of fee income growth since launching a business in 2020 we've invested heavily in talent technology and product capabilities expanding our presence across investment banking sales and trading and real estate capital markets in late march we announced an agreement with basis investment group to acquire their fannie and freddie lending programs related mortgage servicing rights and an experienced team supporting those platforms subject to regulatory and customary closing approvals we expect this transaction will meaningfully enhance our ability to serve commercial real estate clients across the western united states and beyond and to further strengthen our capital markets franchise we continue to invest in our consumer and small business franchises following the launch of our new gold accounts consumer deposit product in the second half of 2025 we recently introduced its companion offering for small business customers branded as quote beyond the business uh quote we began piloting the product in colorado and arizona late in the quarter and it's expected to roll out more broadly across our affiliate banks later this quarter this tiered checking solution is designed to support clients as they grow from basic banking needs to more complex cash flow and money movement capabilities our focus on small business is also reflected in continued momentum in sba lending where we now rank 11th nationally in sba 7a loan approvals during the first half of the sba's fiscal year shifting out of the financial results for the quarter slide three presents certain first quarter results versus the prior order and prior year first quarter results reflected typical seasonal expense patterns while revenue and profitability improved meaningfully relative to the prior year period and earnings for two hundred and thirty two million dollars or a dollar fifty six per diluted share up thirty seven percent from a year ago driven by revenue growth a lower provision for credit losses and a lower effective tax rate compared to the fourth quarter of 2025 earnings declined 11 primarily reflecting lower revenue including the impact of two fewer days in the period and significantly lower securities gains as well as seasonal compensation expenses the net interest margin was 3.27 down four basis points from the prior quarter reflecting lower earning asset yields and the decline in average demand deposits, partially offset by improved funding costs. Average loans grew 2.4% on an annualized basis, led by commercial lending. While average customer deposits showed a modest seasonal decline, period-end customer deposits grew $1.3 billion, or 1.8% from year-end. Credit losses were very modest at three basis points annualized of average loans. On slide four, diluted earnings per share were $1.56, down from $1.76 in the prior quarter and up from $1.13 a year ago. As a reminder, the year-ago quarter included an $0.11 per share headwind related to the revaluation of deferred tax assets due to newly enacted state tax legislation. There were no notable items in the first quarter with an impact greater than $0.05 per share. As shown on slide five, adjusted pre-provision net revenue was $301 million, declined 9% from the prior quarter, reflecting some of the items noted earlier, including a slightly lower day count adjusted tax equivalent net interest income. Pre-provision net revenue increased 13% versus the year-ago quarter on improved revenue and positive operating leverage. With that overview, I'll turn the call over to our Chief Financial Officer, Ryan Richards, to walk through the quarter in more detail and to walk through our outlook.
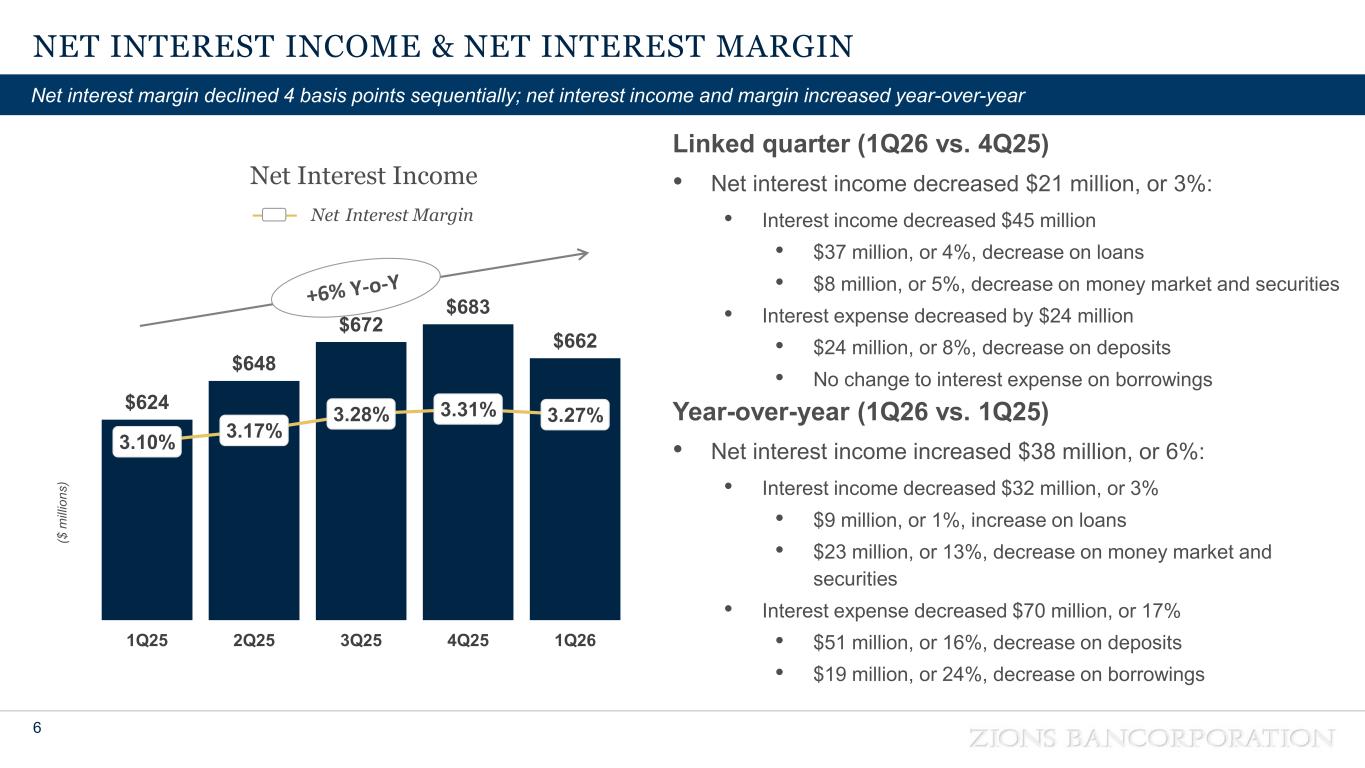
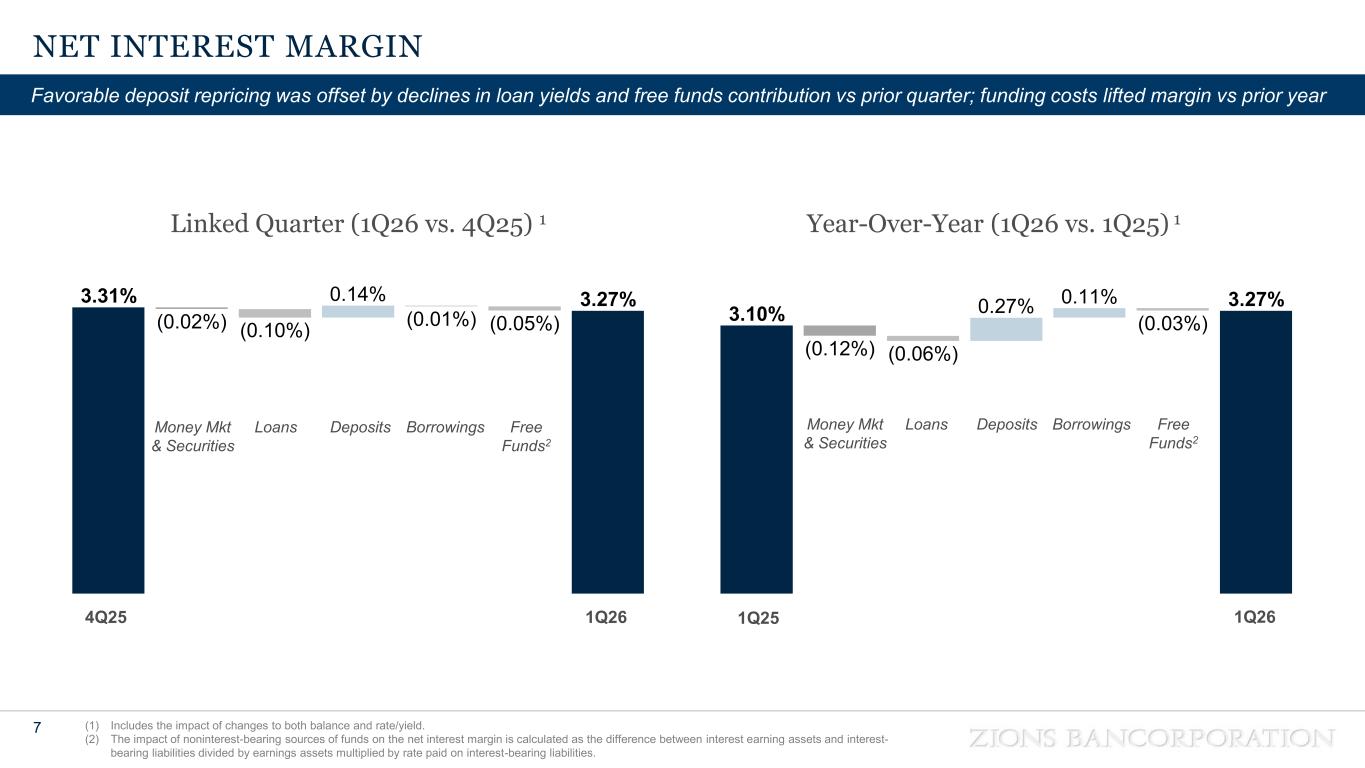
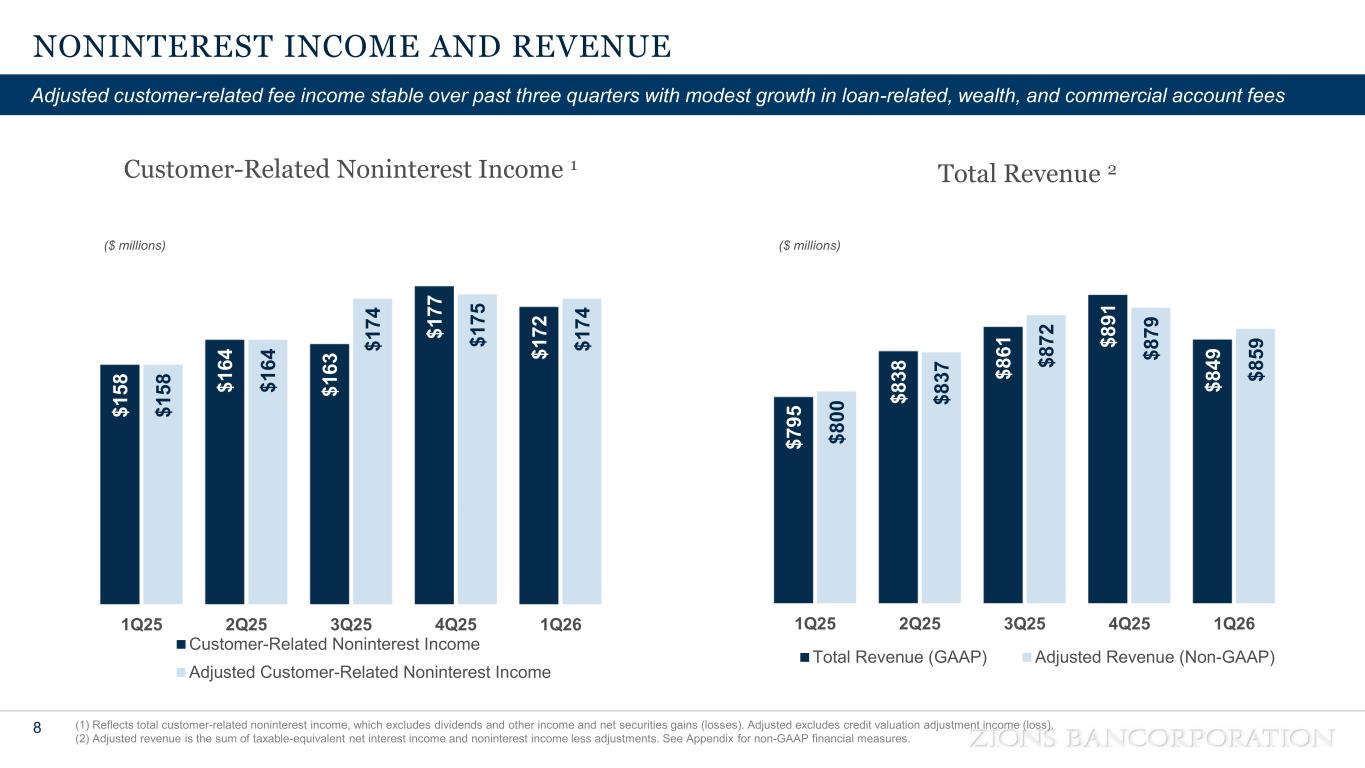
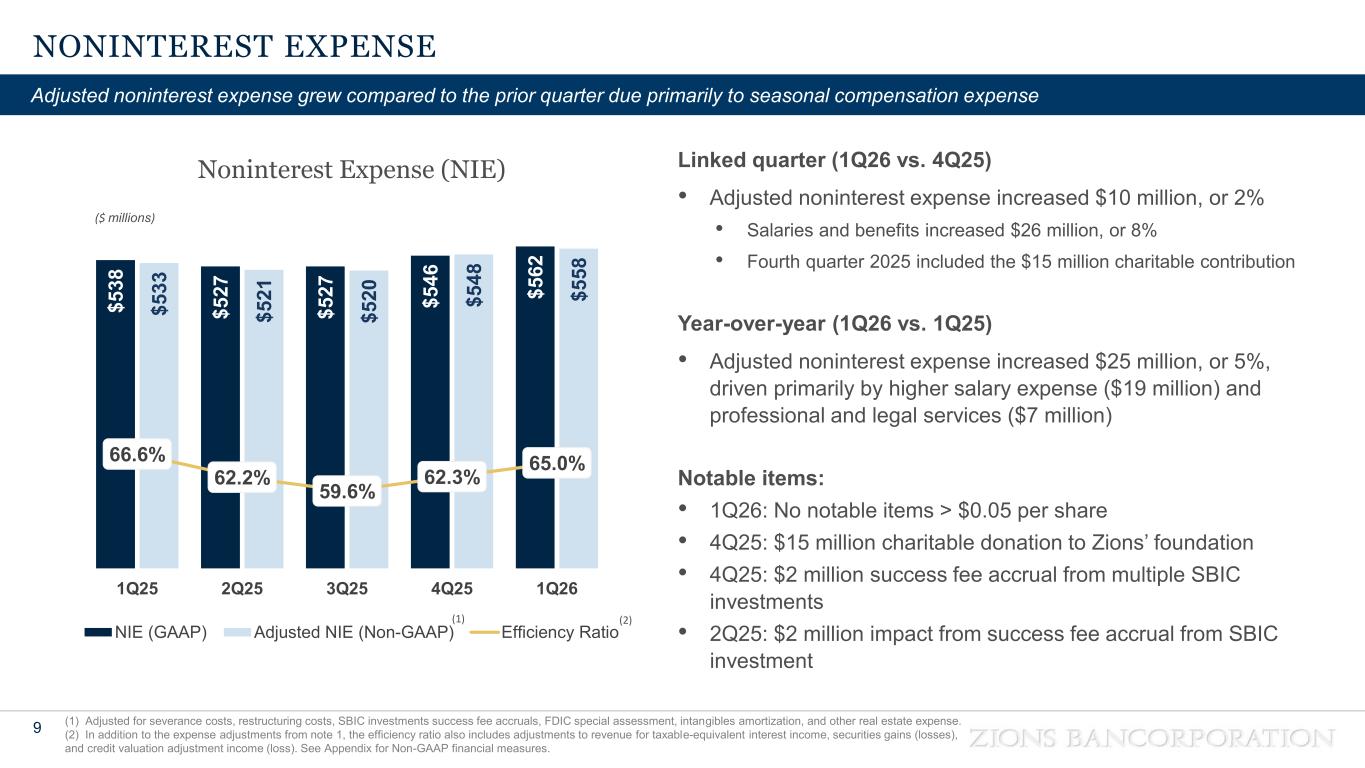
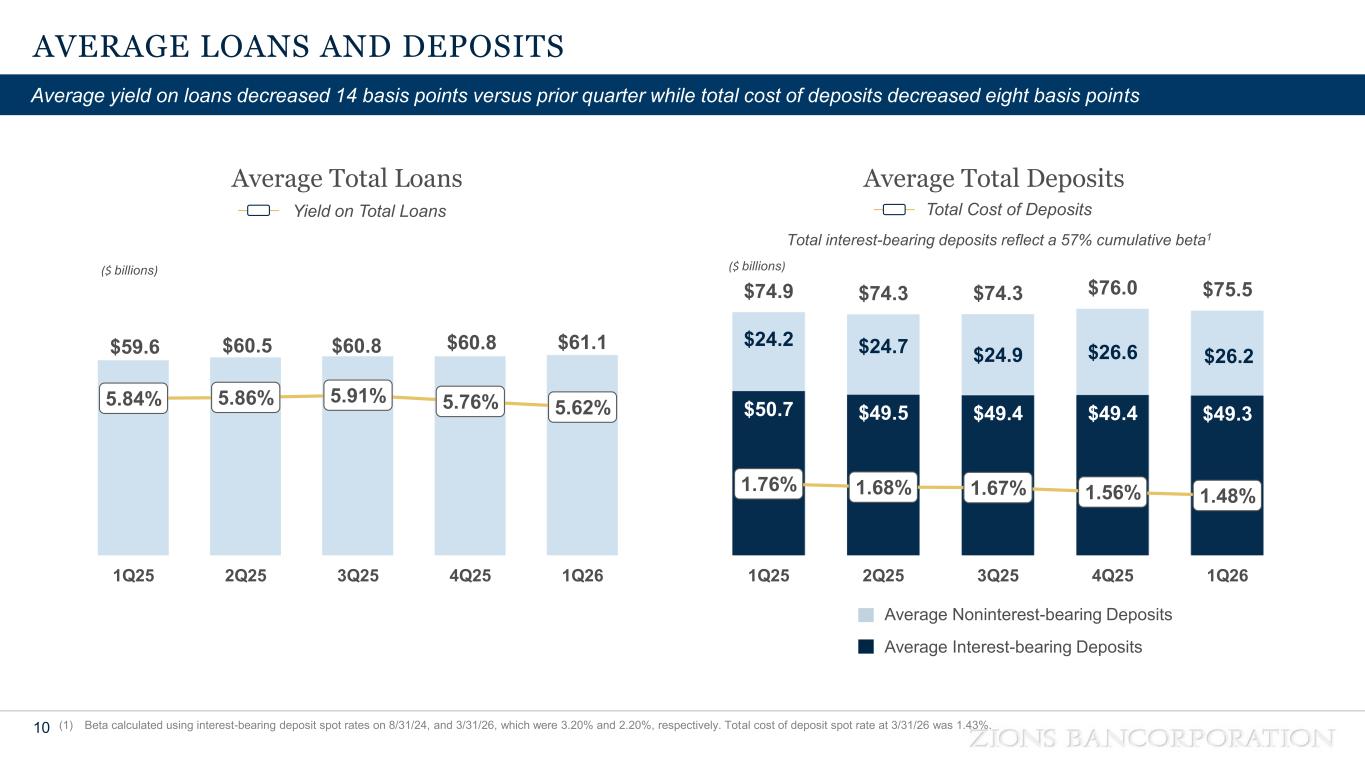
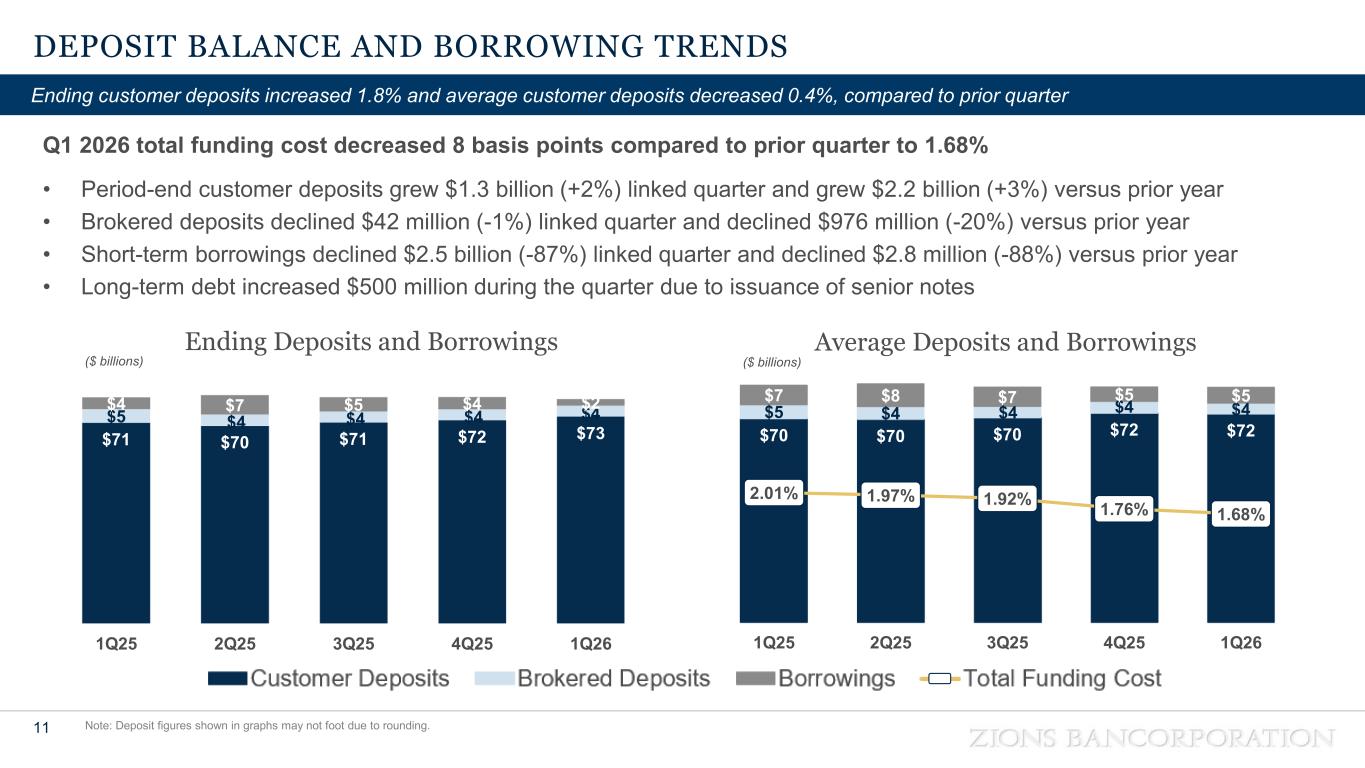
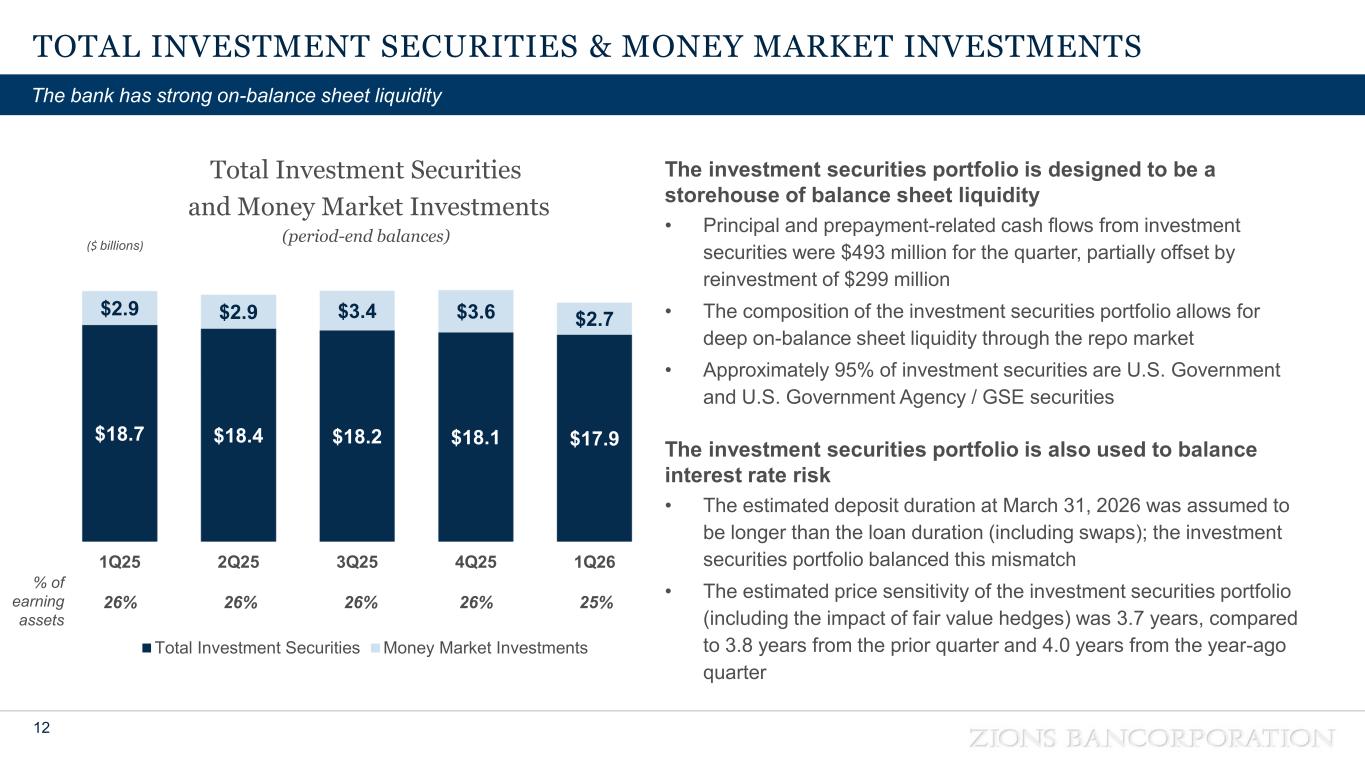
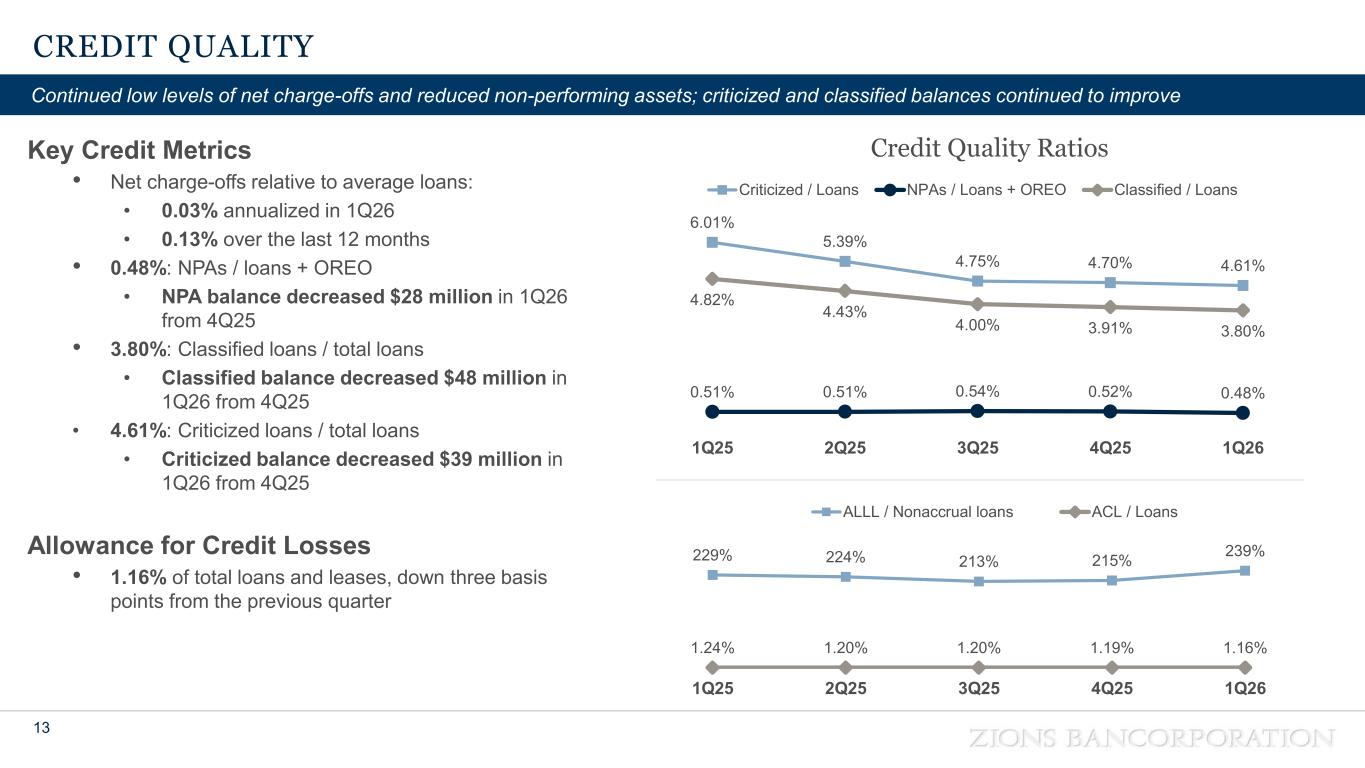
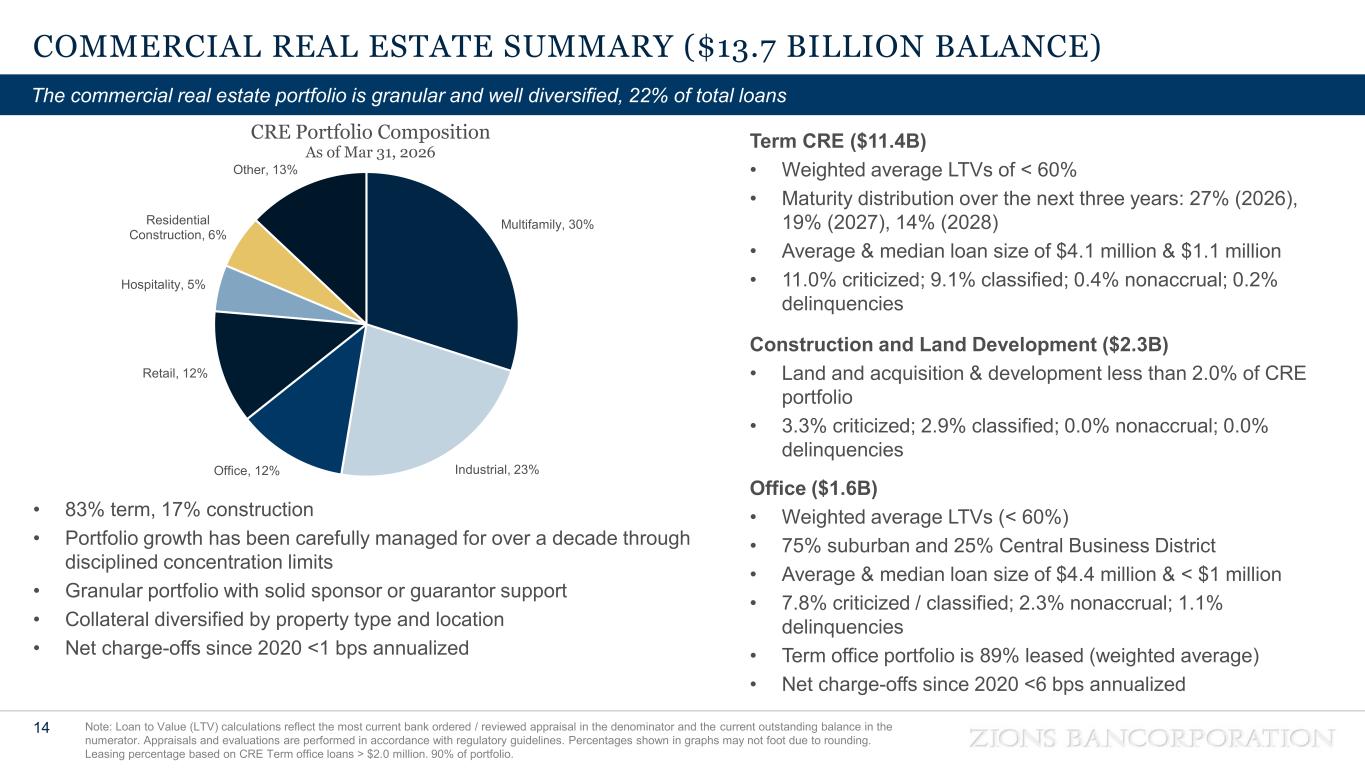
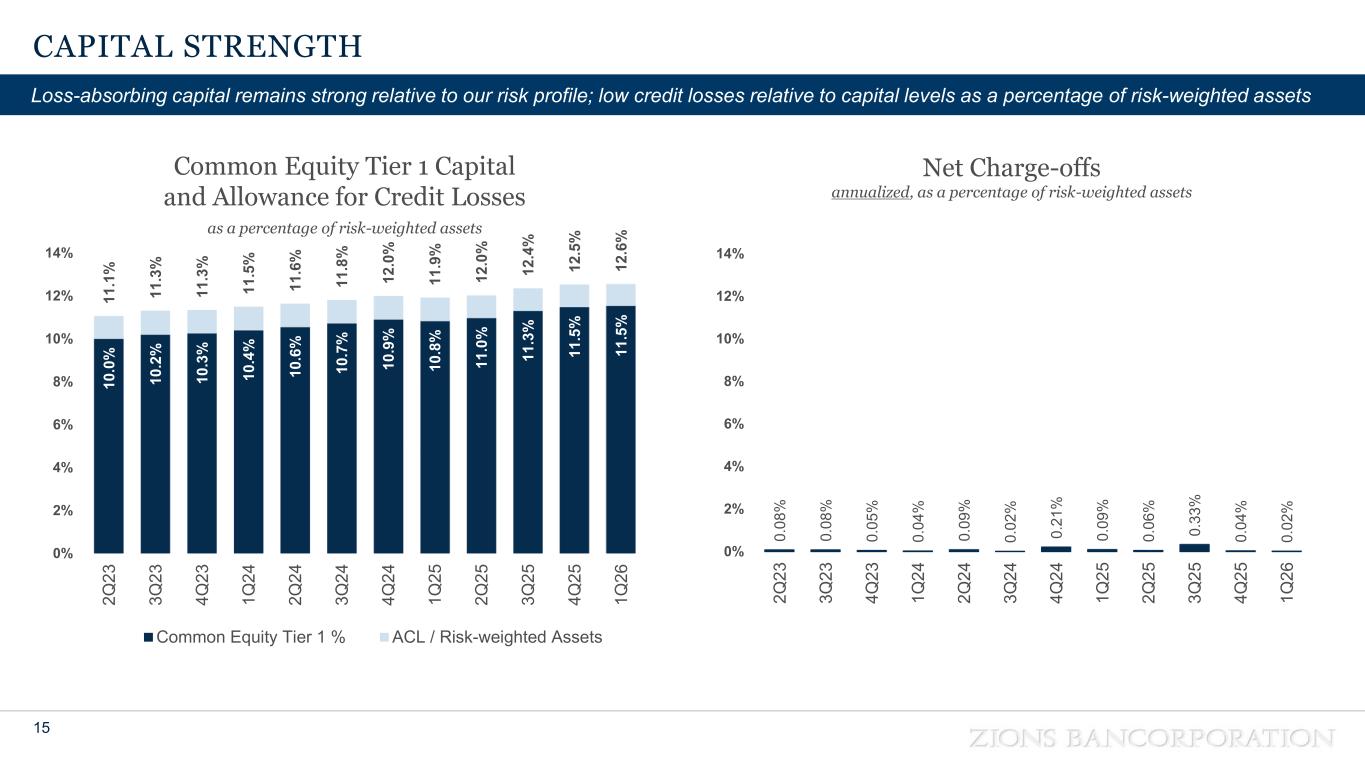
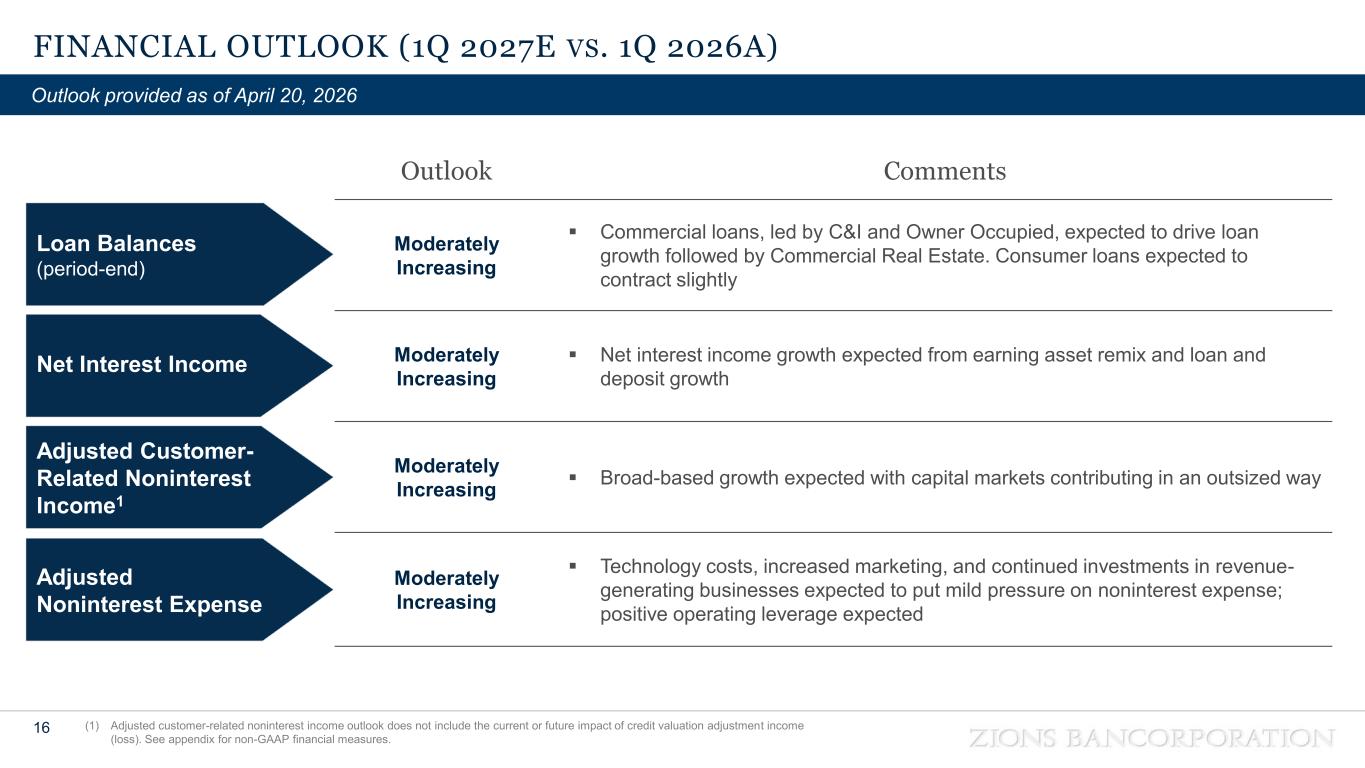
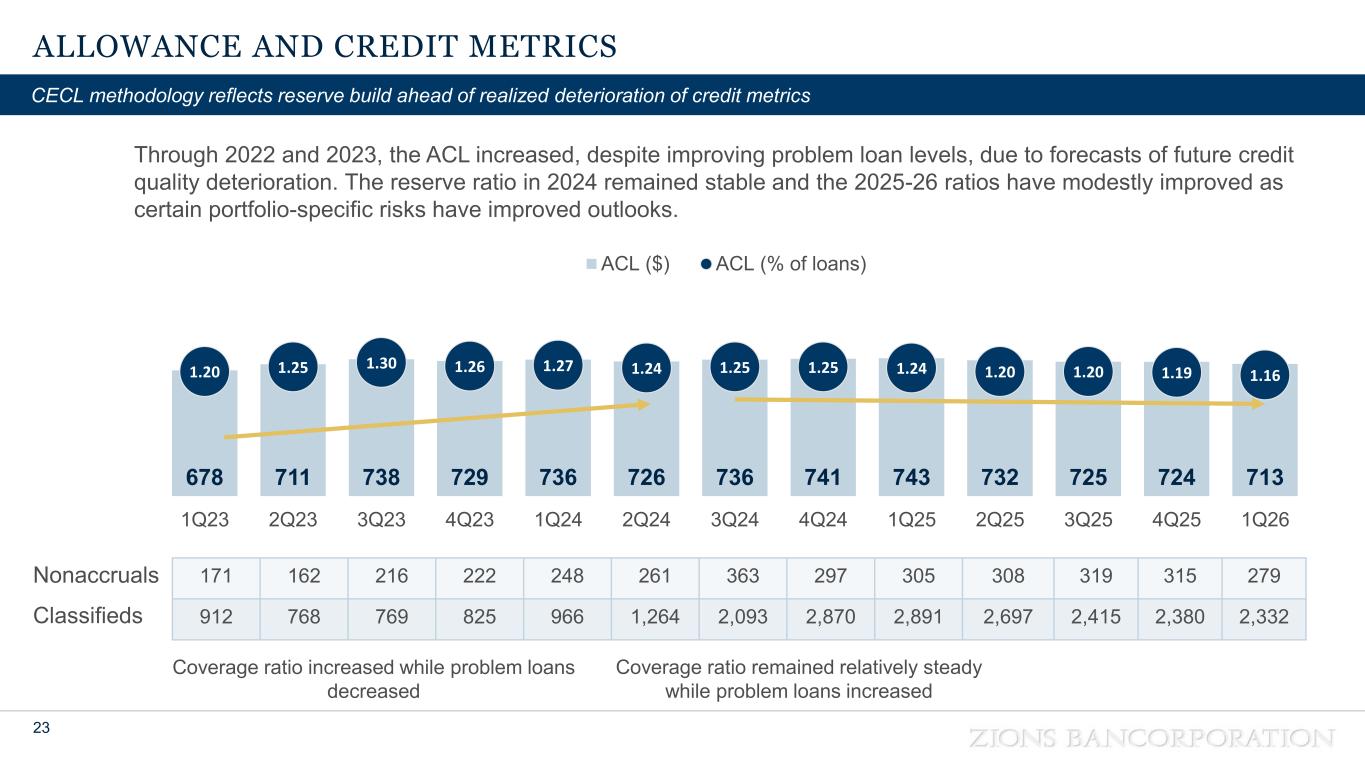
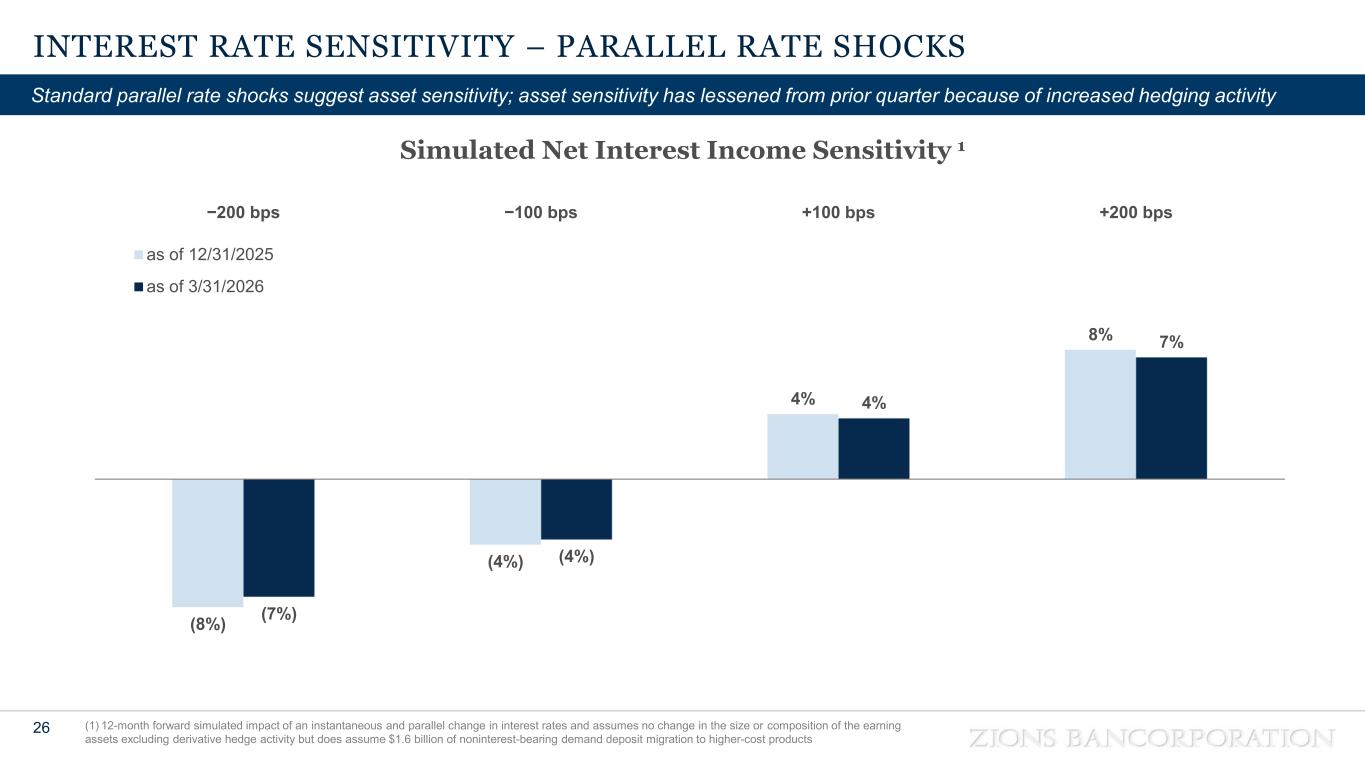
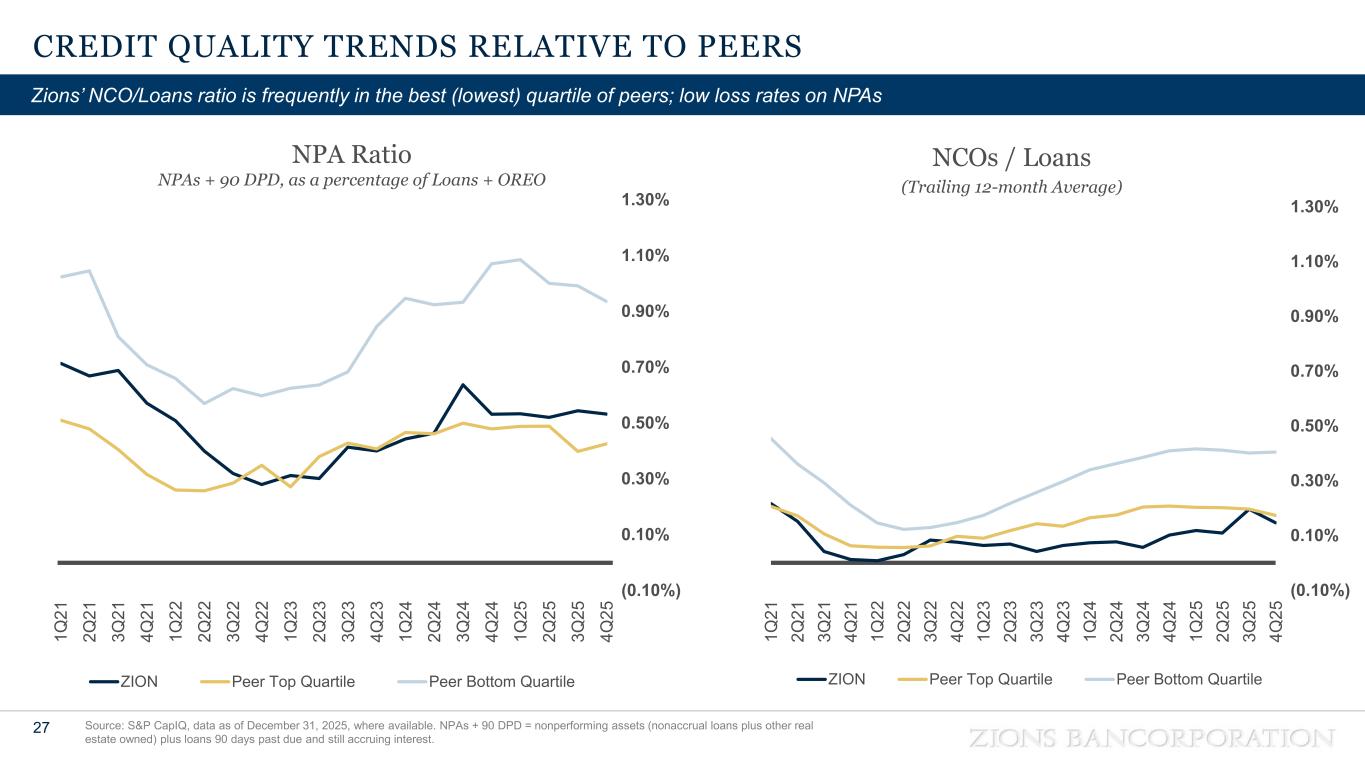
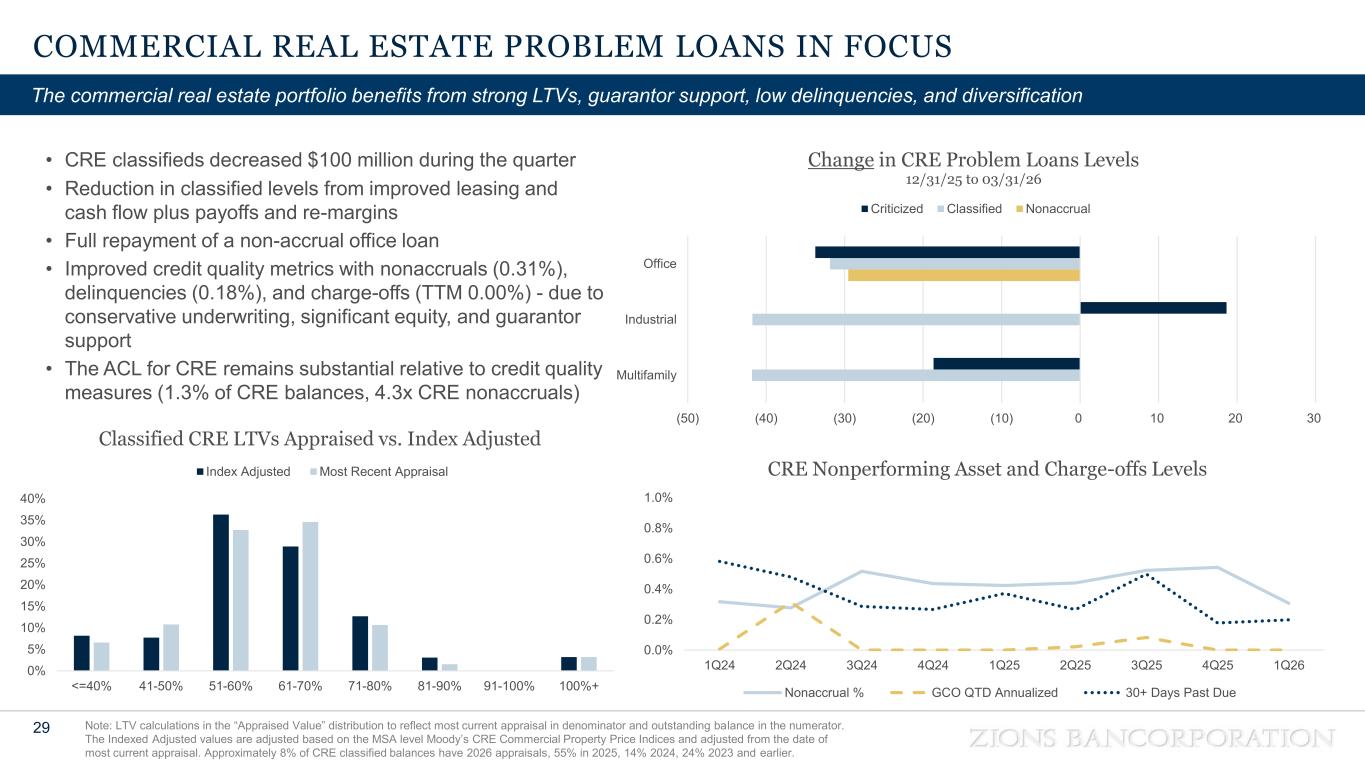
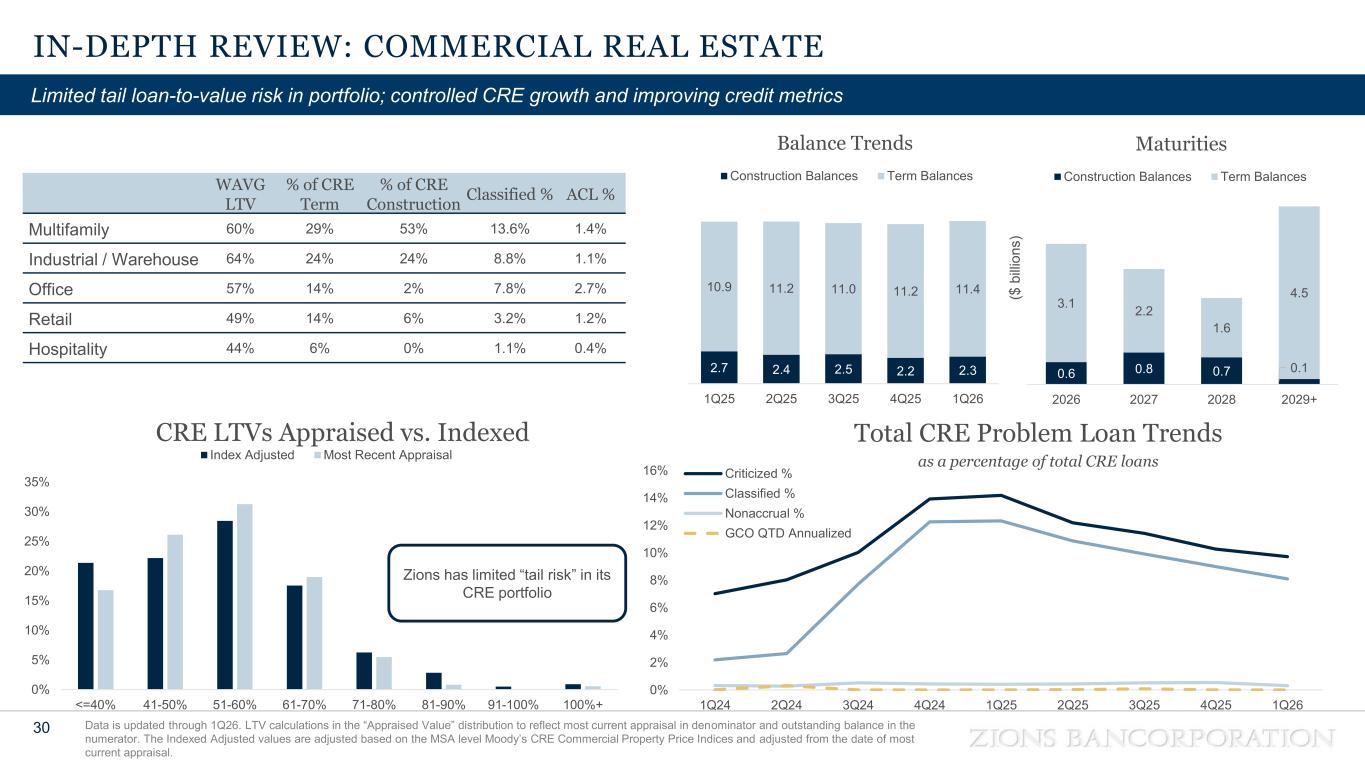
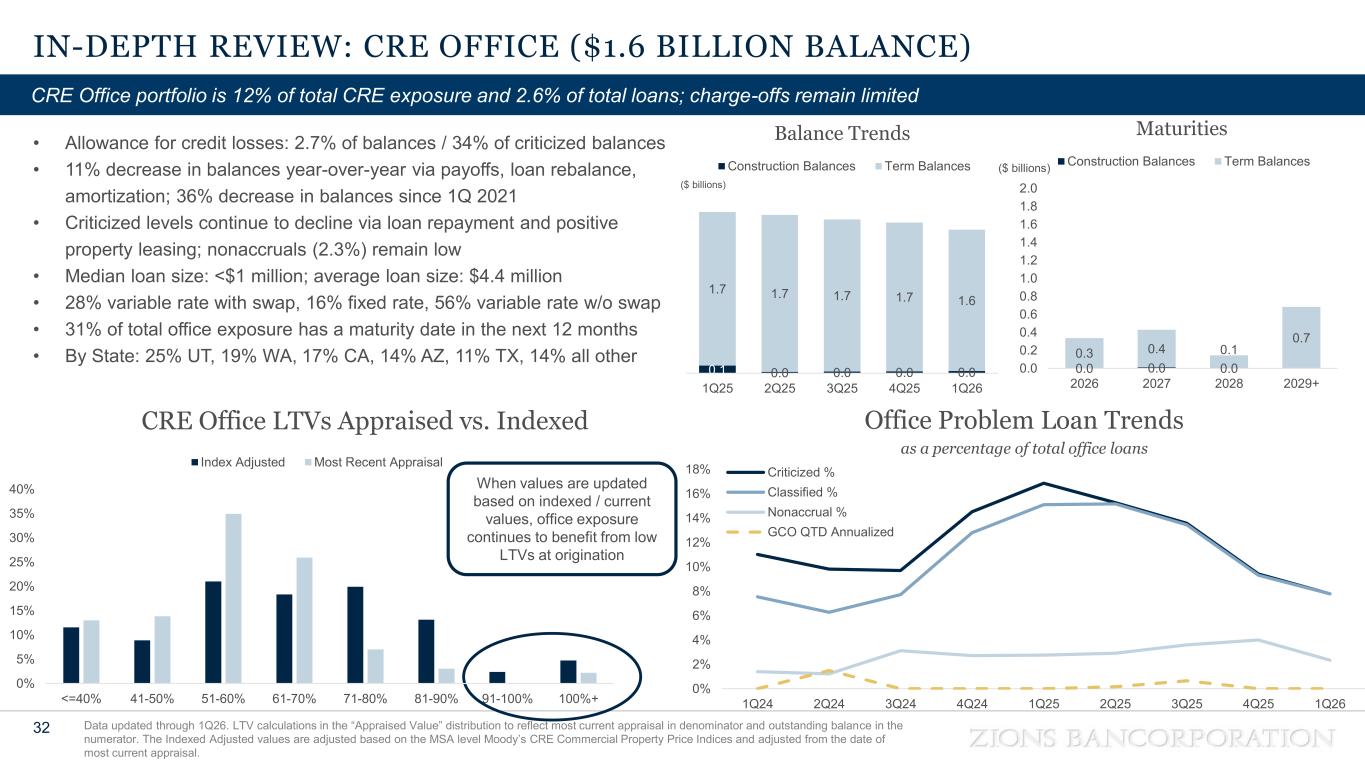
Thank you, Harris, and good evening, everyone. Beginning on slide six, you can see the five-quarter trend for net interest income and net interest margin. Tax flow equivalent net interest income was $662 million, down $21 million or 3% from prior quarter and up 38 million or six percent in the year ago quarter. Earning asset yields fell faster than funding costs during the quarter, most notably in January when loan repricing reflected the impact of the December rate cuts. Term deposit costs also been lower but with a lag over the quarter. Net interest margin was 3.27 percent down four basis points linked quarter, and up 17 basis points year-over-year. Slide 7 provides additional detail on the drivers of net interest margin. The linked quarter walks reflect the lower asset yields mentioned previously, as well as a lower contribution from average demand deposit balances. These factors were partially offset by improved deposit costs. Year-over-year, the improvement in margin primarily reflects deposit and borrowing repricing pricing and our continued focus on optimizing the balance sheet for the first quarter of 2027 our outlet for net interest income is moderately increasing given the uncertain path of benchmark rates the forward curve as of march 31st assumed no rate changes over the next 12 months if that plays out we estimate net interest income growth of about seven to eight percent which would exceed our guide moving to non-interest income on slide eight customer related non-interest income was 172 million compared to 177 million in the prior quarter and 158 million a year ago excluding net credit valuation adjustment adjusted customer related non-interest income was 174 million compared with 175 million in the prior quarter and up 16 million or 10 percent from the year ago quarter. We are particularly pleased with the broad-based growth achieved during the quarter relative to the last year, which reflects higher residential mortgage loan sales activity and growth in retail and business banking, commercial account, and wealth management fees. We continue to see attractive opportunities in capital markets and have strong pipelines going into the second quarter. For the first quarter of 2027, our outlook for adjusted customer-related fee income is moderately increasing versus the first quarter 2026 results of 174 million with broad-based growth and capital markets continue to contribute in an outsized way we currently expect results towards the top end of that range turning to slide nine adjusted non-interest expense was 558 million expenses increased versus the prior quarter driven primarily by seasonal compensation and were higher year over year reflecting increased marketing technology costs professional and outsourced services and higher incentive compensation we will continue to manage expenses prudently while investing to support growth our first quarter 2027 outlook for adjusted non-interest expense is moderately increasing versus the first quarter of 2026. based on first quarter performance and full year expectations, we continue to expect positive operating leverage for a full year of 2026 in the range of 100 to 150 basis points. Slide 10 presents trends in average loans and deposits. Average loans grew 2.4% annualized during the quarter, primarily within the commercial and industrial portfolio, and increased 2.5% year-over-year. Loan yields declined sequentially as benchmark rate cuts in the latter part of 2025 were reflected in variable rate repricing average deposits were modestly lower than the prior quarter by 540 million approximately one half of the decline was due to average broker deposits while the remainder can be attributed to seasonal runoff across business operating accounts early in the quarter importantly period in customer deposits increased by 1.3 billion or 1.8 percent from year end the cost of total deposits declined sequentially benefiting benefiting from both repricing and a more favorable mix within interest-bearing deposits slide 11 presents the five-quarter trend of our average and ending funding sources our total funding costs declined eight basis points linked quarter to 1.68 percent largely as a result of the aforementioned deposit repricing period end customer deposits grew 1.3 billion and short-term borrowings declined significantly as we continue to replace higher cost wholesale funding with customer positive growth and securities cash flows while also remixing into senior debt turning to slide 12 the investment securities portfolio continues to serve as an important source of on balance sheet liquidity and a tool to balance interest rate risk through deep access to the repo markets during the quarter principal and prepayment related cash flows from investment securities of 493 million were partially offset by reinvestment of 299 million they continue to pay down of lower yielding mortgage-backed securities supports earning asset remix or reduction in wholesale funds the estimated price sensitivity of the portfolio inclusive of hedging activity was 3.7 years credit quality remained strong as shown in slide 13. net charge offs were three basis points analyzed of average loans and the non-performing assets ratio declined to 48 basis points. Classified and criticized balances also declined during this quarter. The allowance per credit losses ended the quarter at 1.16% and remains well positioned relative to our risk profile with a 239% coverage of non-accrual loans. Slide 14 provides an overview of our 13.7 billion dollar commercial real estate portfolio, which represents approximately 22% of total loans. The portfolio remains granular and well diversified by property type and geography, with conservative loan-to-value characteristics. Credit metrics remain favorable, including low levels of non-accruals and delinquencies. Our capital position remains strong, as shown on slide 15. The common equity tier 1 ratio was 11.5%, flat during the quarter as earnings growth was somewhat offset by the $77 million in common shares repurchased and dividends paid in addition to the growth in risk-weighted assets. We continue to expect net capital generation through earnings and continued improvement in AOCI. Tangible book value per share increased 19% versus the prior year, reflecting earnings generation and continued balance sheet normalization. Slide 16 summarizes the outlook we've discussed across loans, net interest income, fee income, and expenses. This outlook reflects our best estimate based on current information and is subject to the risks and uncertainties discussed in our forward-looking statements.
This concludes our prepared remarks. As we move to the question and answer section of the call, we request that you limit your questions to one primary and one follow-up question to enable other participants to ask their questions. Julian, please open the line for questions.
Operator
Thank you. And once again, if you would like to ask a question, please press star 1 on your telephone keypad. A confirmation tone will indicate that your line is in the question queue. You may press star 2 to remove yourself from the queue. For any participants using speaker equipment, it may be necessary to pick up the handset before pressing the star keys. One moment while you poll for questions. And our first question comes from the line of John Pam Carey from Evercore ISI. Please see me with your question.
Good afternoon. Bye. Just on the margin side, I know your loan yield compressed about 14 basis points in the quarter. I think you had mentioned that it was largely a function of the rate cuts and variable rate repricing. I guess that link quarter change, was that all the benchmark rate change? Any other impact to loan yields in the quarter? And maybe if you can give us your new money loan yields just to give us an idea where originations are coming on the books.
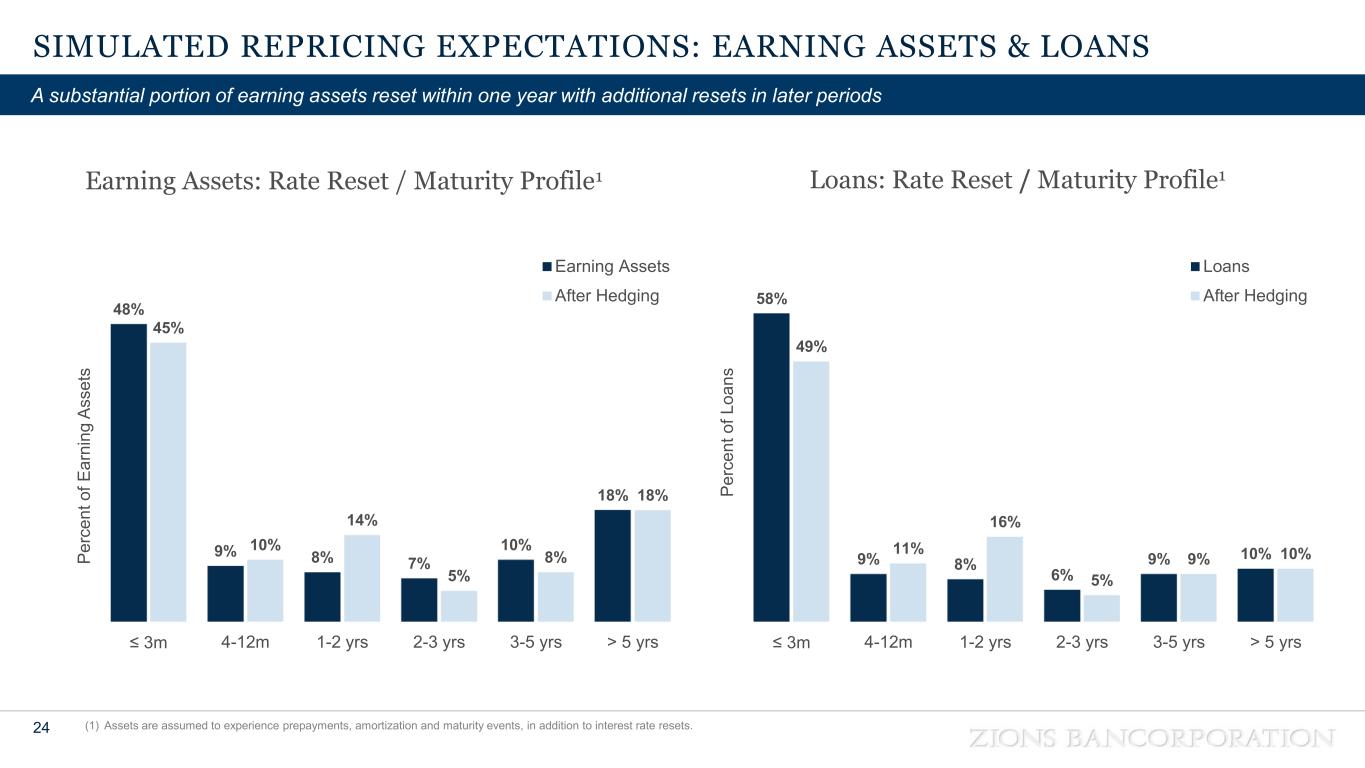
Hey, thanks, John. Really appreciate that. Yeah, so listen, I think you picked up on the main thrust of it. So we would have had some benchmark repricing and expectation of the rate cut that came in the middle of December and some that trailed thereafter and where we remain just skewing a little bit more on the asset sensitive side that that was the biggest contributor. In terms of the repricing characteristics of course we've got the nice materials in our appendix that I know you're familiar with but I think maybe the question that you're getting at on front book versus back book for the loan portfolio is really the most meaningful part of that as we sort of think about the trajectory moving forward is for those fixed rate loan portfolios, the things that have yet to reprice through, and there we're seeing a 72 basis point spread on the front book, basically the back book.
And then, I guess in terms of your positive operating leverage expectation of 100 to 150 basis points, that's for the year. And so what rate assumption does that imply? I know you mentioned if there's no rate changes, you know, consistent with the forward curve, your next 12-month NII outlook could come in at 7% to 8% above the range. Does that 100 to 150 basis points expectation imply the forward curve? And maybe if you can give us a little bit more detail in terms of that NII expectation.
Yeah, thank you for that, John. So, we, in the past, we've brought a view of kind of latent and emerging. It's less interesting this quarter since we, there's not much to talk about in the forward curve in terms rate changes that were implied at least at the quarter end. So those were kind of right on top of each other. So we were able to firm up our guide for the full year. As you sort of think about the trajectory of that, where we normally guide on a one-year or four-quarter basis, we believe you'll see there's a much more powerful positive operating leverage, probably not unlike what we've seen this quarter relative to last quarter, where And Harris' quote in his remarks, you will see positive operating leverage of 270 basis points. So we think that as our repricing plays through from the investment securities into loans, as we have less of those headwinds associated with our terminated swaps, some of the other things play through, we do see really good prospects for one year, fourth quarter. Last year when we were with you, we were anticipating as part of our sensitivity and our guidance that we could have had rate cuts. I think we were anticipating in June and September. And based upon the forward curve, those are now off the table. So having no cuts is embedded into our full-year positive operating leverage guide.
All right. Appreciate it.
Operator
Thank you. And our next question comes from the line of Manan Gosalia with Morgan Stanley. Please proceed with your question.
Hi, good afternoon. On the deposit cost side, deposit costs, I guess they came down quarter on quarter, but they were pretty flat relative to the spot rate as of December 31st. And it looks like the spot rate as of March 31st has moved lower again. So can you just help us connect the dots on the trajectory there? Maybe give us an update on deposit pricing and competition, and also what you're expecting in terms of CD rolls coming up.
Hey, thank you for having on, and we'll try to unpack that in places and invite my colleagues to jump in as well. Listen, I think, and I've seen the questions come in other calls in this earnings cycle about where do deposit costs go if rates kind of stay static here for the remainder of the There's still some trailing activities, some repricing down on term deposits, thinking about customer time deposits that we have to play through so you know that would definitely be an element of this you will have heard us talking increasingly a quarter-over-quarter and when you catch us and at conferences about some of our strategic initiatives we think that those are gonna be really valuable to us and driving deposit balances as well so you hear you heard Harris talk about in his prepared remarks the gold account the business beyond there's a lot we've talked about with SBA lending that brings deposits with us. We think that's useful. There's some other work we've been doing around wholesale deposits with customers relative to other sources of wholesale funding that we think can defray deposit costs moving forward. So, while we don't have explicit deposit guidance and we don't explicitly guide towards deposit costs, all that would be embedded into our, I believe, to be very constructive for your NII guidance. And I think there's a deposit the competition comment there, too.
Speaker 1
Right. Yeah. Manon, this is Scott McLean. And I would just add to that that this deposit campaign we've had going on to bring some of our off-balance sheet deposits back on balance sheet, you know, we've had anywhere from $7 billion to $12 billion in off-balance sheet deposits. And it's really just a client decision as to where they want to sit. but we've been successful at bringing more of those back on balance sheet at rates that are attractive. They're accretive versus broker deposits and overnight cost of borrowings. At various points of time, we focused on that. And so we've been very successful at bringing those deposits back on. And all of it is, oh, I would say 25 to 30, 35 basis points accretive to broker deposits. You'll see us continue to do that. And, you know, in terms of deposit costs in general, it's, I'm not sure I've ever seen a time when it wasn't real competitive other than maybe 2020 and 2021. So, but we, all of these, almost all of this are relationship deposits that we're bringing on. And it's not just coming from off balance sheet. Quite a bit is coming from new clients or existing clients that we didn't have their deposits to begin with.
Got it. I appreciate the color there. And then maybe on the buyback side, buybacks were up this quarter, but the CET1 ratio was still relatively flat as you accrete more capital through earnings. So maybe if you can talk about the level of buybacks that you think you can do for the rest of the year, especially as you narrow the gap with peers in that CET1, including AOCI ratio?
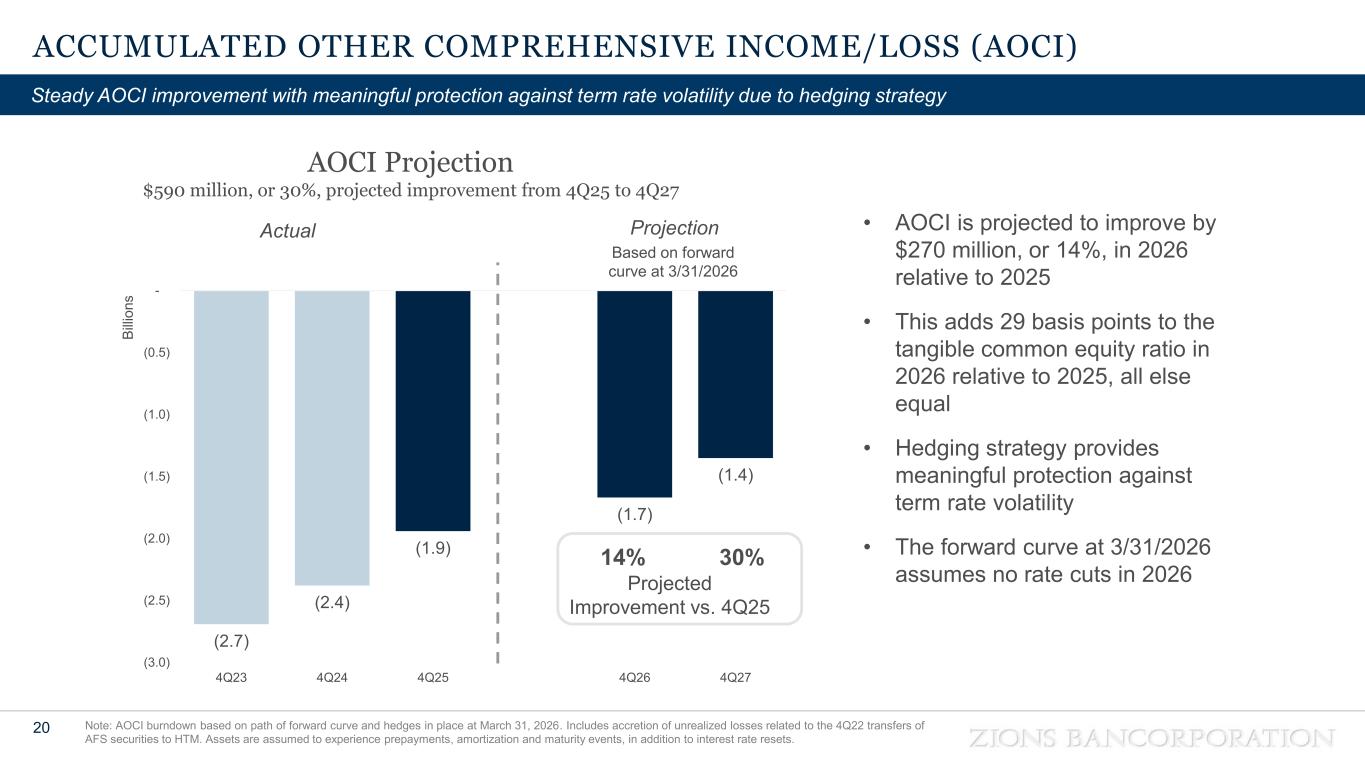
Manon, thank you. I think you said that very well, because our nominal CET1 ratio has been kind of hanging in there. And as we said before, we see the path for AOCI coming in. It's becoming unreasonably predictably over time, and something that's really contributed to our kind of outperformance on tangible book value add year over year. So, I think those all things are are encouraging. We've also taken note of the Basel III in-game proposal, as others have noted in this earning cycle. There's some good things in that proposal for us and others in terms of what it would imply about RWA moving forward. So, I never like to get in front of our board, ahead of our board. That's usually a pretty poor practice for management. But it looks like that we could be in a position to talk about share of purchases moving forward responsibly as our board will allow and as regulators sign off. As Harris mentioned during his remarks, we're really, really excited about the acquisition of the multifamily agency program that's still pending, it's pending regulatory approvals. You know, should that see all the way through as we expect, not knowing the timeline for all that and not trying to predict any of that, that would be a source of consuming capital. But there's some other things that are happening in the environment, including things like Visa exchanges that could be considered by our team as well. So that's a long-winded way of saying I think the prospect of share of purchases are still on the table, subject to board approval.
Operator
And our next question comes from the line of Dave Rochester from Cantor Fitzgerald. Please proceed with your question.
Hey, good afternoon, guys. Hi, Dave. On the guidance, I know we shifted back to the one year ahead quarter over quarter look. I was curious how you feel about the annual guide for 26 you gave last time. It seems like, given everything that you're saying together, you would still feel pretty good about that and maybe with a little bit of upside. Is that fair?
Dave, I think that's a reasonable observation, particularly given my earlier comments here about having those two rate cuts off the table that we would have been talking about last Definitely, I mean, we don't make a practice of doing this all the way through the year, but firming up that, you know, the things that we talked about last quarter are better.
Yep. Yep. Sounds good. Maybe just as a follow-up on the loan outlook, I was wondering how things were shaping up in 2Q at this point. How does the pipeline look overall heading into the quarter versus, you know, where you started, you know, at the beginning of the last quarter? And what are you seeing on the C&I front that has you excited? and maybe if you could talk about the little bit of a pullback on the consumer side, that'd be great.
Speaker 9
Thanks, Dave. This is Derek. You know, the pipeline's looking healthy, actually, at this point. We're seeing lots of activity in small business, middle market, corporate banking syndications, just general C&I, we're just seeing lots of activity. Another thing that's coming back is we're seeing increased CRE activity. We're cautious there, but we are seeing increased activity as some of the markets have reached more stabilization. And so I think we'll continue to see growth coming from those areas.
There's probably pricing pressure on CRE. I mean, I hear our people talking about, you're seeing as much pricing pressure in CRE as they've seen for some time.
Speaker 1
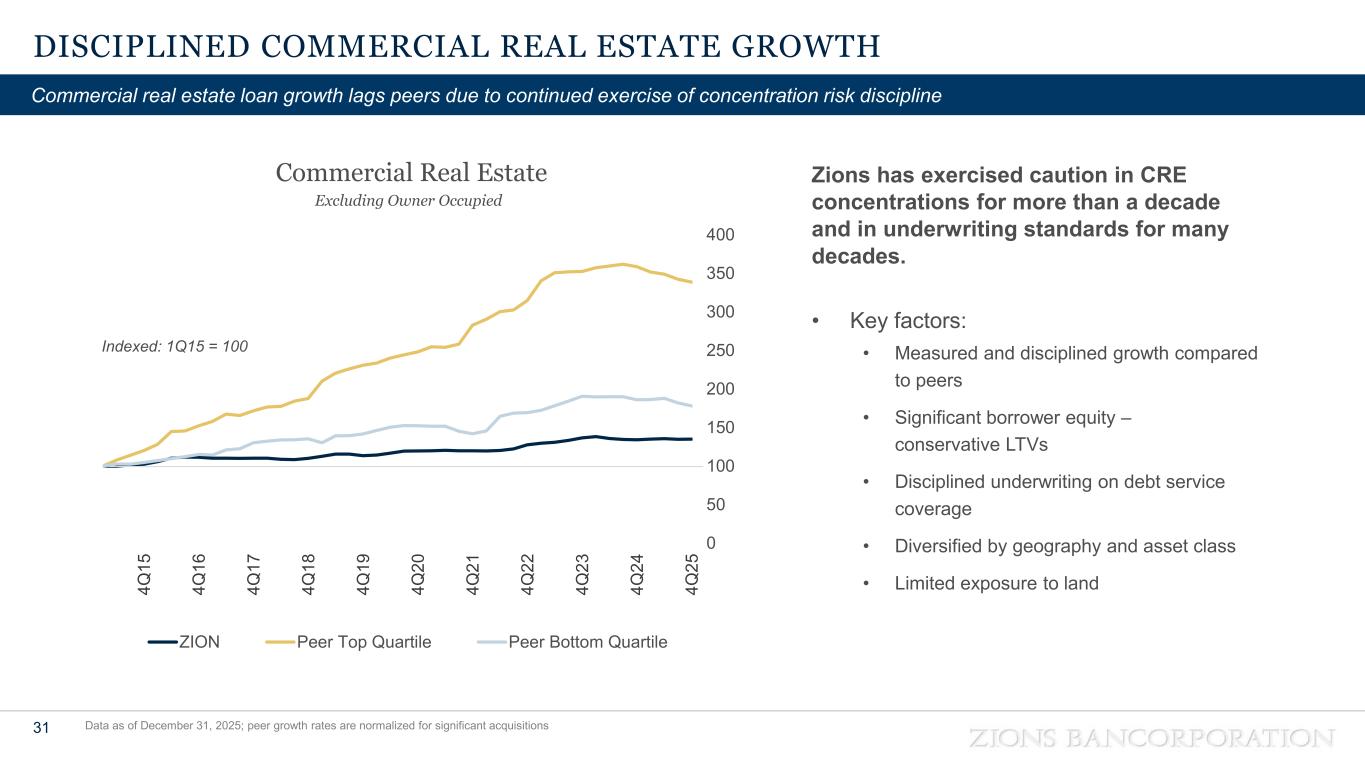
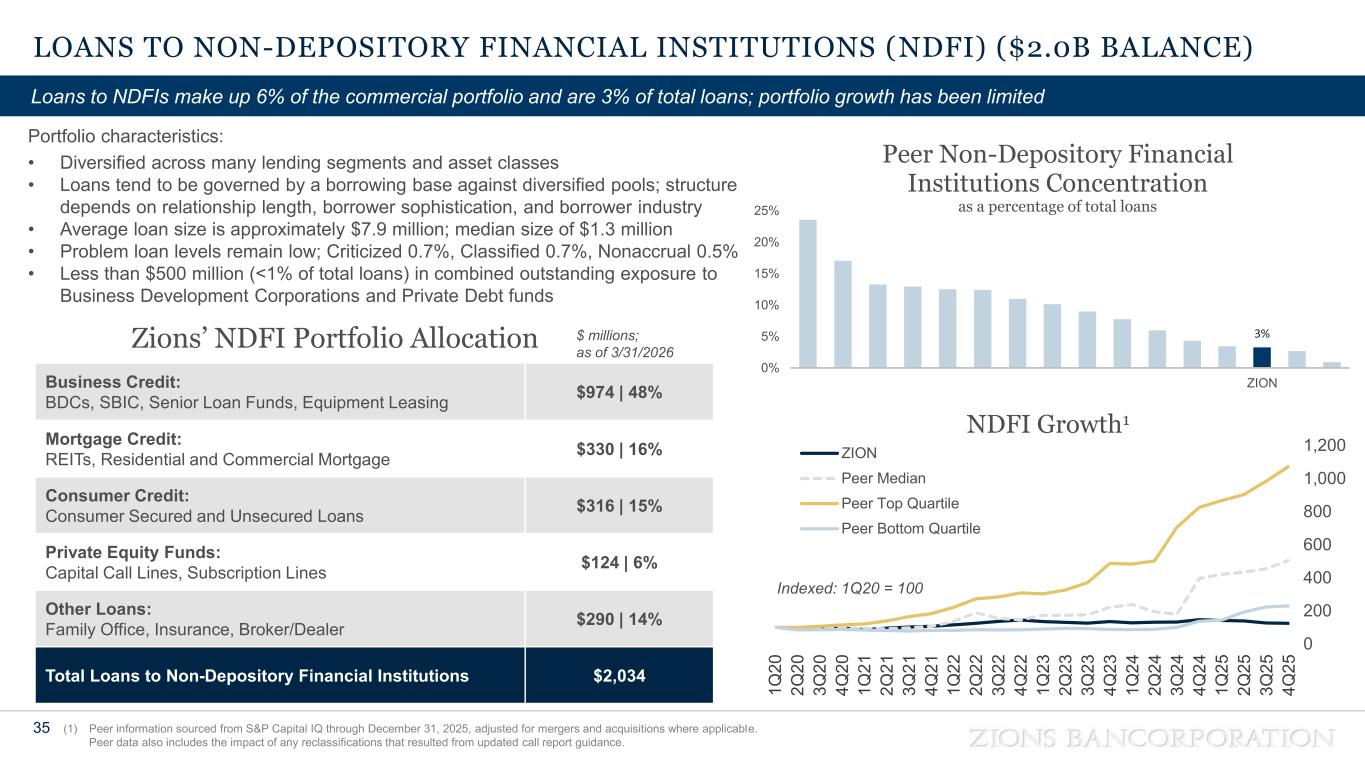
Dave, I would just add also, and I made this comment at the RBC conference back in early March, that I think investors increasingly really need to peel back the onion on the type of loan growth that banks are producing. The NDFI kind of issue that has sprung up has just, I mean, there are massive differences in banks' reliance on NDFI growth. It should be a good asset class for many, many reasons. Managed responsibly, as you know, for us, as we report, it's about $2 billion of our portfolio in outstandings and has not grown in five years. and you can see that our peers and banks smaller and larger are pretty much gulping down these loans, just as there has been a difference in CRE growth. And so I think what investors, if they'll really peel back the onion, will find that if they're worried about NDFI, if they're worried about rapid CRE growth, if they're worried about personal unsecured lending, That's not us. So, again, I think it just requires a little more investigation of the topic.
Operator
And our next question comes from the line of Bernard von Gesicki with Deutsche Bank. Please receive the question.
Hey, guys. Good afternoon. I know we were talking about the positive balances earlier. You had a nice pickup in the non-interest-bearing deposits of about $1.3 billion versus 4Q. I believe the migration of the legacy gold accounts was done last quarter. But, Harris, you mentioned the rolling out of the companion offering for small business customers beyond the business. Just what drove the sequential increase and any color you can share on customer acquisitions on the gold and beyond the business accounts for the quarter?
Yeah, so first of all, I'm dyslexic with this product. It's actually Business Beyond is what the product is called. I can't read my own words here on the front page. But the Business Beyond, this product suite, it's too new to have had any impact in the first quarter and won't have much in the second. Uh, we, we rolled it out in Arizona and Colorado beginning on March 26th, but, uh, the early reaction to it with a very limited sample of, you know, I, it's, uh, it's the first really new product offering we've had for small businesses for quite some time and it's being really well received. and so I you know I'm I'm excited about the prospects for it but we'll be rolling it out across the rest of the organization and later in May and now it'll it'll be kind of in the third fourth quarter before we start to understand what the impact might be on the gold account you know the first quarter I mean we again we started rolling this out in the second half of last year and really its whole impact started to come kind of in the fourth quarter we've in terms of new account activity we opened about 4,000 new accounts in the first quarter and you know I'm hopeful that we'll see that kind of ramp up to kind of 20,000 new accounts for the year what we're seeing is over time um you know the the total relationship balances are uh somewhere around a hundred thousand dollars and you know it's not not immediate but it's kind of we're seeing that accounts build up to that and so anyway we we think that this is a really um great uh opportunity for us. And we have a lot of energy and we'll be devoting a lot of marketing to it. So it's, you know, still early innings, but I'm hopeful that that will really contribute to not only a well-priced deposit base, but one that's granular and really sturdy with the kinds of customers that we can do a lot of business with.
Great. Thanks for that, caller. And just on capital markets fees, the 28 million, you know, slightly higher year-over-year, but down 9 million versus a strong 4Q. Just anything to call out during the quarter? And, you know, Ryan, I think you called out the strong pipelines and capital markets going into 2Q. So, if you could just unpack the quarter and trends you're seeing right now.
Speaker 1
Yeah, this, Scott, I'd be happy to do that. You know, we had a, it was a tough quarter to compare against last year because of a really large M&A transaction fee that we reported on. So we were delighted with the quarter as it ended. And really, all of the businesses continue to show, you know, good opportunity. In the first quarter, we saw real strength with our syndications and our interest rate hedging businesses. And also with a new commodity hedging, oil and gas hedging practice that we started in the third, fourth quarter of last year, we think it has the potential to generate, I don't know, $7 to $10 million a year in revenue, and we're just getting started there. So, but it's basically that business is positioned against about 80 of our energy reserve-based lending clients. We've already had about 30 of those, 30, 35 transact with us on this interest rate, this oil and gas hedging activity. And so I think between syndications, interest rate hedging, our foreign exchange business, commodity hedging, our real estate capital markets business, it was a soft quarter for them. But the second quarter, that can kind of ebb and flow. They're still very confident they're going to have a real solid second, third, and fourth quarter. In our M&A business, again, which is sporadic, we've invested quite a bit in new colleagues there, and deal flow looks good. So it's been a high-growth business for us. We've made a lot of investments there, and we don't anticipate it will disappoint this year.
Great. Thanks for taking my questions.
Operator
And our next question comes from the line of David Ciaverini with Jeffries LLC. Please proceed with your question.
Hi, thanks for taking the questions. I wanted to go back to you alluded to the Basel III endgame benefit of a, you know, it sounded like a modest net benefit. But are you able to quantify what that benefit could be for Zions?
Hey, thanks for the question, David. I'm happy to provide some color there. Listen, we're still working all the way through the process, but our scoping on the standardized approach would suggest some RWA relief, as others have reported. Right now, we would size that between 9 to 10 percent of RWA relief, which would contribute all else being equal about 93 basis points to common equity tier one. We are still studying the ERBA, just to understand the puts and takes there with the risk sensitivity compared to the operational risk RWA. So, So probably more to be said there in future quarters. As you know, we've been sort of talking capital, both non-only and including AOCI, and by formalizing AOCI into the standard moving forward, albeit with a pretty lengthy phase end. Of course, that cuts the other way, but we've already been operating as though AOCI is something that we're cognizant of in setting our capital glide path. So hopefully that helps.
Yes. Thanks for that. And then you alluded to pricing pressure on the CRE side. Could you talk about the CNI pricing environment?
Speaker 9
This is Derek again. I mean, while the activity levels are healthy, it certainly is a competitive market out there So, we're seeing some price competition, but, you know, it's not significant, but it's something that we're definitely very aware of.
Operator
Thank you. And our next question comes from the line of David Smith with Truist Securities. Please proceed with your question. Hey, good afternoon.
Aaron, can you please talk a little bit about where you're spending the most time managing credit today? Obviously, you know, it's a really strong quarter with just three basis points in that charge-offs and 3SIs, non-accruals, pretty much all the forward indicators all trending down versus the fourth quarter. But, you know, to the extent that you're seeing problem or areas of concern in the portfolio, you know, where those might be and, you know, what trends you're seeing specifically for those sub-portfolios?
Speaker 9
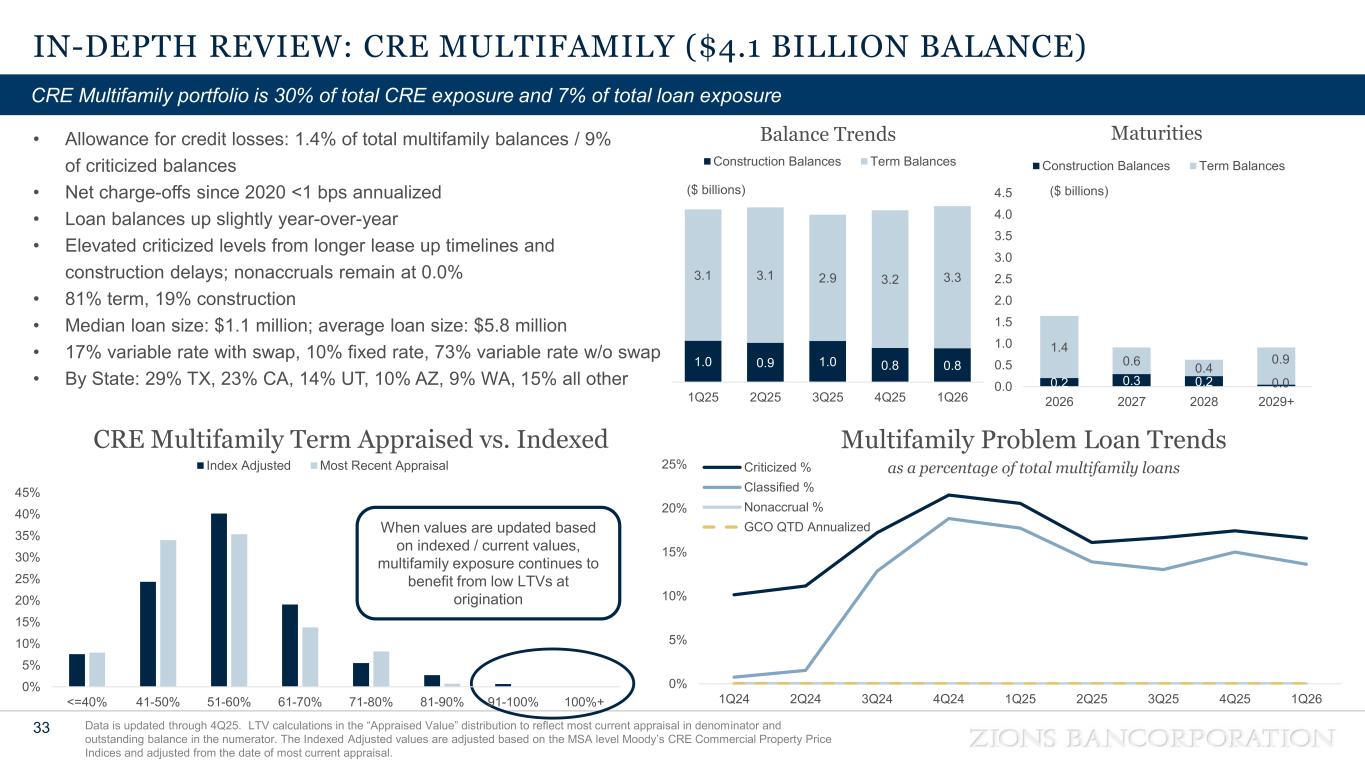
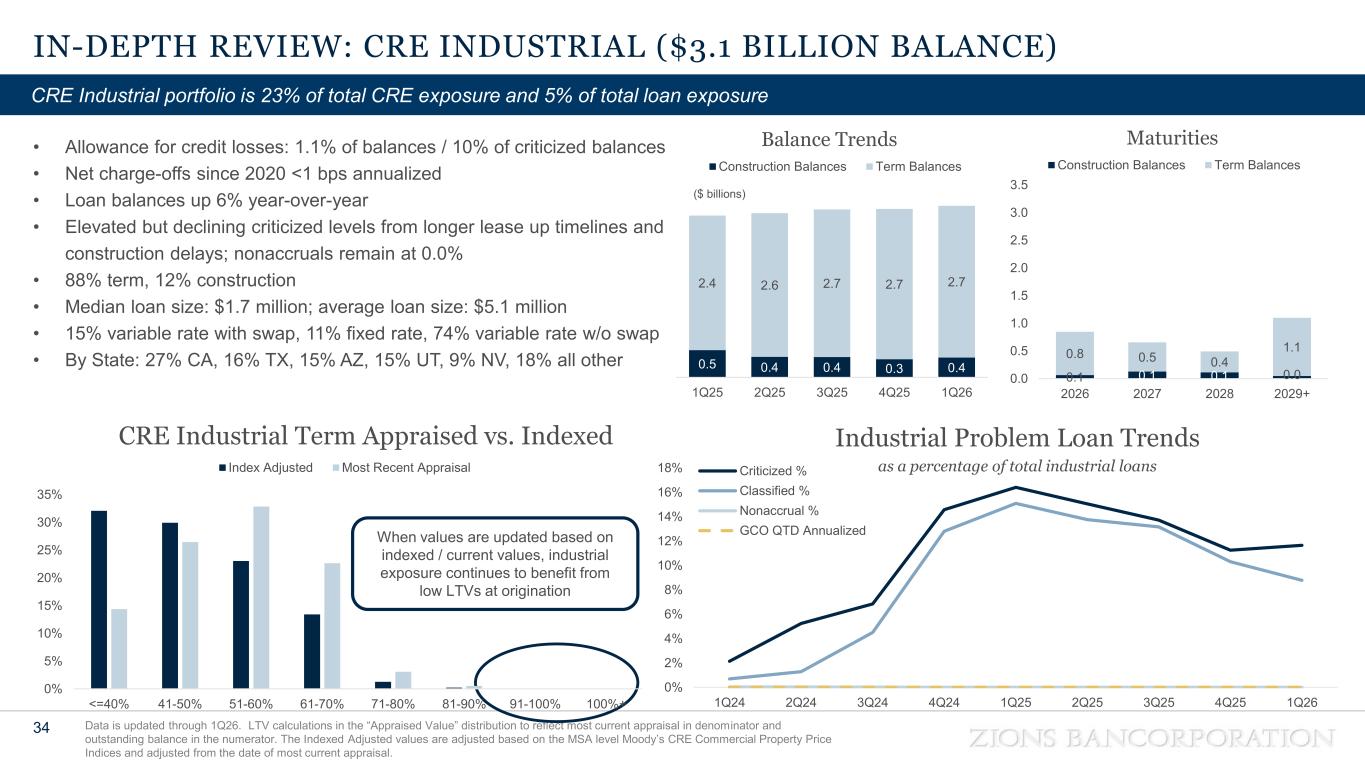
Yeah, thanks. Thanks for the question. Overall, we're continuing to see improvement in commercial real estate, as you can see from the numbers of criticized and classifieds and nonaccruals continue to decrease there. If anything, we're focused on the commercial industrial space. It's actually year over a year our criticized and classifieds have improved there, Saw slight increase this quarter, but that's the area where we're paying the most attention. We are not seeing a lot of impacts from tariffs or from the events in the Middle East at this point, but watching really just focus on some just increases to expenses in certain areas such as restaurants and consumer-focused businesses, that seems to be, you know, what we're watching the most these days.
Do you have a sense of how long oil prices might have to be elevated before that plays through more broadly with some of your industrial client base?
Speaker 9
Yeah, that's a great question. And the forward curve on oil right now is going out a year, you know, at a little higher level, but it starts to drop actually pretty fast. And by next year, it's back to a lower level. So we'll just have to watch and see where the where the curve goes.
Operator
All right. Thank you. Thank you.
Operator
And our next question comes from the line of Ken Musden with Autonomous Research. Please proceed with your question.
Hey, thanks a lot. um hey Ryan can I just um ask and follow up on the NII comments when you mentioned the 78 percent growth with no rate cuts were you referring to the full year 2026 commentary or were you referring to the 1Q27 over 1Q26?
Yeah for our NII guy that's the reporter view is how we how we guide that um so you know at that certainly at the upper end of moderately increasing and with we think the ability to overachieve if rates hang in for us.
Okay got it and I just wanted to make sure because it was a little bit back and forth between talking about like the full year versus the standard guide. So it's on the standard guide. Okay um and then yep and then on the um as you go forward you know the earning asset base has been pretty steady for the you know for the last couple quarters and as you kind of have reworked the mix of the balance sheet from here do we start to see more AEA growth or is the benefit that you get from NII going to come more from the margin expansion from here? Thanks Ryan.
That's a very fair question Ken because you're right I mean if you look year over year average earning assets are kind of hanging in around these same levels and so the loan growth that we're seeing has sort of been offset by the average investment securities and money market funds. Listen, one of the things that we're probably getting closer to, I talked about in my prepared remarks, the reinvestment that's occurring for our investment securities where we've still been allowing a decent amount of that to flow over to paying for loans or paying down wholesale funding. We're getting close to the point in time when we will think about reinvesting fully just to make sure we keep the same comfortable headroom, our liquidity measures and the like. So, but, you know, if you see in our guide, we certainly expect for loans to build from here, and you all, I think, are very attuned to where we expect to see that. One of the things that maybe could be potentially a little bit lost in the message this quarter is we had a really nice loan fee result. You'll see that, and that was on the back of some of the things that we said we were going to do. Part of our strategy was saying, hey, going forward, we want to do more health for sale activity around residential mortgage loans. And that showed up in this quarter. So we had a pool in excess of $500 million that we sold out, the boat that would have otherwise been part of our story for loan growth. Another thing that we haven't yet featured on this call but would be in the earnings release is we did roll out an accounting change this quarter moving forward on the netting of derivative assets and derivative liabilities and cash collateral and things associated with that. And that would also have sort of a knock-on effect on some netting down of some loan balances to the tune of about a $100 million difference. So I acknowledge that our loan growth looks modest, but there were some other pieces in there that were they in our base results would have looked like a stronger loan growth story. So moving forward, it's going to be both. Along with the answer, it's definitely going to be a margin expansion and growth in average earning assets.
Yeah, I just add that I, you know, the consumer book, the one to four family residential jumble arms, you know, I'd expect that that'll remain flat to kind of drifting down over time. We're just trying to remove some of the risk in a world where, you know higher rates may be the norm and and so some of the convexity risk there so really trying to focus more on the tell for sales you know you know turning that activity into more fee based activity so that'll be a little bit of a drag but I you know we think that we'll see no moderate low growth despite that okay thanks for the color yep thank you and our next question comes from the line of Peter Winter with D.A.
Operator
Davidson. Please proceed with your question.
Thanks. Good afternoon. I was wondering, with the outlook of the income coming in at the upper end of your range and you continue to make these investments, which are clearly working, would you expect expenses to also come in at the upper end of that range of model E increasing?
And I'm sure it would. There are others left with that to say. But, you know, my spoken remarks, I purposely kind of guided towards the upper end of the range and NII and fee income. I'm glad you picked up on that. I didn't do that for expenses. So, we'll see. But, you know, for where I sit here today, I think it's a reasonable guide just as it is. You know, I wouldn't guide the upper end or the lower end. I just, you know, leave the degrees of freedom within that.
Speaker 1
I would just add that most of the broad-based growth we're seeing in fees now is, I mean, capital markets, we clearly have invested a lot. The others, we're not having to, the incremental investment is not that significant. We're just, I think we're seeing a lot of our sales practices, you know, flowing through. I think we're seeing our call programs are stronger, and this is the best broad-based growth we've seen in a long time.
I just thought with the growth in the fee income, also maybe higher incentive comp as That's why I was thinking about it.
Speaker 1
Well, that's true. That's true, and you can see that a little bit in the first quarter.
But it's in the context of a $2.1 billion expense number. So it's not going to move it materially.
And then just if I can ask a separate question, but with these growth initiatives underway, is there anything tangible that you can point to that, you know, the investments that you made in the future core to modernize the core systems, has that been additive to your growth or helping attract more customers just given, you know, we're seeing some nice organic growth from you guys. And I'm just wondering if future core is playing into that.
I think, you know, yes, although it's, you know, I think it's hard to quantify exactly, but it's helping us just get things done faster. I mean, customers don't choose a bank because of your core system, especially the lending side. I mean, they're looking for execution and price and relationship, et cetera. But it's giving us – I mean, I go back in time. We did an exceptional job during the whole PPP thing, and that's ancient history now. We couldn't have done it without this new core. um we you know we were quickly doing a you know the real land office business and ppp uh with a great process so it's that that's just an example of how it's allowing us to to get things done faster well and the the other a couple other points i would add is the the the real-time data and the fact that all of our loans and deposits are on one data system again And that doesn't, you know, that doesn't send tingles through clients' minds.
Speaker 1
But in a data-driven world, it's absolutely critical that it be accurate. And we, it also, we said on our last call that we were close to closing a transaction with TCS to bring their Quartz, that have a product called Quartz that is a tokenized deposit stablecoin application. And because we're on their platform, the ability to start innovating with tokenized deposits or stablecoin is infinitely cheaper than anybody else trying to do this. And so we think it's going to be an interesting way to compete way beyond our size in that arena should we choose to. We've not announced that we are, but we've got a platform that we would not have had if it had not been our core conversion.
Operator
Thank you. And our next question comes from the line of Janet Leigh with TD Count. Please see if there's a question.
Good afternoon. Just to go back on your 7% to 8% NII growth, assuming no rate cuts, is it fair to say that that assumption is baking in moderately increasing loan growth, so call it mid-single digit or so, but that would also imply a pretty meaningful step up in net interest margin expansion throughout the course of 1Q26 to 1Q27 in order to get to the 7% to 8%.
Yeah, I think you're right about that in terms of, you know, allowing for loan growth to be embedded in that figure and margin expansion. We don't guide, that hasn't been our practice to guide on margin, but we see ample opportunity to expand the margin throughout the course from this point in time to that point in time many years hence. So both of those are encompassed within our guide.
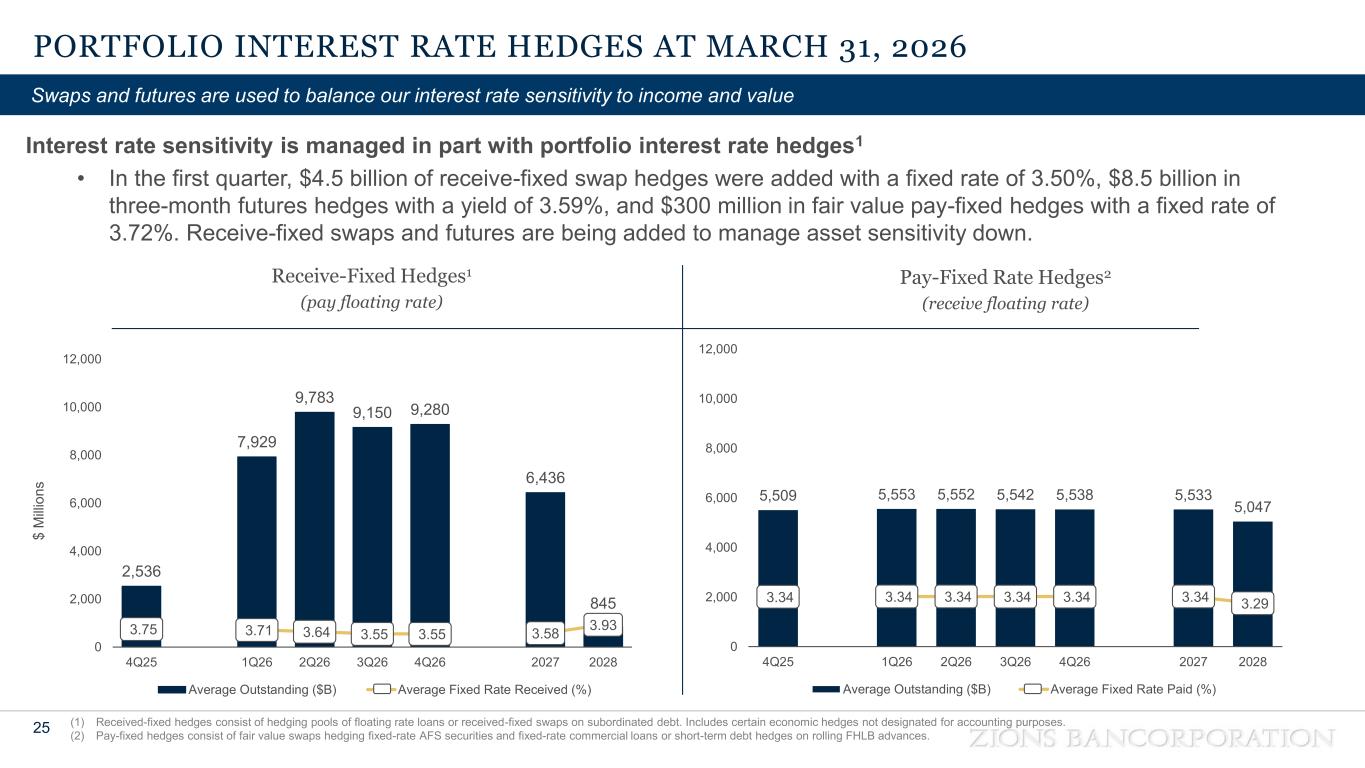
And I can, I can rehearse all those different contributing factors if you think, but I give you the short form answer. I would take that. So yeah, listen, I think there's, there's different things that are playing through and you've heard us probably talk a little bit about this before. We do have that the latent effect of those six asset repricing that has yet played through. There's still some sizable books that have longer repricing kind of patterns. So if you think about things like muni, if you think about owner occupied, if you think about some one to four family resi, so all that together with things like those headwinds for those terminated swaps. This quarter we had about a $10 million headwind. Through the fourth quarter this year, it goes down to about 5 million we've got some disclosures in our 10k that talked about that all those things blend to an improvement in earning asset yields you know kind of one year hence and along the way we've sort of sized that about the two to three basis points improvement in raising yields we are doing some um roll off of our investment securities portfolio to other gainful places like loan growth and paying down wholesale sources of funding we size that as a one basis point kind of of pre-determining assets. So it's that together with a little bit of a taper of things you have to play through and repricing down of term deposits are all things that contribute to a better NIMH story moving forward.
Got it. That's very helpful. And your 150 basis points POL for 2026, you seem very comfortable achieving it in a no rate cut scenario.
I would, is it fair to assume it's still the case if we were to get a, change and if we do end up getting a rate cut or does it get more challenging uh i mean listen we were prepared with something that was analogous to that last quarter where we were seeing two rate cuts so i wouldn't necessarily back away from that i would just say as with all things it'll all depend on our success and driving through those lower cost funds and our composite growth through the course of the year that's our biggest biggest variable and not knowing day-to-day week to week what the board markets are going to tell us, I just feel like we're at least as good or better placed than we were last quarter.
Operator
And our next question comes from the line of Anthony Ellian with JP Morgan. Please proceed with your question.
Hi, everyone. On M&A, last month you announced the acquisition of the agency lending business from Basis, right? Last Last year, you acquired four branches in the Coachella Valley. Harris, are these the types of acquisitions we should expect going forward, or would you cast a wider net at some point, inclusive of bank acquisitions for what you would look at?
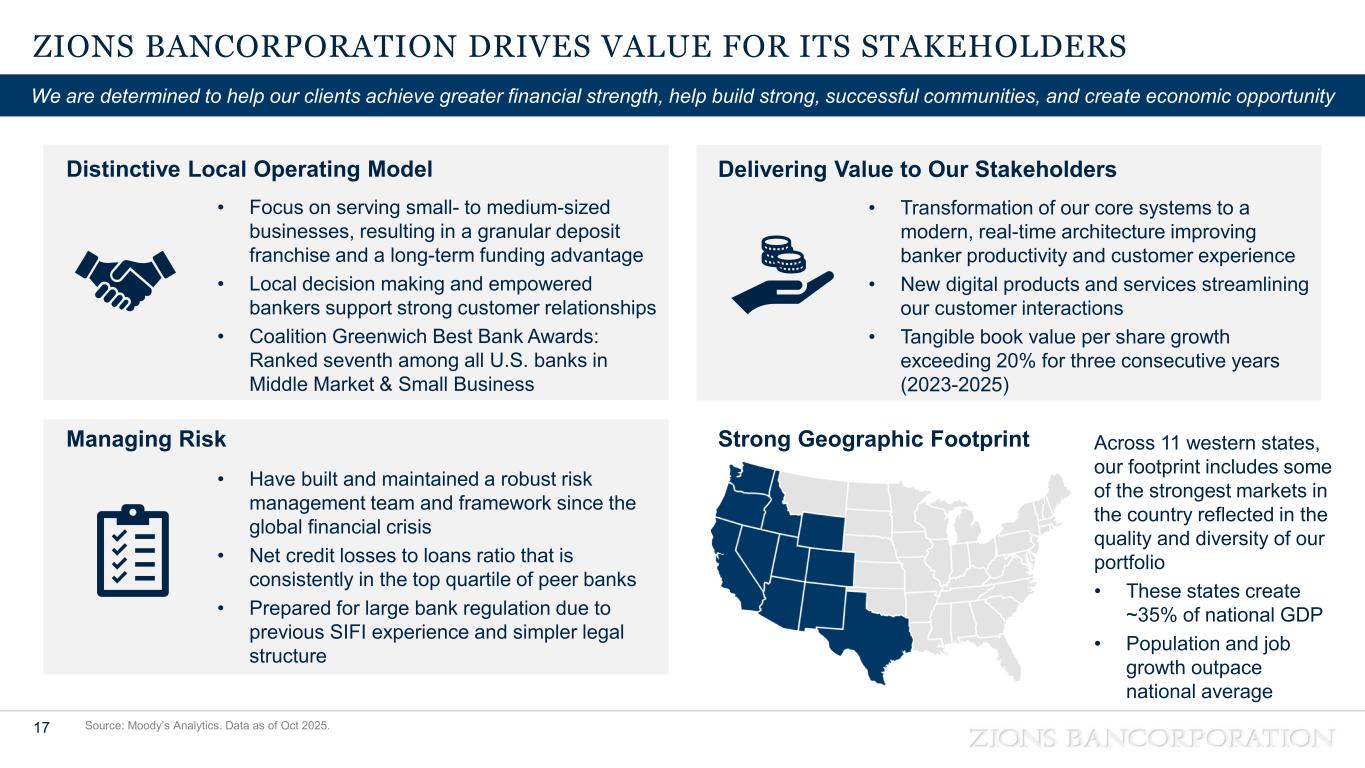
Well, the first thing I'd say is it's not so much that we're casting a net. We're waiting for fish to swim into the pond that we are comfortable with. I we're not we're not we're not out looking to try to you know to it's not an objective to to do M&A to grow I've been pretty consistent about that but I but but as you know as we see opportunities we ask ourselves the question is it a good fit strategically is it is it something that strengthens the franchise and you know it's all about price at the end of the day too and so you know we we'd be opportunistic about it and I think both of these kind of fit that the these agency relationships the the Fannie Freddie business we've been talking about here that's something that is something we have been looking to do we we live in a part of the country where you have a combination of a reasonably young population, a high cost of housing affordability, all of that creates demand for more multifamily over time. It's about 80% of the population of the nation is taking place, you know, through the Mountain West, Southwest, etc. And so being able to be a one-stop shop for developers of multifamily product fits really nicely into the capital market strategy we have and fits nicely with the real estate talent we have in-house to originate that kind of product. So I would expect that anything we do would have kind of a story to it in terms of how it fits with a strategy of becoming a stronger presence in the Western United States.
Okay. And then my follow-up on On deregulation, so, Harris, you addressed this in your annual letter. We had the capital proposals a few weeks ago. I know we have the comment period now, but I'd like to get your thoughts on if you think those proposals are largely sufficient or what more you'd like to see from those proposals.
No, I think we're pretty pleased with what, you know, I, you know, one of the things, And what I said in the letters, you know, the pendulum, what happens is you get a crisis and a reaction. And that's the history of bank regulation and the statutes that are passed to turn that into law. And what happened in the wake of the passage of Dodd-Frank was there were a lot of things that I think that with the benefit now of looking back over the last decade and a half, regulators, sensible people looking at this would say, okay, some of that was actually really useful and needed, necessary. and some of it is uh overkill and from my perspective i think i think the current uh cast in place and the agencies is doing a really nice job of trying to say let's let's focus on the basics because the risk is you get uh so involved in the thick of thin things that you miss the main event and I think that's one of the things that happened you know with the bank failures of three years ago you know things that are kind of hiding in plain sight that wasn't about some of the I mean everybody the industry is actually pretty good at self-regulating I mean after you've been through the great financial crisis you don't need to be told a lot about how adjust your portfolio to make sure that doesn't happen again and yet that's kind of where the system tends to pile on and and so you know a lot of things were done in terms of you know ability to repay qualified mortgages and everything that is it's it's part of the housing affordability problem we have today it's just more expensive to get a mortgage for example I think they're trying to be sensible about how do we how do we get back to kind of a center point. And so I'm actually quite pleased with what we're seeing.
Operator
And our next question comes from the line of John Arkstrom with RBC Capital Markets. Please receive your question.
Hey, thanks. I wanted to ask you about the agency businesses, but I think you cleared those up, Harris. But that's just P&L. It's not really use of balance sheet on those businesses.
Is that correct yeah yeah yeah that it shouldn't use i mean we'll use the balance sheet for the origination of the deal the construction the stabilization but you know uh almost yeah without fail uh our customers are developing this kind of product uh they they need a long-term takeout and so it just allows us to be in the stream for that one way of maybe stitching together harris is a very good response to the regulatory environment and if there was anything on the wish list.
Going back to Basel III in-game, you know, getting some more risk sensitivity on the commercial loan side of the business would be helpful. It looks like they may have MSRs in scope of things to at least nominally reconsider, getting away from the dollar for dollar exclusion above certain levels and maybe rethinking the risk weighting. For this type of business as agency, multifamily business, there will be some MSR generation that would come from it.
So we'll have to see where that falls out good good points okay yeah i know they're rare licenses and very valuable so that'll be good um scott maybe just to um go back on lending energy and lending appetite just curious how you're approaching the business with so much volatility and then can you touch a little bit on the texas or amigee cni growth and what's driving that thanks Sure, John.
Speaker 1
On the Amogee side, I'll take the second one first. They had really strong loan growth last year, really broad-based C&I growth, and their CRE is holding in there. Energy really did not grow much last year for them. They are seeing better growth in smaller businesses. Principally, they've played more in the middle market, kind of the middle of the middle market and the upper end of it. But just good progress there. Their call programs are great. The bank in the Metroplex, their activities in the Dallas-Fort Worth Metroplex and in San Antonio are doing well. And so they just have a lot of momentum that they brought into this year. And I know they feel very optimistic about leading the way in terms of loan growth for the company this year, too. On the energy side, holy cow, we've been sitting at $2 billion and outstanding for a long time. And we would love to see that grow. The credit metrics, the pricing metrics have never been better, as probably 40% of the banks that play in the reserve-based lending, what I would call middle market of energy lending, about 40% of the banks that used to have exited. And a lot of this business is originated by private equity firms that we know extremely well and have decades of experience with. And so, and the way we do it, we have about 75 reserve-based loans. So these are highly secured. They modulate based on pricing. And they, you know, that has done very well through many cycles. What didn't do well was financing oil field service companies. We have long since reduced our engagement with those companies. It's about 12% of the buck now. It was as high as 35%, 40% at one time. So that was decades. It was 15 to 18 years ago. So anyway, I think we've got the portfolio structured right. The midstream side of the portfolio is very good. And we have a great energy lending team. They're widely recognized across the industry as being pros. And adding this oil and gas commodity hedging activity just has been terrific. And we'll see a lot of strength from that because our clients want to do business with us. So anyway, I'm optimistic about it. And, you know, if that business grew 10% a year for three or four years, we'd be, you know, really happy with it. We had outstandings of $3 billion, you know, some years ago. So it's the level that, you know, we're not afraid of the level. We just need to see the activity.
Operator
And our next question comes from the line of Chris McGrady from KBW. Please proceed with your question.
Harris, on AI, could you speak to perhaps a near-term opportunity for the company, but maybe over time, any risks you see out there on the revenue side?
Sure. I mean, we have a variety of things going on with, you know, where we're using AI. I don't suspect we're particularly different than most other peers this way, other than the fact that I think we have, going back to the core replacement project over the last decade, I mean, it forced us to do something that I think few others were forced to do. And that is that is to dramatically focus on the quality of data and its organization. You know, so I tell people, you know, we cleaned the house before we moved into a new house. We threw away a lot of the junk. We organized things. And that's proving to be I think that's going to really prove to be useful in terms of speeding up our, you know, the delivery of solutions. the kinds of things we're using it for, I mean, just examples, we're using it for things like appraisal review, all kinds of document review, contract review. We're using it in our credit exam or credit review function to expand the population of deals that we're looking at and to basically, instead of having people finding needles in their haystacks, people are now looking at the needles that we find with other tools um and so the i mean use cases go on i i you know people are looking for savings through technology i was i came across something earlier today i i was looking i came across just our head count back in in 2008 and i was it was 18 years ago there's nothing magic about the year except that you know our our head count is down 20 percent And our, you know, back then we were about, you know, $54 billion company. You have to, you know, inflation adjust that. But even with that, I mean, it's about a 25% improvement in productivity for dollar real assets. And AI is, you know, becoming a part of that. So my view is that AI isn't, you know, it's a new shiny object, but a lot of different technologies have led to improvement in productivity over the years. I think this has the promise of accelerating it somewhat. I mean, we'll be looking at it in, you know, I touched on a surface of a few things, but we've got a variety of projects going on. I, you know, as to the threat from AI, you know, certainly there's a concern about agentic AI on, you know, on margins, et cetera. But I also think that some of these things get overplayed. I, you know, I think that's probably going to be the case some places. But a lot of the balances we have, a lot of free balances we have actually harm free balances. They're paying for services. A lot of it's analyzed. uh and and in a world where if you see more agentic ai optimizing you know you'll you'll see i mean economies i i'm a great believer that the magic of our free enterprise economy is it's really resilient and and responsive to change and so uh you'll see things priced that maybe or free today that maybe get charged for you, you know, everybody will kind of figure out their way, and I think back to, I've been around long enough, I remember when Reg Q was removed, and if you told me that, you know, that, you know, 40 years later, we'd have more in the way of non-interest-bearing demand deposits as a percentage of total deposits and we had in the early 1980s, I'd have said that's impossible. And yet that's the case. And so I think you have to take with a grain of salt sort of the sky is going to fall because, you know, companies adjust, pricing adjust, et cetera. So I think the important thing is to make sure that you're not, you know, have your head in the sand. You're keeping focused on what customers want, that you're supplying solutions. and uh and that's that's that's where our head is right now is gonna how do we how do we develop and participate in solutions that actually help customers uh and and improve the relationships we have with them i think as long as we did yeah we're doing that it's going to work out fine okay and with that it looks like that's all the questions we have i would like to now turn the floor back over to Andrea Kristofferson for closing remarks.
Thank you, Jillian, and thank you to all for joining us today. We appreciate your interest in Zions Band Corporation. If you have additional questions, please contact us at the email or phone number listed on our website. We look forward to connecting with you throughout the coming months. This concludes today's call.
Operator
Thank you, and with that, this does conclude today's teleconference. We thank you for your participation. You may disconnect your lines at this time, and have a wonderful rest of your day.