Operator
Ladies and gentlemen, thank you for standing by. Welcome to the Acadian Asset Management Inc. Earnings Conference call and webcast for the second quarter, 2026. During the call, all participants will be in a listen-only mode. After the presentation, we will conduct a question and answer session. To be added to the queue, please press the star followed by one at any time during the call. If you need to reach an operator, please press the star followed by zero. Please note that this call is being recorded today, Thursday, July 30, 2026 at 11 a.m. Eastern Time. I would now like to turn the meeting over to Melody Huang, Senior Vice President, Director of Finance and Investor Relations. Please go ahead, Melody.
Good morning and welcome to Acadian Asset Management Inc.'s conference call to discuss our results for the second quarter ended June 30, 2026. Before we begin the presentation, please note that we may make forward-looking statements about our business and financial performance. Each forward-looking statement is subject to risk and certainties that could cause actual results to differ materially from those projected. Additional information regarding these risks and uncertainties appears in our SEC filings, including the Form 8K filed today containing the earnings release, our 2025 Form 10K, and our Form 10Q for the first quarter of 2026. Any forward-looking statements that we make on this call are based on assumptions as of today, and we undertake no obligation to update them as a result of new information of future events. We may also reference certain non-GAAP financial measures. Information about any non-GAAP measures referenced, including a reconciliation of those measures to gap measures, can be found on our website, along with the slides that we will use as part of today's discussion. Finally, nothing herein shall be deemed to be an offer or solicitation to buy any investment products. Kelly Yang, our President and Chief Executive Officer, will lead the call. And now I'm pleased to turn the call over to Kelly.
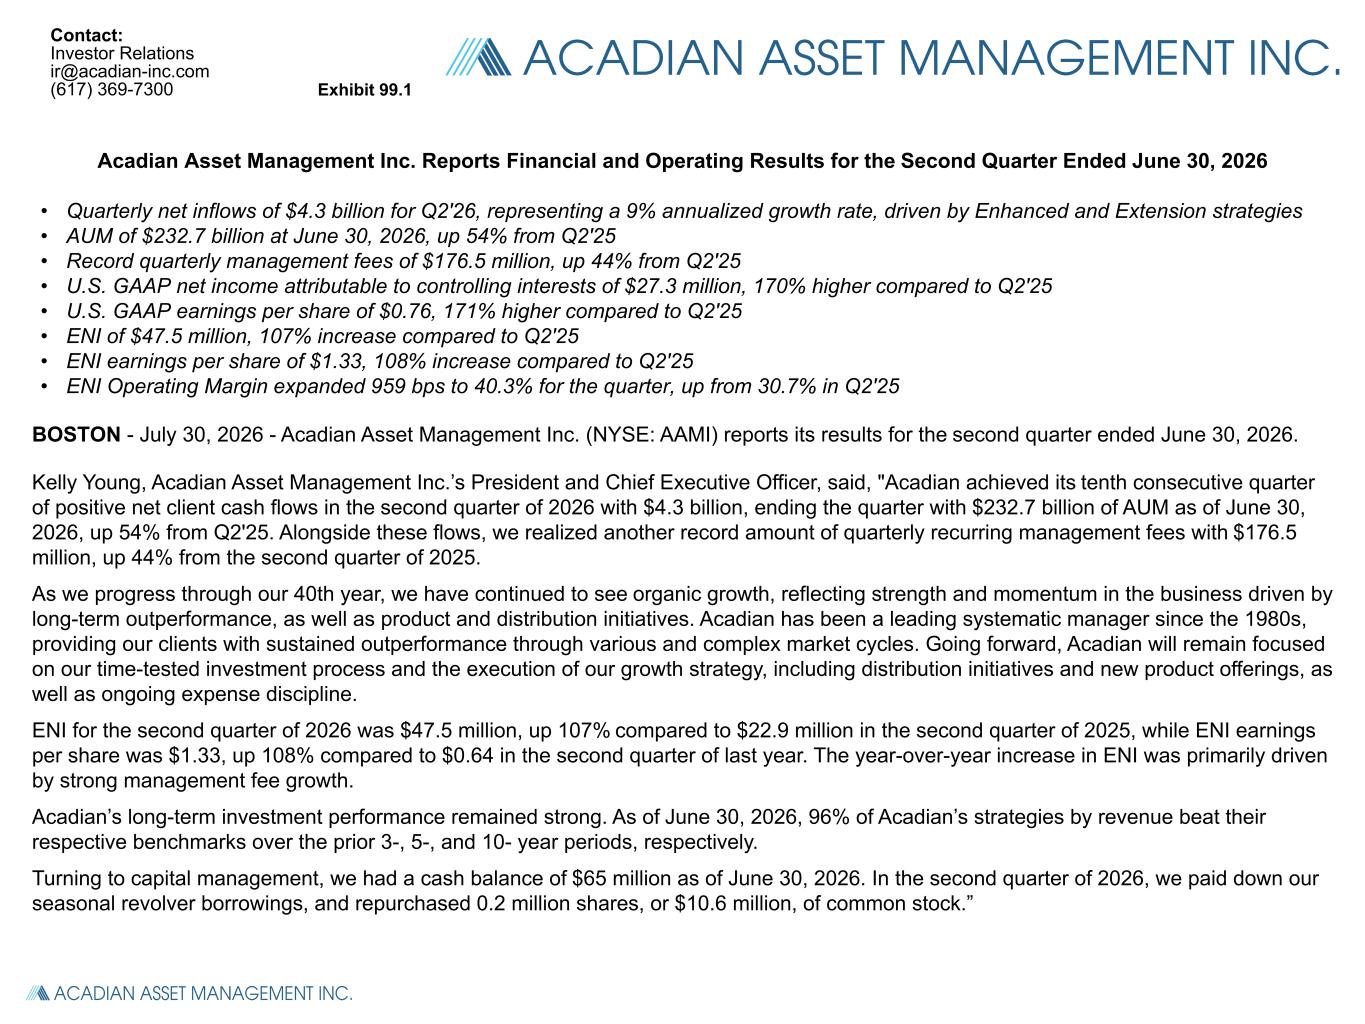
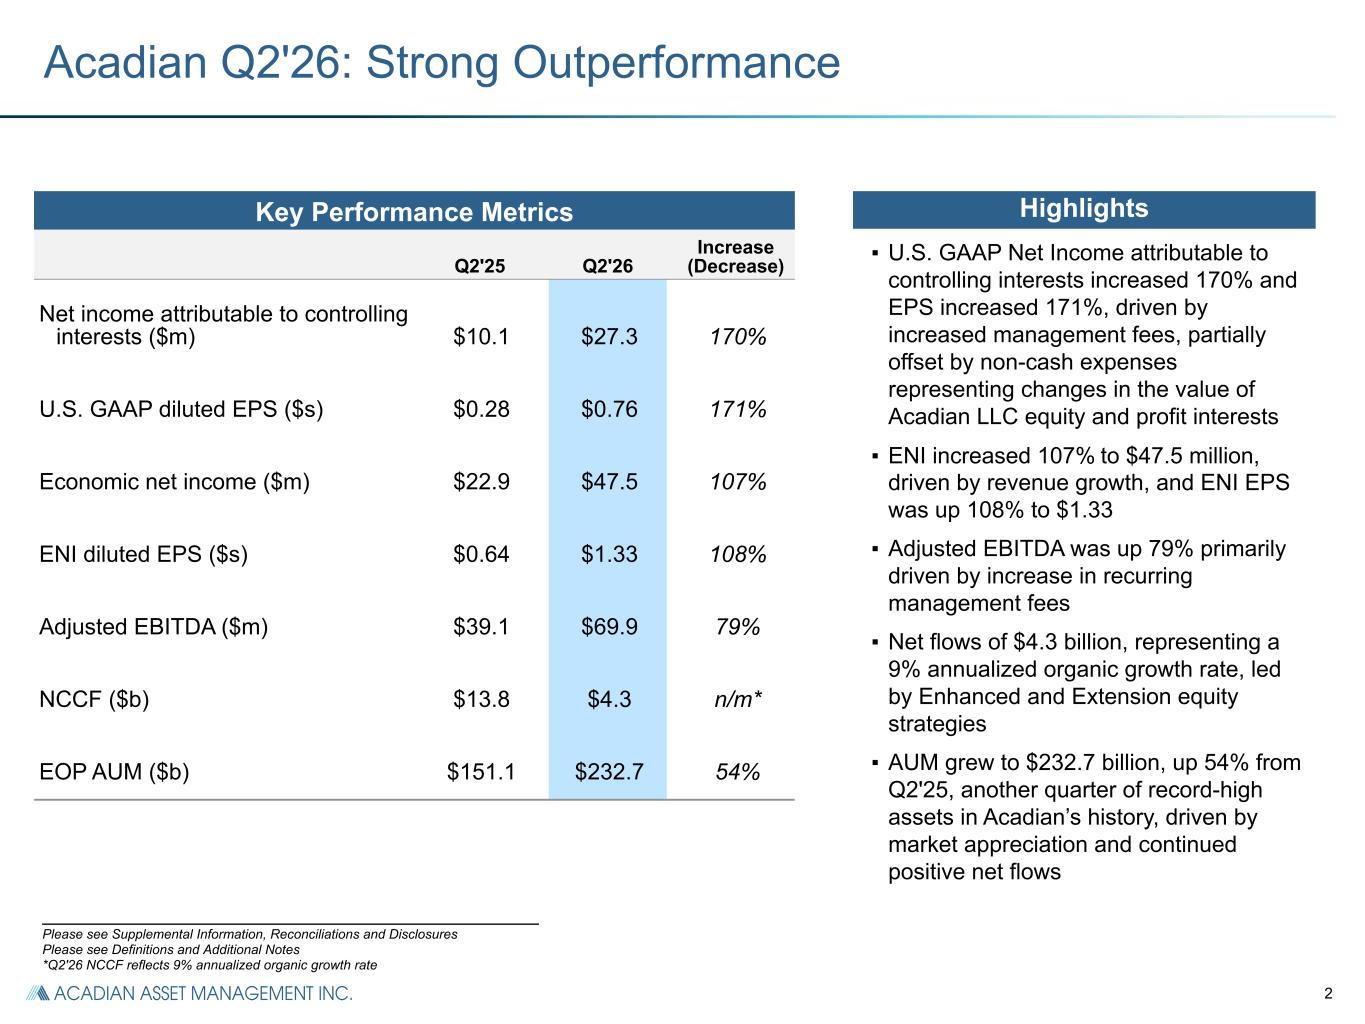
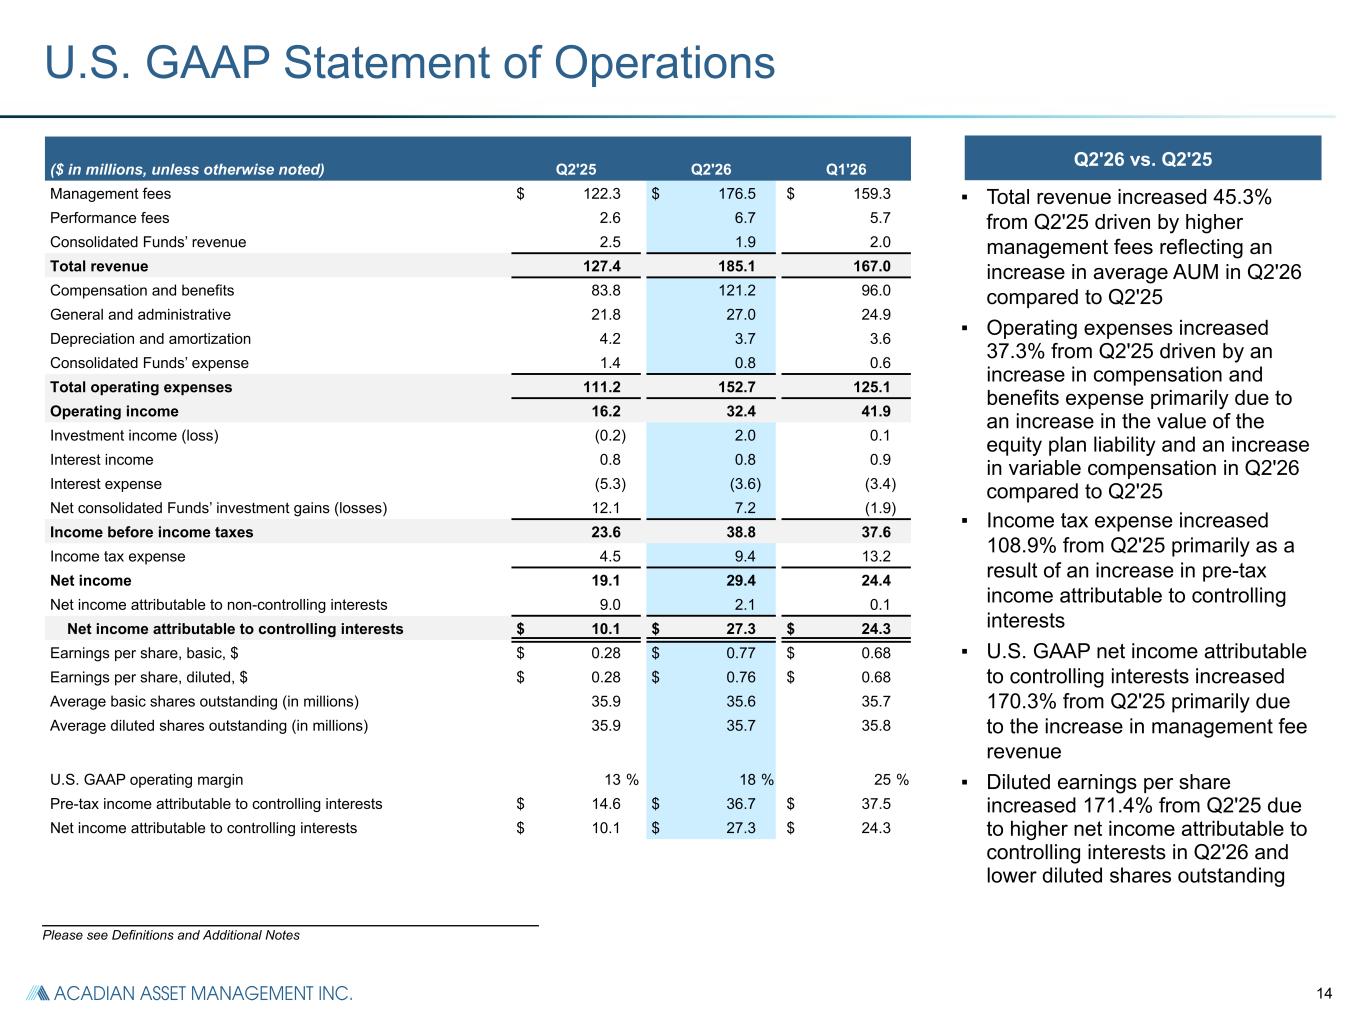
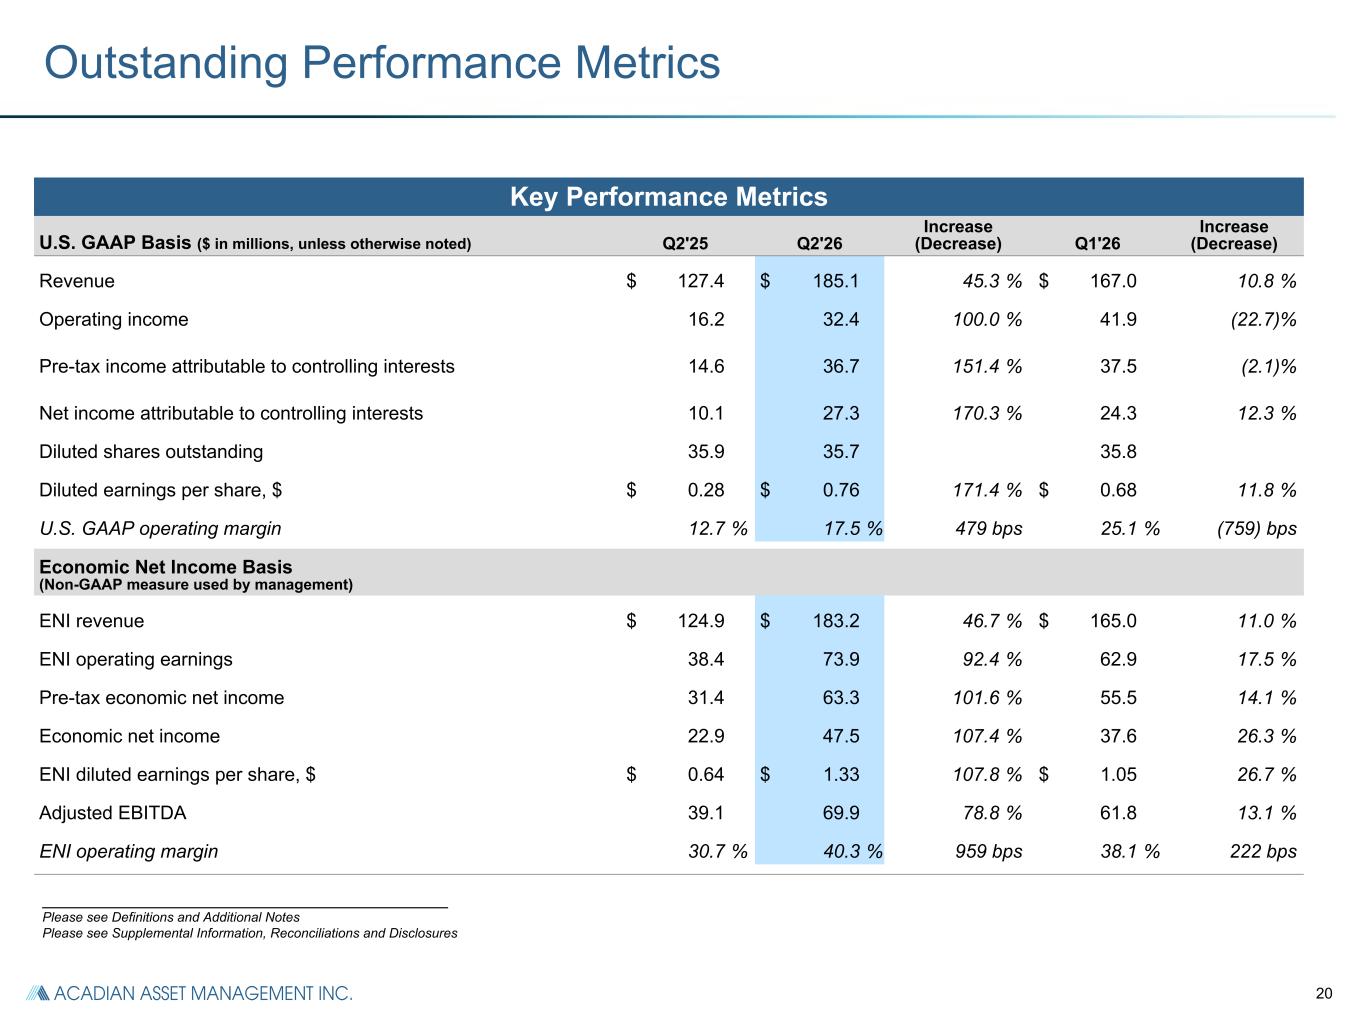
Thanks Melody. Good morning everyone and thanks for joining us today. I'm delighted to share our exceptional Q2 26 results with you. As Acadian celebrates its 40th anniversary, our assets under management and profitability continue to reach new heights with recent strong growth underscoring sustained momentum in our business and disciplined execution of our strategic plan. Before turning to the quarter in more detail, I want to highlight an investment team update that reflects both continuity and ongoing investment in our capabilities. We're pleased to announce that Alex Voitnok, our Deputy Chief Investment Officer, will become co-CIO alongside Brendan Bradley, effective January 1st, 2027. Alex has been with Acadian since 2012 and has played an increasingly important leadership role across our investment organisation, specifically in the areas of portfolio construction, implementation, data infrastructure and investment engineering. This move further strengthens dedicated oversight across data, process, risk and trading as we continue to scale and allows Brendan to focus on investment policy, research innovation and strategic investment priorities. We're also pleased to have welcomed Jonathan Briggs, formerly of TC43 and CPP investments, as well as certain other members of the former TC43 team to Acadian's investment organisation. Their research, data engineering and modelling capabilities are highly complementary to our systematic investment platform and will help accelerate work already undertaken across our research and innovation agenda. Taken together, these developments reflect the same strategic planning and organisational continuity that have defined Acadian for decades. Discipline's systematic investing, continued investment in talent and technology, and a steady focus on delivering long-term outcomes for our clients. We're also pleased to see Acadium move up meaningfully in the latest annual Pensions and Investments Largest Money Managers ranking, rising to number 62 from number 76 last year. While rankings are only one measure, we view this as further external recognition of the scale we've built and the momentum we're seeing across the business. We continued to deliver outstanding results across all key metrics in the second quarter. Our US GAAP net income attributable to controlling interests was up 170% and EPS was up 171% compared to the prior year, driven by increased management fees, partially offset by non-cash expenses, representing changes in the value of occasion LLC equity and profit interests. ENI was up 107% to 47.5 million and our ENI diluted EPS of $1.33 was up 108% driven by revenue growth. Our adjusted EBITDA was up 79%. We realised 4.3 billion of positive net client cash flows in Q2 26 representing a 9% annualised organic growth rate driven by enhanced and extension strategies. And finally, AUM grew 54% from Q2 25 to 232.7 billion as of June 30, 2026, marking another record high for Acadian. Turning to slide three, Acadian's investment performance track record remained strong. Five major implementations comprise the majority of our assets. As of June 30th, 2026, global equity, emerging markets equity, non-US equity, small cap equity, and enhanced equity have 100% of assets outperforming benchmarks across three, five, and 10-year periods, with only one exception. Global equity markets delivered strong double-digit performance in Q2, 2026, while navigating significant volatility with a challenging geopolitical and macroeconomic backdrop. Emerging markets were standout performers, posting their strongest quarterly gains since 2009, which presented a tailwind for Acadian's portfolio returns. Acadian generated strong investment performance with broad-based outperformance across most major strategies. As short-term performance continued to improve in the quarter, 77% of assets outperformed over the trailing one-year period. We believe these results reinforce the consistency and resilience of our disciplined systematic investment process which has been built and refined over acadian's 40-year history slide four details how our investment process has generated meaningful long-term alpha for our clients our revenue weighted five-year annualized return in excessive benchmark was 4.3 percent as of the end of q2 26 on a consolidated firm-wide basis. Our asset-weighted five-year annualised return in excessive benchmark was 3.6% as of the end of the quarter. By revenue weight, 96% of Acadian strategies outperformed their respective benchmarks across three, five and ten-year periods as of June 30th, 2026. And by asset weight, 94% of Acadian strategies outperformed their respective benchmarks across 3-, 5-, and 10-year periods. The next slide highlights our sustained momentum in net flows. We realised positive net flows of 4.3 billion in Q2 26, representing a 9% annualised organic growth rate. Gross inflows were diverse across products and client types and driven by enhanced and extension strategies. We've now generated 10 consecutive quarters of positive net flows, and we continue to focus on renewing our pipeline, which remains very healthy and active after the funding of a number of significant client wins in Q2 2026. I'm now going to turn the call over to our CFO, Scott Hines, to provide you with more detail on our financial performance this quarter and an update on capital allocation.
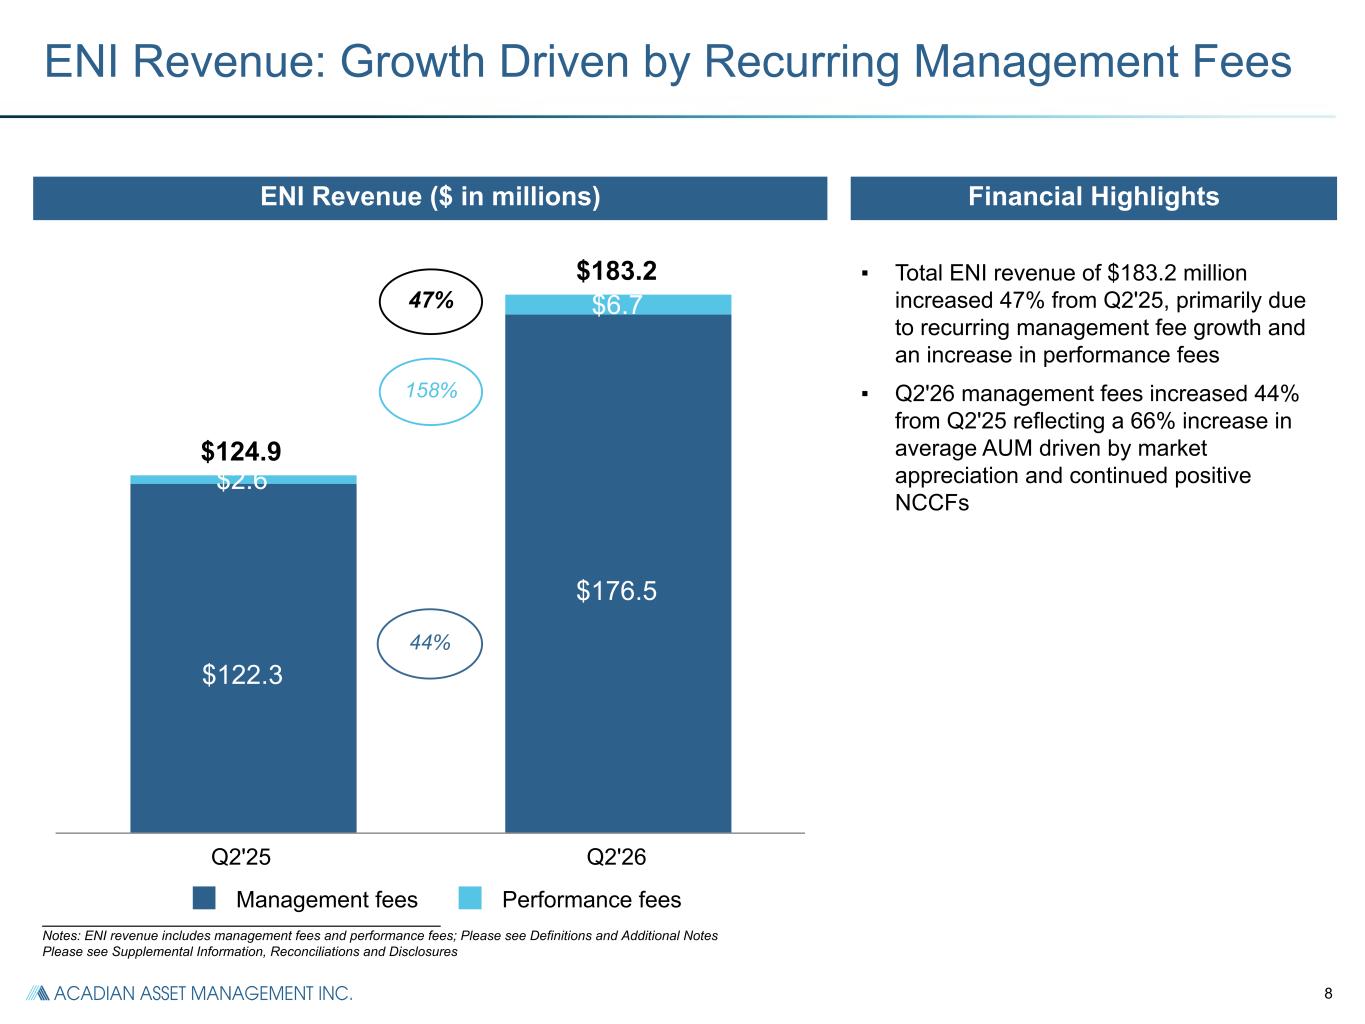
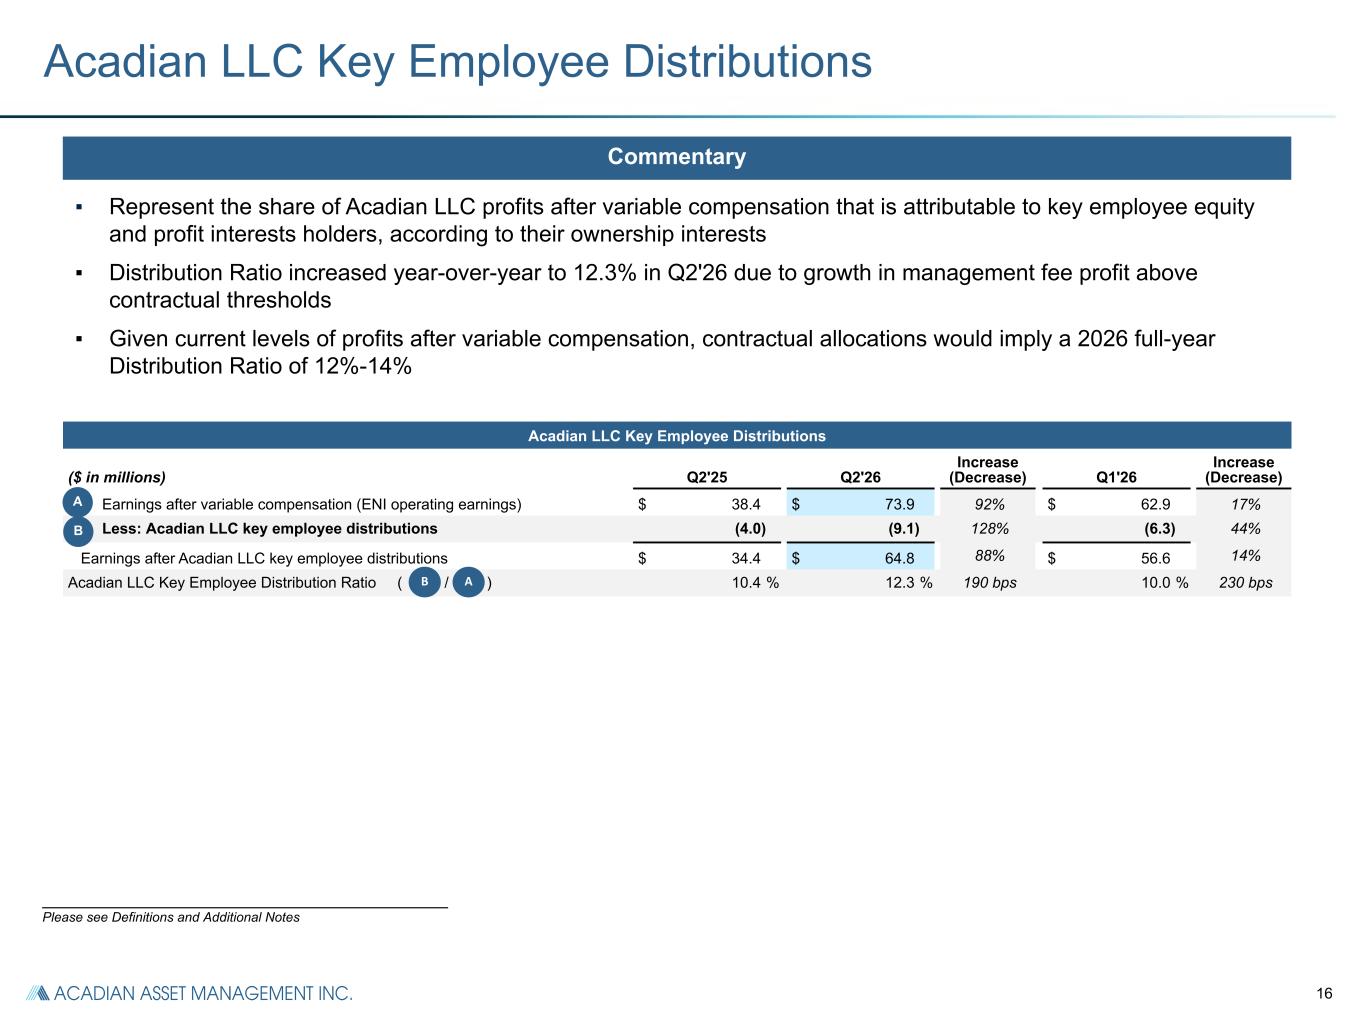
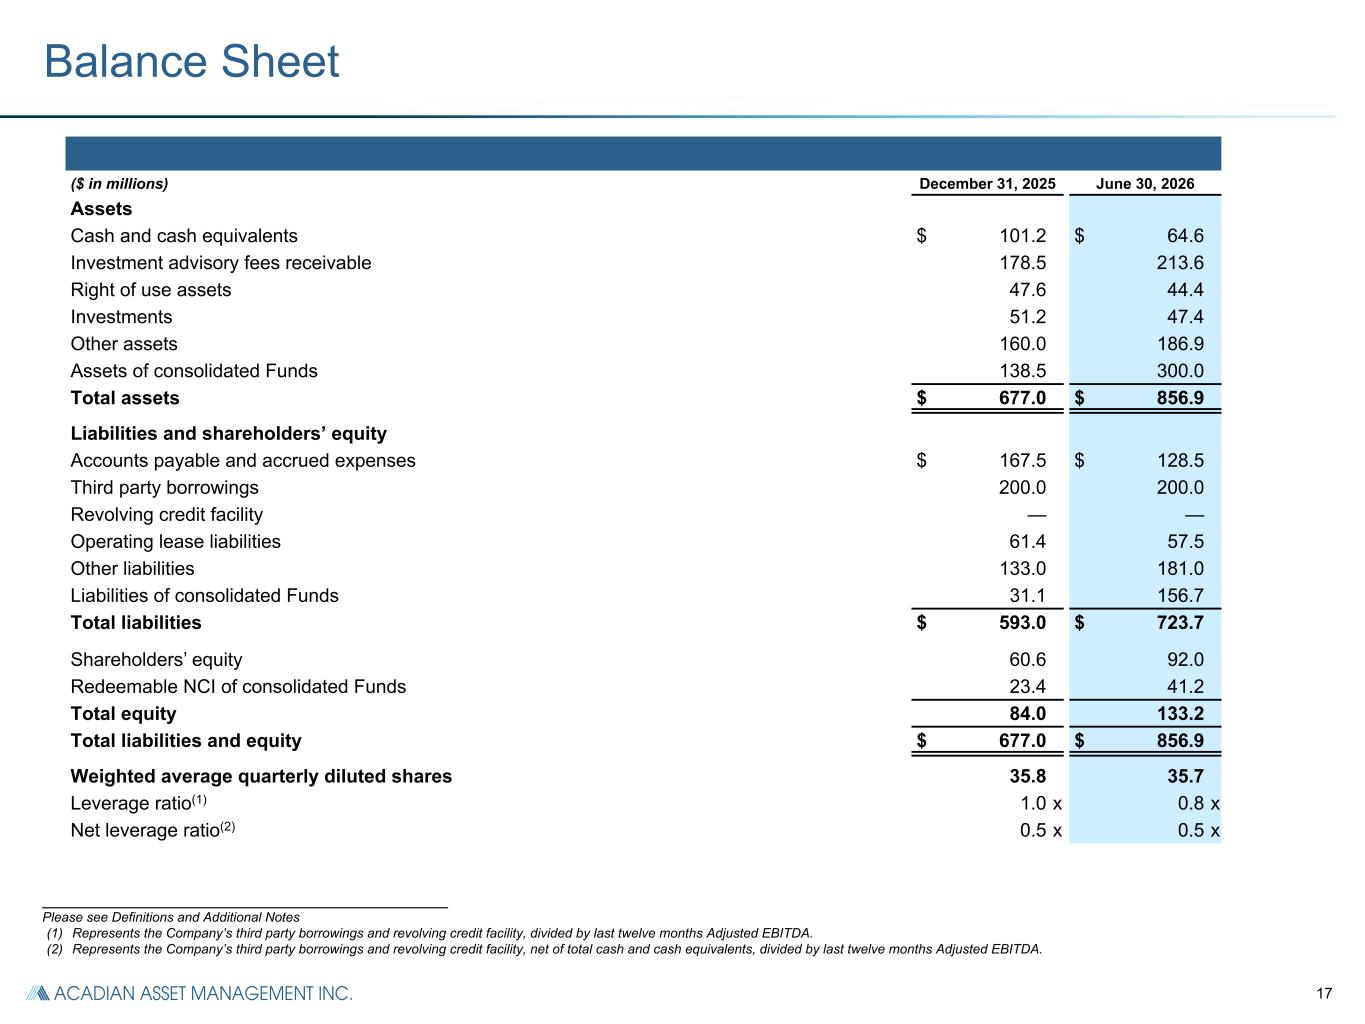
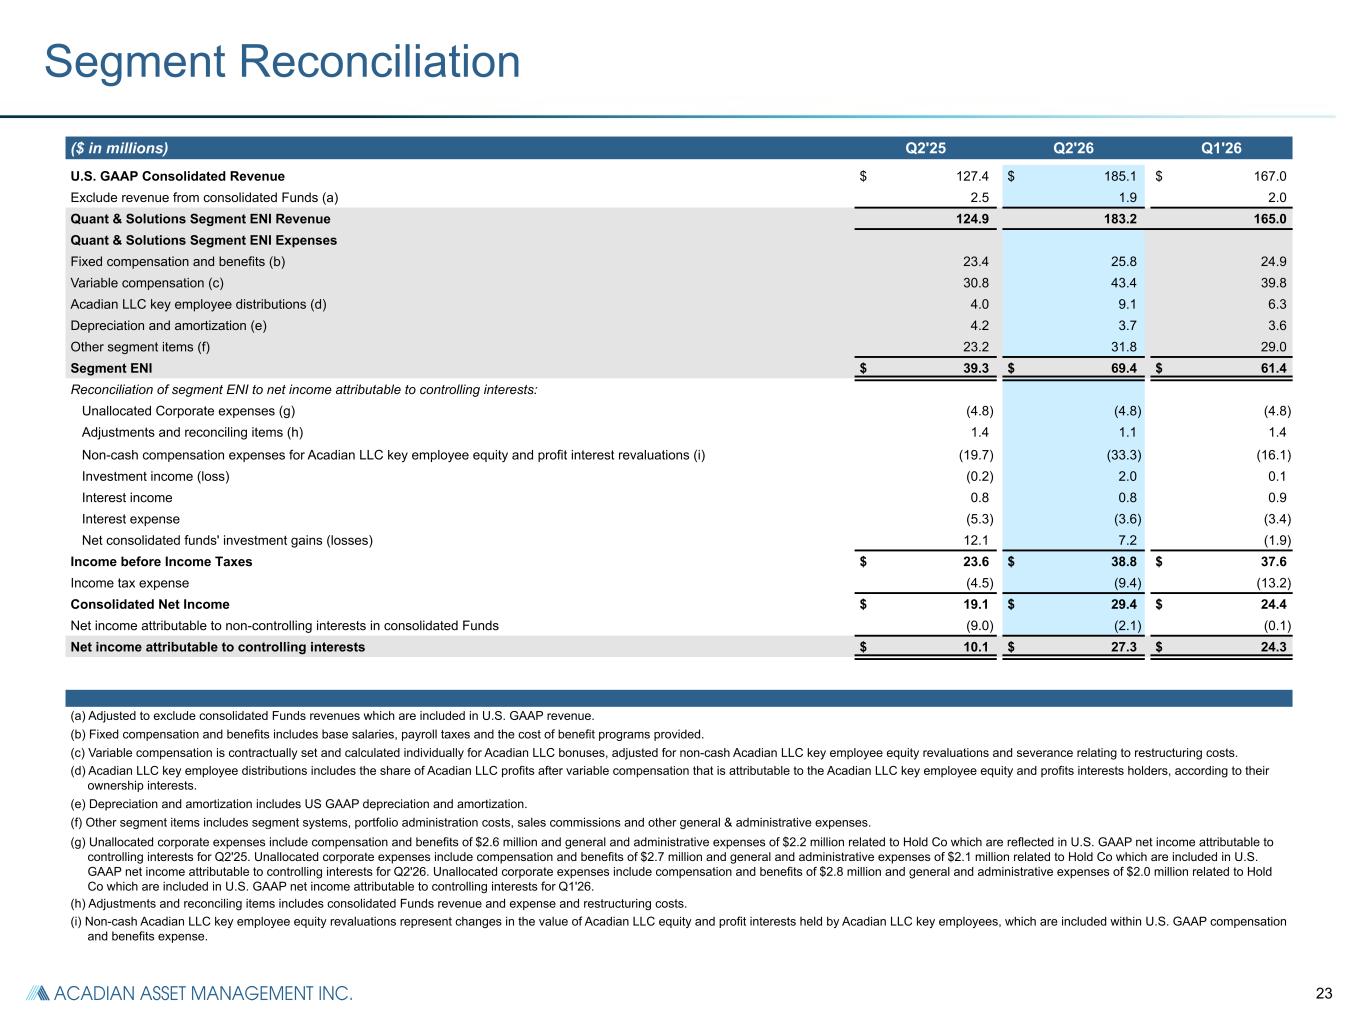
Thanks, Kelly. Turning to slide seven, our key gap in ENI performance metrics are summarized here on a quarterly basis. As previously noted, we manage the business using ENI metrics, which better reflect our underlying operating performance. You can find complete gap to ENI reconciliations in the appendix. Let me now turn to our core business results. Starting on slide eight, total ENI revenue of $183 million increased 47% from Q2 Q225, primarily due to recurring management fee growth and an increase in performance fees. Q226 management fees of $177 million increased 44% from Q225, reflecting a 66% increase in average AUM, driven by market appreciation and continued positive net client cash flows. With average AUM of $220 billion in the second quarter of 2026, we continue to expand our recurring management fee base and strengthen Acadian's earnings power. Moving to slide 9. In Q226, ENI operating expenses increased 19%, primarily driven by higher G&A expenses, including continued investment in technology and infrastructure, as well as AUM driven servicing costs, increased sales-based compensation, and higher fixed compensation and benefits. Our ENI operating margin expanded nearly 10 percentage points to 40.3% from 30.7% in Q225, mainly driven by increased ENI management fees, while our Q226 operating expense ratio fell 8 percentage points year-over-year to 36.8%, reflecting improved operating leverage. Q226 variable compensation increased 39% year-on-year, primarily driven by higher profit before variable compensation. Our Q226 variable compensation ratio decreased to 37.5% in Q226 from 45.4% in Q225. Assuming revenue mix and levels similar to Q226, contractual allocations would apply a full-year 2026 variable compensation ratio of approximately 38 to 42 percent. Turning to slide 10 on capital resources and our strong balance sheet, as of June 30, 2026, we had $65 million of cash and $110 million of seed investments on the balance sheet, with a $200 million balance on our term loan credit facility and no outstanding balance on or revolving credits facility. Note that the company's strong cash flow generation supported repayment of seasonal revolver borrowings during the second quarter. As of Q2 26 period end, our gross debt to adjusted EBITDA ratio was 0.8 times, while our net debt to adjusted EBITDA ratio was 0.5 times. Note that our gross leverage ratio of 0.8 times is improved from year-end 2025, supported by greater last 12 months adjusted EBITDA and is well below the 1.5 times through the cycle gross leverage ratio target identified at our May investor forum. Moving to slide 11, we have a track record of creating significant value through share buybacks in recent years. Outstanding diluted shares have decreased 58% from 86 million in Q419 to 35.7 million shares in Q226. Over the same period, $1.5 billion in excess capital has been returned to stockholders through share buybacks and dividends. During Q2-26, we repurchased 0.2 million shares or 10.6 million of stock at a volume-weighted average price of 69.92. Amy's board has declared an interim dividend of 10 cents per share to be paid on September 25, 2026 to shareholders of record as of the close of business on September 11, 2026. Going forward, we expect to continue generating strong free cash flow, prioritizing organic growth and balance sheet flexibility, and then returning excess capital through dividends and share purchases. I'll now turn the call back over to Kelly.
Before moving to Q&A, let me recap some key points on slide 12. Acadian is competitively positioned as the only pure play, publicly traded, systematic manager with a 40 year track record and competitive edge in systematic investing. Our investment performance track record remains strong this quarter, with more than 96% of strategies by revenue outperforming over three, five and 10 year periods. Business momentum continued a pace in Q2 26, with net inflows of 4.3 billion for Q2, a 9% annualised organic growth rate, reflecting 10 consecutive quarters of positive net flows and achieving AUM of 232.7 billion, up 54% from Q2 of 25, and the highest in the firm's history. Q226 financial results included record management fees of £177 million, up 44% from Q225, ENI EPS of $1.33, up 108% from Q225, and operating margin expansion to 40.3%, up 10 percentage points from 30.7% in Q2 of 25. Finally, capital management remained a focus in the quarter as we strengthened our balance sheet with conservative leverage ratios and earlier than typical repayment of seasonal revolver borrowings and continue to invest in organic growth and return excess capital to shareholders. Pleased with our second quarter results, we remain focused on disciplined execution going forward. and this concludes my prepared remarks.
Operator
At this time, those with questions should lift their phone receiver and press star followed by the number one on their telephone keypad. To cancel a question, please press star one again. Please hold for a brief moment while we compile the Q&A roster. Your first question comes from Kenneth Lee with RBC Capital Markets. Please go ahead.
Hey, good morning, and thanks for taking my question. I'm wondering if you could talk about your institutional pipeline, maybe some additional colour, any of the details of composition as well, if you could share that. Thanks.
Yeah, of course. Hi, Ken. Nice to speak to you again. The pipeline continues to look very healthy across different strategies and client domiciles, despite, you know, the record-breaking first half of 2026 that we've seen. We continue to refund it again, sorry, fund, replenish the, you know, as we've had these sizable wins. I'd say the themes are kind of fairly consistent with those that we've talked about over the last couple of quarters. Demand for our enhanced equity strategies remains very strong. That was characterized, I'd say, by mostly by non-US clients a year or so ago, but we're seeing that really pick up as a global trend now. And the other area of real interest that we're seeing is within our extension strategies. I think as you remember, when we laid out our strategic plan about 18 months ago, we talked about enhanced as a nearer term opportunity, and we thought extensions more medium term, we are seeing that momentum continue to pick up. And of course, you know, Acadian's long term track record in our long only strategies, you know, continues to be, you know, there's evergreen interest in those. I'd say particularly our broader and more diversified strategies, so global non-US EM allocations, those are areas where we continue to see interest. As I noted, there's broad interest from clients globally, so this isn't really a case of pockets of interest from different geographies. This is very much global in nature when we look at the pipeline.
Gotcha. Very helpful there. And one follow-up, if I may, just in terms of the variable comp expense, probably came in a little bit lower than what we expected. Any particular drivers there that would explain the movement there in the quarter? Thanks.
Yeah, Ken. Hey, it's Scott. Thanks again for joining. So on variable comp, the quarter on quarter move, the big driver there is a good news story for us. And that's the growth in the management fees, right? And the management fee profit. So when you think about that variable comp and both how it's moving quarter to quarter, and that full year, if you will, statement we make about where we expect to land on the full year, for all intents and purposes, I'd encourage you to think of three things moving around in relation to another. in relation to one another. The first is the size and how we think or know. Obviously, management fees have come in and the management fee profits have come in year to date. And where, of course, we expect them to go for the rest of the year, then performance fees. And then there's a piece that for intents and purposes doesn't move around. That's the deferred compensation piece that has been there from years prior. So long story short, if management fees are growing proportionally more quickly, larger than the performance fees, that would typically put that variable compensation ratio down. So that's what's going on here this quarter and why you saw the change quarter on quarter and why you saw that full year outlook take down a little bit. It's because of the flows we saw and the relative growth in the management fees year to date. Continue to feel really good about performance fees and how the year is shaping up, but it is proportional. So that recurring management fee profit pool has grown to an extent, and the second quarter was so positive relatively that that moved around the variable compensation ratio in the way that I described.
Gotcha. Very helpful there. Thanks again. Thank you.
Operator
Your next question comes from Joe Tomilo with Morgan Stanley. Please go ahead.
Hey, good morning. Joe Tomilo. I'm from I'm Mike Cypress. Thanks for taking my questions. I guess my first question is on private wealth. Can you update us on your strategy and how you're thinking about the product wrapper and the approach to distribution, particularly around the tax-aware dynamic extension strategy?
Yeah, of course. Hi, Joe. Nice to speak to you. About 20%, 25% of our assets today are intermediated with the wealth channel. So we do have a sizable business. It's an area that Acadian has always had clients. but as you know we were very excited in the second quarter to launch um our tax aware capabilities and we actually launched two funds during the quarter global tax aware and a u.s tax aware and we now manage total assets in those two strategies of 100 million and the vast majority of that is is external capital um so we think there's real opportunities for this as clients are thinking about after-tax outcomes. We think our process is particularly well designed, you know, to help clients with this. Again, obviously, long-term consistent alpha and our extension strategies, again, form the basis of this. So we're very excited. On the distribution side, we have a very large distribution team, very experienced, well-tenured. Again, we have had wealth clients for a number of years. So the team have built very deep and meaningful relationships there. And again, we feel very excited about about the prospects. I think many people will have noted we we recently were in the press with another large wealth win with one of our existing partners in the UK, large UK wealth manager, one of the premier managers in the UK. So, again, continue to see real demand there. And we think that the tax aware capabilities just opens up an avenue to us in the US. And, again, very excited to see the progress we've made there in the, you know, in the couple of months since we launched those two strategies.
And I guess that's my follow-up. You know, as a very quiet, you're a recent investor today. I think you guys noted 27 of your top 50 clients are invested across multiple Acadian strategies. So I guess I'm just curious, you know, how much of your current sales pipeline is cross-selling versus, you know, new customers? And I guess if you could speak to some of your actions you're taking to expand penetration within the existing client set, what hurdles exist, their challenges, and really how do you plan to overcome those to really accelerate the traction on cross-selling? Thank you.
No, it's a great question. We have incredibly deep relationships with our clients. And again, as we noted at the Invest Day, many clients have multiple mandates with us. And I think that speaks to the level of trust and commitment that our clients have in Acadian. And our average client tenure is longer than industry average. So I think we have built a world leading team on the client service side. I'm delighted with the work that they've been doing. And I think we're in very good shape when I look at our overall client retention and opportunities. But as I say, a huge number of our clients do have multiple mandates with us. cross-sell is always a meaningful part of our pipeline. I think that will continue to be the case going forward as we continue to develop strategies that we think are solving problems for our clients across the globe. I think a good example of that, a more recent trend we've seen with some of our clients moving towards extensions from long-only mandates, and we've obviously been working very hard to support them around that. But a trend like that, Joe, I think is we're attracting both new clients and seeing existing clients convert. So I think because of the nature of our client base, it is very broad, sophisticated, very large institutions. The issues that they're facing, the things that they're sort of wrestling with, that they're thinking about, I think often are just reflecting broader market demand. So I guess in answer to your question, again, we feel very well positioned with our clients. We're delighted with the relationship to the trust that we've built over the years. And again, you know, CrossSale will be a very meaningful part of our sales going forward. But I don't think there's anything we need to do to change what we're doing. We've been very successful there. And again, I think that's credit to what the relationship management team have been able to do at Acadian over the four decades that we've been around. Great.
Operator
Your next question comes from John Dunn with Evercore ISI. Please go ahead.
Thank you. You know, I think on systematic fixed income, I think the U.S. high yield product hits a benchmark later towards the end of the year. Has there been any movement or traction leading up to that? And then just more broadly, an update on where you think that segment can go in the next few years?
That's a great question, John. Nice to speak to you again. As you say, Our U.S. high yield will be hitting its three year track record towards the end of this year. And, you know, I'm very pleased with the performance and the resilience of not just that track, that track record, that track record, I should say, sorry. And as well as the U.S. investment grade and our global high yield, I think the credit team here have done a great job building a very resilient, consistent, positive track record. And that's starting to see traction with clients and new potential investors. I'd say when I look at the pipeline, we're continuing to see that deepen and we're seeing it start to mature from early stage opportunities. You know, I think, as I've said on previous calls, we always expected asset raising to ramp up, you know, more in 2027 when those three year trap records are in place. And we don't set hard AUM targets around that. But certainly the conversations we've been having over the last quarter or two have led me to feel, you know, very good about some nearer term opportunities. So I think we're completely on track with with where we'd like to be with credit. So the nature of those conversations are changing and moving to more later stage versus kind of early stage discovery type meetings. And just in terms of the number of meetings, the number of investors we're meeting, that's wrapped up, that's ramped up quite significantly in this this year. And I think we'll continue to do so through the second half. So, again, feeling very good about where we are with credit and again, feeling positive about a couple of near term opportunities as well.
Got it. And maybe could you talk about the exit rate of the C rate? It seems like the big St. James Place win is in the numbers. So going forward, maybe it should moderate down, but at a more modest pace. Is that the right way to think about it?
Yeah, John, it's Scott. Thanks again for joining. And yes, I think the intuition is spot on. And for all intents and purposes, to be clear, there's no real change here from certainly from our investor form in May or really in last quarter. And more specifically, we did have, as you know, a large installation again on the enhanced side late the prior quarter, I mean, late in 1Q26. So full run rate impact of that wasn't really realized until this quarter. That was the predominant driver of that rate move. But for all intents and purposes, there's no real change here from the investor form dialogue or the prior quarter in that year on year, we did see a meaningful change in the fee rate, called again, upper 30s down to lower 30s today. But we think it's more stable than not going forward. And that while there are still opportunities that Kelly's already noted on the enhanced side, which do typically come in at a lower fee rate. It's just not the same step change year and year now that enhanced is, you know, call it, you know, 30 some percent of our AU unmixed. So again, I think the direction of travel is more stable than not where we're at this quarter. As you know, there's a lot of external factors at play with that blended fee rate, client demand, things that are going on the market. So it can move around a bit. But again, I think the direction of travel as we look at our forecast in the pipeline and how it's most likely than not to play out would be relative stability here in and around this quarter. Thanks very much.
Operator
This concludes our question and answer session. I'd like to turn the call back over to Kelly Young.
I'd like to thank everyone for joining us today and hope you all have a great day.