Welcome everyone to our second quarter 20% earnings call. On this call we have our president and chief executive officer Mikael Bratt, our chief financial officer Monica Gramma, and me under the VP Investor Relations. During today's earnings call we will highlight several key areas, including our strong performance despite the challenging market environment, we will provide an update on our structural cost reduction initiative in NIA, an update on the latest market development, and our full year guidance and the potential impact of ongoing year political challenges. Following the presentation, we will be available to answer your questions. As usual, the slides are available on autolid.com. Turning to the next slide, we have the safe harbor statement, which is an integrated part of this presentation and includes the Q&A that follows. During the presentation, we will reference non-use gap measures. The reconciliations of historical use gaps to non-use gap measures are disclosed in our court learning release, available on autobut.com, and in the 10-Q that will be filed with the SEC, and also at the end of the presentation. Lastly, I should mention that this call is intended to conclude at 3 p.m. Central European time, so please follow the limit of two questions per person. I now hand it over to our CEO Mikael Bra.
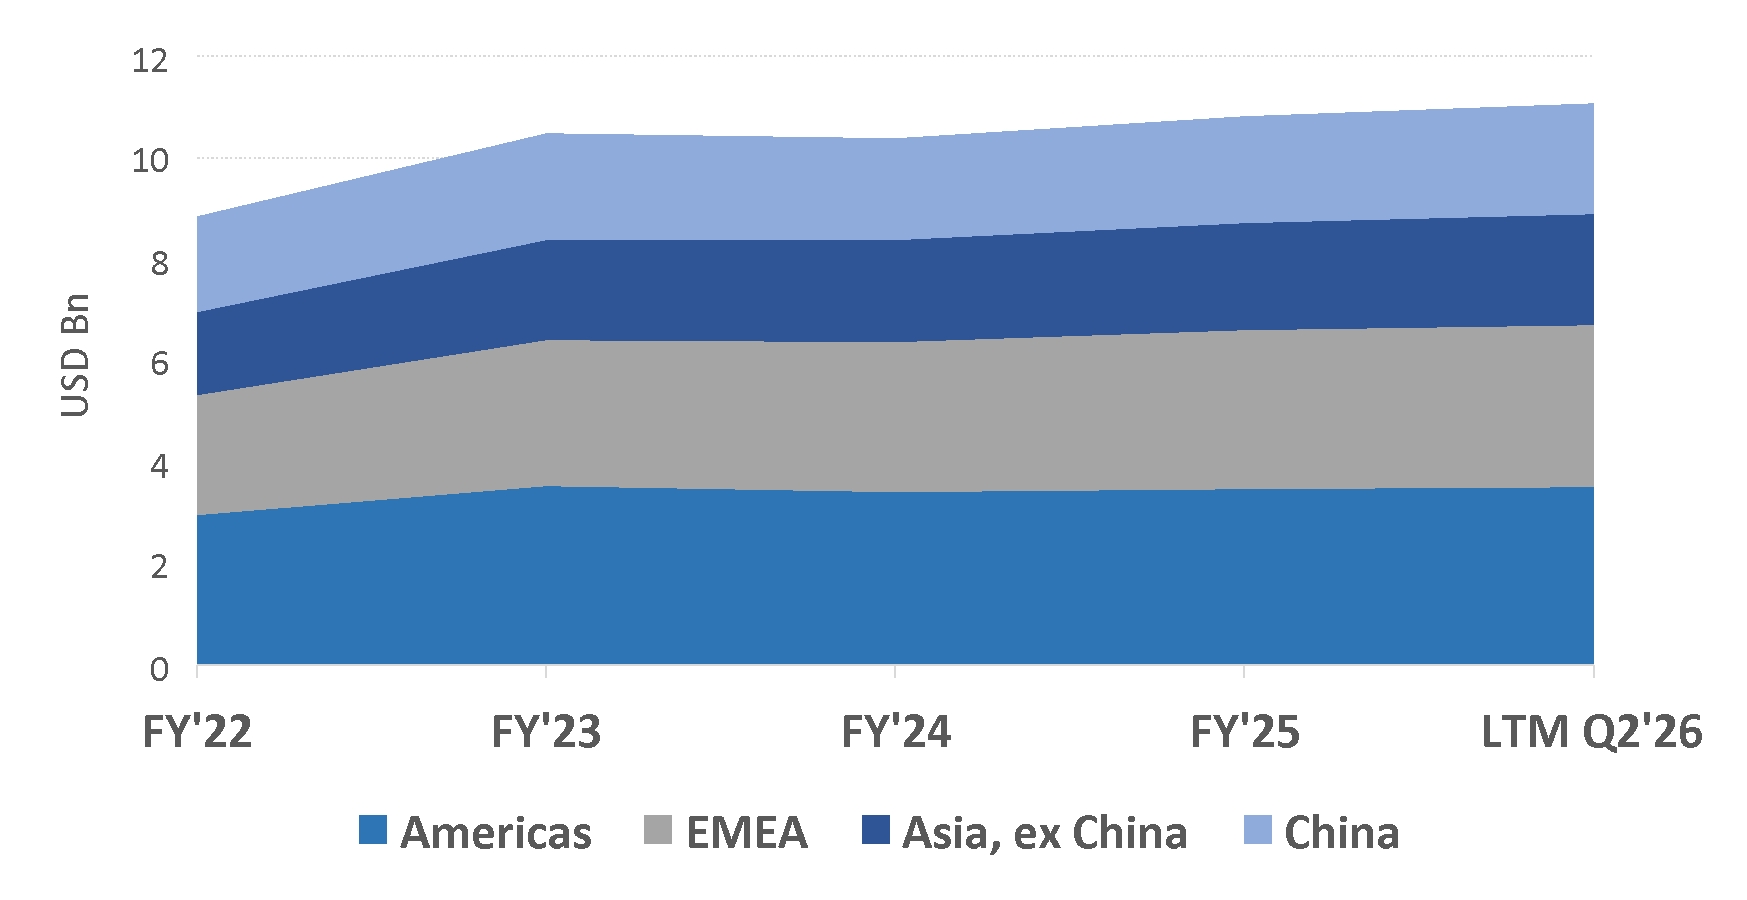
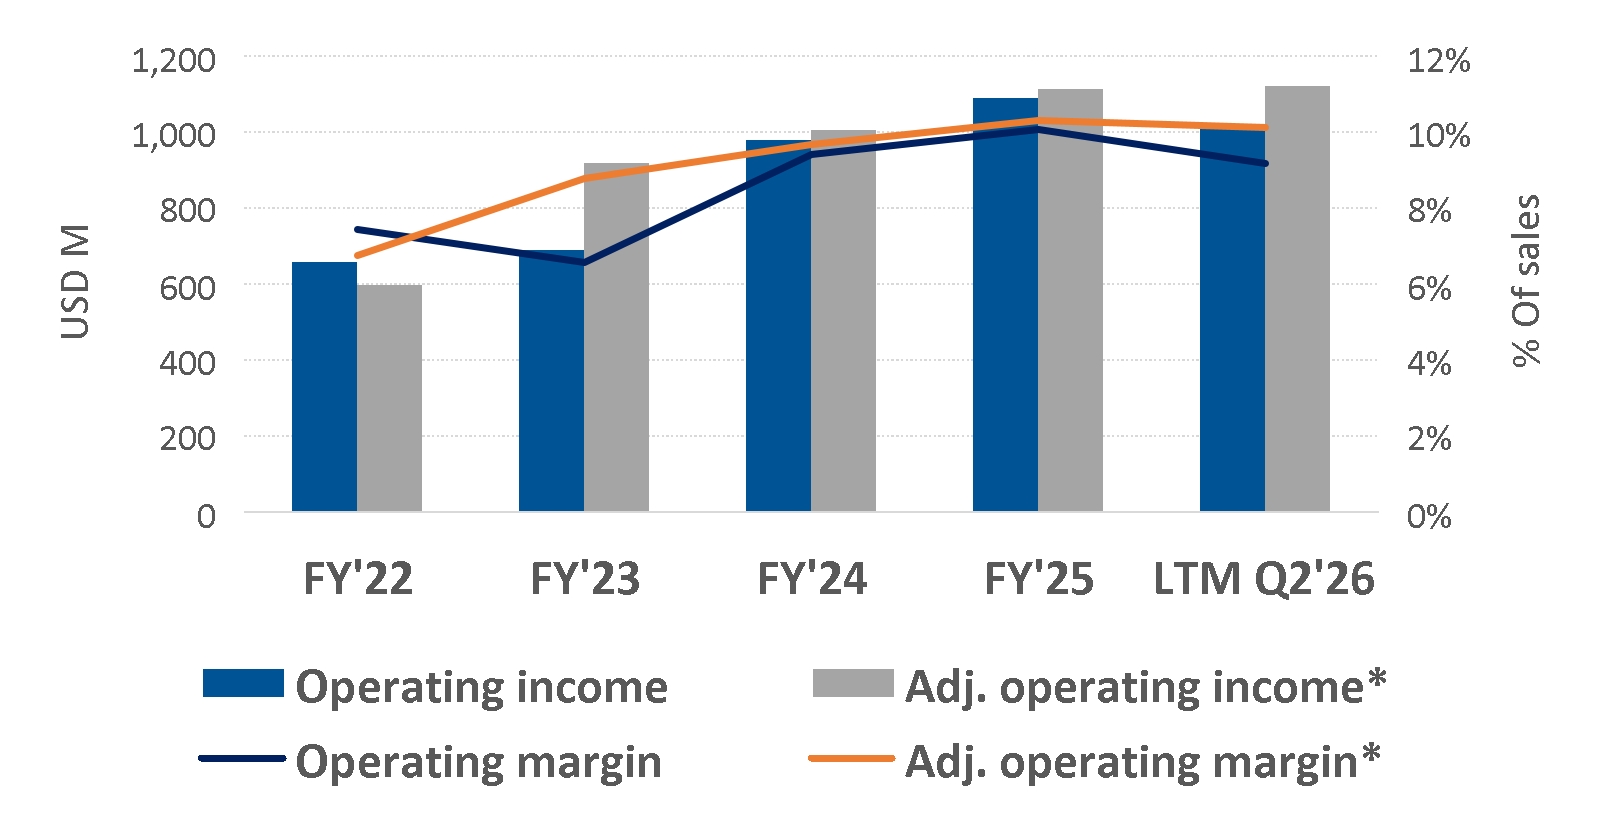
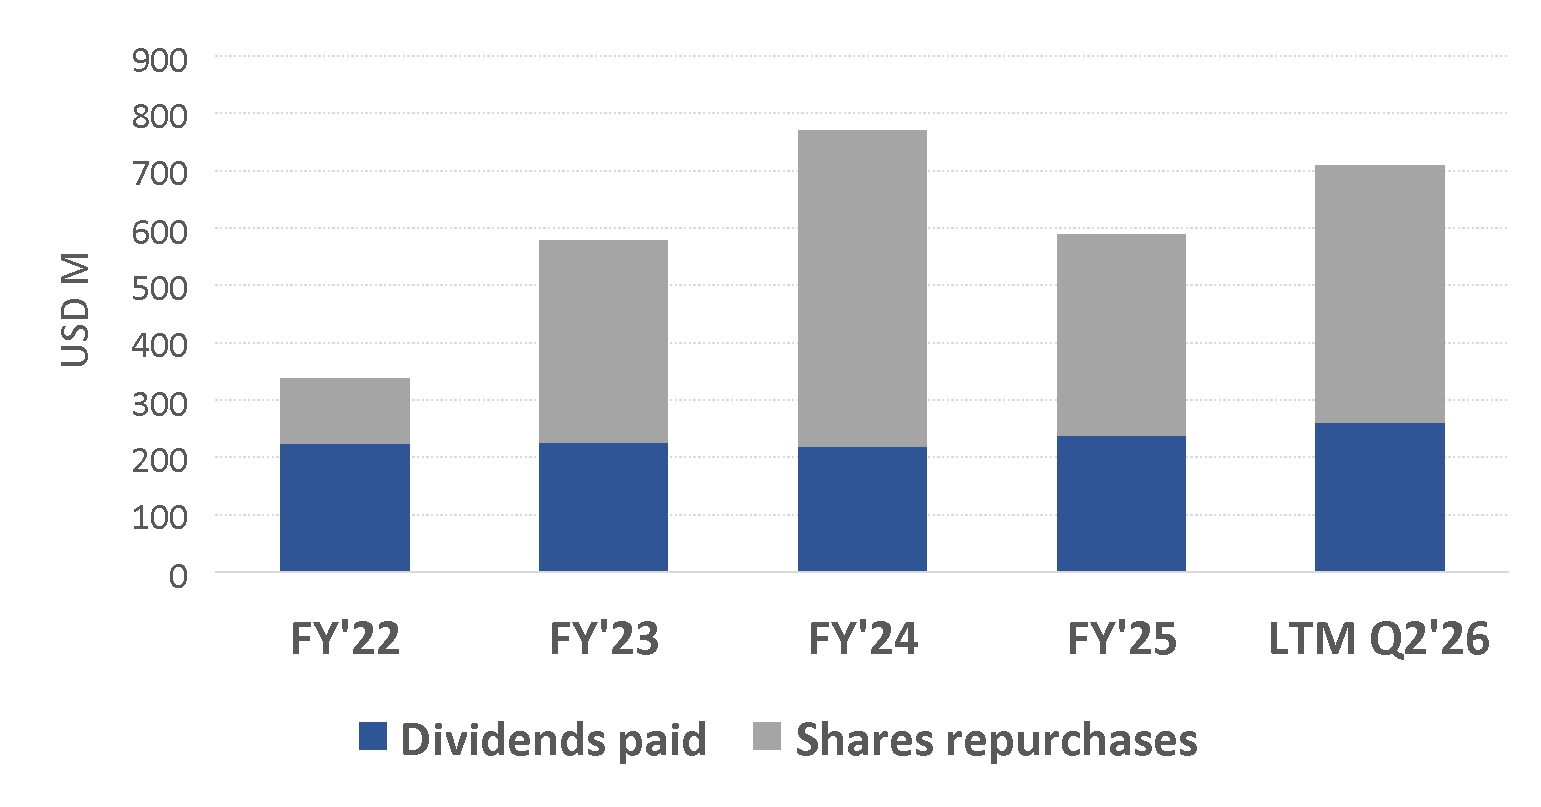
Thank you Anders. Looking on the next slide. We delivered a record second quarter both for sales and adjusted operating income underscoring underscoring the resilience of our company and the strength of our market position supported by strong customer partnerships and a relentless focus and continuous improvement. have built a solid momentum for the rest of the year. During the quarter we also navigated geopolitical development effectively, mitigating the impact of tariffs, supply chain disruptions and raw material cost volatility. And as you might have seen in the report and will hear from us during this course, we have several positive and negative one-time items in the quarter. This includes a supplier settlement reversal from Q3 2025, an AIFA refund, government income in India, an impairment charge related to restructuring activities in Turkey, and a reverse expected credit loss reserve. Combined, these items have virtually no impact on the adjusted operating margin and only a slight negative impact on the top line. Our positive sales momentum in Asia continued during the quarter. In China we once again outperformed light vehicle production driven by strong growth with Chinese OEMs where our sales outperformed by more than 40 percentage points. In India we grow sales by 36% organically, reflecting mainly the trend of increased safety content in vehicles in India. Adjusted operating income and margin improvement improved despite raw material headwinds, particularly higher helium prices. The strong performance was primarily driven by higher sales and well-executed activities to improve efficiency and cost. I am pleased that our cash flow improved in line with our expectations, resulting in record operating cash flow for the second quarter, and supporting our ambitious shareholder return strategy. Despite repurchasing over 1.6 million shares for 200 million US dollars, and paying a dividend of 64 million US dollars, our leverage ratio improved to 1.2 times. During the quarter, we announced additional structural cost initiatives, which we will elaborate on in the next slide. Based on what we know today, we reiterate our full year 2026 guidance of flat organic sales with continued significant outperformance of light vehicle production in both China and India. We continue to expect an adjusted operating margin of around 10.5 to 11 percent. This is based on the assumption that global light vehicle production will decline by around 2.5 percent and that the gross headwind from raw materials is around 110 million US dollars. I'm also proud that we signed strategic cooperation agreements with leading Chinese vehicle manufacturers Great Wall Motor and Chopin. These agreements mark important milestones in our strategy to expand with leading Chinese vehicle manufacturers and further demonstrate the competitiveness of our safety solutions. They strengthen our position as a trusted safety partner and create a strong platform for sustainable long-term growth both in China and globally as they expand their footprint. Looking now on our continued cost reduction activities on the next slide. To strengthen our competitiveness and support our financial targets, we are continuing our global structural cost reduction initiatives. As a part of this effort, we have decided to gradually discontinue our manufacturing operations in Turkey, which today produce steering wheels, airbags and seatbelts. Production will be transferred to our existing facilities across EMEA region, allowing us to optimize our manufacturing footprint while maintaining our ability to serve customers efficiently. This decision is expected to affect approximately 2200 employees. The transition will take place over the coming years, with the complete closure anticipated during the first half of 2028. From a financial perspective, we expect total restructuring charges of approximately 142 million U.S. dollars, of which 90 million U.S. dollars was recognized in the second quarter of 2020. Cash out is expected to be approximately 129 million US dollars with a limited impact on our 2026 cash flow. Importantly this initiative is expected to generate annually pre-tax savings of approximately 40 million US dollars with benefits beginning to materialize in 2027 and reaching the full runway in 2028. Overall this action is an important step in improving our cost competitiveness and it's supporting us in achieving our financial targets. Looking now on the next slide. Second quarter sales increased by approximately 3% year-over-year. Driven by outperformance relative to light vehicle production along with favorable currency effects partly offset by lower tariff related compensations. The adjusted operating income from Q2 increased by seven percent to 270 million US dollars. The adjusted operating margin was 9.6 percent 30 basis points higher. Operating The cash flow was a strong 434 million US dollars, an increase of 157 million US dollars. Looking on to the next slide. We continue to deliver broad-based improvements. Our positive direct labor productivity trend continues. This is supported by the implementation of our strategic initiatives, including automation and digitalization. Gross profit increased by 8 million US dollars while the gross margin decreased by 30 basis points mainly due to the reversal of a supplier federal law. The decline in gross margin from 18.5% to 18.2% driven by a supplier compensation reversal and asset impairment related to the 30 restructuring which combined reduces gross margin by almost 80 basis points. RDNA net increased year over year primarily on negative currency translation effects, higher personnel costs and lower engineering income due to timing of specific customer development projects. SG&A decreased by 7 million US dollars mainly due to reverse estimates of credit loss reserves, partly offset by negative FX translation effects. In relation to sales SG&A improved by 40 basis points to 4.9%. Looking now on the market development in the second quarter on the next slide. According to S&P Global's July data global light vehicle production declined by 0.3 percent in the second quarter approximately 160 basis points better than expected in April. Stronger than expected performance in North and South America, Europe, India and South Korea helped offset softer production levels in China. China. The global regional LVP mix was approximately 60 basis points unfavorable in the quarter, primarily driven by stronger likely production in lower content markets relative to other markets. During the quarter volatility improved year-over-year but declined slightly sequentially driven by weaker development in China. We will talk about the market development more in detail later in the presentation. Looking now on our sales growth in more detail on the next slide. Our consolidated quarterly net sales exceeded 2.8 billion US dollars for the second time in our history. This was approximately 90 million US dollars higher than in the prior year. primarily driven by positive currency translation effect of 62 million US dollars. This benefit was partly offset by approximately 5 million US dollars of lower tariff related compensation, mainly due to an IEPA related refund of 9.6 million during the quarter. Excluding currencies, our organic sales grow 27 million U.S. dollars all by 1%, including negative tariff cost compensation. Based on the latest light vehicle production data from S&P Global, we outperformed the market by over 1 percentage points globally. Our outperformance was significant in Asia. In Asia, including China, we outperformed the market by 6 percentage points, driven by continued strong sales growth in India, where we outperformed by around 20 percentage points. Japan and South Korea also contributed to the outperformance. In China we delivered out performance of more than seven percentage points supported by strong sales growth with Chinese OEMs whose production grew over 40 percentage points faster than light vehicle production. As a result the Chinese OEMs accounted for 55 percent of our sales in China in the quarter, compared to 40% last year. The negative performance in the Americas can partly be attributed to lower tariff compensation following the AIPA refund, as well as an unfavorable mix driven by strong livestock production growth in lower content South American markets. Globally, Cherry, Suzuki, NIO were the largest drivers of sales growth during the quarter. Despite the light vehicle production decline in China, China accounted for 90% of sales. Asia excluding China also accounted for 90%. America for 32% and EMEA for 30%. Looking now on the next slide. The second quarter of 2026 saw a high number of new launchers, primarily in China, with both Chinese and other brands. These new China launches reflect strong momentum for autolead in this important market. Higher CPV is driven by front-center airbags on many of these new leads. In terms of Autoliv's sales potential, the NIO ES9 is the most significant in the quarter. For the rest of 2026, we expect a high number of new current launches, mainly driven by Chinese OEMs, offsetting fewer launches in America and Europe. Let's continue with the next slide. I will now hand over to Monica.
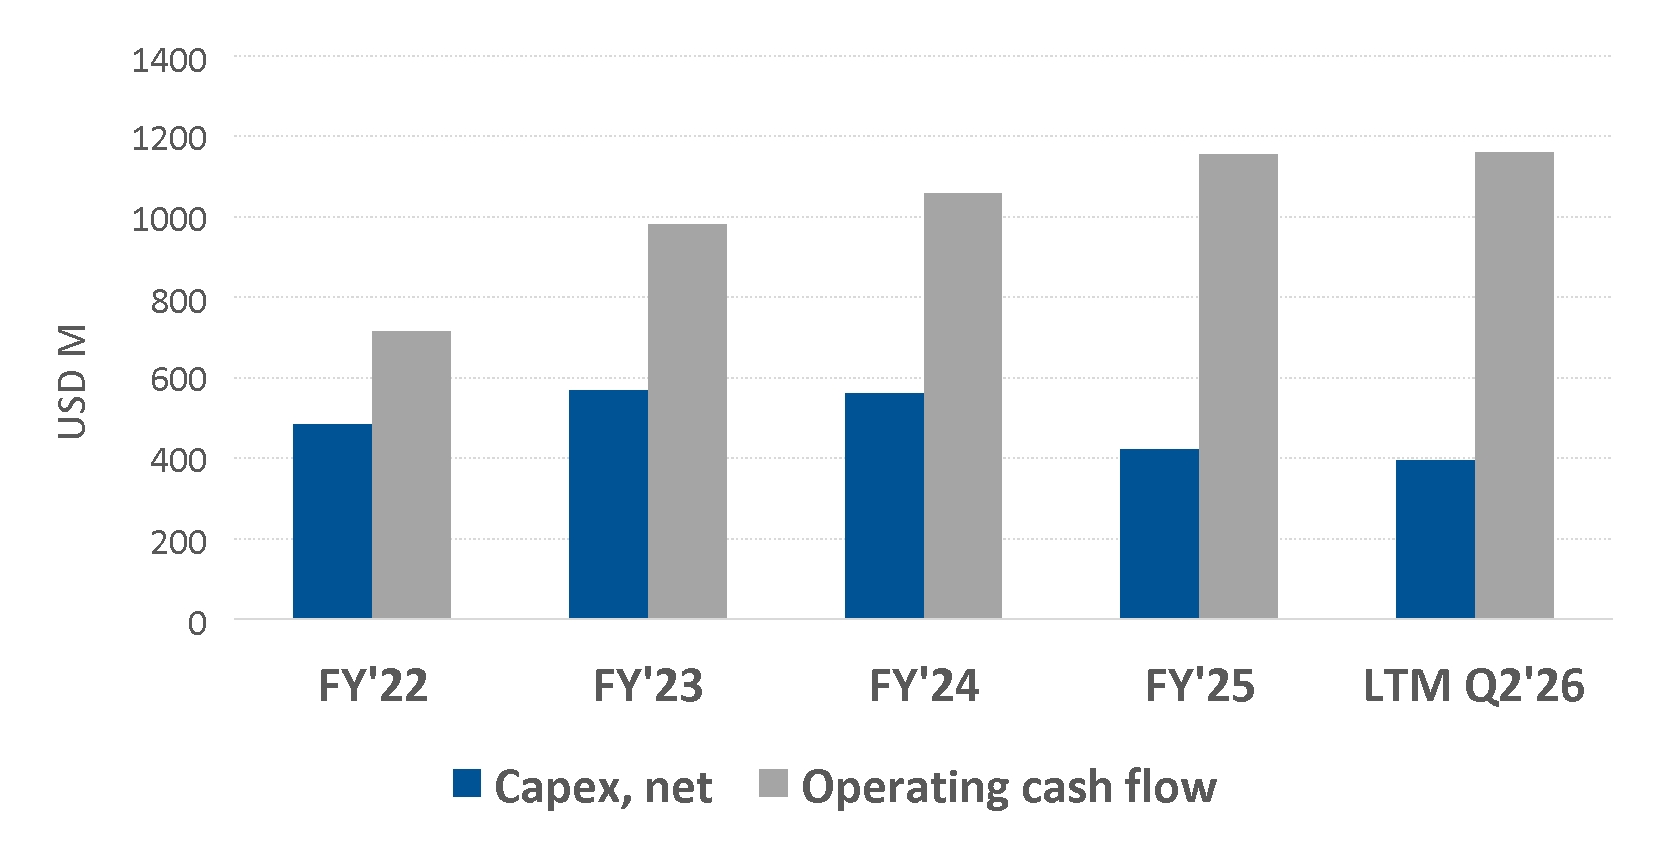
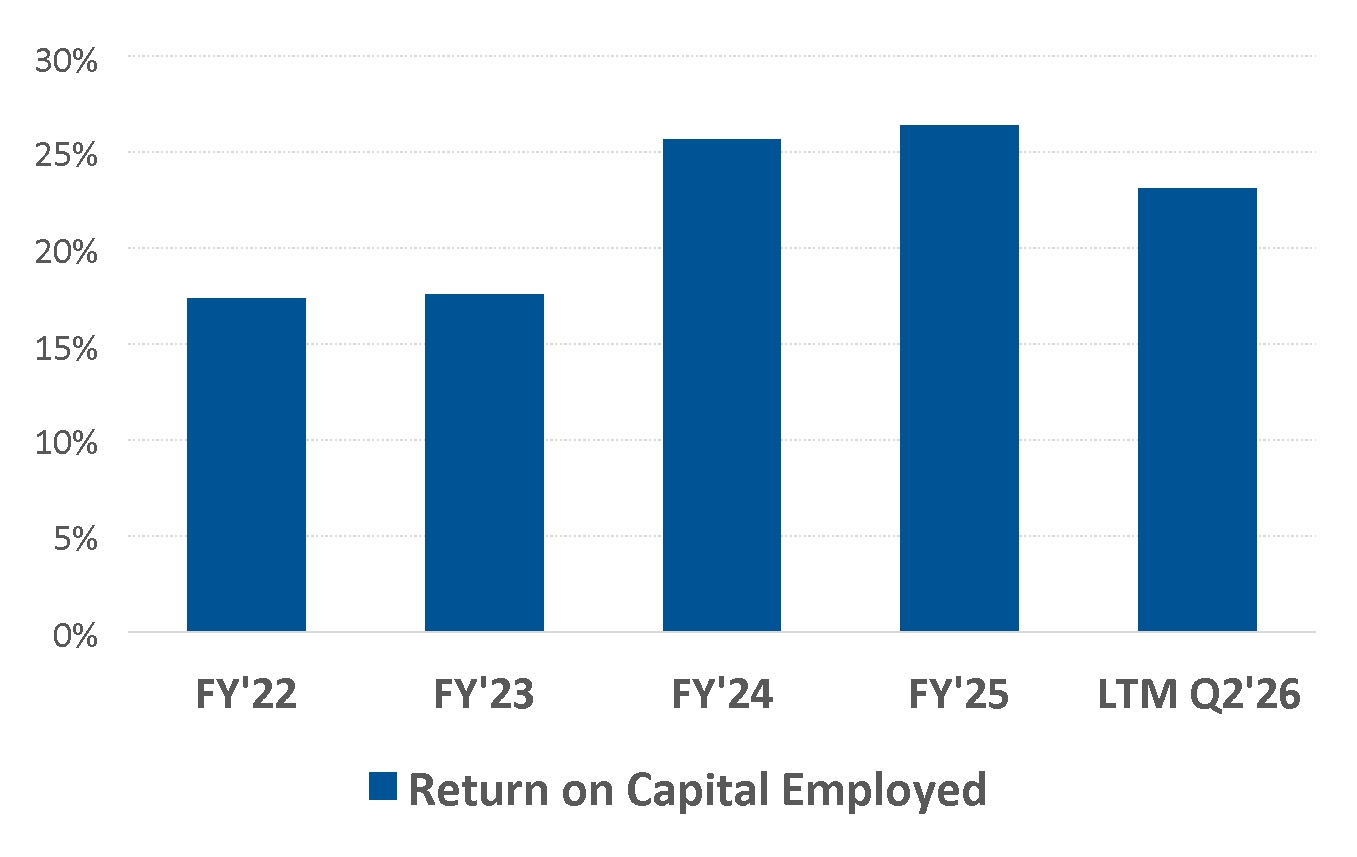
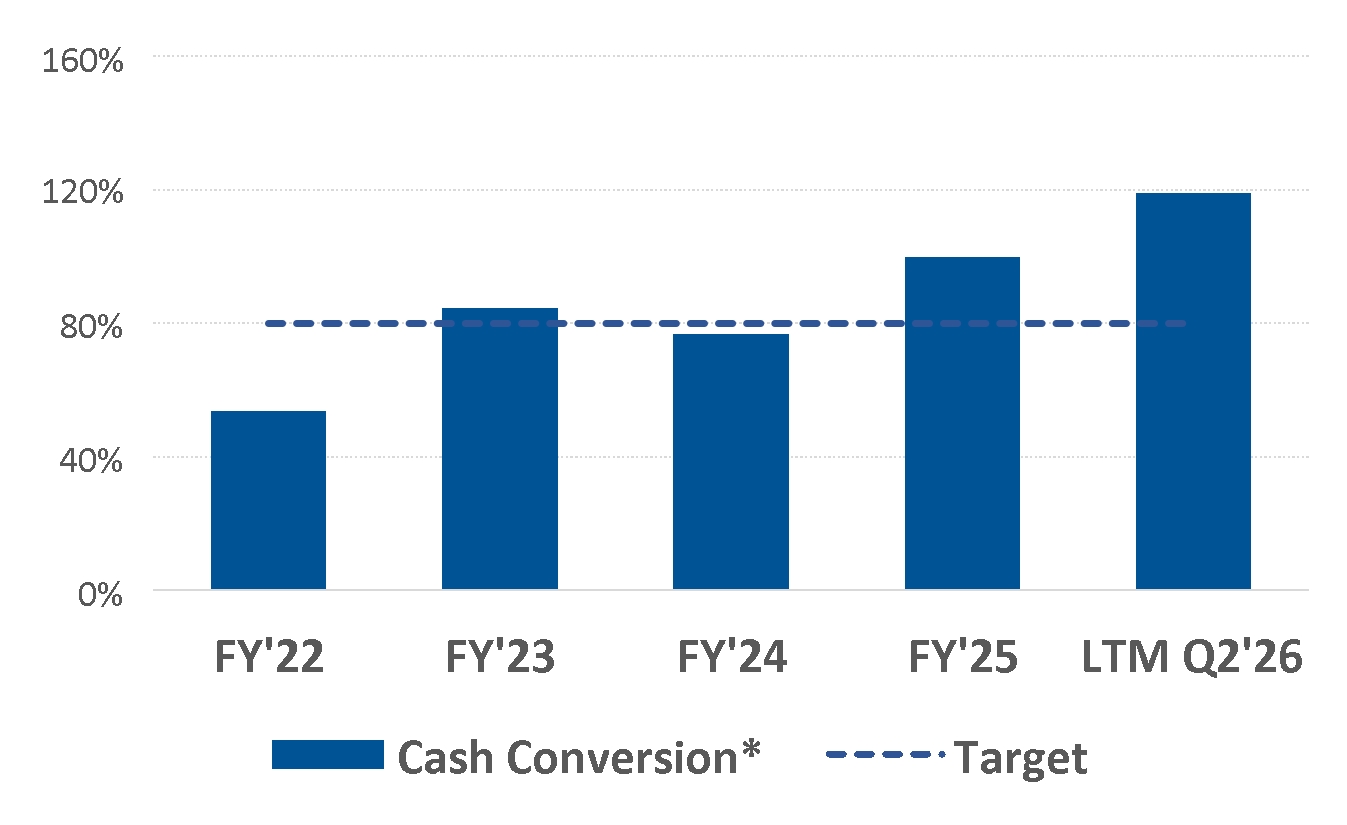
Thank you, Mikael. I will talk about the financials more in details on the next few slides. Turning to the next slide. This slide highlights our key figures for the second quarter of 2026 compared to the same quarter of 2026. Our net sales were 2.8 billion, representing a 3% increase. Gross profit increased by 8 million and gross margin decreased by 30 basis points. The drivers behind the gross profit improvement were mainly positive ethics effects and lower costs for materials. This was partly offset by $13 million in costs for a supplier compensation reversal and $9 million in asset impairments related to the restructuring of the system. The adjusted operating income increased from $251 million to $270 million, and the adjusted operating margin increased from 9.3% to 9.6%. The reported operating income of $192 million was $78 million lower than the adjusted operating income, mainly due to higher capacity alignment activities. The adjusted earnings per share, diluted, increased by $0.23 to $2.43. The main drivers were $0.18 from higher operating income, $0.10 from lower number of outstanding shares, diluted, partly offset by $0.07 from higher taxes. Our adjusted return on capital employed and adjusted return on equity were solid 25% and 28% respectively. We repurchased shares of $200 million and paid a dividend of $0.87 per share. Looking now on the adjusted operating income bridge on the next slide. In the second quarter of 2026, our adjusted operating income increased by $18 million. Operations contributed $61 million, primarily driven by higher organic sales and cost reductions supported by better all-off stability. This was partly offset by $15 million in cost for a supplier compensation reversal, Excluding $6 million of FX translation effects and the supplier compensation reversal, RD&E net and SG&A increased by $6 million, partly driven by $5 million lower RD&E reimbursements. During the quarter, we recovered approximately 83% of our U.S. service costs, excluding IEPA-related recoveries, bringing our year-to-date recovery rate to 78%. The combination of unrecovered tariffs and the diluted effects of the recovered portion was around 20 basis points negative. However, compared to last year, it was a positive impact of around 15 basis points, as the negative effect of last year was around 35 basis points. Looking now at cash flow on the next slide. Operating cash flow for the second quarter was $434 million, an increase of $157 million. This change was primarily driven by a positive working capital impact of $240 million. The working capital contribution reflects a normalization following the first quarter increase, which was largely driven by the high sales level in March 2026 and several adverse one-time impacts. The improvement was primarily attributable to changes in accounts payable of $120 million, net receivables of $35 million, and accrued severance and restructuring costs of $48 million. Free operating cash flow improved by $177 million to $340 million. Year-to-date operating cash flow increased by $4 million to $359 million and free operating cash flow improved by $31 million to $178 million compared to the prior year. Capital expenditures net for the quarter decreased by $19 million. Capital expenditures net in relation to sales was 3.4% versus 4.2% a year earlier. The lower level of capital expenditures net is mainly related to lower footprint optimization and less capacity expansion. The cash conversion for the last 12 months was 119%, exceeding our target of at least 80%. Now, looking on our debt leverage on the next slide. Autolive's balanced leverage strategy reflects our prudent financial management, enabling resilience, innovation, and sustained stakeholder value over time. Our leverage ratio improved from 1.3 to 1.2 times during the quarter, despite shareholder returns totaling $264 million. A net depth decreased by around $75 million in the quarter, while the 12-month trailing-adjusted EBTA increased by $33 million. On to the next slide. I will now hand it back to Mikael.
Thank you, Monica. I will talk about the outlook for 2026 more in detail on the next few slides. Turning to the next slide. Overall, S&P Global expects global light vehicle production to decline by 2.3% in 2020, representing an almost two percentage point downward revision from its general forecast. The downgrade is primarily driven by lower production expectations in China and Middle East, while many other markets continue to demonstrate notable demand resilience. In Europe, light vehicle production is expected to decline by nearly one percent, reflecting on growing affordability challenges and increasing competition from Chinese imports. For North America, S&P Global has revised its outlook upward and now expects production to decline by only one percent in 2006. The market continues to display resilience despite by uncertainty related to the conflict in the Middle East and the higher fuel prices. S&P Global has lowered its outlook for China, like vehicle production, by 4 percentage points since January and now expects a 5% decline in 2026. The weaker outlook reflects the challenging demand environment driven by reduced government incentives. Ongoing macroeconomic headwinds and increasingly cautious consumer sentiment despite continued strength in the vehicle export. S&P Global has revised its light vehicle production outlook upward for both Japan and South Korea and now expects production to decline by only one percent and two percent respectively. The improved outlook reflects strengthening exports to the US and Europe, supported by a robust demand for fuel-efficient hybrid electric vehicles. India's light vehicle production is expected to increase by 9%, driven by a reduction in purchase taxes on new vehicles, which benefits smaller and lower priced models. However, escalating your political tension in the Persian Gulf, continue to increase risk across automotive value change with potential implications for energy prices, consumer sentiment, supply chain stability, raw material availability and overall industry volumes. Now looking on the second half year development on the next slide. As we look ahead to the second half of the year we remain focused on managing a dynamic external environment. We are closely monitoring the potential impact of geopolitical development in and around the Persian Gulf, which could affect supply chain, raw material costs and overall vehicle demand. Our 2026 guidance currently assumes a gross raw material headwind of approximately 110 million US dollars and we continue to evaluate multiple scenarios as the situation evolves. Despite these challenges we expect margin expansions to be supported by FX, engineering income and customer compensations. For the third quarter we expect the adjusted operating margin to be similar to the first half year level. Importantly, customer compensation, engineering income and other litigation initiatives are expected to be weighted toward the fourth quarter, resulting in a significant step up in profitability in the fourth quarter. Therefore, the earnings trajectory in 2026 is expected to be similar to that of 2023 and 2024. Reflecting both the timing of anticipated compensation and the typical seasonal ramp up in profitability and operating leverage. Now looking on the updated full year guidance on the next slide. This slide shows our full year guidance which excludes effects from capacity alignment and antitrust related matters. It is based on no material changes to tariffs or trade restrictions that are in effect as of July 9 2022, as well as no significant changes in the macroeconomic environment or changes in customer full of volatility or significant supply chain disruptions. We expect to outperform light vehicle production by around 2.5 percentage points as our organic sales is expected to be flat, while global light vehicle production is expected to decline by 2.5 percent. The net currency translation effects on sales is expected to be around 2.5 percent positive. The guidance for adjusted operating margin is around 10 and a half to 11 percent. Operating cash flow is expected to be around 1.2 billion US dollar and we expect capex to be below five percent of sales. Our positive cash flow and strong balance sheet supports our continued commitment to a high level of shareholder returns. We expect a tax rate of around 30 percent. Looking on to the next slide. This concludes our forum and comments for today's earnings call and we would like to open a line for questions from analysts and investors. I now hand it back to our operator Sandra.
Operator
Thank you. As a reminder to ask a question please press star one one on your telephone and wait for your name to be announced. To answer your question, please press star one and one again. We will now take the first question from the line of calling from Wells Fargo. Please go ahead.
Oh, great. Thanks for taking my questions. You know, if I look at your comments about the cadence of margins, I think you had previously you said it would be more linear. Now it sounds, I think the math is something like you need a 15% margin in Q4 to kind of get to the midpoint of your full year guidance. What changed and how maybe we should think about raw material costs? I think year to date, you had 26 million. Is that a similar number in Q3? And is all of that recovered in Q4? And is that why we have this, is that a big driver of the Q4 spike is the recovery of all that raw material in Q4?
Thank you for the question there. I mean, as you said, I mean, when we started this year, our expectation was that we could see more of a, let's say, normal, traditional sequence of how the quarter played out in And now we're talking about the more back-end loaded and the reason and why it's more back-end loaded is because we see the inflationary pressure here in the value chain as a result of the Persian gold. So I think what has changed is really that upward pressure on the cost side. And for us, you know, we don't buy raw materials directly, so it's through our supply chain and we have a time lag there, but we also have, I should say, a diluting effect of the hype of it as well. But we need to get that through and then enter into the negotiations with our customers here on the price adjustments. So the way of working is very similar to what we saw, if you call it during the inflationary years, then 2023, 2024, as we refer to here. So that is really the change compared to when we talked about before. And let me just say that also that, I mean, I feel very comfortable in how this tractor look like, because I mean, first of all, we have done it before. Secondly, we are very focused around the different activities to secure the outcome here, meaning that it's a combination, of course, of our internal work here to drive efficiency and cost improvement in general. And here we also, as we say in the report, we have a good momentum in what we do there. And that's why we feel comfortable here to retain and maintain the fully guidance. And then in combination then with the discussions where you have the lead time with our customers. And also here, I would say we have well-established routines also to manage that. So, yeah, I mean, we have clear activities here to do and have confidence in our ability to work on that.
And we should expect almost 100% of the raw materials recovered, just to clarify, or is there still some exposure net for the year because of timing?
No, I mean, it's a combination of, let's call it self-help, meaning that we need to do our bit here with making sure that we don't let through everything from our suppliers here. So we're working with our suppliers to make sure that we are as efficient as possible in this environment there. And then we have also cost out activities internally in the company. And then the third leg is the price adjustments with our customers here. So as you know, the price negotiations with the customers is also very detailed. It's not the general percentage adjustment, it is really down to the components level here to see how the different components have been impacted by customers. So hence the lead time also. But there are several levers to work with how to offset the inflation.
And this last question, you lowered production from one to down two and a half. What is the offset? Is that better growth over market? And where are you seeing that sort of better than expected growth that's offsetting the production weakness? Is that maybe a geographic mix help?
No, I think, I mean, what we see here is that we have a positive mix with how the market is developing. And we also have good growth with our Chinese customers here, India is also contributing So, I think we are in the right places here to capture the growth that actually is out Got it.
All right, thanks for taking my questions.
Operator
Thank you. We will now take the next question from the line of Emmanuel Rosner from Warsaw. Please go ahead.
Great. Thank you so much. One follow-up on the cadence, please. Are you expecting, just to be clear, are you expecting most of the mitigating impact from the recoveries and from your own self-help to happen in the fourth quarter? I'm just trying to understand the delta between what you're saying for Q3 margins and then what maybe consensus expectations were. That's probably like $35 million delta. Just curious, are these unmitigated headwinds in Q3 and then you get it all back in Q4?
No, I mean, the majority is in Q4. I think that's how you should read it. I mean of course we are managing part of it in the third quarter but as a natural progression also if you look at the engineering income it's mainly in the in the fourth quarter rather than in the third quarter so I think that's quite naturally. So it's really engineering income, it is also the higher customer compensation that we talked about here for the inflation And I think if you look at the sales progression, it's also for the remainder of the year, and also geared towards the fourth quarter. So that's really the reason for that.
Understood. And then can you give us a little bit more color around the IEPA refund dynamics, I wasn't able to follow exactly to what extent it helped your EBITs in the quarter and what to expect on a full year basis.
So right now in the quarter, we got back around $12 million from the government, which we largely passed on to our customers around $9 million. So we retain a positive impact of $3 million in the net results. And as mentioned previously, our aim is to recover the tariff or the net impact of the tariff on year-to-date to a large extent on year-to-go and to reach a similar recovery rate that we had in the prior year, which was around 5%.
Understood. Thank you very much. Thank you.
Operator
Thank you. we will now take the next question from the line of tom narayan from rvc please go ahead yeah hi thanks for taking the question i have a follow-up to colin's question on the growth over market um you know i remember at the at the investor day in sweden and we we heard a lot of the story about how we're going to see you know good growth over market coming from you know increasing content per vehicle especially from emerging markets um you know you are calling for two and a half percent growth over market this year i know there's some offsets right notably america's in this past quarter was down five percent so i just wanted to understand that a little bit more i know in the report there was a call out of south america which had i guess lower content per vehicle um and then on replacement vehicles but does this mean that the growth in south america were happening in vehicles with no safety content it's just you understand why it would be down five percent i know that's versus a very strong market level in south america but you know if you have any uh safety content i would think it would be up i just want to understand that better and then i will follow up yeah i mean uh maybe let me start to recap here and because
i mean when we talk about the growth and the capital markets they mentioned here i mean it was really three uh significant buckets we talked about here one was lvp one to two percent it was then uh the content that's one to two so i mean if you imagine a flat lvp uh you had a content growth there are one to two percent on top of that. And what we're talking about now here is really that we see a market that is down with two and a half percent, the LBP portion of it. And then of course we have mixed effects here connected to the content very much. And what we talk about here is when South America is growing and the U.S., if we stay in America so to speak, just to simplify a little bit, which is the high content is flat or even go down. Of course, you have, even if you have growth in South America content, it's not enough to offset what's going down in the high content markets. So there, of course, you'll get a negative mix effect on the content side. So long story short, we definitely see that the content growth is there. And we see also how both, let's call it, the low content markets are growing in the content as well as the high content over time here. And when we talk about India specifically, it's very much so that it's a content driven growth that we see. I mean, the last two years, the content have grown sequentially with 20% two years in a row. So, a strong growth there. So, what we try to convey there, the market definitely still holds here. But unfortunately, you have a mixed effect here that is not moving the full potential here.
Operator
Okay, understood.
And then my follow-up, I guess, what was, I guess, the rationale to move production from Turkey to EMEA? was it cost saves coming from a plant maybe that wasn't as automated was it was it labor was it labor i guess what was driving that decision thanks no i think i mean we we constantly uh review our our global footprint and and here we talk about emea where we have over the last couple we have taken significant steps to consolidate our activities and optimize them as we move forward. And that's something we have done and we continue to do going forward also to ensure that we have the most competitive setup. And we saw here now that with the opportunity to continue to consolidate capacity into other sites in Europe. We have a strong business case to do so and you have seen the numbers and all the numbers here and that's of course a tough decision to take and painful for our colleagues in Turkey that have done a great job over the years but we need of course to make sure that we maintain our competitiveness. So we're moving some to our Tunisian operations that has been a growing plant over the last couple of years here, and we're also moving into other sites in Europe and Romania, for example. So it's to continue to sharpen our position here.
Operator
Thank you. We will now take the next question from the line of Winnie Dong from Deutsche Bank. Please go ahead.
Hi. Thanks so much for taking my question. I just wanted to follow up on your production assumption for the full year a little bit more. So now you're assuming, you know, two and a half percent decline. Previously you were at, you know, one percent. I think lately IHR has actually improved the alg a little bit. So I just wanted to understand if there's a mixed situation that's going on, and if you can help us triangulate what you're seeing and if you're just chewing up to what the market is trending towards. Thank you.
Thank you for your question. I think S&P now is at minus 2.3. We are at 2.5. I would say that's about the same level. It's more than a difference here. And I mean the big move you could say here is that we have seen a more weakening, a deeper weakening in China than expected here. To some extent also the Middle East, but Middle East is still a very small part of the total picture here.
I think it's less than two percent when you talk about Middle East Africa can hear and so I mean it's really about the weekend in China domestic sales and domestic operations at least the train yeah okay okay gotcha thanks that's helpful and you do have very good momentum you know happening in China and I know it's kind of difficult to delineate you know the strength between domestic, which is in a lot of weakness right now but export is actually very very strong. But is there like a general framework on how we can think about you know how much the exports is actually contributing to your outgrowth in China?
I think it's, I mean it's not really, I mean for us it's all domestic you could say that we're delivering in there because we don't have separate value chains or separate setups if it's an export vehicle or it's a domestic. So we don't really see that split from our perspective. So for us, it's all domestic sales to domestic plants. But I mean, you're absolutely correct here that the production level is holding up better than what the domestic sales to the end consumer would indicate. So our chain operation is definitely supported by the exports here. And yeah, I think we will see going forward here. But when we talk about the adjustments we just mentioned here to the minus 2.5, it's the net effect of that, of course.
Operator
Gotcha. Thank you so much.
Operator
Thank you. We will now take the next question from the line of Hampus Engelau from Handelsbanken. Please go ahead.
Thank you very much. One question for me, it's relegating to the Turkey production closure, but also going back to your capacity line and program in Europe. I'm not sure exactly updated, but that initially was about 8,000 people and this is additional 2,200 people. I'm just trying to understand where you are now in terms of headcount and where you see demand trending. Is this a part of the optimization program that you have been running since 2019? Or is it also that you see that you need less capacity or have had too much capacity? Interesting to hear your thoughts on these different parameters. Thank you.
Thank you, Ampo. Because I think, as I alluded to before, I mean, it's a constant review of how to optimize your production facilities. And when it's not like we had an overcapacity necessary in Turkey, but we had an overcapacity in the whole system here where we saw opportunities to consolidate even further. And, I mean, you're correct in the way to say that, you know, the optimization definitely contributes to our opportunity to put more into the existing plant somewhere else. And when you drive the optimization, you can also create the flexibility we have talked about before, and we can also see that with an efficient, optimized and flexible setup, you need less square meter to produce the same amount. So when you harvest that, so to speak, you come to this kind of decisions every now and then, where you're actually looking at the complete site and by then consolidating it in. So it's a way of harvesting the continuous improvement or also the step changes that we've seen as a result of new technology. All right. Thank you. Thank you.
Operator
Thank you. We will now take the next question from the line of Itay Mikaeli from TD Cohen. Please go ahead.
Great. Thank you, everybody. Just two follow-ups for me. Just first, back to the margin guidance, just given the updated cadence for the year, is there any bias at this point towards the lower half or upper half of your full-year margin range?
No, as you see here, we haven't expressed an upper or lower end or any more position than what we have here, which is within the range of around 10.5 to 11. And I think, I mean, if you ask me, which I think you do, why we are not more precise here, It is really that we see with everything going on here that it is difficult to be more precise than what we are with the interval here, and I think the interval here reflects the volatility in the market, so to say, and uncertainty when it comes to the market in whole, and also this inflation pressure here, if it's a if it's a long-term thing or if it's more of a short-term thing. But with what we see right now, this is the best judgment we can do now that we should be within that range.
That's helpful. Thank you. And as a quick follow-up, can you maybe comment on order intake trends in the quarter if you've seen any improvement there?
And maybe how just like order intake the last couple of years just maybe impacts how we should think about your growth over market in americas and europe say over the next 12 to 24 months yeah i mean we don't disclose any details around the current ordering take more than i can say that i feel comfortable that we have activities in this area that supports uh depending our market share here which is around 45 percent uh i would say as always you start out the year where you have a lot of indications that it will be at a certain level, and then as the year plays out, some things are being pushed out to the next year, meaning that the OEM decides to delay the decision and so on. And in these circumstances that we have right now, with a lot of questions around the sentiment in the market, the driveline issues and so on that we saw taking place maybe a year and a half ago when some reshuffling in the model programs took place. I would say to some extent that it's partly going on but it is a reasonable activity level year when it comes to tenders that are out there. And so all in all I think we are in good shape here to defend our market share and I would say also activity level wise it's a decent year great but that's very helpful thank you thank you thank you we will now take the next question from the line of Agnieszka Vilela from Nordea please go ahead thank you and hi Michael, Monica, and Anders.
I have two questions. Starting with your growth of the Chinese OEMs, I mean, you have been very successful increasing your sales towards them, and you announced also the new cooperation with Xpeng and Great Wall.
Overall, do you expect that the growing China mix in your sales will have neutral, positive, or negative impact on your group content per vehicle and on your profitability as you know the profitability part uh i can't go into the details here uh and i'm gonna say it's more more pro platform program by a platform program than anything else but in terms of our growth uh opportunities here i definitely see this is a very important and great opportunity to secure our future growth here. As you see in here, I mean, we have grown from 22% of our China sales in 2022 to 55% of our China sales now in Q2 at the same time as the China OEMs have taken their share of the lightweight production from roughly 43% in 2022 to 72% now in the second quarter of this year. So the combination here of us increasing with them as well as they increasing their share of lightweight production contribution is very positively opposed to the growth, but also to securing our position in China here as the market leader and also with the opportunities that may be in the future here also when the Chinese OEM is also moving out their footprint to support more locally integrated in the different regions. But right now you could say it's mainly an export driven activity here, which also supports us of course here. In the quarter here, four out of the eight fastest growing customers are Chinese OEM, so it's very helpful, absolutely, and important. And I think also, just coming back to the agreements you referred to here, it's of course also very interesting opportunities for us also when it comes to driving innovation here, because many of these customers are very innovative in terms of their expectations on the future interiors, and I would say more advanced products to solve more challenging seeking positions, etc. So, very interesting from an innovation point of view as well.
Perfect. Thank you for the caller. And the second question, coming back to growth, looking at your performance in H1, you outperformed the market by two percentage points. But just looking at what you got for the full year, it looks like the outperformance can accelerate to three percentage points. Can you just give us any kind of reasons why and drivers behind this acceleration in outperformance and growth?
Yeah, I think effects is one part of it as well and I think we have also talked here about before a slightly positive effect coming from the mix here because before we talked about more of a flat or a neutral region mix for 26 and now we're looking at you know let's say 40 basis points contribution coming coming from that as well and then of course also you have some some compensation activities here with our customers contribution exactly as thank you thank you thank you we will now take our final question from the line of
dan levy from barclays please go ahead hi uh good afternoon to you thank you for taking the questions um wanted to uh go back to the the question or the point of uh recovery payment can you maybe you just put this in context of how the recovery payments that you're getting or that you're planning to get on raw materials, how that's at all related to the other recovery payments you'd have on other inflationary measures, whether the two are linked. And with automakers, you've had a very good track record in the past of getting recoveries, but with automakers, especially in North America, tighter on pricing, is that at all playing any role in the types of conversations you have on, you know, the magnitude of recoveries.
Yeah, I wouldn't say that there is any difference in the dialogues today compared to what it was, you know, in 25, 24, 23 here. It's never easy, and it has never been. But once again, I think here when it comes to, you know, the different buckets you're referring to here, I mean, tariffs, it's fairly straightforward, I would say, because that's something you have to pay when you cross the border, and it's very easily connected to the value flows you have towards the customer. Now with the 232, I mean, because we are mainly talking about the tariffs between Mexico and the U.S. here, with the 232, it will be almost automized to a large extent when that is fully in effect. Engineering income is also something we're talking about here as a part of the second half. That's also something that is part of ordinary course of business that we have been for years so there's nothing strange there and when it comes to the inflation compensation here we we see then the combination here of of course that we need to do our part here together with our suppliers and our internal efficiency and then come to the customers so it's a mix of the three here and once again it's a very detailed description down to the component level and also here we are all hands on deck and established routines there so I would almost call it business as usual but maybe that's described a little bit too simple but we have a good way to to deal with that part as well and we are progressing as we speak here and no change It's either improved or deteriorated in terms of ability to do it.
Thank you. And as a follow-up, I wanted to ask about the strategic cooperation frameworks you signed with Great Wall and Chapang. Could you just help us understand if you're aiming to set up additional agreements with other automakers? And to what extent does this position you well as you start to look at potential sourcing opportunities for these automakers in Europe? Does this position you to the front as they start to give out awards?
No, of course, it's something that we constantly work with together with our customers. And we have had this type of agreement in the past also with others. which we also have communicated not that long ago. So they are important. I would say I connected very much also to, first of all, the innovation opportunities here, because it really means that we get very close to our customers here by working well in advance with new joint challenges here. So, as I said before, here are different seating positions that is not traditional, but may come when you see autonomous vehicle increase eventually over time. But already today, comfort is a key factor for many OEMs, meaning that you should be able to sit more relaxed, lean back more than what the current setups allow you to do. so we call it the zero gravity seat I think we have spoken about that here also it's an opportunity but further out you go with the ambitions that some of the OEMs have here in terms of creating new interesting vehicles here you have to have more challenging solutions at the end of the day which drives also content I would say And it puts us up to be in the forefront on developing this new type of technologies that is needed in the future. So very, very interesting and a great opportunity to support our customers in a good way. Great. Thank you.
Operator
Thank you. All the time we have for questions today, I would now like to turn the conference back to Mikael Brad for closing remarks.
Thank you, Sandra. Let's look on the next slide here. Before we conclude today's call I would like to highlight our new innovation center in Vårgårda, Sweden which was inaugurated in June and represents an important investment in our future growth and technology. By bringing research, testing, prototyping and pilot production together in one location the center will help accelerate innovation and shorten development cycle. The center also expands collaboration with industry, academia, and society, creating a strong platform for future innovation. We believe this investment will support long-term growth, enhance our competitive position, and help us save even more lives in the years ahead. Finally, the third quarter call is scheduled for Friday, October 23, 2026. Thank you for your attention and until next time, stay safe.