Operator
Good morning. My name is Rob and I will be your conference operator today. At this time I would like to welcome everyone to ADCOR's second quarter fiscal year 2026 earnings conference call. All lines have been placed in a listen-only mode. After the speaker's remarks there will be a question and answer session. If you would like to ask a question during this time simply press star followed by the number 1 on your telephone keypad. If you would like to withdraw your question again press star 1. As a reminder, this conference is being recorded. Thank you. I would now like to turn the conference over to your host, Matt Klein, Vice President of Treasury and Investor Relations. Thank you. You may begin.
Thank you, and good morning, everyone. I'm joined today by Bill Walsh, President and CEO, John Deitzer, Chief Financial Officer, and John Pergenzer, Chief Operating Officer and President of Electrical. We will take questions at the conclusion of the call. I would like to remind everyone that during this call, we may make projections or forward-looking statements regarding future events or financial performance of the company. Such statements involve risks and uncertainties, such that actual results may differ materially. Please refer to our SEC filings in today's press release, which identify important factors that could cause actual results to differ materially from those contained in our projections or forward-looking statements. In addition, any reference in our discussion today to EBITDA means adjusted EBITDA, and any reference to EPS or adjusted EPS means adjusted diluted earnings per share. Adjusted EBITDA and adjusted diluted earnings per share are non-GAAP measures. Reconciliations of non-GAAP measures and a presentation of the most comparable GAAP measures are available in the appendix to today's presentation. With that, I'll turn it over to Bill.
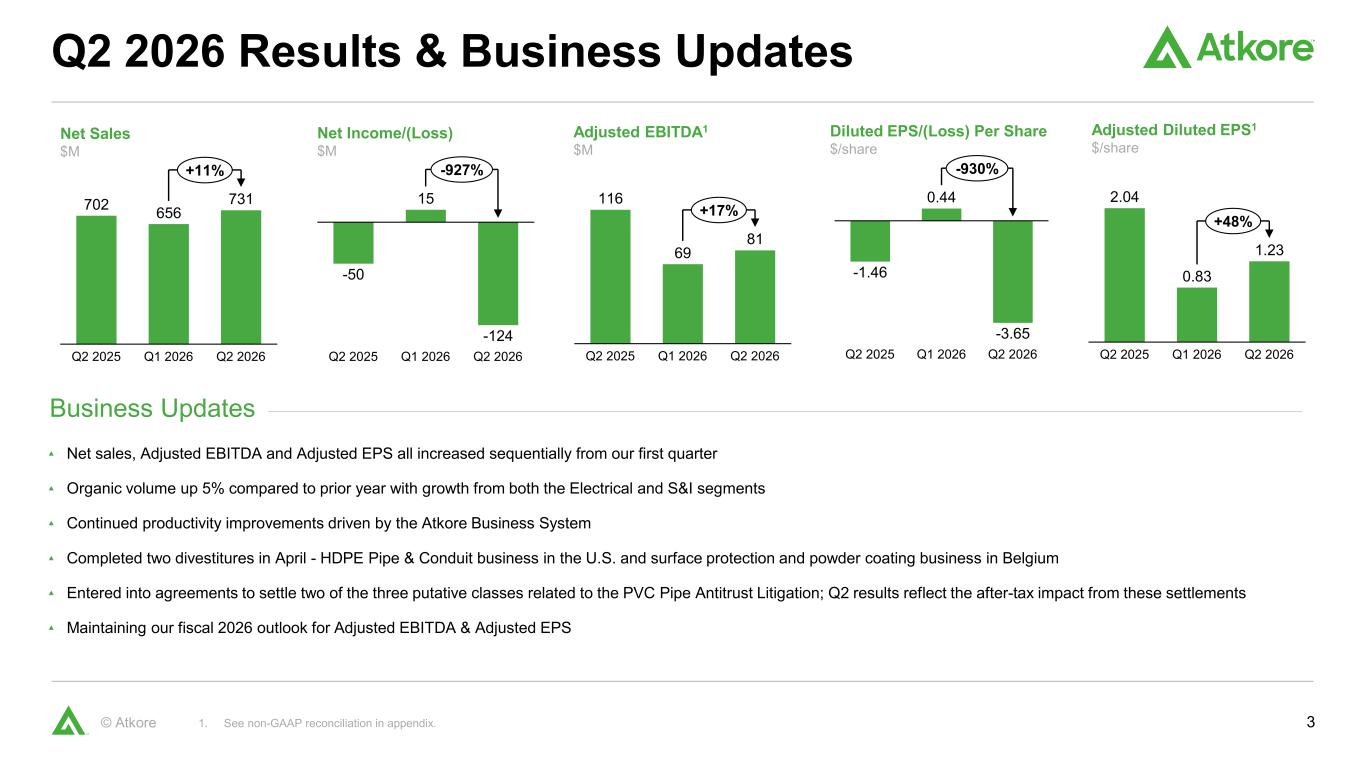
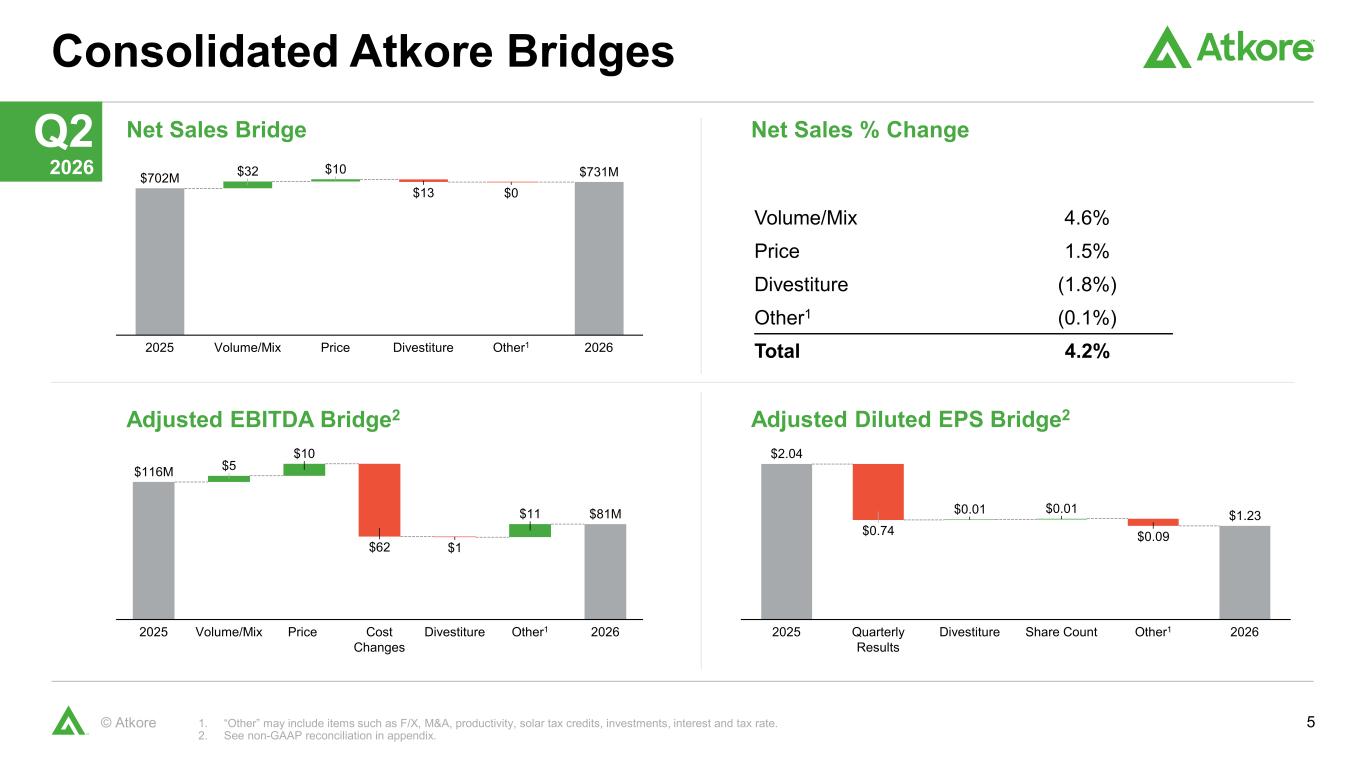
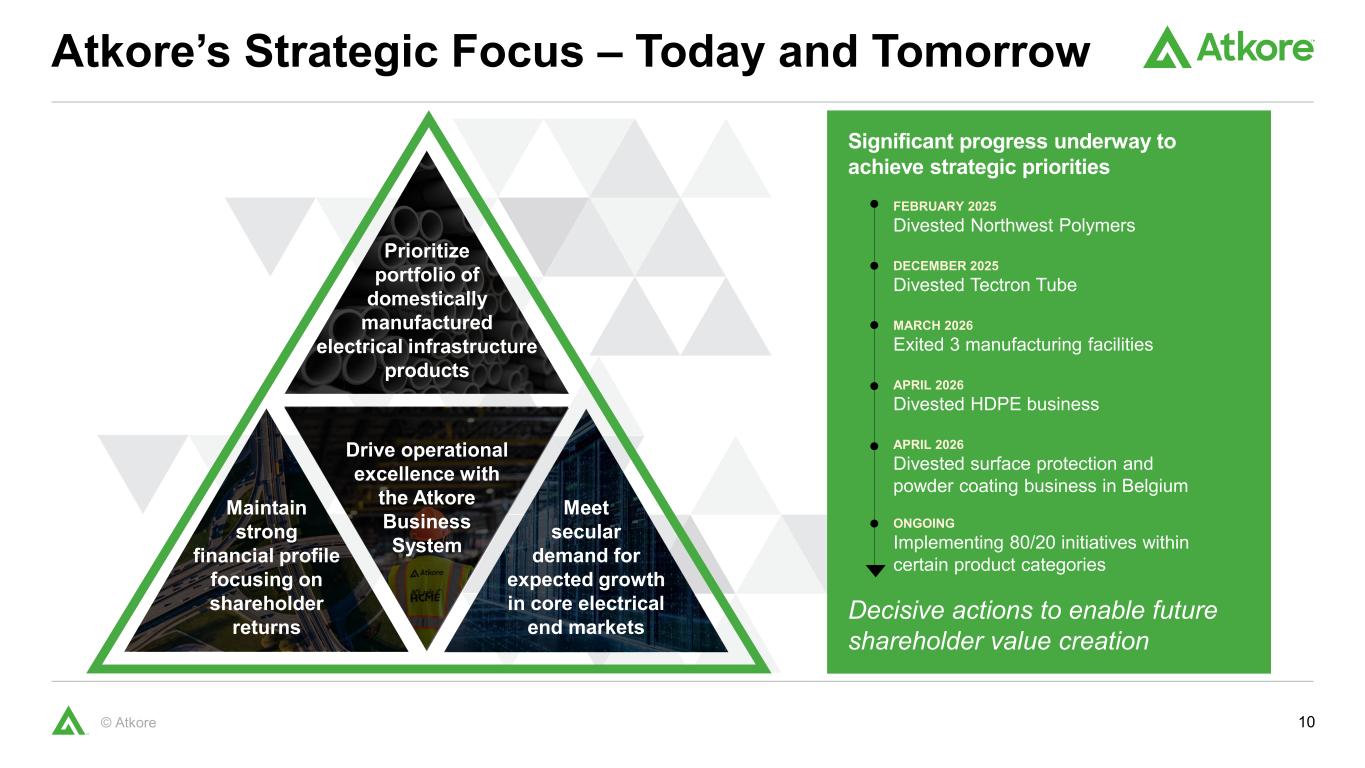
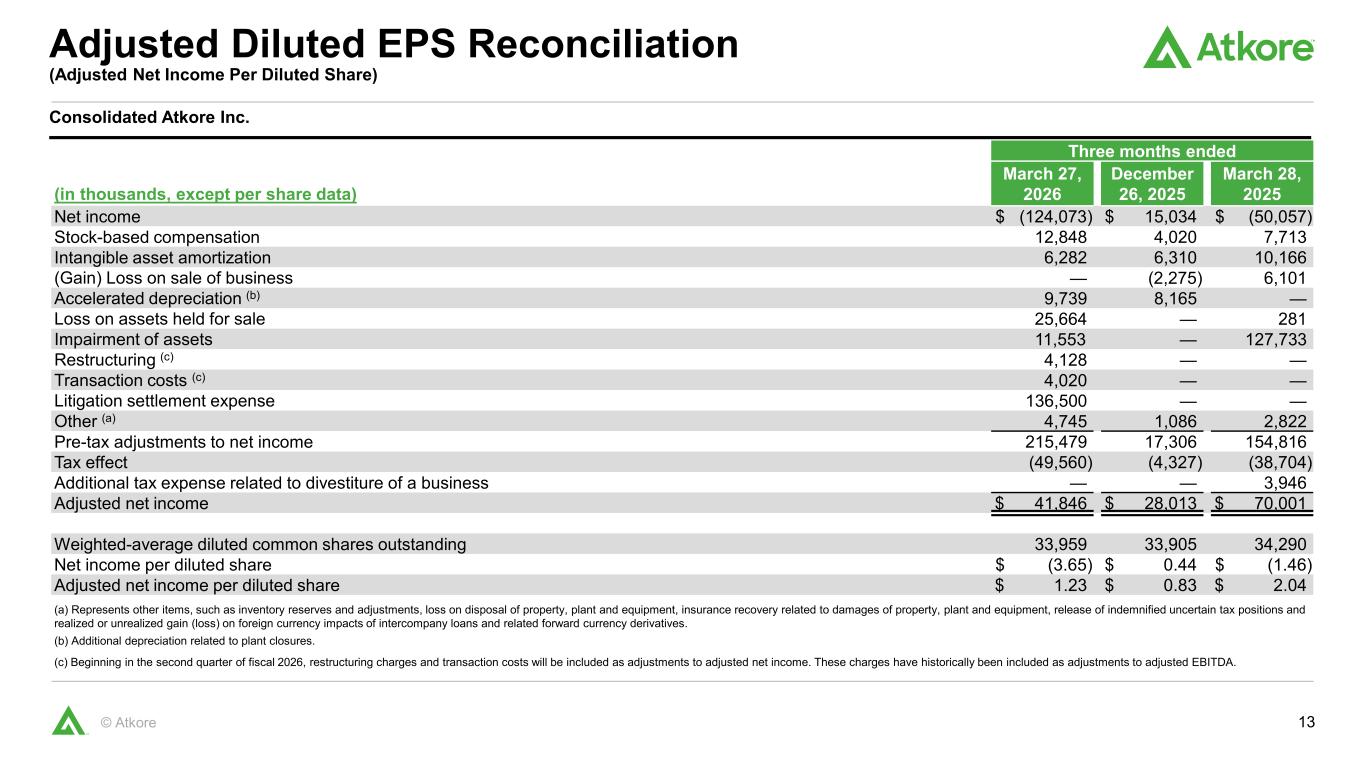
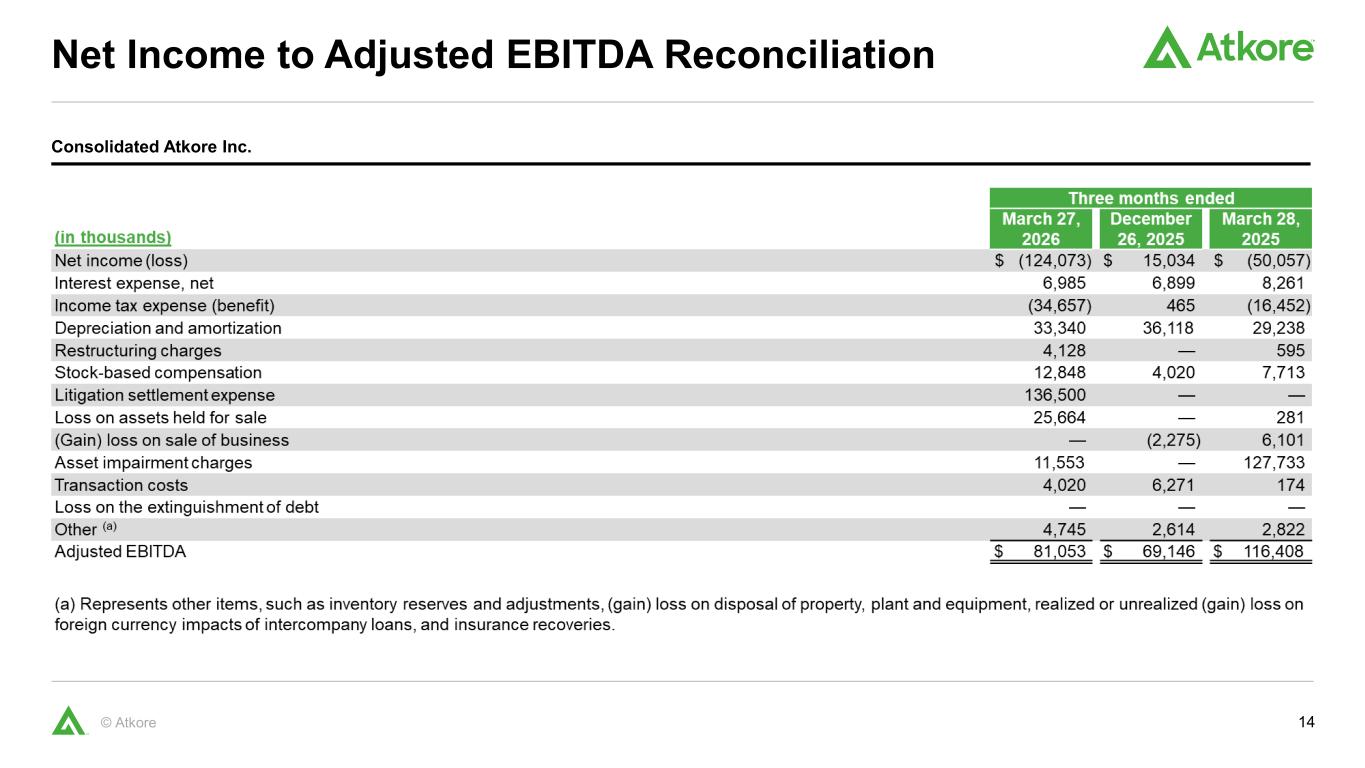
Thanks, Matt, and good morning everyone. Starting on slide three, we are pleased with our second quarter performance. We achieved net sales of $731 million and adjusted EBITDA of $81 million. Adjusted EPS came in at $1.23. All three metrics were sequentially better than our Q1 performance. Organic volume also increased 5% year-over-year in the second quarter, with contributions from both our electrical and S&I segments. Following strong productivity improvements in FY25, we continue to see solid productivity gains again this quarter after a very strong Q1 as well. Our productivity savings reflect our commitment to manufacturing efficiency and cost reduction. After the quarter concluded, we completed the divestitures of our high-density polyethylene, or HCPE, business, and we also just announced the sale of our surface protection and powder coating business in Belgium. We will continue to operate our metal framing and cable support systems facility in Belgium, which supports the electrical infrastructure market. These divestitures are part of a broader review of strategic alternatives, which we announced last year. To date, in addition to the HDPE and Belgium divestitures, we completed the sale of our Tektron tube mechanical product line, ceased manufacturing operations at three U.S.-based facilities, and sold our Northwest Polymers Recycling Business. Each action represents what we believe are initiatives that will enable long-term shareholder value creation. We will continue to provide updates on our ongoing strategic alternatives process as we move forward. In addition, we announced last week that the company entered into agreements to settle two of the three putative classes in the PVC pipe antitrust litigation. The combined proposed settlement for the two putative classes is $136.5 million and is reflected in our second quarter results. We anticipate making payment within the third quarter. Looking ahead to the remainder of fiscal 26, we are on track to deliver our outlook for adjusted EBITDA and our adjusted EPS. At the six-month mark of our year, we remain focused on several continuous improvement and growth initiatives that are expected to create value this year and for many years to come. I'd like to take a moment to thank all of our employees for everything they do to support our key stakeholders. With that, I'll now turn the call to John Deitzer to walk through the results from the quarter and provide more details on our album.
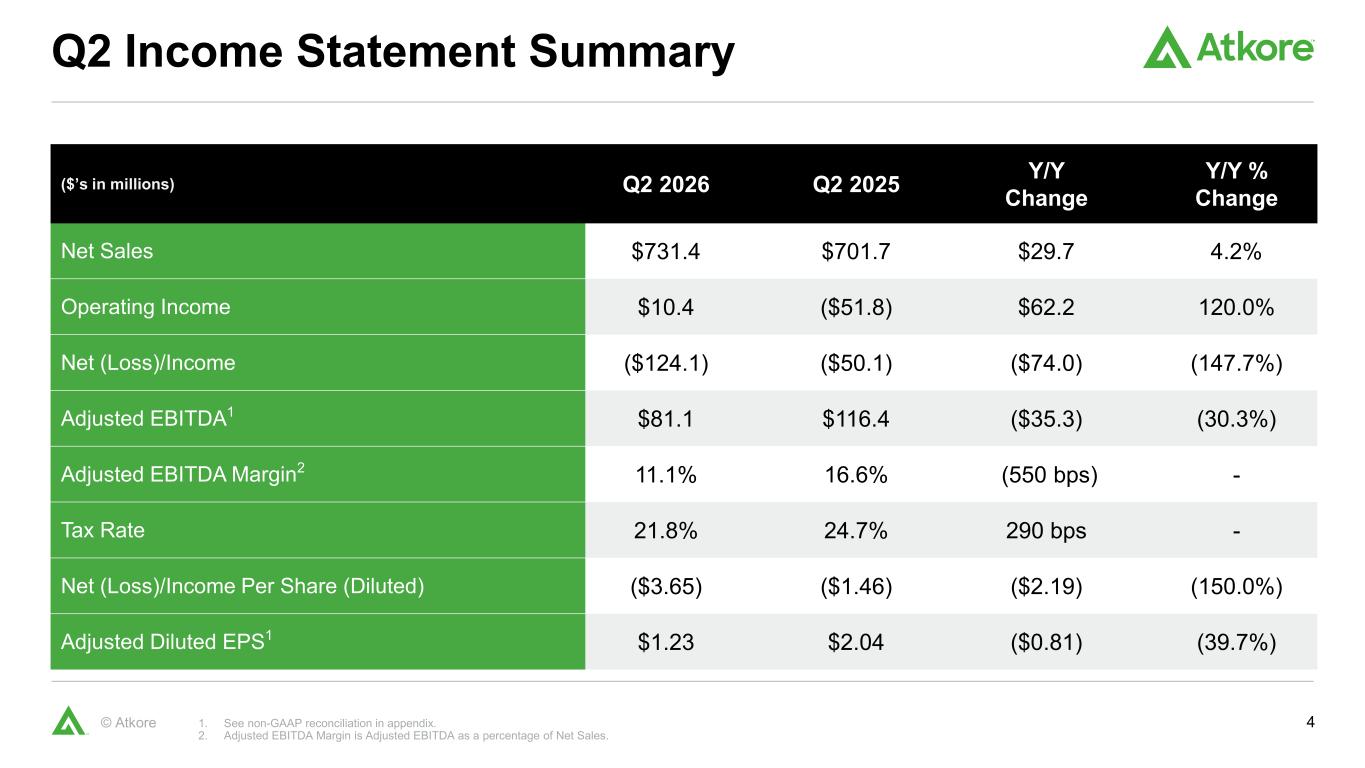
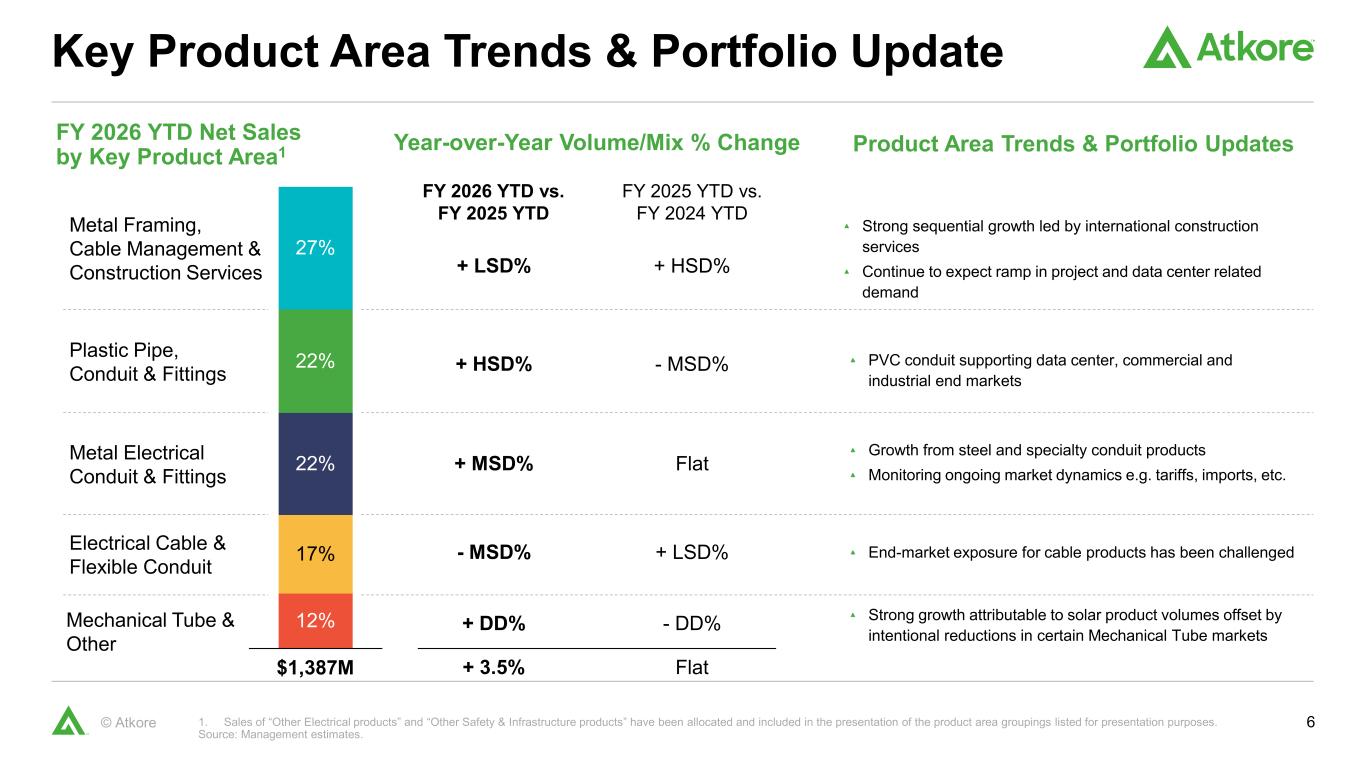
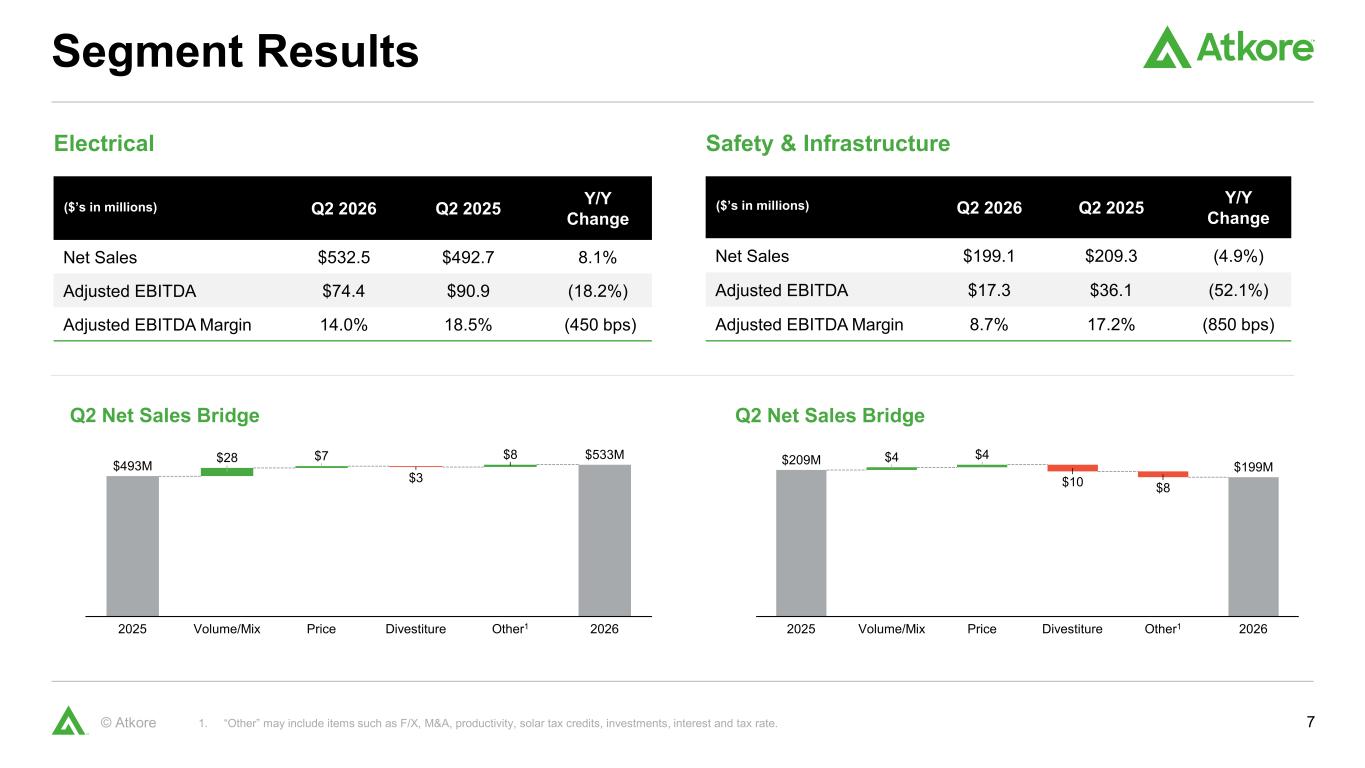
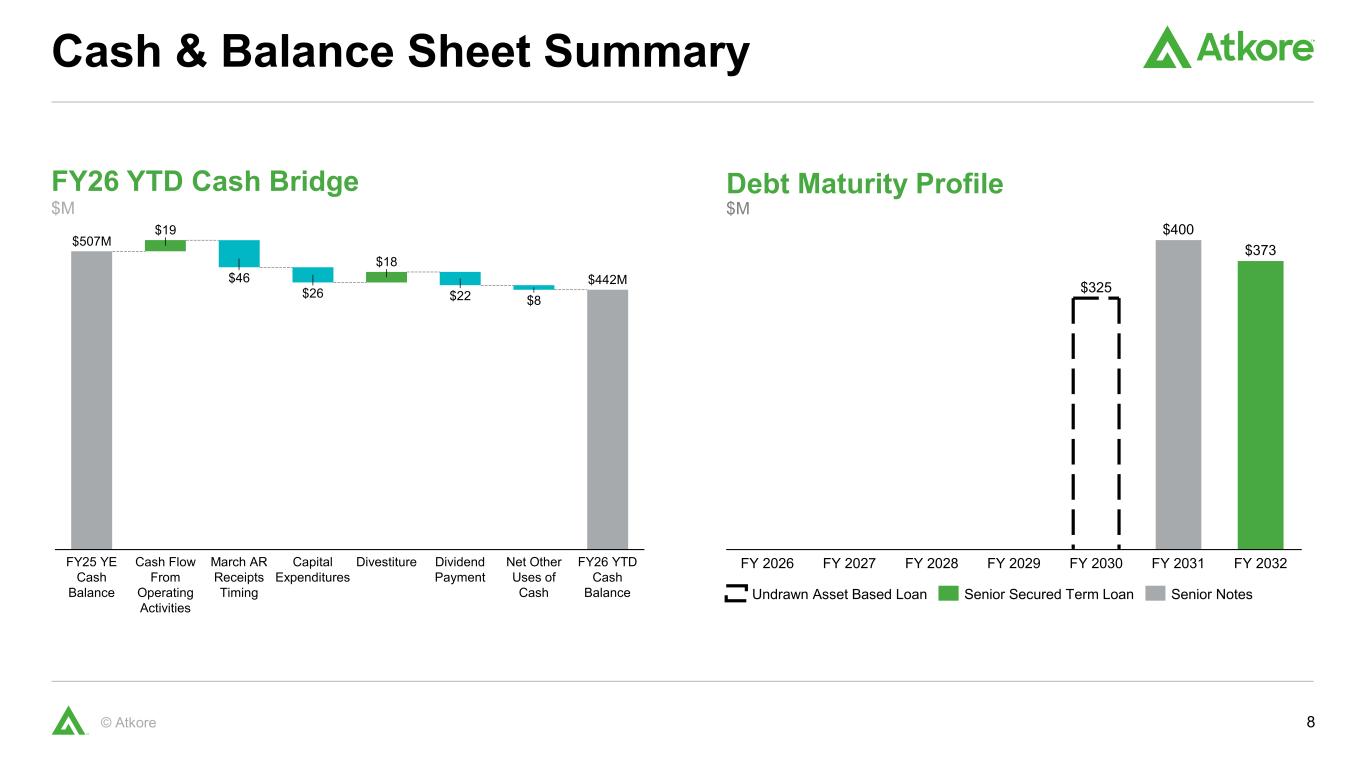
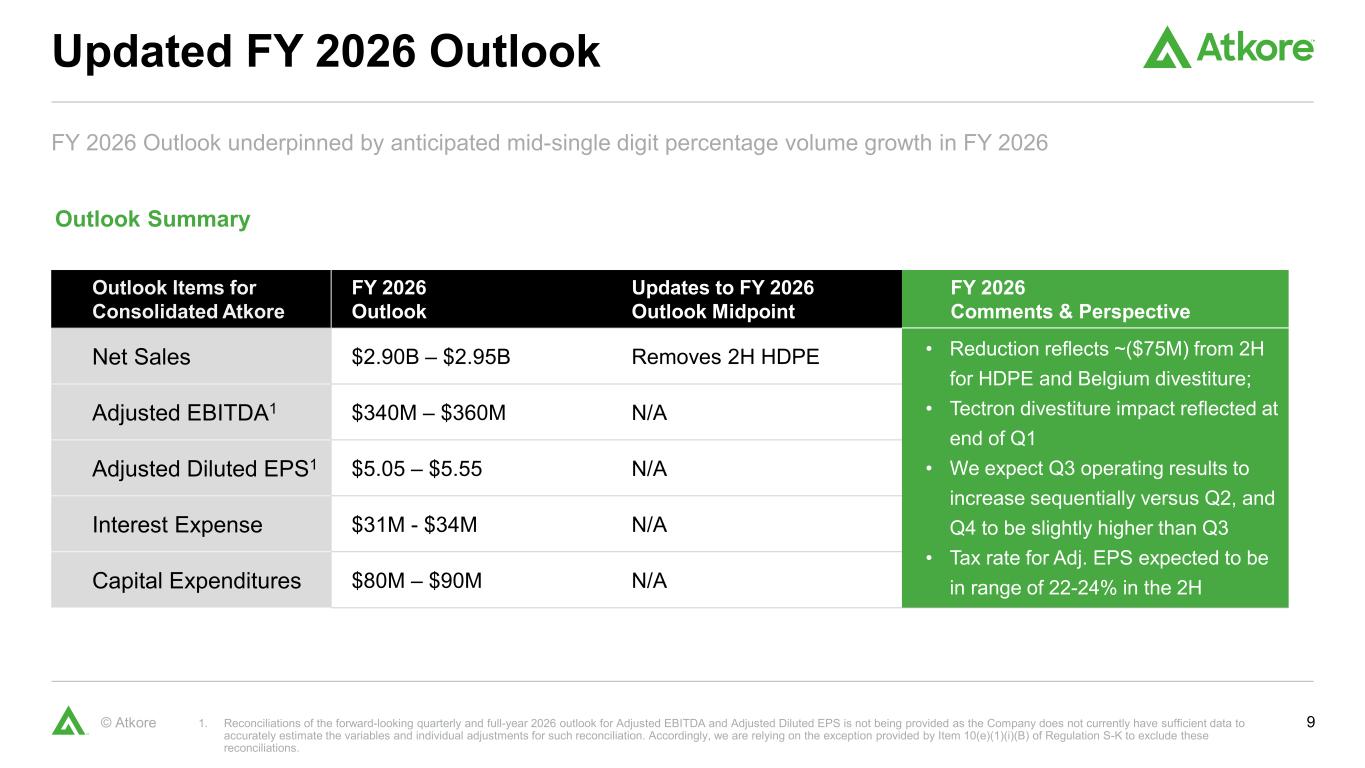
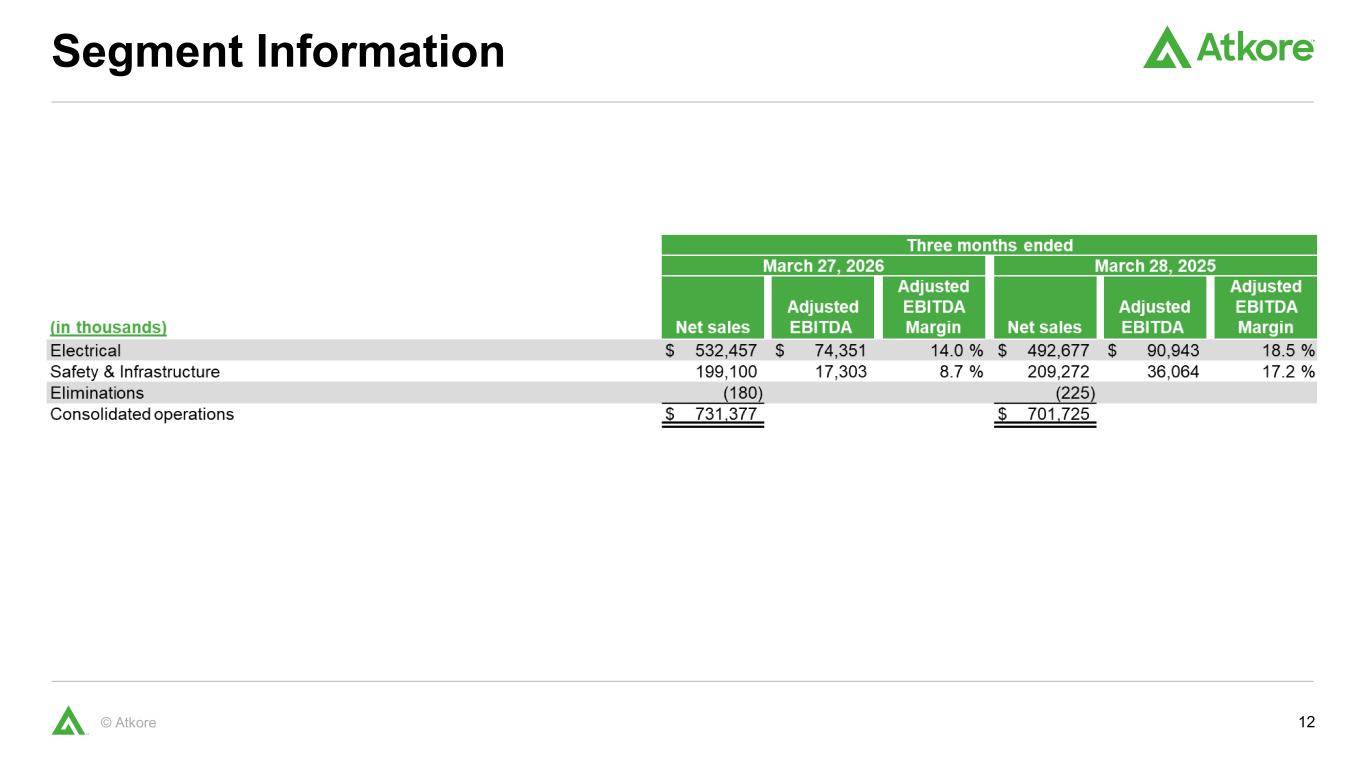
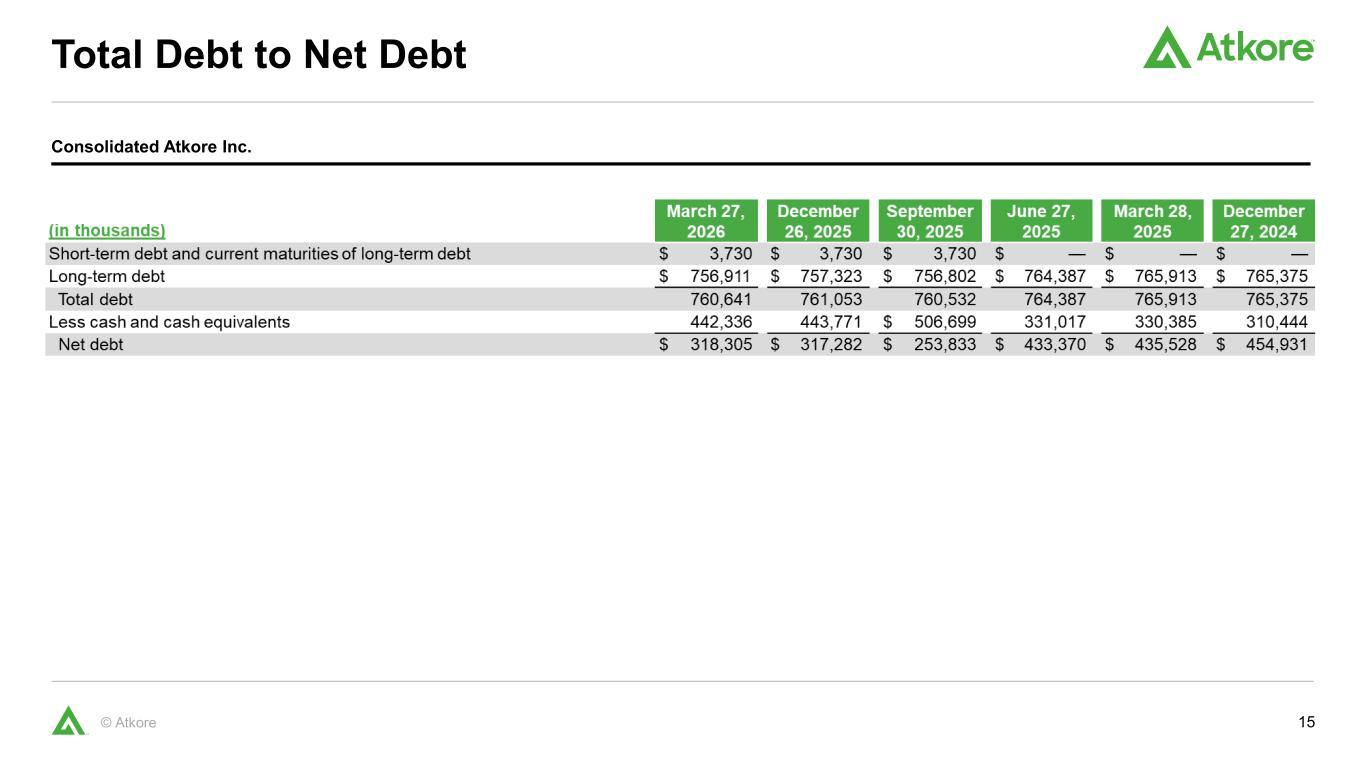
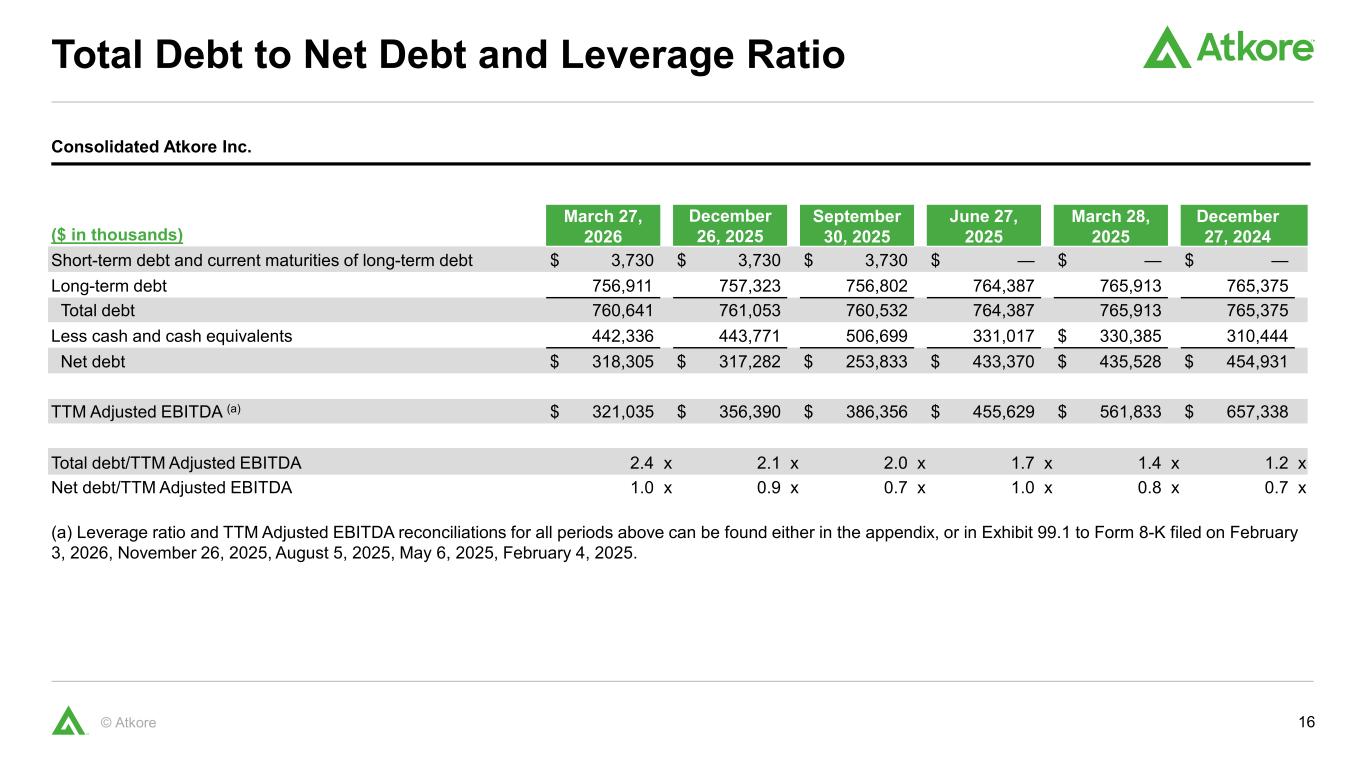
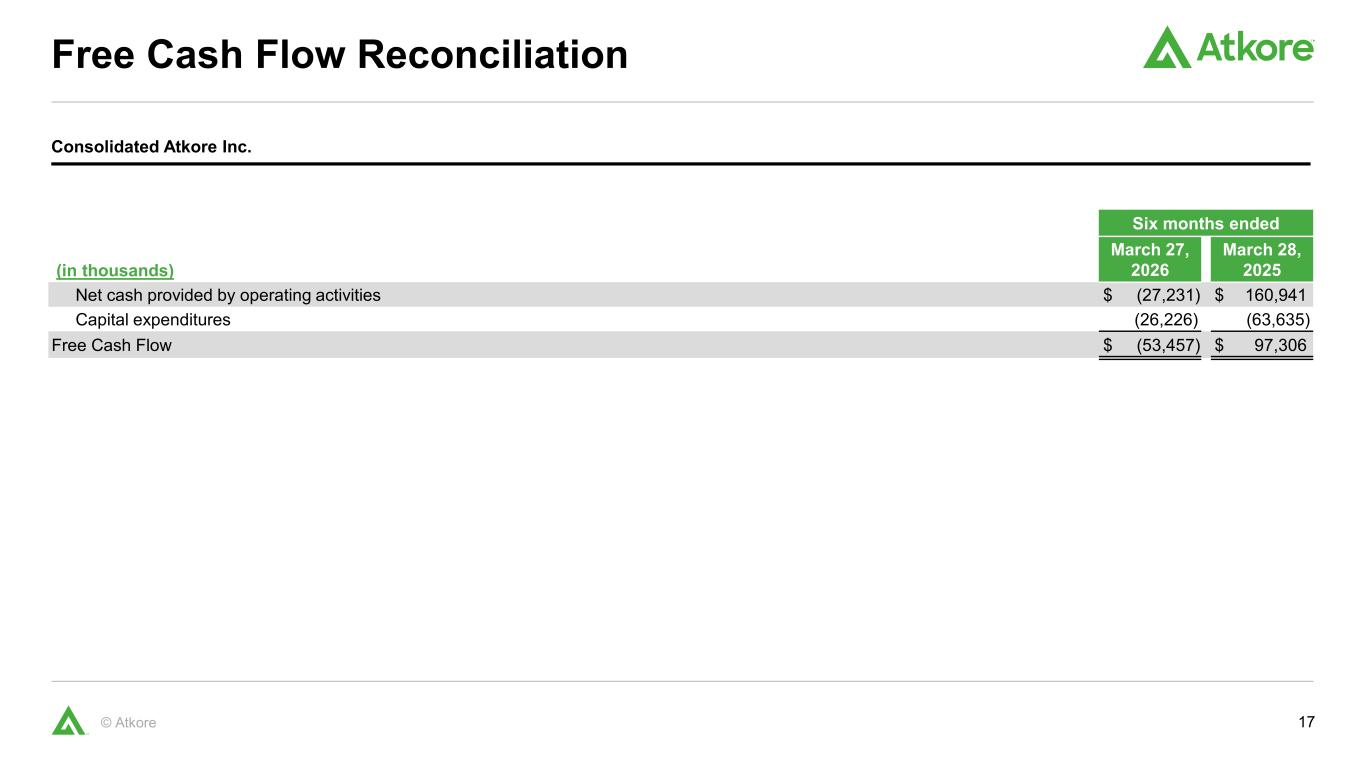
Thank you, Bill, and good morning, everyone. Moving to our consolidated results on slide four. In the second quarter, we achieved net sales of $731 million and adjusted EBITDA of $81 million. Adjusted EPS was $1.23 per share compared to $2.04 in the prior year. We are pleased to see a year-over-year improvement in our net sales, which reflects increases in both organic volumes and average selling prices. This was the first quarterly increase in net sales since the fourth quarter of fiscal 2022. Our net loss for the quarter includes several one-time items. As Bill mentioned, we reached an agreement to settle two of the three classes within the PVC antitrust litigation matter. We recorded a pre-tax liability of $136.5 million, which is reflected as a non-operating expense in our second quarter results. Additionally, we recorded certain items associated with our recently completed strategic actions, including accelerated asset depreciation at the recently exited manufacturing sites, as well as asset impairments and adjustments in carrying value related to the recent divestitures. Our tax rate in the second quarter was approximately 22%, a decrease from 24.7% in the prior year. Our second quarter income tax rate and benefit realized reflect the impact from several discrete items that I just referenced. Separate from these discrete items, the growth we've achieved and expect in our solar business this year has generated additional tax benefits compared to the prior year. Turning to slide five in our consolidated bridges, organic volumes were up approximately five percent compared to the second quarter of fiscal 25. Our average selling prices increased 1.5% during the quarter, which included products from both our electrical and S&I segments. For example, our steel conduit and cable products both increased their average selling prices, while our PVC-related products declined within our electrical segment. Our mechanical tube products saw selling price increases within our S&I segment. Moving to slide six, our year-to-date volume is up mid-single digits compared to the prior year. Four out of our five product categories have grown throughout the year. Our metal framing, cable management, and construction services offering continue to benefit from data center growth both in the U.S. and internationally. It is worth noting that these products and services grew approximately 10% in the first six months of fiscal 25. Despite the high comparability, these products and services are growing again in Fiscal 26. Our plastic pipe conduit and fittings products saw growth in both our electrical and water products during the most recent quarter. Metal electrical conduit continues to see healthy end market demand, particularly for larger sizes of steel conduit. Our specialty conduit products, which include stainless steel and fiberglass are also growing due to increased market demand. Our mechanical tube business, which includes our solar-related products, is growing as we expected due to better momentum for large utility-scale solar projects. As we previously communicated, we are shifting certain available capacity from our existing non-solar mechanical products to our electrical conduit products as part of our 80-20 initiative. This will continue to occur throughout the year. Overall, we continue to expect mid-single-digit volume growth for the full year. Turning to slide 7, net sales increased year-over-year in our electrical segment, driven by higher volume growth and higher selling prices. Adjusted EBITDA margins improved sequentially from the first quarter, while still lower compared to the prior year. Net sales in our S&I segment were lower compared to the previous year. The segment saw higher volume in average selling prices. However, these gains were offset by the year-over-year impact from our Tektron 2 product line that we divested in the first quarter, as well as incrementally higher tax credits past the solar end customers. Adjusted EBITDA and adjusted EBITDA margins both decreased year-over-year. During the second quarter last year, the S&I segment benefited from approximately $11 million of mostly one-time project-based benefits. Turning to slide 8, our ending cash position for the quarter was lower than our fiscal 25 ending cash balance. However, our second quarter ended prior to receipt of approximately $46 million of anticipated customer payments that occurred at the end of the calendar month. Excluding this timing aspect, we generated approximately $19 million of operating cash flow highlighted by better inventory efficiencies. In addition, our March net sales per day were the highest of any fiscal month over the past three years, reflecting a higher-ending accounts receivable balance that will be collected in subsequent months. Our balance sheet remains in a strong position with no debt maturity repayments required until 2030. Moving to slide nine, we continue to expect volume growth to be mid-single digits for the full year. This growth is expected to be driven through a combination of non-residential construction growth as well as contributions from certain initiatives such as solar and global construction services. We are adjusting our expectation for net sales to reflect a reduction from our HDPE divestiture and the divestiture of the two facilities in Belgium. For the full year, we expect net sales to be in the range of $2.9 to $2.95 billion. We continue to expect adjusted EBITDA in the range of $340 to $360 million, and adjusted EPS in the range of $5.05 and $5.55. The tax rate for the third and fourth quarter are expected to be in the range of 22% to 24% to approximate our adjusted EPS. As we look at end market demand, we expect our third quarter to grow sequentially in net sales, adjusted EBITDA, and adjusted EPS from Q2, and then slightly grow sequentially from Q3 to Q4 in all three metrics. With that, I'll turn it to John Progenzer to give an update on our strategic actions and our long-term focus.
Thanks, John. Turning to slide 10. To date, we have successfully executed several strategic actions. Since Q1 of this year, we ceased manufacturing at three U.S. facilities on schedule. I want to recognize and thank our teams for their commitment to improving our operational footprint and cost structure while delivering a positive customer experience. In April, we successfully divested our HDPE business, which included five manufacturing facilities. As part of this transaction, ATCOR will retain a 10% ownership interest in a combined business that includes InfraPipe's existing HDPE business. Excluding the impact of our HDPE business, the electrical adjusted EBITDA margins would have been around 150 basis points higher in fiscal Q2. Additionally, we divested our surface protection and powder coating business located in Belgium. As we reflect on actions taken to date, we remain committed to utilizing the AdCorp business system to create shareholder value by improving operational performance, delivering consistent productivity, and serving our customers with a highly diverse electrical infrastructure portfolio. Long-term electrification trends remain strong, and AdCorp will continue to make strategic decisions with these trends in mind. In the meantime, there is more work to be done this fiscal year. As John mentioned, we expect volume growth to be mid-single digits for the year, and we believe the second half of the year will build upon the growth we've seen in the first half of the year. The electrical industry is a great place to be, and our operational and commercial teams are well positioned to capitalize on these opportunities globally.
Speaker 8
With that, we'll turn it over to the operator to open the line for questions at this time i would like to remind everyone in order to ask a question press star then the number one on your telephone keypad we'll pause for just a moment to compile the q a roster and your first question comes from a line of andy kaplowitz from citigroup your line is open good morning everyone good morning andy good morning uh could you get more color into what you're seeing in the overall markets in terms of volume and the drivers of that volume because When I look at your volume growth, as you said, you moved up nicely into the mid-single-digit range in Q2. I know you only reiterated your volume growth assumptions for the year, but I think you said data center growth up 10% in the first half. But does that start to ramp up in earnest in the second half? Any color and how big is the percentage of the business data centers is at this point, and is there something that's offsetting that growth in the second half?
Yeah, I'll start on some of the items. I referenced, Andy, and then I'll turn it to Bill and John to give a more macro perspective. The 10% was in reference to the metal framing, cable management, and construction services business that grew 10% last year. So we had a tough comp in that business, but we're still up low single digits. So we're pleased to see that, and we also see that as a real opportunity for us in the back half of the year. I think John Progenzer and his comments talked about, you know, we're well positioned commercially here to continue to capture some projects in that construction services and metal framing business really as we ramp in the back half of the year. So that'll be some areas where we can outperform the market and get to that mid single digit outlook. So that's the clarification that was in the 10 percent was the last year growth in that sub business. But I'll turn it to Bill here to give some perspective here on the macro, because there are some pockets of strength in items.
Yeah. So, Andy, following up on John's comments, overall, the markets are good across virtually everything. I would characterize data centers or double digit growth. So anybody obviously heavily, as I'm sure you're seeing with your coverage, that is focused on data centers or preponderance or products should be growing, I think, organically double digits. For our products in that area, you know, we're seeing high growth with those products, whether it's the metal conduit, larger diameter, PVC, the metal framing and so forth that John Deitzer just mentioned. Other products are probably in the low single digits amid single, excuse me, other vertical markets are probably in the low to mid single digit growth. The things I would call out, and this correlates with like if you were you or anybody else to look at Dodge, would see probably the same thing. The low markets are office buildings. If you strip out Dodge as a separate category and residential still seems to be, you know, slow, but growing. And then obviously on the other end, data centers are the highest growth. The one thing from our voice of customer of optimism talking to our distributors is kind of the manufacturing industrial feels like they're optimistic for the future, which I don't know if Dodge calls out.
Speaker 9
Final statement there before I filibuster too long is in talking to our customers, they're optimistic, good backlogs, you know, for the rest of this year, you know, is a holistic statement. it just one follow up there bill or john like do you you've been working on initiatives like construction services for a while you know and it seems like it's starting to ramp up so does that mean data centers play a bigger role for you guys i know it's hard to sort of break out the exact sales but as you sort of you know go to the second half of this year and into 27 should we see a bigger role at ad core from data centers given your initiative
Yeah, hey, Andy, this is John. For sure, data centers are a big part of what we're doing on the global construction services side. And as we look on the back end half of the year, that's going to drive a lot of the growth that we're projecting. Also, we're seeing continued pickup in solar. So those will be two key areas that are going to drive what we're going to expect to see in the second half.
Yeah. And Andy, I'll just follow up. These are real roughs called CEO math. But if you figure overall, markets are growing. And again, we're always talking, by the way, volume, as you know, other, whether a distributor or manufacturer, you know, with positive price in their products, add the two plus an organic growth and sometimes, you know, together. But just organic volume, I'm going to say the market's up, let's just say two and a half to 3%. And then our self-help, as John Perginzi just walked through with data centers, the solar torque tubes, PVC water, those type of things, you should add another 2.5%, 3% that you get somewhere around that single-digit growth.
Speaker 9
It's helpful. And then the other thing trying to figure out is the dynamics of price versus cost. I think last quarter you said that baked into your gut was not a lot of additional spread, given all the moving pieces. But obviously, as you guys see in general upward trajectory of commodities, it looks like you've had some continued cost headwinds so maybe give us more color in the spread you're seeing in the major commodities that you traffic in whether it's steel or PVC are they getting more favorable at all in terms of spread and then how much of a hit are you taking with aluminum and copper for example Andy I'll start with some of the dynamics that that we experienced here in the second quarter and that we're probably seeing in the back half and then I'll kind of let Bill give any comments here also on the market dynamics.
In the second quarter in particular, we probably actually saw more of a steel impact in our costs because that was really the last year when we looked back. It was the transition from our fiscal Q2 into fiscal Q3, you know, go back to April of last year, Liberation Day, et cetera. That's where we saw the real spike occur. So our cost this year in the quarter were related here also primarily in the steel area. As we look forward in Q2 and looking forward into Q3, we are seeing that dynamic with copper and aluminum that impact our cable business. We are recovering a portion of that through higher selling prices, but that is definitely an area where we're seeing significant spread compression. And for us, the cable business is about 17% of company sales. And it was down in volume, but flat in revenue. So we did pick up a portion in price, but that decline in revenue also has an unfavorable impact to the cost structure and the margin. So that's an area of compression for us right now. But on steel, we have had several quarters here of sequential price increases on our steel-related products. I think I mentioned that in my comments. So, we are positive here on seeing some of the trends. We were up for the first time in revenue year over year since the fourth quarter of 2022. Now, that's on a sales basis, not on a profitability basis, I understand. But we are seeing some positive here in momentum, and we'll see if that can continue.
Anything? Yeah. The only thing I would add, Andy, to that, and I did read your pre-guide this morning, is, you know, most commodities, as John just mentioned, steel, but copper, if you go year over year, is up. PVC resin is up, you know, at the moment. I'm saying at the moment, but if we're sitting here at the beginning of May. But as we hold our guide, and by the way, price for gas and everything else for trucking is up. But as we hold our guide, you know, and we feel comfortable with that, obviously, one could infer that we're getting enough price to cover those costs as we go in the second half. So, so far for the year, you know, there's always puts and takes in our product line and different things, but we're, things are playing out as we expected.
Speaker 9
Appreciate all the color, guys.
Yeah. Hey, thank you, Andy.
Operator
Your next question comes from a line of David Tarantino from KeyBank. Your line is open.
Hey, good morning, everyone. Good morning, David. Could you give us an update on both the strategic review and the ongoing cost savings program? We've announced a number of pruning deals and cost-saving initiatives, but could you give us some color on how you're thinking on the review on a go-forward basis? Are we still contemplating a broad range of outcomes here?
Yeah, so I'll do it in reverse order. I'll focus on the initiatives. I think the initiatives that we laid out last fall, we've now hit every one. In other words, as John Perkins recovered in his remarks, you know, we successfully complement, as John did, the employees that did it really well, the three facilities on track for hitting, as we called out in the last quarter, $10 million to $12 million of annualized savings. You know, there could be a slight upside to that. You know, we divested everything that we had planned for, including the major one was HDP, but including the small non-core operations in Belgium here just, you know, in the last day or two, you know, et cetera, et cetera. So those things are all, and they all went very successfully. You know, the facilities have been moved, you know, kind of on schedule, probably in less cost overall than even we expected. So those things are all going well. As for the overall holistic strategic review, both the board and we have announced a strategic review committee are still considering kind of all options or being diligent. But beyond that, to say, you know, a time frame or whatever, the board does not want to get locked into doing what they perceive as best for the shareholders, but whatever time schedule that takes.
Okay, great. That's helpful. And maybe on the top line, nice to see pricing contribute positively. So could you give us some color on what drove the positive inflection here? It sounds like primarily in steel, but maybe some color on what you're hearing in the channel and what you're seeing from the level of imports would be helpful.
Yeah, so a couple of things. Obviously, it's not a direct correlation, but the underlying commodities have a factor. We've always said in my mind, the first thing is supply and demand. From there, it's the cost of the commodities. But overall, as I referenced, I think, to Andy's question, if you look over the year, copper is up, steel costs are up, resin costs are up. And as I referenced, we're passing those things along. As I look out over the next year, you specifically, David, or anybody else can reference, but hot rolled steel commodity futures are basically flat for the rest of the – I'm saying for the next 12 months, but above $1,000 per ton. um pvc resin i you know at least what we're hearing or seeing from different people is they're going to stay up through the end of the year um our fiscal year and they always drop some but now i'm a little beyond my skis here in other words i would check with others that are experts but in the u.s natural gas is used to support to create pvc resin not oil but there's still a correlation that I saw a statistic like March exports were up, you know, 20 percent or something going overseas, i.e. the U.S. competitiveness, the ship overseas is up. So, you know, I would expect them to keep their resident costs, you know, to us and others up. So I think the underlying commodities are up. And I think, you know, supply and demand, as I referenced in the earlier question where the markets are healthy you could see in the last point you could see if you check the public corporation for distributors I think they're having you know they're being able to pass along the cost to contractors and so forth so it's a good environment for us to continue to drive forward and and then just the level of imports oh great question apologize if you asked in the first round. Imports, I would do the following thing. Steel, and I'm looking back over the last six months, because I tell you it's really spiky by month and even quarter, so I don't want to give false precision for any timeframe, but steel conduit imports for the last six months are down, as we've already alluded, the markets themselves are up, so that's helping us you know, continuing supply, demand, domestic, international, you know, so forth with good markets to dry pricing that John Deitzer spoke of. PVC products are still coming in, you know, growing. I guess, again, it depends on the quarter, but I would say with the markets and so forth. But again, the markets are relatively strong there. So.
Okay, great. Thanks, guys.
Operator
Your next question comes from a line of Dean Dray from RBC. Your line is open. Good morning, everyone.
Hey, Bill. Can we follow on that last point just with regard to some of the imports? Can you be more specific? Because we're all watching the level of imports from Mexico on the steel conduit side. At one point, it was in the low 20% of the market. it had come down into representing, you know, high teens, you know, where is that today? That's really will help us calibrating here.
Yeah. John, do you want to give a, yeah.
Yeah. Dean, I think when you look at Mexico, you know, there's been a continual steady decline in imports month over month, specifically for Mexico. So where it was in the, the, the low to mid twenties at one point, We would probably estimate it's in the high teens to mid-teens at this point, but that's one area where there has been some declines. There's been some offsets from other countries importing in, but that would be the situation for Mexico.
Yeah, and Dean, I don't have for me, and I don't know if we'd share the precise number versus John's guide, but just to follow up on David's question, again, I don't want to get, it does bounce. So I don't want to give two level of false precision. But, you know, as we called out in our page six, where metal electrical conduit and fittings are up mid single digits for the year, I would say imports from Mexico for steel conduit is down directly mid single digits. So, you know, it's working in our favor here.
What's the impact of tariffs and 232 in particular? How has that changed the level of Mexican imports?
I think that, well, let me do something, try to answer that two ways, depending on where you're going with your question. is, you know, recently there's been some updates, but they're not a direct, you know, like go, hey, it's 100% of the content of the product, not a steel, but like for us, this, maybe you're not even going here, but it's steel conduit, it's 100% steel conduit. So that specifically any changes of late have not made a material difference for us. And I'm talking there, you know, that I could go back and give you a precise date where the administration's come out with some updates. What I would say, but this is conjecture and correlation, is the tariffs that the administration put in is probably a driving factor in the fact that, you know, the statement before, if you go back, I think, to 2024, you know, steel conduit, as you know, is growing double-digit imports versus the statement I just made that steel conduit, metal conduit is growing mid-single digits and imports are down mid-single digits. So it feels that one could easily deduct the tariffs or a large factor in that.
All right. That's really helpful. And any other color you can share on the PVC dynamics? As you're seeing, you're getting steel price, but your giving price on PVC overall, are there, maybe answer the question, we've got a good sense on the import or the input costs on resin, but what's going on competitively, what you're still seeing selling pressure there?
Yeah, Dean, maybe I'll give a different inflection. John and John, please either correct or add to it to go the statements we've made so far have been more as it should be year over year to go hey what is different things um i don't want to get too far out my skis with one month if you have this quarter behind but i would say that as we go forward and hold our guide is that even in things like pbc one month doesn't make a quarter or a year and, you know, November we'll talk about FY27, but that so far, you know, we have been able to raise our price and cover those costs for PBC. So, again, there's good competition out there. But, you know, as I mentioned to David, the first thing that drives, you know, our pricing is supply and demand and the markets are overall pretty healthy.
All right. I appreciate all that additional color. Thank you.
Operator
This concludes the question and answer session. I would now like to turn the call back over to Bill Waltz for closing remarks.
Thank you. Let me take a moment to summarize my three takeaways from today's discussion. First, I'm pleased with Accor's fiscal 2026 results so far. We grew sequentially in net sales and profit in our second quarter from the first quarter, and our results reflect a combination of healthy end markets and our own self-help improvement. Second, we are on track to deliver mid-single-digit organic volume growth for the full year. This represents how we see the broader market performing and contributions from several key initiatives. Finally, our executed strategic actions reflect our commitment to making changes that increase our focus on the electrical infrastructure market and enable long-term value creation. With that, thank you for your support and interest in our company. We look forward to speaking with you during our next quarterly call. this concludes the call for today this concludes today's conference call you may now disconnect