Operator
Hello, and thank you for standing by. My name is Regina, and I will be your conference operator today. At this time, I would like to welcome everyone to the Armstrong World Industries fourth quarter and full year 2025 earnings calls. All lines have been placed on mute to prevent any background noise. After the speaker's remarks, there will be a question and answer session. If you'd like to ask a question during this time, simply press star, then the number one on your telephone keypad. To withdraw your question, press star 1 again. I would now like to turn the conference over to Theresa Womble, Vice President, Investor Relations and Corporate Communications. Please go ahead.
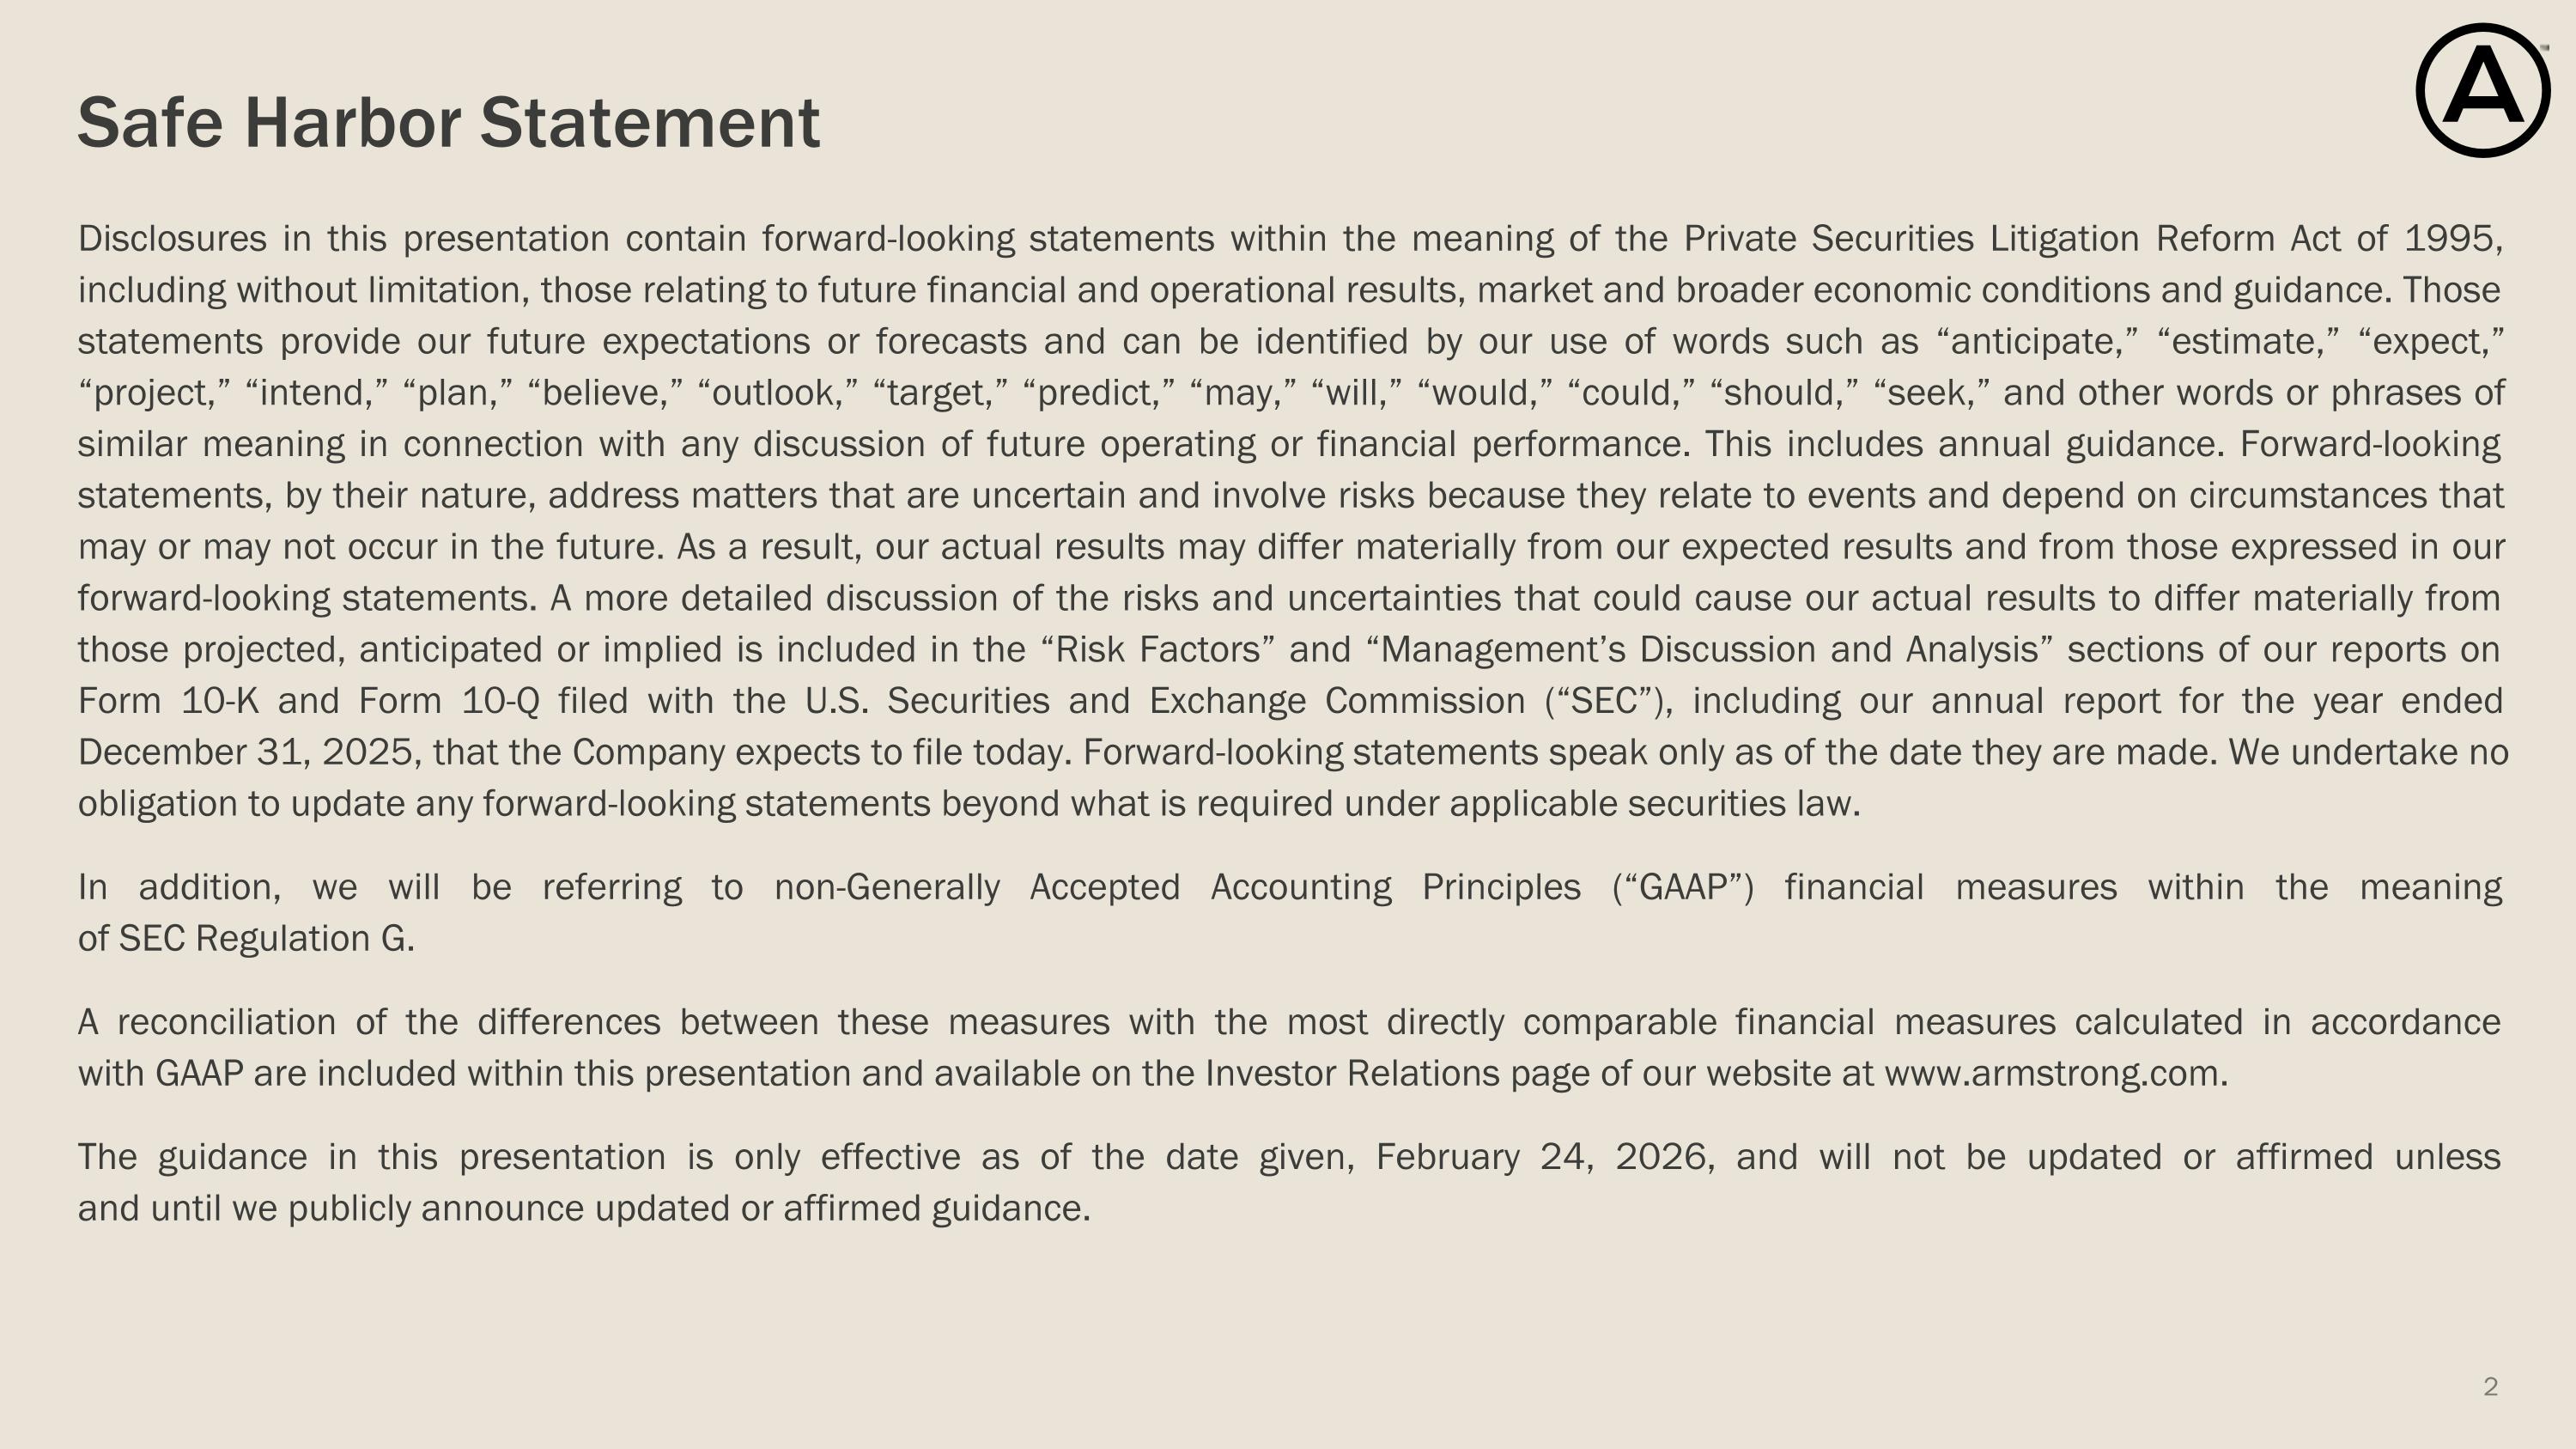
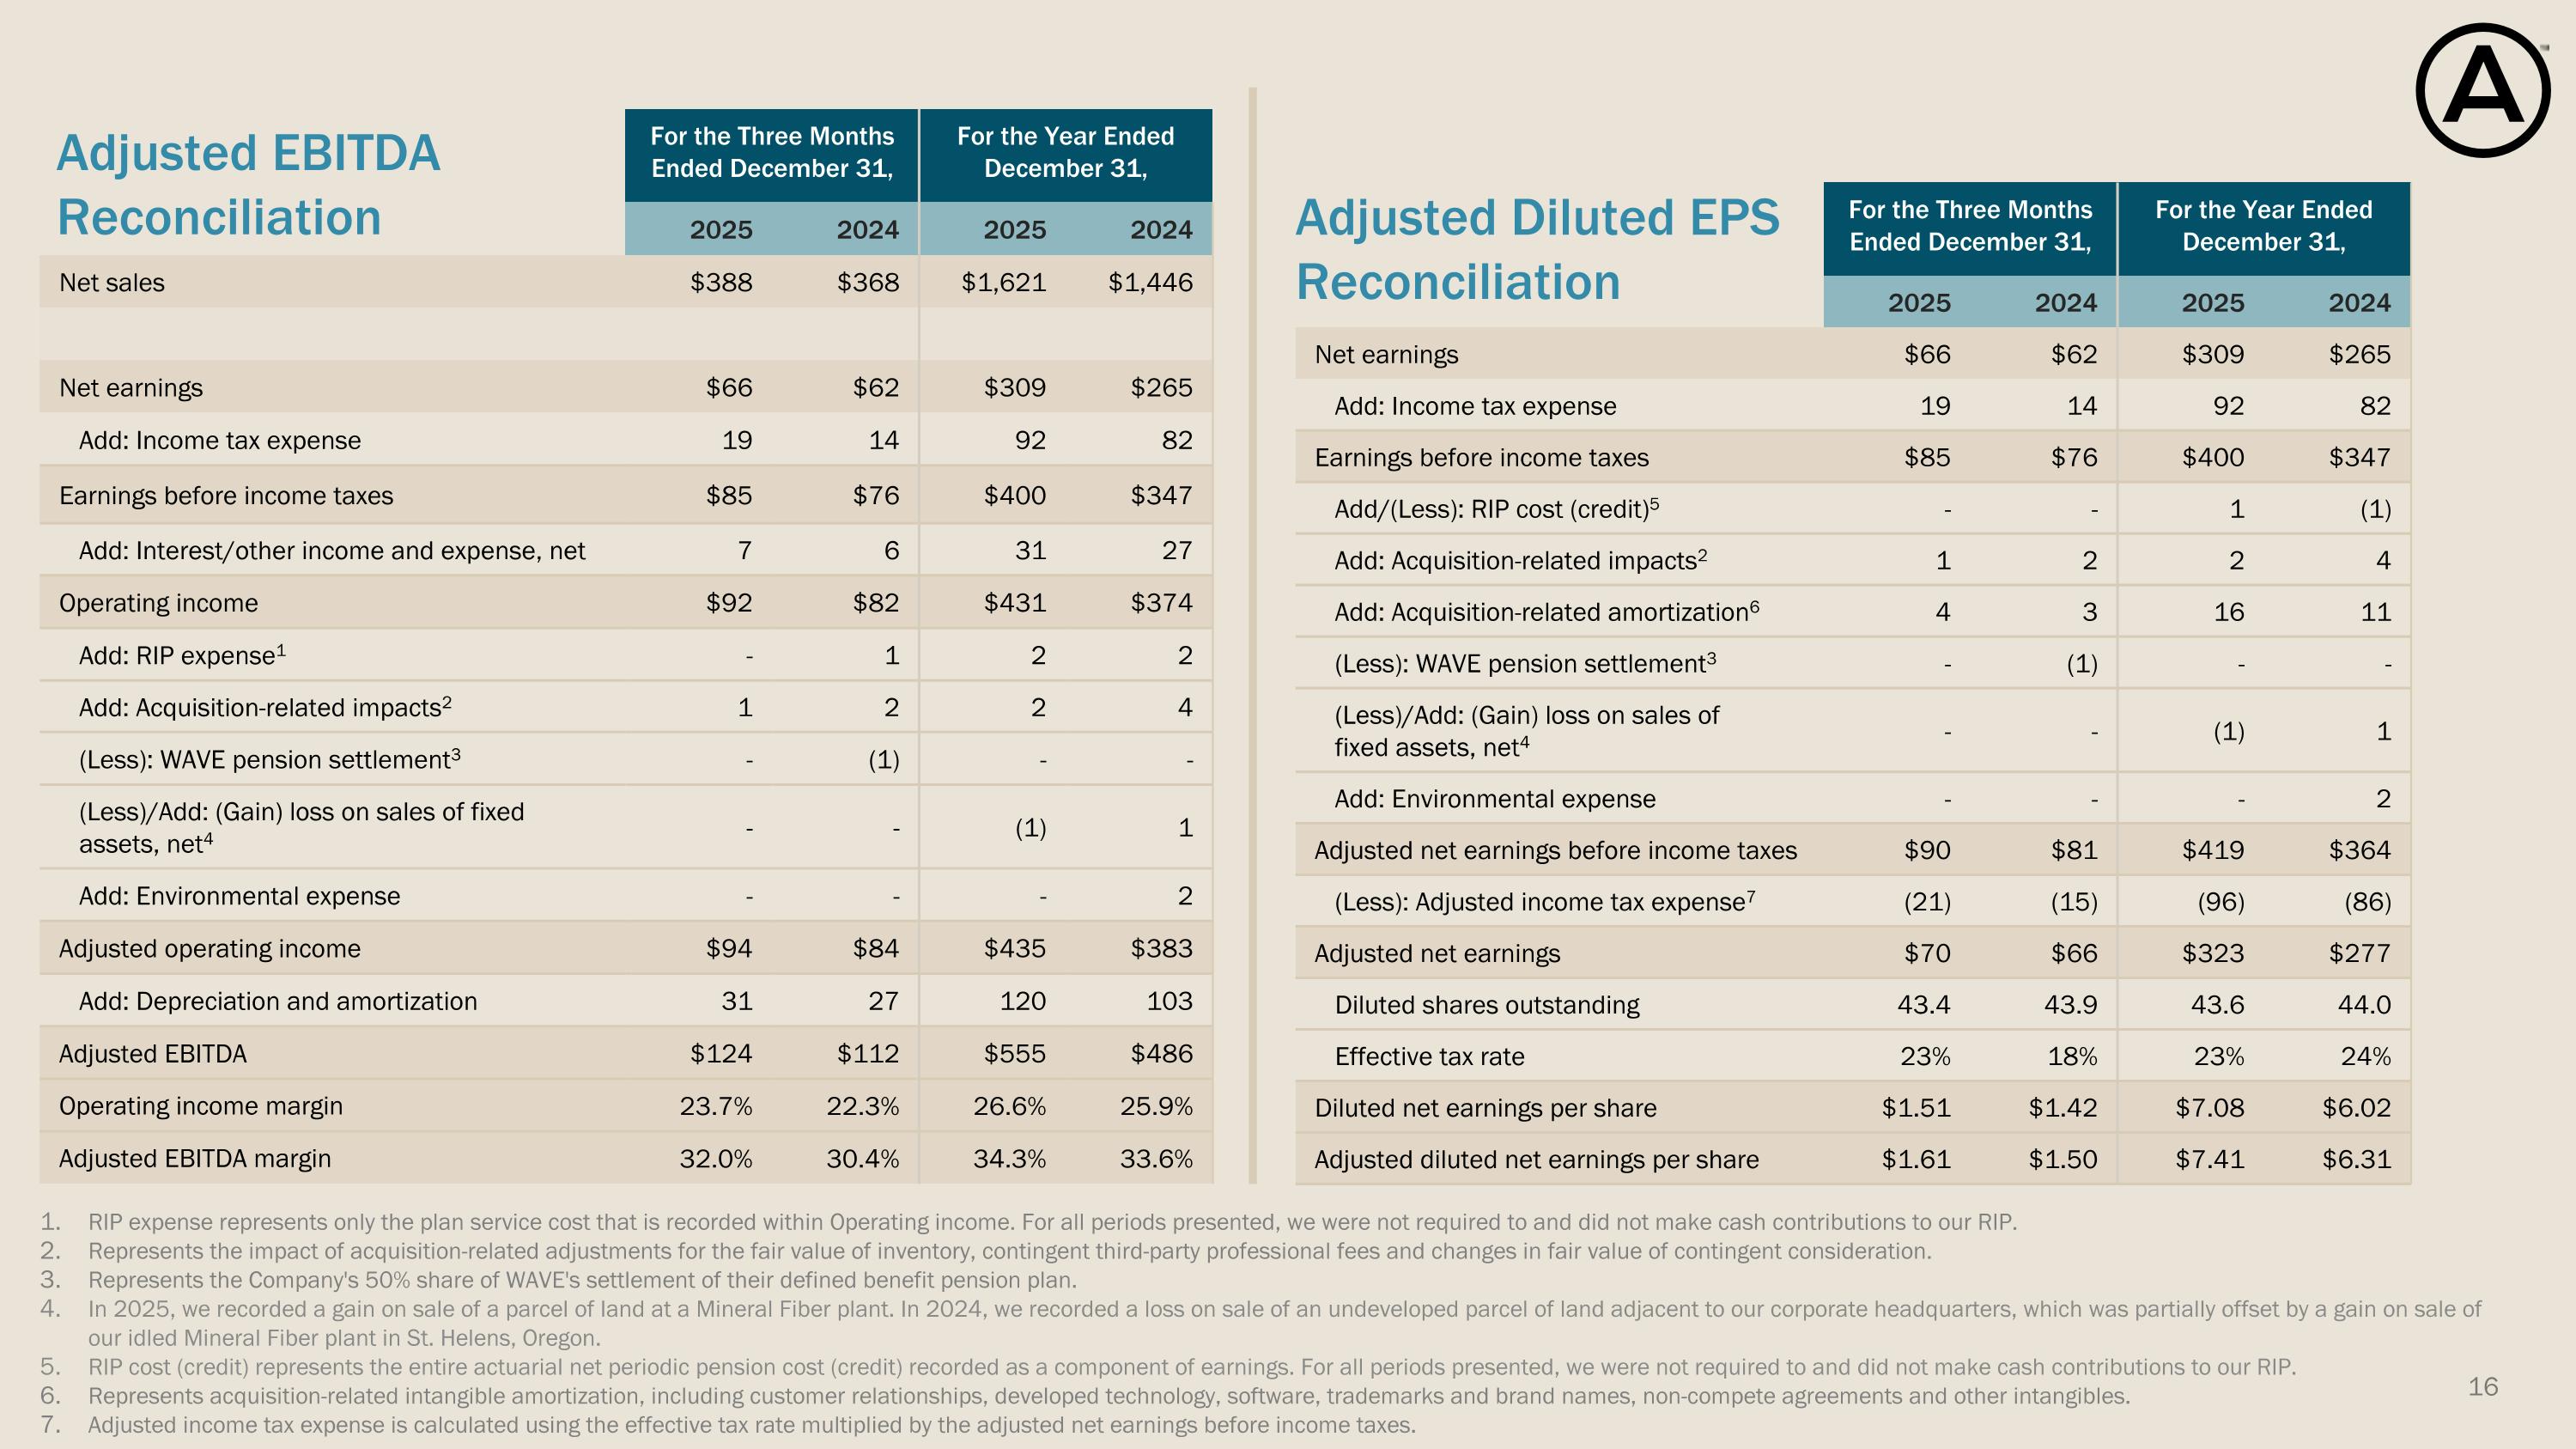
Thank you, Regina, and welcome everyone to our call this morning. Today, we have Vic Grizzle, our CEO, Chris Calzaretta, our CFO, along with Mark Hershey, our Chief Operating Officer, who will discuss Armstrong World Industries' fourth quarter 2020 2020 results and our outlook for 2026. We have provided a presentation to accompany these comments that is available on the investor relations section of the Armstrong World Industries website. Our discussion of operating and financial performance will include non-GAAP financial measures within the meaning of SEC Regulation G. A reconciliation of these measures with most directly comparable gap measures is included in the earnings press release and and in the appendix of the presentation issued this morning both available on our investor relations website during this call we will be making forward looking statements that represent the view we have of our financial and operational performance as of today's date february 24 4, 2026. These statements involve risks and uncertainties that may differ materially from those expected or implied. We provide a detailed discussion of the risks and uncertainties in our SEC filings, including our 10-K filed earlier this morning. We undertake no obligation to update any forward-looking statement beyond what is required by applicable securities law. With that, I will now turn the call to Vic.
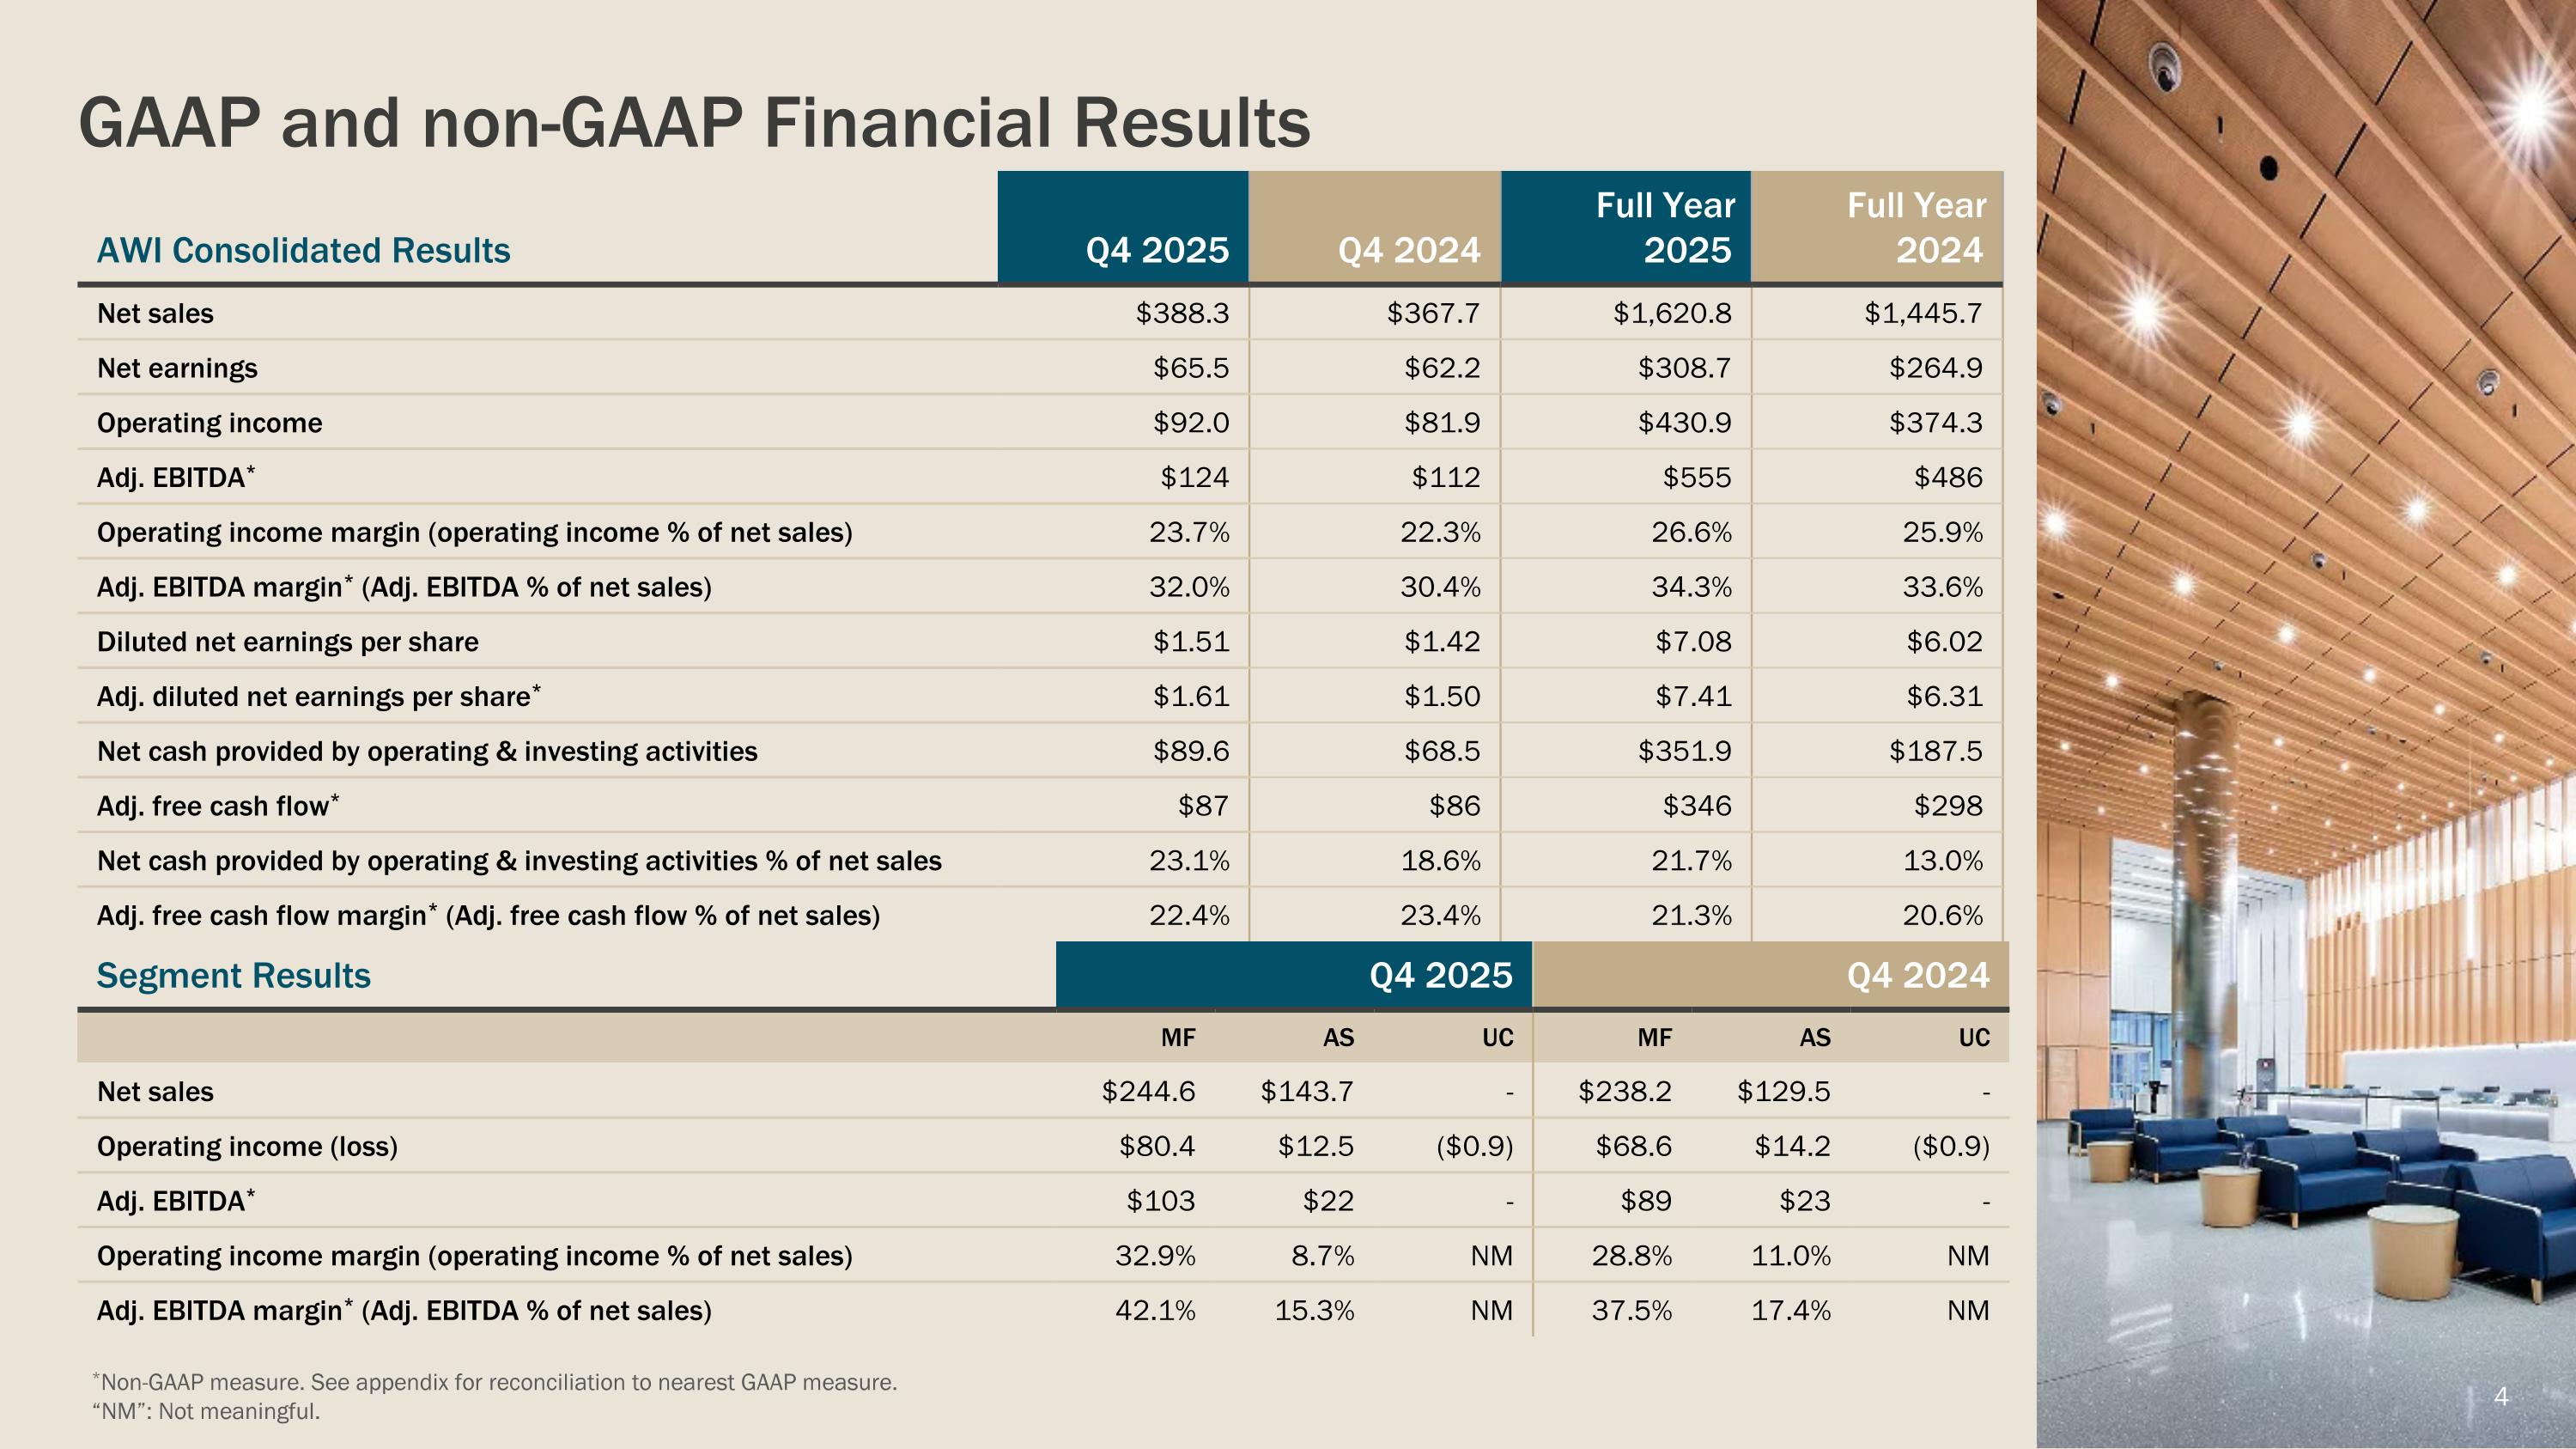
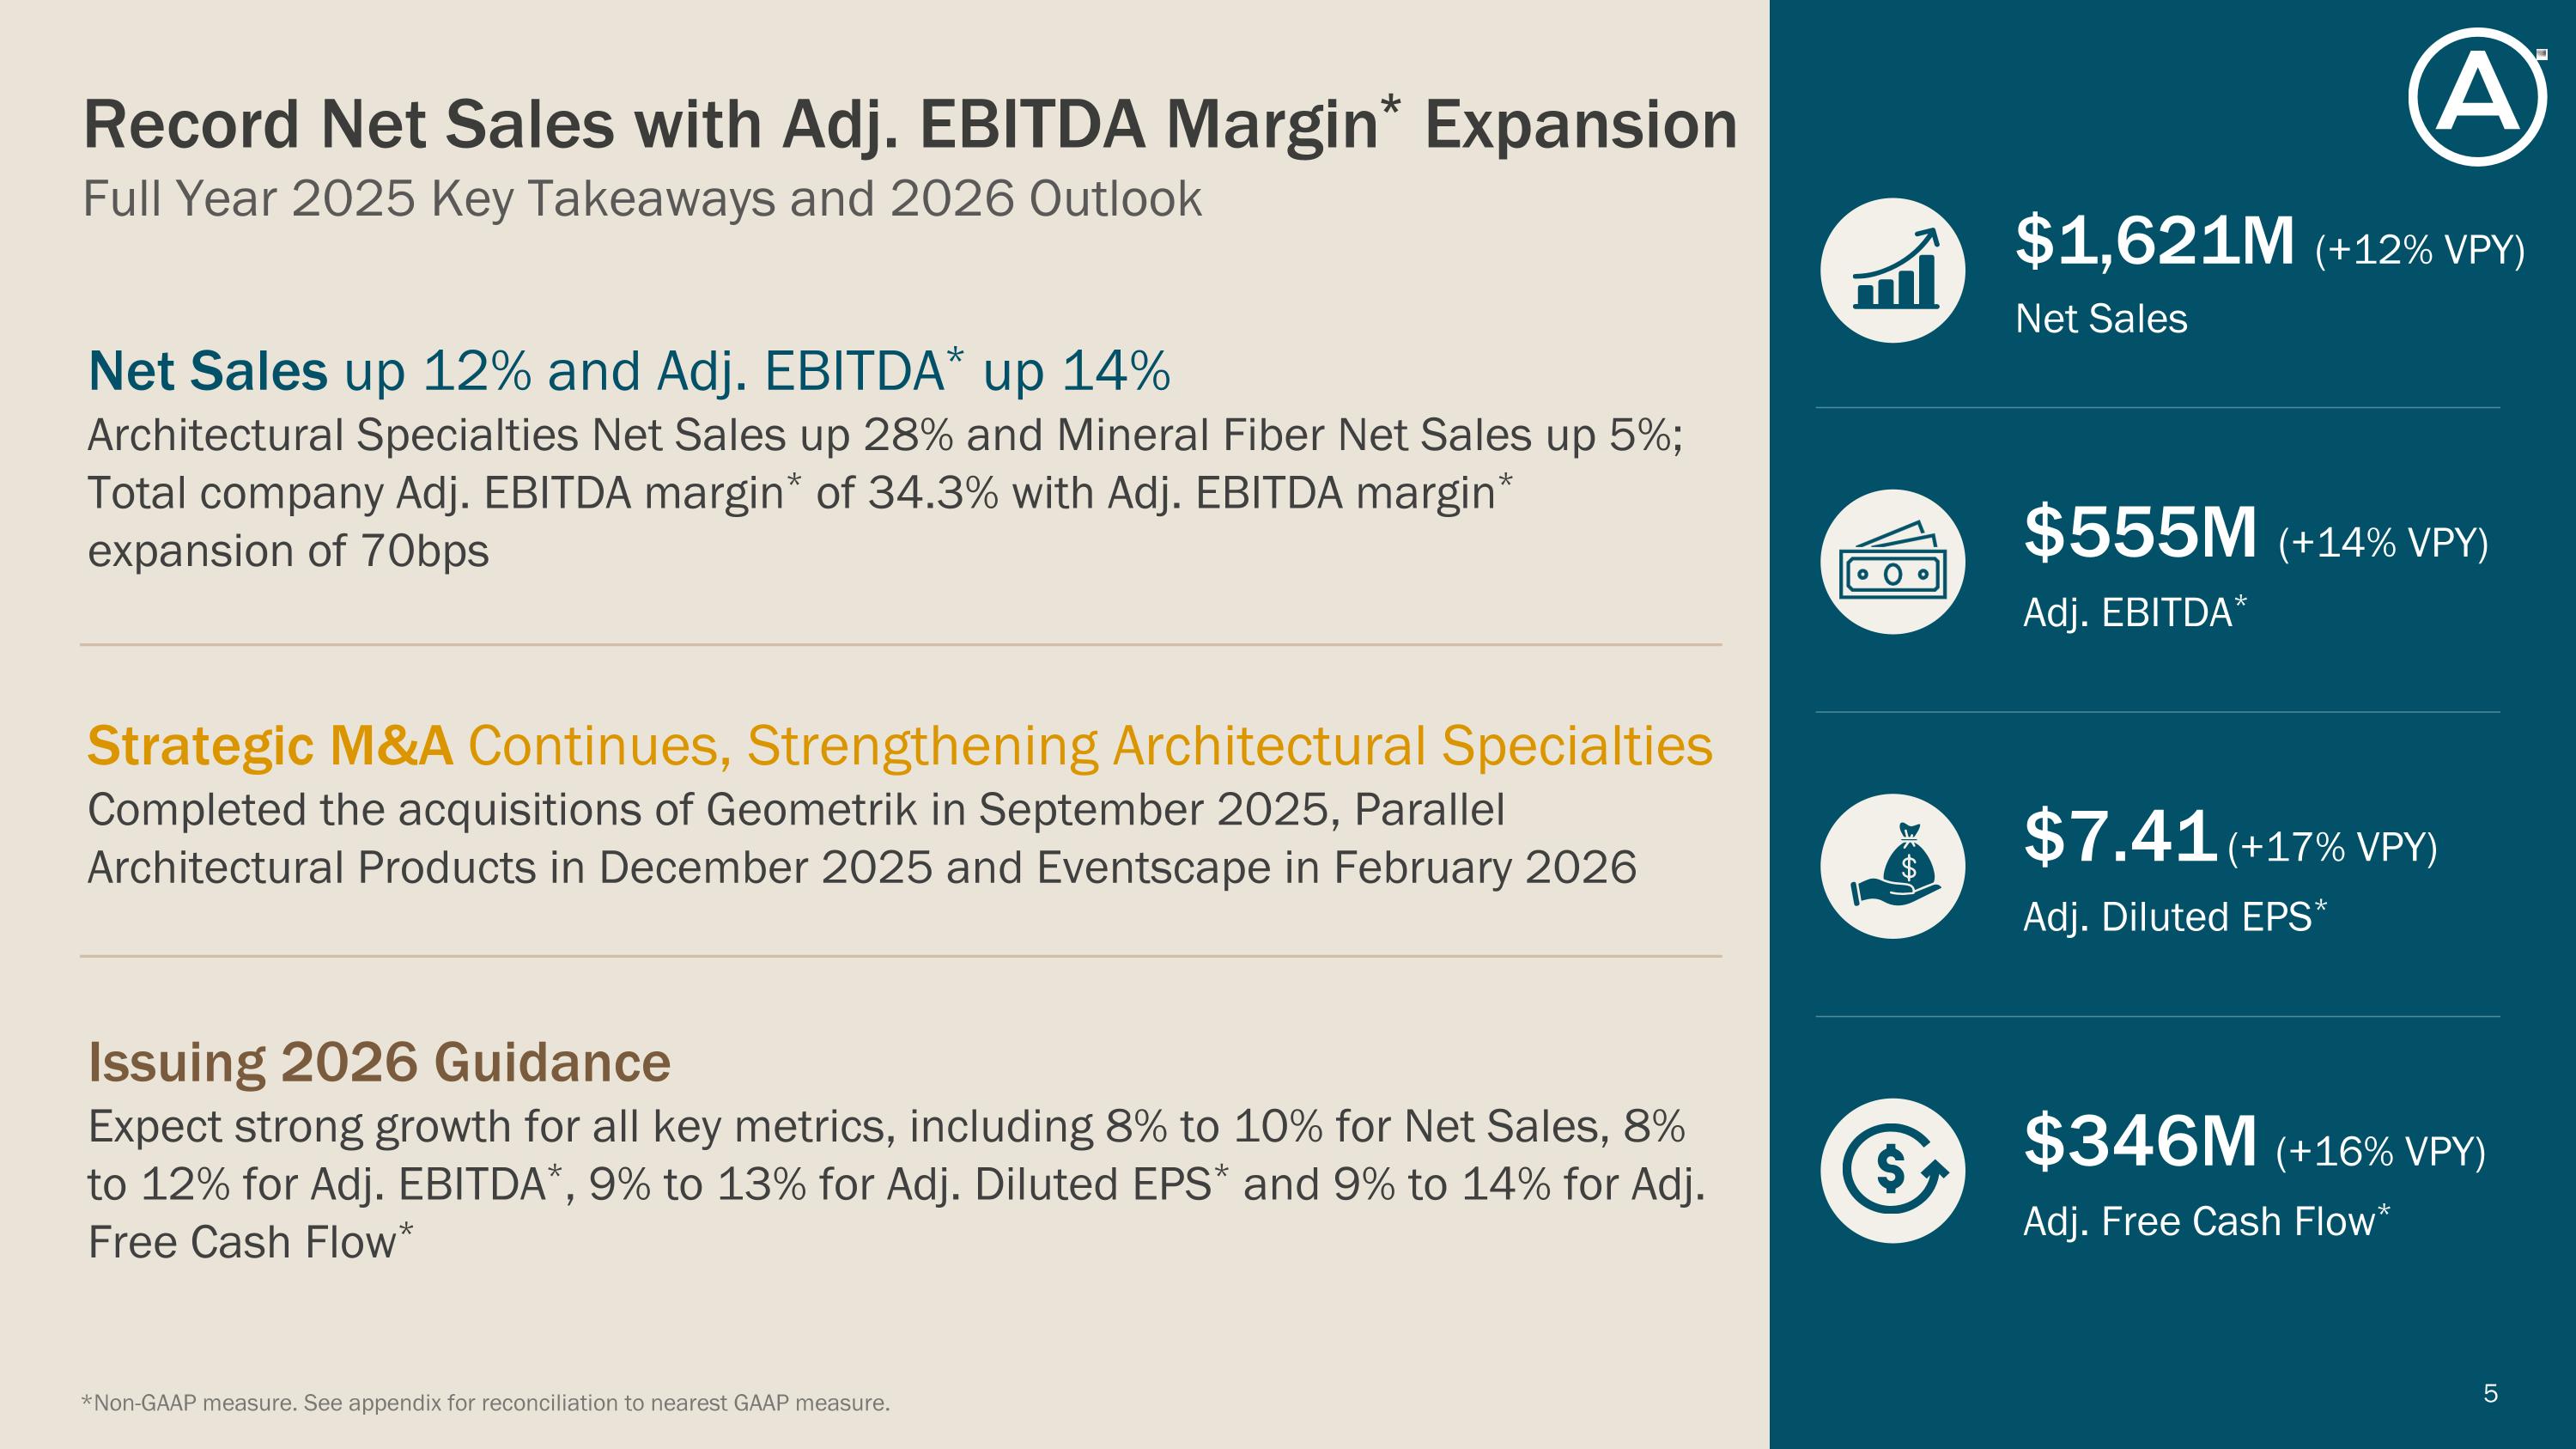
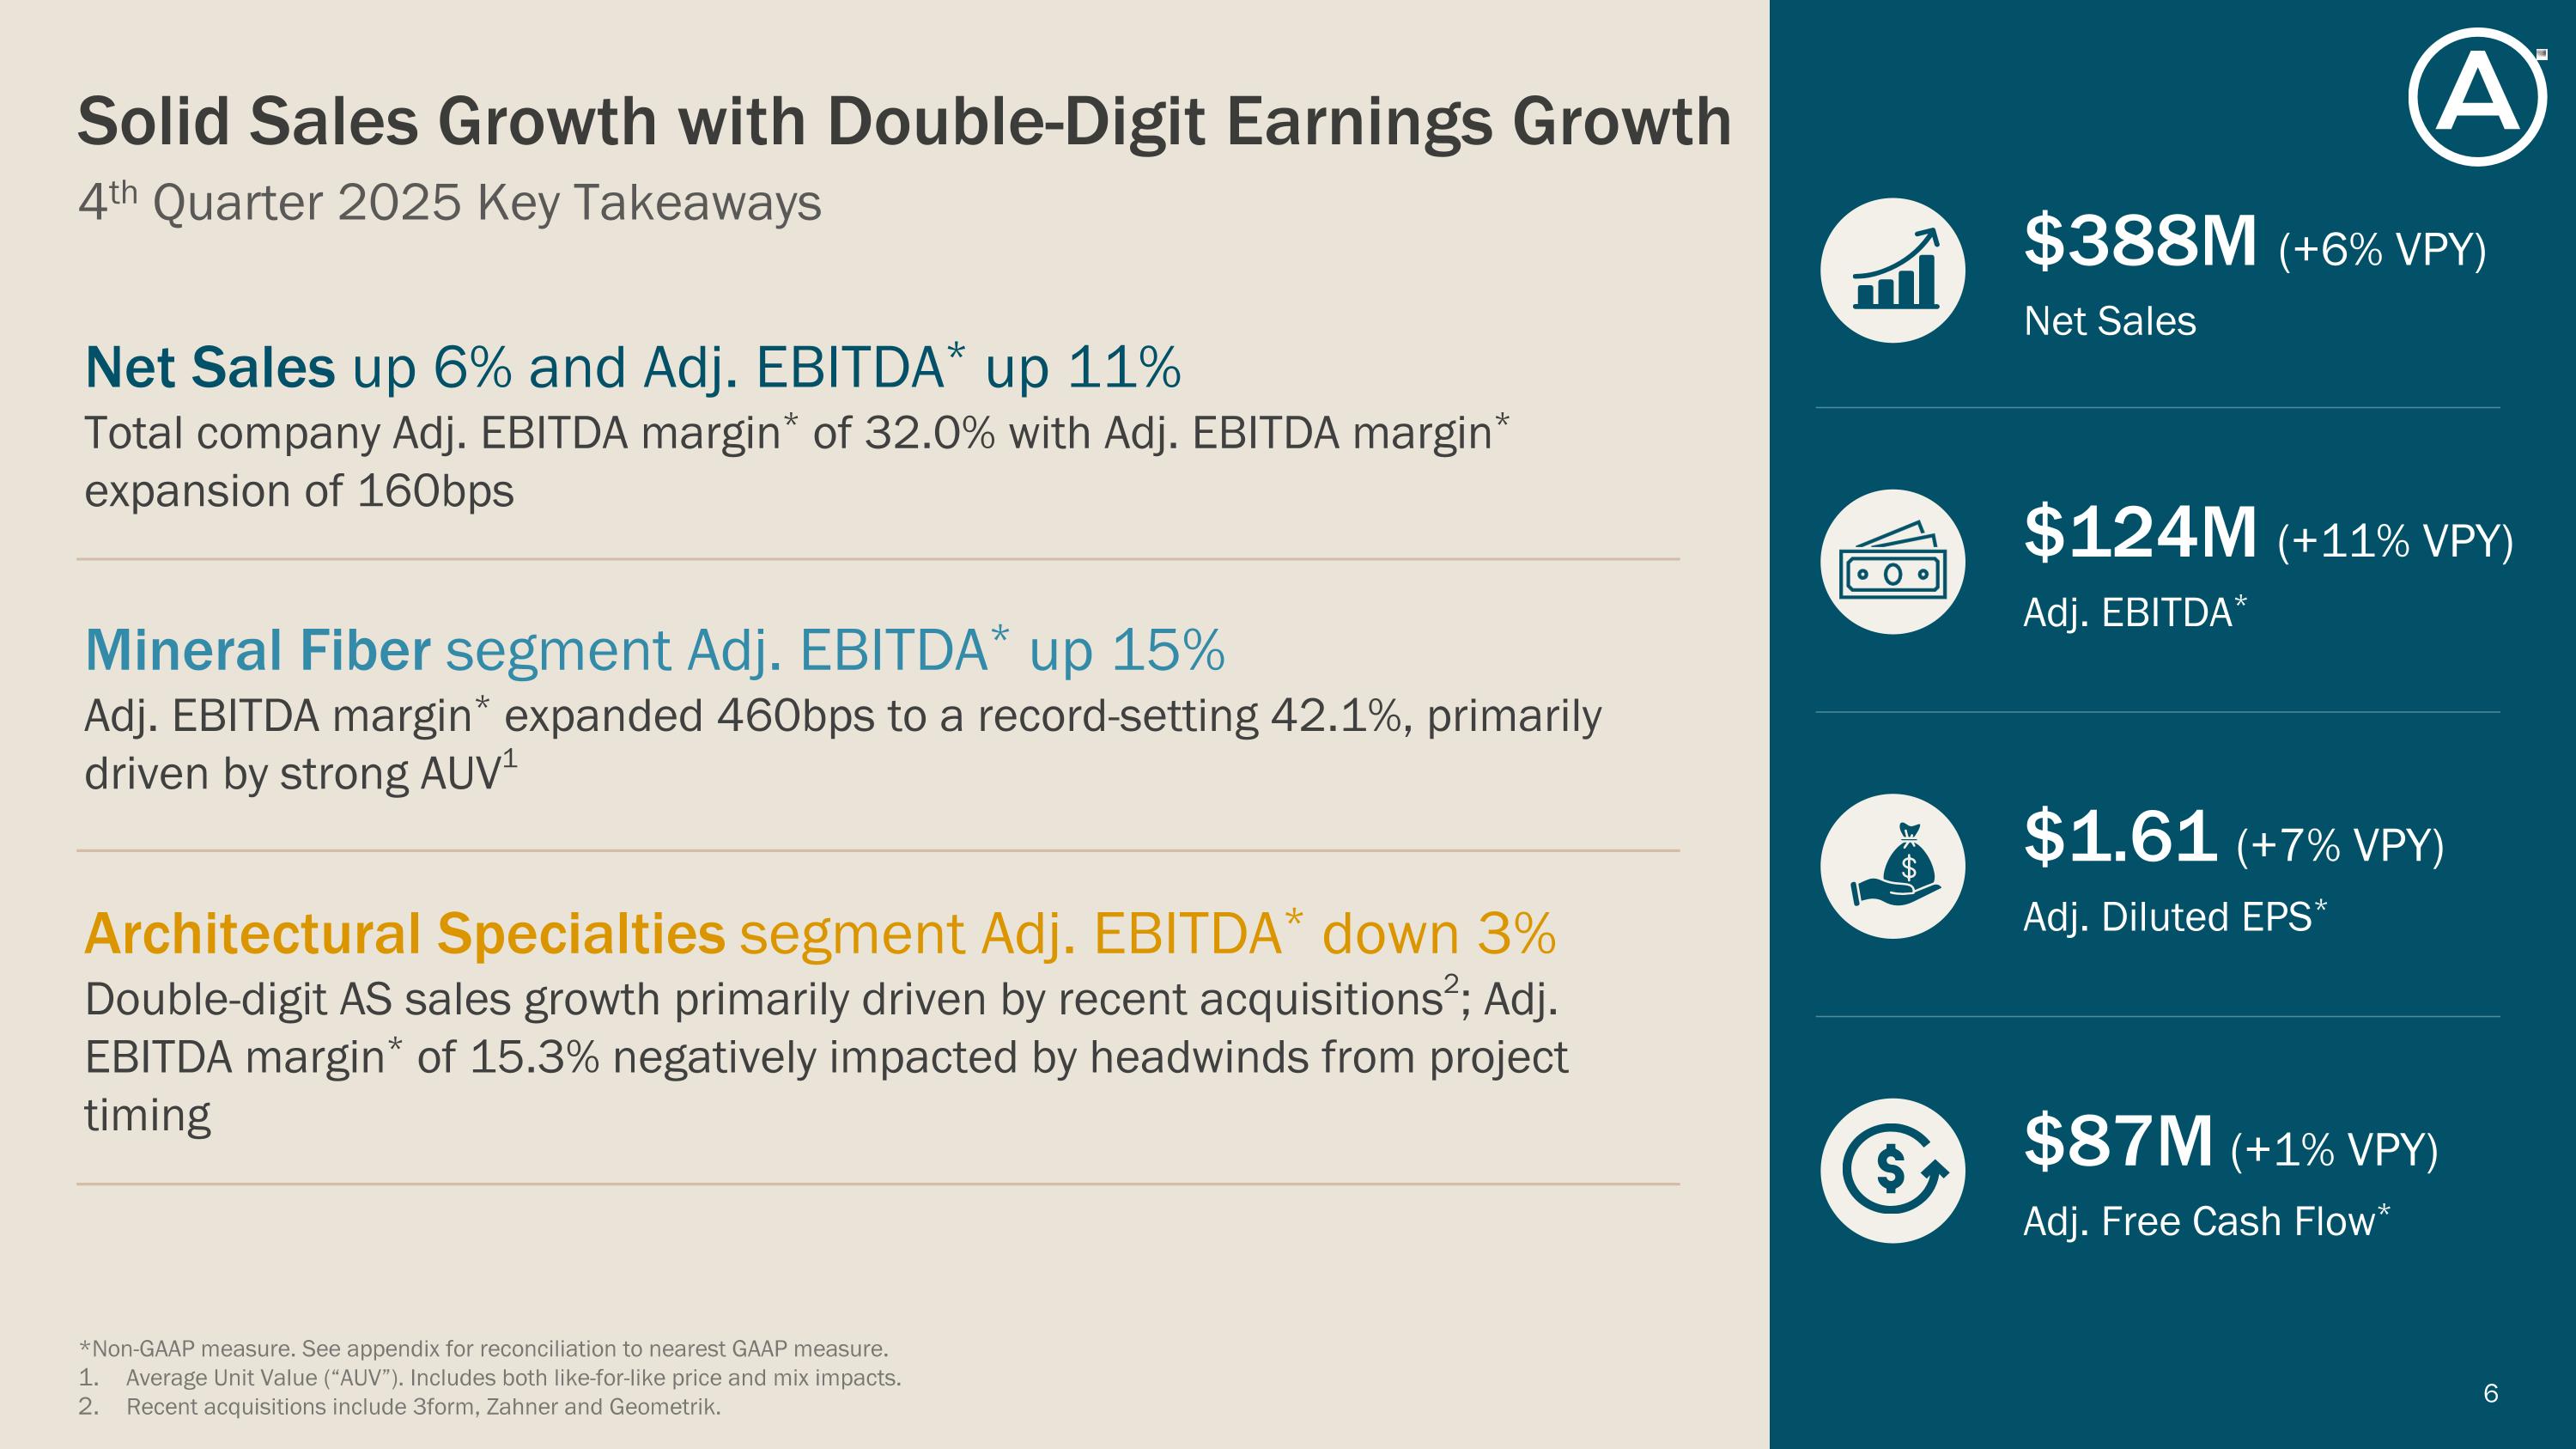
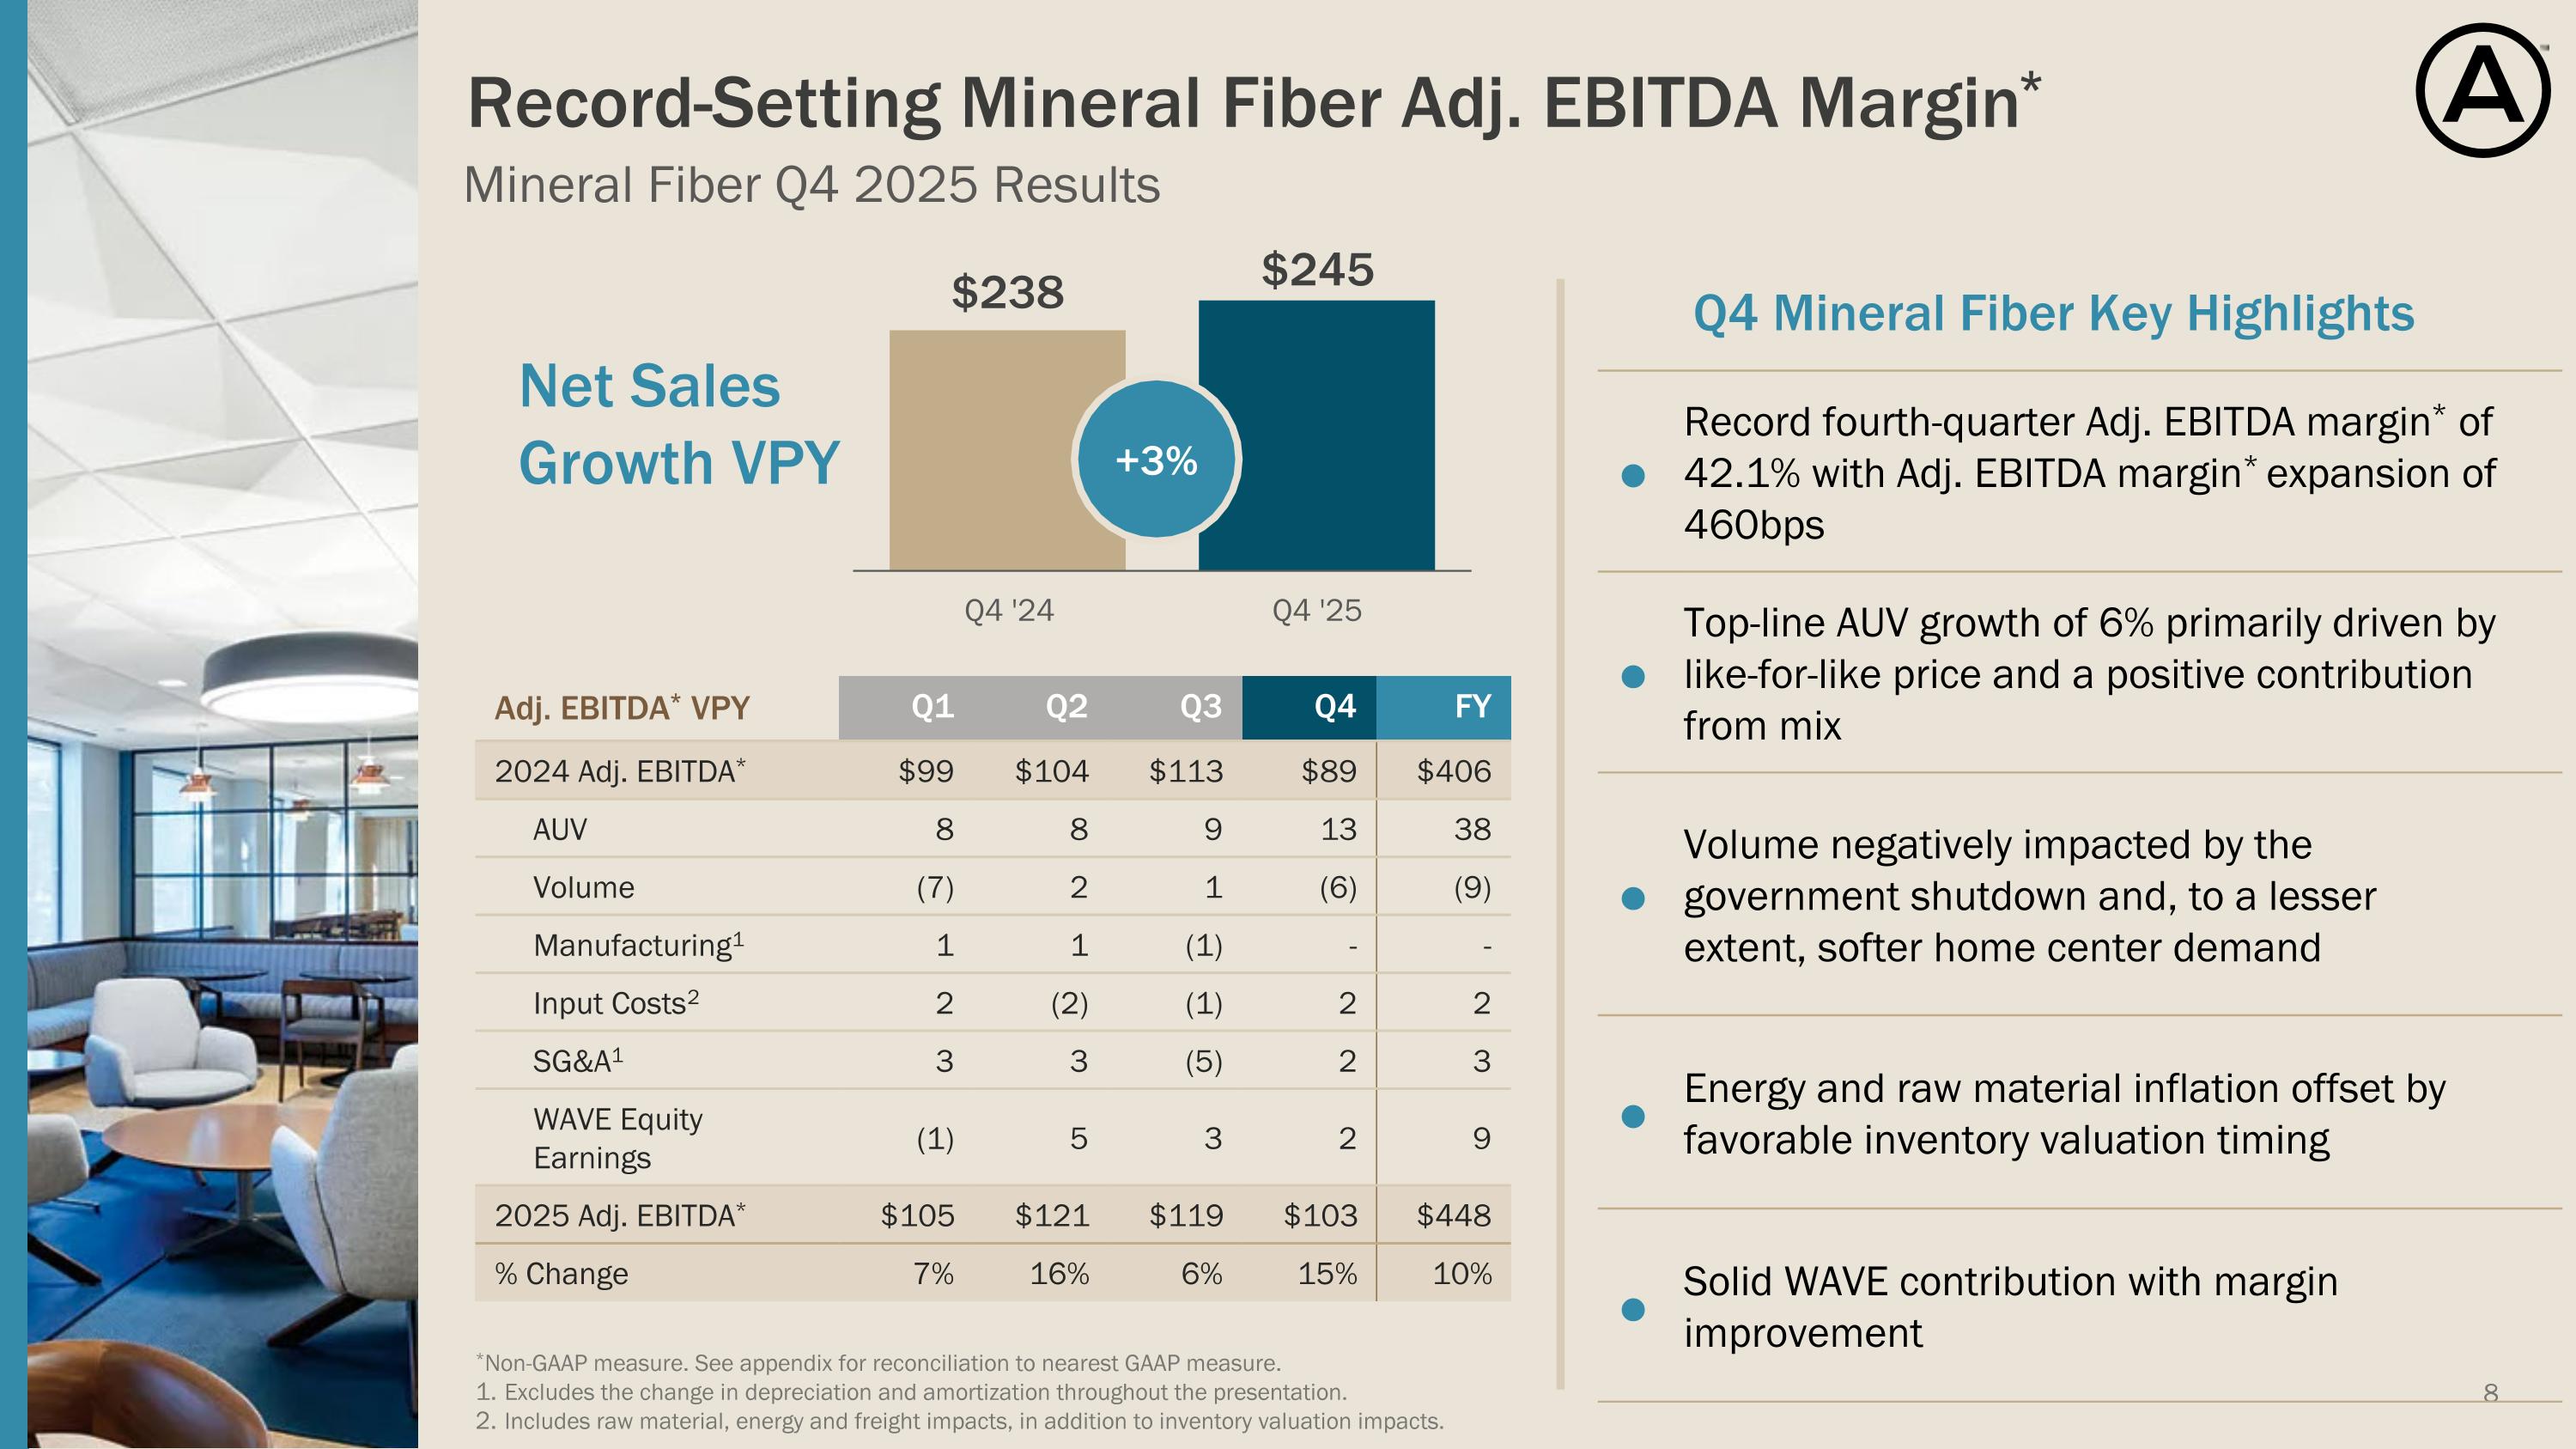
Thank you, Theresa, and good morning, and thank you for joining our call today. As many of you know, this will be my last Armstrong's earnings call as CEO, as I'll be moving into the executive chairman position on April 1st. And as previously announced, Mark Hershey, currently our chief operating officer, will be taking the helm as president and CEO effective at that time. It has been both a privilege and an honor to have led this great company for the past 10 years. Throughout my 15 years here at Armstrong, Mark has served alongside me in various key leadership roles. His extensive experience and track record of delivering results, combined with his strong dedication to our values and our culture of operational excellence, make him both well equipped and ready to lead this organization. We will hear from Mark later in the call today to discuss our recent acquisition of Eventscape and some advancements in our new product innovations. So let me begin with our record-setting 2025 results. 2025 represented another year of strong execution and a full demonstration of our resilient business model that delivered profitable growth despite persistently challenging market conditions. It was our team's continued execution at the highest level across the enterprise that enabled us to deliver another record-setting, double-digit growth year across all key metrics. Again, even as market conditions remained unfavorable. At the total company level for the full year, our net sales increased 12% from the prior year and our adjusted EBITDA grew 14% with our adjusted EBITDA margin expanding 70 basis As noted in our press release that we issued earlier, 2025 was our second consecutive year of double-digit growth, where the core values of Armstrong were on full display, such as strong mineral fiber average unit value growth, robust productivity across our operations, and double-digit top-line growth in our architectural specialty segment. Our 2025 results also mark the fifth consecutive year of net sales and earnings growth. And also notable, this is the third consecutive year we have reported year-over-year adjusted at EBITDA margin expansion. These strong and consistent results reflect our team's ability to steadily execute across the enterprise in all parts of the cycle. So before getting to our quarterly results, I wanna take a moment and recognize and express my gratitude to our team of nearly 4,000 employees. Their commitment and their passion for what we do and dedication to serving our customers are not only impressive, but they're unique and a key driver of our continued success. So thank you to the entire Armstrong team. Now turning to our fourth quarter results, in the quarter, we finished with softer results than expected, even though we had solid AUV growth in mineral fiber with favorable like-for-like pricing, strong productivity more than offsetting inflation, and continued double-digit top-line growth in architectural specialties. Softer results on the top line in mineral fiber mainly came from the impact of the extended government shutdown that disrupted maintenance and repair activity for government buildings across the U.S. In addition, we did not see the normal bounce back after reopening, which impacted mineral fiber volumes in notable areas like our Washington, D.C. territory and with our MRO customers serving the repair and maintenance activity in government buildings. Software-than-expected results in the quarter also occurred in the architectural specialty segment, primarily driven by key project delays. This created a cost imbalance in the quarter, temporarily compressing margins in the AF Together, these drivers form an air pocket of sorts for the total company results that we expect to work through in the coming quarters. As I mentioned in the quarter, average unit value, or AUV, in our mineral fiber segment increased 6% on strong like-for-like price performance and positive product mix driven by our innovative products. Despite short-term pressures created by these temporary market events, mineral fiber EBITDA increased 15% to a record fourth-quarter result and a record fourth-quarter EBITDA margin of 42.1%. Architectural Specialties delivered 11% top-line growth with solid inorganic and organic contributions despite the project delays. And importantly, water intake growth continued to be strong at double-digit levels year-over-year in the fourth quarter, sustaining a momentum heading into 2026. We continue to see strength in the transportation vertical for a broad portfolio of AES products, and we continue to win large airport projects with recent wins at LAX and Salt Lake City International Airport. We continue to expect the transportation vertical to provide a tailwind for several years to come. Both the mineral fiber and architectural specialty segments contributed to our record results in 2025, with our strong focus on operational execution being a key contributor to our sustained leadership position and our growth initiatives providing above market growth rates. Operational excellence enabled now by technology is critical, both in terms of profitability as well as from the eyes of our customer in terms of quality and service. And this was an outstanding year in both areas, with our teams delivering a record high result for our perfect order measure. This measure I've described before tracks our performance across multiple metrics that are critical for maintaining our best-in-class customer service levels. Things like on-time delivery, product defects, billing accuracy. Executing at high levels across these areas not only drives customer satisfaction, but it also supports our pricing performance in competitive markets and reinforces the strength of our market position. After a few years of foundational investment in our growth initiatives, they continue to scale and are contributing to our business model and are creating value as competitive differentiator for the company. On the digital front, the use of ProjectWorks, our automated design platform, continues to grow and generate higher win rates on projects when the service was used, reinforcing its value again as competitive differentiator. Canopy also continue to perform well and contribute nicely to our growth in 2025, providing an easy way for otherwise underserved customers to access a broad range of products through a simple online selling platform. We are pleased to see record revenue and EBITDA results for Canopy in 2025, with each quarter providing a positive EBITDA contribution. Now in addition to these successful digital growth initiatives, with growing opportunities in data centers and energy saving ceilings, total contributions from our growth initiatives are positioned to further accelerate in 2026 and beyond. And Mark's going to cover these two key growth opportunities here in a moment. All in all, these results, together with our growth initiatives, were another demonstration of how our business model and our strategy can deliver growth above the market and do so profitably through our pricing discipline, operational excellence, and strong operating leverage. Now I'll turn the call over to Chris for more details on our financial results.
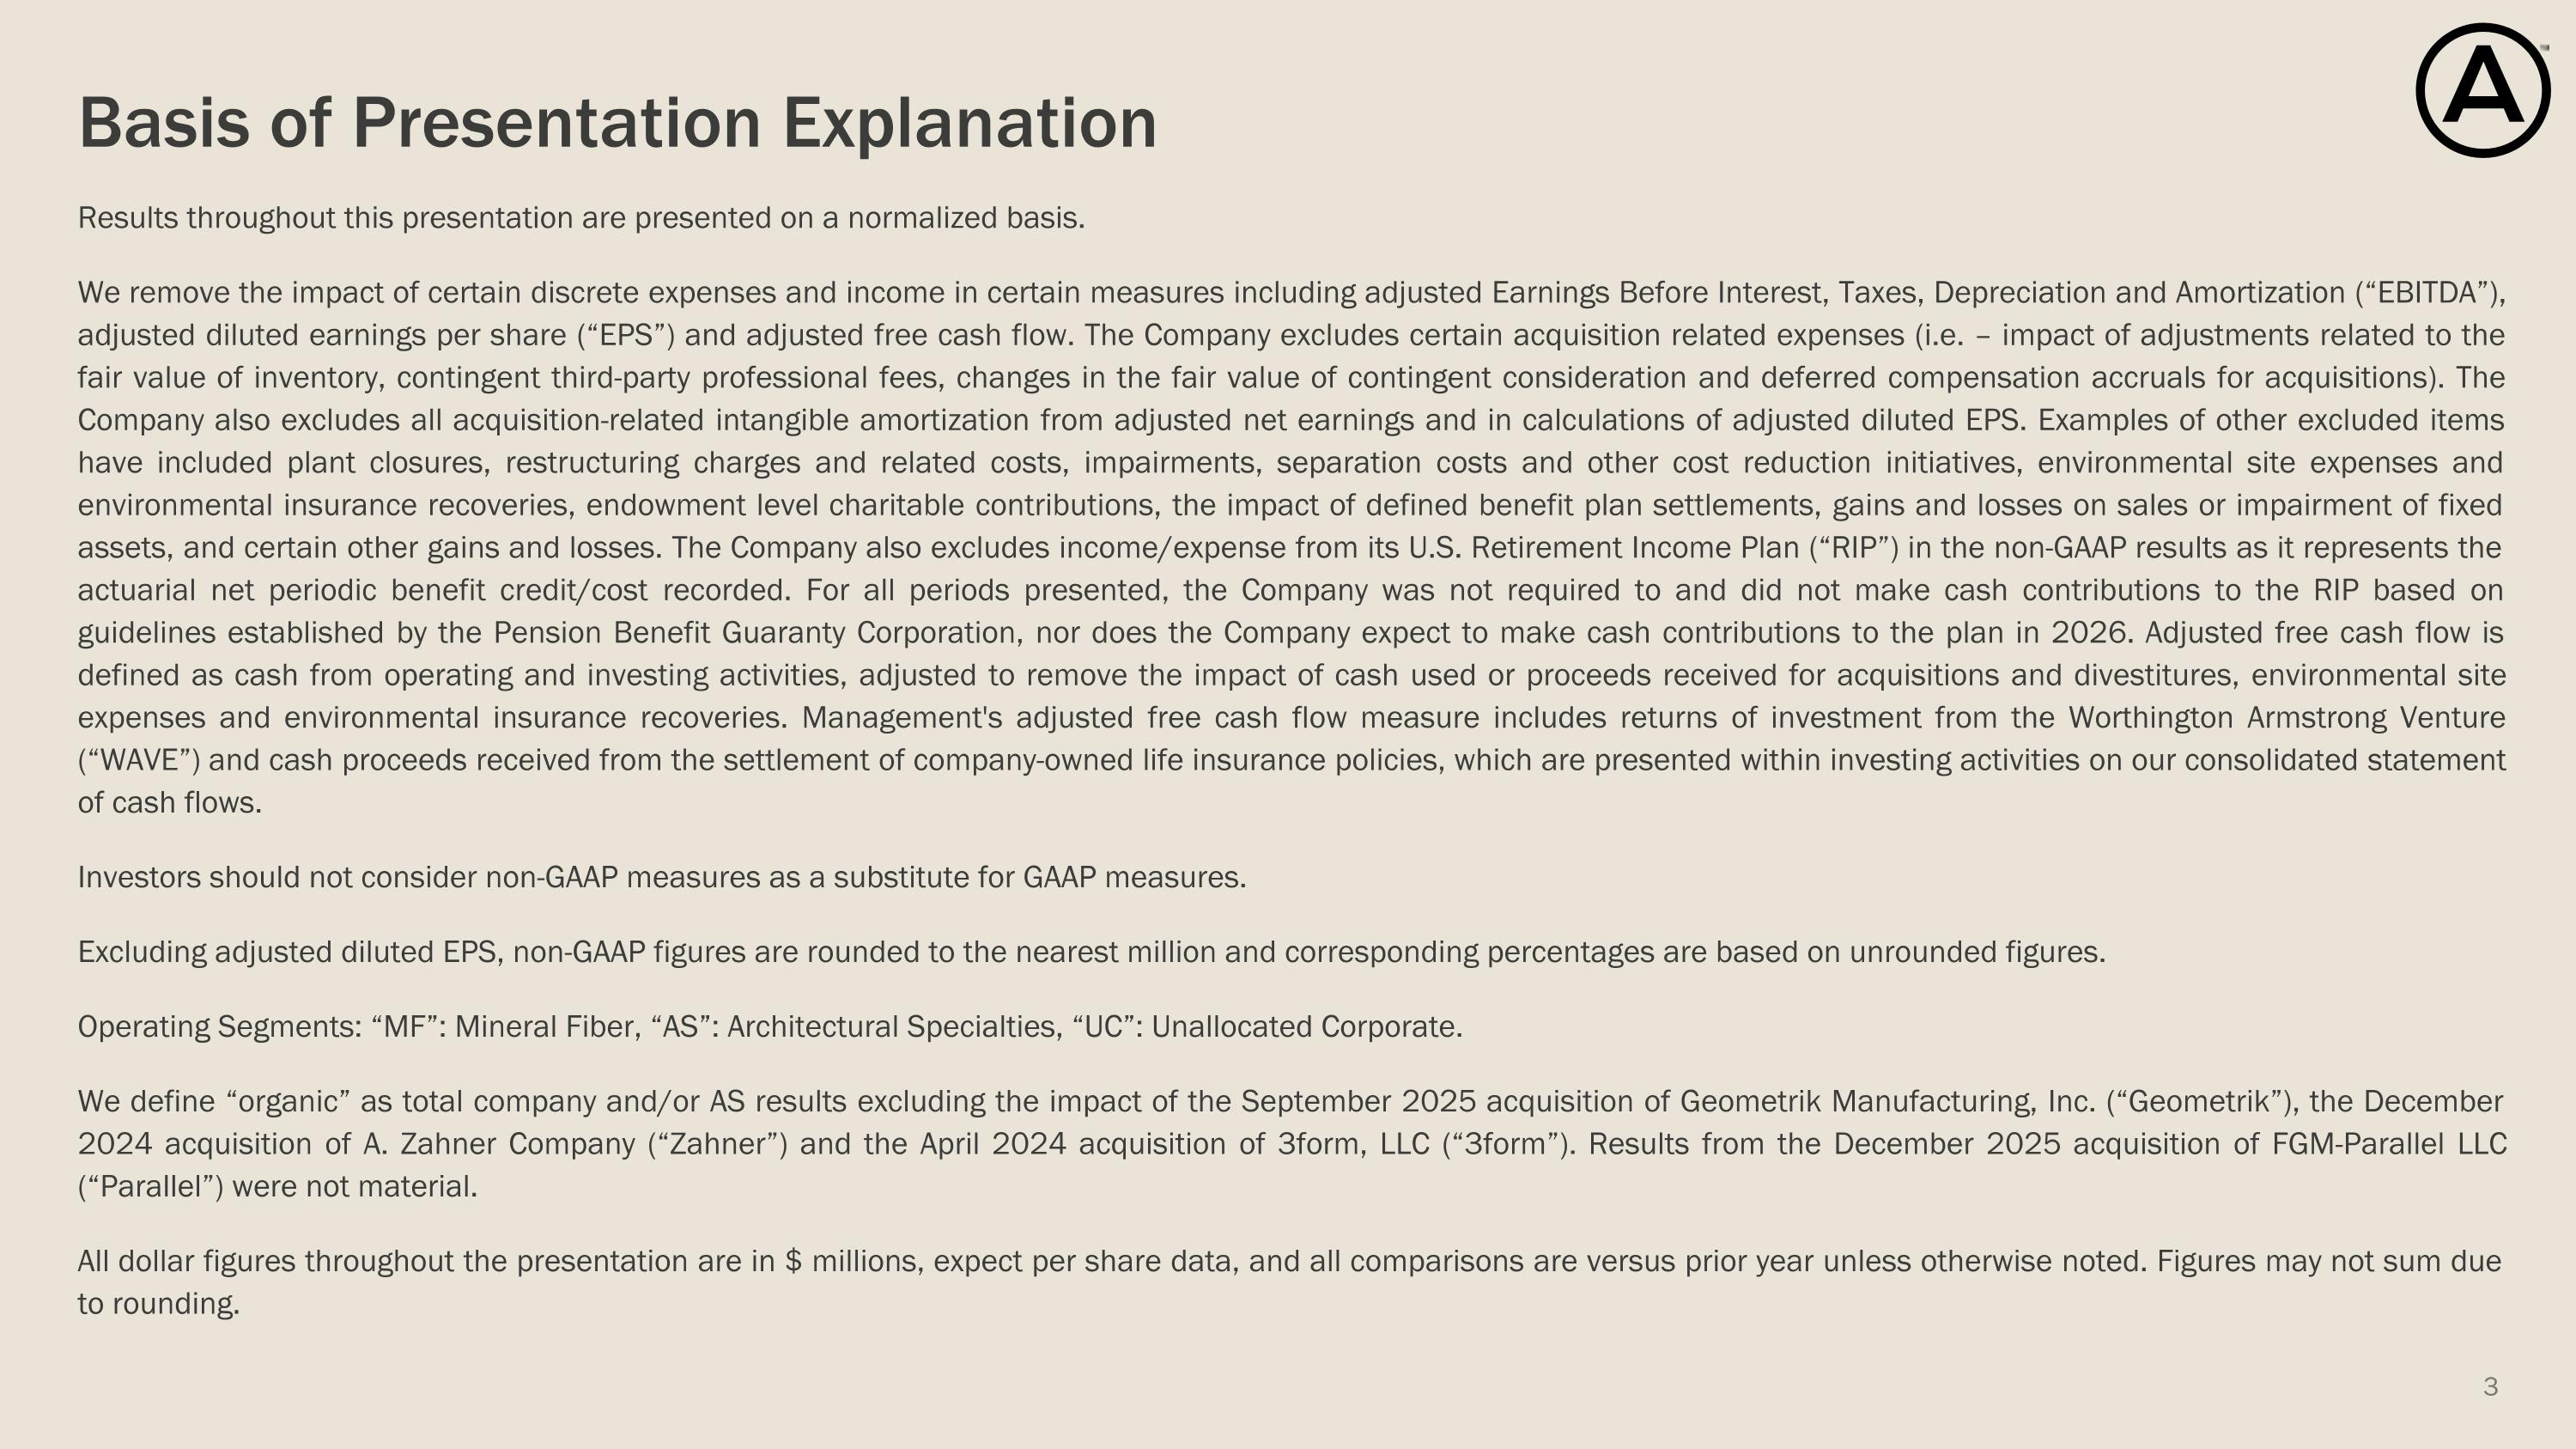
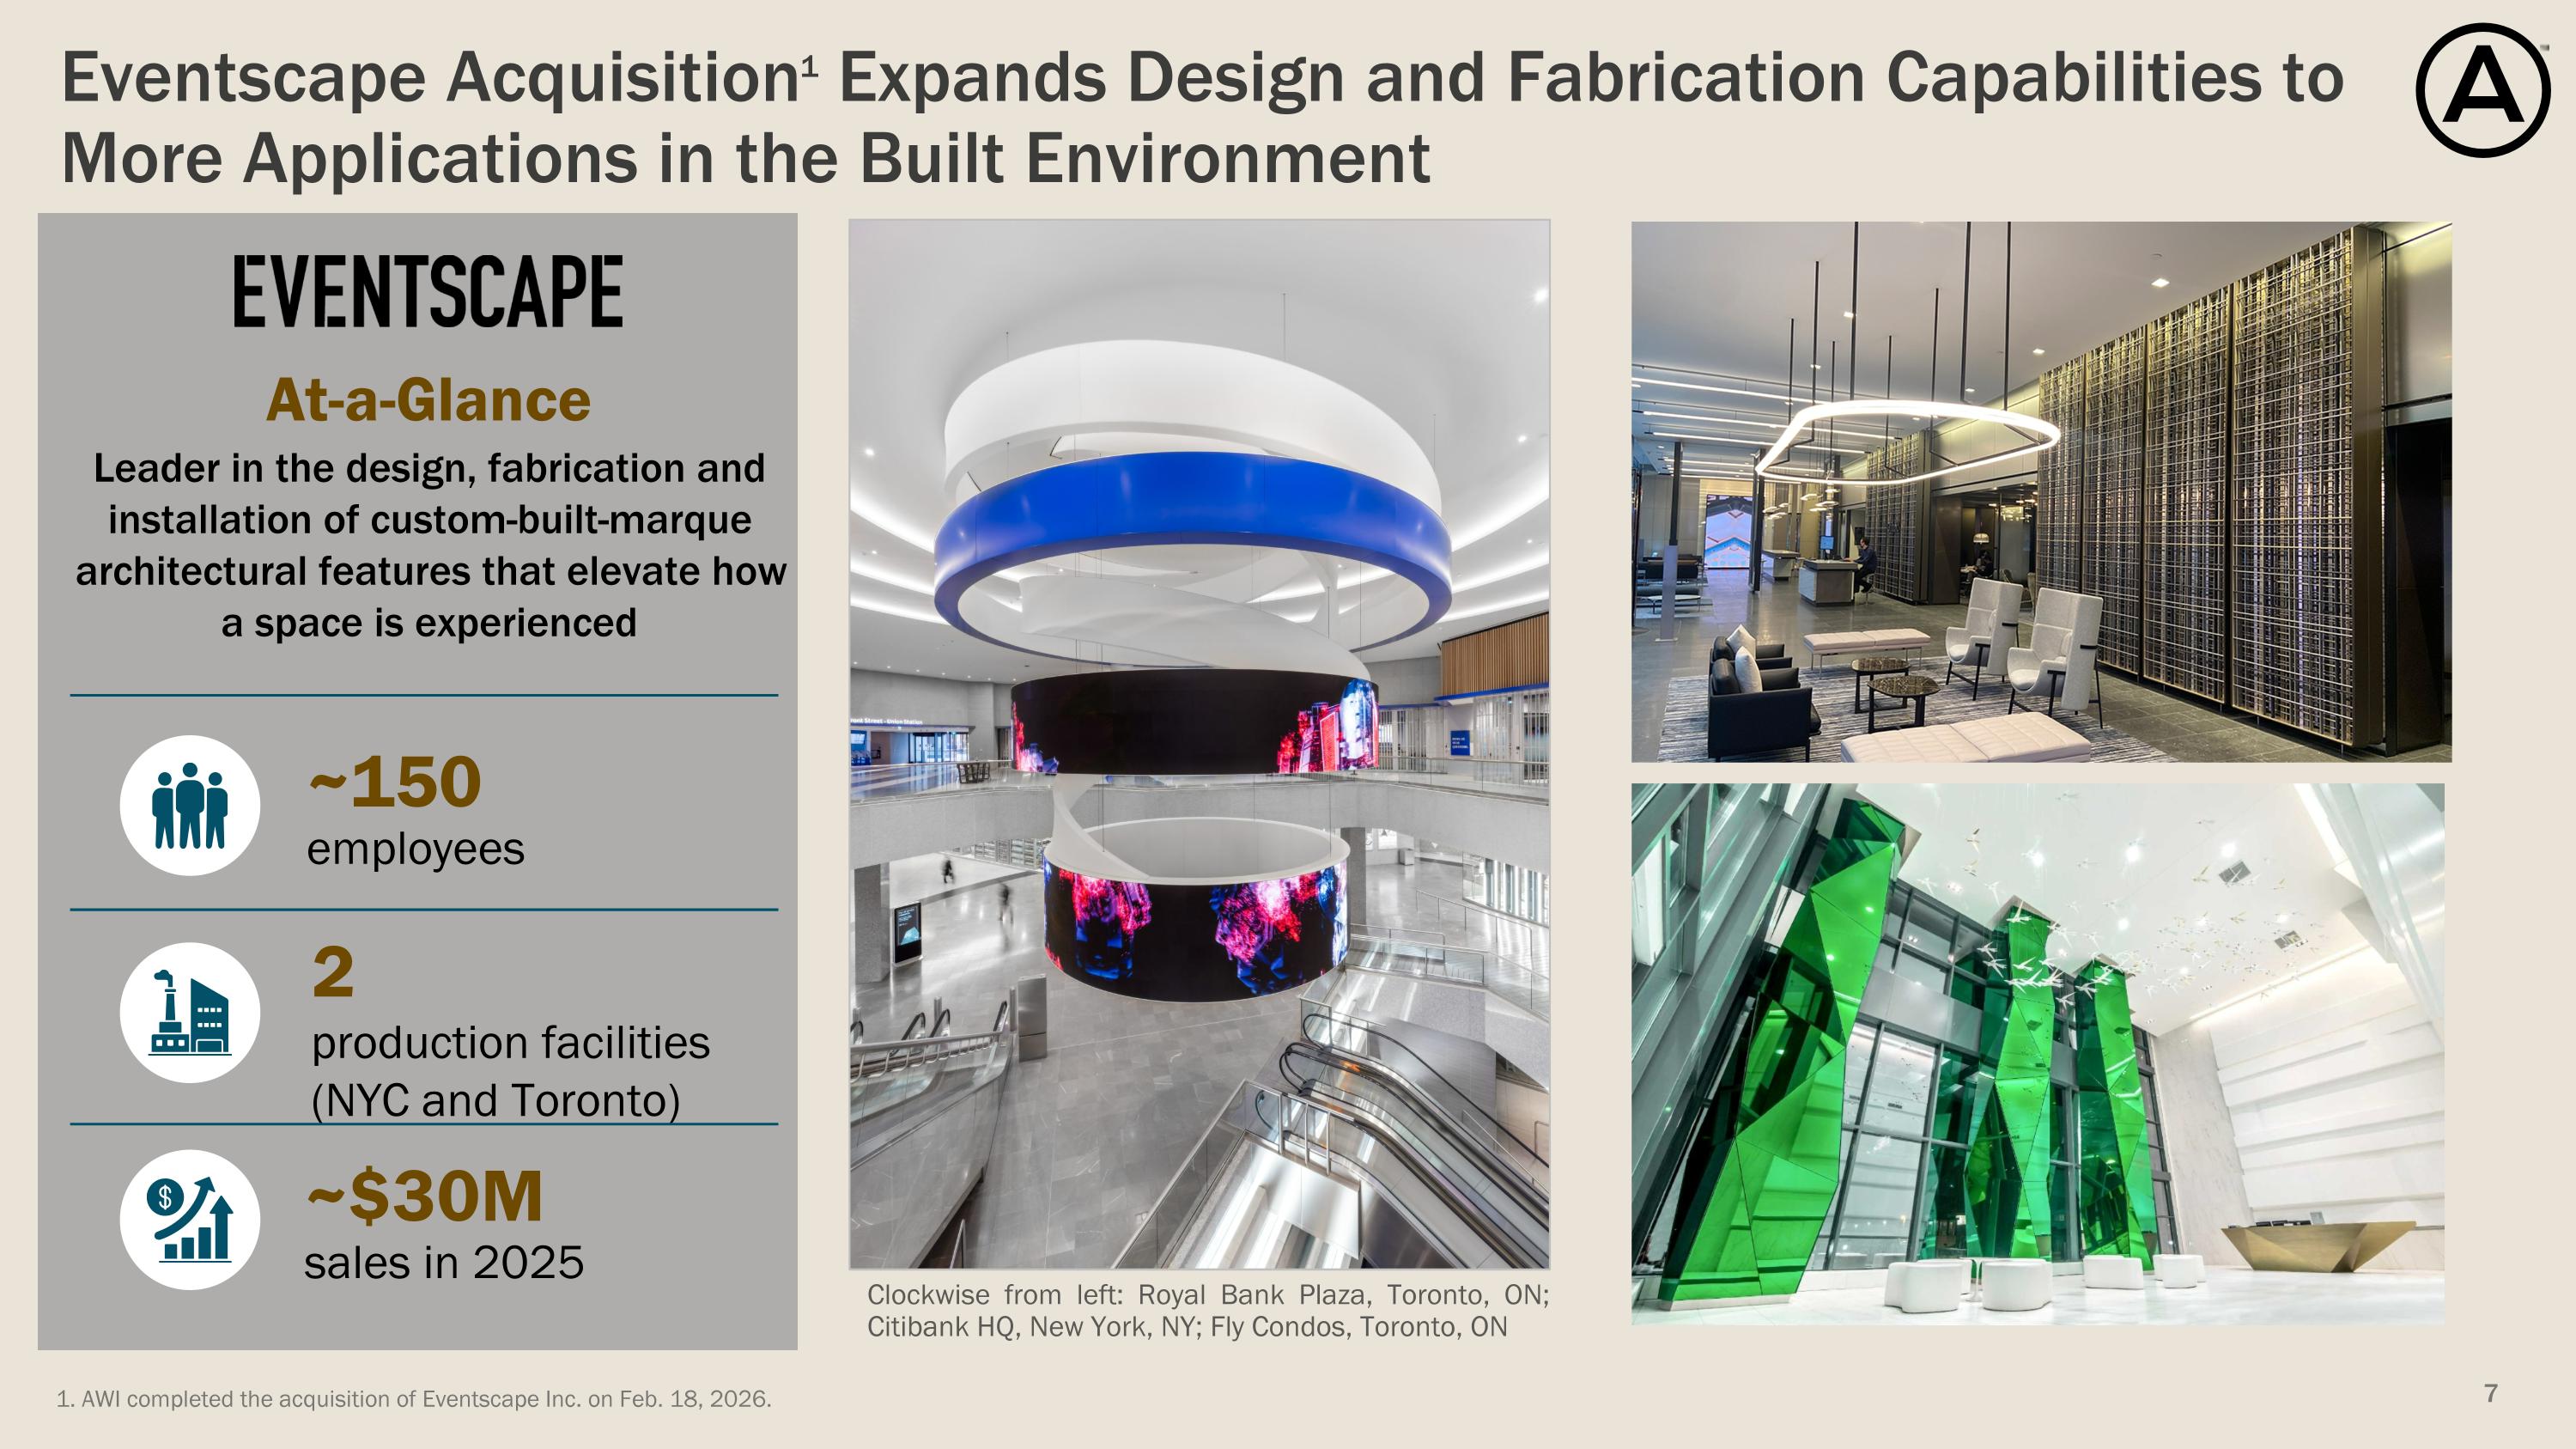
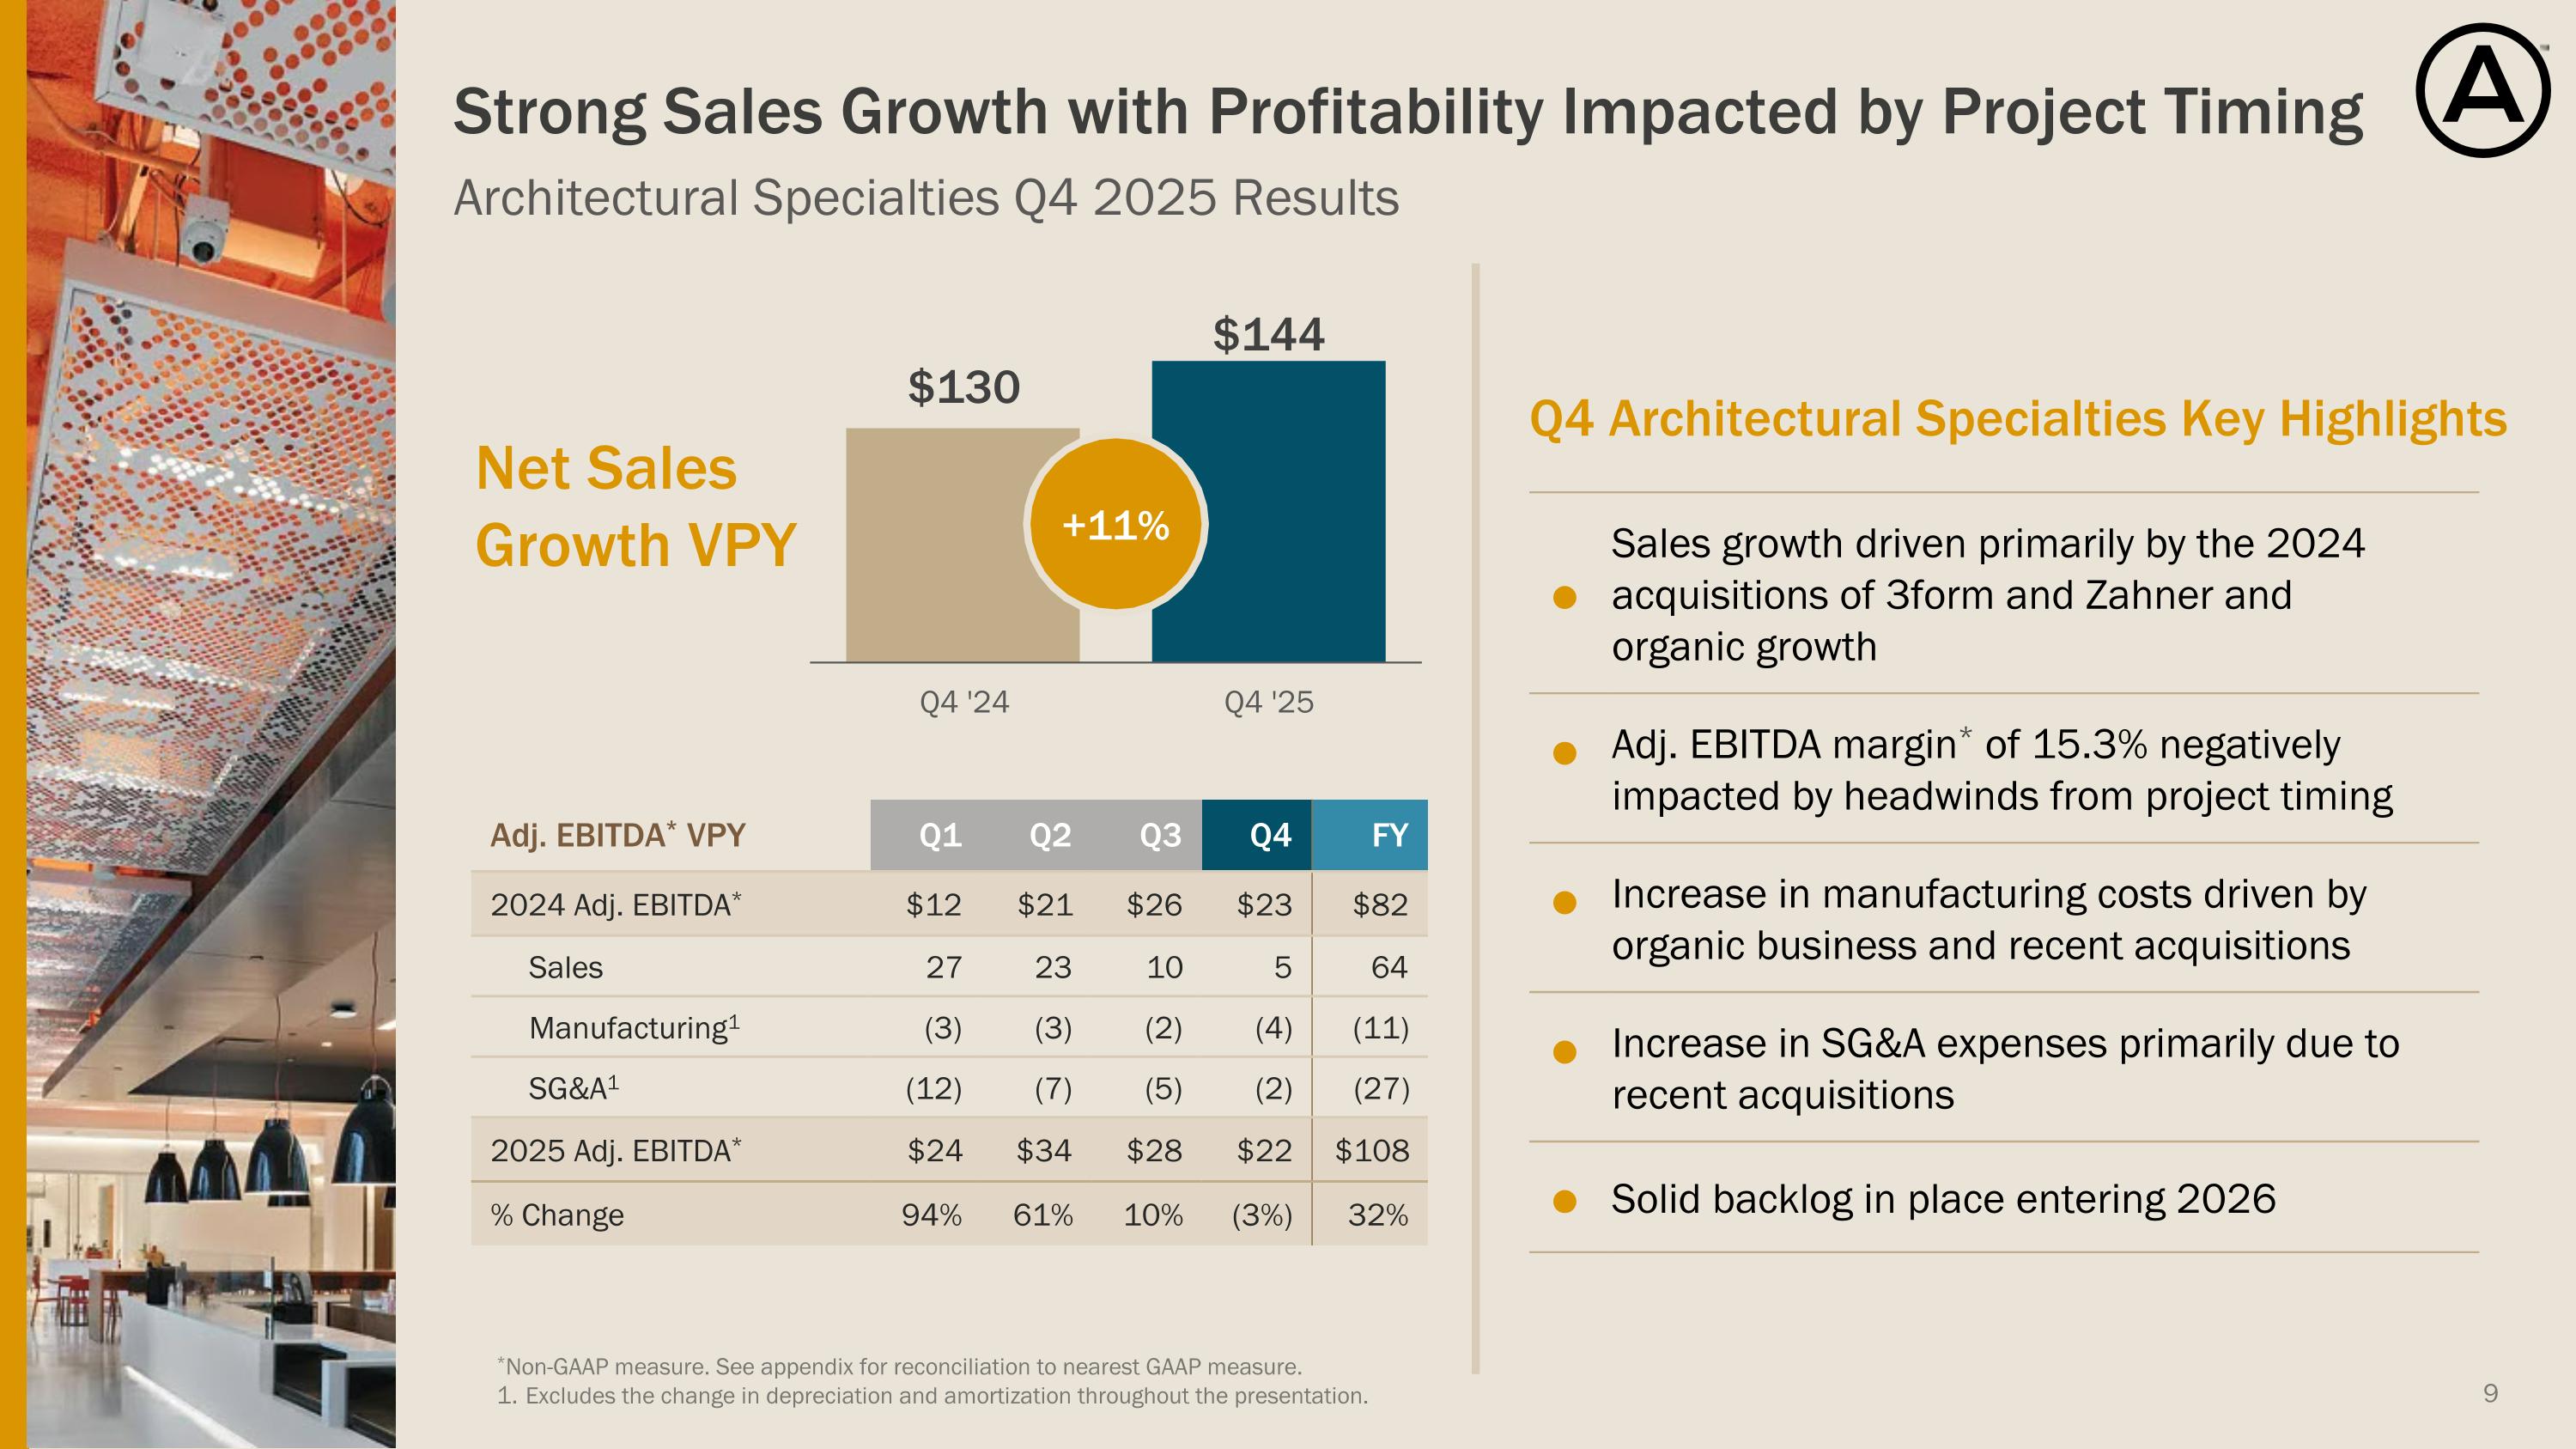
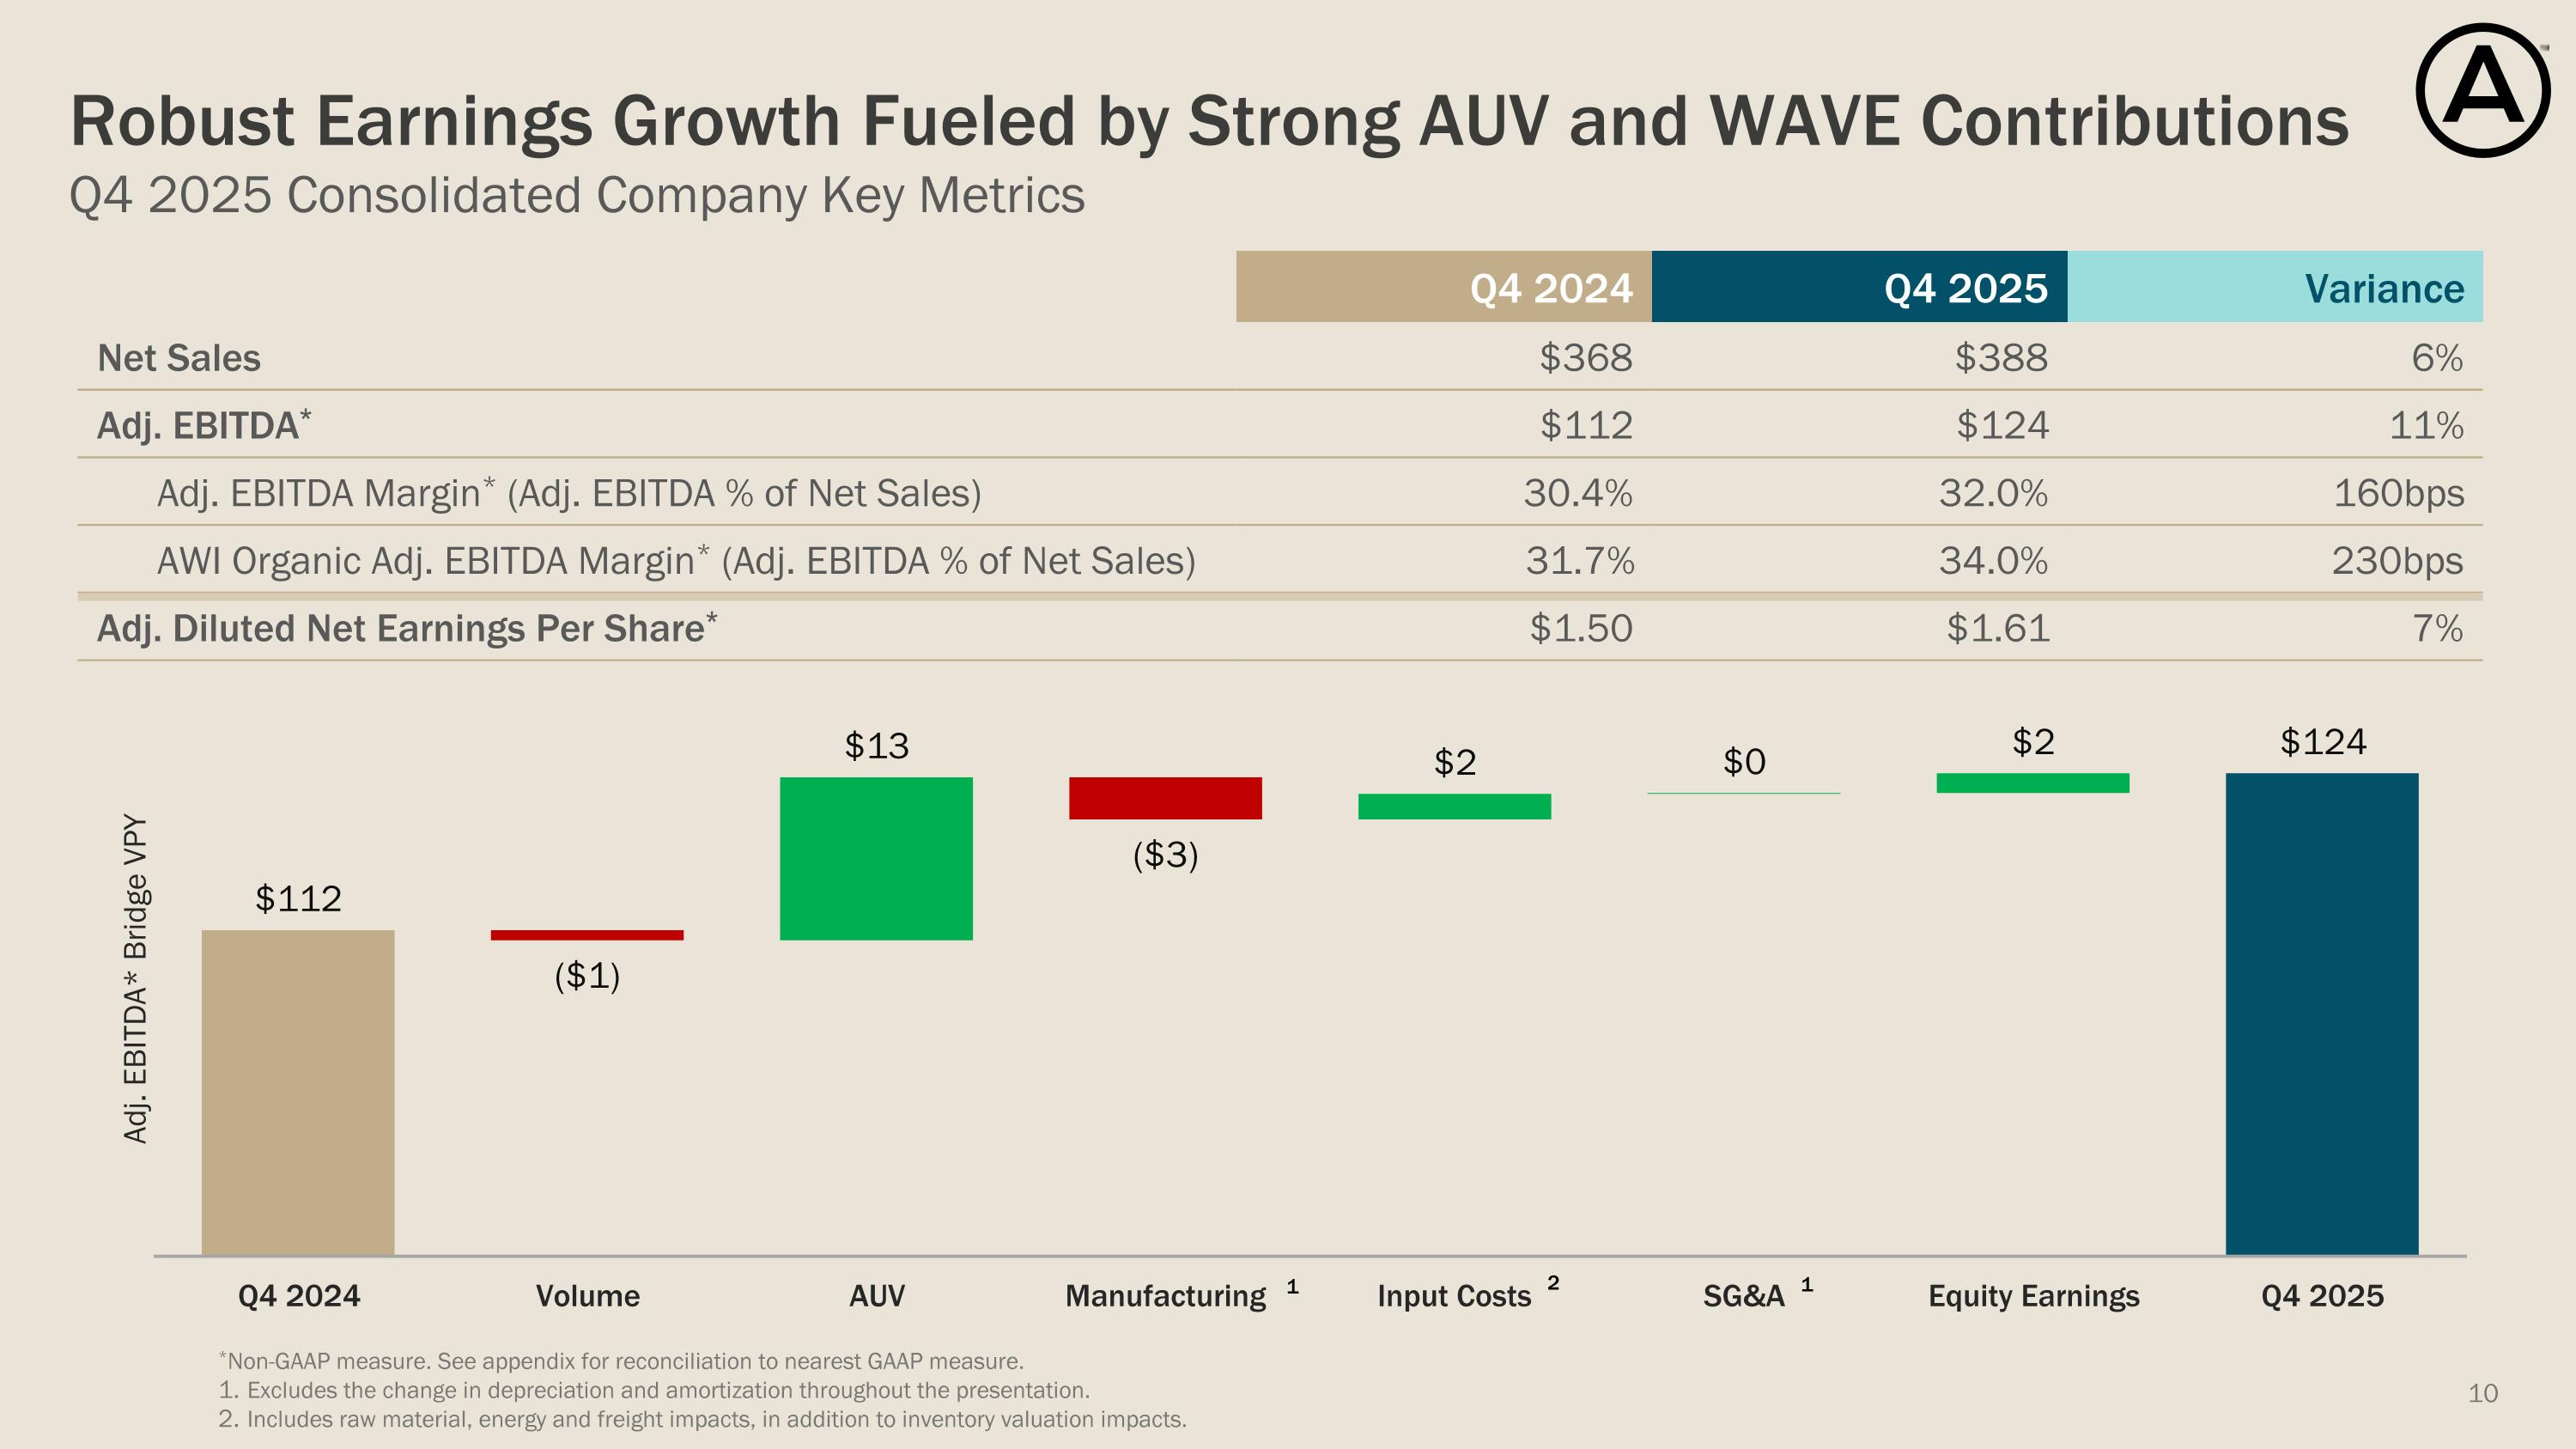
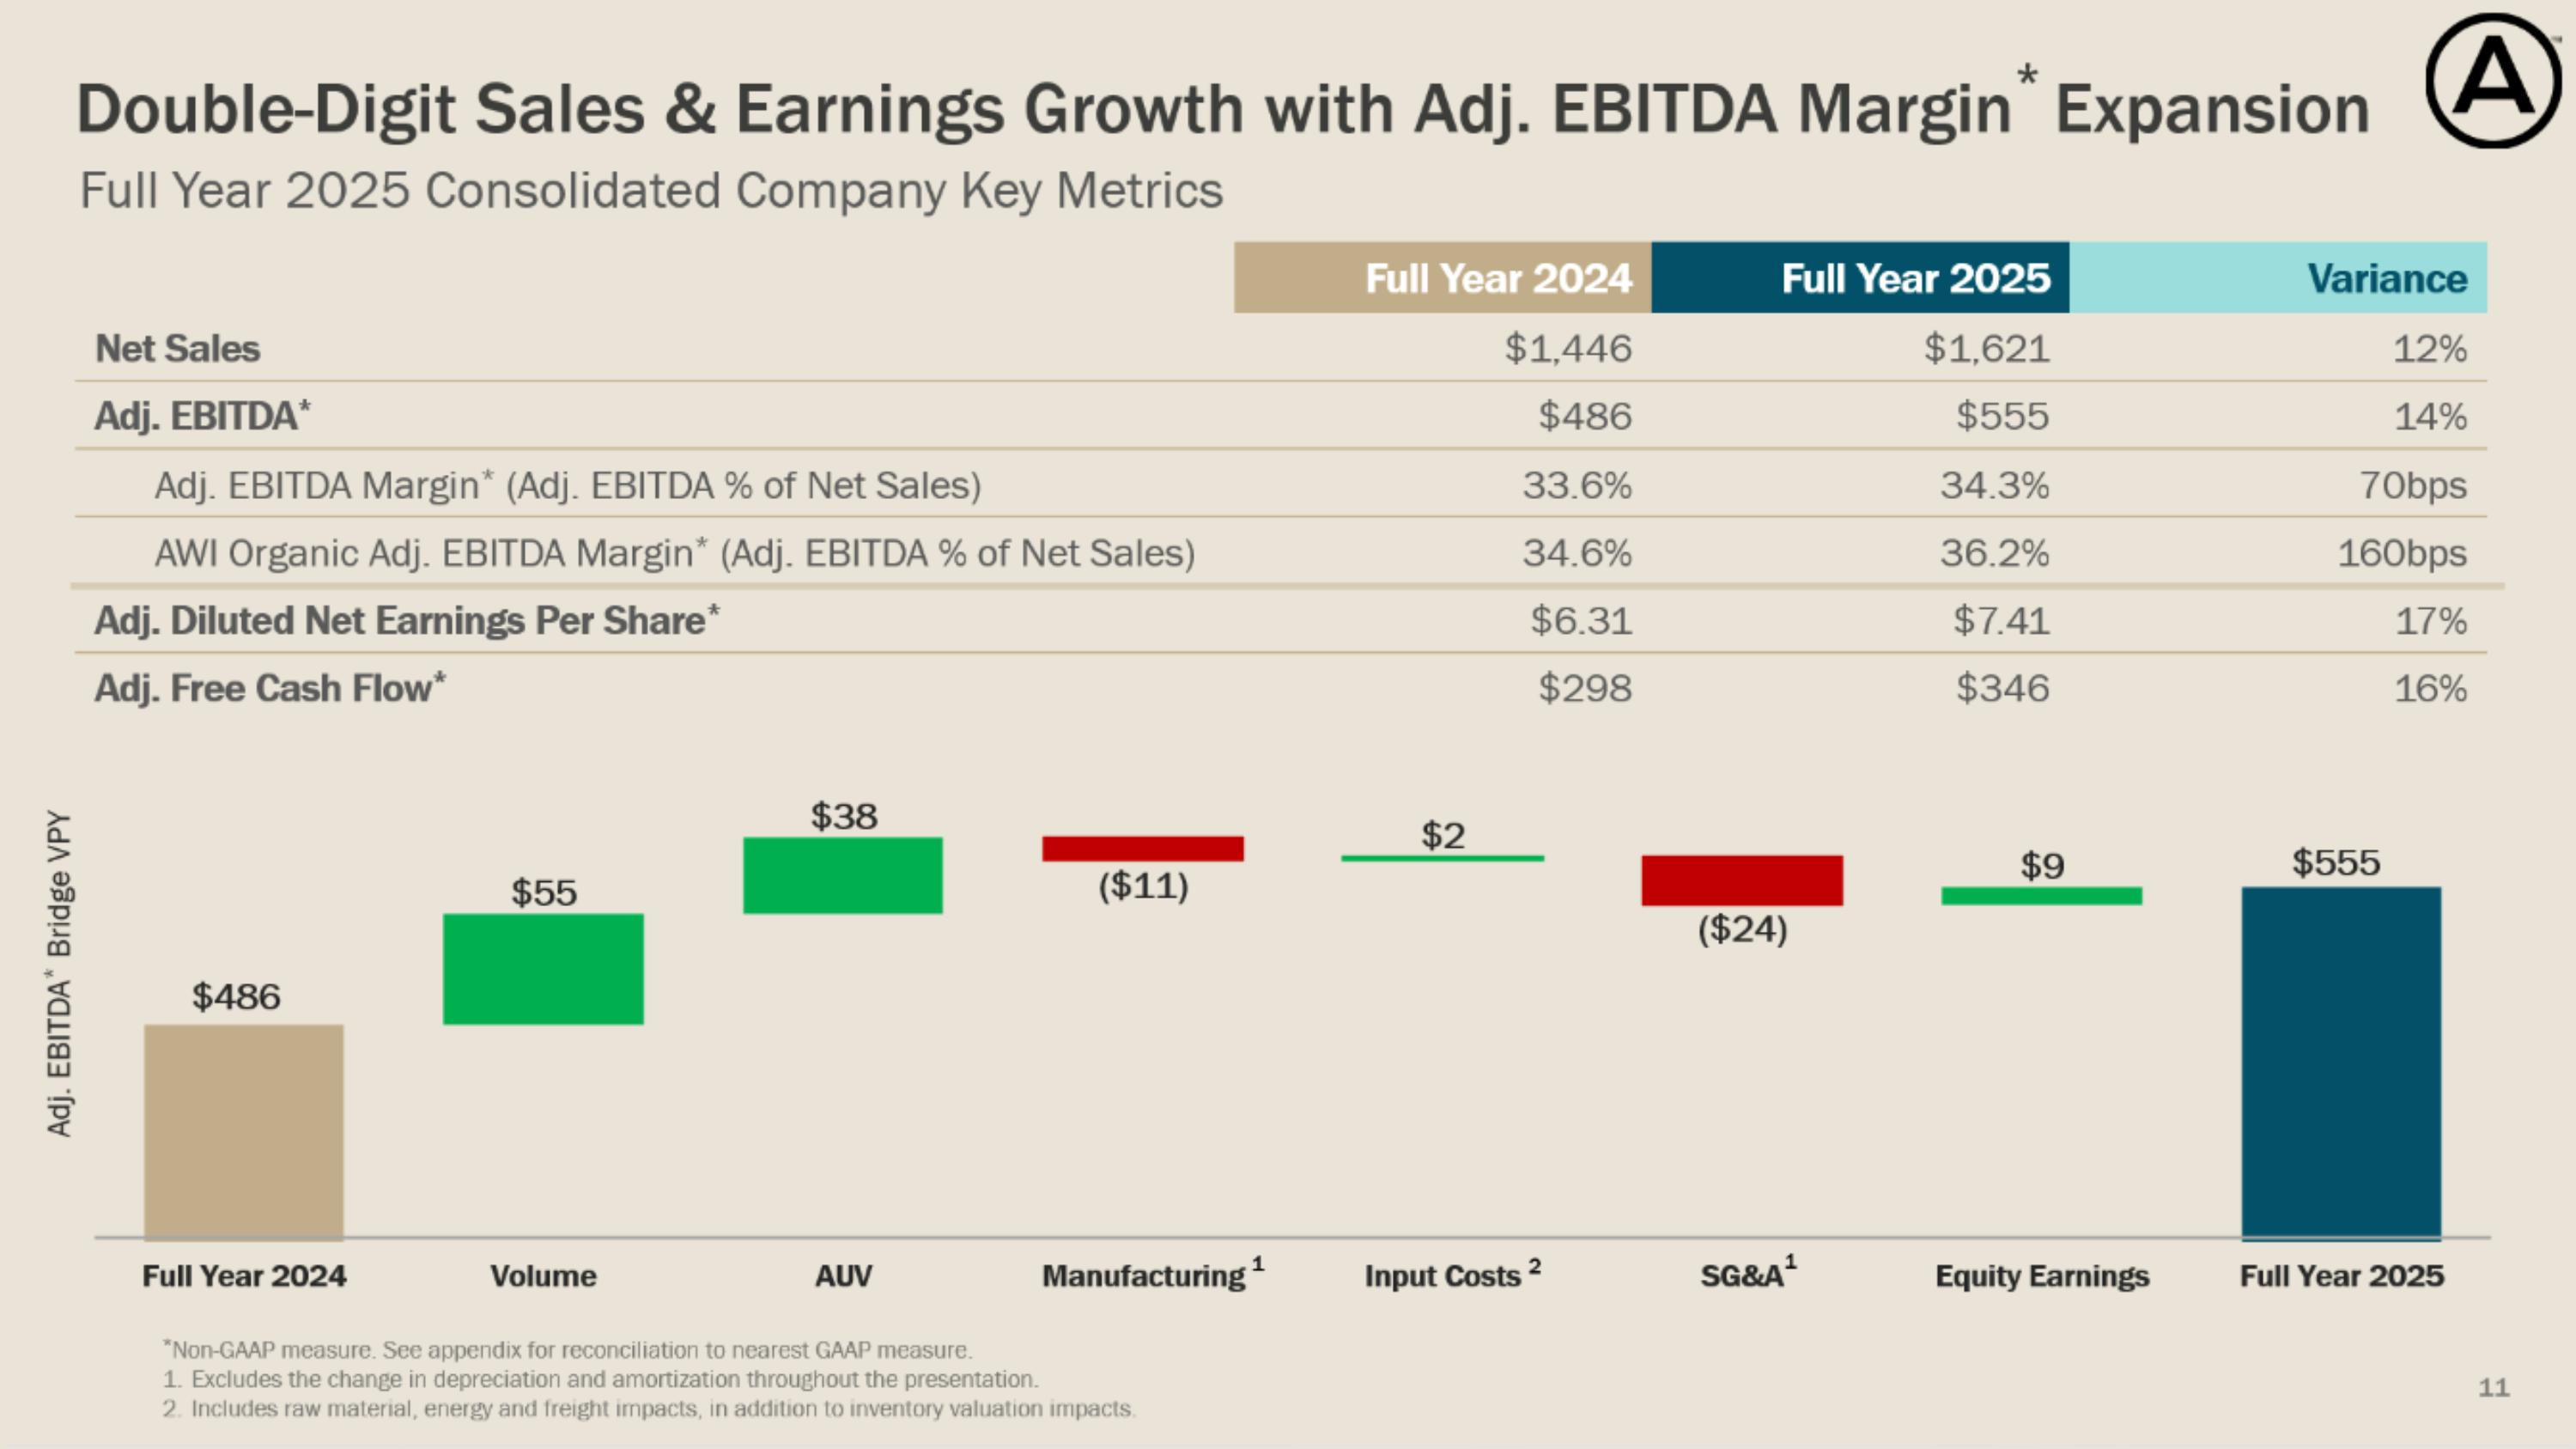
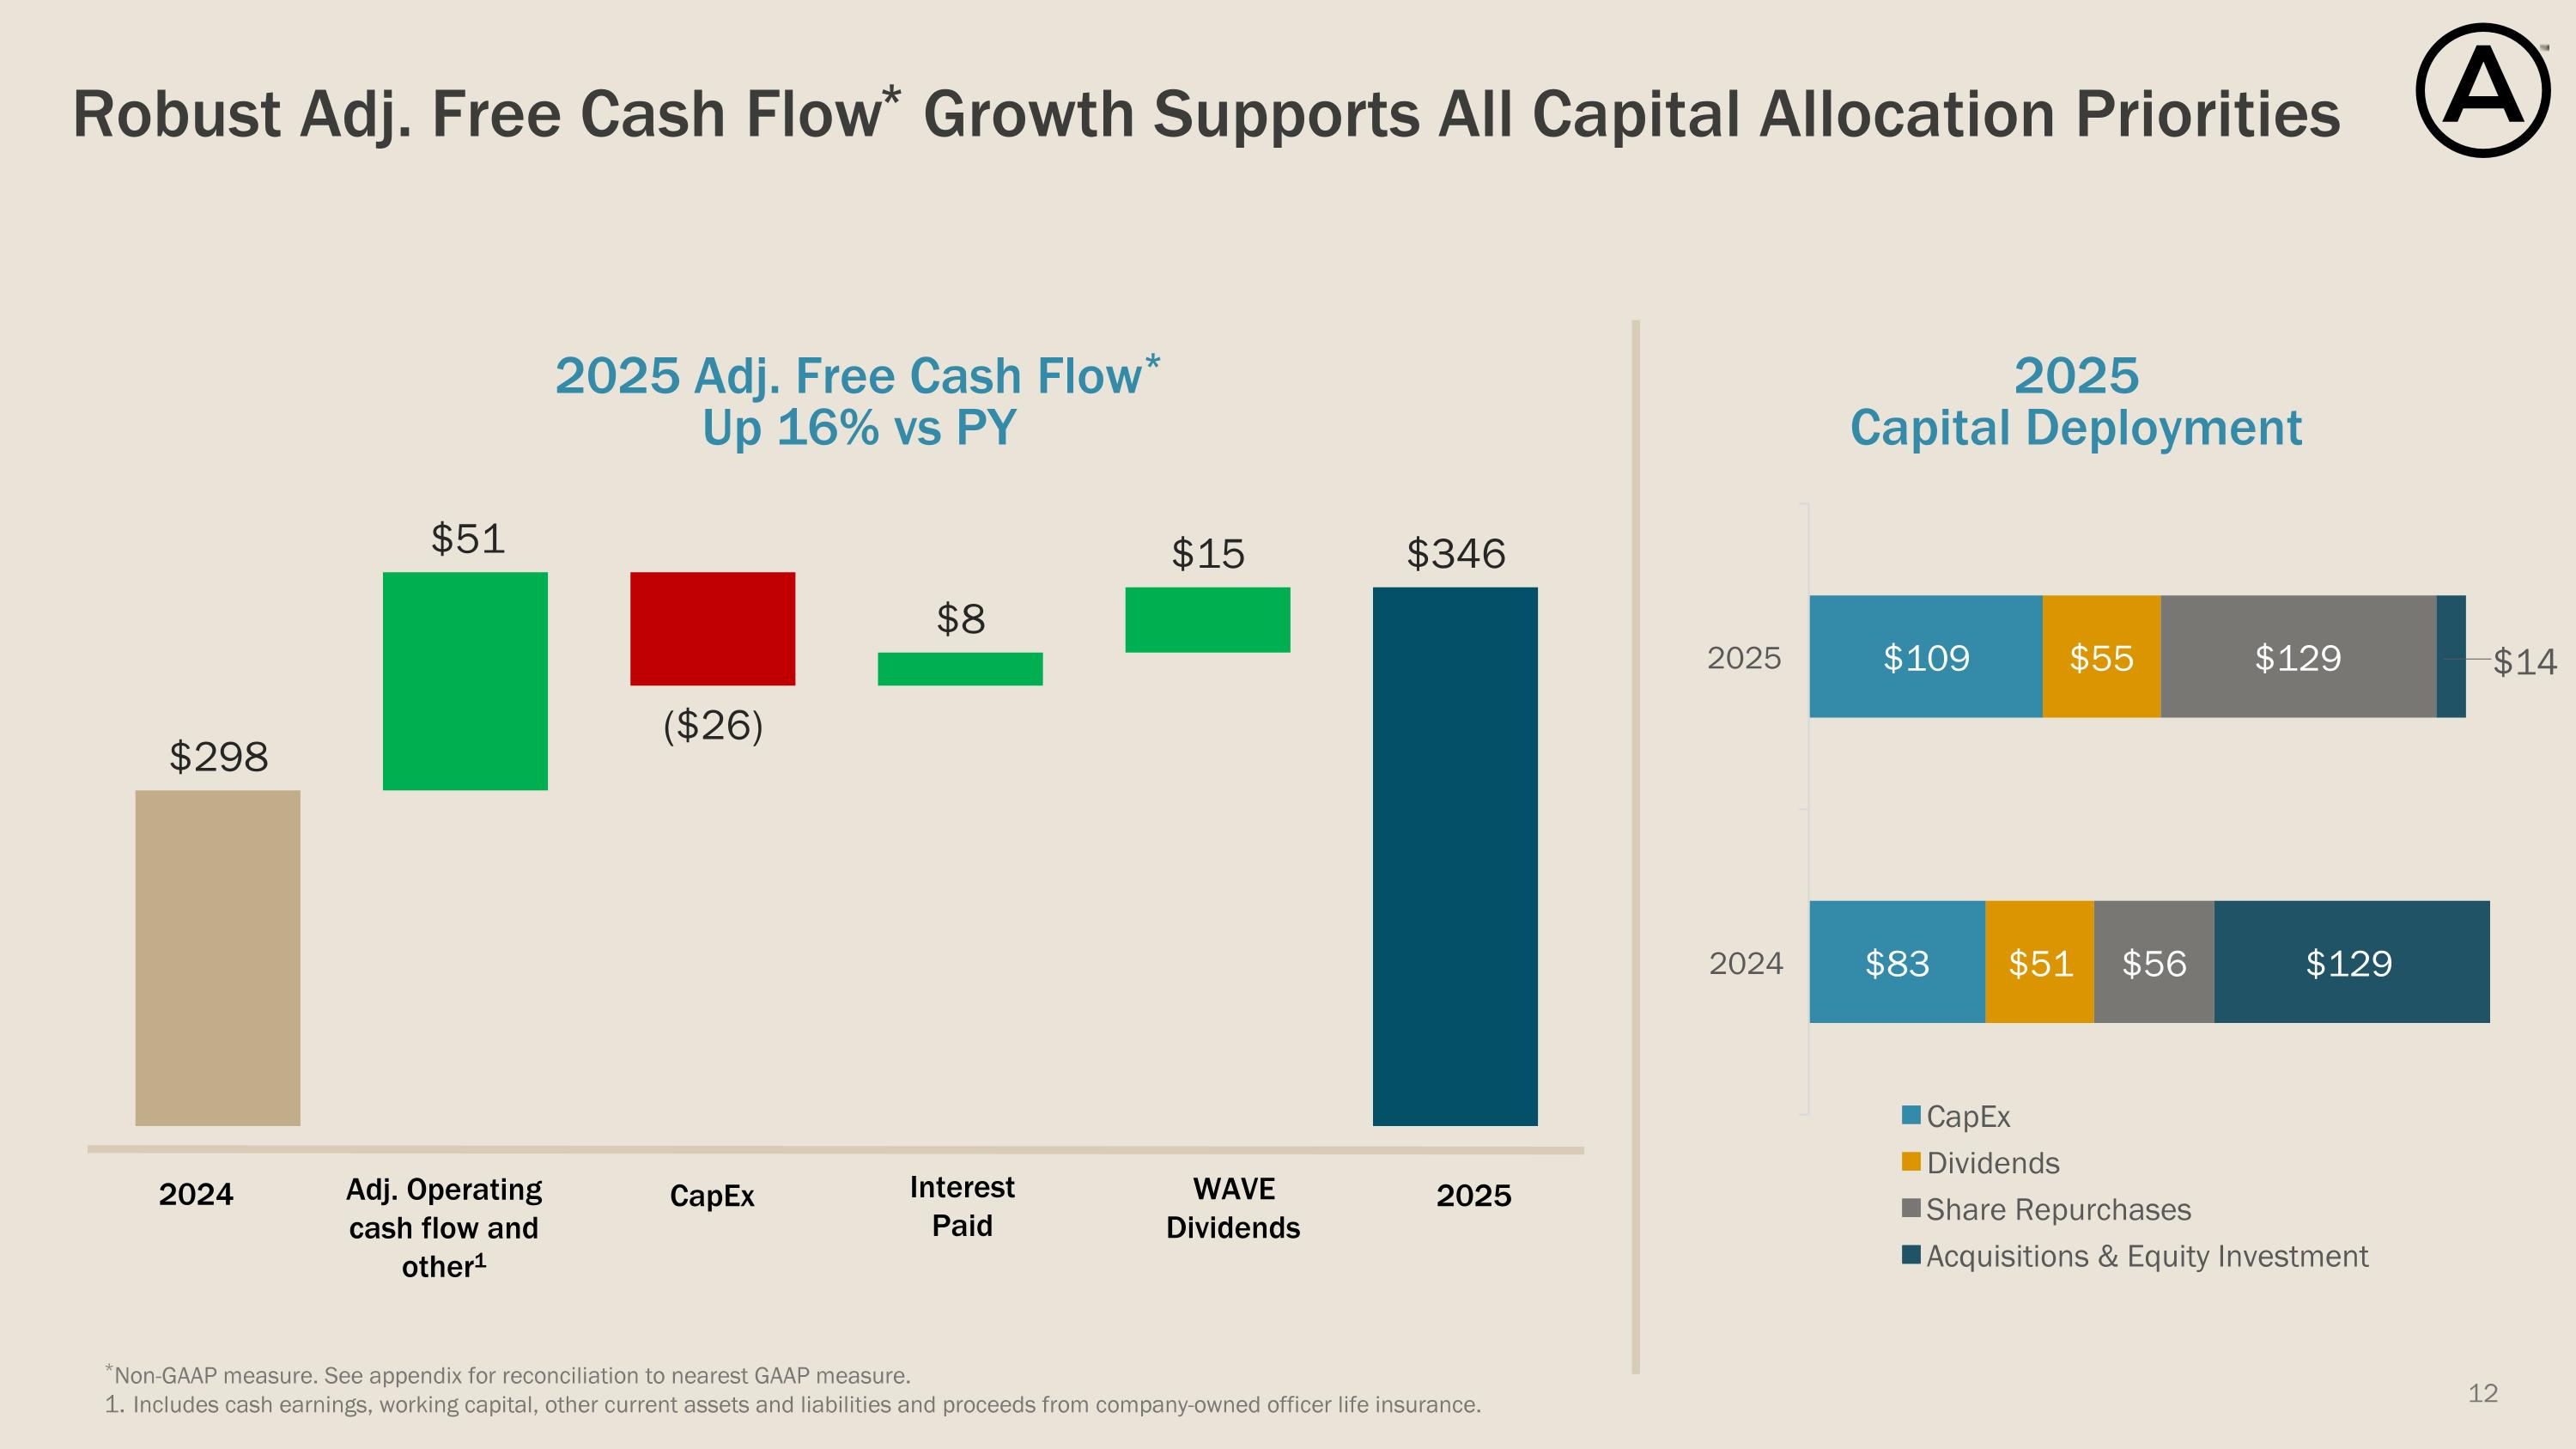
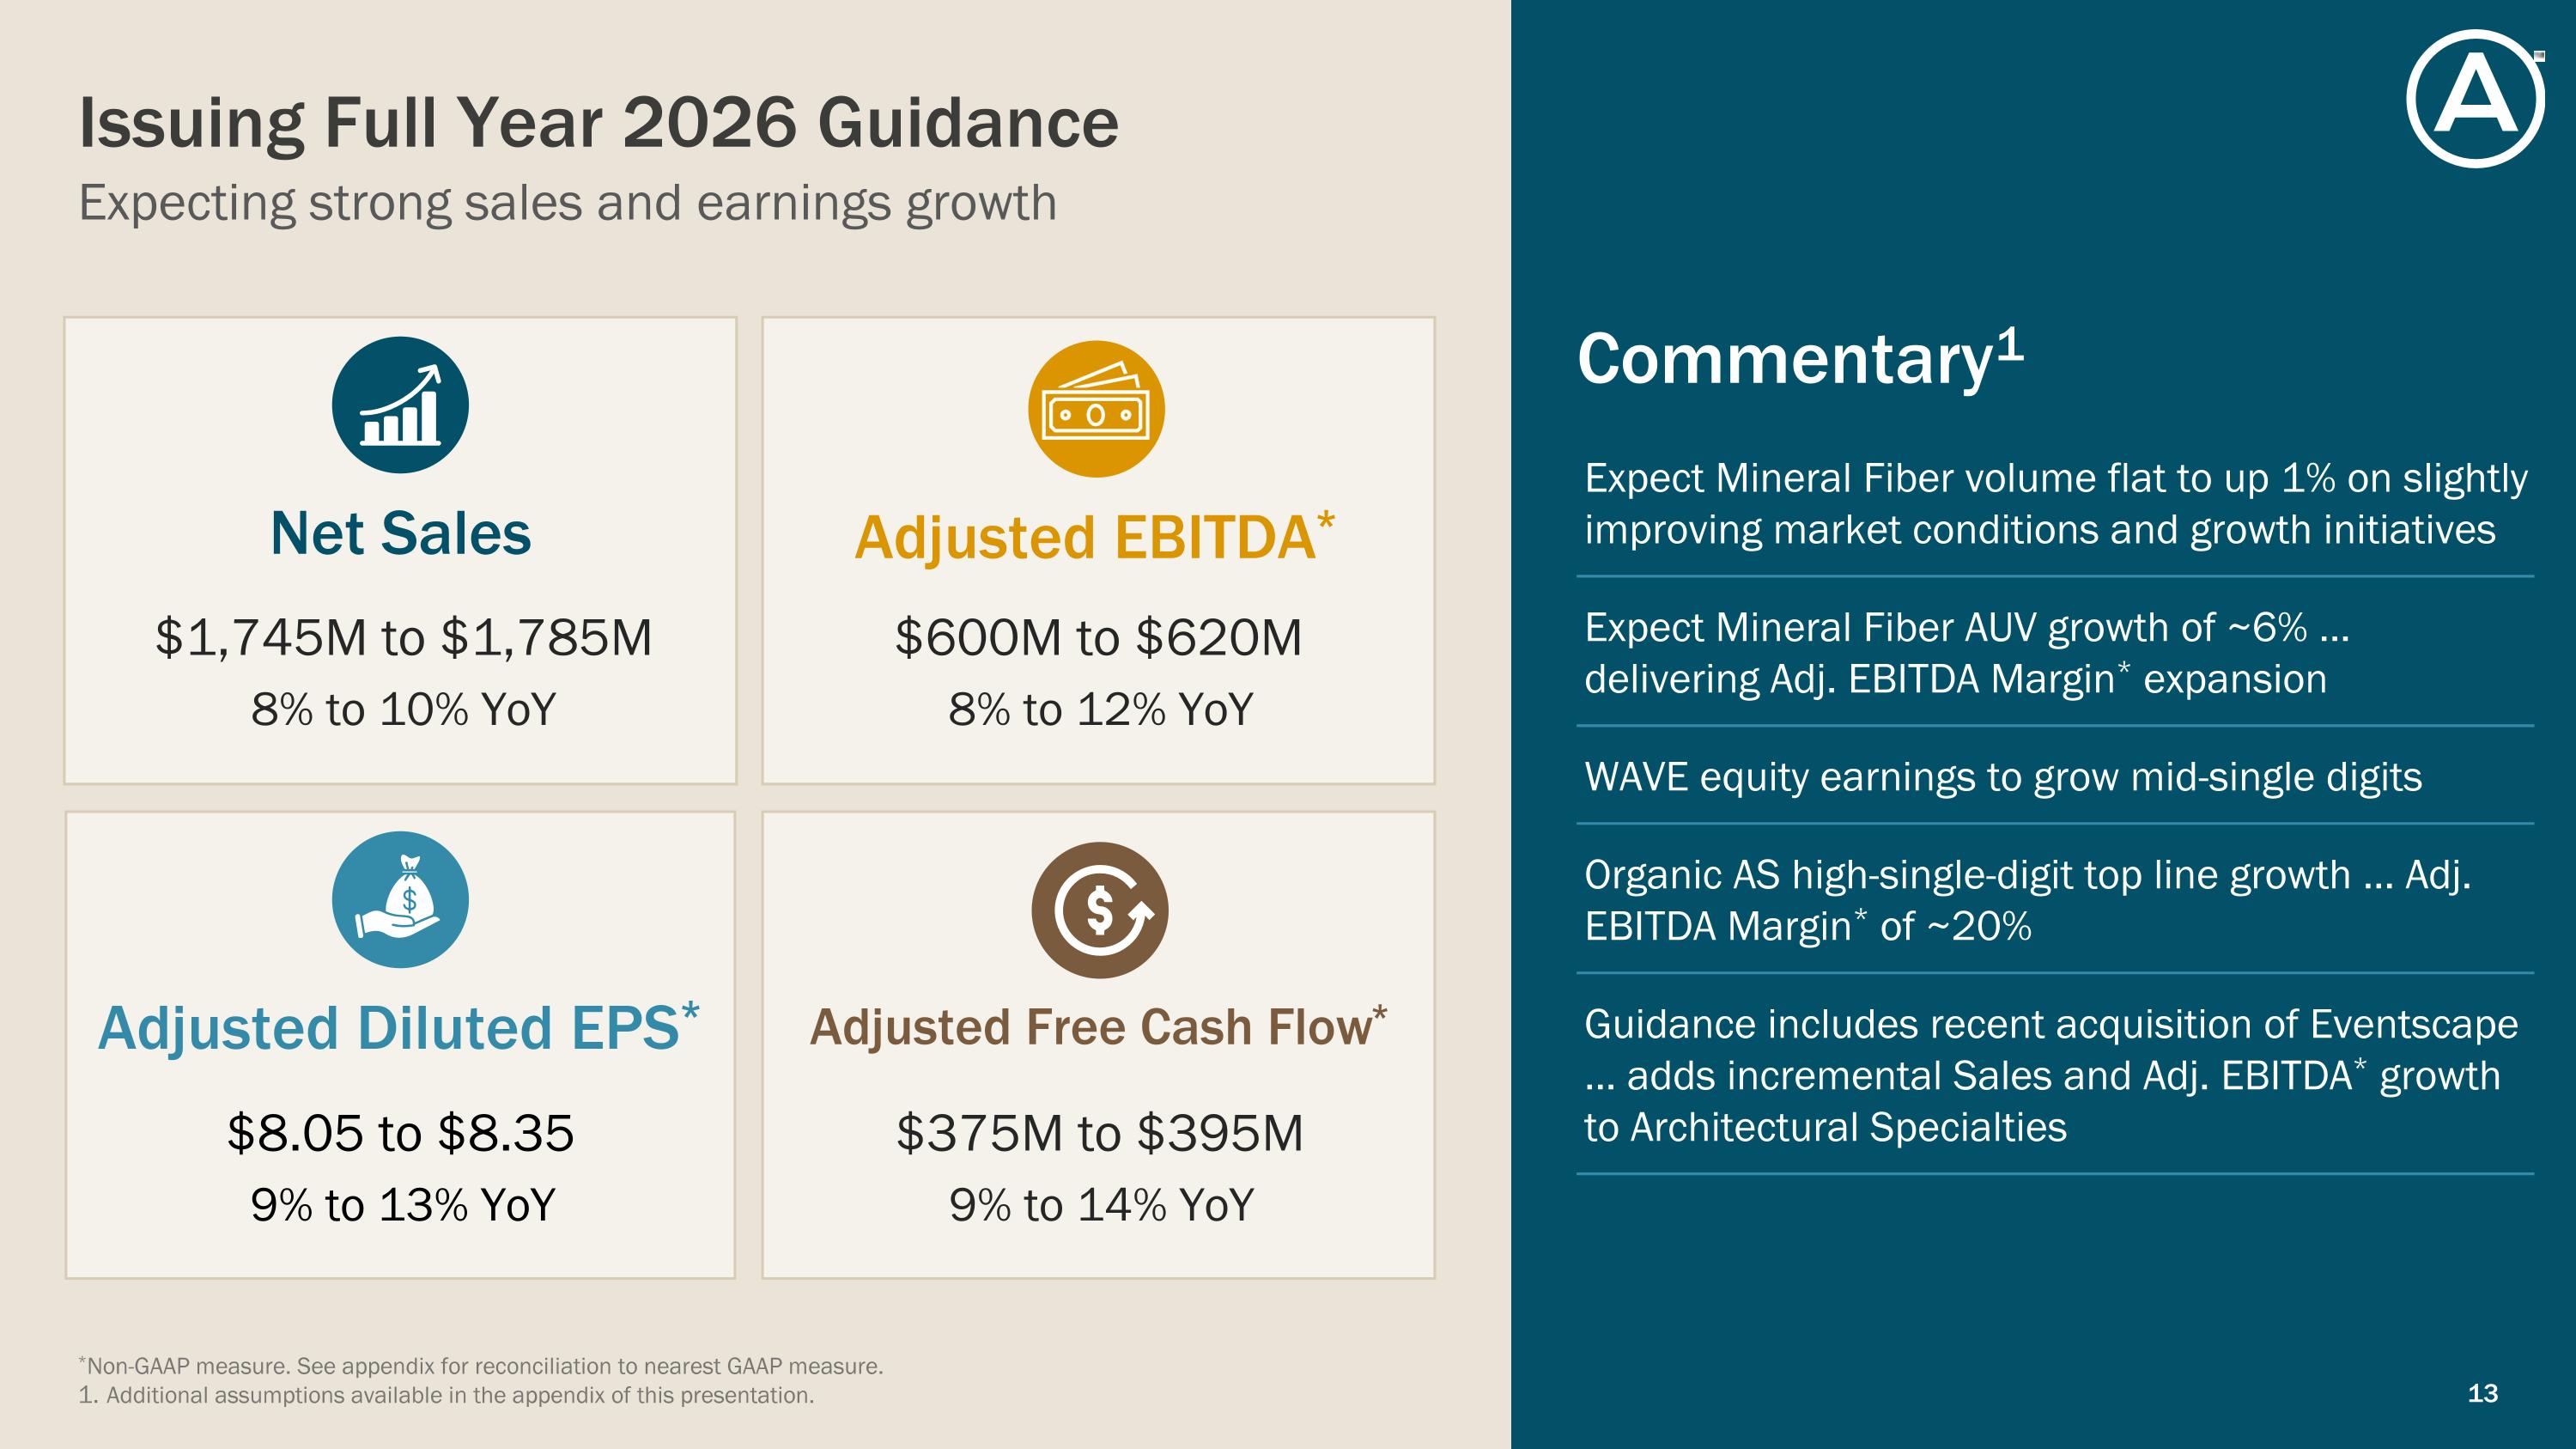
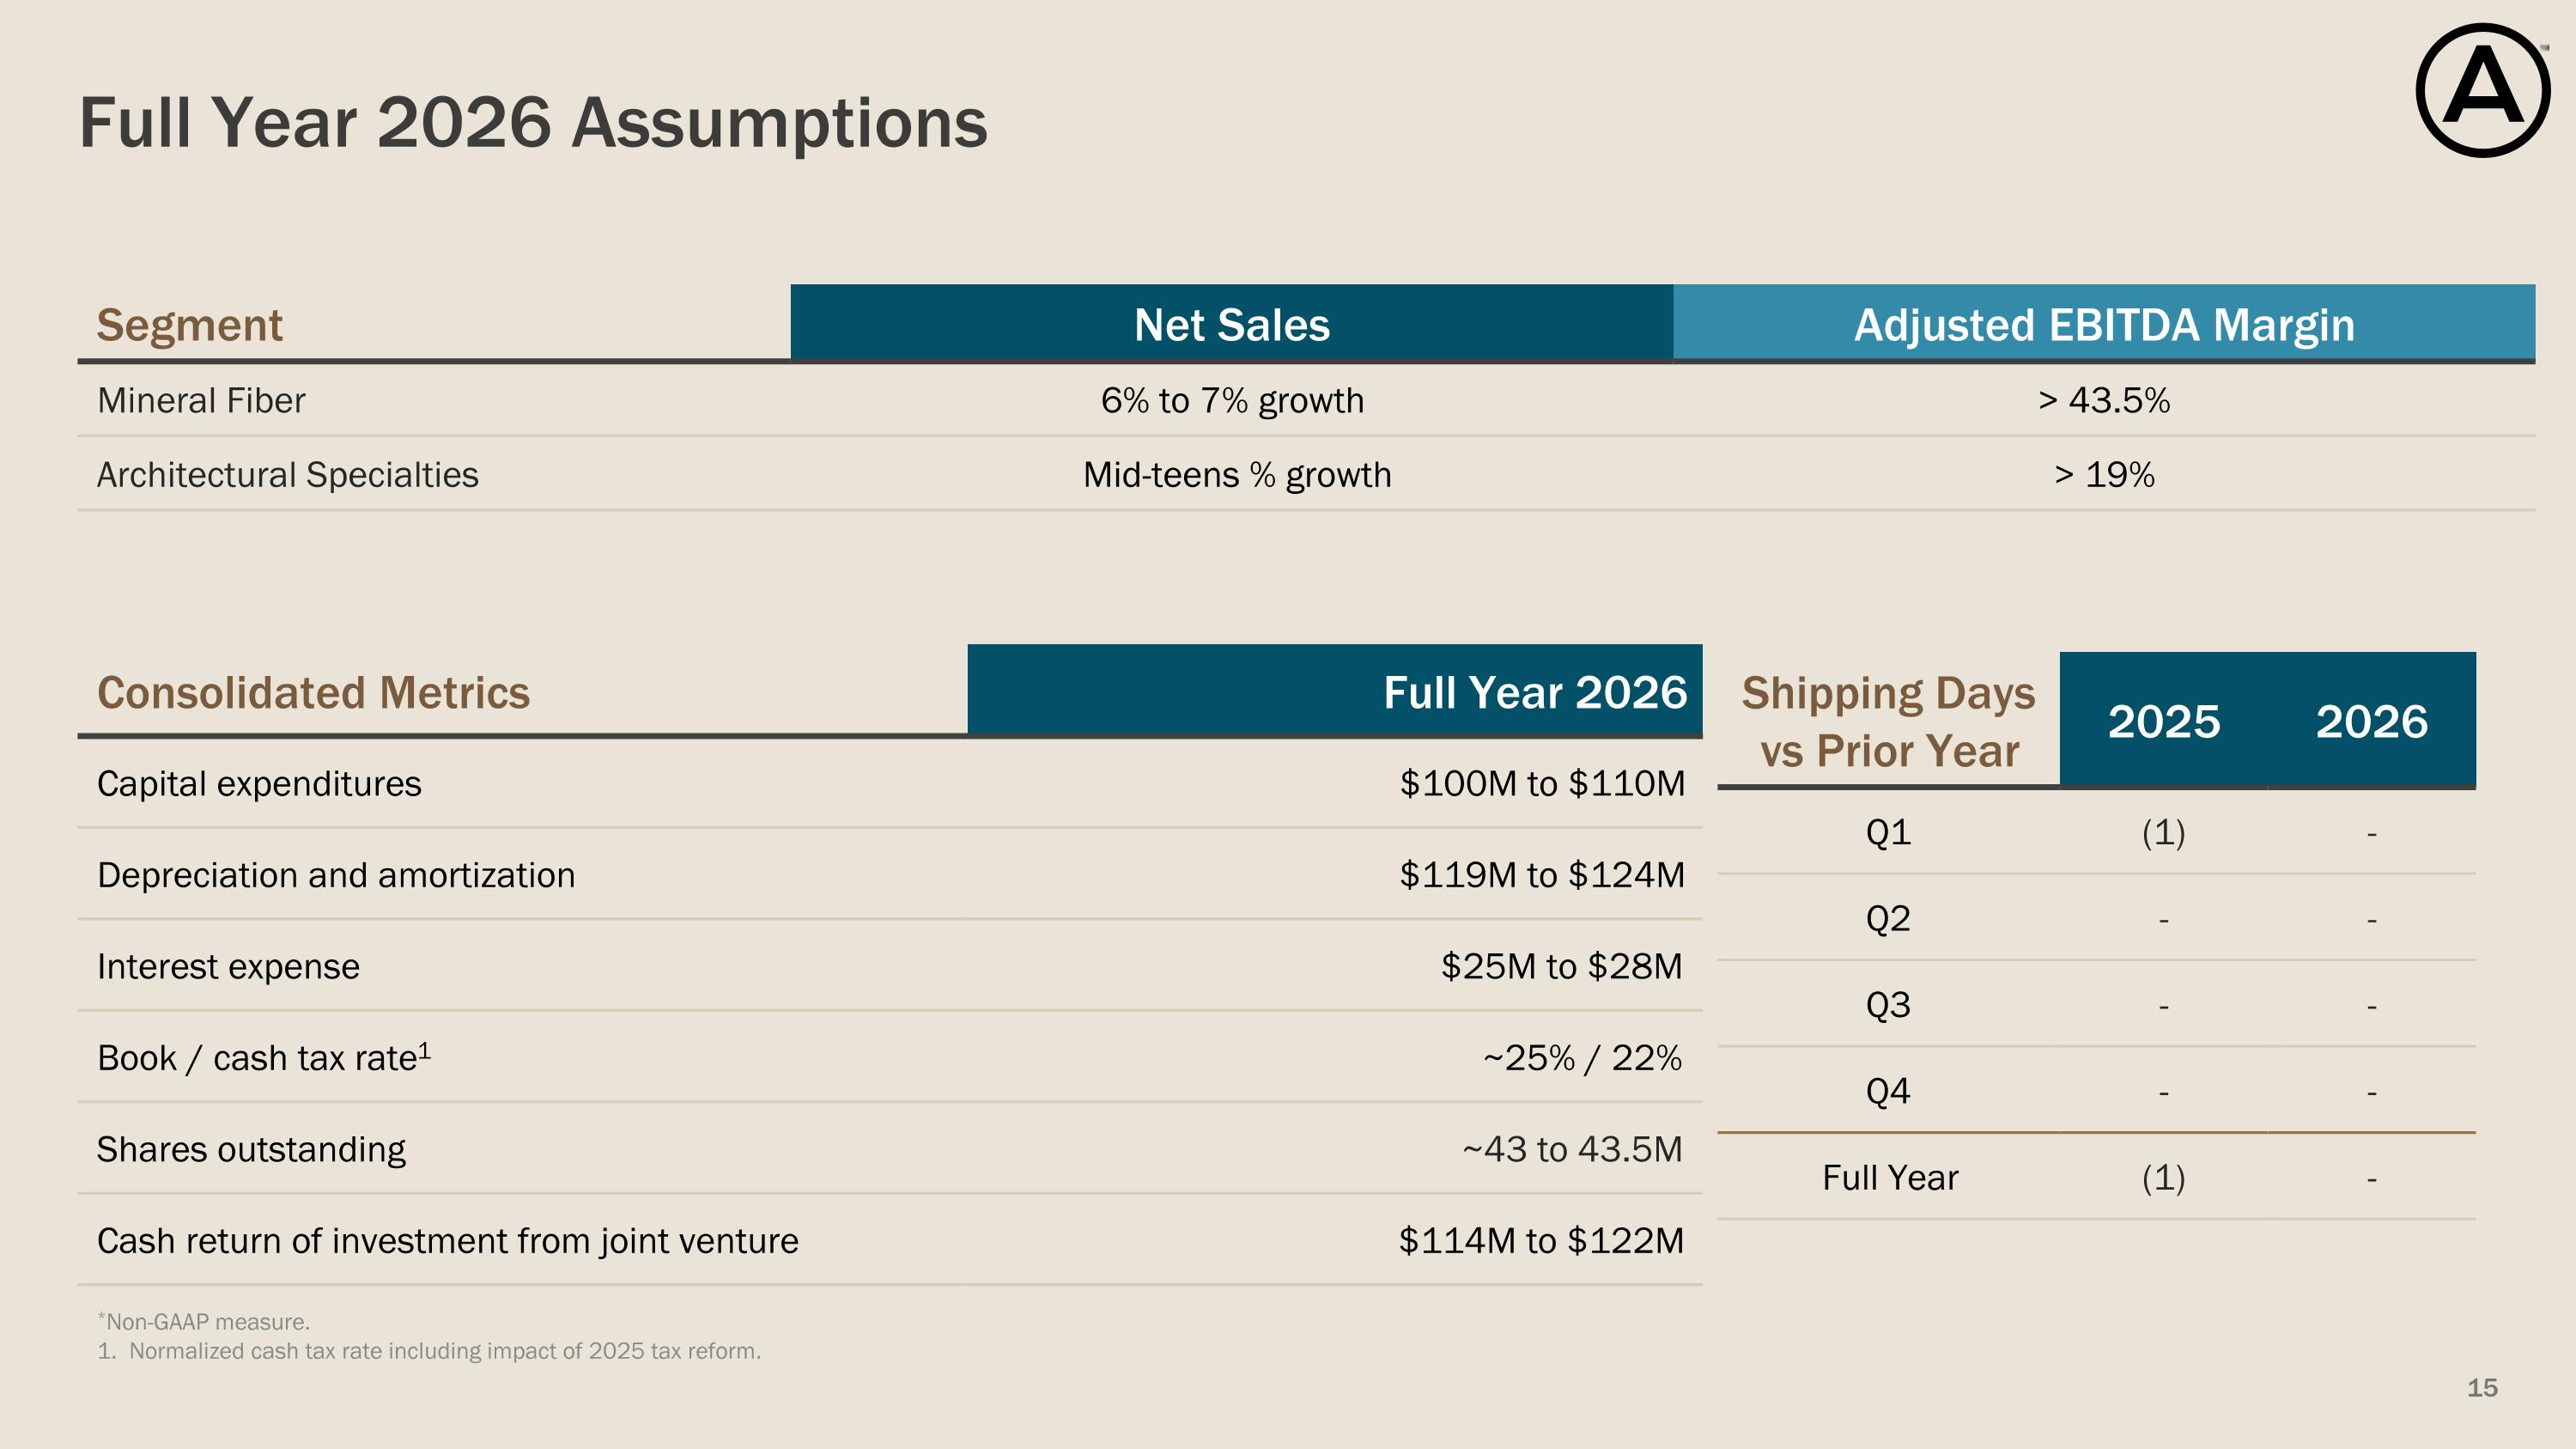
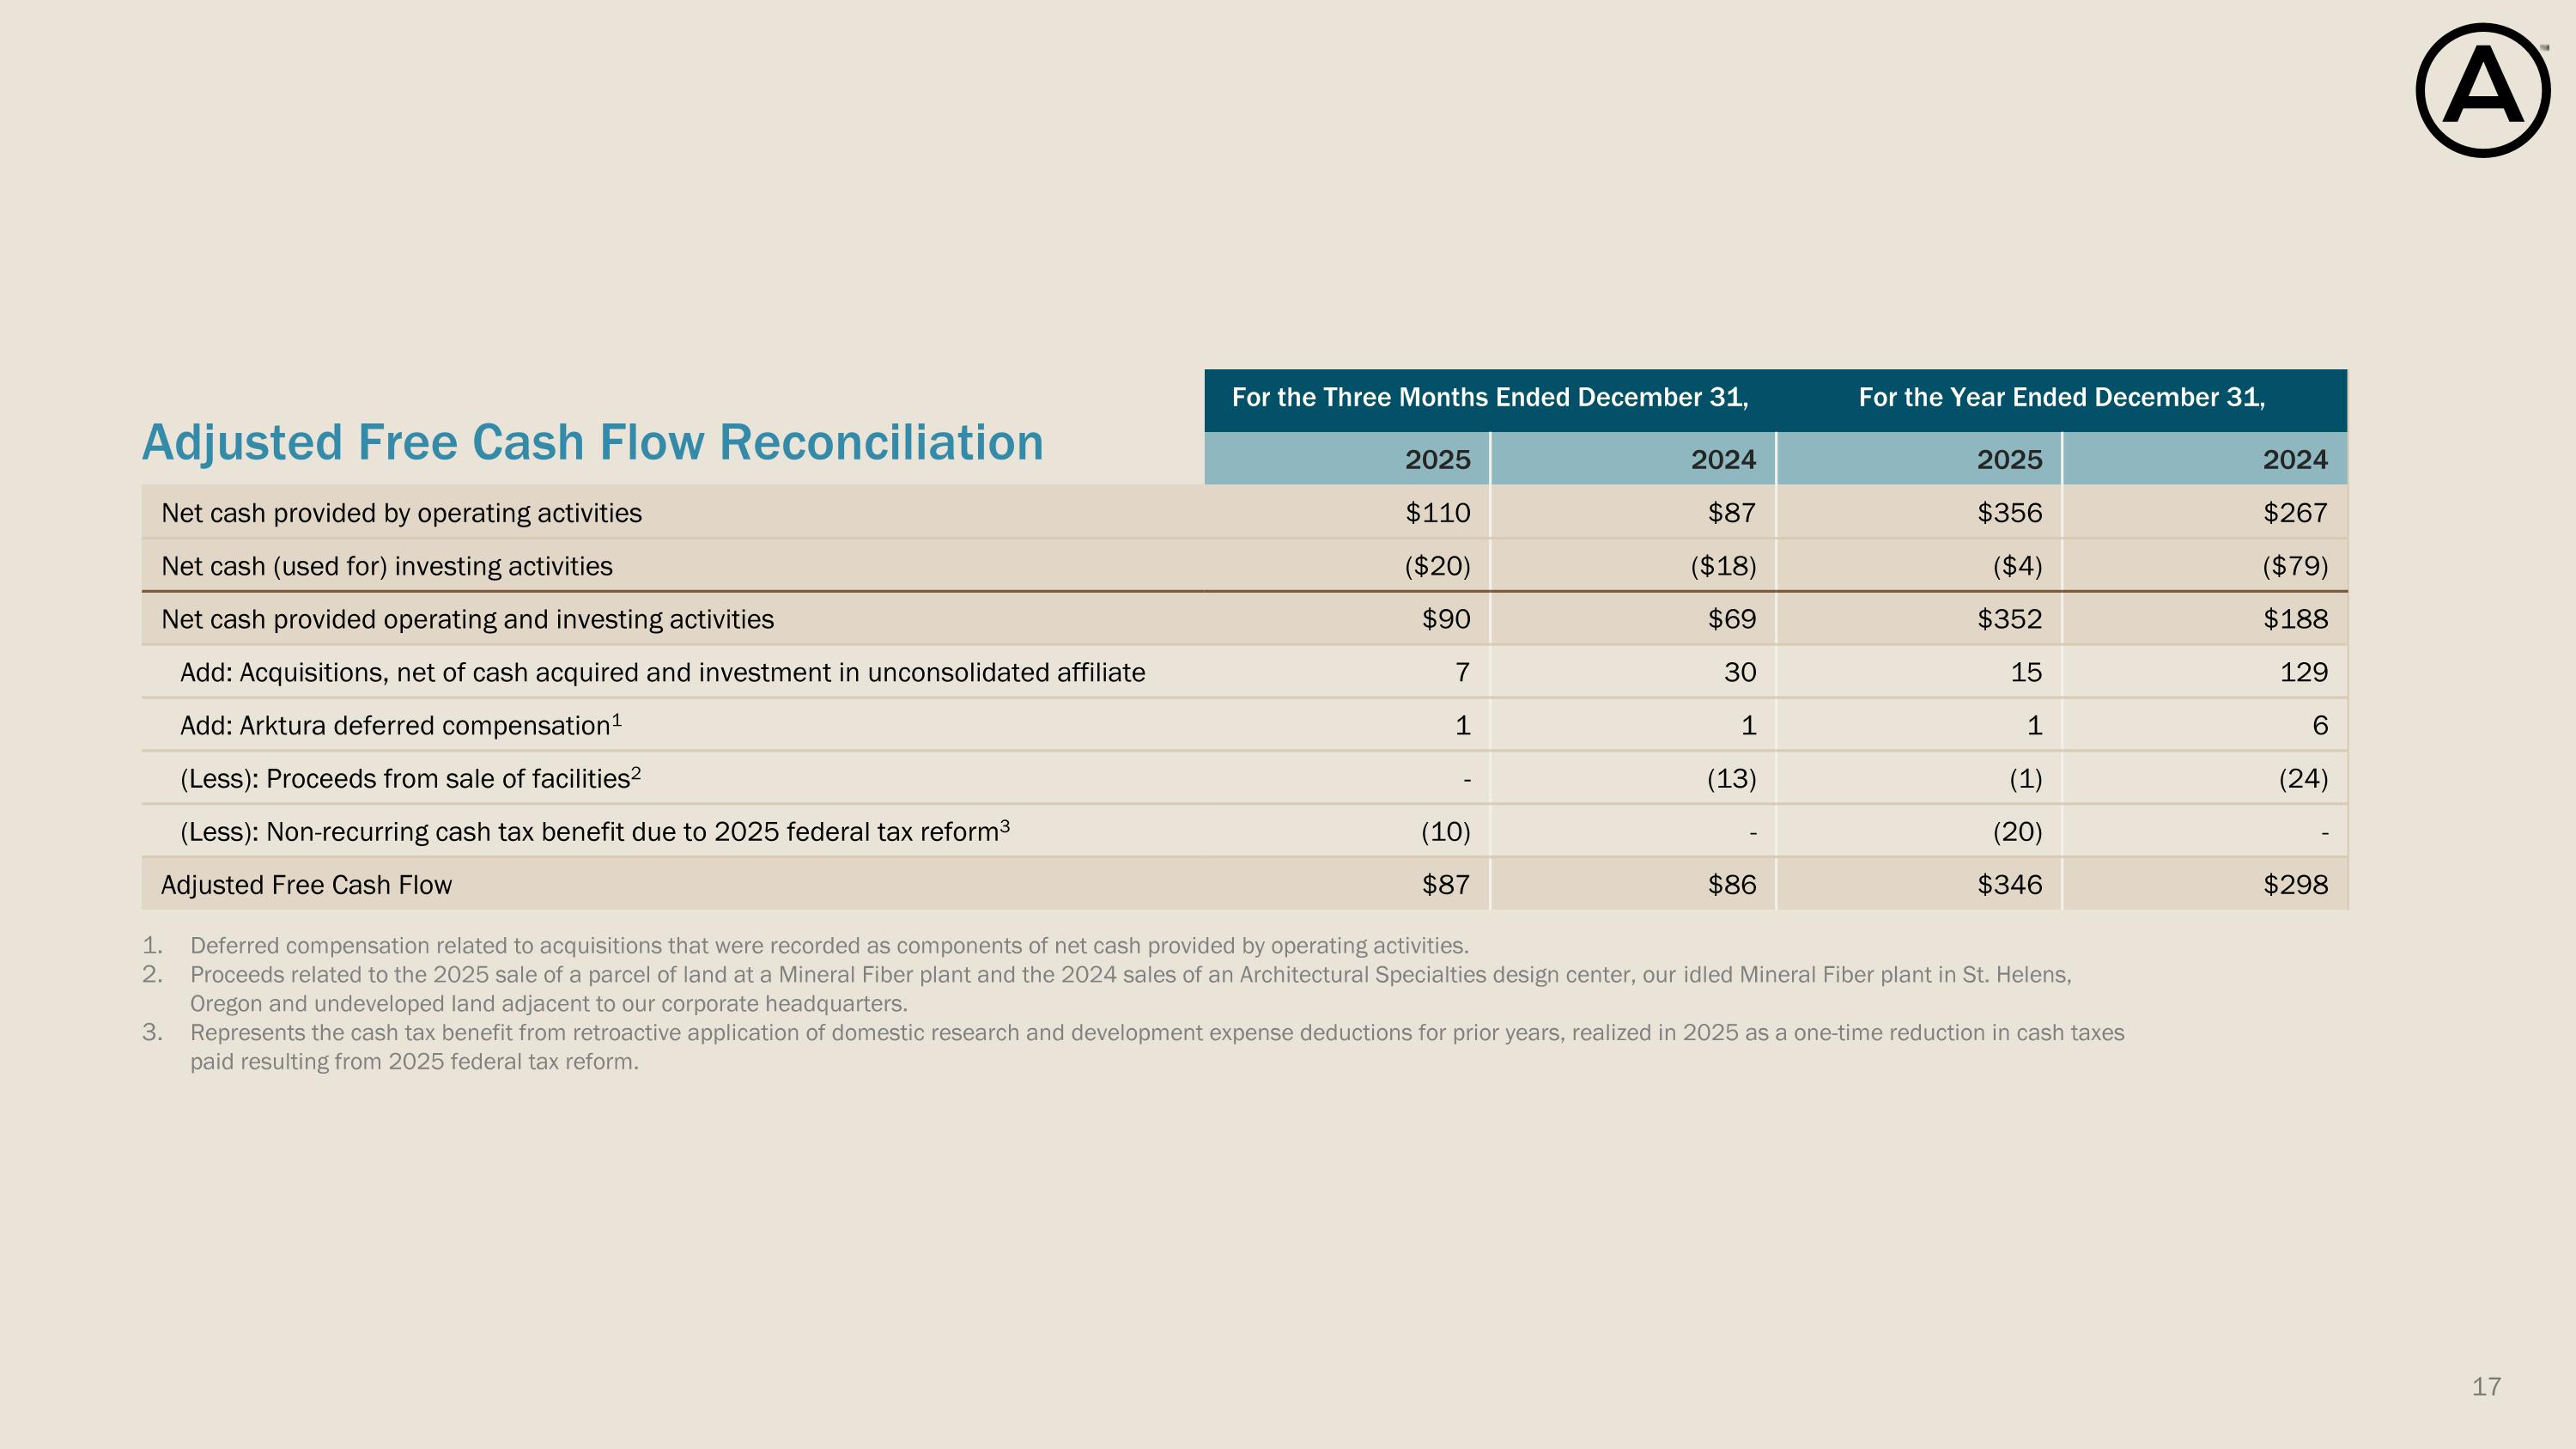
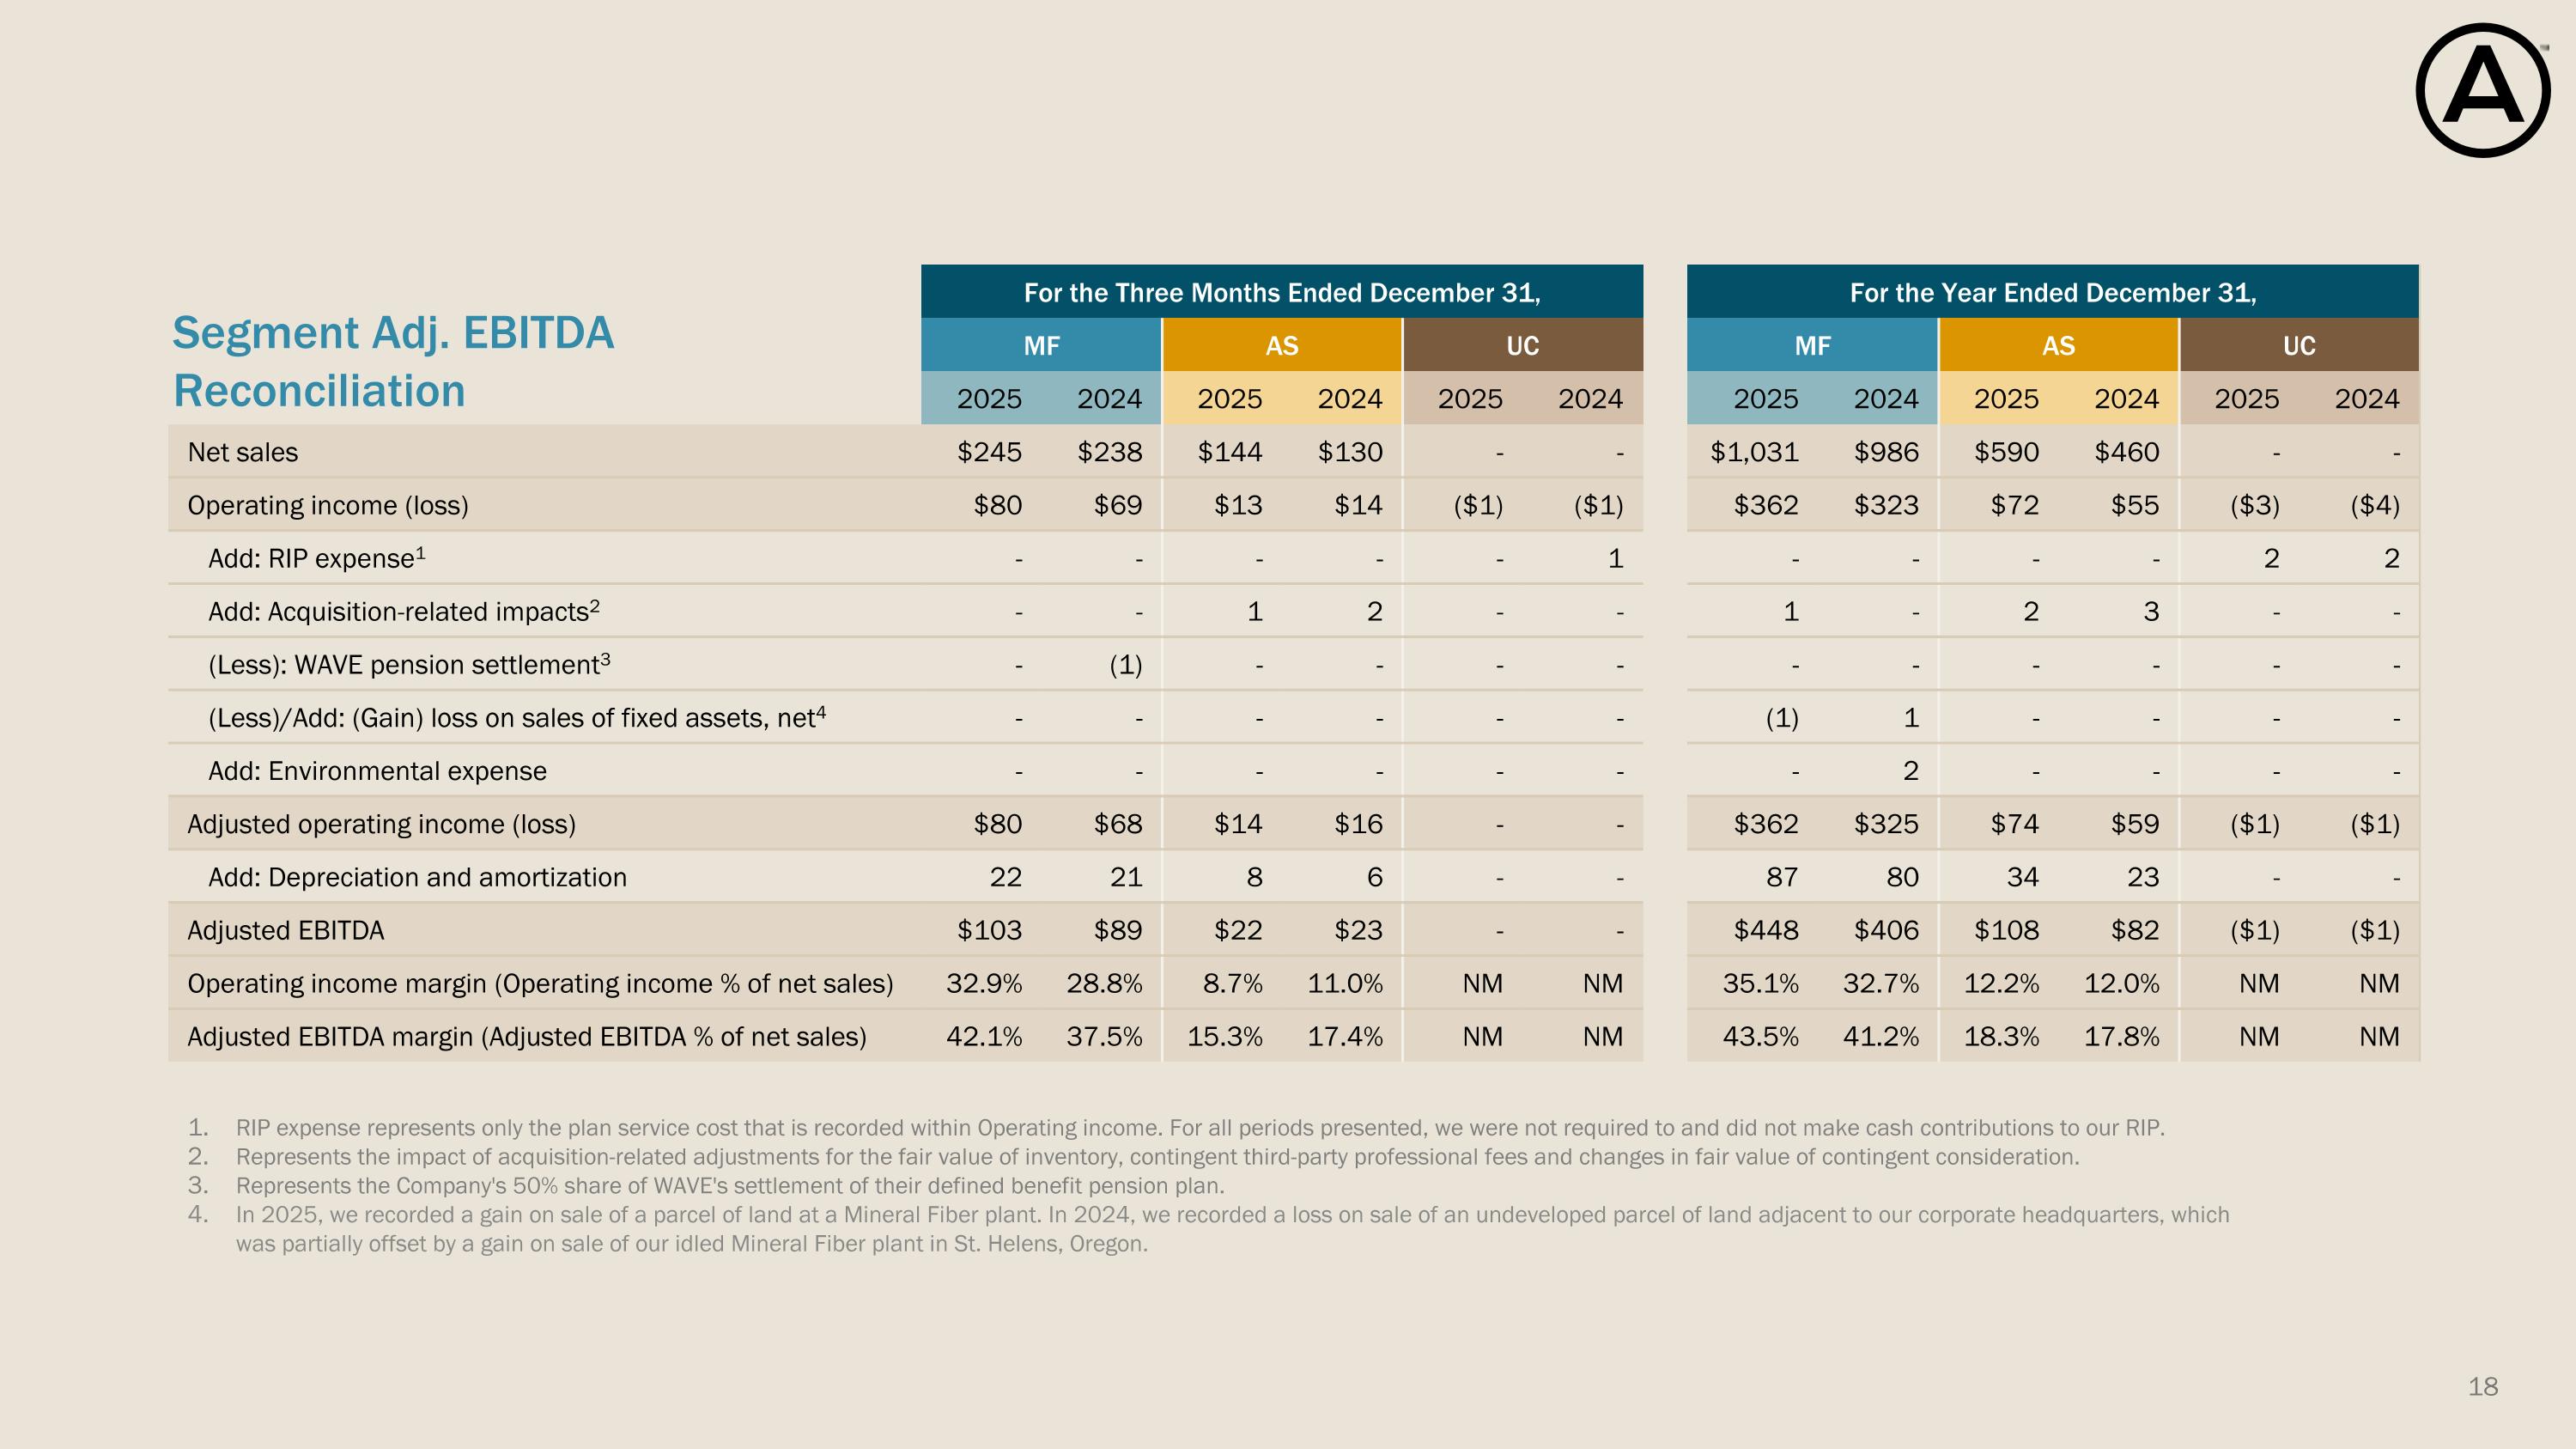
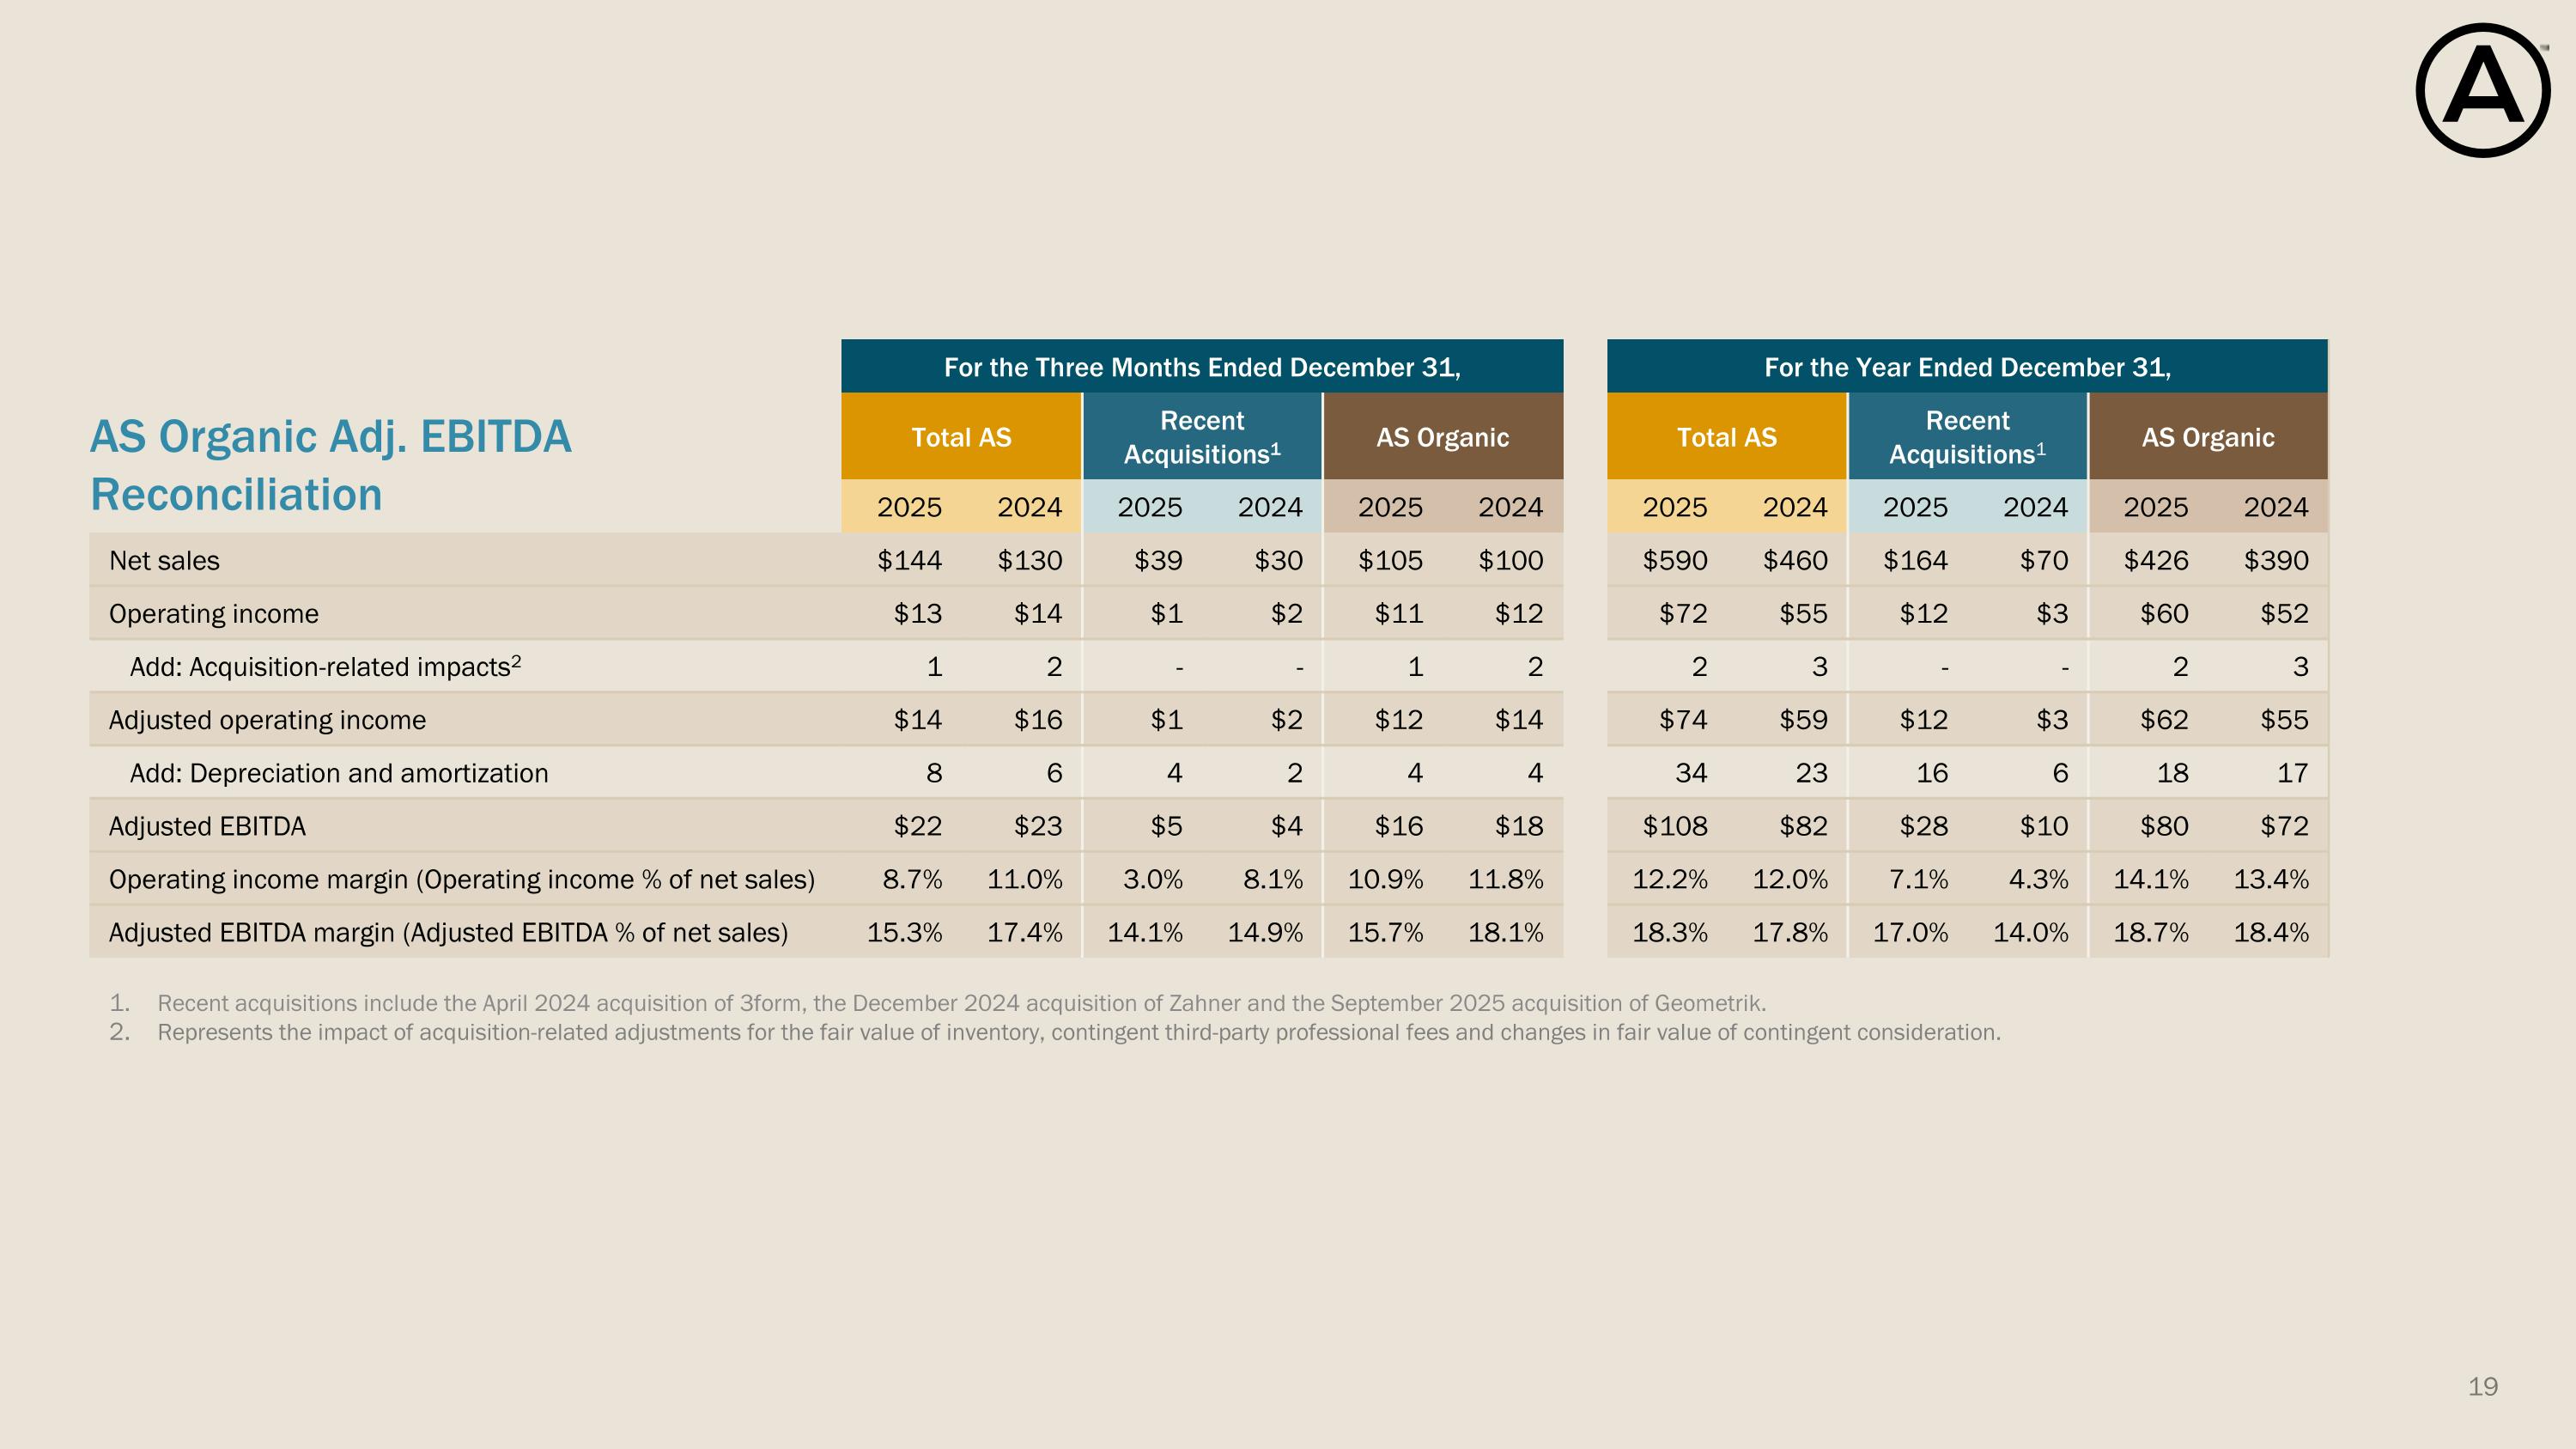
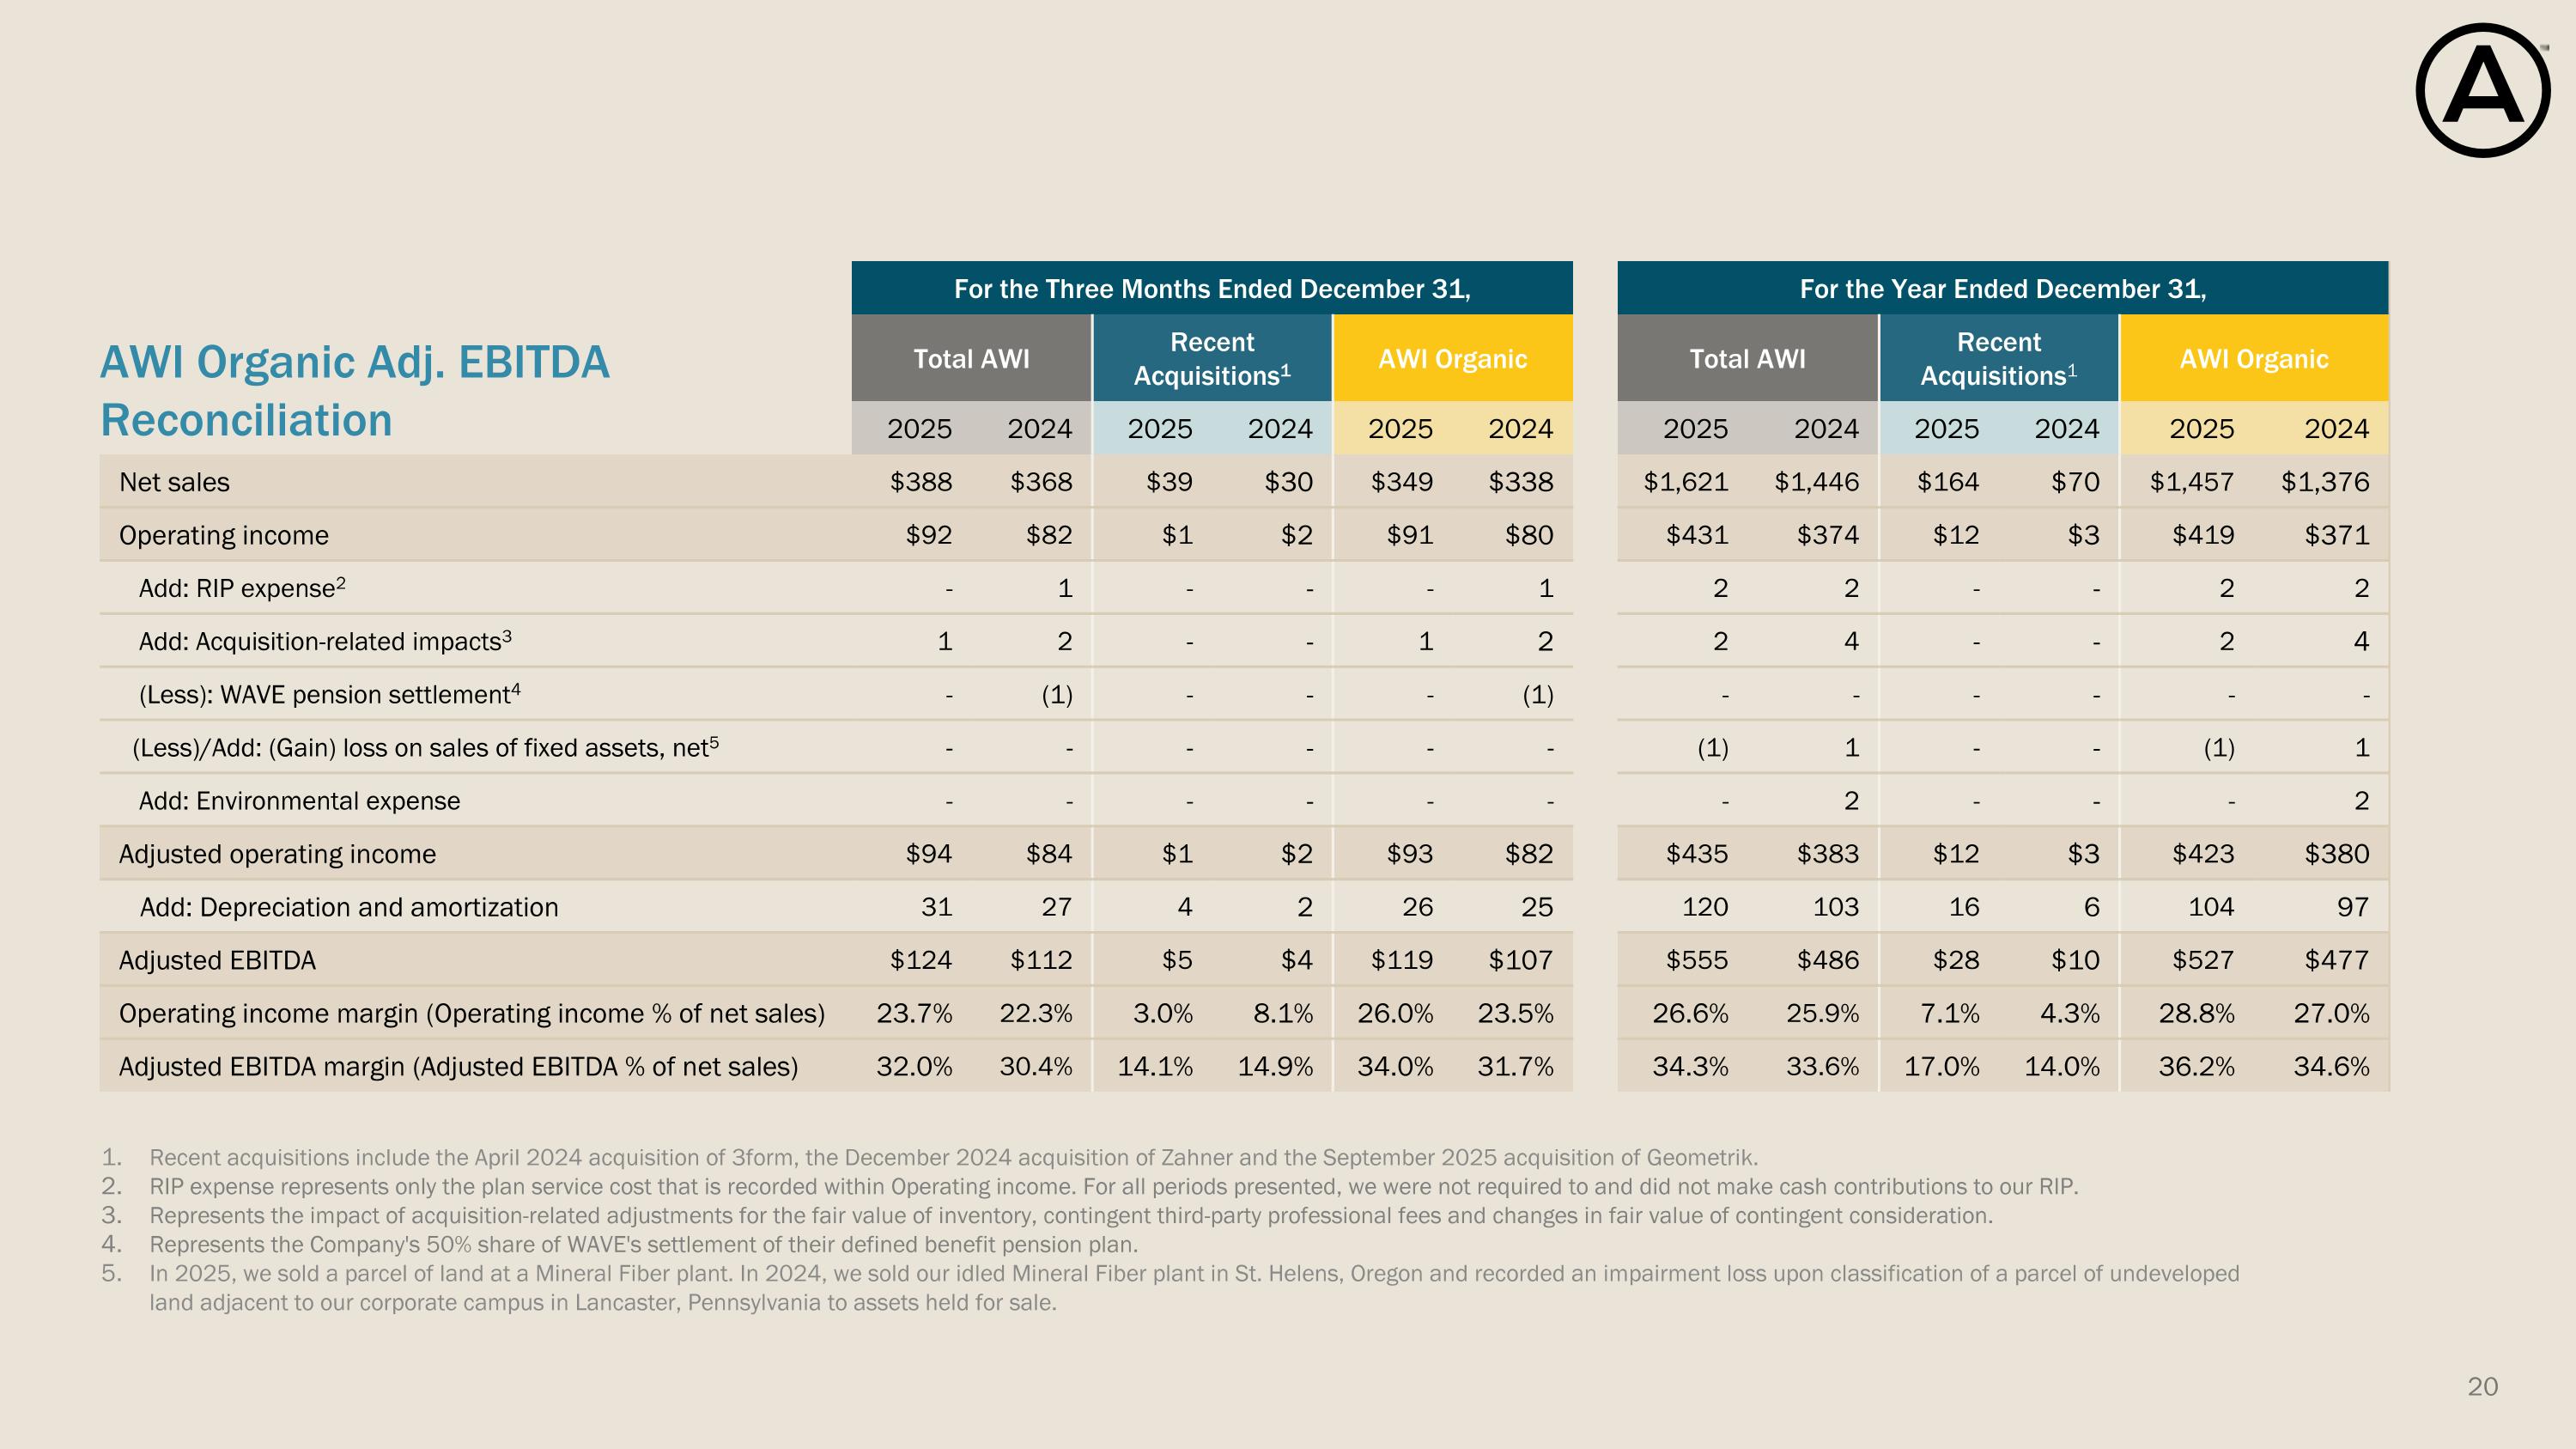
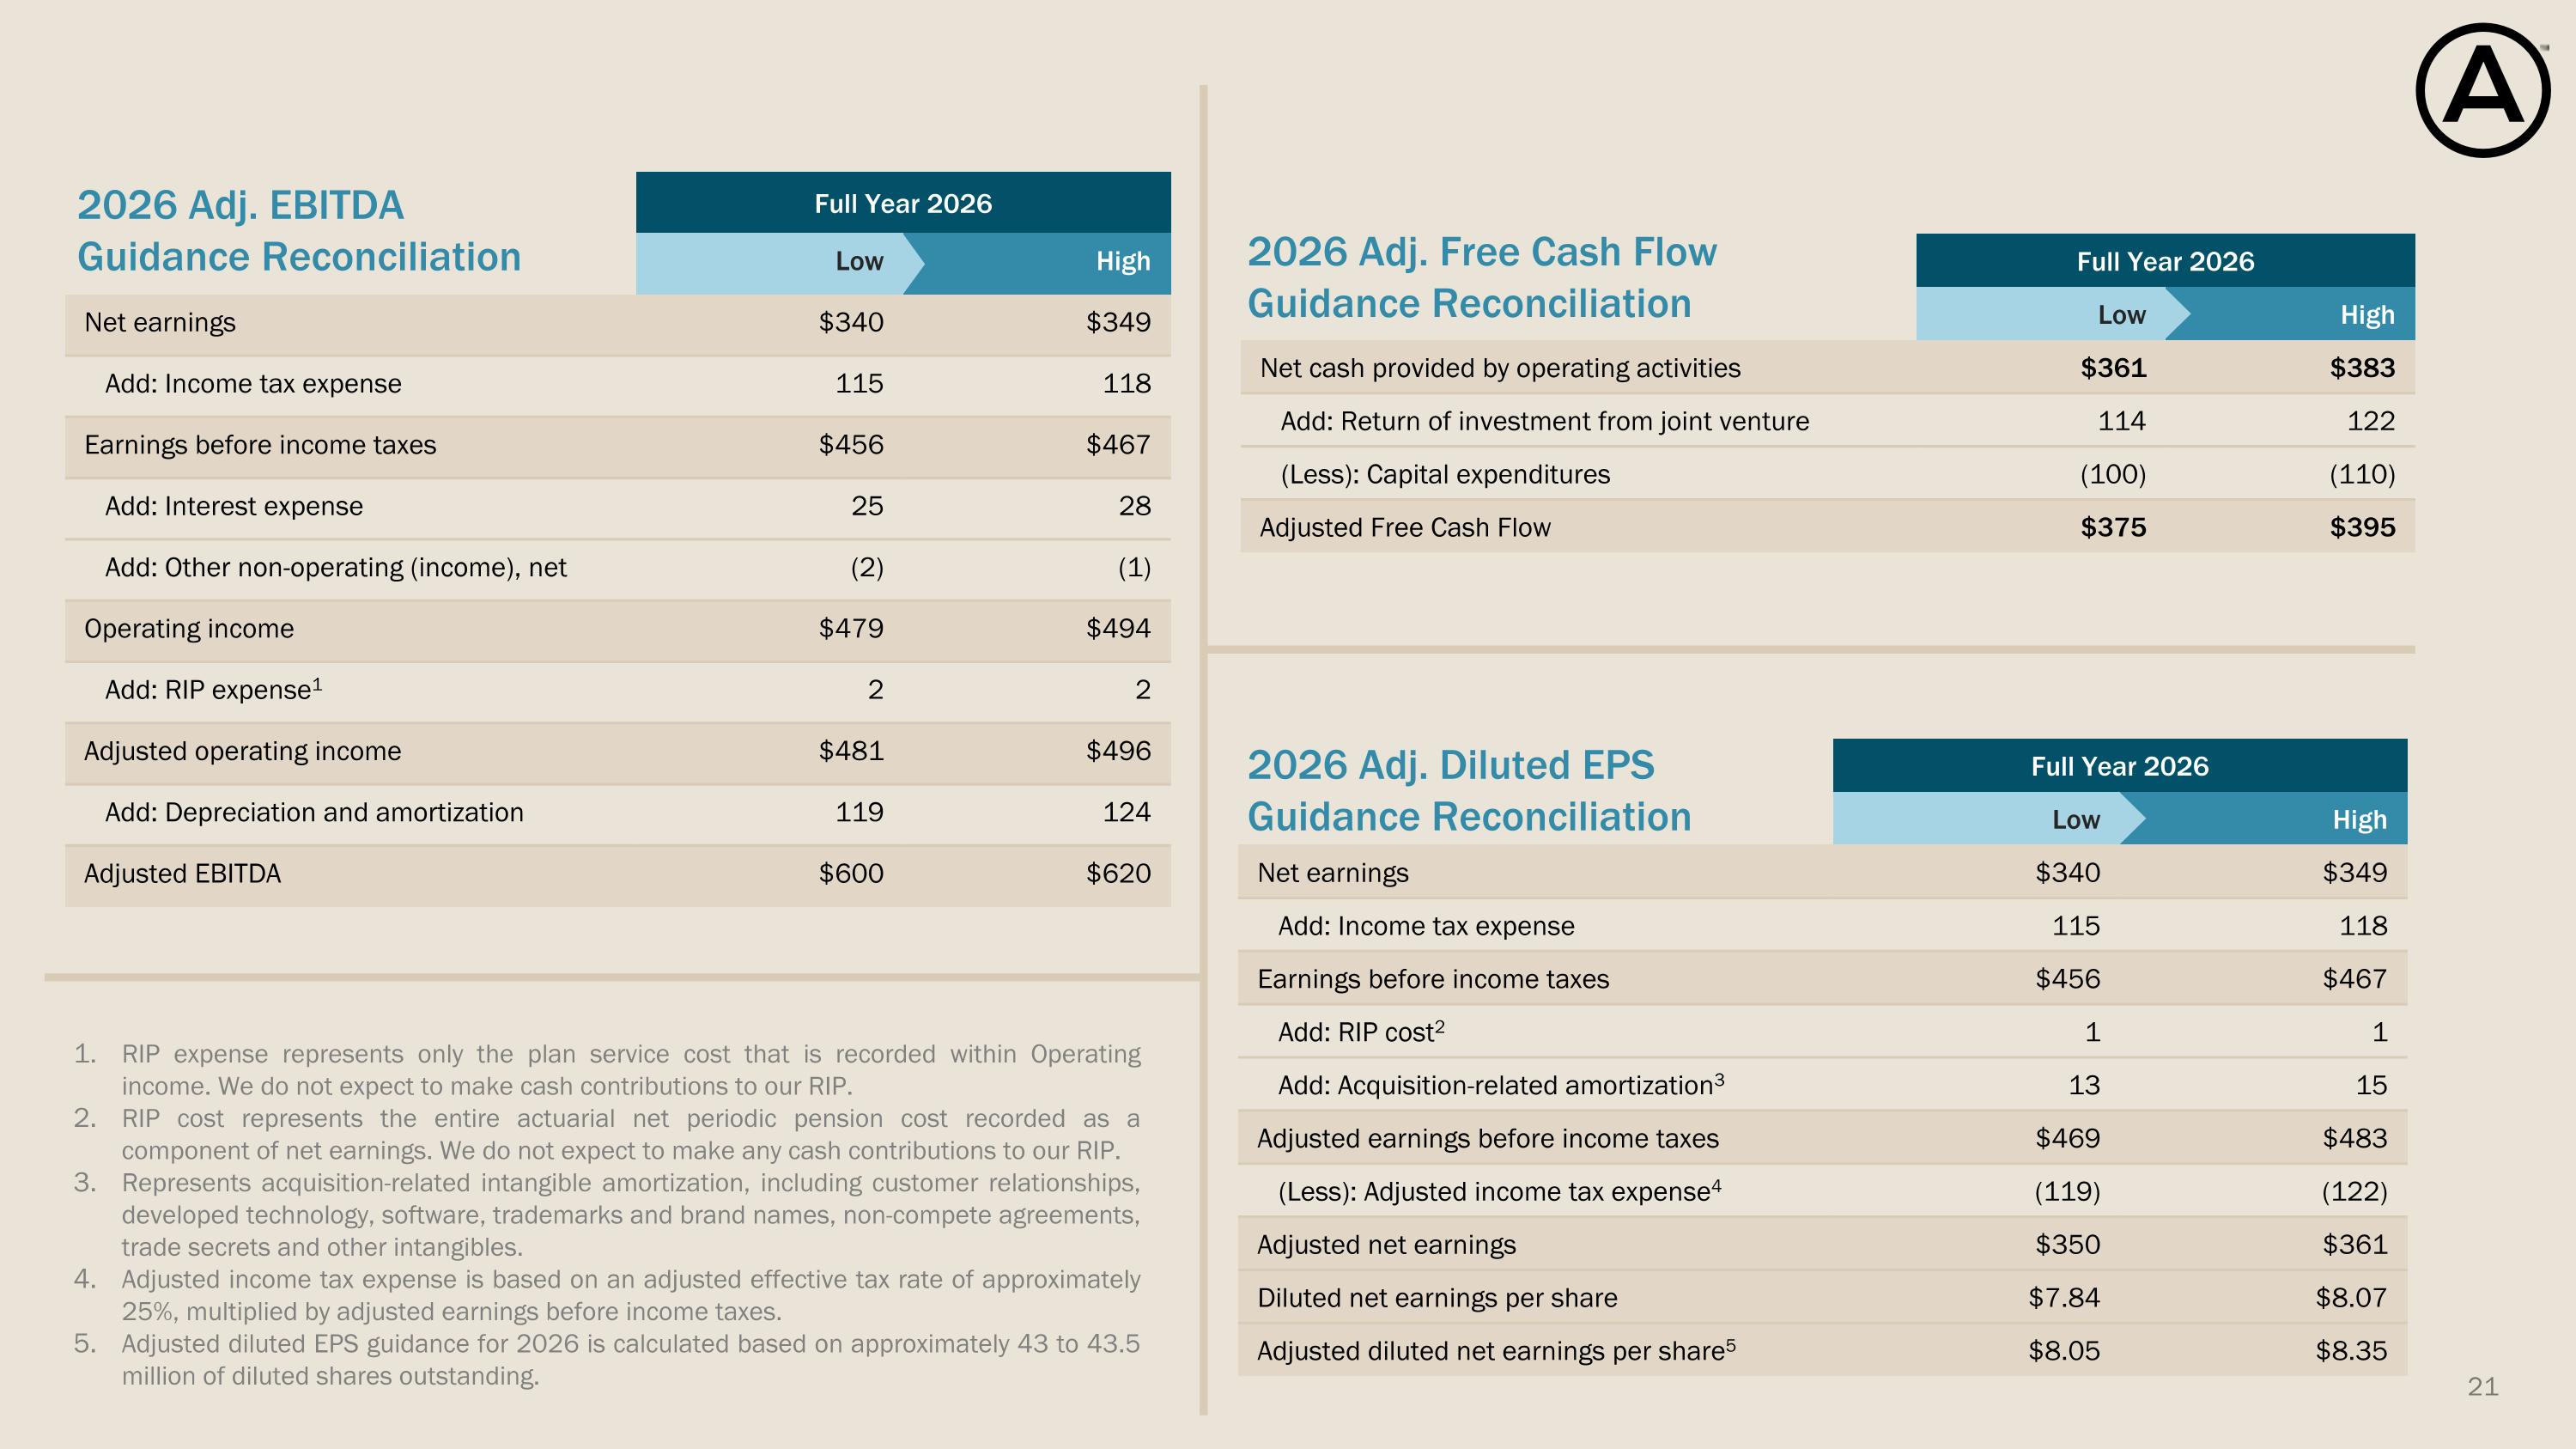
Thanks, Vic, and good morning to everyone on the call. As a reminder, throughout my remarks, I'll be referring to the slides available on our website. And please note that slide three details our basis of presentation. On slide eight, we begin with our mineral fiber segment results for the fourth quarter. Mineral fiber sales grew 3% in the quarter, driven by AUV growth of 6%, partially offset by lower sales volumes. The increase in AUV was primarily driven by favorable like-for-like pricing, along with a positive contribution from mix. Volumes in the quarter were softer than we expected, primarily due to short-term headwinds from the indirect impacts of the federal government shutdown, as well as softer home center demand. Mineral fiber segment adjusted EBITDA grew by 15% in the quarter, with adjusted EBITDA EBITDA margin expanding 460 basis points to 42.1% despite lower volumes. As Vic mentioned, Mineral Fiber's adjusted EBITDA margin of 42.1% in the quarter marked the best Q4 margin performance in the segment since 2016. Adjusted EBITDA margin expansion was primarily driven by the fall through of AUV, which benefited from strong like-for-like price benefit and a favorable claims adjustment in the quarter. higher equity earnings from our WAVE Joint Venture, favorable SG&A expenses, and lower input costs. From a full-year perspective, Mineral Fiber adjusted EBITDA margin finished at a record-setting 43.5%, surpassing the high watermark of 2019. This level of financial performance underscores our Mineral Fiber value creation drivers, including consistent AUV growth, annual productivity gains, and positive contributions from our WAVE Joint Venture, along with our disciplined focus on cost control on slide nine we discuss our architectural specialties or as segment results double digit sales growth of 11 percent in the quarter was driven primarily by contributions from 2024 acquisitions of three form and zaner as well as organic growth as a reminder the fourth quarter compares to a very strong prior year period that delivered 15% sales growth, largely driven by several large transportation projects in the fourth quarter of 2024. Importantly, full-year organic AS sales grew 9%, which was consistent with our expectations of high single-digit growth. AS segment adjusted EBITDA decreased 3% in the quarter, with adjusted EBITDA margin negatively impacted by softer, organic top-line performance, resulting in less favorable operating leverage due to the timing of custom projects. Higher manufacturing costs were driven primarily by the recent acquisitions and our organic business, which increased in part due to capacity investments in support of future growth, while higher SG&A expenses were primarily due to recent acquisitions. Partially offsetting these increases in costs was a benefit from higher sales volumes. For the full year 2025, adjusted EBITDA margin for the AS segment was approximately 18 percent, representing 50 basis points of margin expansion, but below our 19 percent margin guidance due to fourth quarter headwinds from project timing. Overall, we are pleased that on an organic basis, AS adjusted EBITDA margin was approximately 19% and that in 2025 we delivered two quarters of AS organic adjusted EBITDA margin of 20% or greater. This performance demonstrates that the underlying AS business fundamentals are strong and that we have the right building blocks in place to deliver at or above our 20% target level as project timing normalizes. We expect continued progress and profitability and margin improvement as we integrate our recent acquisitions, drive operational efficiencies, and scale these businesses on the Armstrong platform. And we remain committed to delivering our targeted 20% adjusted EBITDA margin for the AF segment. On slide 10, we highlight our fourth quarter consolidated company metrics. We delivered solid sales growth with double-digit adjusted EBITDA growth, and total company adjusted EBITDA margin expanded 160 basis points. Excluding recent acquisitions, total company adjusted EBITDA margin expanded 230 basis points. Adjusted EBITDA growth in the quarter was primarily driven by the fall-through impact of strong AUV, positive wave equity earnings, lower input costs, and benefits from manufacturing productivity. These impacts were partially offset by increased manufacturing costs within the AF segment. Turning to page 11, full-year sales increased 12% and full-year adjusted EBITDA increased 14%, resulting in 70 basis points of margin expansion. We also saw double-digit growth in adjusted diluted net earnings per share up 17% and adjusted free cash flow up 16%. These robust results reflect the power of our financial performance drivers, incremental growth from AS acquisitions, market penetration in the AS segment and the benefits from our growth initiatives, consistent, strong AUV performance, manufacturing productivity gains across our plant network, and healthy wave equity earnings. These benefits more than offset increases in SG&A and manufacturing costs driven by our recent acquisitions, as well as a modest increase in manufacturing costs in our organic AS business. Slide 12 shows our full year adjusted free cash flow performance versus the prior year. The 16% increase was primarily driven by higher cash earnings and an increase in dividends from our Wave Joint Venture, partially offset by higher capital expenditures. The $26 million step up in capital expenditures reflects our continued strategic priority of reinvesting back into the business. During the year, we deployed capital to further enhance manufacturing productivity across our plant network, expanded capabilities at one of our mineral fiber facilities to support the growth of our TEMPLOC energy saving ceiling offering, and advanced several key IT and digital initiatives. Targeted investments like these reinforce our commitment to advancing our growth strategy while maintaining a disciplined capital allocation approach. The strong adjusted free cash flow profile of our business allows us to execute on all of our capital allocation priorities. And as a reminder, our first priority is to reinvest back into the business where we see the highest returns, such as the investments I just outlined. Our second capital allocation priority is to execute strategic acquisitions and partnerships to create shareholder value. In the fourth quarter of 2025, we acquired the issued and outstanding shares of parallel architectural products, and just last week, we announced the acquisition of Eventscape. In 2025, Eventscape generated approximately $30 million in revenue, and we expect that this acquisition will be a positive contributor in 2026. Mark will be covering this in more detail in a moment. Our third capital allocation priority is returning cash to shareholders through dividends and share repurchases. In the fourth quarter, we paid $15 million of dividends to our shareholders and we repurchased $50 million of shares, representing a meaningful step up from the pace of repurchases in the prior three quarters. As of December 31st, 2025, we have $533 million dollars remaining under the existing share repurchase authorization, which runs through the end of 2026. We entered 2026 with a strong balance sheet and ample available liquidity, and remain committed to delivering on all of our capital allocation priorities. Slide 13 presents our guidance for 2026. With slightly improving market conditions, we expect mineral fiber volume flat to up 1% for the full year, including contributions from our growth initiatives. We also expect mineral fiber AUV growth above our historical average at approximately 6%. Additionally, we expect high single-digit AS organic growth, reflecting continued traction as we penetrate a highly fragmented market. Inorganic contributions from geometric will be incremental through the first eight months of the year, and results from both parallel and eventscape acquisitions will be incremental throughout the full year. We expect these acquisitions together to drive approximately half of the total AS segment sales growth. This results in total company net sales growth of 8 to 10 percent. Moving to adjusted EBITDA, we expect adjusted EBITDA growth of 8 to 12 percent with adjusted EBITDA margin expansion in both segments for the full year. We expect mineral fiber AUV growth to more than offset input cost inflation. In addition, growth in the AS segment, the benefits from WAVE, and our continued focus on execution throughout the organization will contribute to earnings growth. While we expect SG&A to increase modestly as we continue to strategically invest in the business, we also expect SG&A's percentage of net sales to improve as compared to 2025. For the full year, we expect adjusted diluted net earnings per share and adjusted free cash flow to grow at rates largely similar to adjusted EBITDA. Please note that additional assumptions are available in the appendix of this presentation. It's also worth noting that our first quarter is typically a seasonally impacted quarter, with Q2 and Q3 representing our stronger sales quarters in mineral fiber due to favorable weather conditions and the typical timing of renovation and new construction activity. While we don't guide to individual quarters, we expect a more muted start to 2026, reflecting both seasonality and the choppiness we've seen in the broader market, coupled with significant winter weather events across multiple regions in the U.S. Accordingly, we anticipate mineral fiber volume in the first half of the year to be slightly softer than the back half as a result of these dynamics. In closing, despite challenging market conditions, we delivered record mineral fiber profitability, strong AS growth with continued progress on margins, and robust adjusted free cash flow growth that enables us to continue to execute on all of our capital allocation priorities. As we enter 2026, our disciplined strategy for growth and proven value creation model position us well to deliver another year of profitable growth. And now I'll turn it over to Mark for further commentary.
Thank you, Chris, and good morning, everyone. First, I'd like to start by expressing how honored and proud I am to have the opportunity to serve as the next CEO of Armstrong World Industries, particularly at this exciting time in our history. Armstrong has a rich legacy of innovation in ceilings and specialty walls, and that legacy remains fully intact today and it provides an exceptional platform for continued success. I look forward with confidence to working alongside our executive leadership team, our dedicated employees, and our trusted partners as we together write the company's next chapter. Vic, you are leaving the business stronger and more resilient than it's ever been and perhaps most importantly well-positioned for continued growth. On behalf of the entire organization, thank Thank you for your dedicated and outstanding service to our company and the strong foundation you will leave behind. As Vic and Chris have noted, 2025 represented another record year in a multi-year period of profitable growth. Those results were driven by our resilient business model and our consistent focus on AUV growth, productivity, innovation, and expansion of our architectural specialties business. Over the last decade, through innovation and acquisitions, we've successfully expanded the company's reach beyond traditional mineral fiber ceilings to a broader set of solutions, including specialty ceilings and walls, with a growing platform for design-centric solutions for more and more spaces within the built environment. And now we are expanding our solutions for energy-efficient buildings and for data centers, two of the most durable and accelerating growth markets in construction today. Throughout 2025, we continue to pursue and prioritize innovation aligned with both of those powerful macro trends. First, the increasing need to reduce energy consumption as power demand accelerates and power costs rise. And second, the rapid global buildout of data centers driven by cloud computing and AI. These are long-term structural shifts, and they are reshaping how buildings are designed and operated. And the fourth quarter of 2025 marked an important step in our commercialization of innovation in these two key areas. On the energy efficiency front, we introduced an upgraded TEMPLOC energy-saving ceiling solution within our sustained portfolio. This new solution enhances passive heating and cooling performance, improves fire rating and thermal comfort, and gives architects more design flexibility. As customers, from owners to contractors to architects, better understand TEMPLOC's multiple value propositions and economic benefits, supported by tax credit incentives and real-world validation through case studies, we are seeing interest and adoption grow. For example, we are currently shipping TEMPLOC for office renovation projects with two major financial services firms in New York City, and we were recently awarded TEMPLOC specifications for higher education projects on both the East and West Coast. We expect much more to come on this exciting opportunity as we develop the market for this multi-dimensional new ceiling solution. In data centers, the fastest growing vertical and commercial construction, our opportunity extends beyond ceilings to engineered infrastructure. In Q4, we launched data zone panels and Dynamax LT Structural Grid, solutions designed for mission-critical environments that require higher load capacity, better airflow management, and faster installation. We also expanded into other high-performance environments with the launch of Skylo, our integrated walkable ceiling system for clean rooms, advanced manufacturing, and cold storage. Taken together, these innovations supported by our digital growth initiatives will enable us to drive volume growth ahead of the market and support our ability to continue to deliver AUV growth. In 2025, our growth initiatives contributed roughly one point of growth in a down market. In 2026, with contributions from data centers and energy savings, we expect our growth initiatives to contribute up to an additional half point of growth. In addition to innovation, our strategy also involves the expansion of our AS business through greater portfolio breadth and capabilities, where we have demonstrated success over the last decade through acquisitions that offer innovative capabilities and materials expertise. By adding these differentiated businesses to our sales and service platforms, we are driving accelerated growth and improving margin performance over time. Eventscape is another exciting example of this strategy and of how we are boosting our ability to partner with architects, designers, and even building owners at the earliest stages of projects, when design intent and technical feasibility remain uncertain and still under development. Eventscape is unique within our architectural specialties acquisition because of their remarkable ability to design and fabricate with any material substrate which is what we mean by material agnostic and while their focus includes ceilings walls and facades it also includes distinctive and often iconic architectural features that differentiate the occupant experience in or around the space. Some great examples of this include special features in the new JPMorgan Chase headquarters and in the recently completed Pittsburgh International Airport. Notably, these are projects where both Armstrong and Eventscape participated on different and complementary aspects of the overall work in summary we are extremely excited about the potential of our recent innovation activity and our recent acquisitions to strengthen our company for consistent growth Armstrong is now more uniquely positioned than ever to offer solutions for a wider array of applications in commercial buildings I look forward to sharing more of our progress in these areas in the future with that I'll turn the call back to Vic.
Thank you, Mark, and as you can hear from Mark's comments, we have a lot to be excited about here at Armstrong in 2026 and beyond. The recent acquisitions like Parallel and Eventscape expand our sales opportunities within commercial buildings and further strengthen our relationships with architects and designers. The innovation we've highlighted enables our competitiveness in two new growth areas of the market, data centers and energy savings, both of which contribute to consistent mineral fiber AUV growth, incremental volume growth ahead of the market. These are key building blocks for continued, consistent, profitable growth. Looking ahead to our market outlook, we are encouraged with some improvement in visibility. However, high levels of uncertainty around policy, around interest rates, potential geopolitical events still exist. In 2026, we expect underlying market conditions to be steady and slightly improved versus what we experienced in 2025. Within this outlook, we expect transportation to remain an area of growth, along with data centers, and the gradual healing of the office vertical. As we experienced in 2025, we also expect to have near-term opportunities from new construction starts in the healthcare and education verticals from projects that were initiated in the past 24 to 30 months. Now, while the office vertical does appear to have bottomed, and we see green shoots of opportunity emerging, we haven't yet seen a significant return of broad tenant improvement work at this point. It is worth noting that even as a full recovery in office has yet to materialize, we are seeing in the bid data that project bids are at meaningfully higher values, meaning that building owners who are doing tenant improvements are investing more into office spaces to enhance their aesthetics, their functionality, and their amenities. Now, this is encouraging and represent a prime opportunity for Armstrong to leverage our broad portfolio of products, playing to our strengths at the high end of the market. In closing, I want to thank our employees again for their dedication and solid execution that enabled us to deliver another year of record results in 2025 and really set us up for continued success in 2026. We have executed well on our strategy and enhanced our value-creating building blocks. With our growth initiatives that we've invested in through the pandemic, we are now delivering above-market performance. And we have made several strategic acquisitions that have expanded our capabilities and our addressable market. Over the 10-year journey we've had at Armstrong, we have purposely built a highly focused America's ceilings and architectural specialty company that delivers consistent, profitable growth. By separating from the flooring business and divesting of our international operations, we have reduced complexity and focused our investments in North American market, which have strengthened our market position, made our business more resilient, and improved our returns to shareholders. Our cash generation has nearly tripled. We have returned over a billion and a half dollars to shareholders. And through the execution of our strategy, we have significantly increased the value of the company. And today, I am more confident than ever that we are poised to continue on this path in years to come. And with that, we'll be happy to take your questions.
Operator
We will now begin the question and answer session. To ask a question, press star, then the number one on your telephone keypad. We kindly ask that you please limit your questions to one-and-one follow-up. Our first question comes from the line of Tomohiko Sano with J.P. Morgan. Please go ahead.
Hi. Good morning, everyone. Good morning. Thank you for your leadership, and congrats on your transition to Chairman. We look forward to continued execution under MOCS leadership. So my question is, for the 6% AUV growth in 2026, what is the price and mix split, and how sustainable is the pricing power in the current competitive environment, and what the customer is saying about the price versus about the delivery, please?
Yeah, our AUV performance was above historical levels, as you've noted, at 6%. And normally, and if you look at this over a long period of time, like the past 10 years, it ranges about 50-50 or averages about 50-50. In 25, we had a little bit more price than we did mix contribution based on inflationary pressures and that we were pricing into. So the mix was a little bit more biased toward like-for-like pricing than mix. Going forward, as Chris can outline, we're anticipating some additional inflation in 26, and our expectation is with our normal cadence on pricing, we're going to continue to price ahead of that inflation and likely to end up with a more positive bias toward like-for-like pricing than next in the year. That's kind of how we're thinking about it sitting here today.
Thank you. And my follow-up is that Anders Mark's leadership, how should we think about the strategic continuity and top priority over the next 12 months and any key KPIs, please?
I'll let Mark take that. Yeah, happy to take that. Thank you for the question. Obviously, Vic and I and the leadership team have worked very closely together over the last seven years or more in my different roles on strategy. So, you should not expect a pivot in our strategic direction. I'll be focused on and continue to be focused on innovation, for sure will be a priority. Our growth initiatives, initiatives we've had in digital initiatives I talked about today, so energy savings and data centers, and some of the hallmarks of the business, productivity, as well as inorganic growth, whether M&A or partnerships as well. So, the same consistent areas of emphasis, the same consistent overall strategic objective, consistent profitable growth. Thank you very much.
Operator
Our next question comes from the line of Susan McClory with Goldman Sachs. Please go ahead.
Thank you. Good morning, everyone. And let me add my congratulations to both Mark and Vic. Looking forward to working with Mark and Vic. Enjoy your new time.
Thank you. Thank you very much.
Yeah. So my question is, you know, talking a bit about the operating environment, you did mention in your remarks that you are seeing bids for office that are at least meaningfully higher in value. Can you talk about how these products and the platforms that you've launched in the last couple of years are gaining momentum and how they're perhaps coming through even with some of the headwinds that it sounds like you're facing?
Yeah, you know, let me start just with the actual starts of work in the marketplace is fairly flattish and it kind of, I think, represents what we're feeling in the market overall. And when you look at the office vertical in particular, yeah, the values stand out and it's well above inflationary numbers, right? You might look at value bidding numbers and say, yeah, well, there's a lot of inflation in there. And there are inflation in these numbers, but they're well above inflationary levels. And of course, this also is consistent with what we're seeing in the marketplace and the specifications that we're working on, where they're using a lot more architectural specialty type products in certain areas of the building to create these different fields and amenities employees to entice employees back to work and to keep them in the office. So we were anticipating this coming as more and more constraints are on availability of Class A office space and Class B spaces had to be upgraded to compete. We were anticipating this, but I'm calling this out because it's really notable in the bid data to see how the values are meaningfully higher than you would normally expect from inflationary pressures there and of course yeah I'll just just add to that I'll just add that you know this is where having the breadth of product portfolio that we have that includes mineral fiber where they need to use that but now a whole host of a pallet of materials that we can allow architects to design with it's really a one-stop shop advantage that we can bring for all different types of designs and all different types of spaces within
these buildings now it happens to be you know more prevalent in office spaces which is again a really good opportunity for us yes okay and that kind of leads to my follow-up question Vic which is can you talk about the integration of the deals that you have done in the last couple of years where we are in that process and in your remarks you also mentioned investments in capacity to support future growth and so how should we think of you know the integration and these investments that you're making and the potential for upside over time yeah I think the way I think about the integration of these businesses is it's a continuum of work and we take them step by step
and the objective here is to get them to take advantage of the large platform platform, Armstrong has to offer them. So mostly on the revenue generating side, right, some of the biggest synergies we have with these acquisitions is we scale that in their first couple of years on the platform. They're in hundreds of more architects' offices and through our distribution network. So we try to do some of those steps initially as then we bring on more and more productivity and more and more of the operational side of the business. And eventually, you know, footprint optimization work. So we kind of think about this as a continuing ongoing work. Again, when you look at, and I would just point you to the revenue generation and the architectural specialty business, with these companies that we're buying, they're certainly not growing at high single digit levels. And it really comes down to, we're scaling these through our integration work on the Armstrong platform very successfully. So, I'm really pleased with those early stages of integration, and I would just say as we go, we're going to continue to integrate these businesses on the operational side to drive more operating leverage from the revenue growth, but also more productivity in the And that's how we get to the 20% goal that we put out there and how we're going to sustain that over time.
Yeah. That's great, caller.
Operator
Thank you, and good luck with the quarter.
Operator
Our next question comes from the line of Keep Hughes with Truist. Please go ahead.
Thank you. Just a couple of detailed questions on 26. What kind of inflation expectation, input inflation expectation do you have from Mineral Fiber for the year?
Yep. So for 26, overall inputs at the mid-single digit inflation range versus prior year on a percentage basis. And just a reminder, you know, our detail of that is, you know, about 35% of our COGS is raw. It's about 10% frayed, 10% energy, and 10% labor. So if I break that mid-single-digit inflation down, frayed is about flat year over year. And we're seeing low single-digit percent inflation in raws. That's really on some of our fiberglass paper and perlite inputs. And then energy inflation in that, call it, you know, low double-digit 10% to 12% range. And that's really a split between, you know, electricity and that gas, but a little bit of that gas pressure here for 2026. So all up, all in, mid-single inputs for 2026.
Okay. And as you pointed out in the prepared comments, the AUV expectation is a little bit higher than you get. But although you've been actually, if we look at it last several years, it's been close to 6% in many years, last couple of years. You just talk about what's going on in the business that's just getting a higher number than we have historically.
Yeah, I'd say in, you know, as Vic mentioned earlier about the like-for-like pricing and positive contributions for mix in that AUV, you know, it really goes back to our innovation and our service and our quality dimensions of the business. We continue to get and can see that, you know, more price than mix dynamic here, certainly with that inflationary backdrop that I mentioned, but also coupled with our investments back into the business to really drive that innovation part of the equation. So, again, we feel good about that 6% for 2026. And if I look at it on a first half, back half kind of split dynamic, it's relatively even, you know, first half to be about the same as the back half. But again, as we think about the investments back into the business, that's a really big core value creation driver for us and one that we're very excited about in 2026 and beyond.
And finally, my congratulations to you as well, Vic. tremendous run since you took over the company so job well done thank you thank you thank you Keith appreciate that our next question will come from the line of Adam Baumgarten with vertical research partners please go ahead hey good morning everyone just starting on the mineral fiber you get that guy for 26 I know it's fairly open-ended you know above 35 and a half or 43 and a half I should say But that's despite 6% to 7% revenue growth. So is there anything, you know, offsetting that from a cost perspective? I know you talked about AUV covering inflation, maybe getting some SG&A leverage. Is it just conservatism just because it's a pretty solid top line and it seems like price costs will be favorable?
Yeah, no, Adam, I think it's a good question. No, I mean, I'd say I'd point really back to the value creation drivers that we've been talking about, solid AUV growth. What we haven't talked about is the manufacturing productivity that we get year in and year I mentioned in my prepared remarks kind of the overall investments back into the business on CapEx, and a lot of what we see manifest themselves in that productivity is really investing back into that pipeline to continue to get those productivity gains. So, no, I mean, overall, you hit on SG&A, and I talked about SG&A in terms of how we're We're thinking about getting that leverage, but we will be investing in SG&A for our growth initiatives in 2026, but are pleased with the fact that we're out looking another year of overall EBITDA margin expansion given those solid value creation drivers that I mentioned.
Okay. And then just on the government channel that was weak, given the shutdown, and it seems a bit slower to come back. Are you seeing any positive signs there, and is any kind of recovery from that weakness late last year built into the outlook in 26?
This is fact, yes, we did see it bounce back in January. We certainly would have expected this in November and December, but with the holidays around that, it did not bounce back as robustly as we thought it would be. But we did see it in January, and we would expect a lot of this to be filtering back in over the next several months. Okay, great.
And the second part of your question is that we've already kind of factored this into our outlook for the year okay perfect thanks thank you for that question yeah our next question will come from the line of rape jabrosich with bank of america please go ahead hi guys this is actually sean counten on for race um so first the architectural specialties organic growth has slowed over the last two quarters uh but you're expecting it to return to high single digit growth in 2026. what do you think in the pipeline that gives you the confidence that that growth picks up and did you see any delays in projects in the second half
that are going to benefit 2026 yeah I'll take that in the architectural specialist segment we had a really strong back half of 24 so a little bit of that deceleration you're referencing it's more of a base period comparison versus the actual run rate of the business we've actually been generating a backlog growth with our order intake in double-digit levels. So it's this kind of where we are currently with our backlog and the way it's been growing throughout 2025 for 26 and actually beyond into 27 already. That gives us really, I think, the confidence that we need for returning to high-signal-digit levels of growth. And remember, we know there's some large projects in here, and they can ebb and flow quarter to quarter. Certainly, as we saw at the end of the year, they can actually move out of the year and impact on a quarterly basis. But as the year goes, I think we'll benefit from those. And those are factored into, again, factored into our guidance for 2026. I feel really good about where we are with our order rates and how we're winning in the marketplace with our breadth of portfolio in this space.
Okay, great. And then it sounded like you're expecting mineral fiber volumes down in the first half but up in the second half. Can you talk about what gives you the confidence that you'll see growth in the second half and if there's any specific verticals that you expect to outperform versus underperform?
Yeah, I'll take the first part of that question. Yeah, so we expect growth for the year flat to up 1% with a stronger back half than front half of the year on the, you know, the weather dynamics and the seasonality that I mentioned in my prepared remarks. So positive for the year, but a little bit stronger in the back half than the front half with, as you can imagine, you know, given the winter weather impacts we've seen here in the first quarter, a more muted start in Q1. Did you want to talk about the vertical component of that?
Vertical? Of office? I think as we've talked about with the office vertical, we're not expecting an inflection where it just turns on and then here we go. I think it's a very gradual and it's going to be an uneven recovery across the US. So I think it's going to build if we have some, you know, some of this uncertainty continue to clear up as we go into the year, it could build into the second half. I think the other thing, you know, as Mark talked about the excitement around data centers and energy savings, these are two new early stage growth initiatives. Each quarter as we go, we should be continuing to build contributions from those initiatives that are additive to our base growth initiatives in digital. So a lot of those things kind of adding up that gives us the outlook of a stronger back Great.
Operator
Our next question comes from the line of John Blavallo with UBS. Please go ahead.
Good morning, guys. Thanks for taking my questions as well. The first one on architectural specialty organic EBITDA margins, 18.7 for the year, which you talked about was slightly below that 20% outlook. I'm curious if you could help us kind of bucket the drivers between the lower organic revenue, some of the project timing and maybe any other factors that played in there.
Yeah, John, if you're asking about the project delays that impacted that cost imbalance, I can give a little more color there. But let me finish there but start with, you know, we continue to make good progress on our stated goal of getting this architectural segment to 20%. Again, this is the fourth year in a row of margin expansion in that business on our way So I feel like we have the right levers. We know what the right building blocks are for us to deliver that. In fact, we had two quarters in 25 where we were north of 20%. So again, I think we know what to do. We know how to get there. We really didn't have the operating leverage in the fourth quarter based on these project pushouts. We had the cost in place. There was five good-sized projects. In fact, they were all delayed in December. And so normally, and we experience project delays all the time in this architectural specialty segments. We've talked about this. Normally, they're picked up in the same reporting period. So in this case, they not only fell out of the quarter, they fell out of the year because they were in December. And they were primarily education and healthcare projects. And so because they were sizable, that just created this imbalance of costs and therefore the margin compression. This will work its way out. I think, again, we know what the right levers, the right building blocks are to deliver a 20% EBITDA segment in architectural specialties.
Did that get to your question, John? Yeah, yeah, that's helpful. And then I guess just on the mineral fiber growth piece, the 0% to 1% this year, I mean, I know the longer-term outlook is sort of 2% to 4%. You know, help us kind of think about, you know, the path towards that 2% to 4%. What do we need to see in terms of the market and just, you know, internal execution? And what, if any, timing, you know, guidelines you guys have around that?
Yeah, it's your question. I mean, we're moving that direction, right? When you look at it's been a while since we've outlooked positive mineral fiber volume growth, right, in the years. So we're moving in that direction. Remember that the two to four had two components to it. It was a market recovery of one to two points of growth from the market recovery off of the getting us back to 2019 levels. And then there was one to two points of contribution from our growth initiatives. So as Mark outlined, we're moving in that direction of the one to two on our growth initiatives, which is what we can control. level, and with a little bit of the healing going on that we're expecting in 26. And we'll see if that continues into 27 and 28. But that's how you get to that two to four range. I still believe that that's a good midterm type outlook for mineral fiber line growth.
Okay. Thank you, guys. You bet.
Operator
Our next question will come from the line of Derek Schmoy with Loop Capital. Please go ahead.
Oh, hi. Thanks. On the data centers and energy saving projects, I'm wondering if you could speak to just how large your overall portfolio do these projects represent just in the context of the half-pointer growth you're expecting them to contribute this year? And then also, maybe can you speak to any mix impact these projects have on margins?
Mark, I'll take this and if you want to add any color. Let me just start with on the AUV side, Both of these initiatives are accretive to our AUV. So we really like selling more of these products in terms of that financial metric of growing our AUV. They're really consistent with the innovation that we're bringing to market as supportive of that continuation of that AUV growth. On the margin side and contribution of that, I think the data center tile in particular is further down the road in terms of scaling, in terms of getting the operating leverage and the margins up, and energy savings are still in the early stages of getting really good operating leverage on the $10 million investment that we made down to one of our plans that we talked about in 2025. So we do expect both of these to be consistent with our 60% incremental contribution to EBITDA as they grow over time. So, again, I think these are really two high-value applications for us to continue to innovate and build our portfolio on. I'm not sure I got all of your questions, but Mark, do you want to add anything to that?
Yeah, and obviously, and I mentioned this in my remarks, the data center category is growing, and we've got an opportunity to penetrate that category further. energy savings plays across all of our verticals frankly and early days we've seen a high level of interest in office and education that plays really well across all our verticals and there were both the both of these initiatives are supported by macro trends so we are on trend with our value propositions in both of these spaces and a lot of energy behind both of them now that's that's Follow-up questions just on the home center softness you saw in Q4.
Was that de-stocking by chance or just the general slownishness in that channel?
Yeah, it's kind of more of the same of what we've seen quarter to quarter than moving some of the re-inventory levels around. So primarily de-stocking again in the fourth quarter. And again, this is a dynamic they can sell down from their inventories and then build up, back up very unevenly. So fourth quarter is more of the same, to a lesser degree, of course, than some of the other things we've mentioned, though.
Thanks. Best of luck, Vic, in the future. And Mark, we're looking forward to working with you in more detail. Thank you. Thank you, Eric.
Operator
Our next question comes from the line of Brian Bureaus with TRG. Please go ahead.
Hey, good morning. Thank you for taking my questions and Dick and Mark, congratulations on the new roles. Thank you, Brian. On the middle part of the volumes, can you maybe just compare today's level to like pre-COVID? Because while volumes have been down, you've been able to perform very well. So I think it's kind of important to understand what you've been able to do at this lower volume level and kind of how we keep that in mind for when and if volumes do return.
Yeah, that's a good question. 2019 levels, we're still about 14% as we finish 25, we're still 14% below 2019 volume levels. So yes, I mean, getting back to one of the earlier questions on market contribution to that 2% to 4% volume range, we have quite a bit of ways to go to get back to 2019 levels. And we believe that as long as the market verticals keel back to where they were and there's nothing structurally in their way to doing that, we should be able to get back to 2019 levels.
So that really is a flywheel opportunity when you look at the margins that we're back to now we're back to 2019 margin levels without 14 percent of the volume so yes very very good opportunity for the company in the future yes it's a good story at the margin level and then maybe follow up on visibility last year kind of always is this kind of choppiness around preparing a model side maybe like six months plus out and that kind of seemed to come in slightly better than expected at the beginning of the year last year so how do you view visibility now for 2026 in that lens I think you touched on it a little bit in the
prepared marks but there's compare and contrast the visibility today versus a year ago thank you yeah I mean we're we're pretty good at modeling what's going on there's not a lot of visibility on the renovation especially some of the lower level renovation work that doesn't involve say an architect we've talked talked about this in the past, we have the least amount of visibility in that part of the mineral fiber business, kind of just shows up through distribution. So we have to model that based on what drives that by vertical. And what drives it in the office vertical is very different than what drives it in the So how we do that is we do a lot of modeling and triangulation. And of course, our ear to the ground with our customers and the marketplace. Again, we're pretty good at it. We don't get it perfectly every quarter, but on a year-to-year basis, our models are pretty good. So that's kind of how we do it. I think going into 26 and beyond, we'll continue to use the technology, the AI modeling capabilities that we have now to just get better and better at that.
Operator
Our next question will come from the line of Steve and Kim with Evercore ISI. Please go ahead.
Yeah, thanks very much, guys, and Vic, yeah, congratulations, really a job well done. And Mark, looking forward to working with you. Mark, I wanted to, yeah, Mark, I wanted to clarify a couple of things you said. There was a lot talked about with respect to innovation, which is obviously a good thing. You know, you have project works, canopy, healthy spaces, PEMPLOC, Dynamax, Skyflover. You talked about even the data centers initiative and the energy savings initiative. So, what I wanted to first do is just make sure I understood your terms, because you said that some component of these added 1% of growth in 2025, and you expect an additional half point in Figure 26. So, what exactly was the 1% and what exactly is going to be this half point that you're talking about? And I guess generally, why would there be a deceleration? I would actually think given the momentum that there would be maybe an acceleration in the contribution. So if you could just clarify that for me, it would be great.
Yeah, very fair. Happy to clarify. There is an acceleration. That is the point I'm trying to make. I was trying to highlight the addition and the emphasis on data centers and energy savings as an accelerant to the other pool of initiatives that you mentioned there. So our initiatives in general that we've talked about historically are driving that first point. And with the addition and the ramping of energy savings and data center focus, there's an incremental half point on that initiative progress.
Okay. So does that mean that in 2026, relative to 25, that the contribution would be 50 basis points? or are you saying it's 150 basis points and just trying to make sure I'm understanding what you're trying to communicate.
Yeah, incremental year on year 150.
That clarifies it. Appreciate that. All right, great. And then I guess secondarily, you talked, you've talked in the past that Project Works and Canopy is being a real differentiator for your business. And I'm curious if you see AI, the emergence of, you know, artificial intelligence, as a positive or a negative for some of your initiatives, particularly, I guess, with Canopy, in the sense that I would think that AI might enhance their functionality, but I could also theoretically see it leveling the playing field a bit for your competitors. So I wonder if you could talk a little bit about what you see in terms of the impact of AI as a positive or a negative factor for those initiatives.
Yeah, happy to take that. So I think on the whole, it's a positive. And in fact, some of our initiatives, broadly speaking, are embedding AI, and it's one of the most prominent places we've got AI utilization in the organization is to enable, further enable our existing initiatives. And we feel good about that focus in particular with specification excellence we've talked about in the past as really an amplifier to that initiative, and just as we will across the organization. I can see all of our initiatives benefiting from the use, but early days for some of the initiatives, but in particular, spec excellence is the one that I think really is accelerated by AI.
And Steven, you know that winning the specification is really, really an important part of our strategy, right? As you, over the years, you've come to know, that's a key part to our pricing model and of course, our innovation. So the fact that we're using KGI there to even strengthen that core strength of ours is pretty exciting.
Operator
Our final question will come from the line of Phil Eang with Jeffries. Please go ahead.
Hey, guys. Vic, congrats, and thanks for the partnership. And, Mark, looking forward to working with you. Thank you. I guess kind of kick things off, Vic. You sounded a little more upbeat on the outlook for mineral fiber, right? I mean, you're calling for a flat to up, which is encouraging. But you also, I think Chris highlighted, it's going to be a softer first half. I don't know if you're just trying to signal volume is going to be down the first half. You sound more upbeat, but slower start to the year. Can you kind of help square that up? And perhaps where's that optimism coming from? Are you hearing from your customers that they're seeing a more robust backlog? What's driving some of that?
Yeah, there's still a lot of cautious, I would say, optimism around that. But when you think about the last several years, and so you've called this out a couple We've been out looking a potential recession in the back half. And so we've had several years of downturns expected in the back half. I think the improved visibility in 26 is nobody's talking about that. In fact, I think they're talking about the economy actually strengthening and getting And that's always good for renovation work. When the overall economy is doing well and the uncertainty gets less and less, we see a lot more renovation work. So that's part of the encouragement that we see is that there is more visibility. Nobody's calling for a recession. Actually, I think people are outlooking more positive economic activity. And that gives us, again, some market help. But I would say, Phil, the biggest driver to a little bit more upbeat here is the traction we're seeing in our growth initiatives. This is what we can control. This is what we have really good visibility on. We have our target list. We know our customer engagement on that. And, you know, as Mark highlighted, getting some acceleration in the contribution from our growth initiatives is also really what we're encouraged by, and it's generating a little bit more confidence to get to a positive volume growth, again, as I said earlier, the first time in a long time. So, you know, what Chris is outlining is, you know, I think very typical in terms of a seasonal impact in the first half, and now we've had some weather events, and we've had time to digest some of that impact and include that in our guide, and how we're sequencing at the guide, too. That's really, I think, what Chris and I have batted back and forth to make sure that that's It's helpful and clear for everybody.
And maybe just add a little more context to the volume in the first half feel positive, but a slower start to the year volume-wise in Q1.
Got it. That's helpful, Collar. And then I guess a follow-up on the, you know, wave earnings outlook you're calling for mid-single-legit growth. Pretty healthy growth considering you're lacking a pretty tough comp in 2025, and it kind of implies that the earnings leverage in WAVE is perhaps even more robust than the overall mineral fiber segment. What are some of the building blocks for that momentum in WAVE?
Yeah, so as you mentioned, WAVE equity earnings growth for the years in that mid-single-digit range. But if I just take a step back, so one of WAVE's value creation drivers is that price-cost algorithm to continue to drive that growth through innovation, quality, service, And it's really to drive that growth through discipline pricing, and there's no change there to your question. That rate that we're talking about here in 2026 is reflective of some short-term operating leverage headwinds on some of the initiatives there in that business. So as those kind of scale, that'll improve kind of in the short term, and we'll get more traction. And I think overall from a, you know, longer term, mid to longer term perspective, we don't see any change in the equity earnings growth trajectory to get back to that five single digit range in terms of equity earnings for the Wave Venture. Okay.
Appreciate the color, guys.
Operator
And that concludes our question and answer session. I will now hand the call back over to Vic for any closing remarks.
Yeah, thank you. And I appreciate the comments on the call. I really do appreciate that. Really thank you all for the coverage and the support of AWI over the last 10 years. And I really, again, want to thank our 4,000 employees for just an outstanding job in transforming the company over the last 10 years. It really, truly has been an honor for me and a privilege to serve as the CEO of Armstrong. And as I step aside, like I said earlier, I'm more confident than ever that the future is bright here at Armstrong. So, again, thank you all, and good luck to Mark. Thanks, sir.
Operator
This will conclude our call today. Thank you all for joining. You may now disconnect.