Operator
Good day, and thank you for standing by. Welcome to the Bank of Hawaii Corporation 4th Quarter 2025 Earnings Conference Call. At this time, all participants are listening-only mode. After the speaker's presentation, there will be a question-and-answer session. To ask a question during the session, you will need to press star 11 on your telephone. You will then hear an audible message just by letting your hand is raised. To withdraw your question, please press star 11 again. Please be advised that today's conference is being recorded. I would like to hand the conference over to your first speaker today, Chang Park. Please go ahead.
Good morning and good afternoon. Thank you for joining us today for our fourth quarter 2025 earnings call. Joining me today is our chairman and CEO, Peter Ho, President and Chief Banking Officer, Jim Polk, CFO's Brad Sattenberg, and Chief Risk Officer, Brad Harrison. Before we get started, I want to remind you that today's conference call will contain some forward-looking statements. And while we believe our assumptions are reasonable, the actual results may differ materially from those projected. During the call today, we'll be referencing our slide presentation as well as our earnings release. Both of these are available on our website, boh.com, under the investor relations link. And now I would like to turn the call over to Peter.
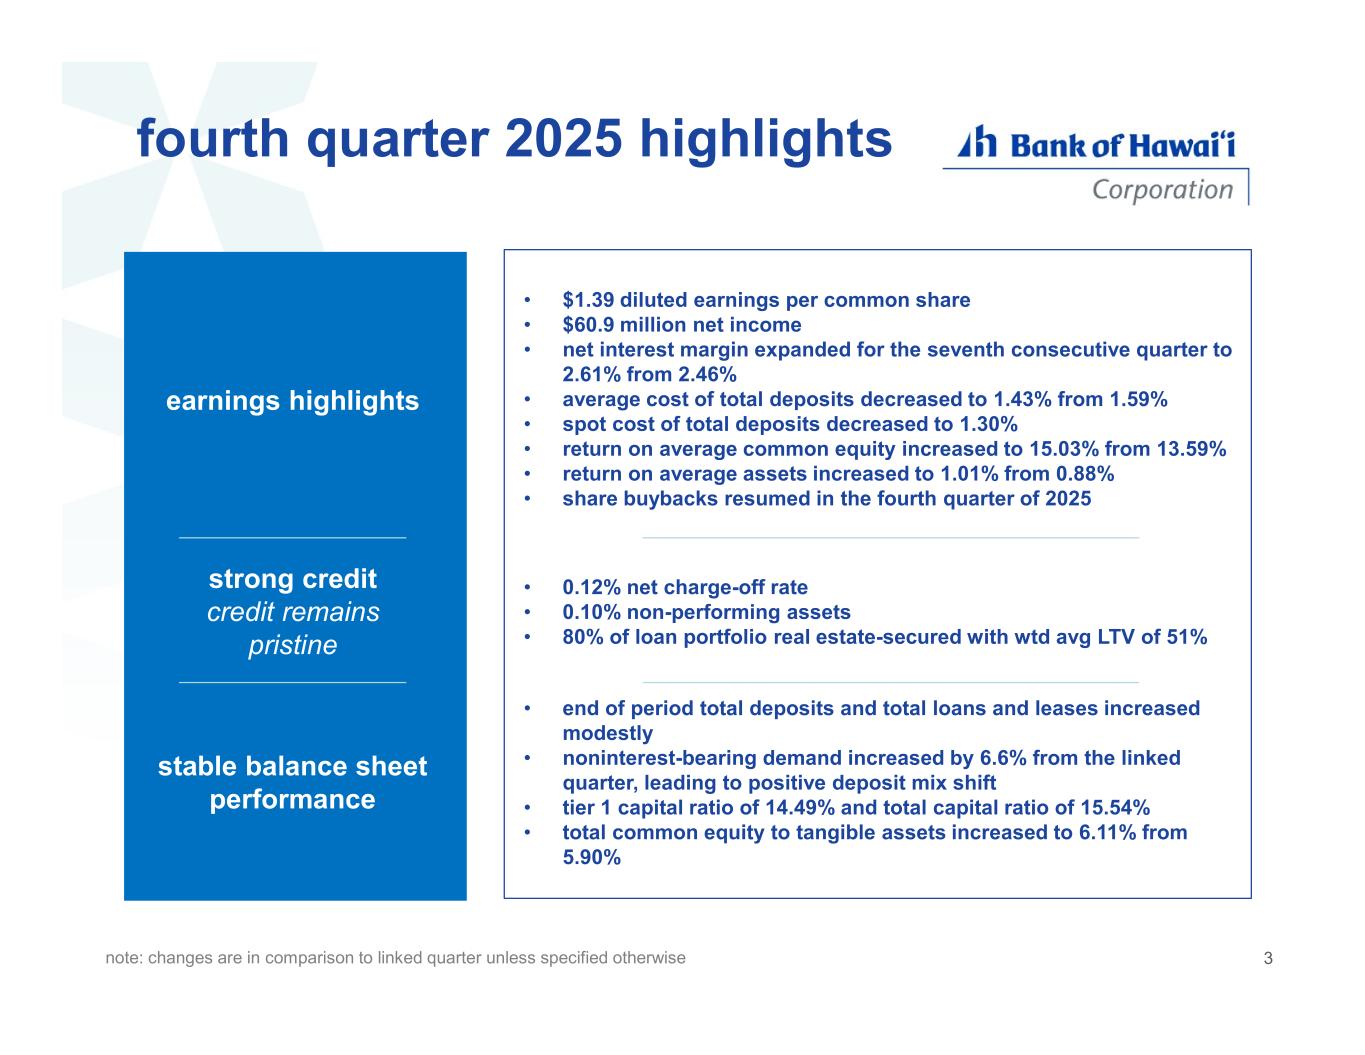
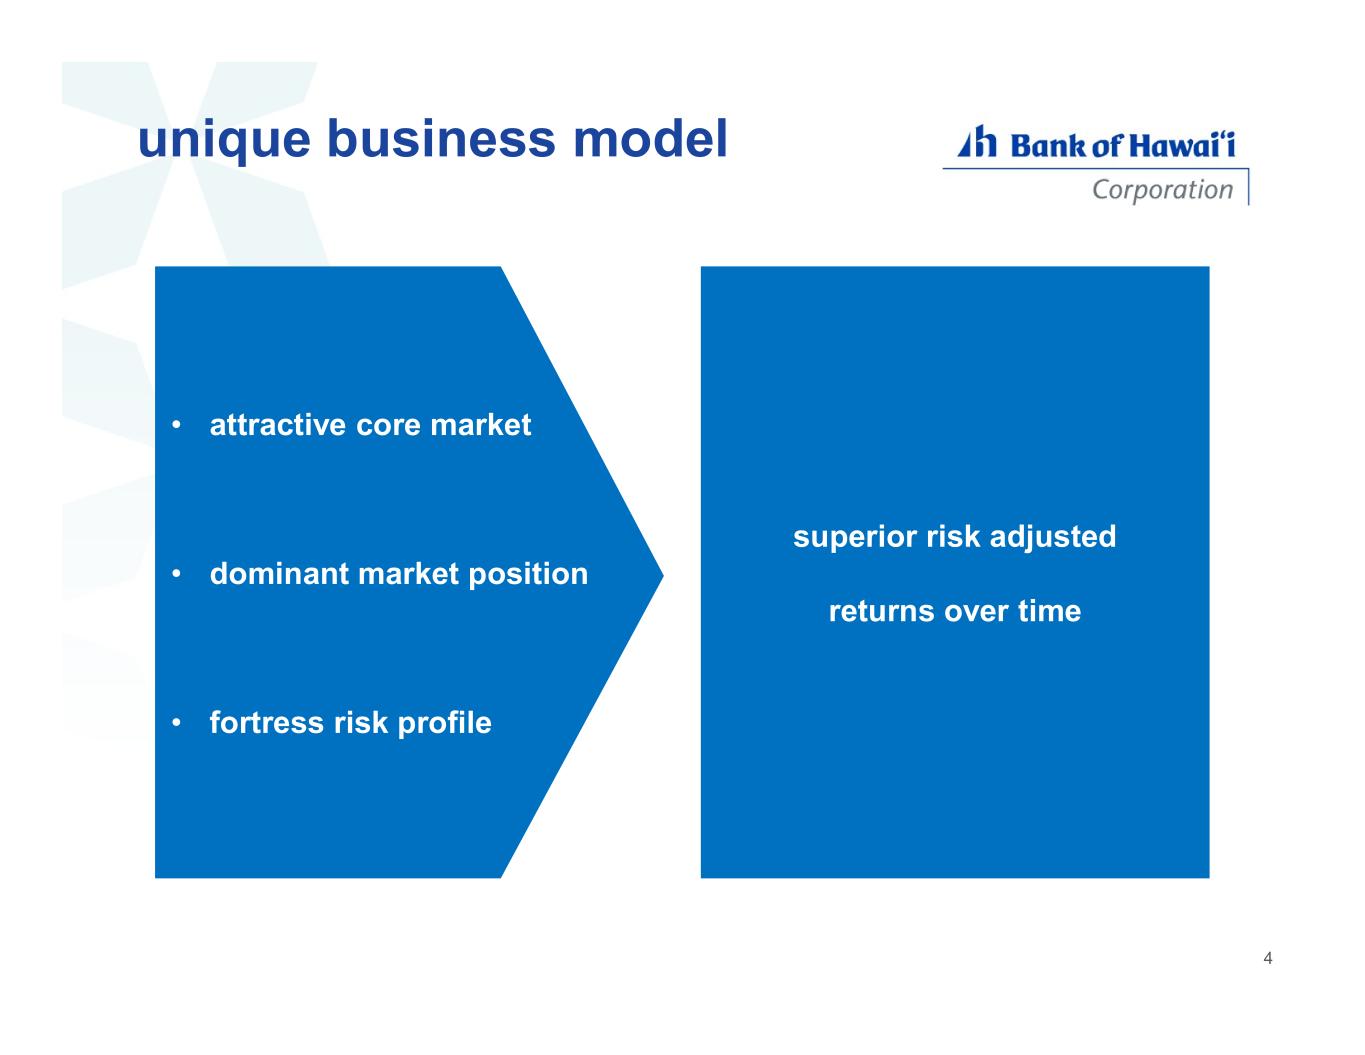
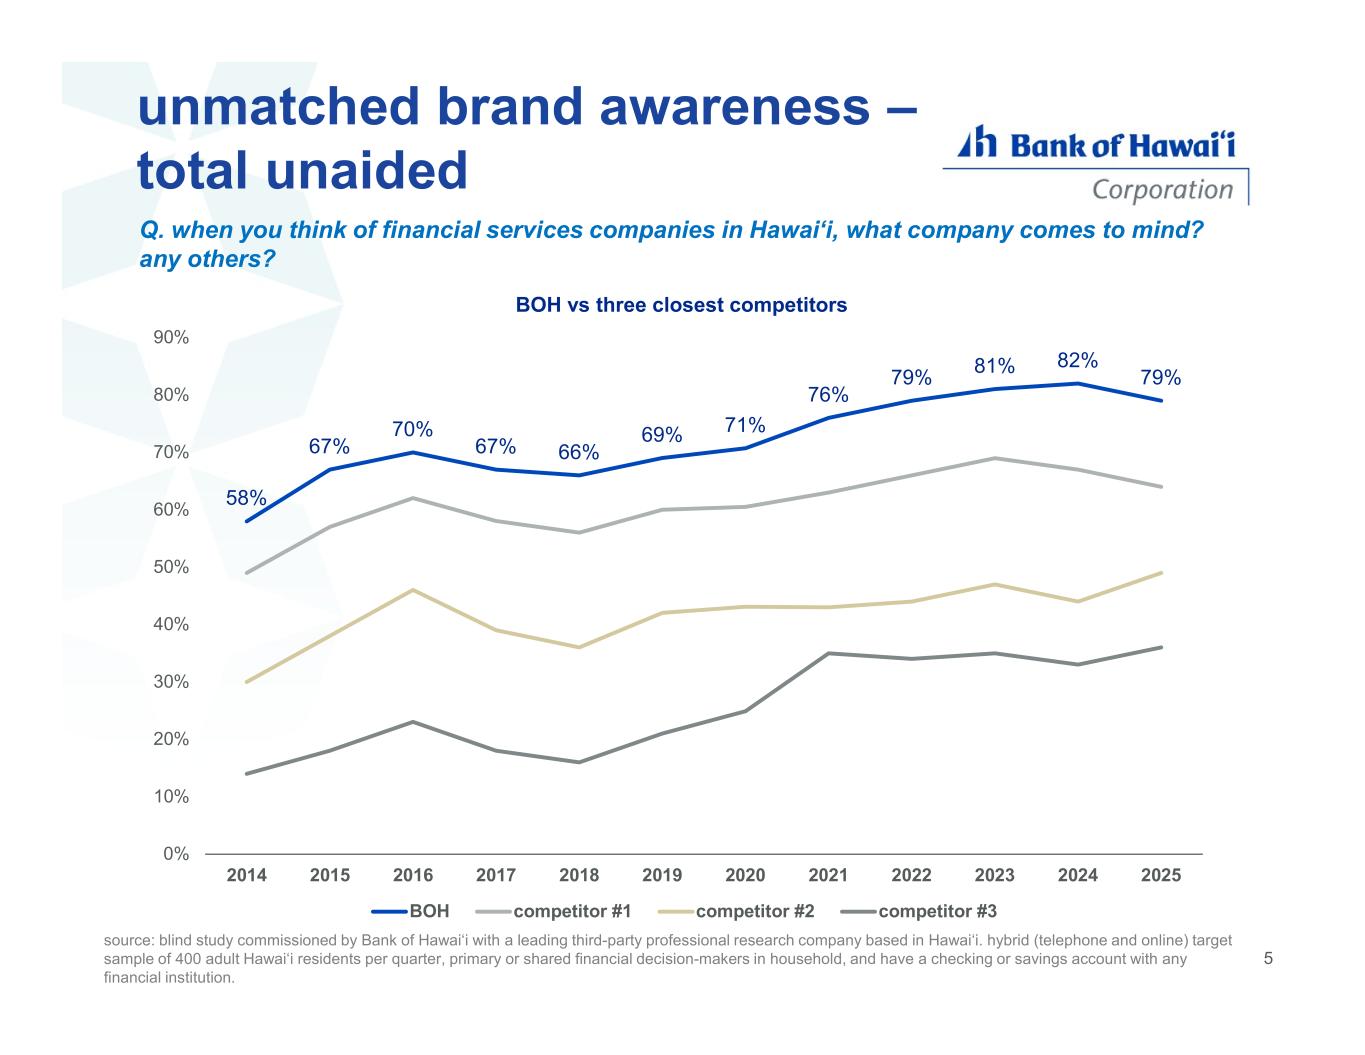
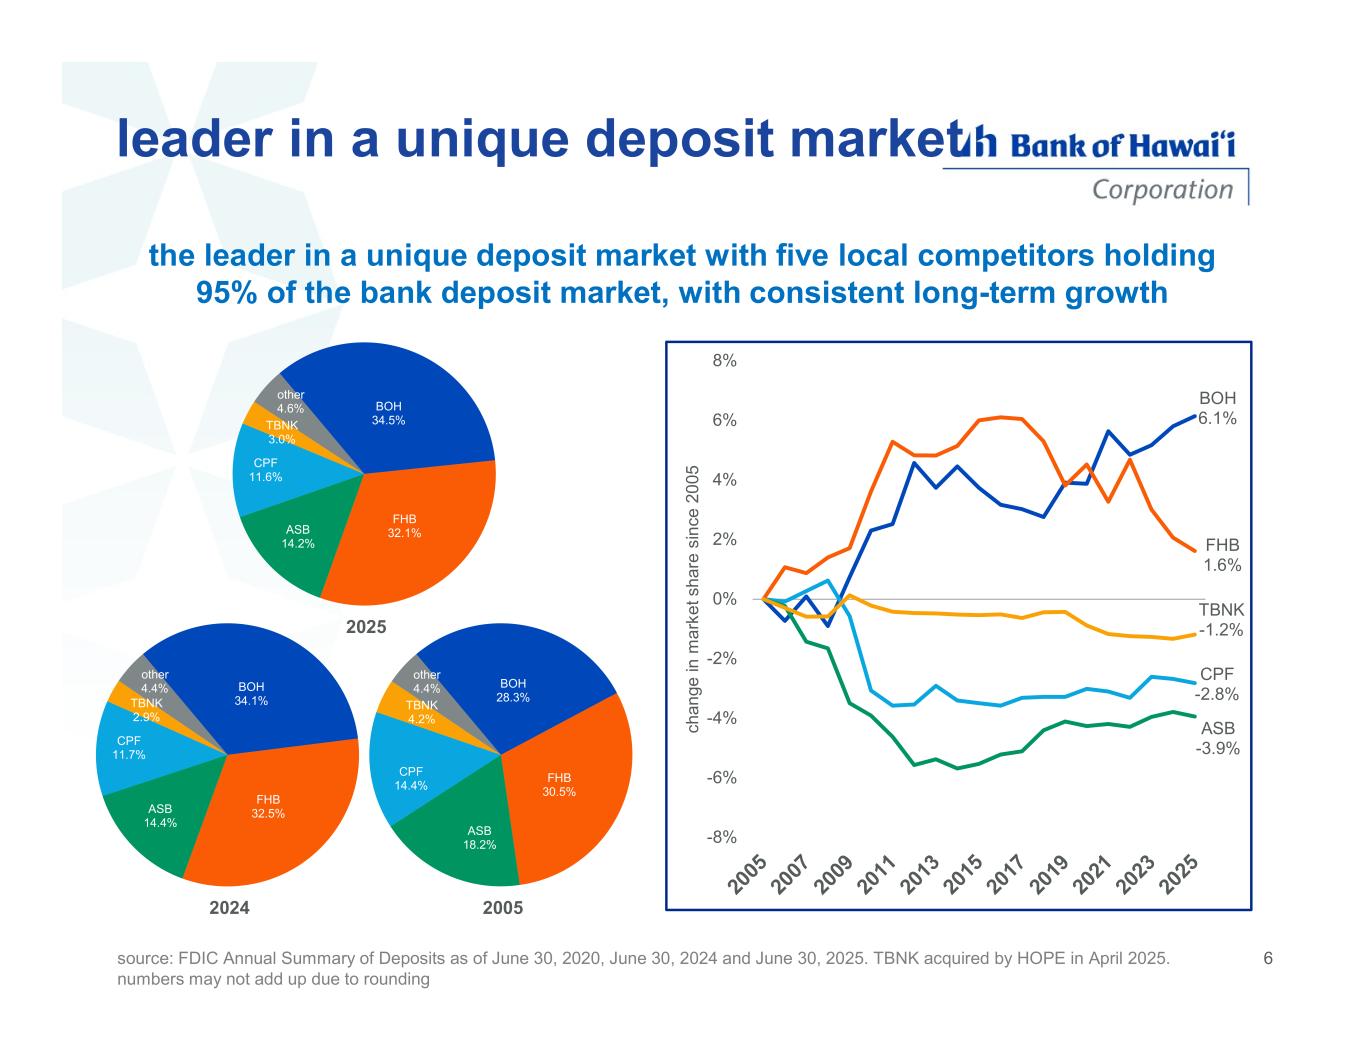
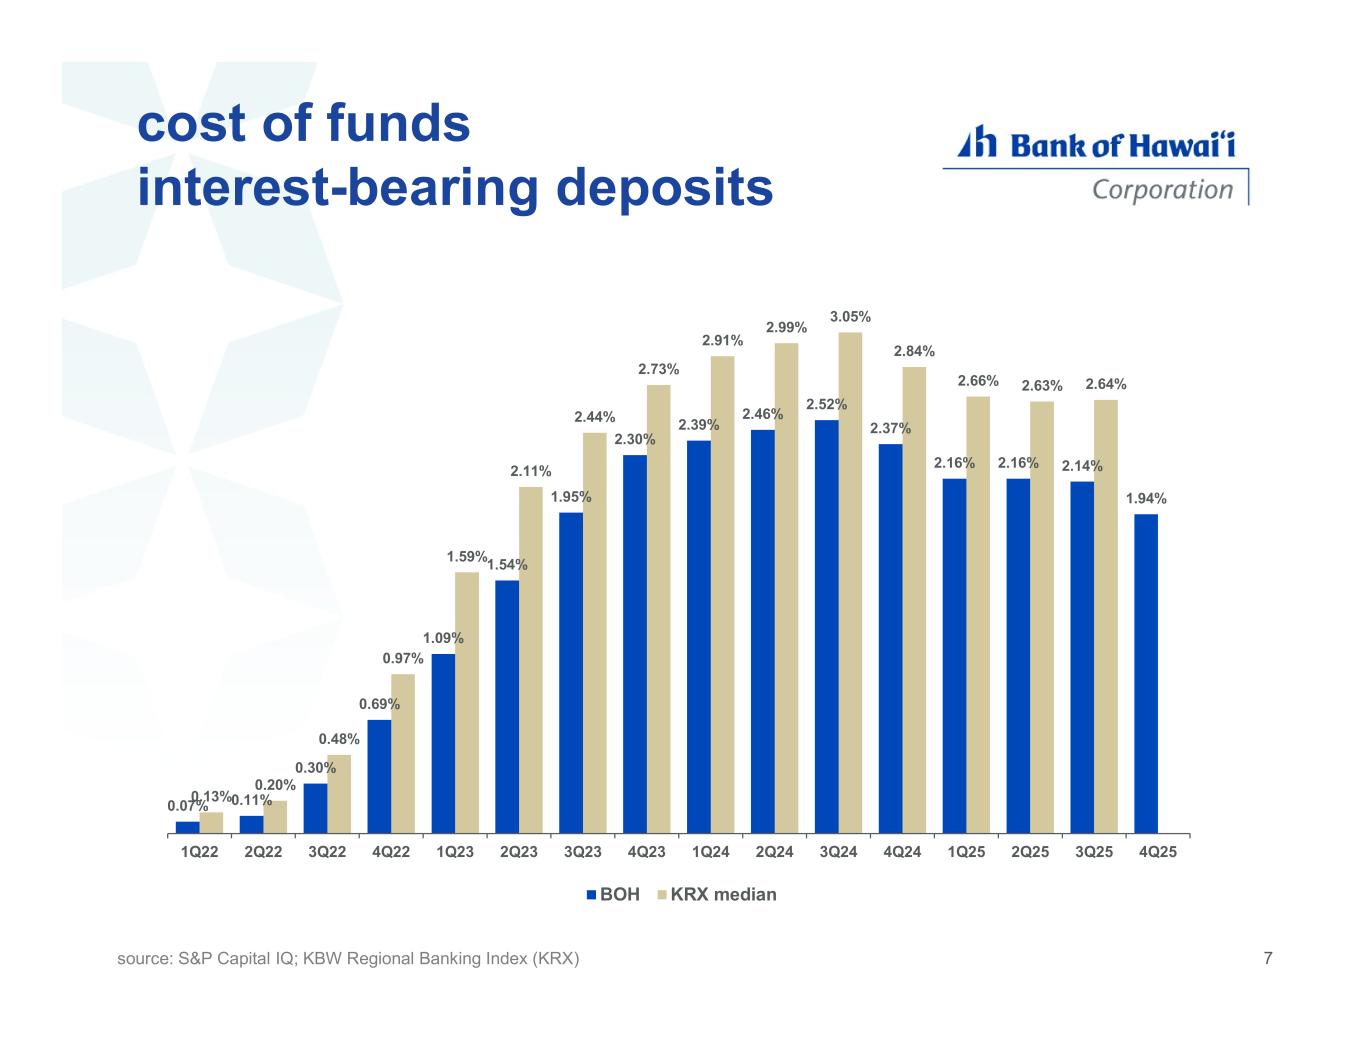
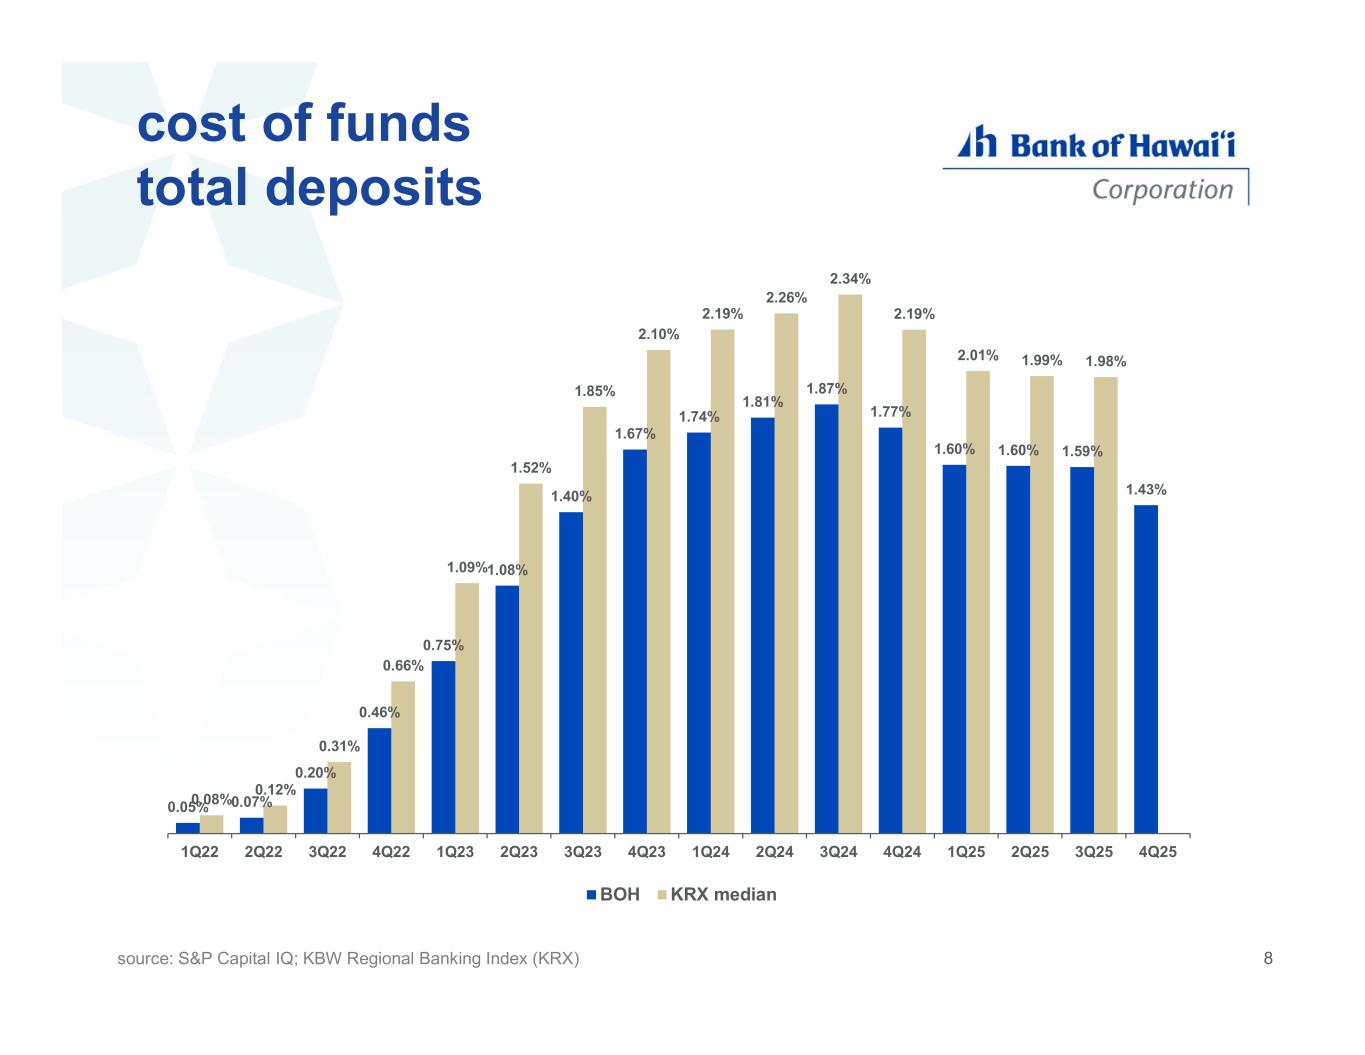
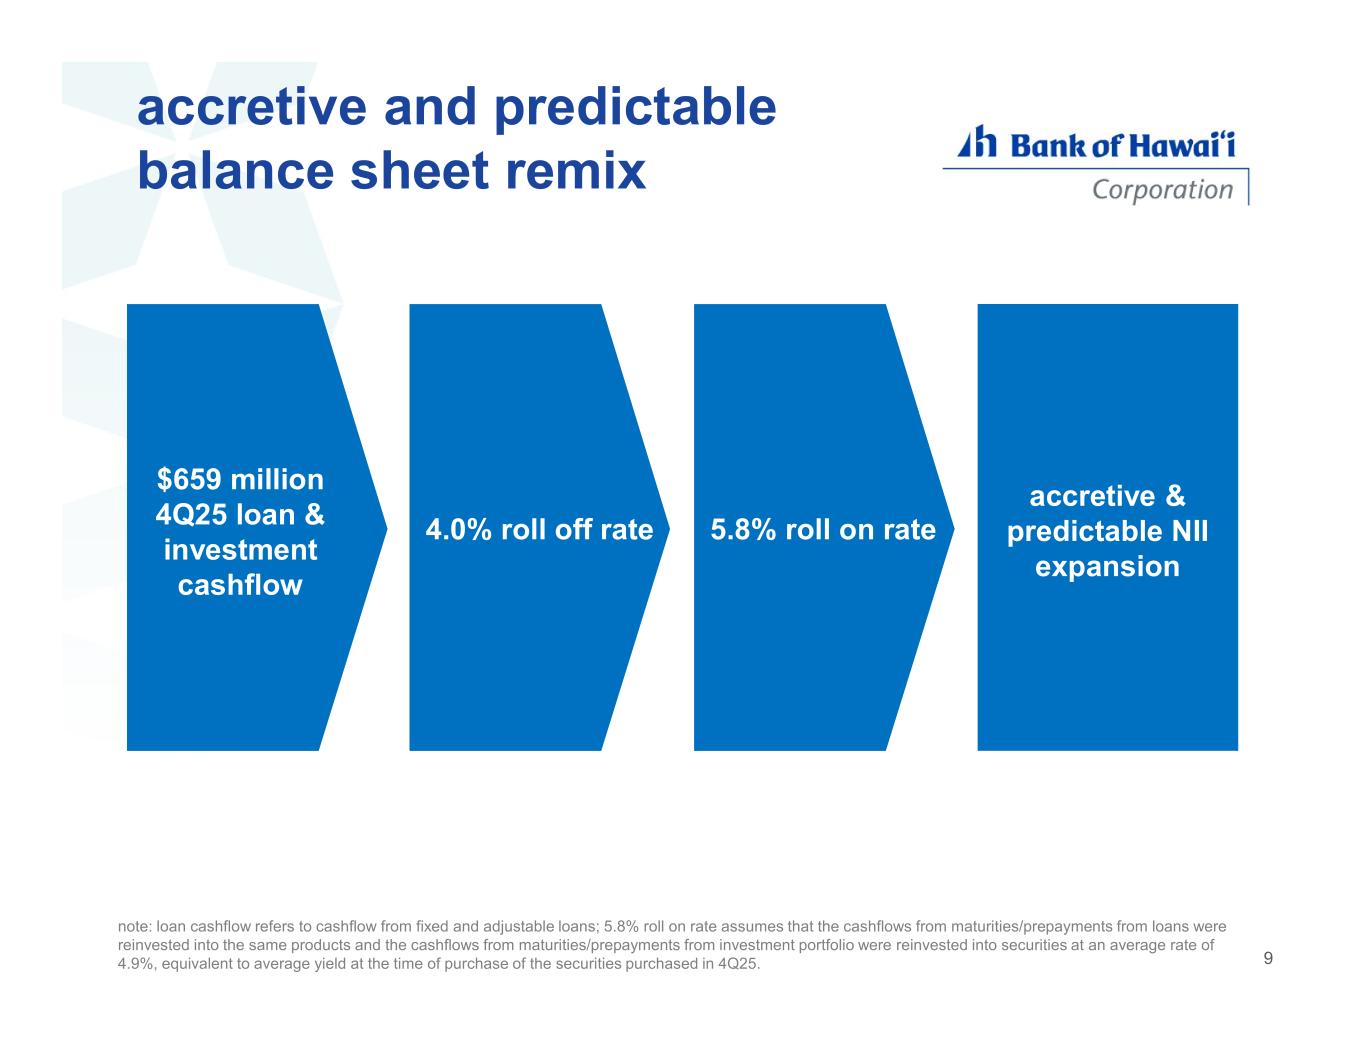
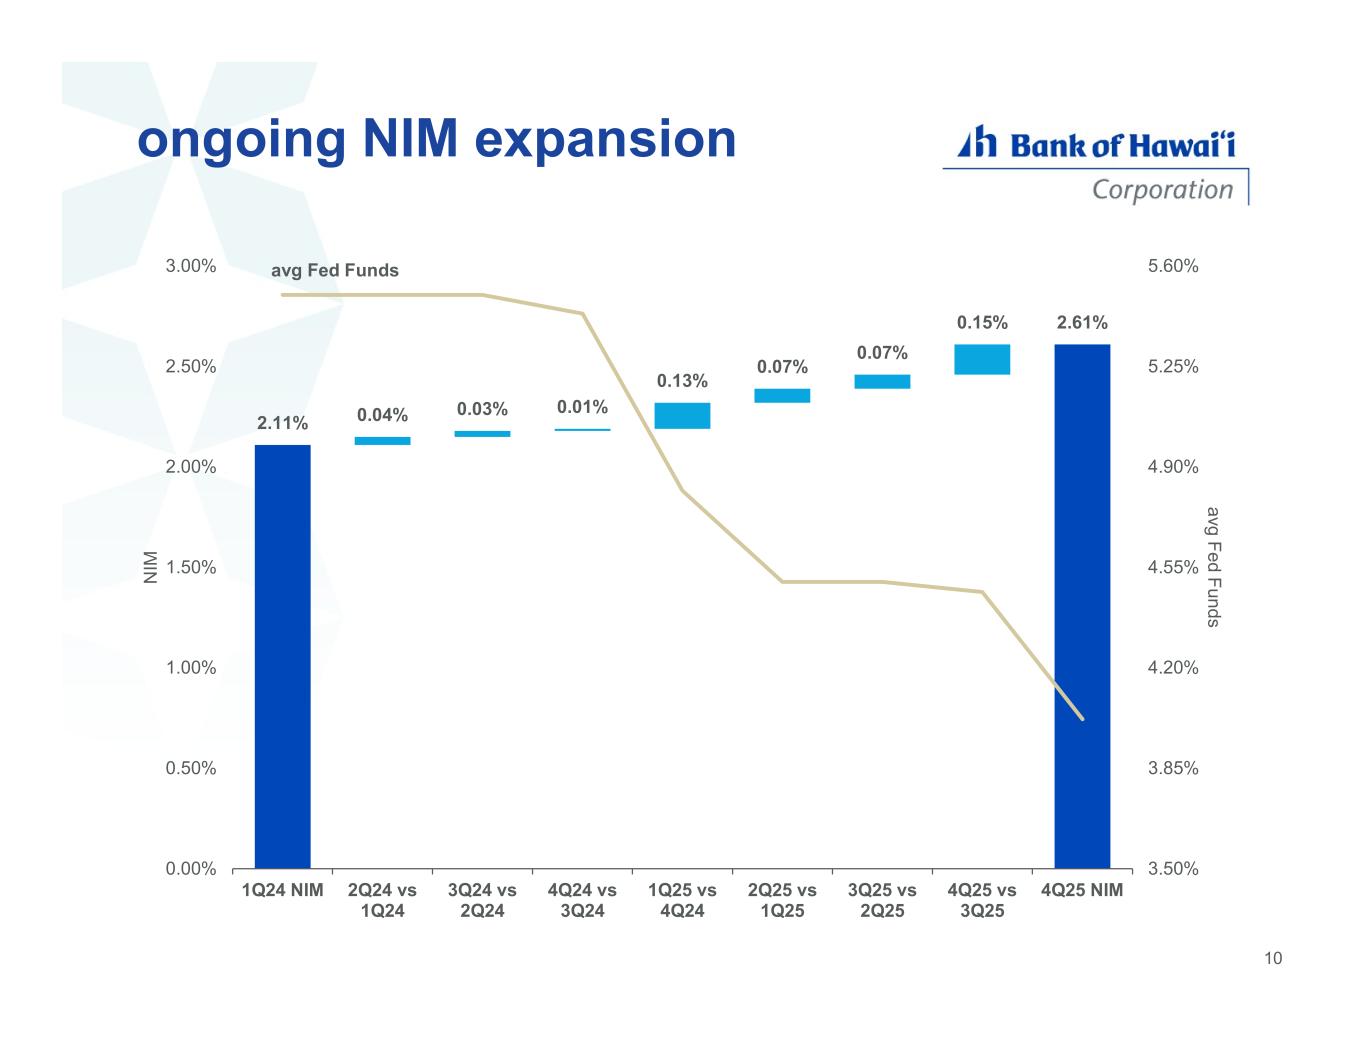
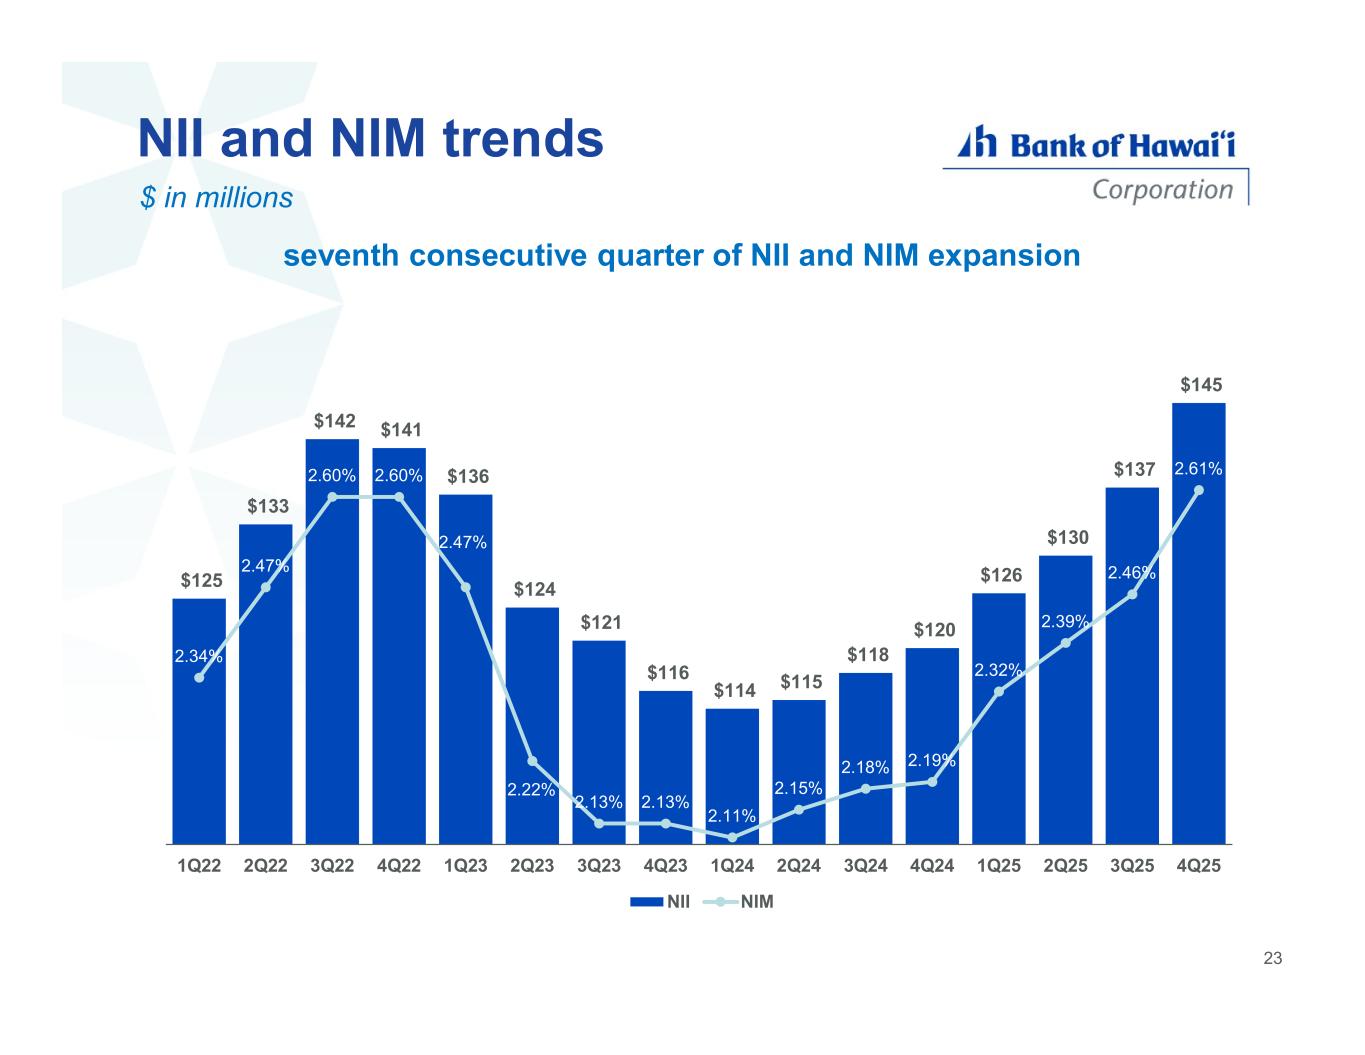
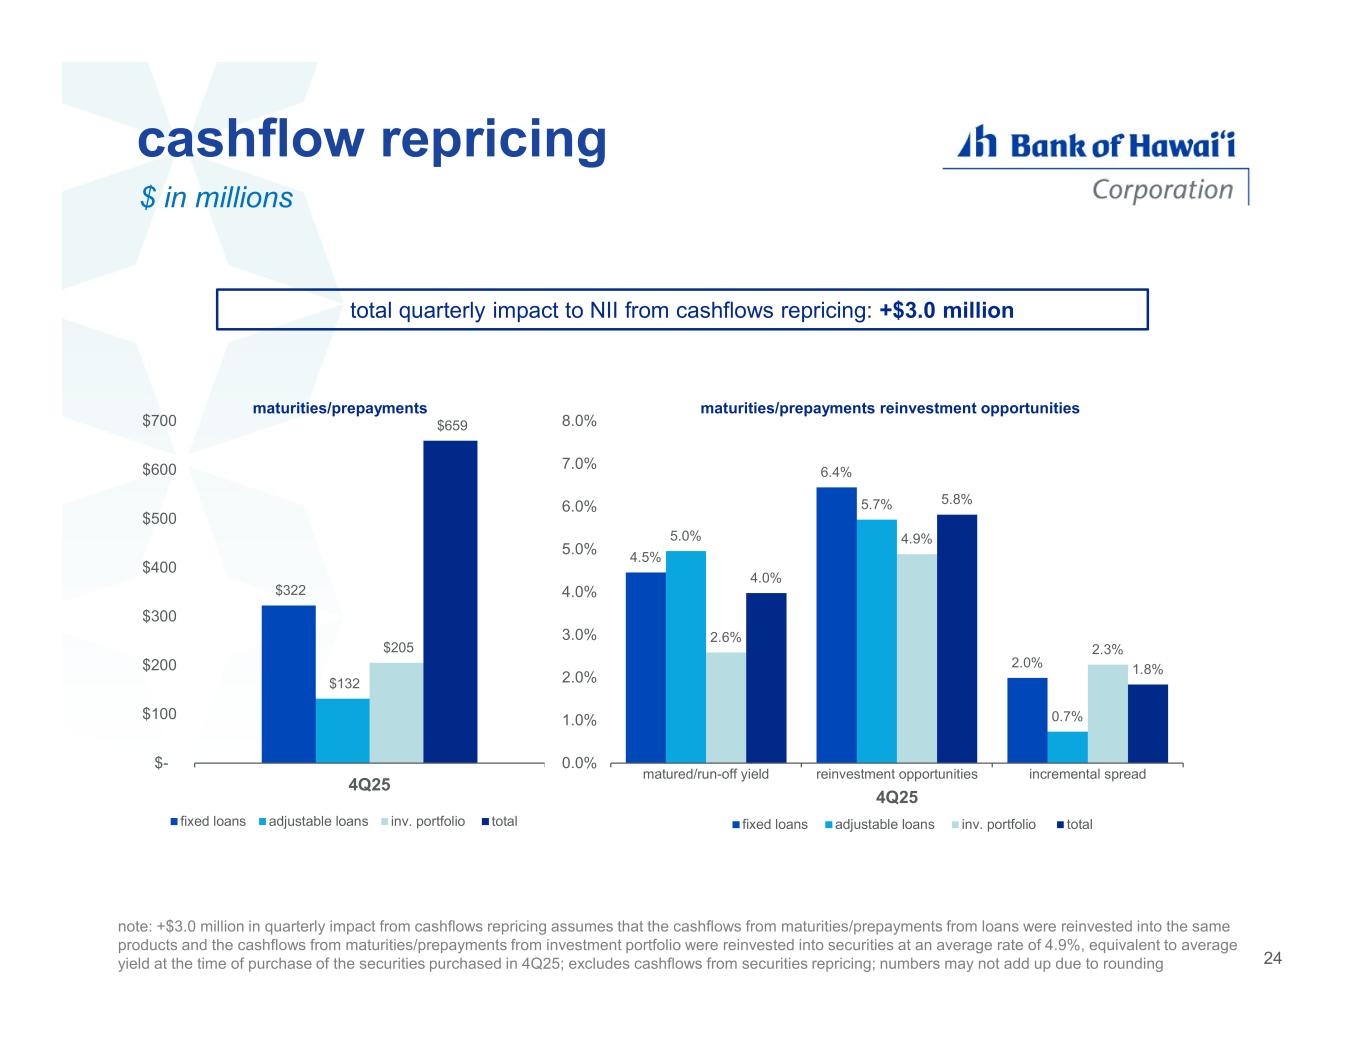
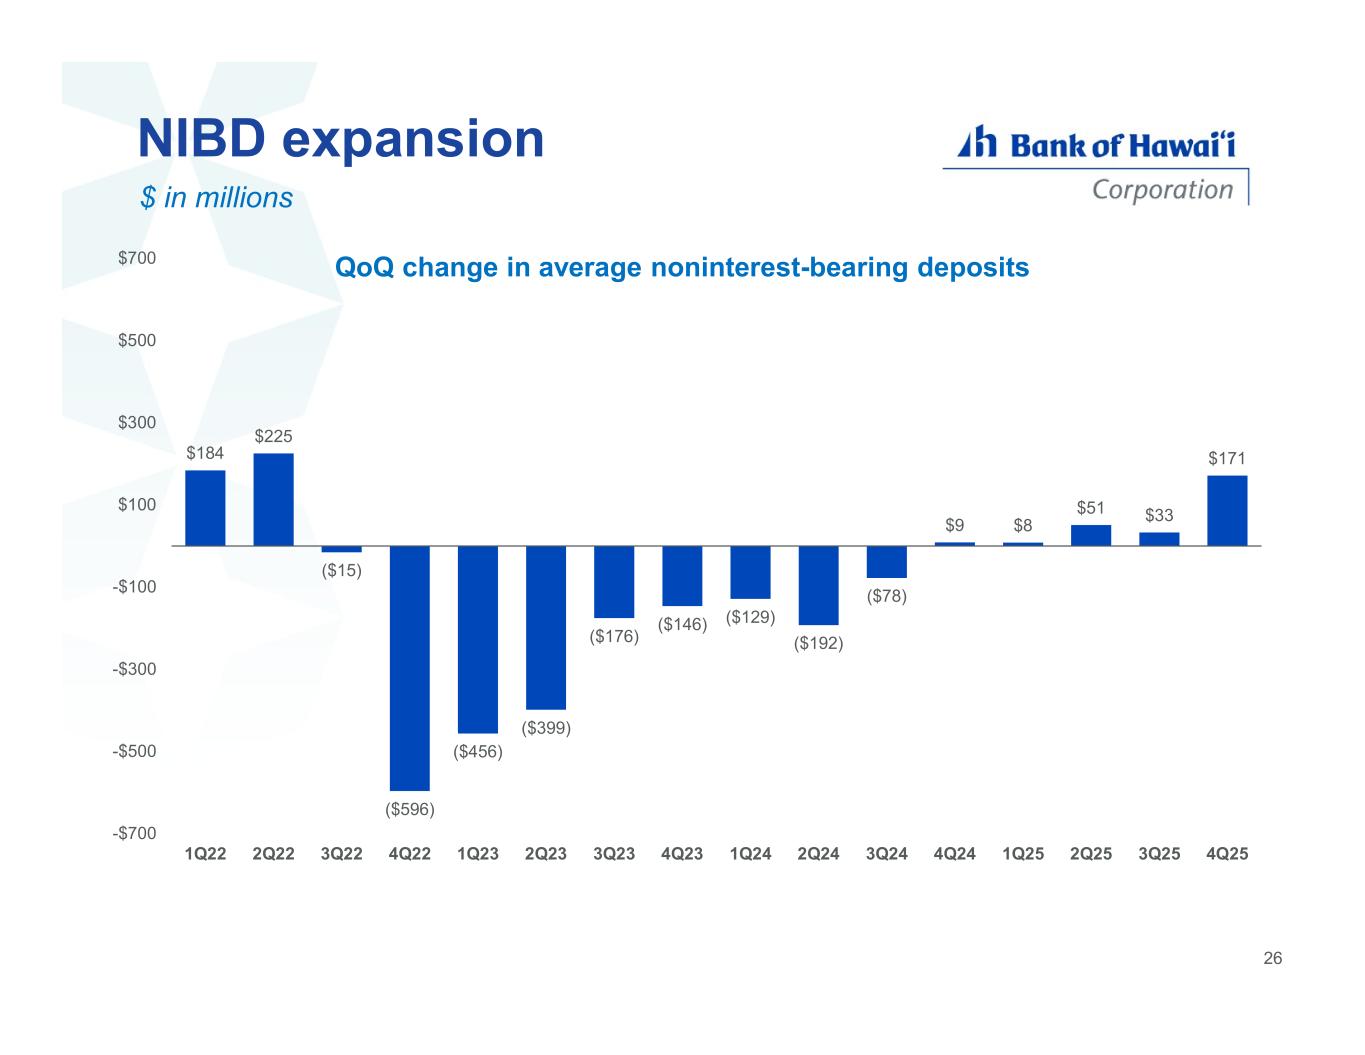
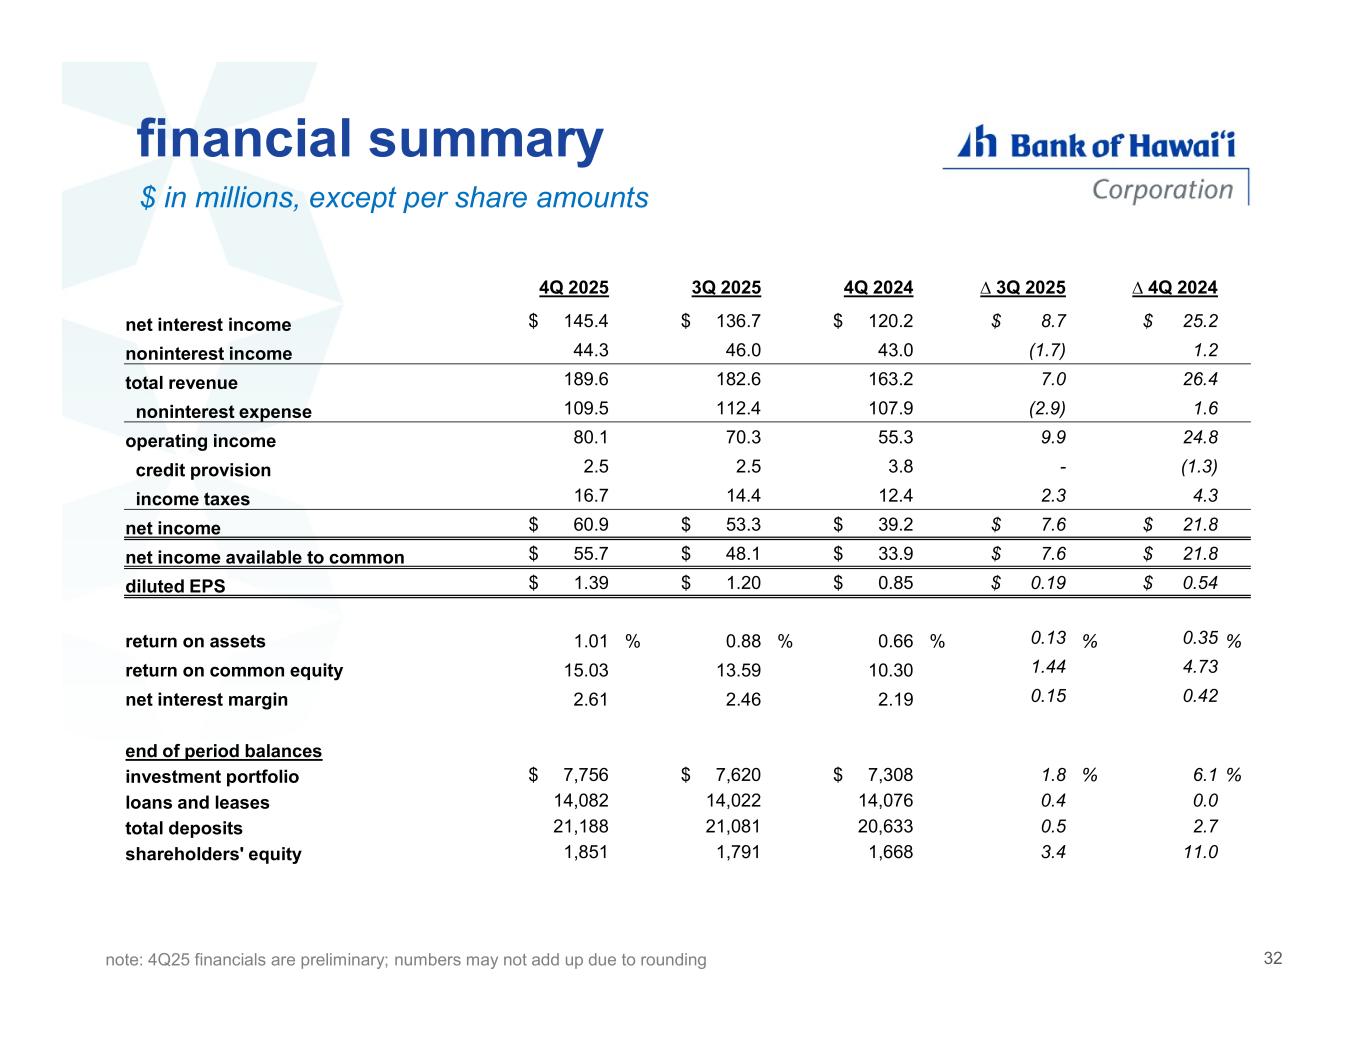
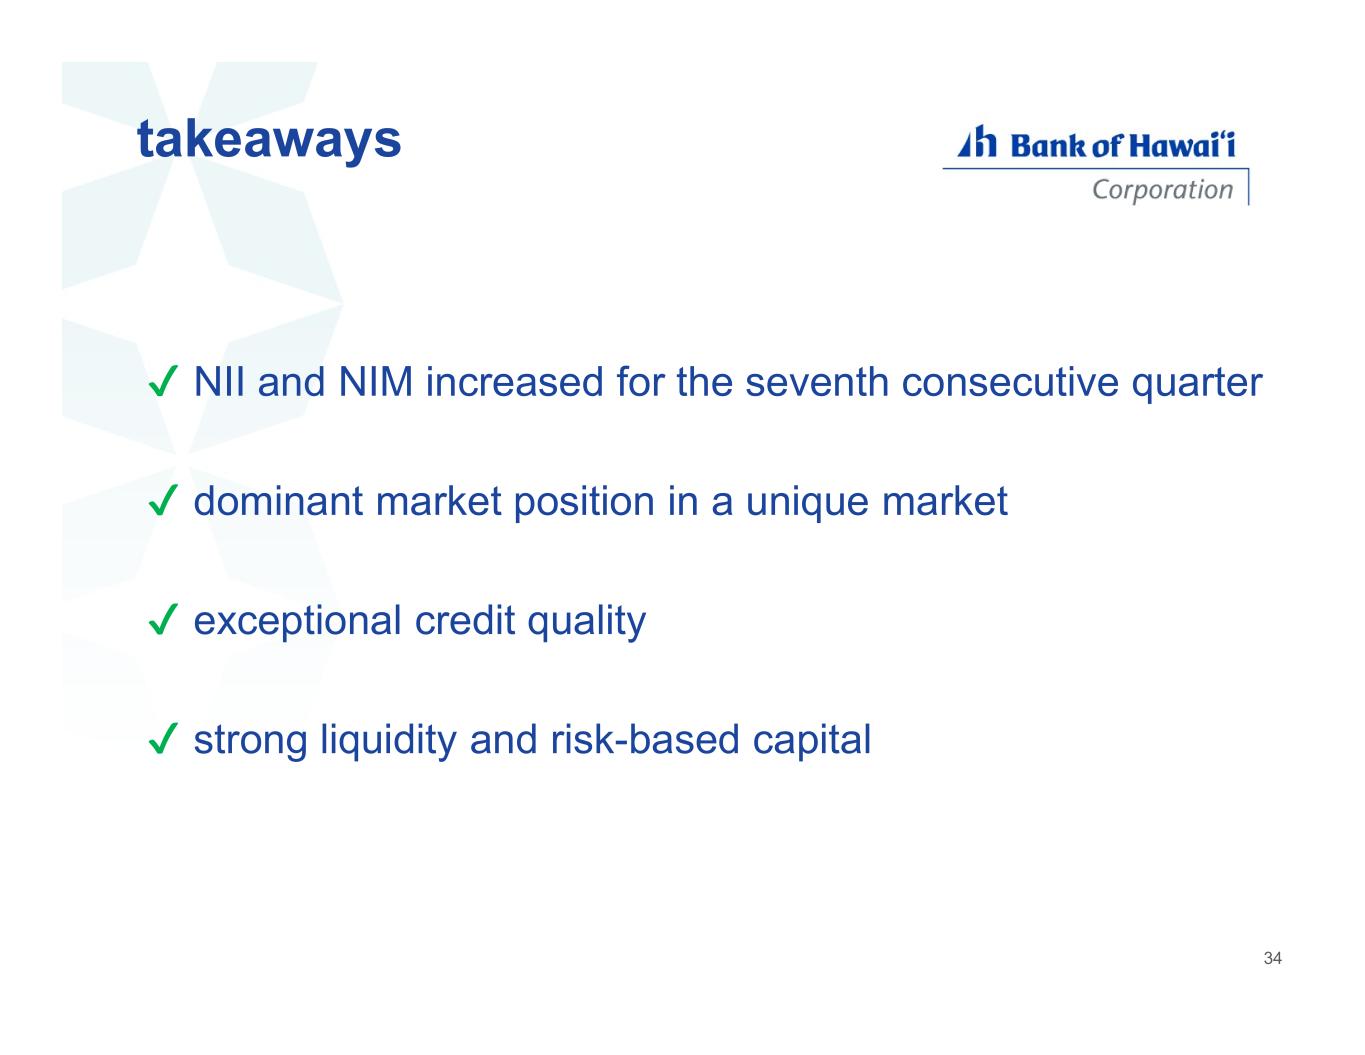
Thanks, Jang. Good morning or good afternoon, everyone. Thank you for your continued interest in Bank of Hawaii. We recorded yet another set of strong results in the fourth quarter. Fully diluted earnings per share was $1.39 per share, 63% higher than results from a year ago, and 16% higher than last quarter. Yet interest margin improved for the seventh straight quarter up 15 basis points to 2.61%. Return on common equity improved to 15%. Loans and deposits both grew modestly in the quarter. Importantly, non-interest-bearing demand deposits grew 6.6% on a linked basis. Credit quality remained and remains pristine. I'll now touch on some operating highlights. Brad Shererson will briefly update you on credit quality, and Brad Sattenberg will dive a little deeper into the financials. As you know, Bank of Hawaii has a unique business model that creates superior risk-adjusted returns by leveraging our unique core Hawaii market, our dominant brand and market position, and our fortress risk profile. Our market-leading brand position is largely the driver of our market share outperformance, giving us both a robust and durable competitive franchise advantage. Our brand advantage is built on our 125-plus year history in the islands, our physical branch system, and increasingly our digital service, marketing, and commerce capabilities. Over the past 20 years, Bank of Hawaii has delivered market share growth nearly four times greater than that of our next closest competitors. The market share growth continued in 2025, advancing another 40 basis points. We are the clear deposit market share leader in Hawaii. Interest-bearing deposit costs improved by 20 basis points and total cost of funds improved 16 basis points in the quarter. Also in the quarter, we remixed $659 million in fixed-rate loans and investments from a roll-off rate of 4% and into a roll-on rate of 5.8%, helping to improve net interest margins. As I mentioned, Q4 was the seventh consecutive quarter of NIM expansion. In early 2025, we had a goal of achieving a $250 NIM by year-end based on fixed asset repricing, improving deposit remix, and rate cuts. We were gratified to see NIM results for Q4 well exceeding that goal. We believe NIM, by the end of 2026, could come in near the 290 range. Our fortress credit position is a longstanding strength of bank FOI. The portfolio is diversified by product type, predominantly secured, and possessing superior long-term loss experience. We dynamically manage our credit portfolio, actively managing off loan categories that that we find not to meet our stringent loss standards. And now, let me turn the call over to Brad Shererson, who will provide a brief overview on credit.
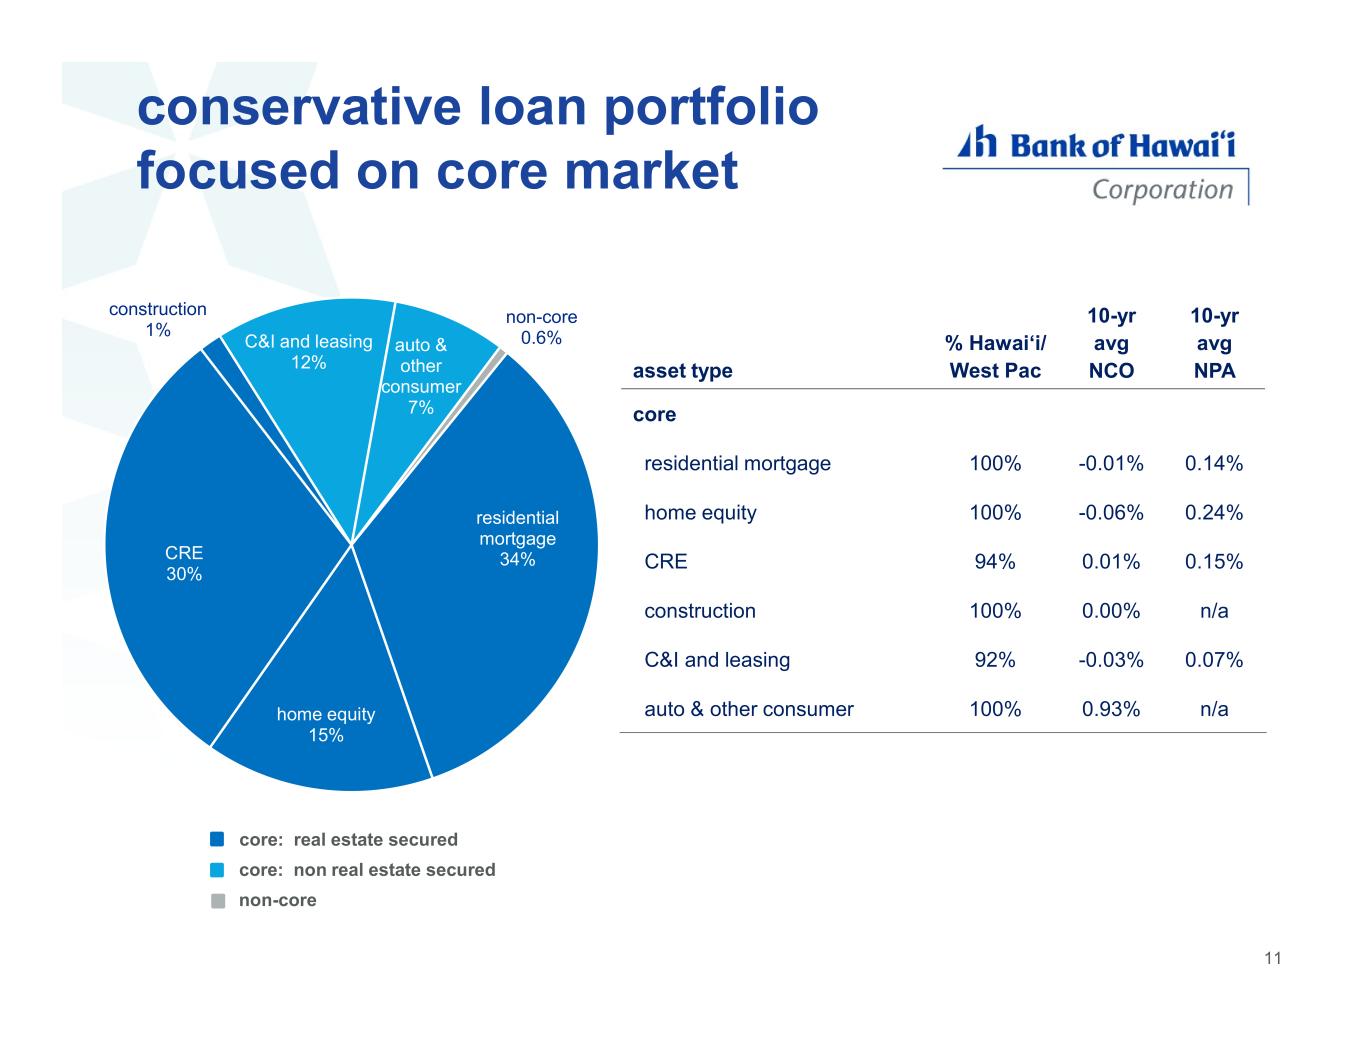
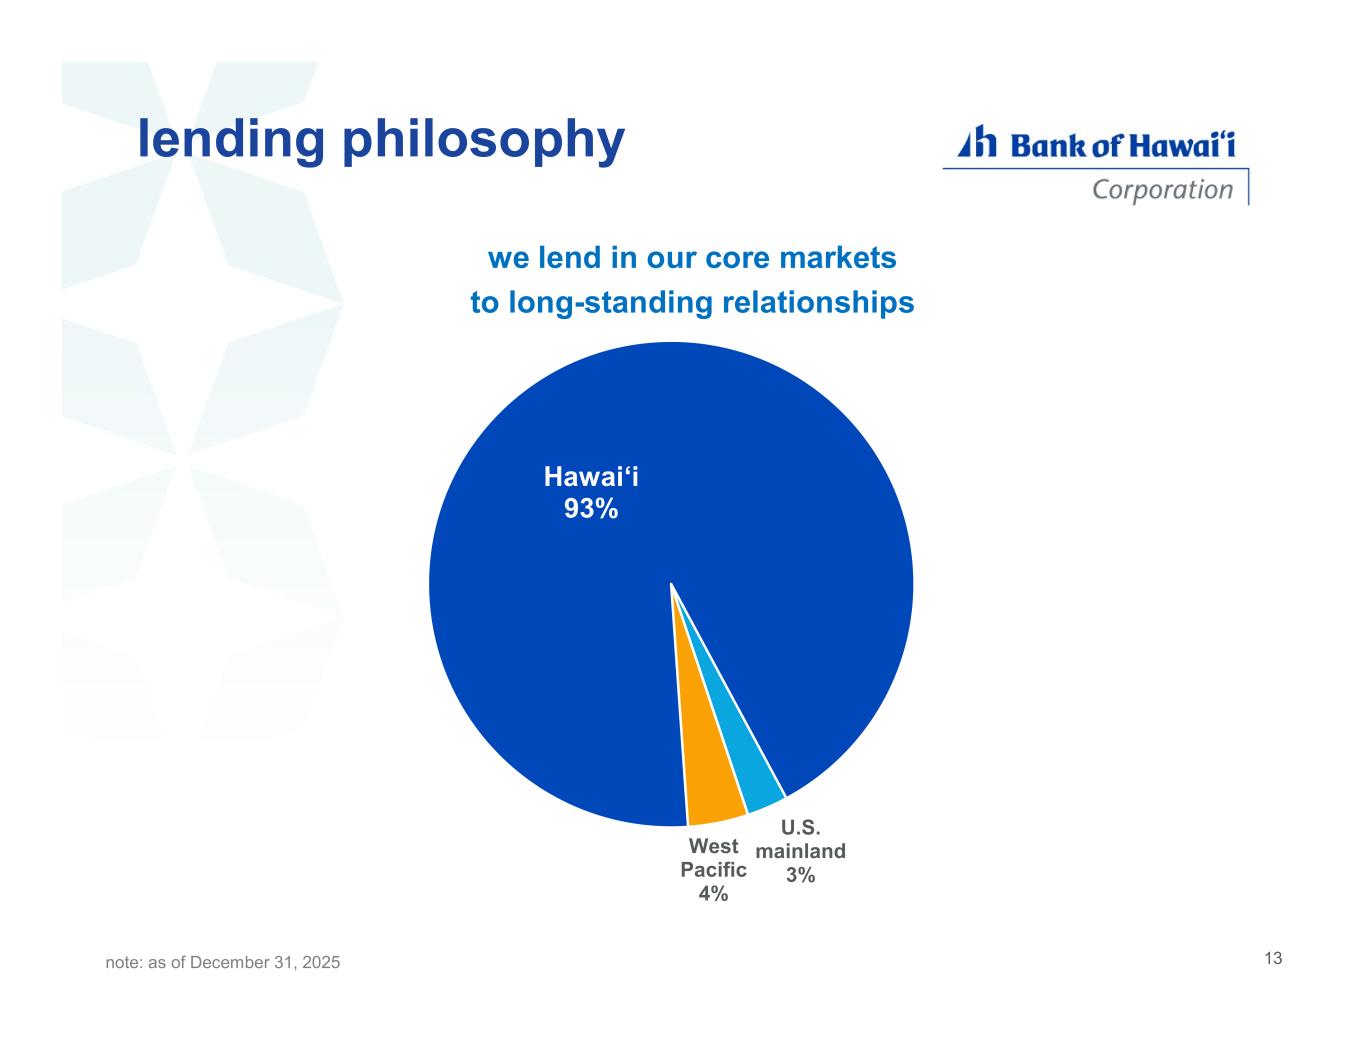
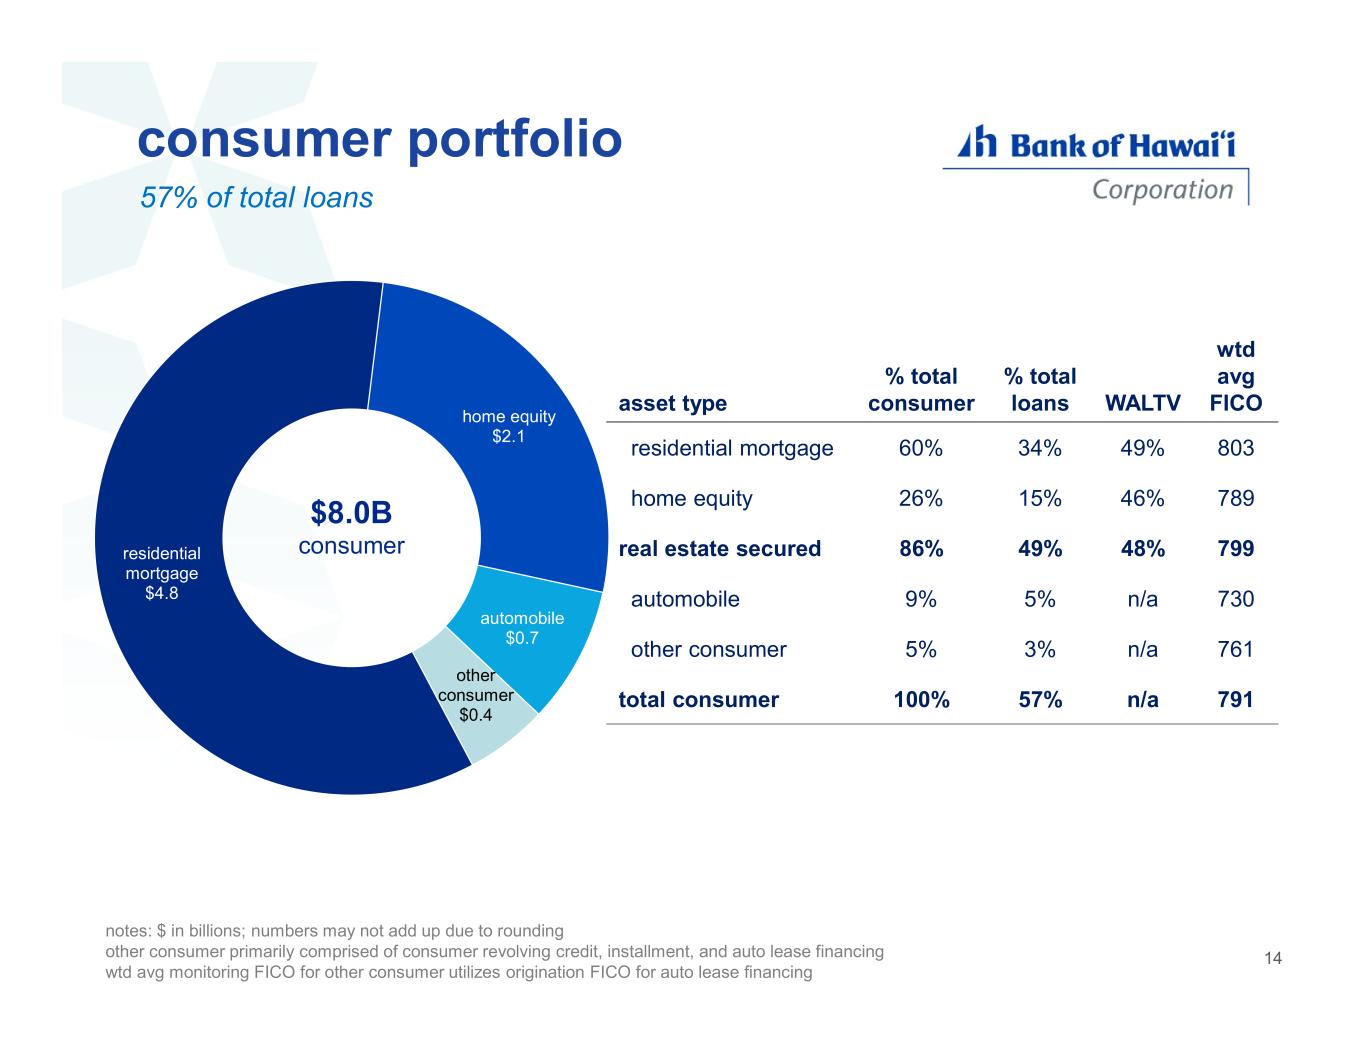
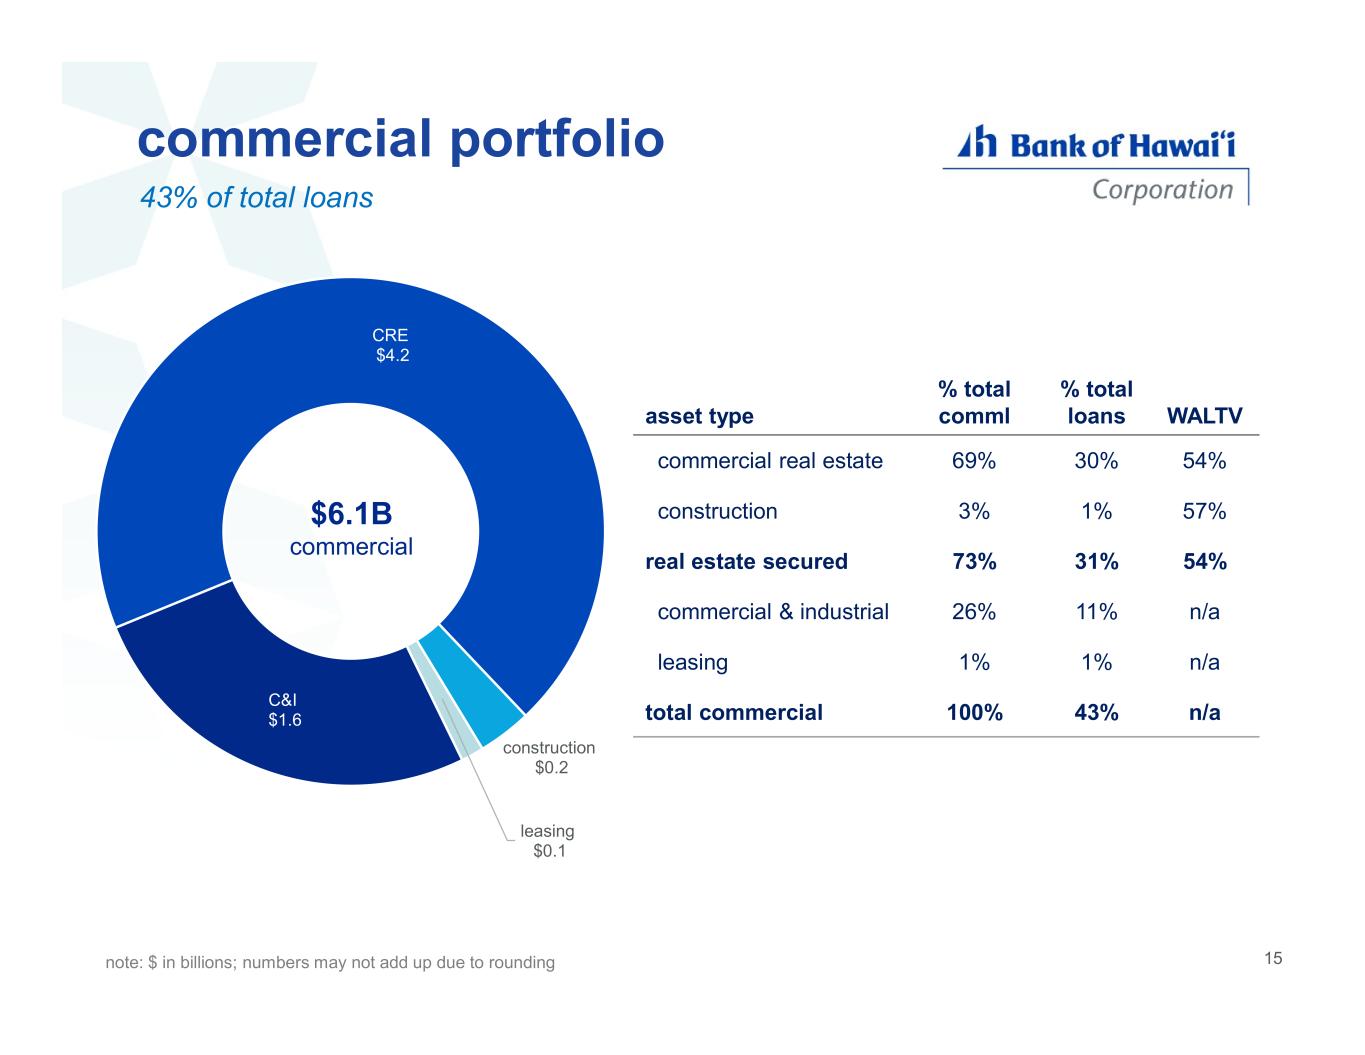
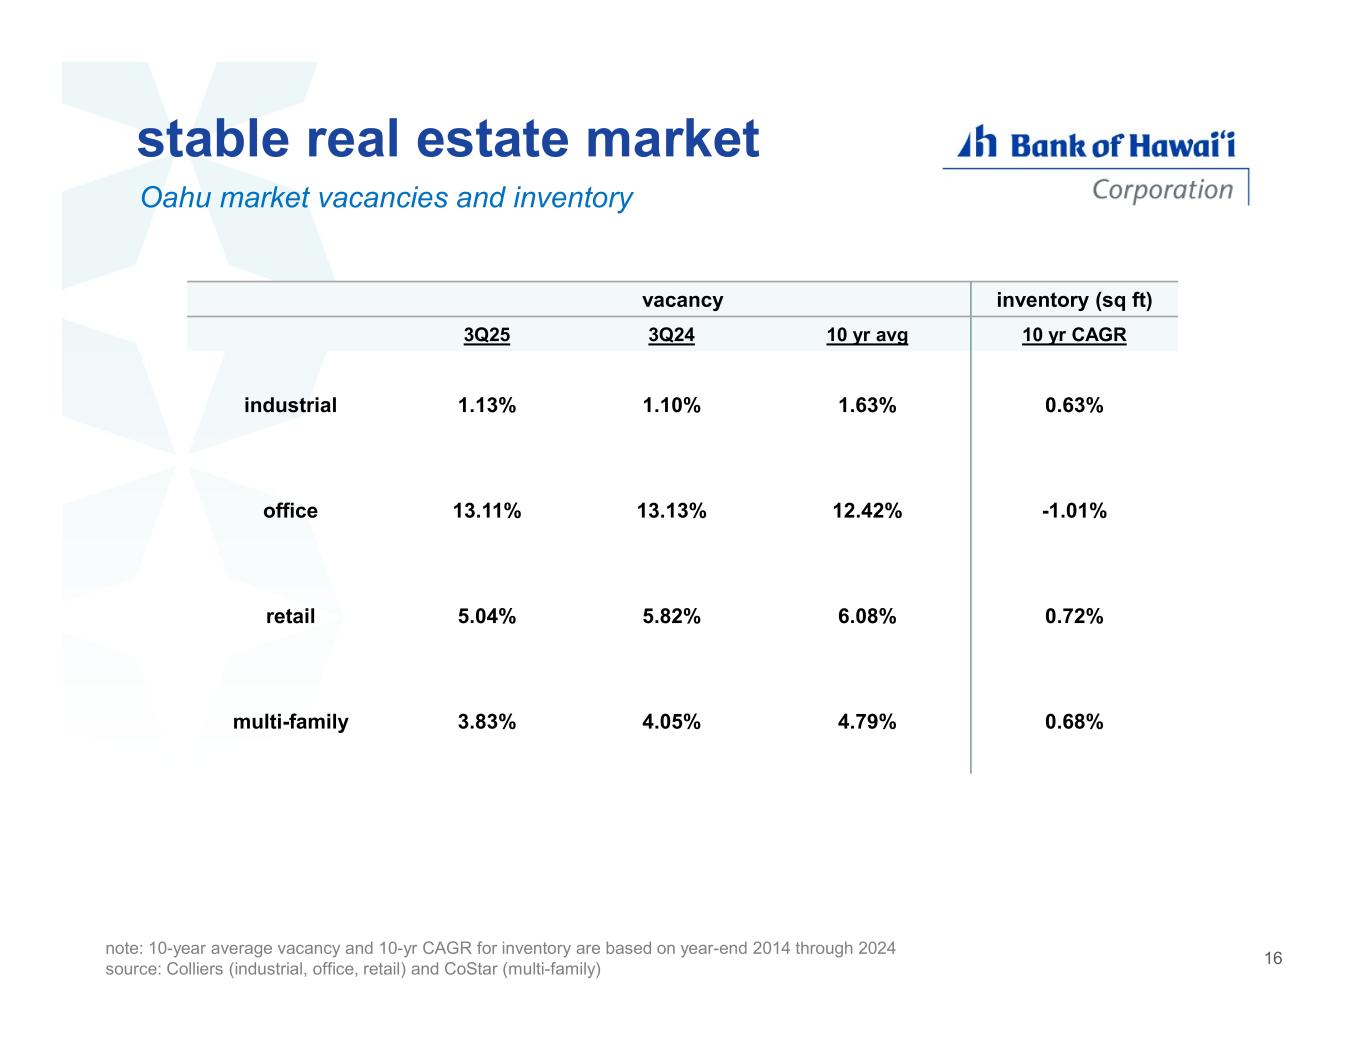
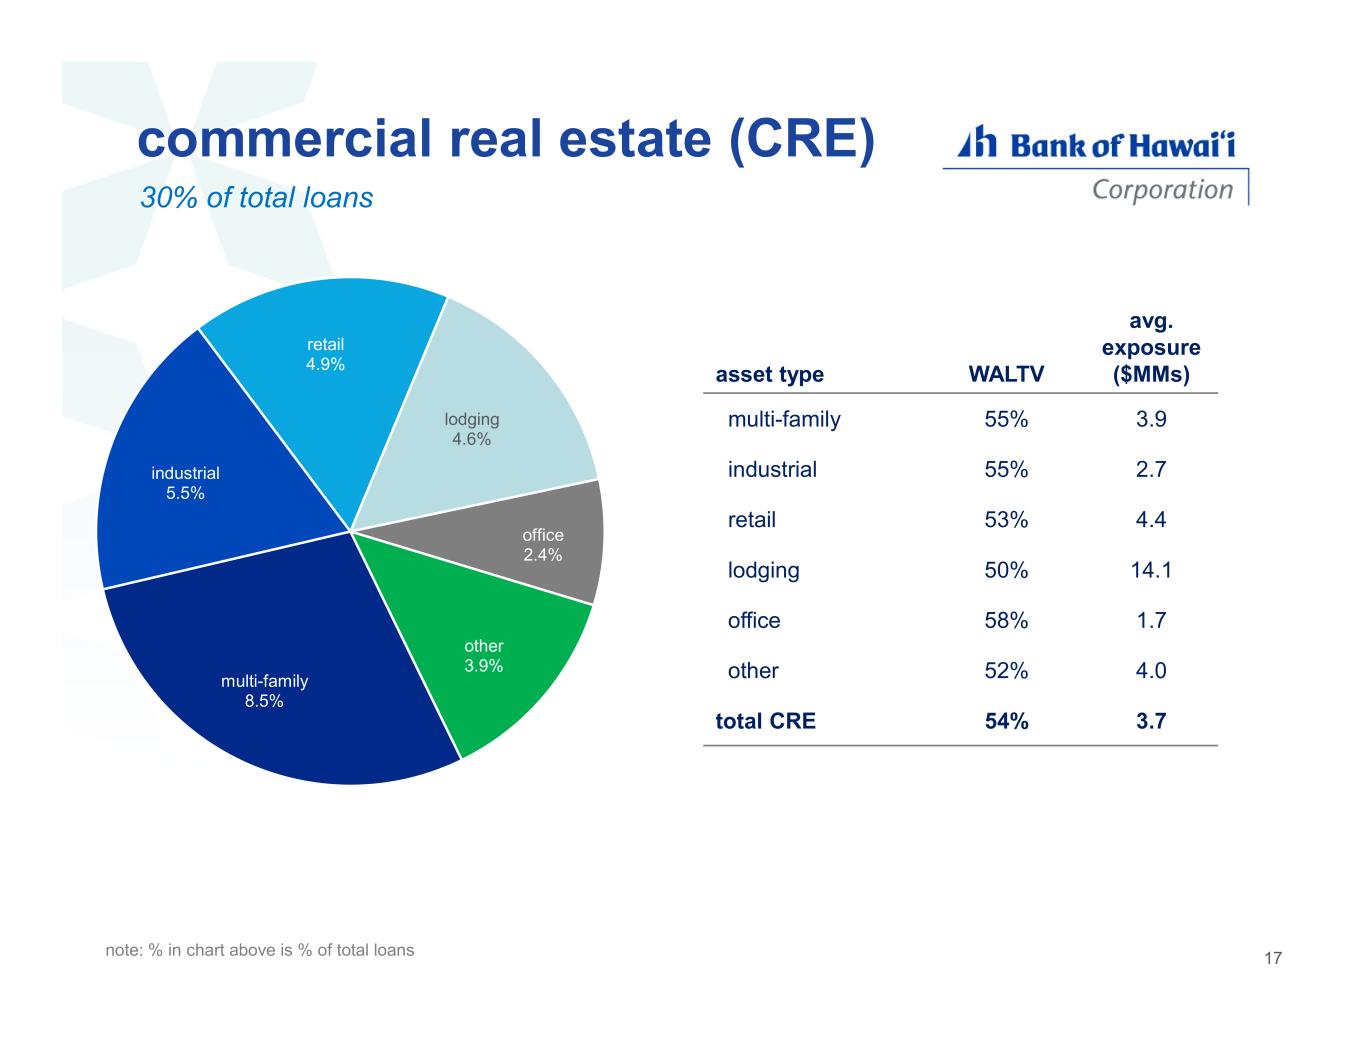
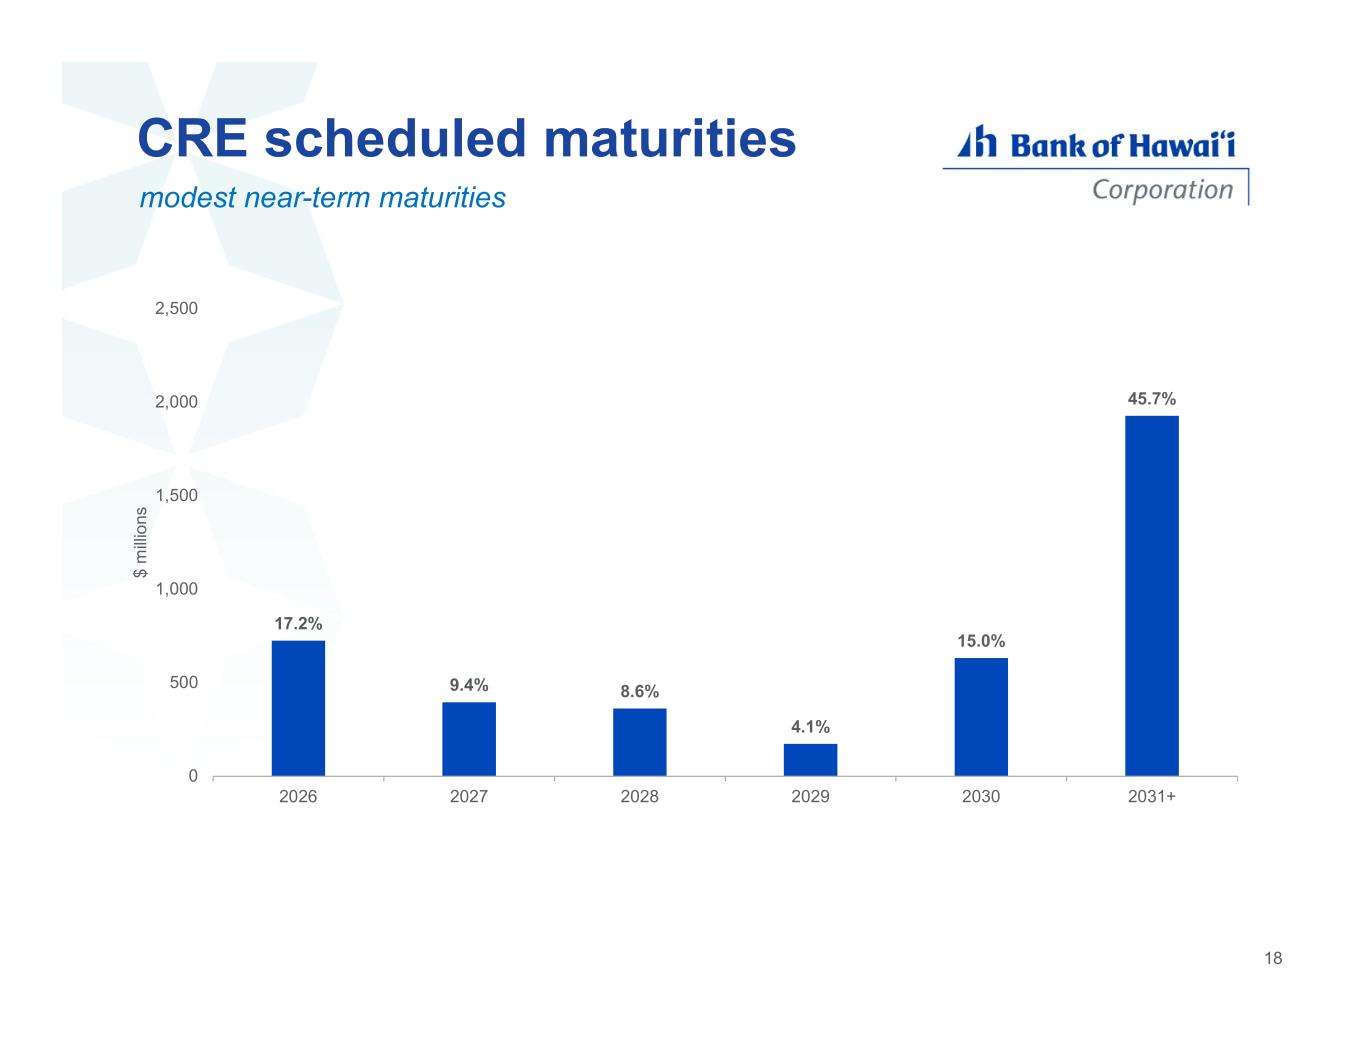
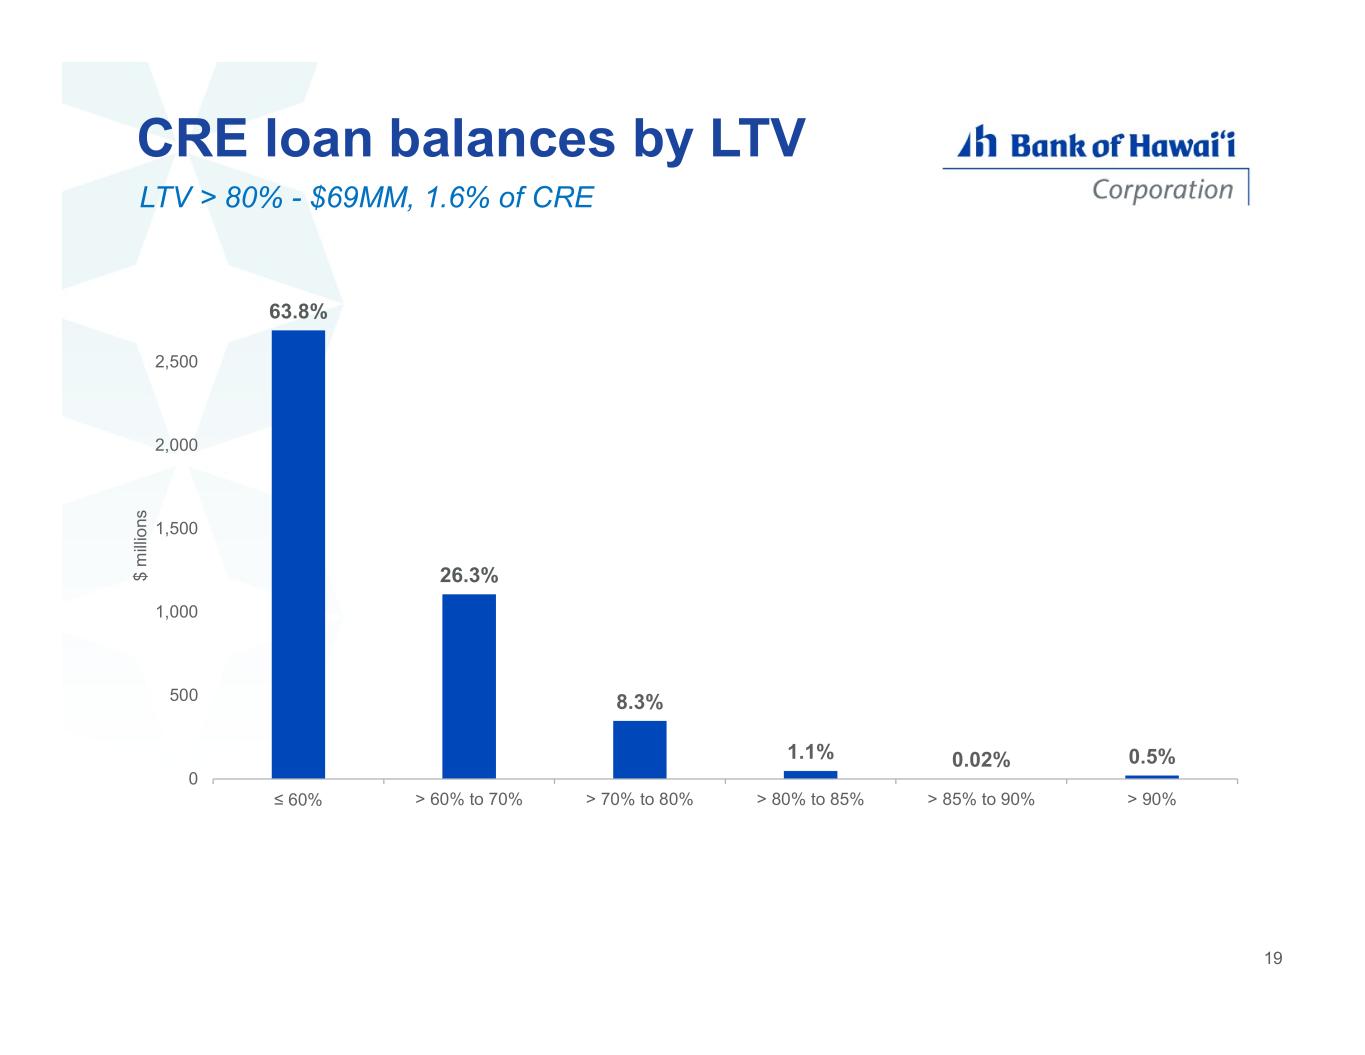
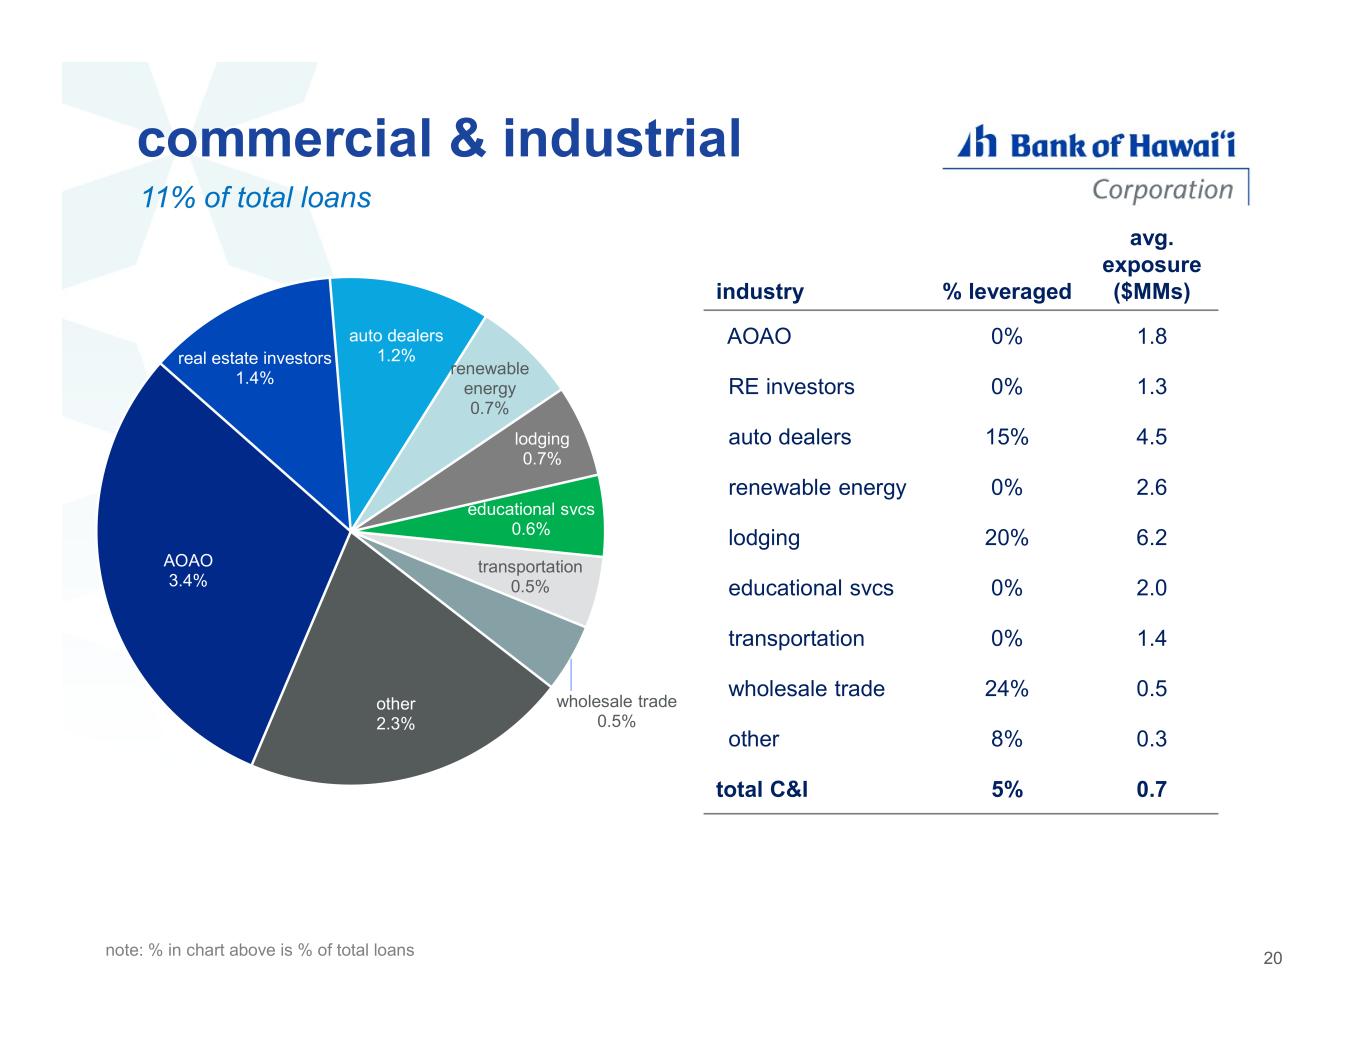
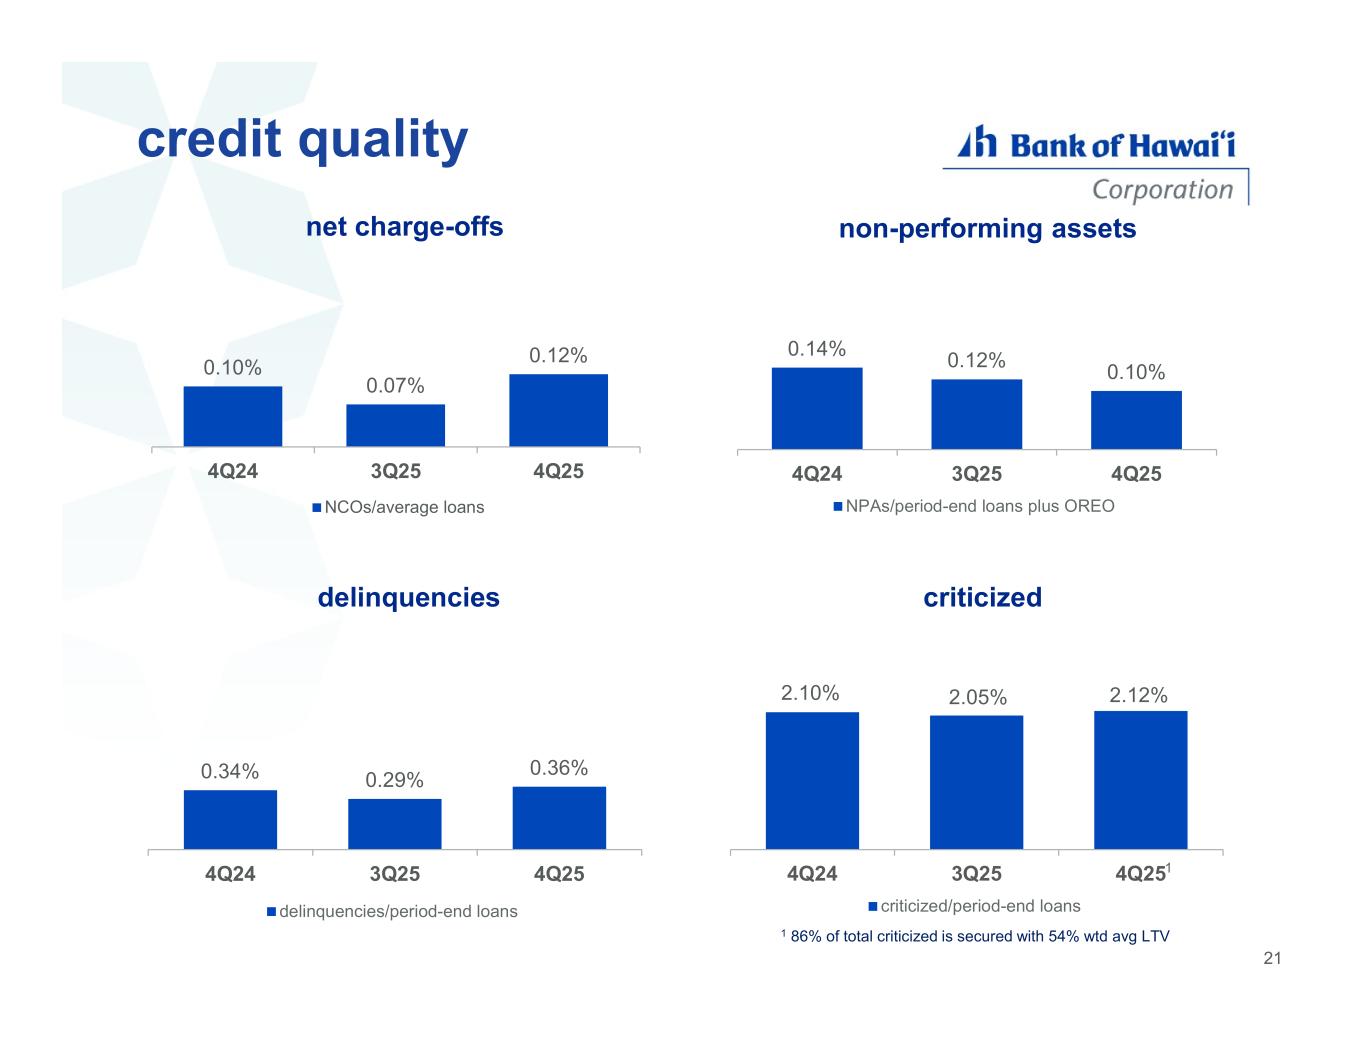
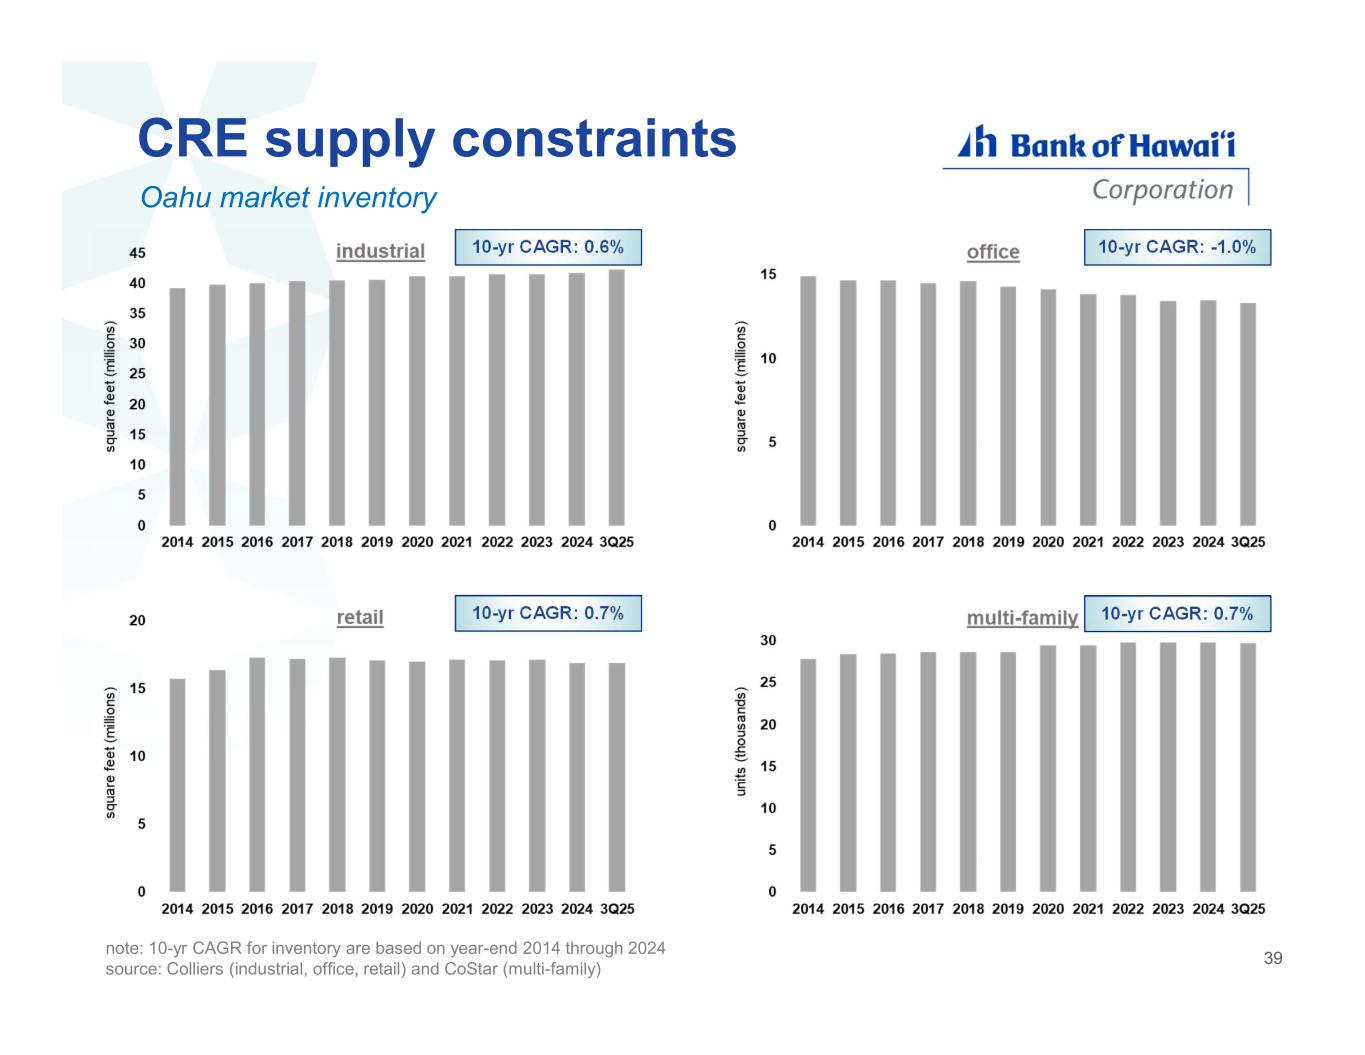
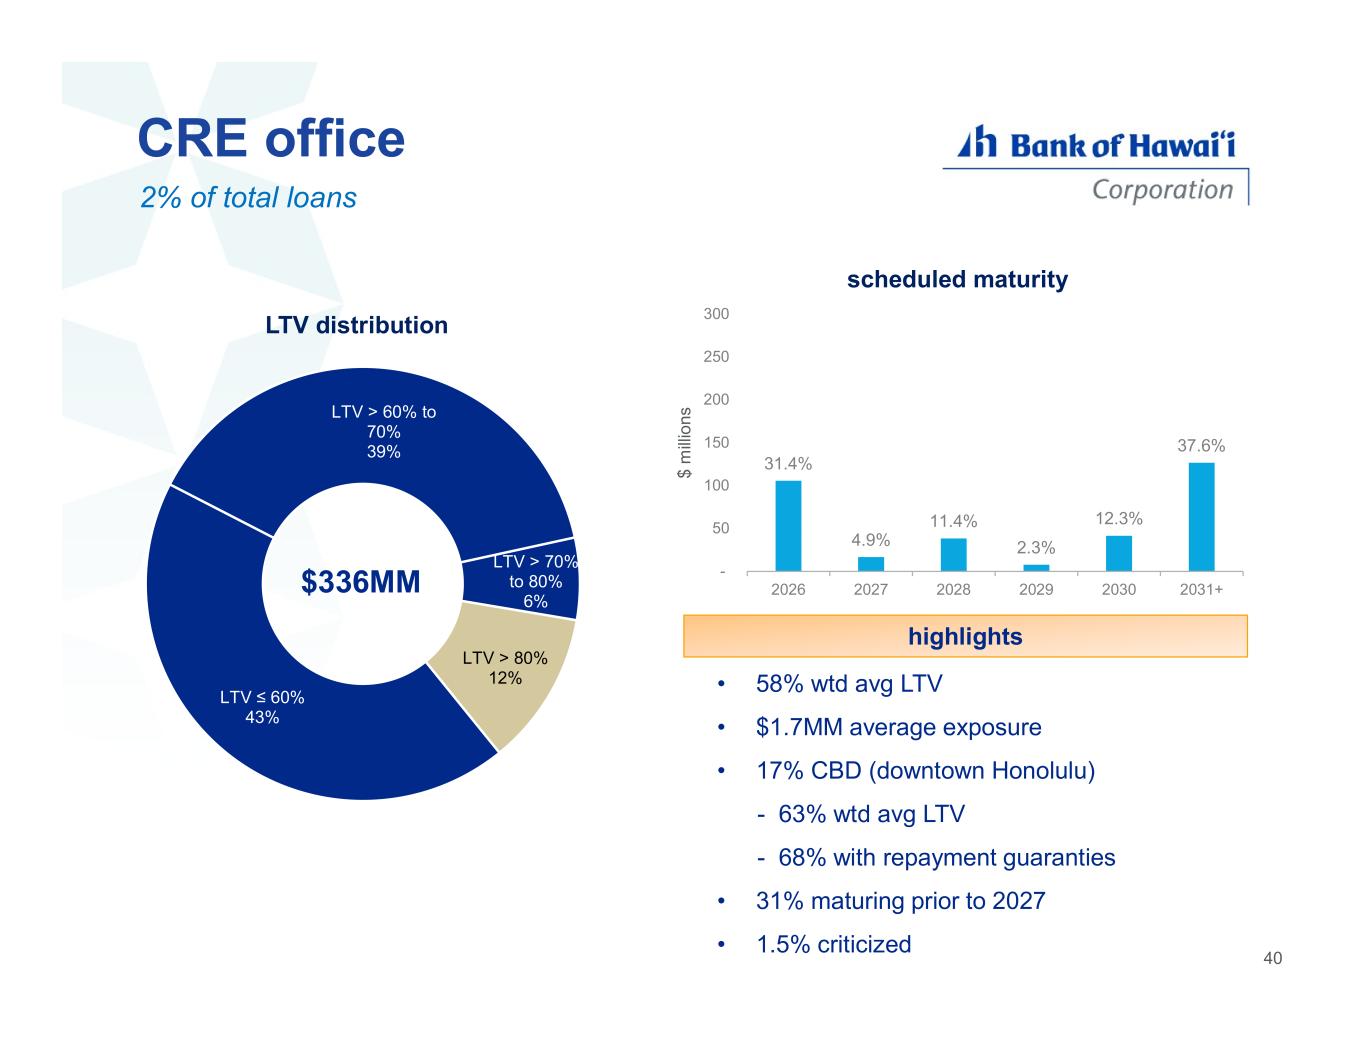
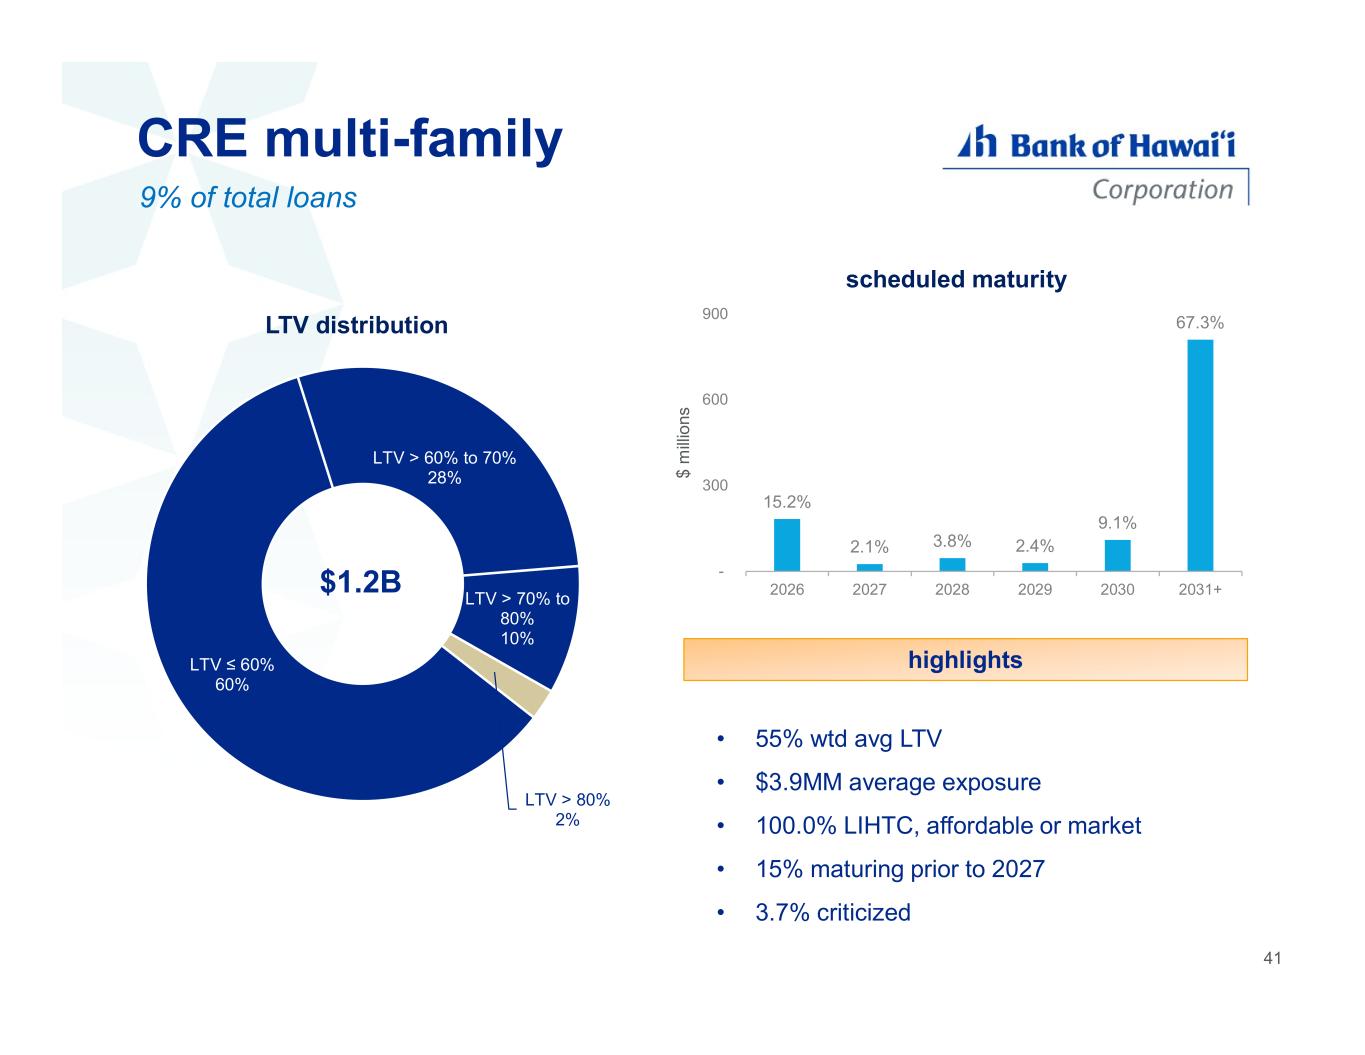
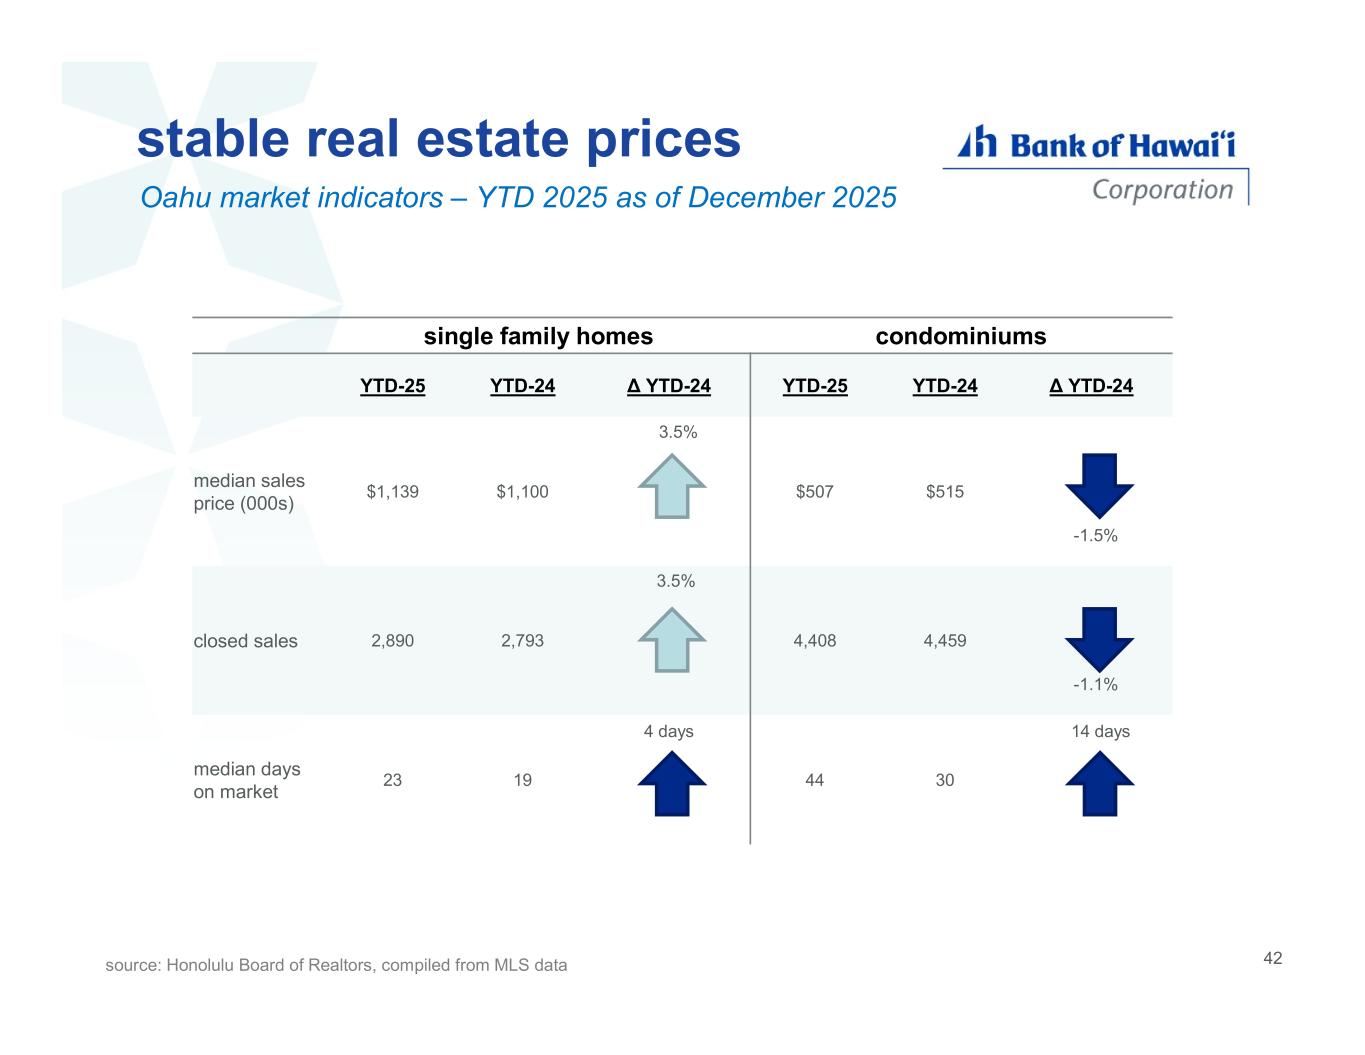
Thanks, Peter. I'll begin with an overview of our credit portfolio and conclude with asset quality metrics. And as you will see, our performance has remained strong, consistent with prior quarters. Turning to our lending philosophy, the Bank of Hawaii is dedicated to serving our local communities, lending primarily within our core markets where our expertise allows us to make informed and disciplined credit decisions. Our portfolio is built on long-tenured relationships with approximately 60% of both our commercial and consumer clients having been with the bank for more than 10 years. Geographically, our loan book is concentrated in markets we know well. Approximately 93% of loans are based in Hawaii, with 4% in the Western Pacific and just 3% on the mainland, primarily supporting existing clients who operate both locally and on the mainland. Our loan portfolio remains well balanced between consumer and commercial exposure. Consumer loans represent 57% of total loans or approximately $8 billion. Within the consumer portfolio, 86% consists of residential mortgage and home equity loans with a weighted average LTV of 48% and weighted average FICO score of 799. The remaining 14% of consumer loans are comprised of auto and personal lending. Credit quality in these segments also remains strong, with average FICO scores of 730 for auto loans and 761 for personal loans. Turning to commercial lending, the portfolio totals $6.1 billion, representing 43% of total loans. 73% is secured by real estate with a weighted average LTV of 54%, reflecting our ongoing emphasis on collateral protection. CRE remains the largest component of the commercial book, totaling $4.2 billion, or 30% of total loans. And in Oahu, the state's largest CRE market, a combination of consistently low vacancy rates and flat inventory levels continue to support a stable real estate market. Across industrial, office, retail, and multifamily property types, vacancy rates remain below or close to their 10-year averages. Total office space on Oahu has declined by approximately 10% over the past decade, driven primarily by conversions to multifamily residential and lodging. This structural reduction in supply combined with the return-to-office trend has brought vacancy rates closer to long-term averages and well below national levels. Our CRE portfolio remains well diversified, with no single property type exceeding 8.5% of total loans. Conservative underwriting practices continue to be applied consistently, with weighted average LTVs below 60% across all CRE categories. In addition, diversification within each segment remains strong, supported by modest average loan sizes. Scheduled maturities are also well-balanced, with more than 60% of CRE loans maturing in 2030 or later, reducing near-term refinancing risk. Looking at the distribution of LTVs, there isn't much tail risk in our CRE portfolio. Only 1.6% of CRE loans have greater than 80 percent LTV. C&I accounts for 11 percent of total loans. This portfolio is diversified across industries characterized by modest average loan sizes with very little leveraged lending. Turning to asset quality, credit metrics continued to perform exceptionally well. Net charge-offs totaled $4.1 million, or 12 basis points annualized. That's up five basis points from linked quarter and two basis points higher year over year. Non-performing assets declined to 10 basis points, down two basis points from linked quarter and four basis points year over year. Delinquencies increased to 36 basis points. That's up seven basis points from linked quarter and up two basis points year over year. And criticized loans increased to 2.12% of total loans of seven basis points from linked quarter and two basis points higher year-over-year. Notably, 86% of criticized assets are real estate secured with a weighted average LTV of 54%. And as an update on the allowance for credit losses on loans and leases, the ACL ended a quarter at $146.8 million. That's down $2 million from the linked quarter. the ratio of our ACL to outstandings dropped two basis points to 1.04%. I will now turn the call over to Brad Satenberg for a discussion of our financial performance.
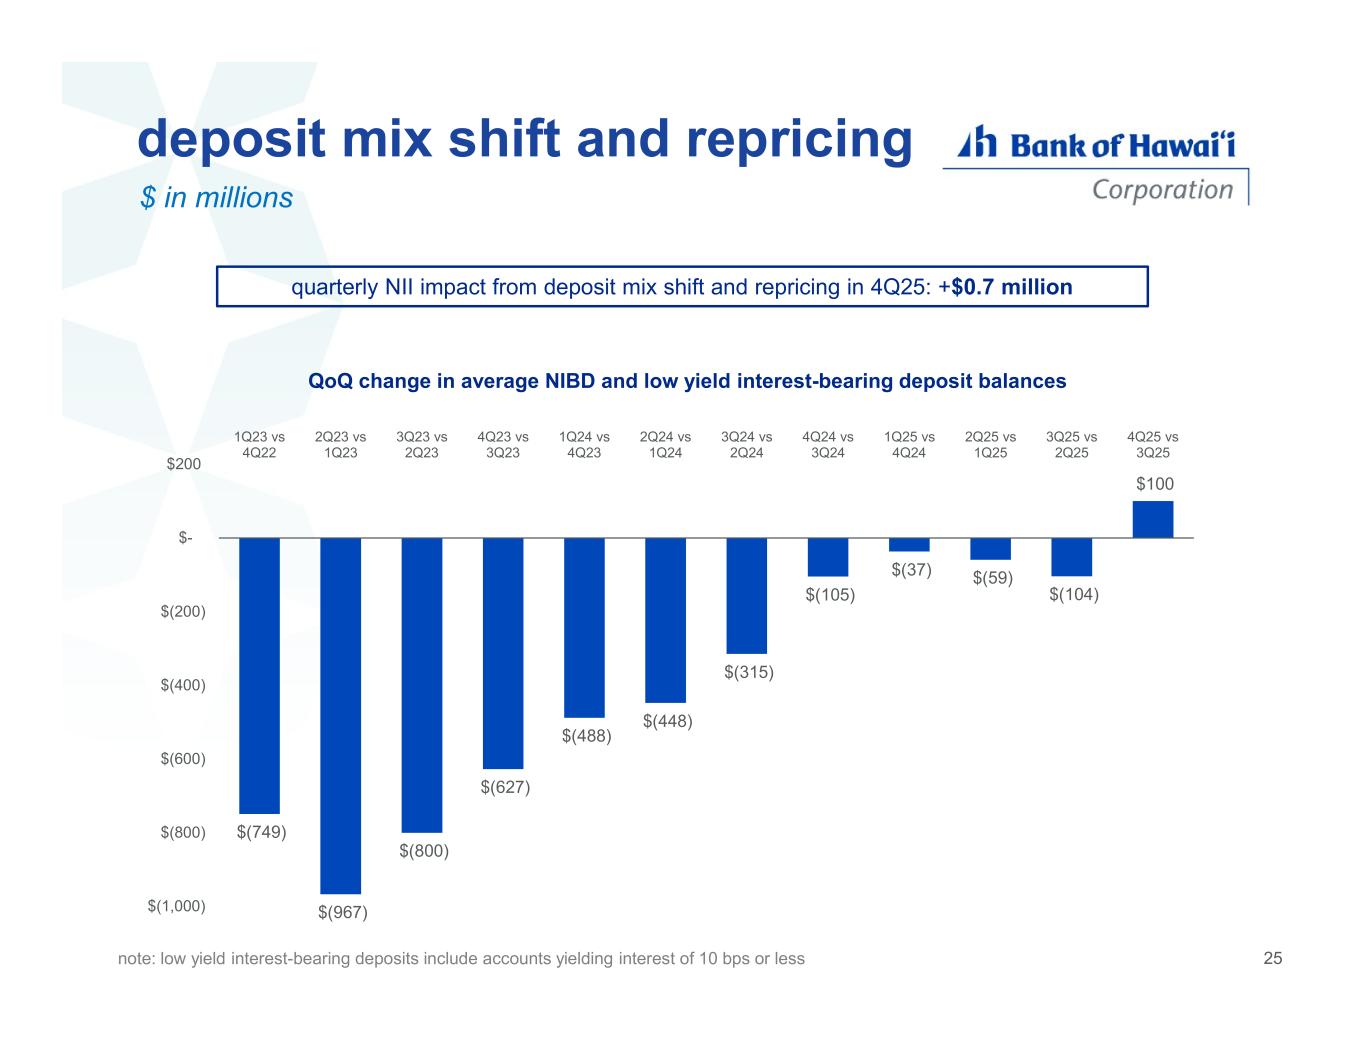
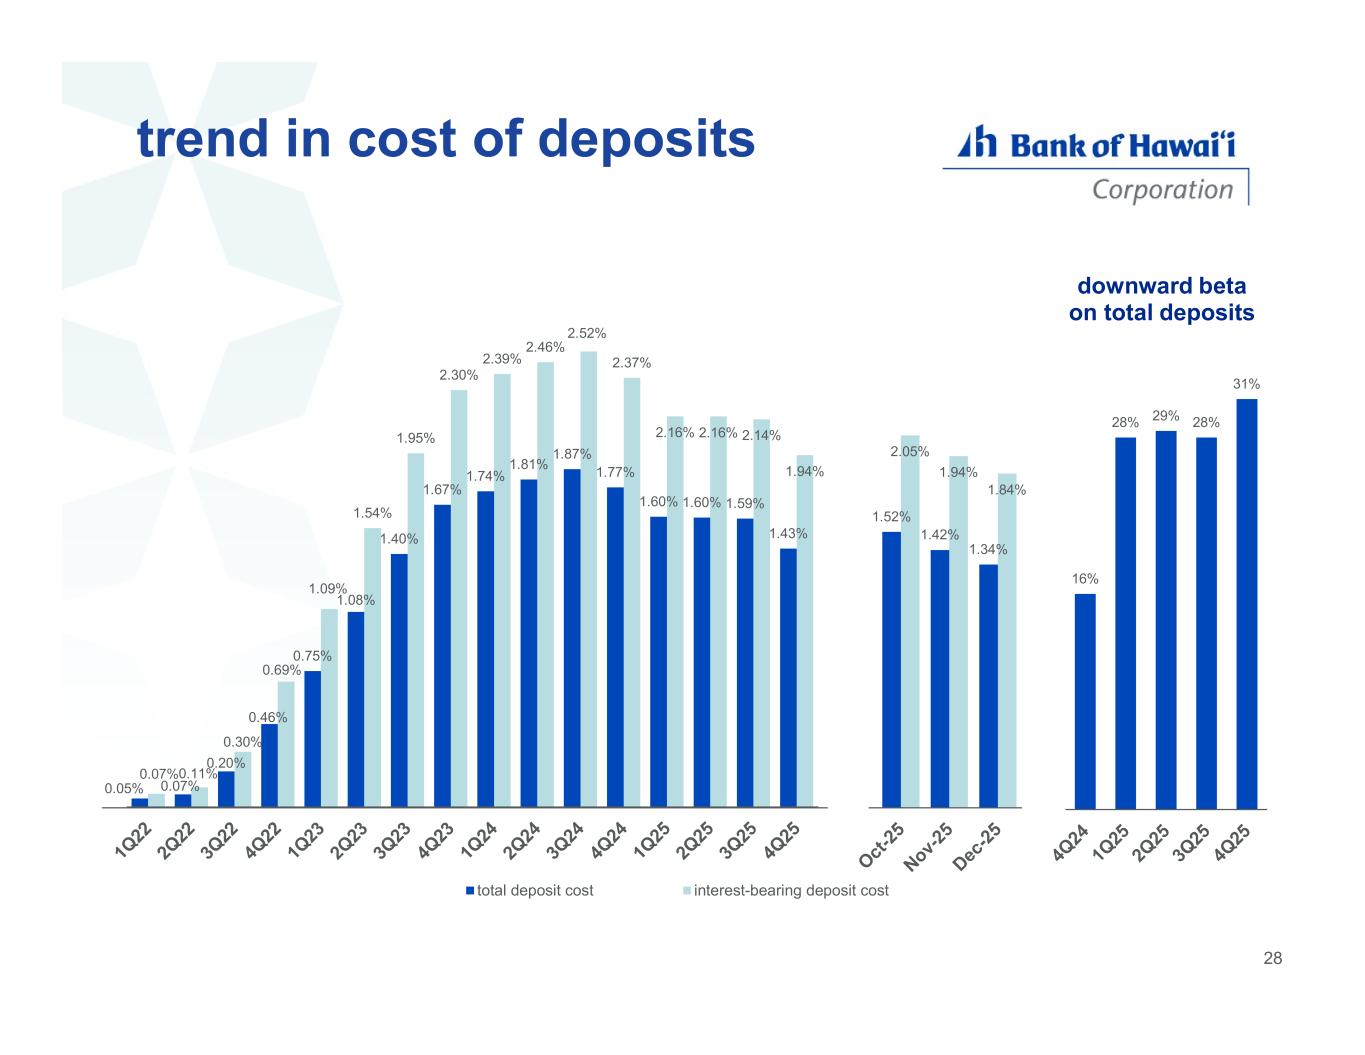
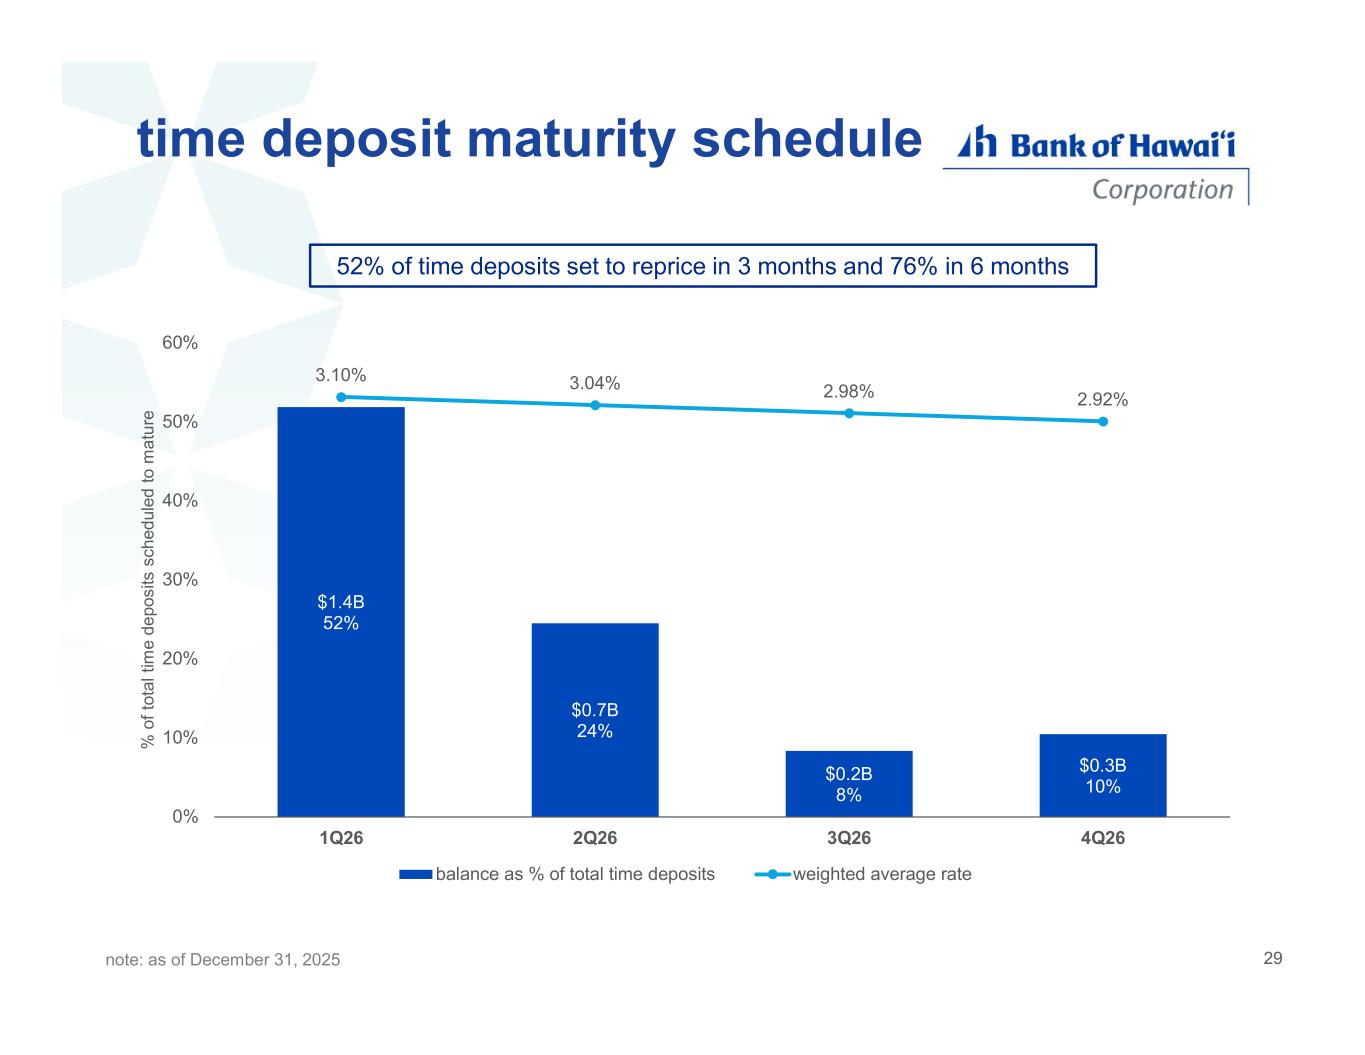
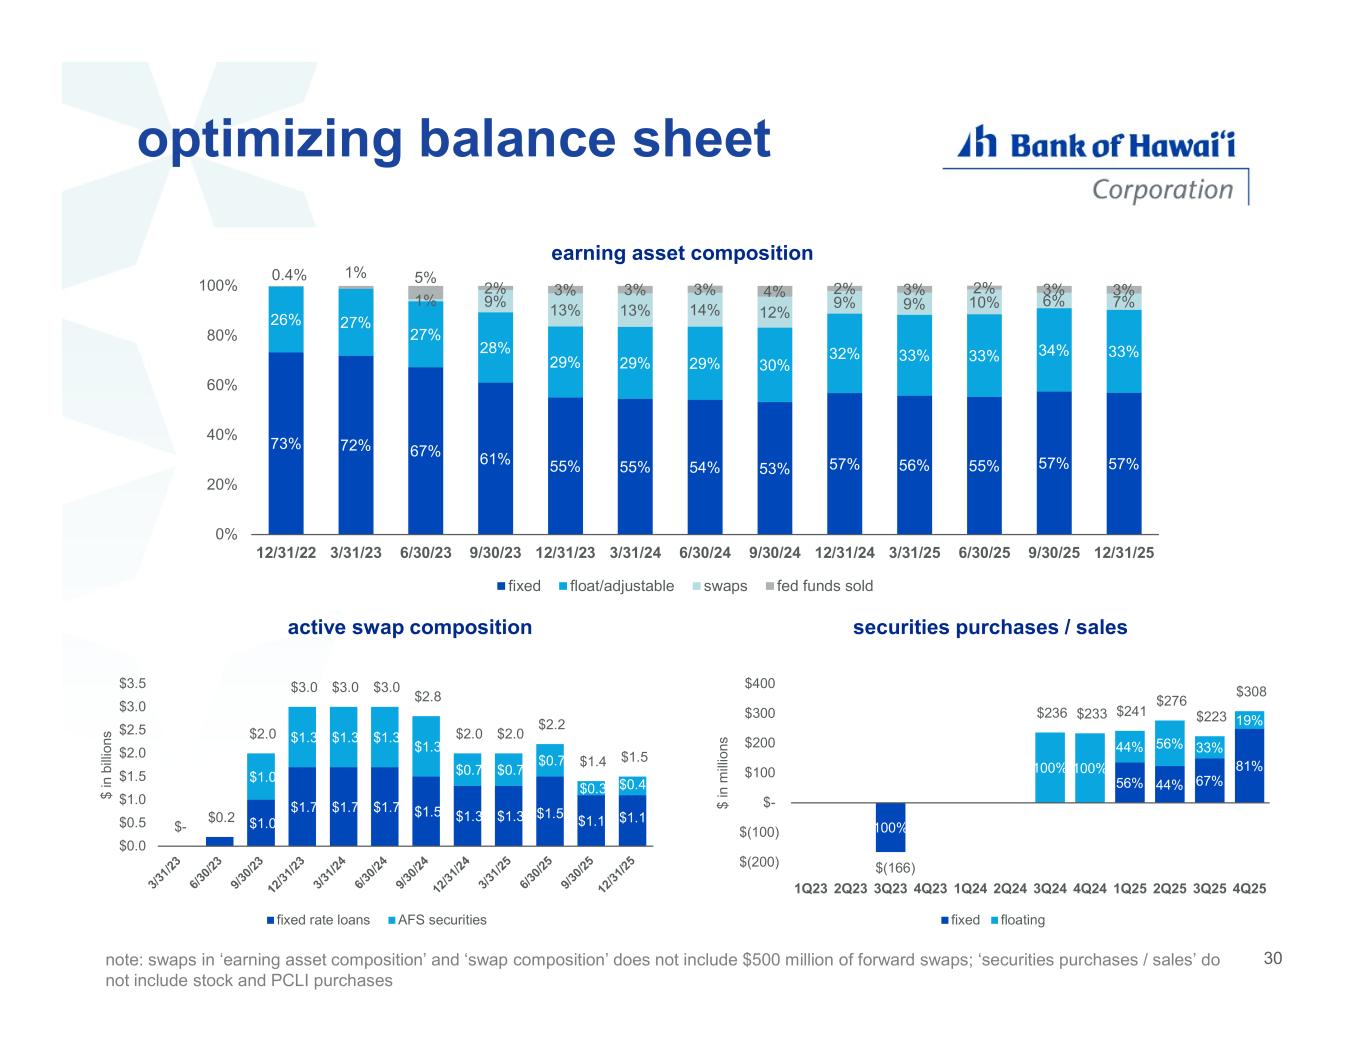
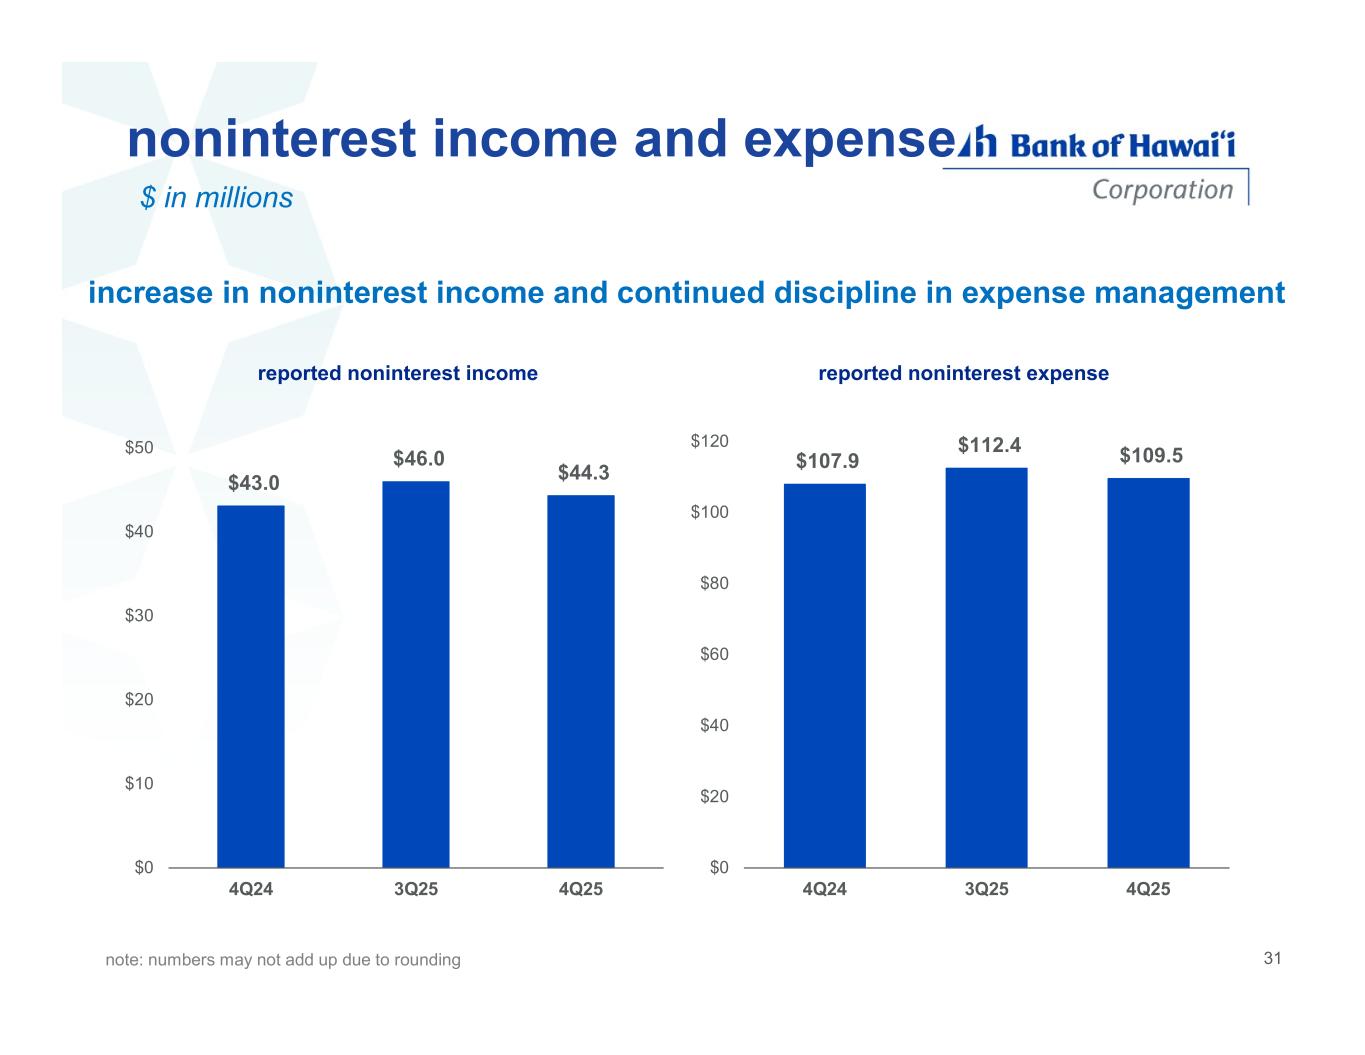
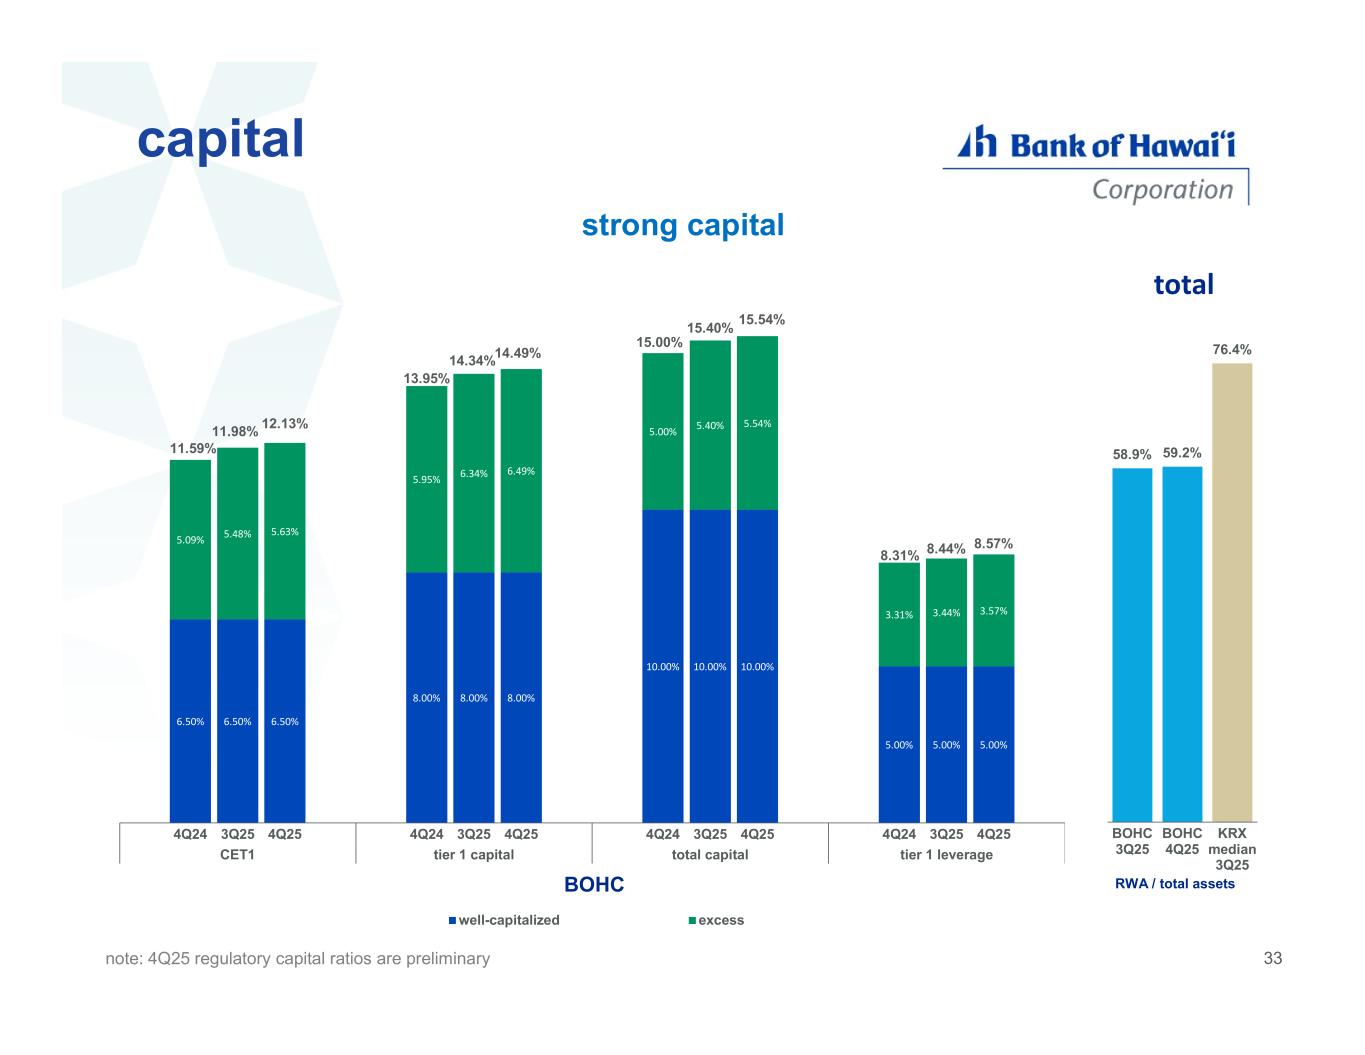
Thanks, Brad. For the quarter, we reported net income of $60.9 million and a diluted EPS of $1.39, an increase of $7.6 million.19 per share compared to the link quarter. These increases were primarily due to the continued expansion of our net interest income and our net interest margin. As Peter mentioned, this is the seventh consecutive quarter that we've expanded both our NII and NIM, and this quarter's expansion of $8.7 million and 15 basis points represents the most significant improvement during that stretch. Driving this expansion is the successful repricing of our deposits, a $200 million securities repositioning that we executed in early October, as well as the deposit mixed shift, which is a positive $100 million this quarter. This is the first time since the second quarter of 2022, after the Fed started raising rates, that the mixed shift had a positive impact on our earnings. As a reminder, the mixed shift represents deposits shifting from non-interest-bearing and low-yielding deposits to higher-cost deposits. The mixed shift peaked at $967 million in the second quarter of 2023 and has moderated since then. During the year, the average quarterly mischief was $25 million compared to $340 million in 2024. During the quarter, the yield on interest earning assets declined modestly by one basis point as floating rate assets repriced down in response to rate cuts during the latter half of the year. The impact of these rate cuts was almost entirely offset by the positive impact from our fixed asset repricing. While the yield on interest earning assets dipped modestly, the cost of our interest bearing liabilities improved by 19 basis points or 9% compared to the link quarter. It was driven by the successful repricing of our deposits, which declined to 1.43%, a 16 basis point reduction from the third quarter. In addition, our deposit beta improved from 28% to 31%. And I remain optimistic that we will ultimately achieve a beta at least 35% after Fed funds hits its terminal rate. It's also important to point out that we ended the quarter with a spot rate on our deposits of 1.3%, or 13 basis points lower than our average cost during the quarter. Based on the spot rate, I anticipate another solid improvement in the cost of our deposits during the first quarter. Additionally, our CD book continues to reprice down, and during the fourth quarter, the average cost of our CDs declined by 22 basis points to 3.18%. During the next three months, 52% of our CDs will mature at an average rate of 3.1%. The majority of these CDs are expected to renew into new CDs at rates ranging from 2.25% to 3%. We made no changes to our interest rate swap portfolio during the quarter, and we finished the year with an active pay-fixed receive-flow portfolio of $1.5 billion at a weighted average fixed rate of 3.5%. 1.1 billion of these swaps are hedging our loan portfolio, while 400 million are hedging our securities. In addition, we have 500 million of forward starting swaps at a weighted average fixed rate of 3.1%. 300 million of these forward swaps will become active during the first half of 2026, while the remaining 200 million will become effective during the third quarter. At the end of the year, our fixed float ratio remains stable at 57%, and I believe that we are well-positioned for any interest rate environment. Non-interest income was $44.3 million during the quarter compared to $46 million during the link quarter. As I discussed last quarter, non-interest income in the fourth quarter was impacted by an $18.1 million gain on the sale of our merchant services portfolio, which was largely offset by a $16.8 million loss incurred in connection with the repositioning of our investment portfolio. The current quarter also includes a $770,000 charge related to a Visa B convergent ratio change, while the link quarter includes a similar Visa B charge. The third quarter also includes approximately $3 million of merchant services fee income that will not recur following the sale of that business. Adjusting for these normalizing items, non-interest income was essentially flat. My expectation is the first quarter normalized non-interest income will be between $42 and $43 million dollars. Non-interest expense was 109.5 million dollars compared to 112.4 million dollars during the link quarter. Included in non-interest expense this quarter is a 1.4 million dollar reduction in our FDIC special assessment as well as a non-recurring 1.1 million dollar donation to our Bank of Hawaii Foundation. The link quarter includes a severance charge of 2.1 million dollars and approximately 2.2 million dollars of non-recurring merchant services expenses. Compared to my previous forecast, actual normalized non-interest expense was higher than expected, mainly due to additional incentives that were recorded during the period. For 2026, I am forecasting that expenses will increase by between 3% and 3.5% from our 2025 normalized expenses, and I anticipate that our first quarter normalized non-interest expense will be approximately $113 million. The first quarter generally tends to be elevated as compared to the rest of the year due to seasonal payroll taxes and incentive-related charges. During the quarter, we also recorded a provision for credit losses of $2.5 million, which is unchanged from the linked quarter and resulted in a coverage ratio of 1.04%. Further, we reported a provision for taxes of $17 million during the quarter, resulting in an effective tax rate of 21.5%. I anticipate that our tax rate will be closer to 23% in 2026 due to the impact from forecast to discrete items. Our capital ratios remained above the well-capitalized regulatory thresholds during the quarter with Tier 1 capital and total risk-based capital improving to 14.5% and 15.5% respectively. And consistent with the linked quarter, we paid dividends of $28 million on our common stock and $5.3 million on our preferreds. Plus, we resumed our stock repurchase program in the fourth quarter and purchased approximately $5 million of common shares at an average price of $65 per share. I'm currently planning to increase the level of our repurchases next quarter. At the end of the year, $121 million remained available under the current plan. Finally, our board declared a dividend of $0.70 per common share that we paid during the first quarter. Now I'll turn the call back over to Peter.
Thanks, Brad. This concludes our prepared remarks.
Operator
Now I'd be happy to take whatever questions you might have to answer session as a reminder to ask a question you need to press star one one on your telephone and wait for your name to be announced to withdraw your question please press star one one again please stand by while we compile the q a roster now our first question comes from a line of matthew clark of piper sandler your line is not open hey good morning everyone morning um just want to start on the non-interest bearing deposit growth this quarter uh good to see some strength there um sounds like less mixed shift you know
people seeking higher rate um probably some seasonality too but just can you just drill down on that those balances there at the end of the year whether or not that's sticky and what your what your outlook is for growth uh this year yeah man i think i think um the fourth quarter might be a bit outsized.
I mean, it was a 6% pickup in NIBD. But I think directionally, we've seen growth in that category for a few quarters now. And that's coming from a pretty balanced grouping of business segments participating. So commercial, our consumer folks are doing a good job bringing in sticky low-cost deposits. So we would anticipate this probably continuing would be my sense, but probably not at that same clip of six, you know, six plus percent. That's probably a little bit overstated. And I think there's probably some seasonality in there as you alluded to.
Okay, great. And then on the loan side, pretty much in line. Anything you're seeing there in the pipeline that would suggest any, you know, ideally like to get back to mid single digits. I don't know if that's realistic this year or not, but just want to get a sense for the pipeline and your outlook there too.
I'll let Jim cover that too.
Yeah, I feel generally better about where our pipelines are at, but until we can get both consumer and commercial kind of both contributing to growth, I think we'd probably stick in the mid single, you know, in the low single digits at this point. But I think there's opportunity to improve as we work throughout the year?
Yeah, but I think to be clear, 25 was basically, it was a flat year from an end of period standpoint, year on year. So I think that 26, at least from our forward vision into at least the first quarter, feels like it's going to be more of a kind of a mid-single-digit type of year for us. So a bit of an improvement, but still, we still love to see growth accelerate there, obviously.
Okay, great. And then just last one for me. Do you happen to have your special mention in classified balances at the end of the year?
I will take a look and see if I can get that for you.
I don't have that offhand.
Might come back to you in a minute or so. Great, thanks.
Operator
For our next question. And our next question comes from the line of Jeff Rullis of DA Davidson. Your line is now open.
A couple questions on the margin. I just want to confirm that kind of update on the margin to reach near the $290 range. That's a kind of end of year, not a fourth quarter average of $290. Is that correct?
That's the way we're thinking about it, Jeff.
That's right. Okay. And do you happen to have the December margin average?
Yeah, we finished the year at 267, so about six basis points above where we finished the fourth quarter in.
Great. And just on the sensitivity, it seems like that margin has been almost absent, hasn't really impacted. It's kind of a mechanical increase. Would you say the same sensitivities or lack thereof, it's a pretty, from your seat, looks like a pretty extended increase, I guess, regardless of rate moves upcoming?
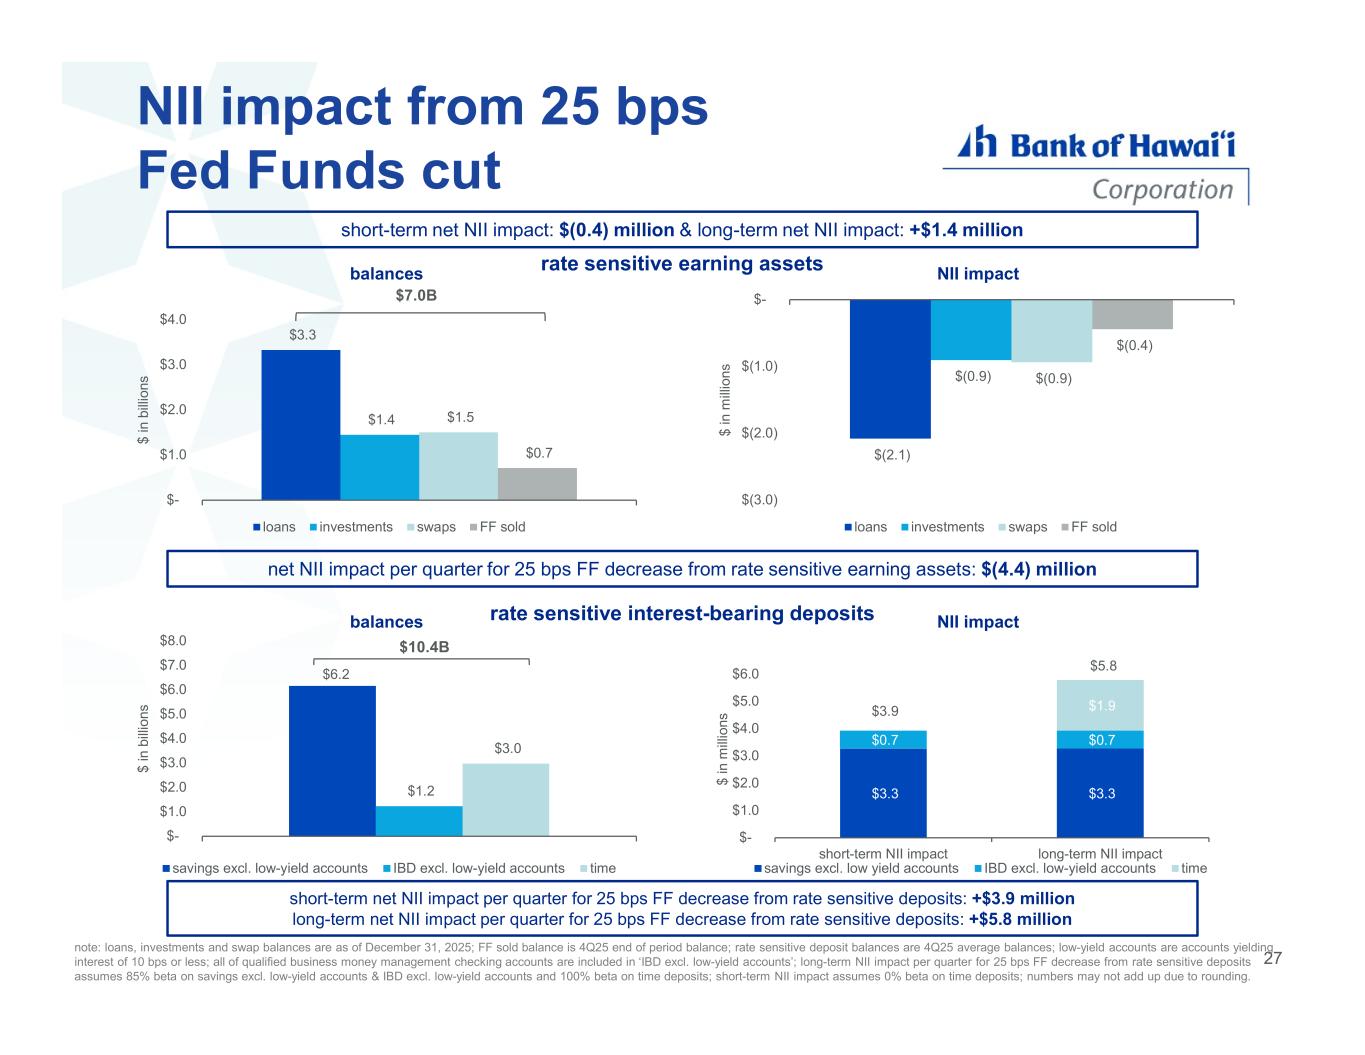
Yeah, I would agree with that. I mean, I would say that any rate cuts that we see, as long as they're orderly and sort of telegraphed, I think, you know, we'll see a benefit from that. And then also, you know, you look at the mix shift and to the extent that we can keep that either moderated at, you know, breakeven or even positive, I think that will actually contribute to margin as well.
Yeah. Let me just add a little bit to that, Jeff. I think, you know, what you saw in the quarter was the convergence of a number of things that were supportive of the margin expansion. Obviously, as you pointed to, the fixed asset repricing is mechanical. I mean, we just have assets coming off at lower yields, and they're going back onto, which is a good thing, obviously. But, you know, rate cuts did have a positive impact for us to the extent we get rate cuts moving forward. We think that's going to continue to be a positive for us. And then also in the quarter, we had very strong, as you know, we had strong deposit remix characteristics. So we're able to grow out the lower-yielding NIVD, in particular, deposits. And if that continues to persist, that'll be another tailwind for us. And then finally, I'd say that I think that, you know, certainly, effectively, there have been two, you know, rate-cut periods, 24 and 25. I'd say that our ability to manage deposit pricing with the 25 vintage was materially better than 24. So I think the team's gotten better at managing, you know, a little more of a rate reduction cycle, and that's coming through on our betas.
Got it. Nice backdrop. If I could squeeze one more in, just on the credit side with the ACL decline link quarter, I don't want to read too much into it, but is there any sort of indication of a mixed change or macro improvement? You kind of outlined the CRE firming up, but I just want to touch on credit and potentially that reserve release, if we should take anything from that.
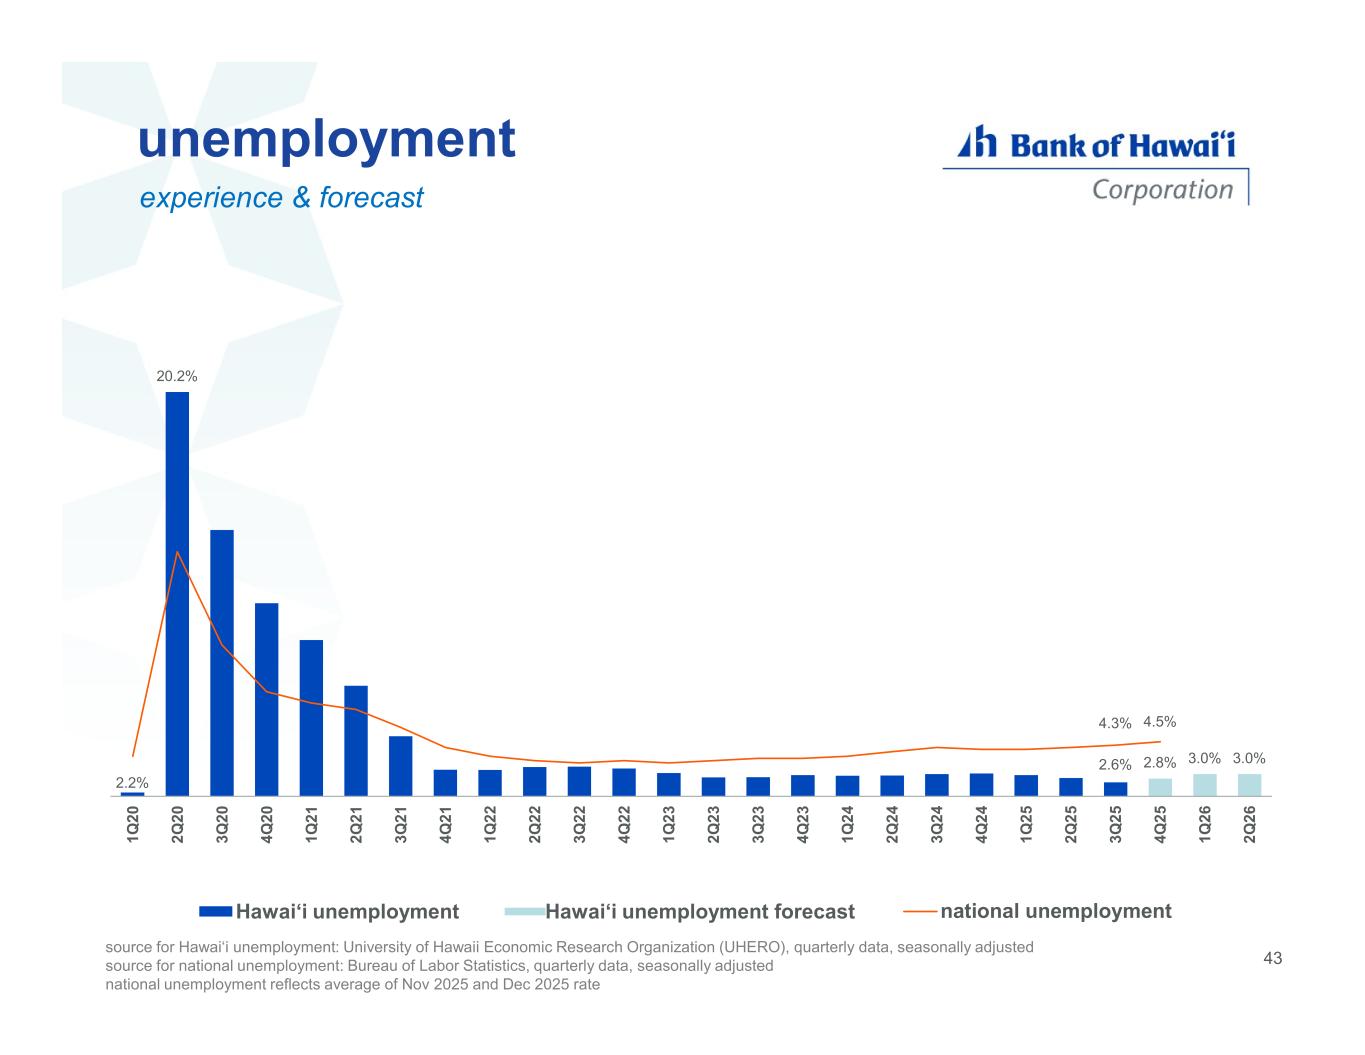
And I will answer your other question as well related to special mention. Special mention, I'll start off with that and just say that special mention, the end of the fourth quarter was $63.4 million. That's actually a year-over-year change, down $46.8 million from the fourth quarter of 2024. And then our total classified at $298.5 million. And as Peter mentioned earlier, credit quality remains pristine. During the quarter, I will mention that we had a charge-off of just over $1 million related to a previously identified non-performing asset. and as a result, you can see our NPAs declined while net charge-offs experienced a modest uptick. This was obviously an idiosyncratic resolution rather than a sort of reflection of a broader credit stress. That's very clear. Absent this charge-off, our credit quality metrics would have been pretty much very similar to last quarter's performance. We do continue to see very strong underlying portfolio performance overall. And we have stable trends across delinquencies, criticized assets, and any early stage indicators. And in addition, to answer your second question, the most recent U-Hero economic forecast for the state of Hawaii reflects an improved outlook for 2026. And that's really what supports that reduction in the ACL coverage during the quarter. So we feel really good about how we're positioned right now.
Well, an improved outlook coming off of what would previously be a forecasted downturn. Exactly. So they revised their downturn numbers up.
Operator
Thank you. One moment for our next question. Our next question comes from the line of Jared Shaw of Barclays. Your line is now open.
Maybe just sticking back with the growth in DDA, it's a great quarter. Can you just give a little color on market share gain that you think from that versus just sort of improving customer backdrop? And then if we look at the slide that shows the strength of sort of the market share gain over the last year and the last 20 years. Is there a natural ceiling for that, or do you think that Bank of Hawaii can continue to take significant share here?
I'll address the second part of the question first. I like to believe that our historic performance is an indicator of what's possible for the future. We think of Hawaii as our core primary market, and we're always trying to figure out ways to serve our clients better, whether it's on the consumer side or the commercial side. That's been met with pretty handsome market share pickups. I don't really see a condition that would lead me to believe that that's going to retard at all often in the future. It's a competitive world. Things are changing. Products change. Consumer demands and sentiment changes. Today, we've been pretty good at understanding how that plays through here in this marketplace, and I'd hope that continues to continue on. As relating to the demand deposits growth of the past, certainly this quarter, the past couple of quarters prior, I think this market feels like it's stable but not growing tremendously. So I don't know that a lot of our operating deposits have come from just better economic outcome, that feels reasonably flat to me. I do think there's some cyclicality into the fourth quarter. And I think, frankly, it takes a while for the teams to really focus in on whatever categories you're sending them to focus in on. And DDAs and deposits and DDAs in particular is an area that we have obviously put a lot of emphasis into as Fed Funds has given that a good amount of profitability, I think we're beginning to see kind of the fruits of our labor there.
Okay, thanks. I appreciate that, Collar. I guess shifting maybe to the other side of the balance sheet, you know, talking about the low single-digit loan growth opportunity, could you just give a little color on what you're seeing in terms of commercial pipelines and what sort of the backdrop on the residential mortgage side could look like?
Sure. Jimmy, do you want to cover that? Yeah, so maybe I'll start with commercial. You know, we've seen the pipeline build nicely through Q4. I think that sets us up really, you know, in a more positive fashion in Q1. The activity has been on the commercial real estate side in our large commercial real estate business, but we've also seen some good growth in the pipeline in our middle market businesses. So I think it's more robust than just one area, and we feel pretty good about that. On the RESI side, you know, we had a really solid Q4 that was driven in part by an increase in overall purchase activity aided by a couple projects that closed out during the quarter. Pipeline remains pretty good going into Q1, and so I think, you know, as I said earlier, I think we feel better about overall loan activity, and, you know, I think we see the opportunity to move into the mid-single digits as we work through the year.
Operator
Thank you. One moment for our next question. And our next question comes from the line of Andrew Turrell of Stevens. The line is now open.
If I could just start on the margin, obviously, you know, another, sounds like another year of a really good margin expansion. I'm just curious, is that mostly fixed asset repricing driven? Do you assume or contemplate any securities restructuring within there? And then, you know, as we look out beyond just, you know, the fourth quarter or year end of 2026, does the fixed asset repricing benefit continue in 2027 or start to diminish somewhat?
I'll let Brad touch on that.
Yeah, I mean, just to start with the fixed asset repricing, we believe we've got a couple years at least of that. I mean, you know, we think we'll still see an impact of it. it may start to diminish slowly, but we'll continue to see that, you know, continue to have an impact over the next couple of years easily. As far as this quarter, I mean, we did have fixed asset repricing and the securities repositioning obviously had an impact. And then the rate cuts obviously had an impact as well on the decrease in our cost of deposits. And so looking into the first quarter, I mean, I think we're continuing that momentum. I think you'll see the NIM expand, maybe not to the same extent as you saw in the fourth quarter, but I still think we'll see a nice expansion with, you know, the spot rates and our cost of deposits in the December NIM, you know, going into January at 267. You know, I think we'll continue to see some good momentum with our NIM.
Yeah. Okay. And then just on the topic, do you have the total NII impacts of the swaps in the fourth quarter, inclusive of the terminated hedges? I think you guys terminated last quarter?
The impact on our net interest income? It was about just over a million dollars for the quarter, and that includes the impact of the amortization of the termination costs.
Okay, thank you. And then last one for me just sounds like, you know, interested in thinking of the buyback a bit here in the first quarter, but, you know, growth also sounds a little stronger as well on the loan side. Just remind us where you're comfortable at from a capital standpoint? And then just on the repurchase front, should we expect that becomes a more consistent part of the capital return story moving forward?
I think as long as growth remains kind of in the tepid range, call it, we're going to be looking to deploy capital into buybacks. We like, you know, kind of where the price is from a purchase standpoint, at least. So we were $5 million last quarter. I would anticipate that we'll be closer into the $15 to $20 million range moving forward per quarter.
Great. Nice quarter. Thanks for taking the questions.
Operator
Thank you, Wumwun, for our next question. Again, as a reminder to ask a question, you'll need to press star 1-1 on your telephone. And our next question comes from the line of Kelly Mata of KBW. Your line is now open.
Hey, good morning. Thanks for the question. Most of mine had been asked and answered at this point, but one area I did want to touch on was fees. You mentioned on your October earnings call about the potential opportunity and wealth and ahead, and I appreciate the Q1 guidance of 42 to 43. As you look ahead, can you perhaps share a bit about the opportunity on the fee side and kind of the cadence of potential pull-through with that?
Sure. Should we want to touch on that? Yeah, sure, Peter. So, you know, as we've mentioned, we've spent the last couple years really building into our wealth opportunity. We've started to see some good traction internally, educational-wise, participation-wise, calling-wise with our clients. We're doing a number of different engagement activities with clients just from a seminar type of perspective. And I think those things are really starting to help us to build the overall momentum. You can look at quarter over quarter, we had a little over 2% growth in fees on a linked quarter basis. And so I think that production in Q4 was one of our highest levels in a while pipeline remains um very strong from an investment perspective so you know i think as we as we move forward getting into that 10 range i think that was the guidance that we provided at the last call even higher as we have more time to build into the opportunity i think you know we feel pretty reasonable about that got it that's that's um that's really helpful And then on the expenses, just a minor housekeeping question.
On the 3% to 3.5% increase, I just want to make sure I'm using the right normalized expense base. I have you at about 441 in 2025. Is that the right number to kind of build off of, given that there's been a couple one-time items, especially here in the second half?
Hey, Kelly, this is Brad. Yeah, that's about right. I mean, I look at it as somewhere between 440 and 441.
Got it. Thank you so much.
Operator
Thank you. I'm showing no further questions at this time. I'll now turn it back to Chang Park for closing remarks.
Thank you, everyone, for joining our call today, and thank you for your continued interest in Bank of Hawaii. As always, please feel free to reach out to me if you have any additional questions. Thank you so much.
Operator
Thank you for your participation in today's conference. This has concluded the program. you may now disconnect