Operator
Good day and thank you for standing by. Welcome to the Bellring Brand's first quarter fiscal year 2026 earnings conference call. At this time, all participants are in a listen-only mode. After the speaker's presentation, there will be a question and answer session. To ask a question during this session, you'll need to press star 1-1 on your telephone. You will then hear an automated message advising your hand is raised. To withdraw your question, please press star 1-1 again. Please be advised that today's conference is being recorded. I'd now like to hand the conference over to your speaker today, Jennifer Meyer, Investor Relations for Bellring Brands. Please go ahead.
Good morning, and thank you for joining us today for Bellring Brands' first quarter fiscal 2026 earnings call. With me today are Darcy Davenport, our president and CEO, Paul Rohn, our CFO. Darcy and Paul will begin with prepared remarks, and afterwards we'll have a brief question and answer session. The practice and supplemental slide presentation that support these remarks are posted on our website and both the investor relations and the S&T filing section at bellering.com in addition the release and slides are available on the S&T's website before we continue i would like to remind you that this call will contain forward looking statements which are subject to risks and uncertainties that should be carefully considered by investors as actual results could differ materially from these statements these forward looking statements are current as of the date of this call and management undertakes no obligations as they be stated as a reminder this call is being recorded and an audio replay will be available on our website and finally this call will discuss certain non-GAT measures for reconciliation of these non-GAT measures to the nearest GAT measure see our press release issues issues today and posted on our website with that I will turn the call over to Darcy thanks Jennifer and thank you all for joining us this morning.
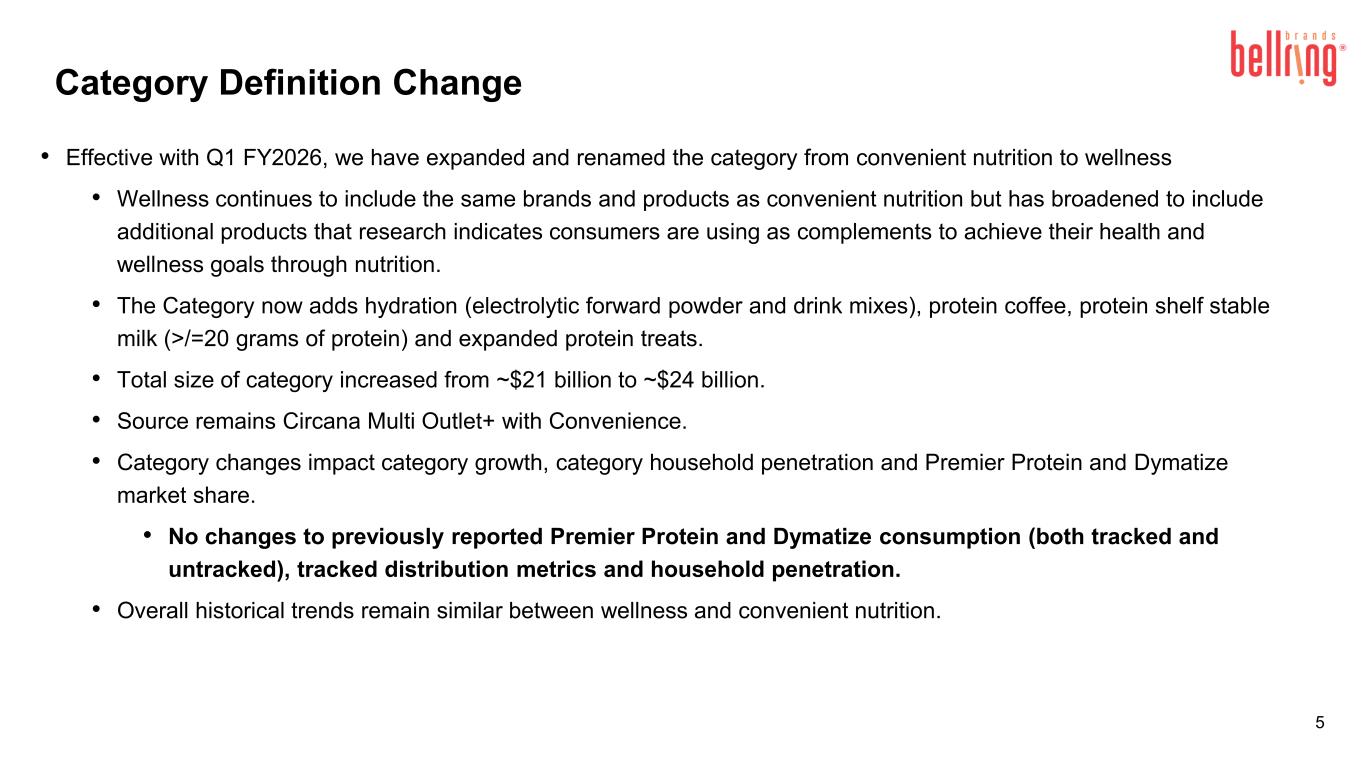
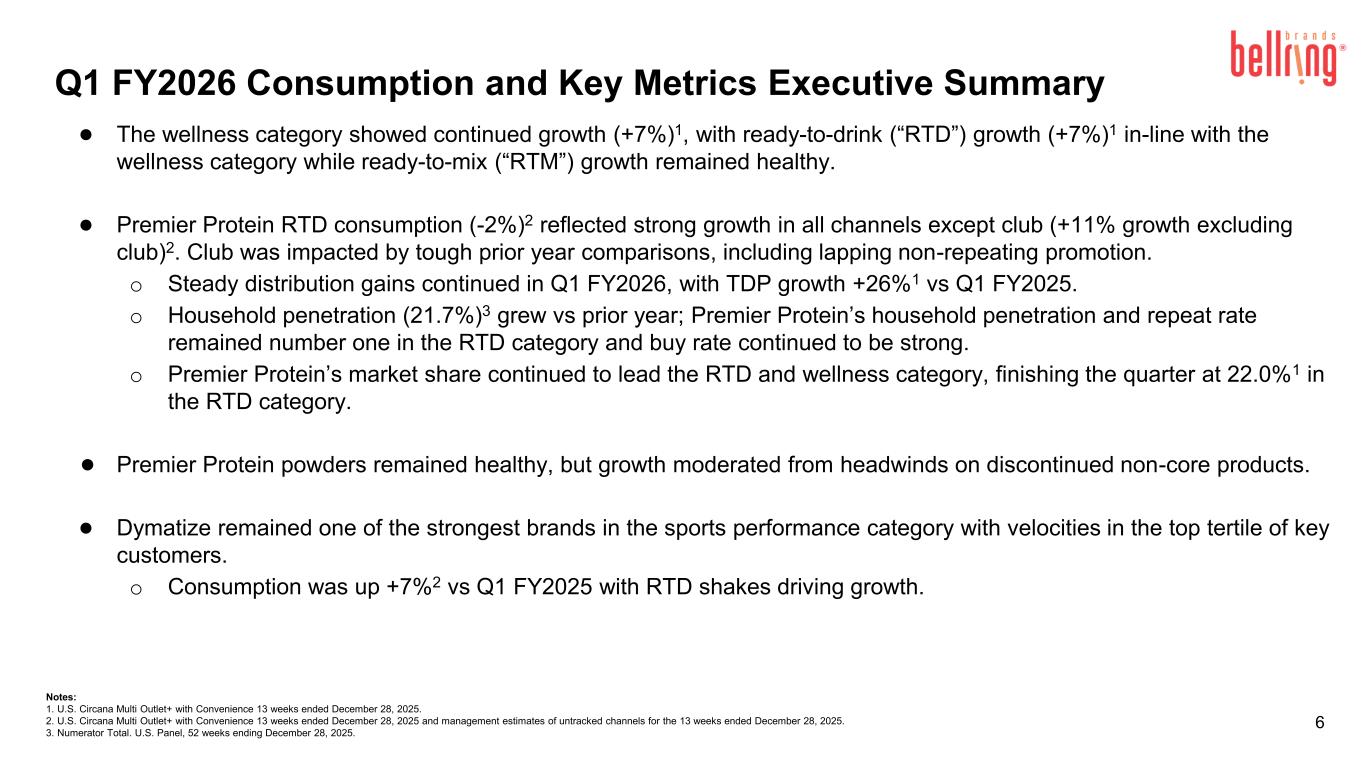
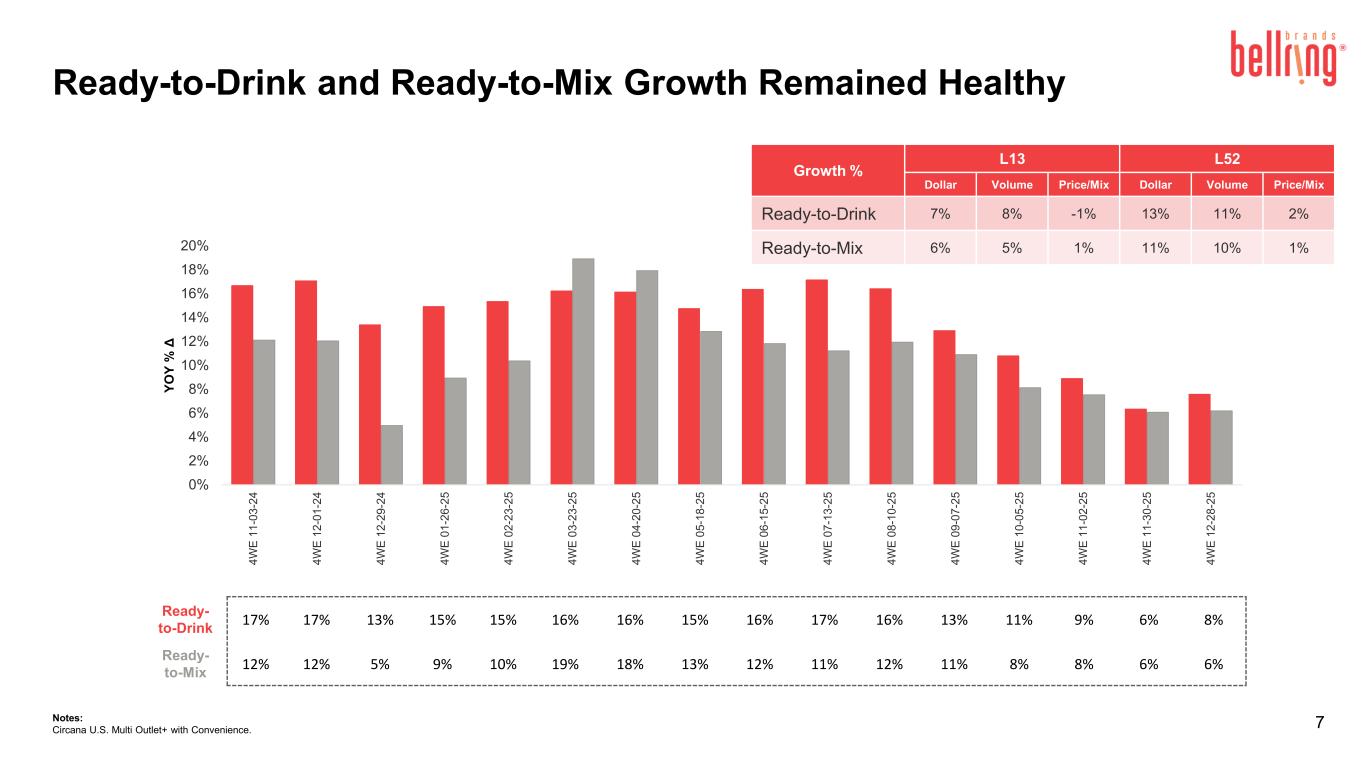
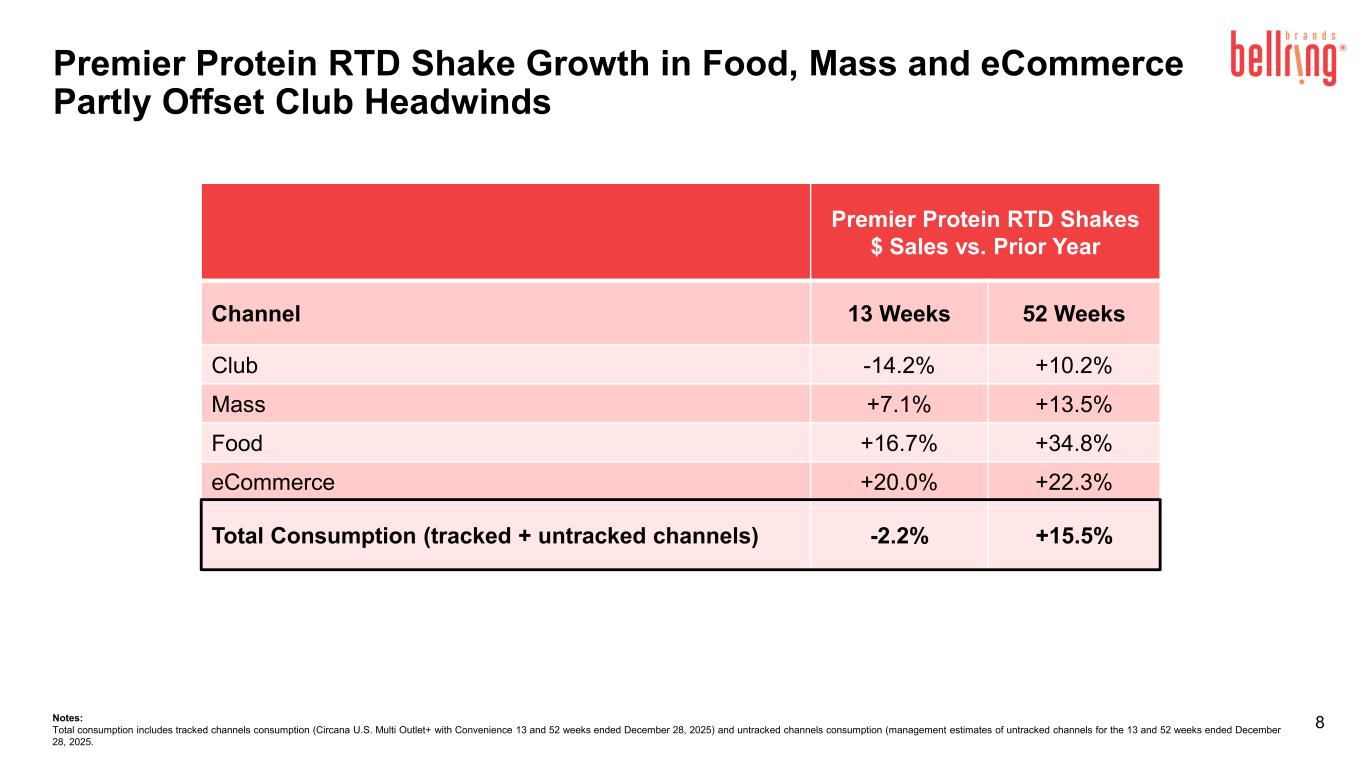
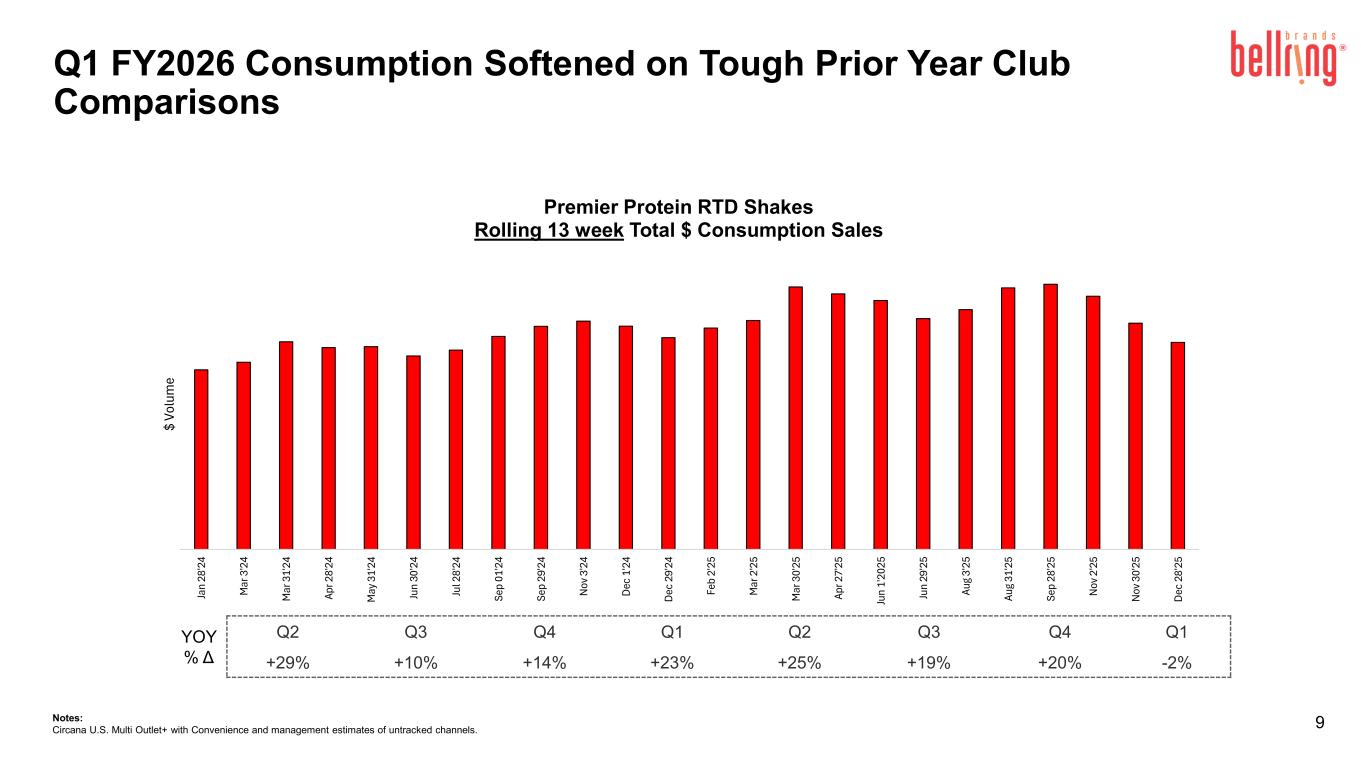
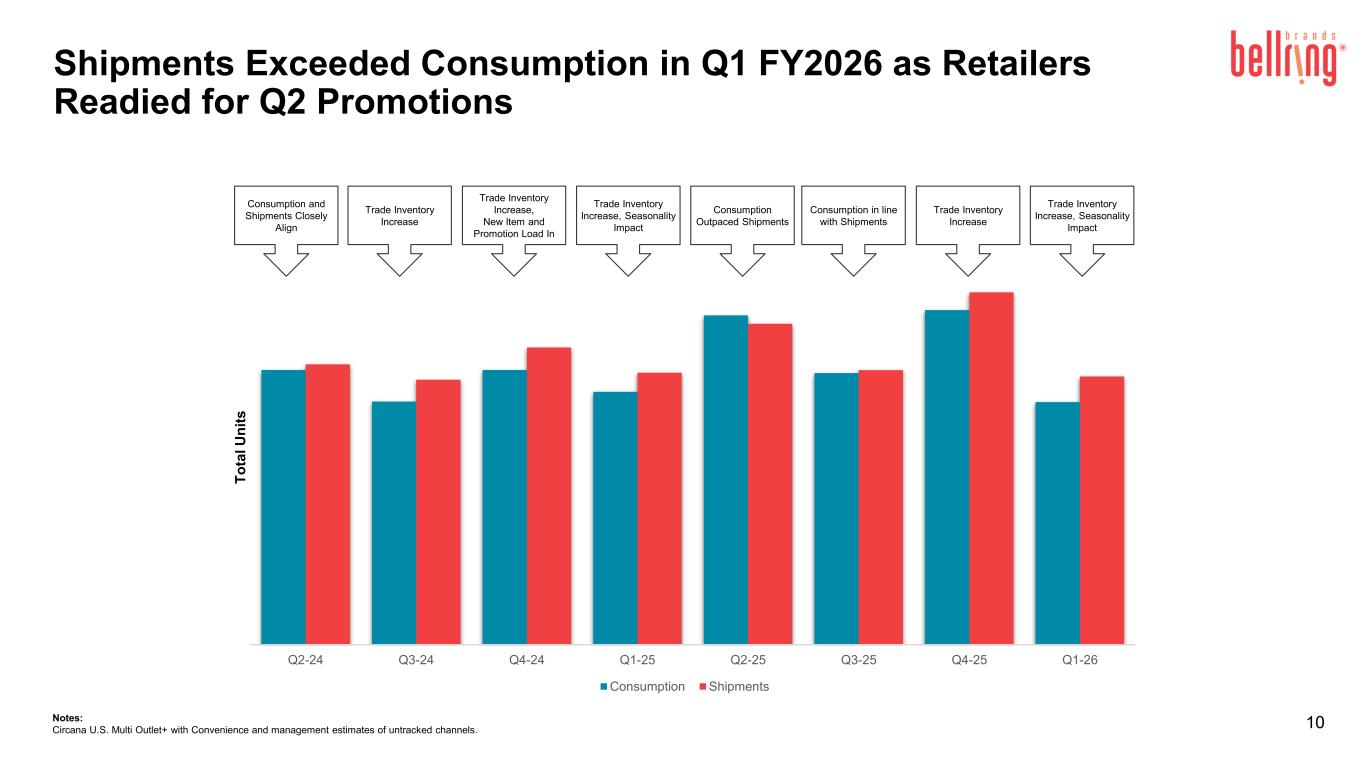
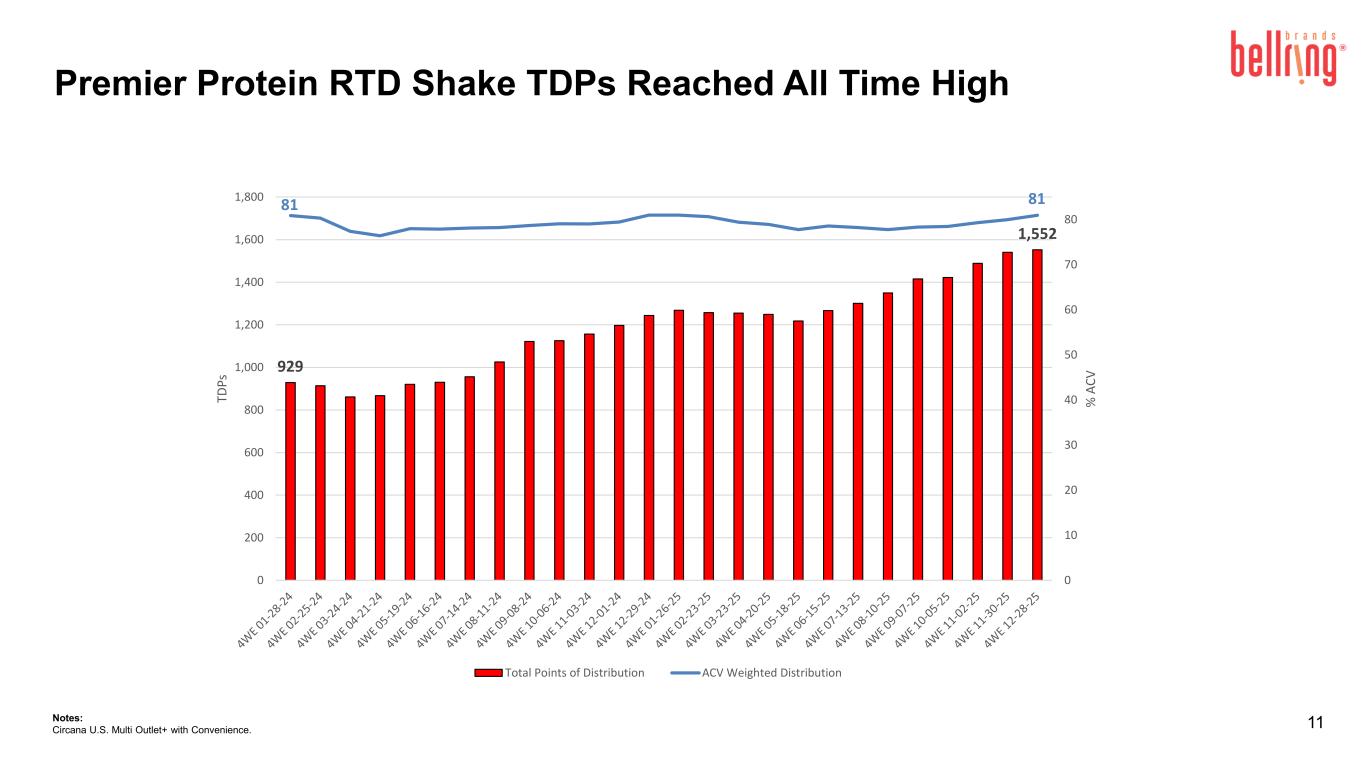
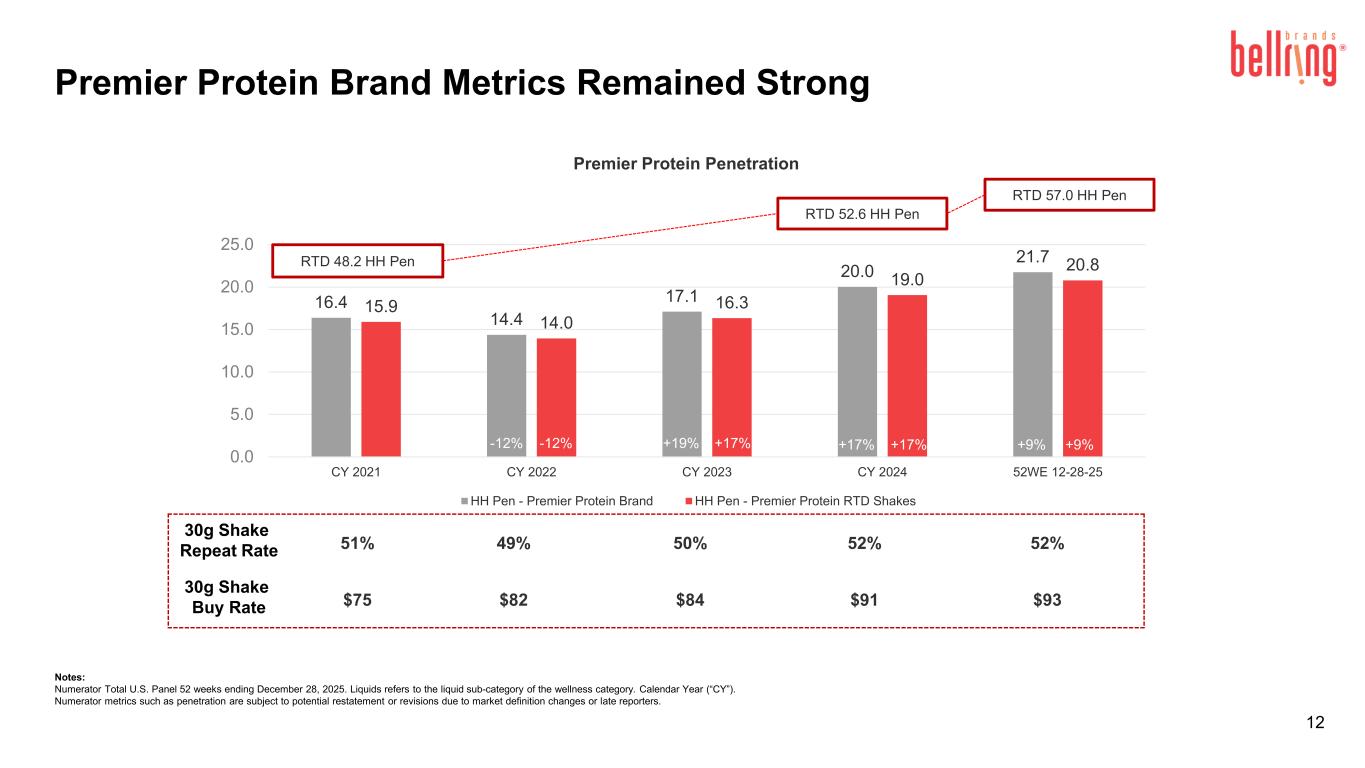
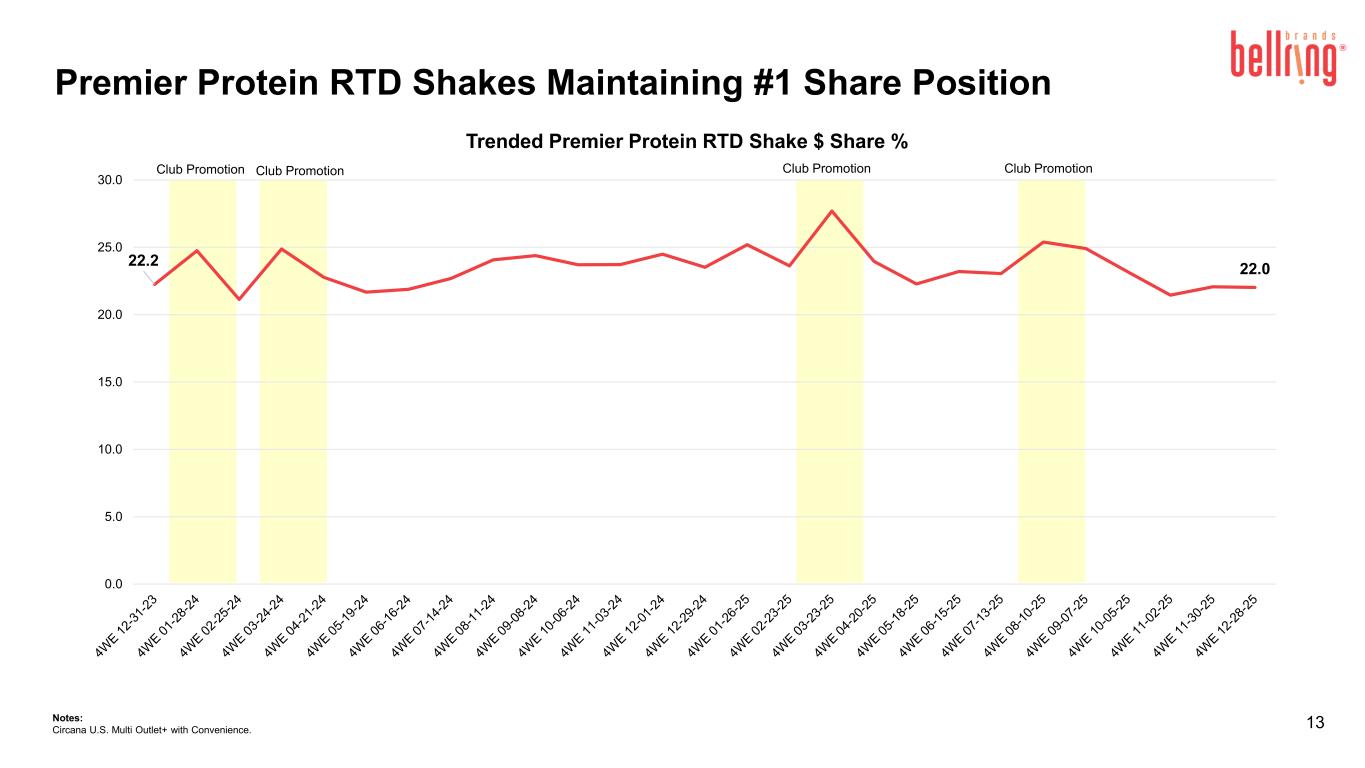
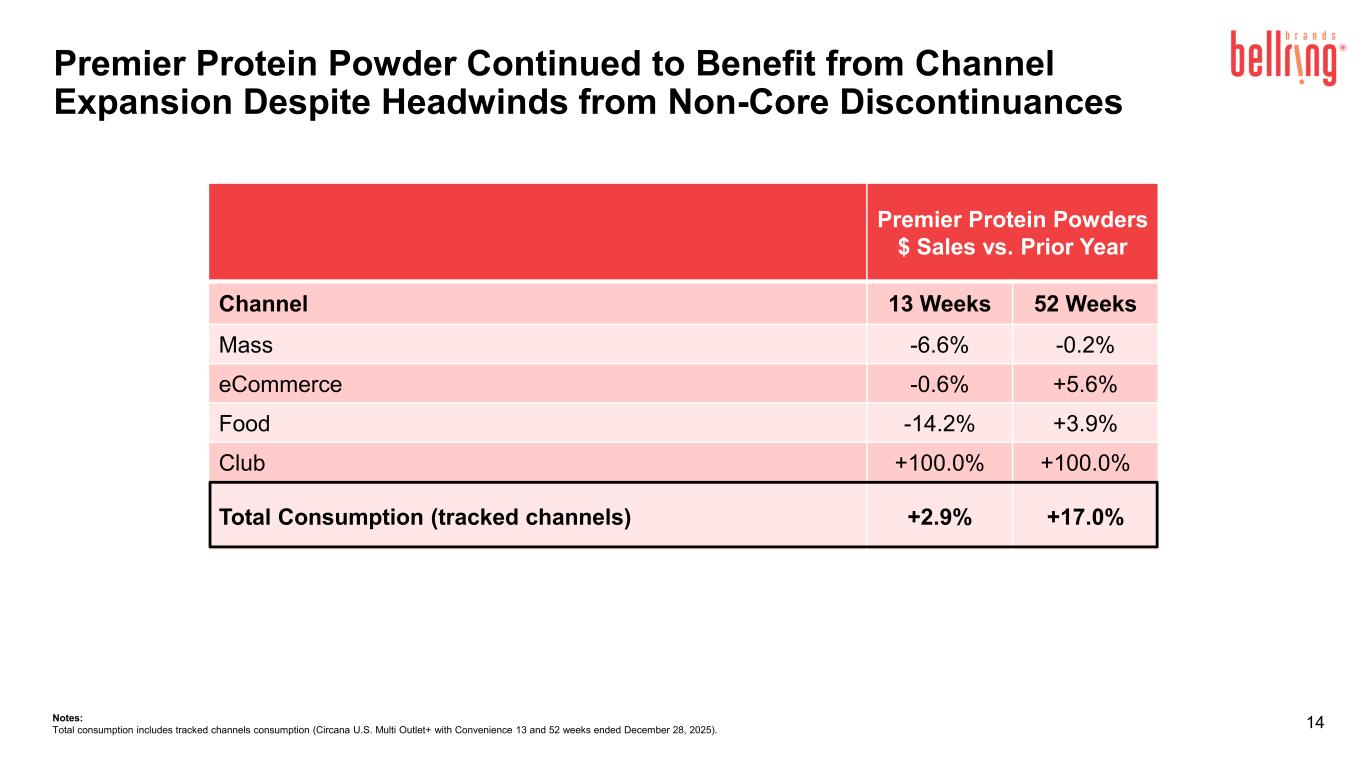
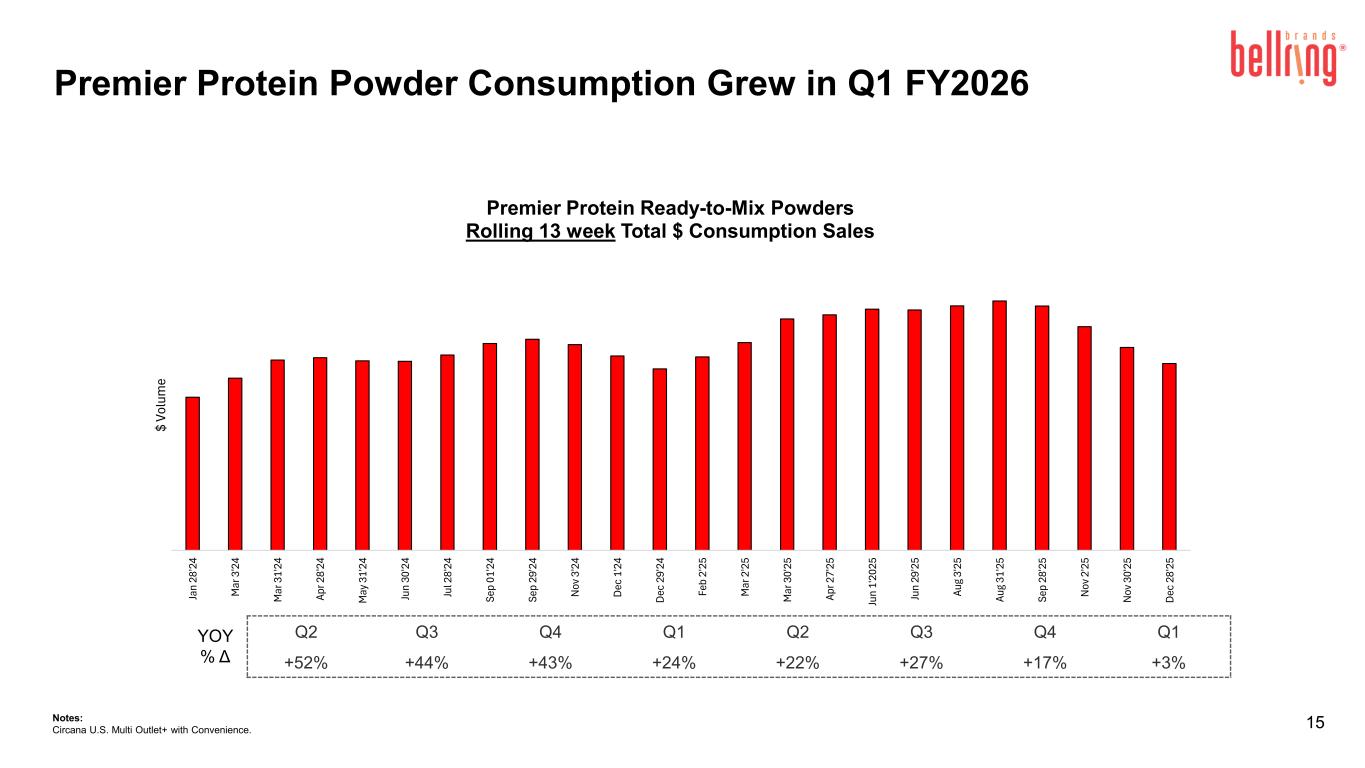
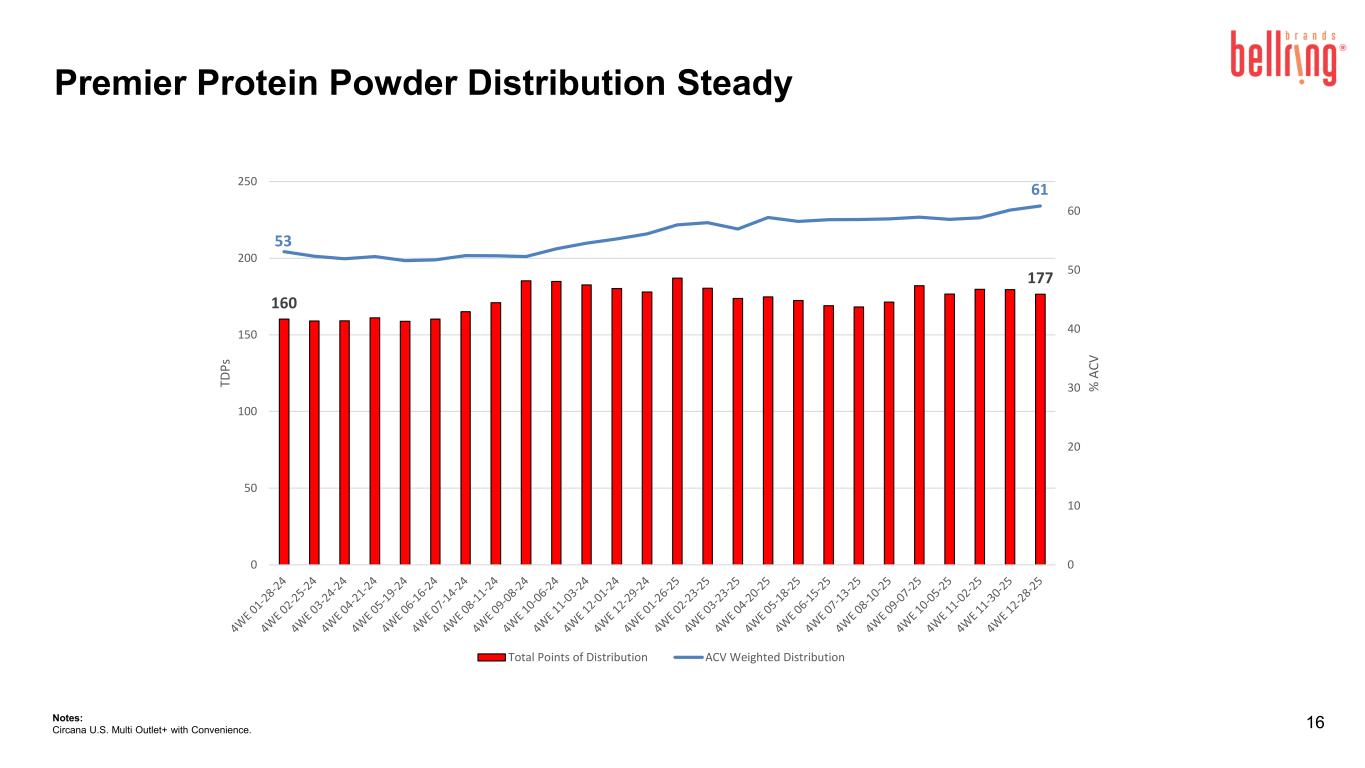
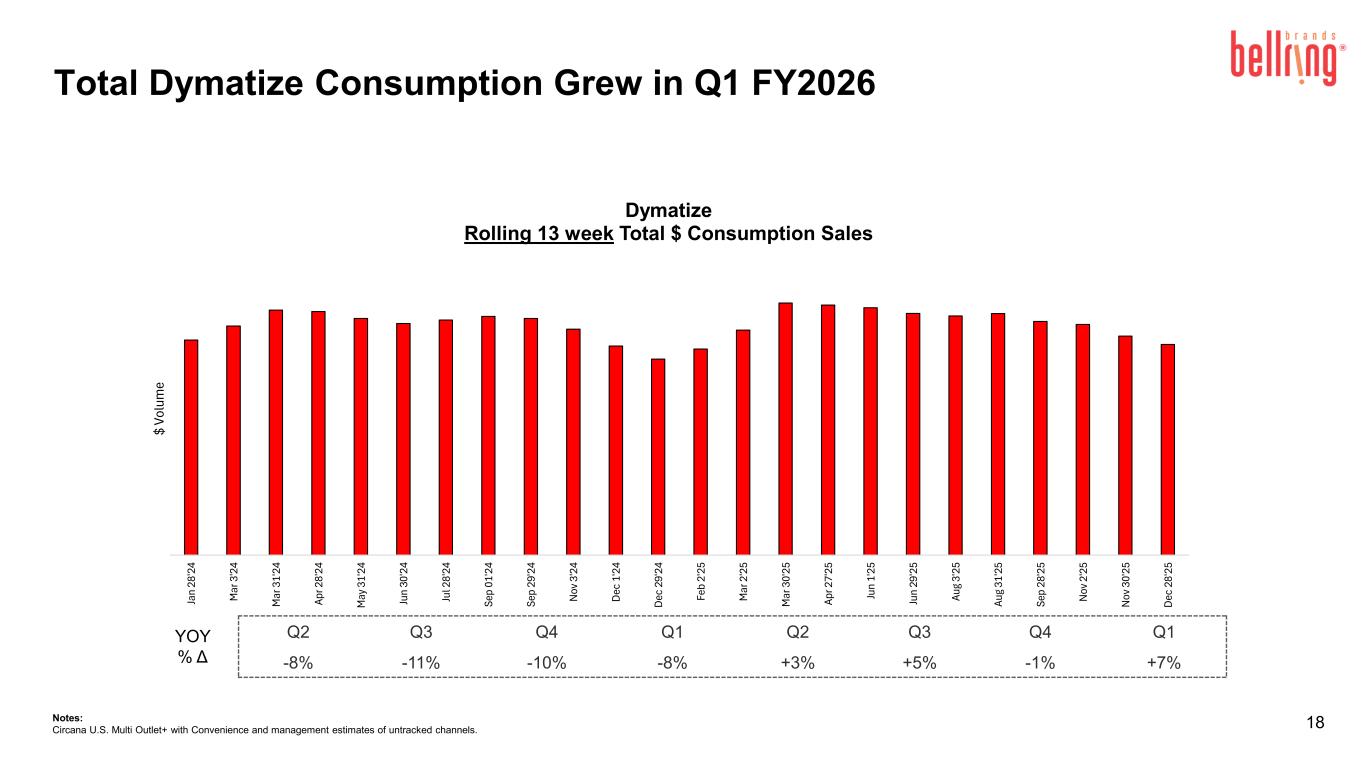
The first quarter delivered a solid foundation for the year as we continue to execute our Results were ahead of our expectations with favorability, primarily driven by the timing of customer orders. The RTD Shake category remains healthy, and Premier continues to hold a leadership position with 22% market share and best-in-class household penetration, brand equity scores, and repeat rates. Today, we have narrowed our range of our 26 net sales guidance to between 4% and 6% growth. While much of our key selling periods remain ahead, we have observed more frequent promotional events from insurgent brands than expected. As a result, we have appropriately factored this into Premier's consumption trends in our balance of year outlook. We are continuing to execute on our strategies of growing distribution, increasing brand investments and launching innovation which are progressing as planned many of these initiatives are ramping up and are starting to positively impact consumption we were encouraged by the growth and consumption during January up 6% in all channels and 16% excluding clubs we expect q2 premier consumption to be generally in line with net sales and expect these growth strategies to be more meaningful contributors to growth in the second half of the year. As Paul will discuss in more detail, we have updated adjusted EBITDA guidance to 425 to 440 million. This range incorporates our updated sales outlook and the impact of higher way costs on our powder business. Turning to our categories, we continue to expect RTD shade category growth in the high single digits for 26 primarily driven by volume in the medium to long term we expect more marketing spend expanded shelf space innovation and the main streaming and affordability of GLP ones to drive higher household penetration and category growth retailers are fully behind the category and are increasing category space testing higher traffic aisle locations and expanding display space to capture growing consumer demand as I discussed on my last call the success of the category has attracted competition. As insurgent brands work to establish themselves in the market, we expected promotional spending would increase. However, as I briefly mentioned earlier, year to date, the number of events is tracking modestly ahead of our initial expectations. Over the longer term, we continue to expect retailers to consolidate the shelf behind a handful of the best-performing brands and move them to more heavily trafficked aisles. We remain confident in our ability to continue leading the category, though we anticipate some near-term transitional impacts until these competitive dynamics play out. We believe that mainstream appeal, high repeat rates, and execution capabilities will determine the long-term winners. Turning to our first quarter performance, I'd like to highlight that our supplemental presentation and corresponding metrics now reflect a change in category definition from convenient nutrition to wellness, with the U.S. category size increasing to $24 billion from $21 billion. The broader definition includes the same brands and products as our historical category along with additional products that our research shows consumers consider in the category. This change does not impact any of our previously reported tracked consumption or household penetration metrics. The wellness category grew 7% in Q1 and RTD shakes also up 7% with growth driven by volume. Premier RTD shake consumption was down 2% in the quarter, lapping 23% consumption growth in the first quarter of 25, which included very strong club consumption with the smallest number of new brand entrants in a non-recurring promotion. Consumption outside of club was strong, up 11% in the quarter. Premier Q1 consumption growth came in slightly below our prior outlook of flat, primarily due to the timing delays in activating promotional display at a mass retailer, as well as a modest impact from greater than expected promotional activity by insurgent brands. First quarter net sales increased 1% with Premier net sales down 1% and Dymatized net sales up 16% on strong international growth. Paul will go into more detail in the quarter later. Now I'll provide a review of our operating plans which will continue to provide momentum as we progress through the year. We are on track with our plans to one, continue growing our distribution both in and out of the aisle, two, increase advertising investment while elevating its impact, and three, launch innovation that provides consumer excitement, adds occasion, and drives trials. Distribution both in and out of the aisle is a major opportunity. Starting with CLAB, we launched new products and formats as well as increasing sampling and promotional spending which is expected to improve our performance in this channel as we move through the year our premier shake TDPs increased at double at strong double-digit rates in fiscal 25 primarily driven by math food drug and e-commerce channel and we remain on track to expand at similar levels in 26 We're encouraged by the early performance with our new broker and internal retail sales In particular, our sales of single bottles have more than doubled in January, effectively increasing trials. Our improved store activations are already meaningfully impacting our SDM channel results, with strong share increases in feature and display. In late Q1, we launched a partnership with a major math retailer, which included extensive displays and end caps across pharmacy and grocery aisles and the first launch of our coffeehouse shake innovation. Due to the timing of the retailer's holiday merchandise transition, program execution was modestly delayed. Our programming is now fully in place and we are seeing strong double-digit consumption growth as traction builds we're also encouraged by the early performance of coffee house where caramel macchiato is one of the highest velocity four counts in January our second priority is advertising we saw a strong return on investment in fiscal 25 and have decided to further invest in elevate our creative in 26 our go get them campaign was launched in late December and is designed to drive household penetration, strengthen emotional connections, and bring fresh energy and relevance to the Premier brand. Premier Protein has always been a brand that celebrates the everyday go-getters, not just those who work hard in the gym, but those who work seriously hard in life. As the original mainstream RTD brand, this campaign is perfectly positioned to bring in new households as the category continues to mainstream. This omnichannel campaign was developed with a new agency and runs across linear TV, streaming, podcasts, and social, as well as retail media and out-of-home locations, including gyms. Go Get'em has tested better than any other prior campaign, and we expect it to drive further awareness and conversion as we move through the year. Turning to innovation, in 26, we are intensifying our focus on innovation across flavors, formats, consumer segments and occasions to expand shape occasions last year we kicked off the year with our indulgence line and this year our new year new you focus is on our new coffee house line coffee house meets the protein and energy consumer need with 30 grams of protein and the caffeine equivalent of one cup of coffee and targets a sweeter taste palette versus our core cafe latte Early results are promising, and we're excited about adding a coffeehouse variety pack in bottles as an incremental item at a club retailer later this month. Premier is known for its flavor innovation. We will continue to bring flavor excitement to the category throughout the year. Our LTO strategy remains highly successful, with winter mint chocolate performing at the top tertile. In January, we launched Strawberry Powder, and in our third quarter, we will offer an exciting new seasonal shake flavor. Lastly, I'm pleased to announce that we have two new shake lines. Two new lines we are readying for launch in the second half. The first line is a continuation of our strategy to expand our portfolio across protein levels. In addition to minis, which provides a smaller size product with lower protein levels that are perfect for snacking, we will launch a product with higher protein for those consumers looking for more protein in a ready-to-drink shake. I'm especially excited about our second line launching late in the year. It offers consumers a completely different drinking experience versus our core products. It tested well above industry benchmarks and targets both incremental consumers and incremental occasions. In closing, the first quarter was a solid foundation for the year and consumption is ramping up. We have conviction around the category, the strength of our brands, and our demand drivers. Premier remains the number one brand with record high hustle penetration and repeat We have deep expertise in one of the fastest growing categories in retail and continue to expect strong category growth. We are investing in our brands, sharpening our execution and innovation plans, and driving savings our savings agenda to deliver our 26 outlook our operating plans are on track and we continue to expect an acceleration and growth in the balance of year I remain highly confident in our future and our ability to create sustained long-term value for shareholders before turning the call over to Paul I want to discuss the leadership transition plan we announced this morning as you saw from this announcement I decided to retire from my role as president and chief executive officer later this year. The transition will take place on or before the end of our fiscal year on September 30th, 2026. The Bellring Board of Directors has started a national external search to identify the company's next CEO. I remain fully committed to helping Bellring brands achieve its full potential following the appointment of our new CEO. I will serve in an advisory role to ensure a smooth transition of leadership responsibilities and to provide strategic support to the company. I'm incredibly proud of all that we have achieved during my time with the company and the roadmap we have established in the future. It has been an unbelievable ride. 17 years ago, I joined a privately held company with approximately $20 million dollars in sales today we are publicly traded global 2.3 billion dollar business with significant runway still ahead of us while the growth is remarkable what I'm most proud of is the culture we have built along the way a special thank you to all of our employees who put their hearts and souls in our purpose every day changing lives with good energy the foundation of Bellring is strong, and I look forward to helping the board and the company's new CEO advance toward its next chapter of growth. Thank you for your interest in the company. I will now turn the call over to Paul.
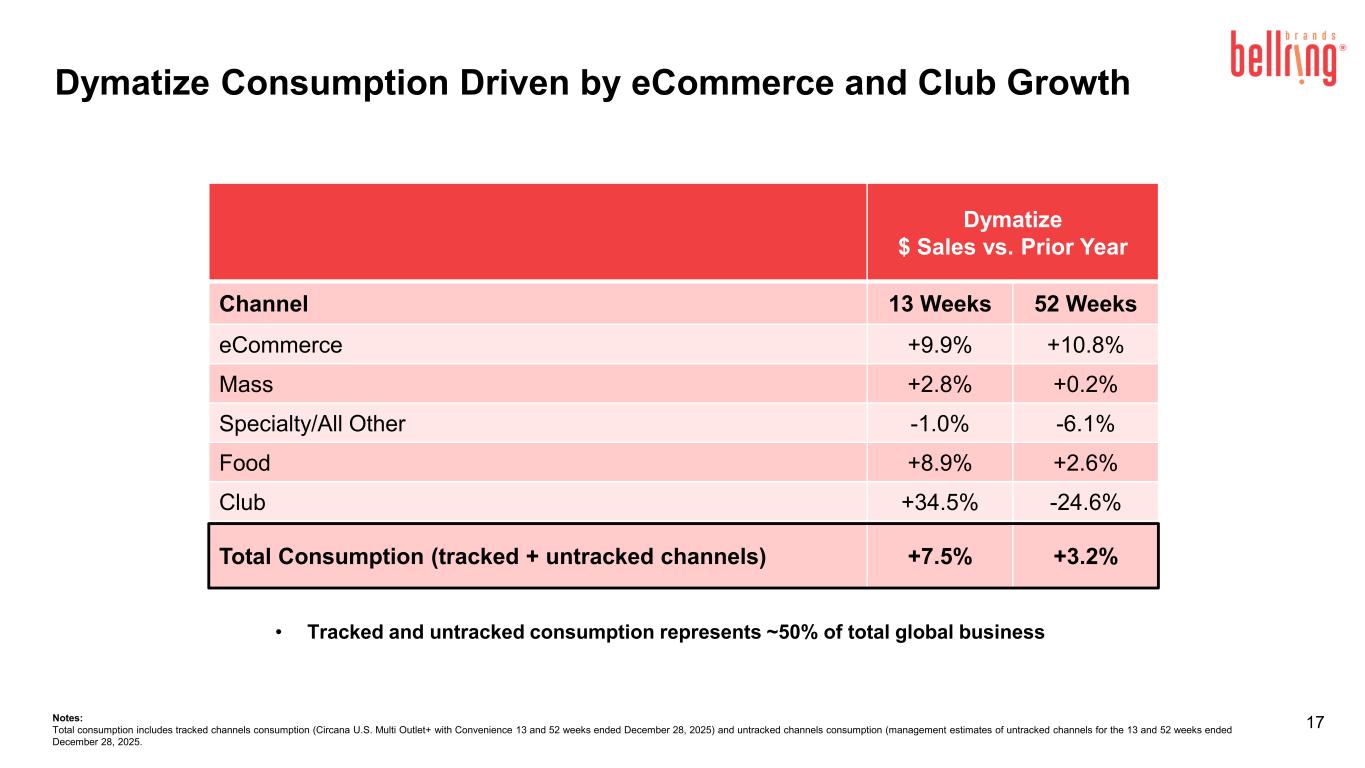
Thanks, Darcy. Good morning, everyone. Total Bellring net sales for the quarter were $537 million, up 1% over a year. We delivered adjusted EBITDA of $90 million at a margin of 16.8%. First quarter net sales were ahead of our expectations of down 5%, driven by timing benefit from customer orders that we previously expected in the second quarter and some upside at diamond size. Just a deep dive was ahead of our guidance on higher sales and SG&A leverage. Premier Prokey net sales were down 1%, with RTD Shake net sales down 2%. Premier Shake volumes were flat with price mix and unfavorable 2%. Diamantize sales increased 16% driven by strong volume performance, particularly in international. As we noted on our last earnings call, Q1 is our toughest comparison of the year in the club channel where we left a period with fewer new entrants and chose not to repeat promotions for Premier and Diamantize. Gross profit was $161 million with gross profit margin of 29.9%. Excluding mark-to-market adjustments on commodity hedges, adjusted gross margin declined 730 basis points. The decline was expected and driven by mid-single-digit input cost inflation, unfavorable mix, and lapping of $5 million of non-recurring cost favorability in the prior year. We expect whey protein inflation for the remainder of the year, while headwinds on our RTD shake milk proteins will moderate in the second half. tariffs had an unfavorable impact of 75 basis points on our gross margins in the quarter SG&A expenses were 78 million at 14.5 percent of sales versus 15 percent of sales in the prior year quarter before reviewing our outlook i'd like to make a few comments on cash flow and liquidity as expected the first quarter was a modest use of cash in line with our typical seasonality and we ended the quarter at net leverage of 2.5 times we continue to return cash shareholders through share repurchases, with $97 million repurchased in the first quarter. Turning to our 2026 outlook, we now expect net sales of $2.41 to $2.46 billion, which represents 4% to 6% growth. Just Diva does expect it to be $425 to $440 million, with a margin of approximately 18%. Our guidance reflects our updated consumption outlook for Premier and some upside from Diamond We now expect premier protein net sales to grow mid-single digits at the midpoint. In addition to healthy category tailwinds, distribution gains, including innovation and increased brand investment, are expected to lift sales growth starting in the second quarter with a more meaningful impact in the second half of the year. Volume performance is expected to be partially offset by a low single-digit headwind from promotional investment. We now expect modest growth in sales for the rest of the portfolio. For Dynatize, we have executed additional pricing actions to offset meaningful whey protein inflation and have brutally modeled in elasticities, which we expect to impact the second half of the year. Our updated adjusted EBIT guidance of $425 to $440 million incorporates our sales outlook, which embeds a slight mixed shift towards the lower margin Dynatize business, and a meaningful increase versus our prior outlook in whey cost, which is the primary input cost for our protein powders. Adjusted EBITDA margins are expected to decline 300 basis points year-over-year at the midpoint, with lower adjusted gross margins the primary driver. The gross margin decline reflects significant input cost inflation, the introduction of tariff costs, and the increased trade promotional investment. Tariffs are expected to have an unfavorable impact of 80 basis points on our full-year gross margins. The remaining EBITDA margin impact is primarily due to increased advertising, which is partially offset by other SG&A leverage. We continue to expect advertising as a percentage of sales of approximately 4%, with the largest year-over-year dollar increases in Q2 and Q3. For the second quarter, we expect net sales growth of 3% to 4%, with similar growth for both Premier and Diamantize. Consistent with the first quarter, second quarter, even the margins reflect significant commodity cost inflation and tariffs, as well as higher plan advertising investment. These factors, along with the tiny shift of sales into the first quarter, now result in a second quarter just EBITDA margin of approximately 13%. Our first half of just EBITDA margin is expected to be approximately 15%, largely in line with prior expectations, with significant sequential margin improvement expected in the second half. Specifically in the second half, our sales growth and cost savings accelerated. Dymatize becomes a smaller portion of our sales mix, and we expect significantly higher SG&A leverage. In closing, we are executing our operating initiatives as planned, expecting investments we are making in our brands this year to bolster our long-term position. Our business is highly cash-generative, and we have a solid balance sheet, which positions us well to fund growth initiatives while continuing to repurchase shares opportunistically. I will now turn it over to the operator for questions.
Operator
If you'd like to ask a question at this time, please press star 11 on your telephone and wait for your name to be announced. To withdraw your question, please press star 1-1 again. Please stand by while we compile the Q&A roster. Our first question comes from Andrew Lazar with Barclays.
Great. Thanks very much. Good morning, everybody.
I guess, Dr. Paul, I guess my one question would be the main hope for the mass merchandiser test you talked about is to sort of just further prove that Premier Protein and ready-to-drink shakes in general sort of belong, you know, outside the pharmacy section, deserve greater points of disruption in the store. In those, I guess, stores where the execution of this test is in full swing, maybe if you go into a little bit deeper, what sort of results are you seeing? And are they such that I think, if I'm not mistaken, this was supposed to be sort of a three-month sort of test.
Is there a possibility that based on the results you see that this gets extended or somehow changes the way Premier Protein is merchandised in either that store or others going forward giving you'll have some proof points for it thanks Andrew and yeah the the program is performing very well so we absolutely internally view this as a success and something that we want to bring to others first of all bring to that same retailer later in the year but also bring to other food drug mass customers and show the impact that they can have on their category and on our business we're seeing record weekly sales on the rollback items January was our largest month ever at this retailer I mean just a shout out to our team they're doing an amazing job but with execution specific and when I say our team the broader team we have an internal activation team that I talked about in prior calls as well as a new broker and you know they're in the stores all the time and it's working so I think you know we had we had we have good learnings this was really our first major kind of program if you think of I I mean, right now we have, you know, up to, it depends store to store, but we could have up to kind of seven displays throughout the store. Obviously, some are in testing, some are in fewer markets. But it is, we have really good learnings that we can now apply to other customers. So, yeah, thanks for the question. and we're really pleased with the results.
Operator
Next question comes from Megan Clapp with Morgan Stanley.
Hi, good morning, thanks so much. I wanted to ask a little bit about the consumption. Darcy, last quarter you talked about an expectation that December consumption for Premier would accelerate to low double digits and that would continue into January. I think you noted in the prepared remarks that some of the timing of the mass retailer partnerships just was the primary driver of Premier being slightly below, but it seems like into January the consumption is still running a bit below what you had expected, so can you just help us understand a little bit more of, you know, is that primarily what's going on in the club channel, you know, maybe some of the weaknesses persisted a bit longer than you expected on the promotional intensity into January, and just help us understand kind of what's embedded into the balance of the year for that channel in particular and maybe you can test around just the expanded steps as well and how that's factored in thank
you perfect okay so yes two main reasons and that we so premiere shake consumption was down two percent and in q1 and we we modeled and I predicted it would be flat so two main reasons one was what you talked about which slightly but we were slightly below the guide because of time the timing delay in setting up that math promo and then there's a second piece which is we started and I talked about it in my remarks but we saw a small impact from increased frequency of events from insurgent brands and that was mainly in club but also some in math as well so part of bringing down our you know narrowing our guide a couple points basically taking the top end off the guidance was we are flowing we're assuming that level of kind of frequency of events promotion throughout the rest of the year so that is and that is you know affecting kind of some of the January consumption that you're seeing too what I will say is and I think you guys are seeing it as well the consumption is improving so I think that although we kind of had a little bit of a late start then we expected lots of learnings there but we're starting to see a nice increase 6% all channels in January 16% outside of club so we are seeing some strong momentum we expect that to continue through and continue into you know throughout q2 and further indicate into eight into the second half as we start seeing our growth drivers become more meaningful and I think it
Megan there was another question in there just the extended shelf set any update you kind of have on that it's your largest customer yeah so you know as as we said last last call we expect that it would stay we still expected to got it thanks Darcy our next question comes from the line of David Palmer with Evercore ISI thanks good morning I wanted to ask you about just assumptions and you know going into the back half of the year or last three-quarters of the year I think your guidance contemplates mid to high single-digit consumption going forward and you know you January I know people are going to look at the the most recent trends, it's more like mid-single digits in terms of consumption for Premier Protein. And in that month, you could say that it's looking very promotional, not just by the competitors, but by Premier Protein. It looks like it stepped up to 65% volume mix from 45% a year ago. So I'm wondering if you could help us work with the recent trend and think about why trends would be at or above this going forward, you know, what are your key assumptions going It sounds like a couple new shakes in the back half would be one of them, because I think people are going to want to understand your guidance and why that's realistic.
Yeah, it's a great question. So, as I said, I think, you know, we expect consumption to improve in Q2 and further in We said consumption in Q2 would largely track net sales. I do want to hit your point. There is always weekly consumption noise. Depending on promo timing, year ago, this year, competitive promos, weather, hard to track weekly consumption. So I know it is the data we have, but it is just – it's going to be bumpy. And so what I would say just to zoom out is that in Q2, we expect our consumption to largely track net sales growth. We expect it to increase throughout the second half as our growth drivers become more meaningful. I'll go through some of those kind of reasons to believe and why you know I believe we will see that increase which is first of all distribution and merchandise there's really three pieces distribution and merchandising advertising and innovation so distribution and merchandising it's already starting to build that's what we're seeing in the consumption right now we're seeing some good momentum starting with our math partnership but also we have displays and also other food accounts so that will continue the next kind of pulse period is really Q4 but we have some small events also in Q3 the second one is advertising started in late December you know the new go get them campaign is to drive household penetration and and relevance to kind of the mainstream audience I love the campaign is tested better than any other campaign that we've ever had but that is a lag it has a lag on consumption meaning you know call it a couple months before you start seeing it impact consumption and so that will more impact kind of the back half and lastly innovation so we launched our coffeehouse already in mass we are extending that to a club account this month so that's exciting that will start rolling out through to the other accounts throughout the year I talked about some LTOs that we have coming in that's new that always I mean it seems like a small thing but it always generates a ton of excitement for consumers and specifically excitement for retailers because they know these things sell and there is some bias for action so we often get a lot of displays associated with the LTOs and lastly you know I kind of teased this idea of a couple new lines and although they're later in the back half yeah they're exciting lines you know one we are you know hitting kind of a higher protein levels and then the other one which I was you know purposely vague on it is that it is a line of products that's just a completely different drinking experience than what we have as our in our 30-gram shakes so again a lot of activity going on and that's why you're going to start seeing the acceleration in consumption especially in the back house thanks for that our next question comes from Thomas Palmer with JP Morgan
hey it's Elsa on for Tom so you've mentioned in the past that you'd expect some of these smaller brands that have entered into the club channel to start filtering out and I think you've already maybe seen that happen in some cases could you just give us an update on where that stands today you know are you still seeing more entrants coming into the channel or is it starting to go the other way thanks um yeah we are seeing I think there is you know with a category like this that has the growth and the potential that that we see it is expected
to have you know more competition the way I have described this before but it probably would be helpful to just hit it again the way we break down the category is we have about half the category of the leading brands which includes premier then about call it 10% of the category of these insurgent and crossover brands which is really what you're asking about and then about 30 percent of the category are declining legacy brands which has been meaningful shared donors over over the years there's an extra 10% that basically just follow the category growth but in general if you think of those three key areas we the insurgent brands much like other categories like energy there's a lot of brands that come in and out we're actively watching repeat rates we have already seen you know some brands not make it especially in club because those thresholds are very high and and so yes we've already seen kind of the shake out what I expect is that 10% of market share that we're seeing with insurgent and crossover brands that will probably stick it'll just be a different set of brands that are competing so I would say that yes we're continuing to see kind of a shakeout we are just you know we're watching remember it this is where low household penetration category you can have you know you can have multiple winners and don't forget that there is kind of 30% of the categories that have been meaningful share donors and will continue to be our next
question comes from Jim Solera with Stevens good morning thanks for taking our question you called out several of these challenger brands being more promotional and i wonder do you have any data on the consumer shopping behavior for any of these particular brands when the promo rolls off is there an instance where consumers are just really being attracted by kind of the prominence of the discounting but once that's pulled away they revert back to previous brands any commentary you can find on that would be great yeah i don't know if i have specific um data on that i would just say we're watching it i mean
And here's what we do see, you know, we assumed, and I talked about it last call, given, you know, these insurgent brands, they're going to spend to try to get their foothold in the category. So we knew that this next year, 26, it would be, you know, slightly elevated promotional spending. What I would say, you know, what we're, what we saw kind of year to date is frequency. So it's less about like more depth, it's more about just frequency of events, especially in club, but also we're seeing it in mass as well. So I would say, I mean, it's early, it's only a few months in, I think we have conservatively embedded this higher number of events throughout the year but I would say to have specifics about kind of what you're asking about bump and stick I think is what we call it internally I don't think necessarily we have that data but as you can imagine we are watching it very closely Great.
Operator
Our next question comes from Alexia Howard with Bernstein.
Good morning. Can I ask about Dymatize, specifically what's driving the growth in the international market to be higher than expected? And then domestically, how are share trends moving since the quite favorable Consumer Reports article about the fact that the brand does not have heavy metals in it to the same degree as the competition. Thank you, and I'll pass it on.
Yeah, Larcy, I'll start with Dynatize, and then if you can weigh in on our second question. You know, Dynatize International has been performing very well, you know, for a long period of time um we saw really throughout 26 or fiscal 25 where dynamitize performed well in a number of markets across the globe um middle east um south america you know central america so it's performed very well um we have a great sales team uh or a great management team over international we have great distributor partners um around the world and so it's just continued to perform well you may recall we expected actually we had a really strong q4 we thought some of that was maybe a pull forward ahead of pricing the q1 actually came in better than we expected and so that's why we now think that q1 will stick and we've raised our expectations a bit on international but it's just it the brand resonates um i think the competitive set perhaps in the international markets is a little bit different um a little less intense perhaps than you see in in the U.S. The shopping experience, I think it's still, you know, a lot in specialty channel stores, whereas out of the ocean states, it's been pivoting more to online and more in some of the mass channels. But like I said, it's continued to perform well, and we expect it to continue. Darcy, you want to take the second part of that?
Yeah, with regards to U.S. share trends I mean it's pretty flat so you know we're basically growing with the category I would just say that you know the challenge the brand is a really strong brand and yeah nice to get some acknowledgement in some of this with some good PR but it but there are challenges on weight pricing I mean I know that Paul talked about it having some headwinds but that's facing the entire category so you know we've kind of pulled back on on support for Dynatize just to manage the P&L candidly so because the the way pricing is so high but overall it's a strong brand well-known and holding share basically in a growing category.
Operator
Our next question comes from the line of Yasmin Deswandi with Bank of America.
Hey, guys. Good morning. I just had a bigger picture question. So in your slides, you talk about expanding your category definition from convenient nutrition to wellness. So is there any reason we should infer that there has been, you know, a change to your portfolio priorities or M&A priorities as you, you know, maybe look into expanding into these categories, or is it, you know, or is it kind of holding as is?
Yeah, Yasmin, so just – let me just give you a little more context on the category definition change. So, you know, we do a pretty thorough category study with consumers. The last one we did was about four years ago. Category has changed a ton since then. So, when we did it this last time, there were some new types of products that consumers put into this category. First of all, they don't call it convenient nutrition, they call it wellness, and so then we're going to evolve the name. But other products like some, you know, powder products like hydration powder products, think protein coffee, different types of isotonic protein drinks, even you've started to see like protein sodas around so like those types of product and expanded protein treats so all of those things go into our category which makes it you know increase about 10% which is not insignificant. As far as your question around does it change you know how we're thinking about you know M&A and different things like that I would say it absolutely I mean we are a consumer obsessed company so we are constantly looking at what consumers want and how we can get incremental sales whether it be through organic innovation which are some of the things that you know we are really focused on internally but also we obviously look at an inorganic opportunity as well our next question comes from Brian Holland with DA Davidson yeah thanks good
morning just to clarify first Darcy high level obviously the consumption inflection second half December January was not so where you thought it would be and And obviously, you've explained some of the reasons that might be. So I just wanted to isolate and ask whether the mass retailer merchandising event, whether that is performing to expectation and, you know, it was maybe impacted by, like you said, the lag in the rollout, what's happening in club, or is competitive activity in that mass retailer where we're seeing a bunch of rollbacks, et cetera, Is that weighing on the actual performance at that customer relative to expectations? And then the second part of the question, which I guess is kind of totally separate, but should sight lines into similar merchandising events here as we look over the balance of the year that we can anticipate, whether it's in club, which is obviously even a pressure point, or elsewhere?
Okay. I'm going to answer your first question, and I might – you were going in and out a little bit, So, you might have to repeat the second one, but let me hit the first one. So, in the match retailer, the delay, the kind of delay was the biggest contributor to the softer consumption. small impact from increase from competition but the larger was the timing and I would say now that we are fully set up the event is is hitting our expectations so like I said that the bigger you know the bigger reason was just the delay. So, then your second question.
Yeah, I'm sorry. I'll remove the headsets. Hopefully, this is clear. I paused for any technical difficulties there. So, just the second part of the question was sight lines into similar merchandising events either at this mass customer or other customers, club, et cetera, over the balance of the year.
Now, as we're, you know, just maybe one quarter in that we that might similarly catalyze demand yeah we're in the process of if you can imagine I mean we're on Feb 3rd and we just kind of are seeing the kind of impact that it's having so the team is putting together some materials to go back in obviously we already have line of sight to kind of our promotional plans I think now what we're trying to do is going back in and making them bigger honestly so coming with this information showing what the potential is showing pictures also you know I don't I want to hit this like execution because showing what great execution can look like for us because this execution is much better than we've ever had before we haven't had these type of displays we haven't had these type of singles displays and then having people you know having you know our brokers come in and making sure that it's stocked so we're now going out with this information and trying to make the the promotions that we have sold into bigger our next question comes from John Anderson with William Blair
Hey, thanks. Thanks very much. Just a quick one that's kind of related to that last question, Darcy. I think on the last call you mentioned real focus, along with your merchandising or broker partner, securing displays for singles and entry price point multipacks. To what extent does that kind of play out the way you would hope? I don't know if it's the mass delay, but more broadly. And are there incremental costs that you as an organization have to absorb to kind of take on this new capability that would have a longer-term effect on profitability or margins in the business?
I'll hit singles and progress, and I'll let Paul talk about costs. Yeah, I would say it's early, but it's working. So, you know, I said in my remarks that singles in January were double what they were last year. So, I think that it is, we're getting these displays out there, we're getting trial, and, you know, it is starting to work, but it's early. so I would just say that and we're learning a ton and we're learning you know do do we need do we need people in the store restocking shelves more often than we're doing it right now do we need them in certain stores in other regions and not another so it is it is like a very steep learning curve but it's exciting because I think the most important thing is the consumer pull and we're seeing that so we know we have the right product we know we were you know this is we know getting out of the aisle is key we know singles for instance will get well you know get new new trial from consumers and household pen so now it's just about you know really quickly implementing these learnings and then I'll pass your follow-up class.
Yeah, you know, we talked about on the last call that we're obviously making significant investments this year on promotions, merchandising, brand, you know, marketing, all the brand investments. So, yes, there is some incremental cost to the merchandising that we believe is obviously going to help us build, continue to build our sales growth and fuel this business. So there is some incremental, but that's all contemplated in our guidance. And it's not a dramatic change on just the merchandising piece alone, but there is some incremental cost.
Operator
Our next question comes from Camille Godfra-Wallis with Jeffries.
Hi. We're going, you know, and I think you've mentioned it a few times as we're, you know, we're going into a major protein boom or trend, maybe bubble, whatever you want to call it. And I guess I'm trying to work out with all your commentary around promotions and competition, does it feel irrational? The big difference perhaps between energy drinks and maybe this category is this category seems to be a lot more promotional than energy drinks are. And so I'm just wondering as you see this race for protein everything, is it happening in a sort of a healthy way from a proper perspective or do you feel like there's some irrational actors and we just have to work through the process of them coming and going? Thanks.
Yeah, great question. So, okay, let's get back. So, the category actually is usually not that promotionally driven. Now, I actually don't know the energy. You probably know that better. But it's about 25% to 30% sold on deal. So, compared to, you know, a lot of other categories in the store, that's pretty low. Having said that, this year is higher. as I mentioned the reasons as far as rational actors yeah I would say that some of the insurgent brands are less rational and I think that we expected some of that because they're trying to gain trial and so they're going to be you know spending to do so so I'll just give some examples you know in club you know there are these insurgent brands that are spending a ton of money on demos on you know promotion displays etc I think that I think if you zoom out I do think this is kind of a point point in time I do not think it is the new normal I think part of it is what you referenced which is it's like this protein craze and it's like a land grab I think that you know we fully expect that you know once retail once retailers kind of consolidate around the best performing brands this heightened promotion should eventually come down but as you know I talked about reason why for narrowing the guide was mainly because we're going to expect it kind of frequency events especially by these
insurgent brands will continue for the year got it thank you our next question comes from Robert Moskow with Petey Cowan Hey, I was hoping to dig a little deeper, Darcy, into M&A and just how you and the board think about, you know, risk and reward. So you mentioned insurgent brands many times. Are any of them that, you know, do you think any of them will stand the test of time? And if so, you know, there is an example of this in the energy drink category with two big energy brands merging and creating some real distribution and marketing synergies. Is there an opportunity for that to happen in the protein shake category as well?
Yeah, there is a, as you guys see, this is a super dynamic category. I don't think it's ever been as dynamic as it is now so many you know new brands new format kind of protein and everything I think we are seeing there will absolutely be some winners and there will there they're going to be some brands that we look back on and don't even remember their names so you know I think that we are watching we are paying attention we are watching repeat rates we are evaluating the kind of consumer metrics to see and in incrementality and interaction with our brands to see if there are any that we think would be interesting you know add-ons to our business we're always looking at both organic and inorganic growth. As far as like, you know, a bigger, you know, something bigger, I would just say in any dynamic category, there is always opportunity.
Operator
Our next question comes from Steve Powers with Deutsche Bank.
Great, good morning, Darcy Paul, thanks. I wanted to pivot back to some of the the innovation that you teased Darcy but from a slightly different perspective and specifically as you as you as you do things like envisioning these shakes with more protein and more notably the different drinking experience that you referenced I'm just curious as to what extent you can leverage existing capacities for those initiatives and any implications that may have on your ability to scale and distribute those those new products quickly and smoothly or any implications on up for profit margin contributions relative to the core. Thank you.
So, from a distribution standpoint, well let's go for capacity first and I'm assuming you're talking about, you know, co-man capacity. It depends. So, I think, you know, some of our innovation is absolutely leveraging our existing co-manufacturers, but some of our innovation is looking at new co-manufacturers. I think what is, I think, you know, exciting for me is, you know, we have invested and built an incredibly strong operations function. We have, you know, a national network of co-mans. We know every single, you know, co-man that makes a protein-type product, and so – and we have a, you know, a team that is really good at startups now. We've done a lot of them. So I think that – so some will use existing, some of them use new. As far as distribution standpoint, we will use existing – we'll use our existing distribution for all of the new products. I think as we go down the path of, you know, working on kind of a DSD solution, obviously, that would – we would be able to, you know, sell these products in those channels as well. But right now, we are all about using our existing distribution channels.
Operator
Our next question comes from John Baumgartner with Mizuho Securities.
Thanks for the question. Darcy, I'd like to stick with innovation. You know, historically, Premier has focused on flavors, and it's broadening now to protein content and these differentiated experiences you mentioned. But, you know, given your core consumer is this everyday type of consumer rather than someone who's maybe looking for something specialized or premium priced, how do you think about the incrementality of this forthcoming slate of innovation relative to cannibalization of the baseline? And then by product line, you mentioned the focus this year is support of Coffeehouse. To what extent do you plan to continue investing behind indulgence? Or is indulgence sort of the emphasize here as you support these two new lines or platforms?
I think the consumer is evolving, so even the mainstream consumer. So I think this is where a portfolio is really helpful. So I think, you know, if you think of our 30-gram product and all the different flavors are perfect for people just coming into the category, then they start evolving and start looking for different things. I think some of the new innovation that we're coming with goes after an incremental consumer as well as an incremental occasion. So again, our innovation strategy is very simple, it's all about incrementality. So from your second question just about coffeehouse and indulgence, they're very different. so I think you know intelligence has been very successful and you know we just launched it a year ago and and it's been a strong a strong contributor and it is really been mostly around incremental occasions and I think you know coffee house is unique because it has it's kind of you know flirting with the energy category a little bit with the caffeine equivalent of a cup of coffee we've had a lot of success with cafe latte this is kind of taking that but but running with it so no I if those they have two distinct positions within our portfolio and actually very little overlap okay thank you that concludes today's question and answer session this will conclude today's conference call Thank you for participating, you may now disconnect.