Operator
Good day, and thank you for standing by. Welcome to the BellRing Brands Fourth Quarter Fiscal Year 2025 Earnings Conference Call. Please be advised today's conference is being recorded. I would now like to hand the conference over to your speaker today, Jennifer Meyer. Please go ahead.
Speaker 1
Good morning, and thank you for joining us today for BellRing Brands Fourth Quarter Fiscal 2025 Earnings Call. With me today are Darcy Davenport, our President and CEO; and Paul Rode, our CFO. Darcy and Paul will begin with prepared remarks, and afterwards, we'll have a brief question-and-answer session. The press release and supplemental slide presentation that support these remarks are posted on our website in both the Investor Relations and the SEC Filings sections at bellring.com. In addition, the release and slides are available on the SEC's website. Before we continue, I would like to remind you that this call will contain forward-looking statements, which are subject to risks and uncertainties that should be carefully considered by investors as actual results could differ materially from these statements. These forward-looking statements are current as of the date of this call, and management undertakes no obligation to update these statements. As a reminder, this call is being recorded, and an audio replay will be available on our website. And finally, this call will discuss certain non-GAAP measures. For a reconciliation of these non-GAAP measures to the nearest GAAP measure, see our press release issued yesterday and posted on our website. With that, I will turn the call over to Darcy.
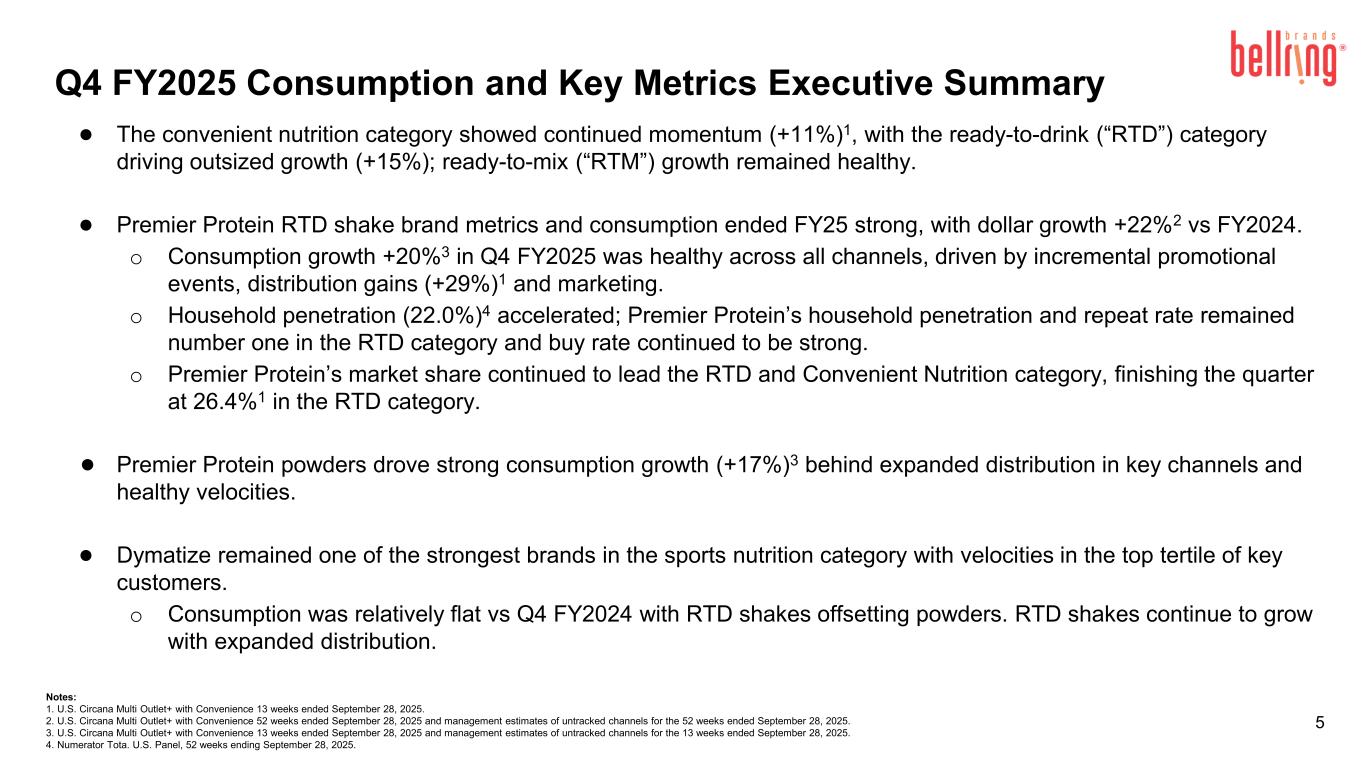
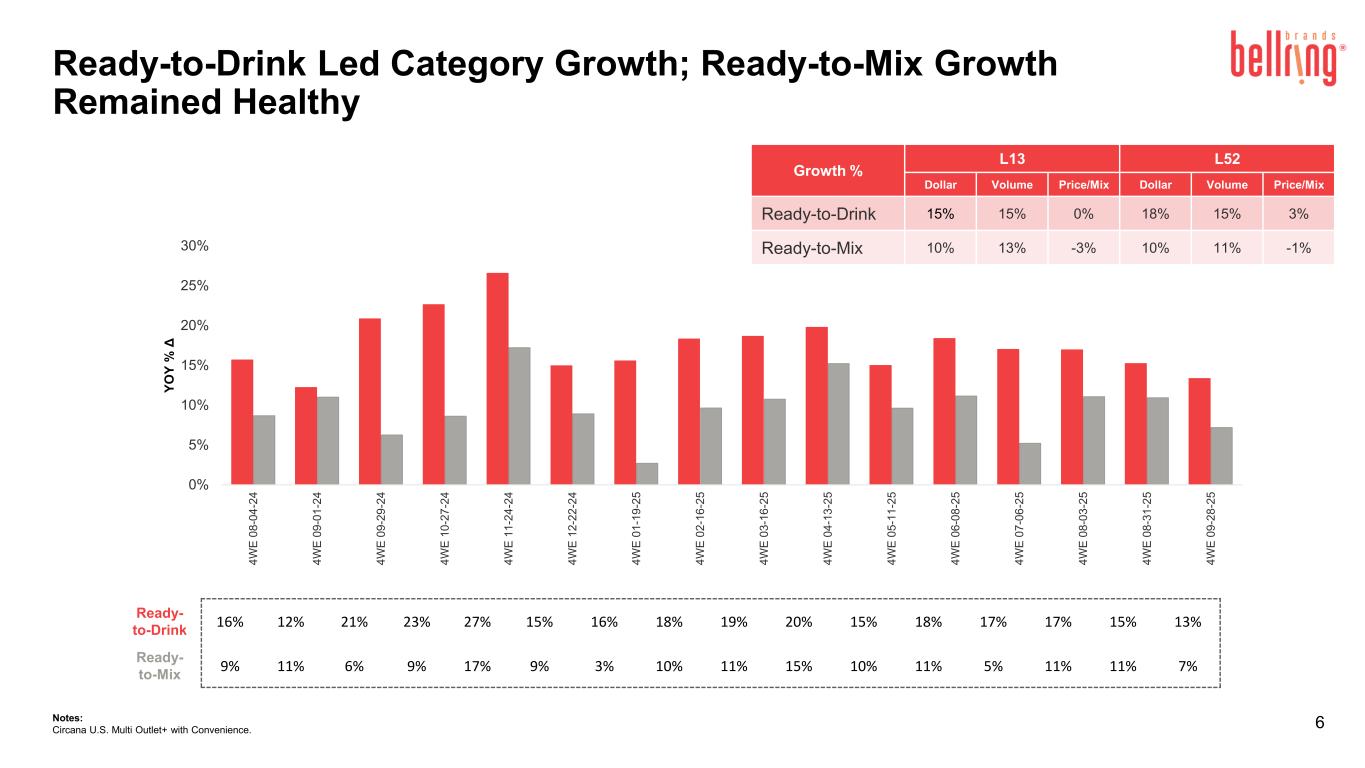
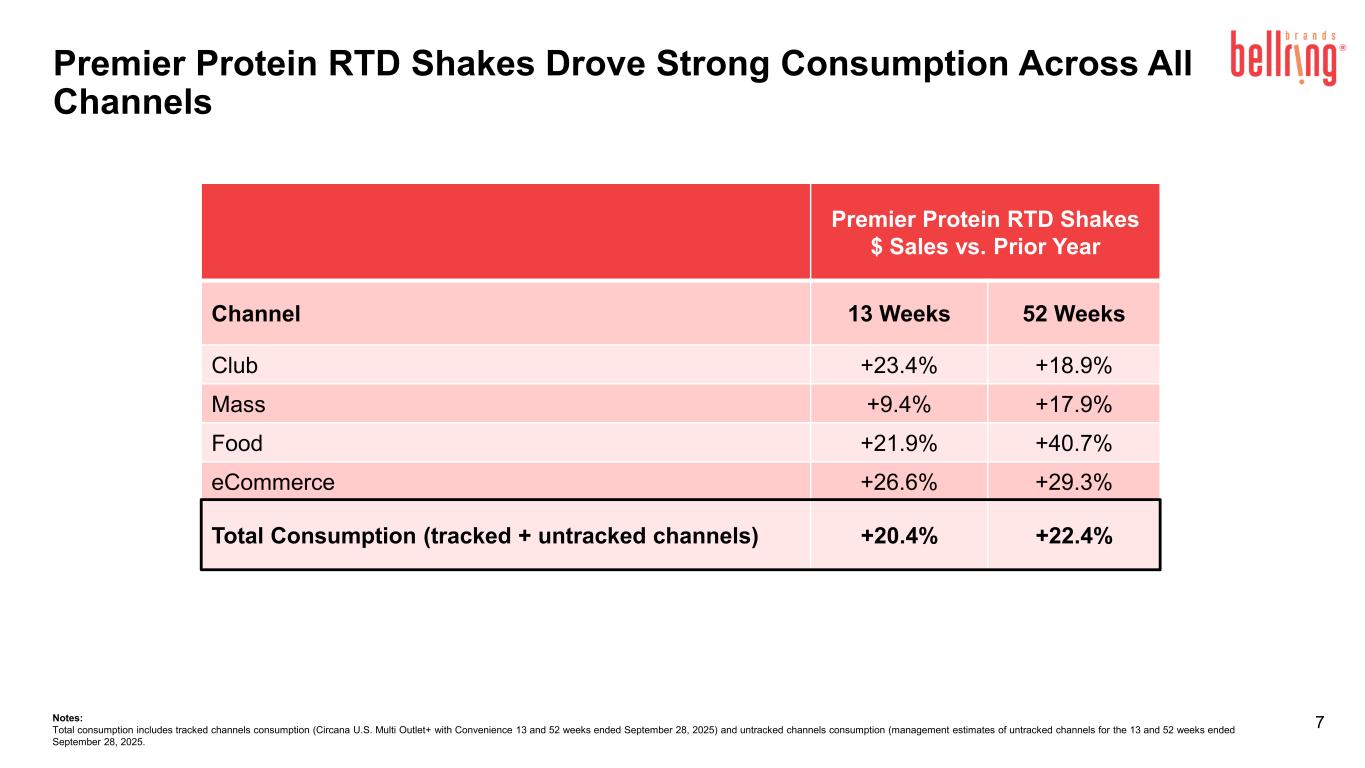
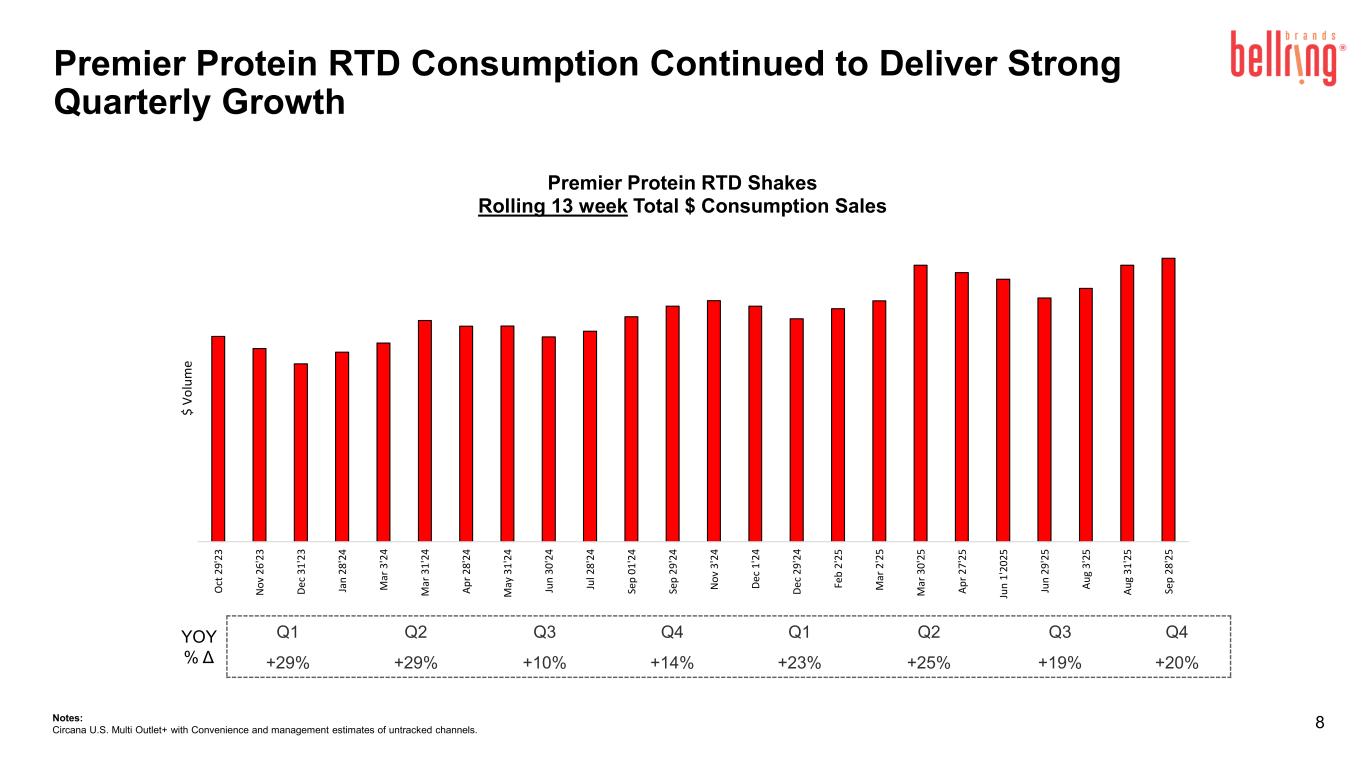
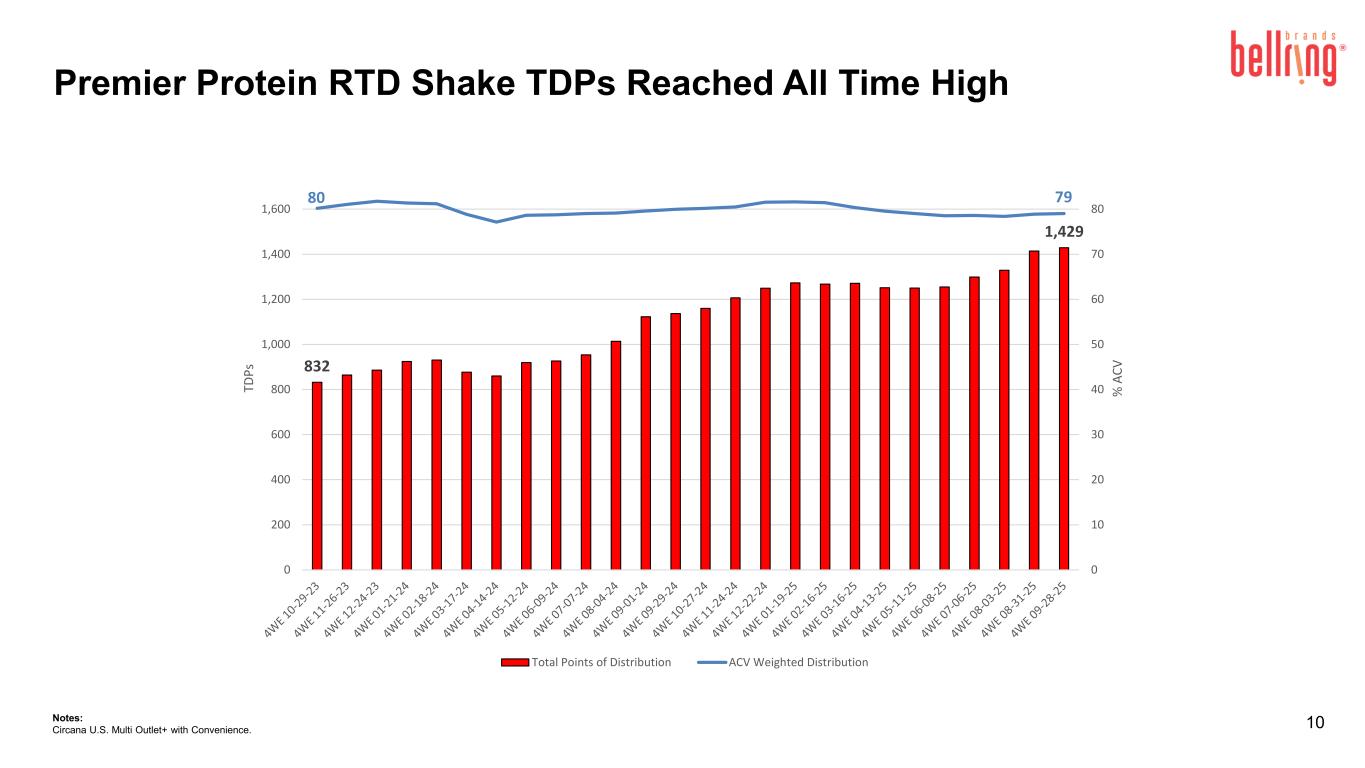
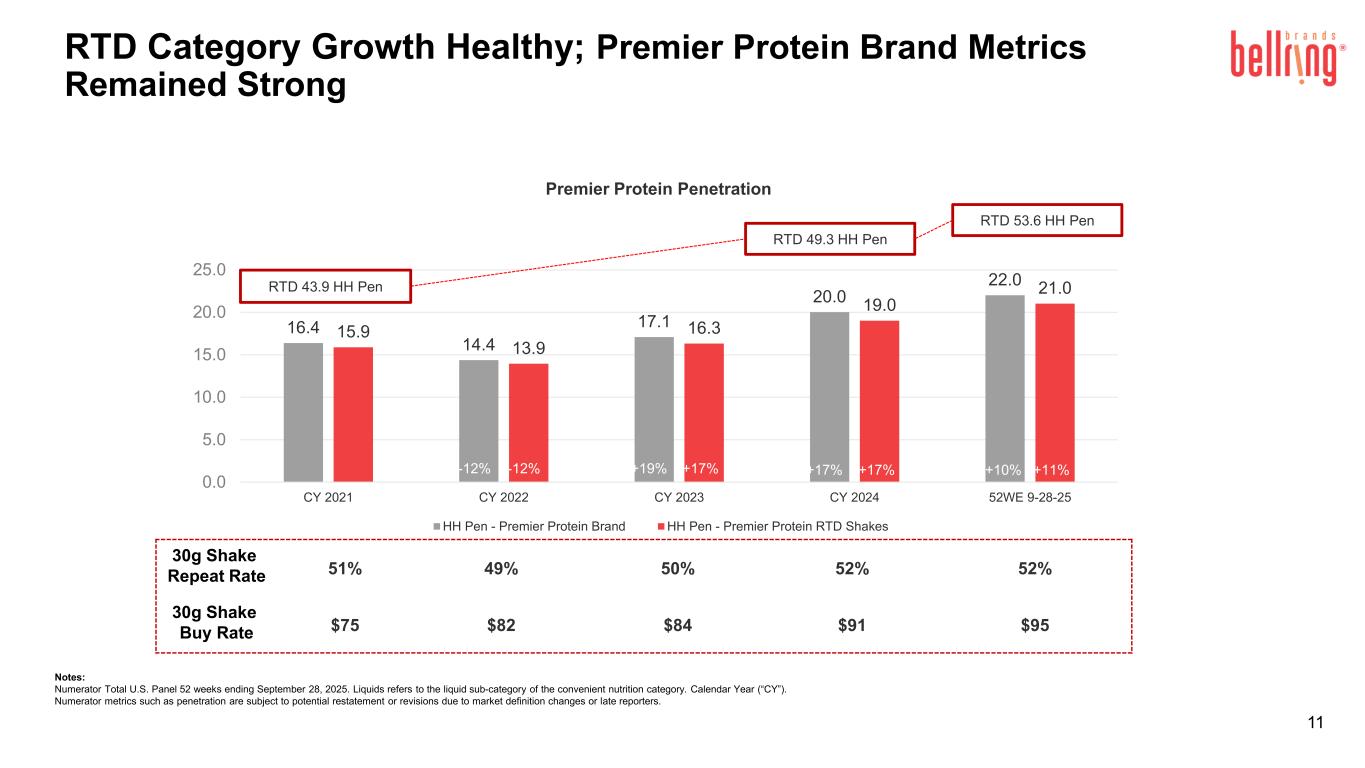
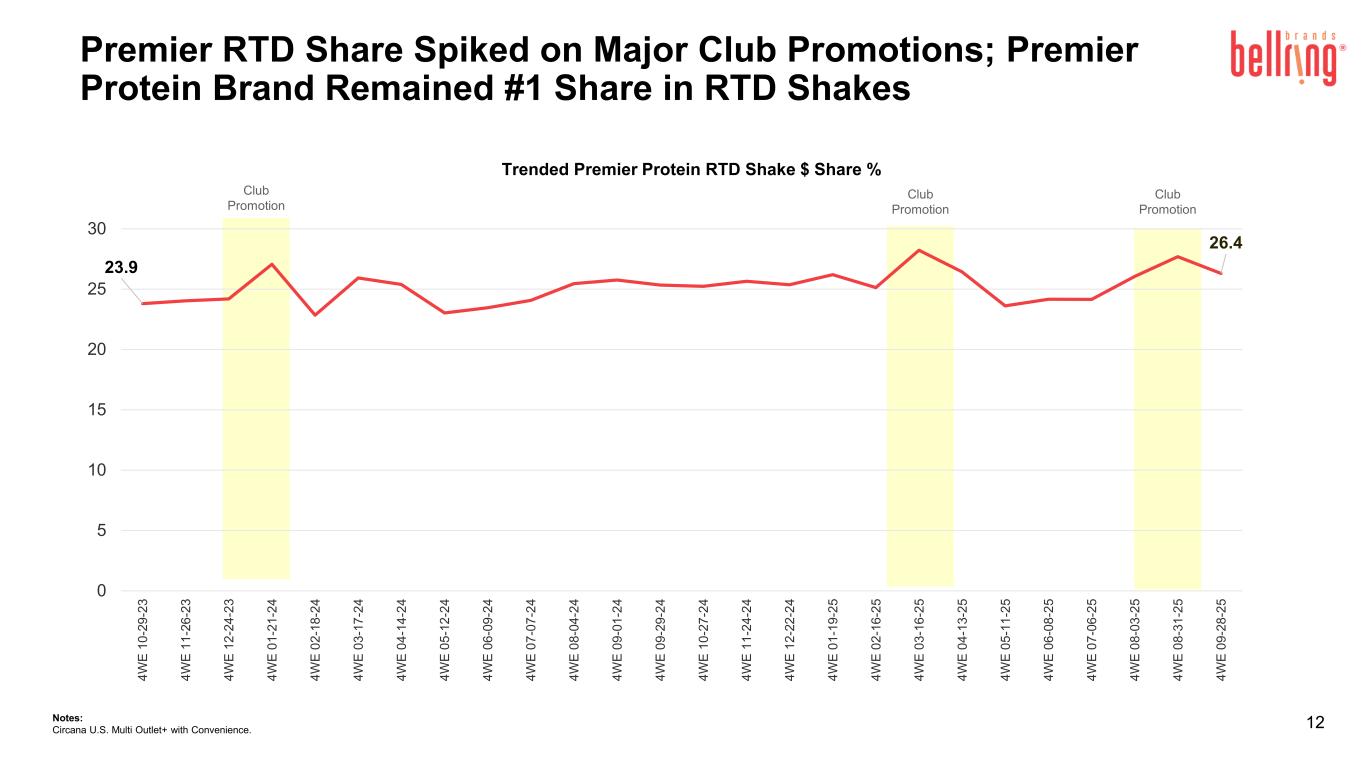
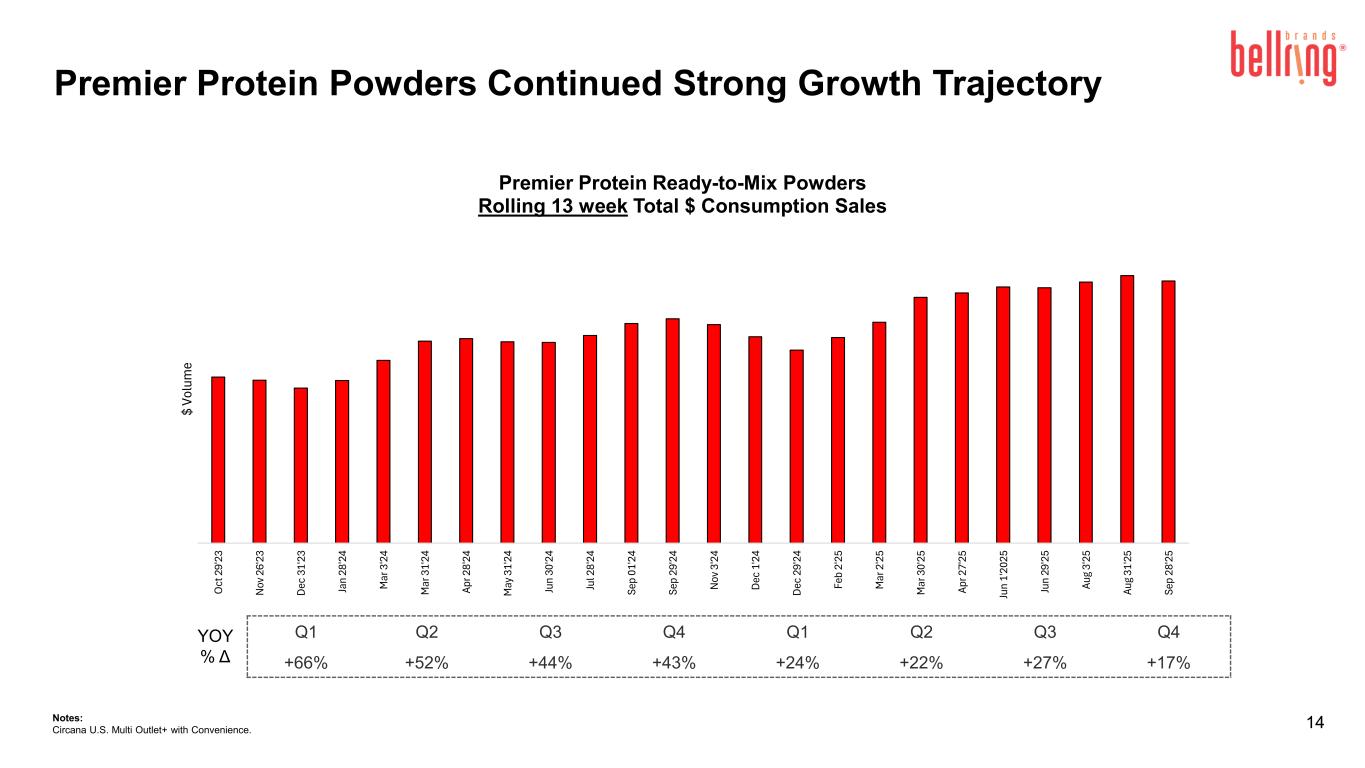
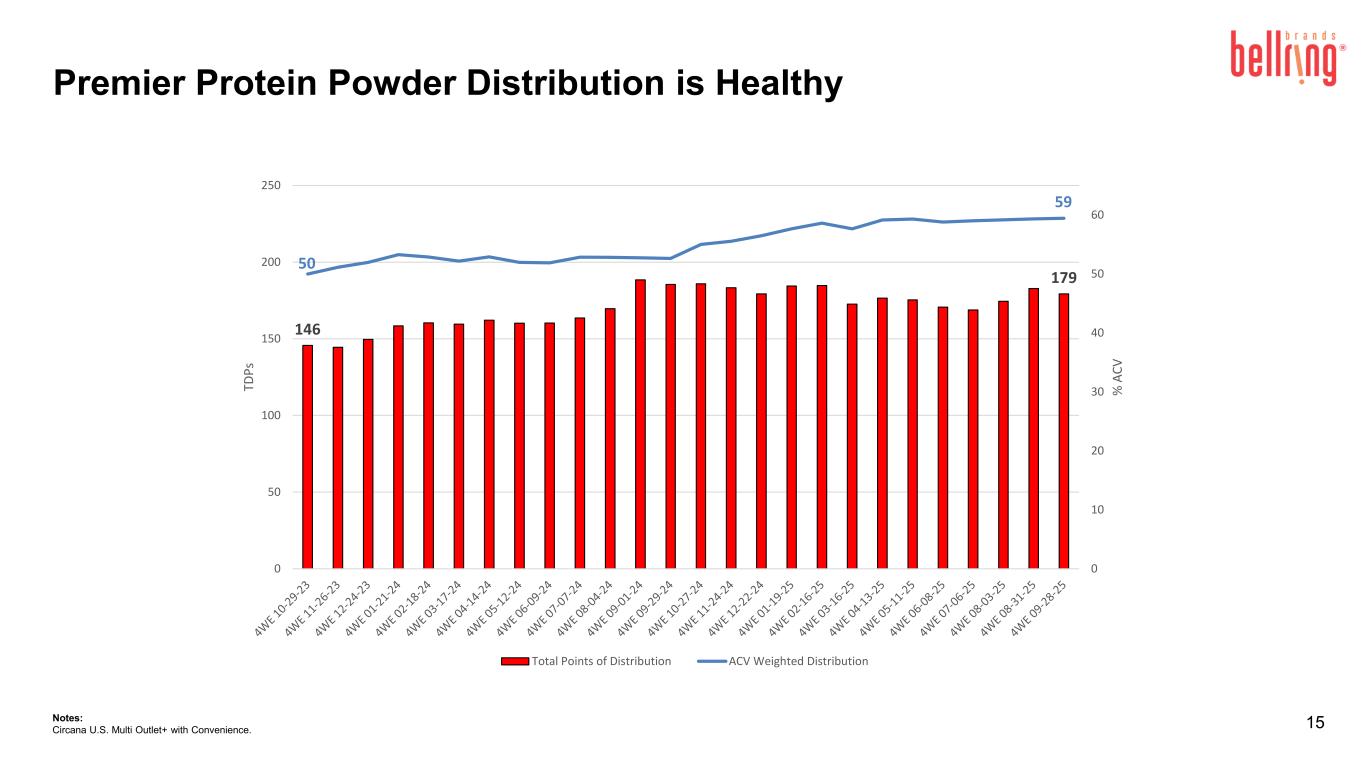
Thanks, Jennifer, and thank you all for joining this morning. Fiscal year '25 was a strong year for BellRing Brands. Net sales grew 16% and adjusted EBITDA margin reached 20.8%. We launched our first media campaign since '21, delivering compelling returns, expanded distribution while elevating retailer partnerships and accelerated our multiyear innovation strategy. We also advanced our savings program, enhancing flexibility to reinvest in future growth. Our strong track record of cash generation continued this year, and we meaningfully stepped up our share repurchases, buying approximately 7% of our shares outstanding. We expect another successful year in fiscal '26 with a softer Q1 followed by a stronger balance of the year. Paul and I will provide additional detail on our guidance and quarterly cadence. Turning to the fourth quarter. The ready-to-drink shake category grew 15%, while Premier shake consumption grew 20%, driven by incremental promotion events. Premier continues to have category-leading metrics, including the #1 household penetration and the category's highest repeat rate. Notably, both household penetration and buy rate increased during the quarter, reinforcing the brand's unmatched strength and consumer loyalty. Now turning to the category. RTD shakes are one of the fastest-growing CPG categories, fueled by consumer health and wellness trends, functional beverage preferences and GLP-1 usage. Household penetration of 54% highlights a long runway for growth as it trails mature CPG categories, which are often at 80% to 90%. Retailers are leaning into this opportunity, increasing category space, testing higher traffic aisle locations and expanding display space to capture growing consumer demand. The success of this category, which has doubled in retail sales since 2019 to $8.7 billion, has naturally attracted competition. Currently, the two leaders, including Premier Protein, have approximately 50% market share. The other participants include newer insurgent and crossover brands and some declining legacy brands. Of note, legacy brands, which collectively represent approximately 30% of the category, have been meaningful share donors for several years now. Over time, we expect retailers to consolidate the shelf behind a handful of the best-performing brands and move them to more heavily trafficked aisles. We believe that mainstream appeal, high repeat rates and execution capabilities will determine the long-term winners. Premier Protein is well positioned to benefit from these developments and continue to lead the category. Over the next few years, we expect RTD shake category dollar growth to be high-single to low-double-digit, with volume the primary driver. In late '25, a major club retailer significantly expanded their RTD assortment. While we do not know for certainty, we assume the expanded assortment continues through fiscal '26. We expect pricing benefits to subside and promotional spending to slightly increase as new brands work to establish themselves in the market. These near-term dynamics lead us to expect category growth in the high single digits for '26. In the medium-to-long-term, we expect more marketing spending, expanded shelf space, innovation and the mainstreaming and affordability of GLP-1s to drive higher household penetration and category growth. We are confident in our continued strength of the category. Premier's deep category knowledge, strong brand equity, scalable manufacturing network and robust retailer relationships give us confidence that we will continue to be the category leader and capture meaningful share of long-term growth. I'll now turn to our long-term targets. BellRing began its journey as a public company six years ago with $850 million in revenue. Our total revenue base is now $2.3 billion, and our Premier Protein shake revenue has tripled. Since IPO, we have delivered a net sales CAGR of 18%, significantly ahead of our long-term revenue growth projection of 10% to 12% shared at the time of our listing. There are multiple ways to achieve strong growth in our business. However, it becomes more difficult to grow at double-digit rates of a larger revenue base. And in the near term, we are expecting a more competitive environment. As a result, we are updating our long-term revenue growth algorithm from low double digits to high single digits, specifically 7% to 9%, with Premier Protein driving our growth. This assumes that Premier Protein, the #1 market share brand will continue to grow relatively in line with the RTD category, while Dymatize slightly weighs down our growth rate. We are maintaining our adjusted EBITDA margin algorithm of 18% to 20%, which embeds higher levels of brand investment enabled by our cost savings agenda. These investments are designed to reinforce our brand strength and position us for sustained profitable growth over the long term. Our updated revenue growth algorithm is healthy. And together with attractive margins and our asset-light model, we expect to continue to generate strong cash flow and create significant value for our shareholders. Turning to our outlook for '26. Our '26 net sales guidance is a range of 4% to 8% growth with adjusted EBITDA margins of 18%. At the midpoint, sales for the year are expected to be modestly below our long-term algorithm because of the softer first quarter driven by specific items and near-term competitive dynamics. We expect performance to strengthen with the remainder of the year at the top end of our algorithm. Adjusted EBITDA margin is expected to be at the lower end of our range, primarily due to significant commodity inflation and tariffs, along with the lagged revenue impact of increased brand investments. For Q1, we expect flat consumption for Premier RTD shakes with October and November lapping the toughest club channel comparisons, including a nonrecurring promotion. For context, we are lapping 23% consumption growth in the first quarter of '25, which included very strong club consumption with the smallest number of new brand entrants in an incremental promotion. Q1 net sales largely follows consumption with some additional timing-related headwinds impacting sales, resulting in a roughly 5% decrease in net sales. Paul will provide more detail later. We expect consumption along with net sales to accelerate starting in mid-December. As we move through the year, our FDM merchandising initiatives, advertising and innovation become more meaningful contributors to our growth and club comparisons ease as we lap expanded assortment. Now I'll provide additional details on our operating plans for '26. Our priorities for this year include: one, continuing to grow our distribution both in and out of aisle; two, increasing advertising investment while elevating its impact; and three, launching innovation that provides consumer excitement, adds occasions and drives trial. Distribution, both in and out of the aisle, is a major opportunity. Starting with club, we intend to bolster our position in the club channel with new products, increased sampling and additional promotional spending. We expect our performance in club to improve as we move through the year. Our Premier shake total distribution points increased driven primarily in mass, food, drug and e-commerce channels grew by more than 20% in '25, and we have strong plans to expand at similar rates in '26. As I mentioned last quarter, we have partnered with a new broker to significantly expand store level coverage and launched an internal retail sales team focused on securing in-store displays, especially singles and entry price point multipacks. In late Q1, we will launch a partnership with a major mass retailer that includes placements across pharmacy and grocery aisles plus extensive displays and end caps. This program will also include the first launch of new shake innovation targeting incremental occasions, which I'll discuss later in my remarks. Our second priority is advertising. We saw a strong return on investment in fiscal '25 and decided to further invest and elevate our creative in '26. Premier has the highest unaided brand awareness in the category, though there remains significant opportunity for expansion. We have strengthened our agency roster and we'll be launching a new creative campaign designed to drive household penetration, strengthen emotional connections and bring fresh energy and relevance to the brand. The campaign kicks off in late December and includes national TV and strong digital components. Turning to innovation. In fiscal '25, we conducted a comprehensive demand study and incorporated the results into our multiyear innovation strategy. The study validated our product focus for '26 and identified several white space opportunities, some of which that we have accelerated launching in late '26 and early '27. Specifically, in '26, we are intensifying our focus on innovation across flavors, consumer segments and occasions. In June of '25, we launched almond milkshakes, our first non-dairy protein offering, with the strategy of bringing new consumers into our brand. Although early, it is already the #2 turning four count in the non-dairy RTD set. We are seeing strong incrementality with nearly half of the buyers new to the brand. Almond milkshakes are expanding distribution throughout '26 and supported by advertising. About a year ago, we launched our indulgent line with the goal of driving incremental occasions; it worked. In '26, we will build on that success as well as the success of our Café Latte core shake flavor with our new Coffeehouse or proffee shake line. Each shake provides 30 grams of protein and the caffeine equivalent of one cup of coffee, meeting the protein and energy consumer need, which is incremental to our core baseline. It will be offered in caramel macchiato and mocha targeting a sweeter taste palate. Coffeehouse launches in mid-December in both mass and e-commerce channels. The launch will be fully supported with paid media influencer partnerships and in-store signage and sampling. And lastly, Premier is known for its flavor innovation, and we will continue to bring flavor excitement to the category throughout the year. In closing, Premier has a history of strong growth and is the #1 brand in one of the fastest-growing categories in retail. The power of the brand is evident in our record high household penetration and repeat rates. Our first-mover advantage lies in being a scaled pure-play company with attractive margins and deep category expertise. Retailers see the category's potential, and they are partnering with Premier as they develop their growth plans. Q1 has some unique dynamics that are causing near-term challenges, but growth in the balance of the year is strong. The brand and business fundamentals are robust, and I have confidence in delivering the year. We are investing in our brands, sharpening our execution and innovation plans and driving our savings agenda to enable our next phase of growth. I remain confident in our future and our ability to create sustained long-term value for shareholders. Thank you for your interest in the company. I will now turn the call over to Paul.
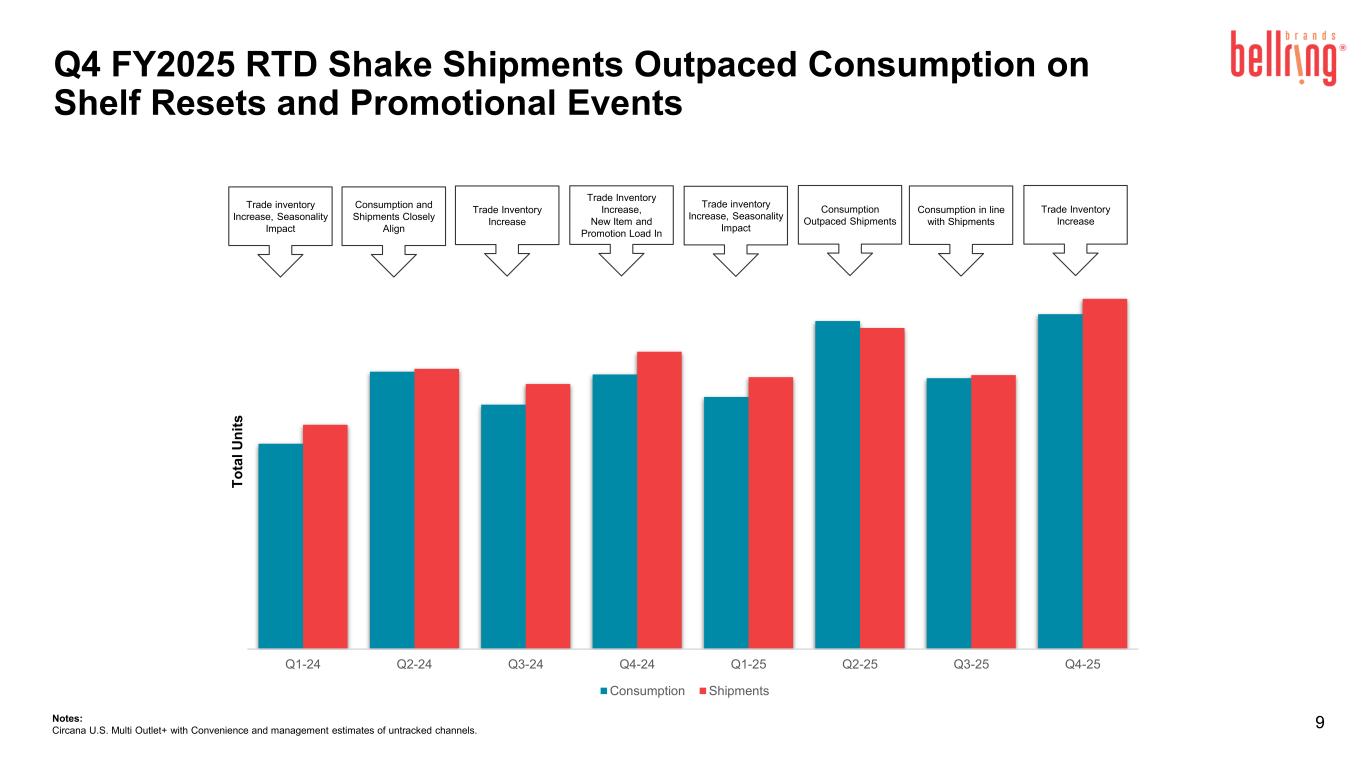
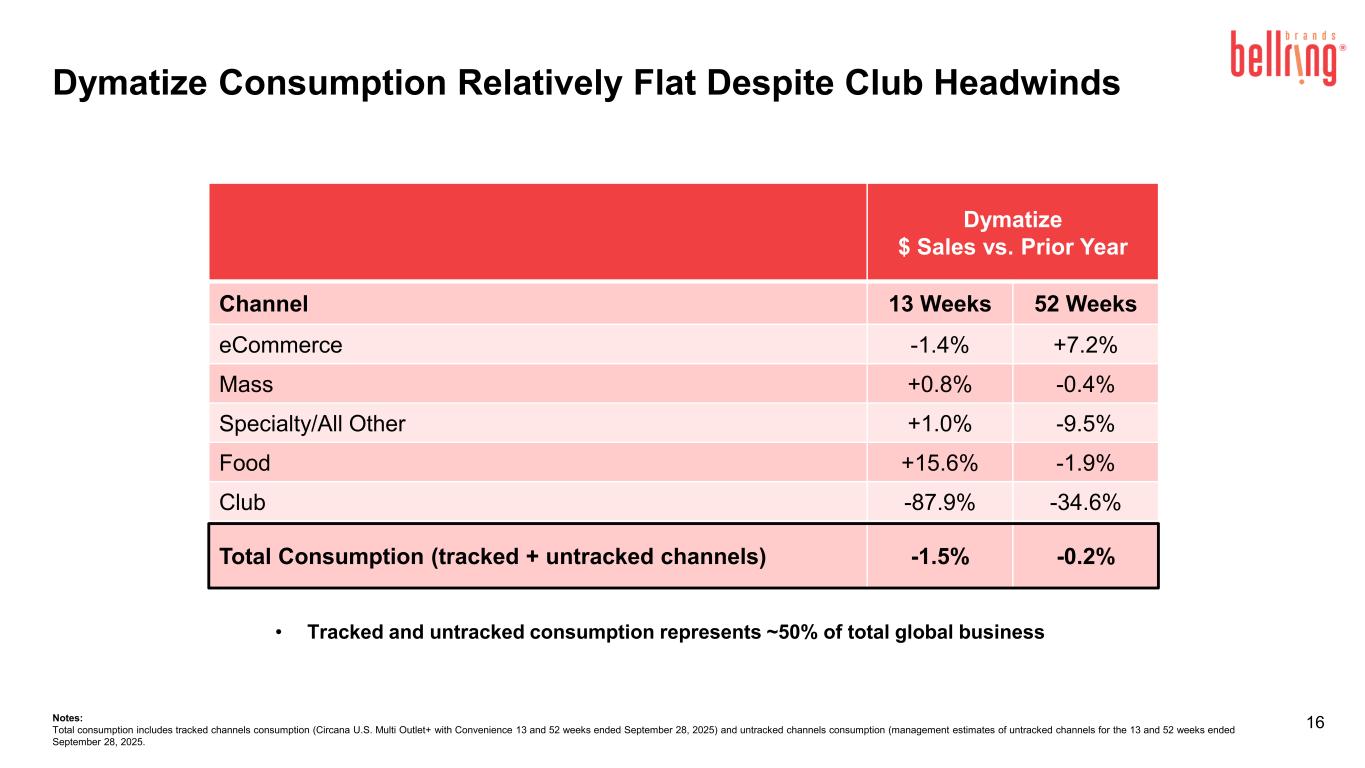
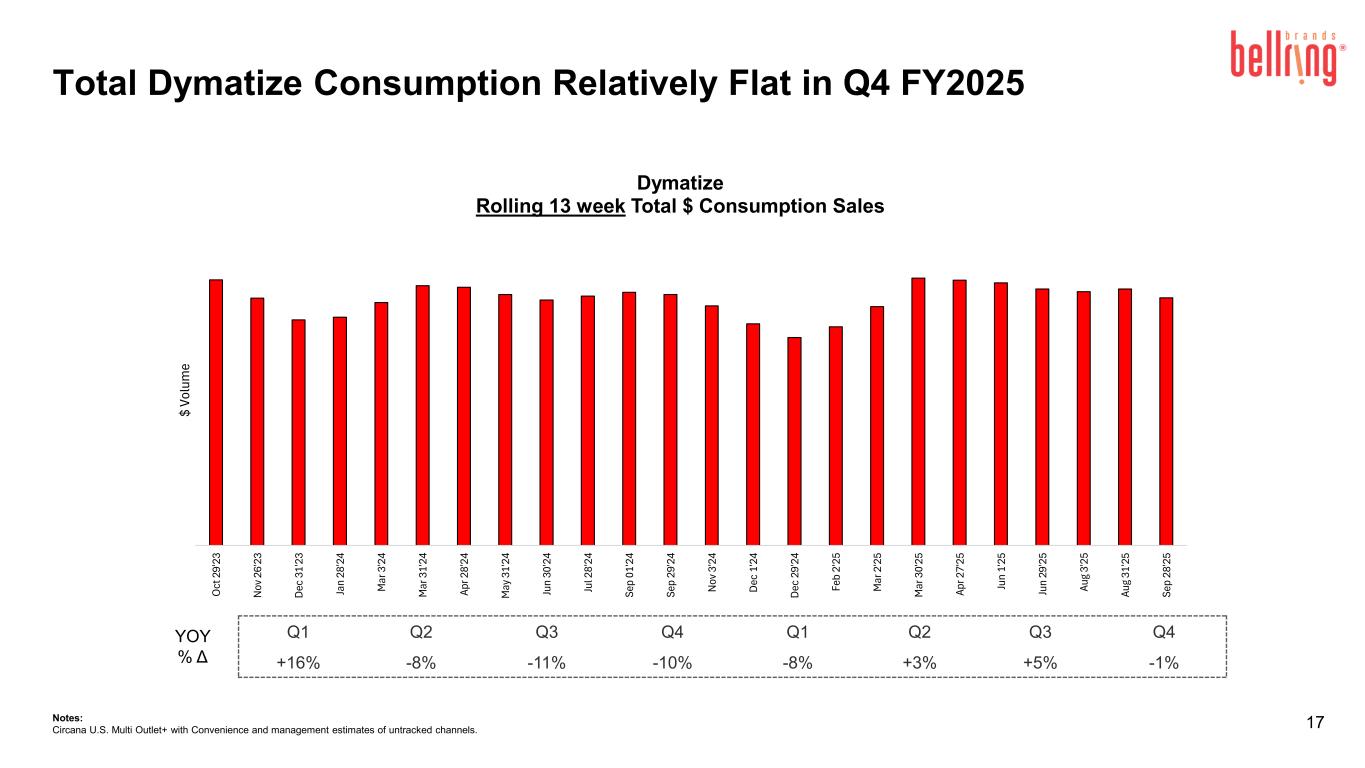
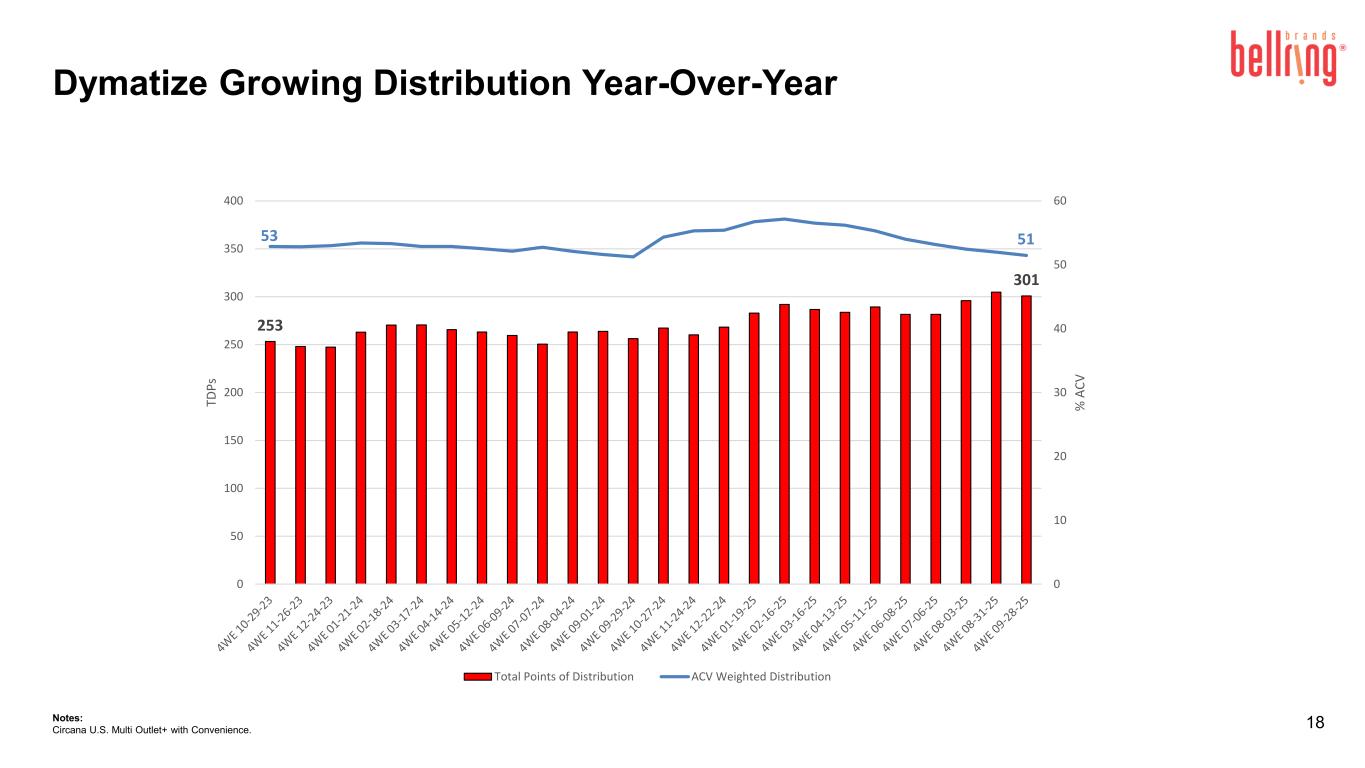
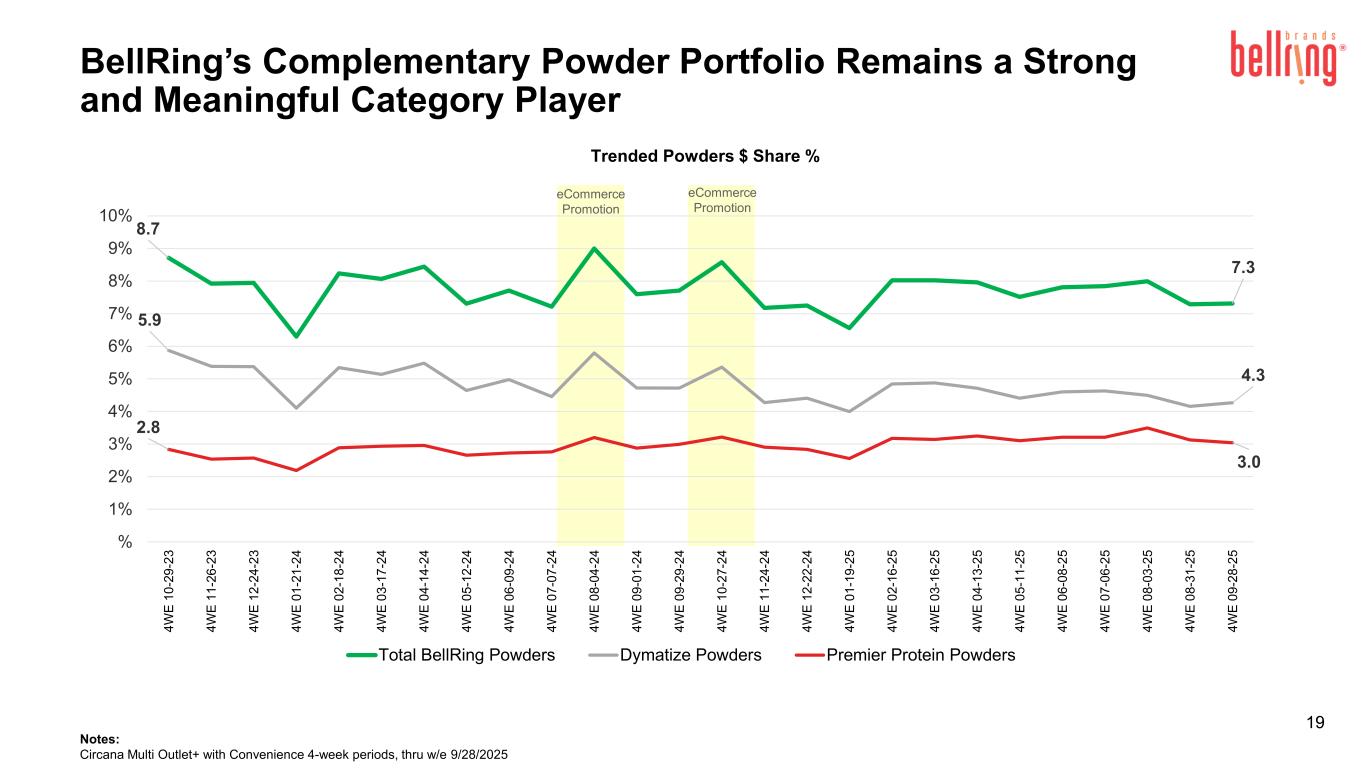
Thanks, Darcy, good morning, everyone. Fiscal '25 was a year of strong performance for BellRing with net sales growth of 16%, adjusted EBITDA of $482 million and an adjusted EBITDA margin of 20.8%. Our business generated $261 million in cash flow from operations, and we ended the year at a net leverage ratio of 2.1x. Our strong balance sheet enabled us to repurchase 9 million shares or $473 million in total or approximately 7% of shares outstanding. We've continued to repurchase shares in October with $40 million repurchased to date in the first quarter. In the fourth quarter, net sales were ahead of our expectations at $648 million, up 17% over the prior year. We delivered adjusted EBITDA of $117 million at a margin of 18.1%. Premier Protein net sales grew 15% and were in line with our expectations with strong volume growth for our RTD shakes and putters. RTD shake sales grew 14%, driven by volume growth from incremental promotional events and distribution gains offset partially by unfavorable price mix. As expected, Premier shake dollar consumption was up 20% and outpaced revenue growth. This difference was driven by expected changes in trade inventory, primarily the previously noted e-commerce fee load as well as the pricing impact from our incremental promotional events, which had an outsized impact to our net sales compared to consumption at retail prices. Dymatize net sales growth of 33% was well ahead of our expectations, driven by strong volumes. International benefited from strong consumption and a volume pull forward ahead of our late Q1 price increase with the latter and expected headwind to Q1 growth. Adjusted gross profit, which excludes mark-to-market adjustments on commodity hedges, was $192 million and declined 4% from the prior year. Adjusted gross profit margin of 29.7% decreased 620 basis points. The decline was driven by mid-single-digit input cost inflation, increased promotional activity and one-time packaging redesign costs. Protein costs stepped up in the quarter across both powders and shakes, and we expect these headwinds, most notably on powders, to continue into fiscal '26. SG&A expenses were $81 million and delivered significant leverage at 12.5% of sales versus 16% of sales in the prior-year quarter. The reduction in expenses was driven by lower marketing and advertising expenses as expected as we lapped a period of heavier media and testing. I'd now like to discuss our long-term targets and capital allocation priorities, followed by our 2026 financial guidance. As Darcy discussed in her remarks, we now target long-term annual net sales growth of 7% to 9%. We expect our business to maintain strong profitability and are reiterating our long-term adjusted EBITDA margin algorithm of 18% to 20%. In 2023 through 2025, we exceeded our adjusted EBITDA margin algorithm. That performance reflected strong sales growth with favorable pricing and a more constructive commodity cost environment prior to the second half of fiscal 2021. Advertising spend as a percentage of net sales was also relatively low at approximately 3% given past supply constraints. Looking ahead, our adjusted EBITDA margin algorithm reflects a healthier level of Premier brand support with total company advertising investment increasing to 4% to 5% of net sales and promotional spending at competitive levels. Our adjusted EBITDA margin algorithm also now incorporates the impact of tariffs. As previously communicated, tariffs will begin to impact our P&L starting in fiscal '26. While we have mitigated much of our tariff exposure, we do expect an ongoing annualized impact to our margins of approximately 120 basis points. We continue to evaluate ways to further mitigate these impacts. To bolster our margin target, we have accelerated cost savings initiatives across our organization. The primary areas of savings involve more efficiently utilizing our co-manufacturing, warehousing and transportation networks as well as procurement savings from ingredients and packaging. Longer-term, our cost savings efforts, normalization of record highway protein costs in 2026 and modest SG&A leverage are expected to be supportive of improvement in our EBITDA margins. Our disciplined capital allocation priorities remain unchanged. We will first invest in growth initiatives, including innovation, marketing and systems and process capabilities. Second, we expect to remain asset-light with low capital expenditures. After investing in our business, we expect to be aggressive and opportunistically repurchasing our shares with M&A being a longer-term priority. Turning to our fiscal '26 outlook. We expect net sales of $2.41 billion to $2.49 billion. This represents 4% to 8% growth. Adjusted EBITDA is expected to be $425 million to $455 million with a margin of 18%. From a brand perspective, we expect high single-digit sales growth from Premier Protein at the midpoint. Premier's volume growth is expected to be driven by continued category tailwinds, distribution gains, including innovation and brand investments. Volume performance is expected to be partially offset by low single-digit headwind from promotional investments as Darcy mentioned in her remarks. We expect high single-digit sales declines for the rest of the portfolio. For Dymatize, we're executing a price increase beginning in late Q1 to offset meaningful whey protein inflation and have prudently modeled in elasticities. Additionally, we are reducing brand investment as we navigate high protein costs and the brand has a difficult sales comparison in Q4. Specific to Q1, total net sales are expected to be down approximately 5% of both Premier and Dymatize declining largely in line with our overall decrease. Consumption growth for Premier Protein shakes is expected to be flat. In Club, Q1 is our toughest comparison of the year where we lapped a period with fewer new entrants and chose not to repeat promotions for Premier and Dymatize. Additionally, Dymatize had a strong fourth quarter and benefited from a sales pull forward from Q1 of approximately $8 million, mostly related to shipments ahead of our late Q1 price increase. Together, the non-repeating promotions and sales pull forward are a 4-percentage-point headwind to our first-quarter growth. As we move into Q2, we expect an acceleration in both consumption and net sales with the balance of the year sales to grow at the high end of the algorithm at the midpoint of our guidance. This is driven by Premier, which we expect to outpace overall company growth for the balance of the year, as robust merchandising programs in the FDM channel phase-in for Q2 and beyond and club comparables ease. Moving to fiscal 2026 adjusted EBITDA. We expect adjusted EBITDA margins to decline 280 basis points at the midpoint with lower adjusted gross margins, the primary driver. Adjusted gross margins are expected to be pressured by significant input cost inflation, particularly whey protein, the primary input costs for our powders, the introduction of tariff costs and promotional investment with margin pressure primarily in the first half of the year. Tariffs are expected to have an unfavorable impact of 80 basis points on our gross margins, net of mitigation and the impact of timing. The remaining EBITDA margin impact is primarily due to increased advertising, which is partially offset by SG&A leverage. Advertising as a percentage of sales is expected to be approximately 4%, with the largest year-over-year dollar increases in Q2 and Q3. We expect Q1 adjusted EBITDA dollars to be below prior year levels with a margin of approximately 16% to midpoint, primarily driven by lower sales and gross margins. In Q2, adjusted EBITDA dollars are expected to improve sequentially, with margin rate approximately 100 basis points lower sequentially due to a combination of higher sales, including Dymatize pricing, continued high commodity inflation and the timing of advertising support. We anticipate adjusted EBITDA growth in the second half due to higher sales growth, easing commodity inflation and higher cost savings. In closing, fiscal '25 was a strong year, highlighted by robust top-line growth and strong profitability. We feel confident in our plans and ability to deliver our 2026 guidance and long-term outlook. Premier is the #1 shake brand with durable competitive advantages in an attractive category, and we expect the investments we are making this year to bolster our long-term position. Finally, our cash-generative business and strong balance sheet enable us to fund our growth plans while also opportunistically repurchasing shares. I will now turn it over to the operator for questions.
Operator
Our first question comes from Steve Powers of Deutsche Bank.
Speaker 4
Darcy, a lot has changed over the last six months in your categories and around your business. Could you start off by summarizing what you've observed and how that's influenced your plans for 2026 as well as your updated long-term views? Also, why do you believe the outlook you've landed on is the right one, both for the upcoming year and in the long term?
Sure. I would begin with what remains unchanged. The momentum in the category persists, and household penetration is still low, around 50%, indicating significant potential for growth. There's arguably even more momentum in the category now, and Premier's standing within it has not shifted. We continue to be the top brand with the highest household penetration and repeat purchases, supported by a robust national supply chain. These factors are key constants. However, the competitive landscape has evolved, which was anticipated. From my perspective, the category consists of leading brands, including Premier, which capture roughly 50% of the market. Then there are insurgent and crossover brands, holding about 10%, and declining legacy brands, making up around 30%, who have contributed to market share changes over the years. Looking ahead, I believe that the leading brands will maintain their prominence, while there will be a mix among the insurgent brands, resulting in some successes and some failures. The declining brands will likely continue to lose ground. Regarding our guidance and strategy for 2026, I feel optimistic. We face a challenging first quarter due to unique circumstances, including a period with fewer new entrants and a major club customer, as well as some one-time promotions. Despite this tough quarter, it doesn't reflect the overall business performance. The prior three quarters have shown substantial growth, and I have strong confidence in the health of the category. We are implementing robust plans, the rest of our business is rapidly expanding, and we have a few exciting partnerships, including one with a mass retailer that I believe signifies potential success in other grocery accounts along with improvements in advertising and innovation. This gives me reason to be optimistic about the future, along with my perspective on the category.
Operator
Our next question comes from Andrew Lazar with Barclays.
Speaker 5
Darcy, last quarter you mentioned that you didn't have much clarity regarding the repeat rate for the new entrants in the category, especially with your largest customer. I'm assuming you have more clarity now on this matter. More importantly, how does this impact your expected shelf set for the upcoming year at your biggest club customer? I was hoping you could provide an update on this situation, as it seemed to be a key reason you weren’t able to offer guidance for 2026 last quarter, which many had anticipated.
Yes, I can provide an update. We now anticipate that our major club customer will continue to support the expanded product range, which differs from our previous expectations. This indicates that the competitive landscape will broaden and remain consistent. We are closely observing the repeat purchase rates, and it's evident that not all emerging brands will succeed; a shakeout is expected. The standards that must be met by these club customers are high, which will lead to a changing mix of smaller brands entering and exiting the market. We have learned that our fifth pallet with this customer will transition out, but the rest of our business is performing strongly. Overall, the category is robust and has growth potential. Among insurgent brands, there will be both winners and losers, given the difficulty of meeting the required thresholds. We are in a strong position compared to our competition, and our repeat rates are improving. Additionally, we are gaining some volume from our competitors, which gives me confidence in our long-term business outlook, even though there has been some complexity this quarter.
Operator
Our next question comes from Megan Clapp with Morgan Stanley.
Speaker 6
I just wanted to ask about the club channel, again, maybe following up a bit on Andrew's question. There's been a lot of unique dynamics, not just here in the first quarter, but all year in the club channel. And clearly, it's an important channel for the category a bit more mature for you. But when we think about the acceleration that you talked about that you're going to see in mid-December and the kind of down 5% to up 9% or so embedded in the guide. How much is driven by the club channel in particular? And can you just tell us what that means for what you're expecting for growth in the club channel this year? And how the various headwinds and tailwinds kind of shake out in your mind as you think about that channel.
Yes. We expect that the major growth will primarily come from outside of the club channel. We have observed stronger growth for many quarters in our food, drug, mass, and e-commerce channels. This is where we see the most potential and opportunity for the category and for us. Our guidance assumes that club comparisons will improve over time, but the growth is mainly driven by the other channels. Additionally, I mentioned reasons to be optimistic regarding distribution, merchandising, advertising, and innovation.
Operator
Our next question comes from David Palmer with Evercore ISI.
Speaker 7
Thank you for your insights on your investment areas. Many of us will be analyzing the all-channel scanner data and consumption data. I'm curious about your expectations for consumption trends as we move through the rest of the fourth quarter, and whether you anticipate an increase into the second quarter. Could you share your plans and how you are considering the impact of rising competition and potential surprises, as well as the role of innovation in driving growth?
From a consumption standpoint, we expect to continue facing challenging club comparisons in November, particularly due to the nonrecurring club promotion from October. So, anticipate slightly negative low-single digit results throughout November. However, we expect to see an acceleration in the latter half of December as we approach the New Year. With our mass partnership, we anticipate low double-digit growth for all of December, which will ramp up towards the end of the month. This momentum should carry through January, February, March, and beyond. There are some unique factors affecting the club channel right now that will eventually ease. The nonrecurring club promotion is quite specific to October and November, but following that, we expect continued acceleration as we introduce additional demand drivers. David, what was the other question?
Speaker 7
Well, how you're thinking about increased competition being headwind, perhaps including some room for surprises there, but also contribution to growth, and how you're thinking about just the innovation giving you some help on some of the consumption numbers you're thinking about?
Yes, I believe our guidance is very prudent and conservative. It takes into account the ongoing competition. That's one of the reasons why I feel optimistic about achieving our goals throughout the year, quarter by quarter.
Operator
Next question comes from Brian Holland with D.A. Davidson.
Speaker 8
I wanted to follow up on the discussion regarding comparisons for the remainder of the year. Looking at Premier Protein's consumption, it was somewhat softer in the second and third quarters last year in clubs. Overall, consumption remained strong throughout the year. I understand you conducted a longer promotional event with your largest club customer this past August and September. Could you provide a bit more insight into why you believe the comparisons will be easier as we move forward in the year? Additionally, what visibility do you have into competitor shelf placements as we progress?
I'll begin, and then Paul, feel free to add anything. Our club comparisons are becoming easier. In our largest club customer, the expanded set started easing in the third quarter and continued into the fourth quarter. We are now comparing against a period with less competition, particularly in the first and second quarters. The comparisons are more challenging at the beginning. Moving forward, we have a decent visibility on competitive entrants for the first half of the year. We are uncertain about our reset for the second half. As the leading brand in the category, our retail partners are looking to us for guidance on their category decisions. There are exciting developments underway. I mentioned earlier that in various retailers, including club chains and major food retailers, they are testing higher traffic aisles to promote the category. They are selectively introducing only the best-performing brands, those with the most mainstream appeal, into these new high-traffic placements. Premier Protein is obviously included in this, while some legacy brands will remain in the pharmacy section. This dynamic is currently being tested, but we don't see it impacting consumption immediately; it will likely have an effect in the medium term. These developments are promising and indicate the direction of the category and where we, as the leading brand, are headed.
We experienced very strong distribution gains in fiscal '25, and we will realize the full-year benefits of that in fiscal '26, particularly with significant distribution gains in our fourth quarter at a mass retailer that reset their shelves. We will benefit from that reset throughout the year, and in our first quarter, we also have some innovations that will begin shipping. As we move into Q2 and beyond, these innovations will start to ship. Q2 is a critical advertising period for us, and we will increase our advertising, merchandising, and promotional events, especially in food, drug, and mass channels. These factors lead us to believe that sales and consumption will accelerate as we transition into Q2 and beyond, with additional innovations launching later in the year.
Operator
Our next question comes from Thomas Palmer with JPMorgan.
Speaker 9
I wanted to maybe bridge a little bit more on your EBITDA margin, down around 280 basis points year-over-year. You noted, I think, around 80 basis points from tariffs and your comments suggest maybe another 80 basis points for stepped-up advertising. So when we're thinking through the remaining 120 basis points, maybe a little help kind of bridging like SG&A leverage, excluding advertising, inflationary pressure, excluding tariffs? And then maybe thinking through some of the cost savings that you noted.
We're anticipating our EBITDA margins to decrease by approximately 280 basis points compared to last year, with about 80 basis points attributed to tariffs. In terms of line items, we expect gross margins to fall, which will primarily account for that decrease. SG&A is expected to have a modest decline, influenced by an 80 basis point headwind from advertising, although this will be partially offset by some G&A leverage. Within gross margins, we anticipate a low to mid-single-digit inflationary headwind, primarily related to whey proteins, which affect our powders. We are planning to adjust our pricing toward the end of Q1, which should start to mitigate some of these pressures as we enter Q2. In our shake business, we expect a slight increase in Q1, with inflation remaining flat to slightly increasing throughout the year. Therefore, we are facing some additional inflation, particularly in our powder segment, where we are implementing price changes. While our shake business is dealing with modest inflation, we also have significant cost-saving initiatives set for the latter half of the year. Notably, when examining our margins by quarter, we will be comparing against a very strong margin performance in the first half of last year, where our gross margins were nearly 35%. Consequently, the first quarter this year will experience the most considerable margin headwinds compared to the previous year. Q2 will also experience significant but lesser headwinds than Q1. However, in the second half, we expect our margins to be fairly stable compared to last year. Thus, the initial half of the year presents the most substantial challenges for margins, driven largely by inflation and increased promotional activities.
Operator
Our next question comes from Peter Grom with UBS.
Speaker 10
I wanted to revisit the market share topic and follow up on Andrew and Steve's question, particularly regarding the insurgent brands. Do you believe they could achieve market shares comparable to the current leaders in the category? I'm asking this in the context of the competitive landscape debate. Some suggest that our industry might resemble the energy drinks market, which has a duopoly, as opposed to others with five or six brands sharing similar market shares. Darcy, you mentioned that you think some of these brands may disappear, but I’m interested in your perspective on whether any of these insurgent brands might evolve into significant competitive threats over time.
I appreciate that you all have been part of our journey, and it's evident with our main competitor that establishing a national network and supply chain takes considerable time. While some insurgent brands may perform well with one retailer, the challenge lies in expanding beyond that, which we have successfully done. This complexity, including a sophisticated supply chain and expertise in servicing multiple channels concurrently, cannot be overstated. Additionally, whether self-manufactured or co-manufactured, there are further challenges involved. We recognize that a few insurgent brands may succeed, but it will take time, and we expect many others will not. The transition from catering to club customers to a national presence is intricate and requires different skills, taking several years to achieve. Ultimately, I believe this category will consolidate around a few successful brands, and we expect to be the leading brand in that consolidation.
Operator
Our next question comes from Alexia Howard with Bernstein.
Speaker 11
Can I ask about pricing expectations, price versus volumes embedded within your guidance. You're obviously taking a list price increase on Dymatize. With the rest of the portfolio, do you expect promotional activity step-up to actually bring pricing downwards? And does that cadence vary through the year?
Yes. I will break it down by brand. For Premier Protein, we anticipate a slight low single-digit challenge related to pricing. This accounts for our increased trade investments, balanced by an expected favorable mix. We foresee a low single-digit challenge in our shake business, which is the largest segment of our operations. For Dymatize, we are implementing a price increase on powders, but we expect the mix to significantly influence this as we now offer ready-to-drink shakes, which are priced lower per pound than the powder. This results in a unique mix. Overall, for total BellRing, I expect a low single-digit challenge, with Premier Protein showing a similar trend, while Dymatize may appear to have a negative impact despite the price increase due to the mix effect.
Operator
Our next question comes from Matt Smith with Stifel.
Speaker 12
Darcy, following up on the discussion or Paul, around higher promotional activity over the next year. We've seen a step-up in promotional intensity from insurgence in recent weeks. As you look forward, do you expect Premier's promotional activity to be moving higher more on a frequency or a depth basis? And do you expect that to be focused in certain channels? It sounds like maybe club promotion should be similar relative to the prior year once we get past the first quarter?
Yes, I believe that's me, Paul. You're correct. We anticipate a slight increase in promotions in 2026. It's noteworthy that October, particularly in the club channel, is typically not a peak time for promotions, yet we've noticed an uptick, primarily driven by insurgent brands. It's important to remember that this category experiences relatively low promotional activity compared to others, with about 25% to 30% of sales occurring on deal. As we consider the broader market, we're expecting a modest rise in promotions within our business, mainly as we focus on expanding in the food drug mass channel. The key for us is to engage customers and drive trial, and with our 50% repeat rate, we expect to maintain that momentum. We've hired brokers and established a new internal team to concentrate on single units and entry-level priced multipacks. Consequently, with this enhanced merchandising, we will likely implement some form of temporary price reductions, leading to an increase in promotional activities alongside the expanded merchandising.
Operator
Our next question comes from Yasmine Deswandhy with Bank of America.
Speaker 13
I have a quick question about your long-term strategy. Several years ago, you exited the PowerBar business, and now the convenient nutrition category is growing beyond traditional products. Have you considered re-entering the bar market or expanding into breakfast items like waffles, pancakes, and cereal? Additionally, in light of the recent press release regarding the new Board appointment that emphasized David's experience in finance and M&A, has there been any shift in your capital allocation priorities, particularly related to M&A and your product portfolio?
Let me discuss the portfolio aspect, and then Paul can address capital allocation. From our perspective on the portfolio, we have strong confidence in our category, particularly in ready-to-drink shakes and to a lesser extent, powders. We see significant opportunities here. In my earlier comments, I mentioned a demand landscape study we conducted, which was crucial in ensuring there was substantial growth potential and many years of strong growth ahead, highlighting a considerable amount of untapped market space we can target. This reassured us of our belief in this category. We have a strong brand that positions us well for competition. Additionally, we've also ventured into some other areas through licensing. For instance, we offer frozen pancakes, frozen waffles, dry pancake mix, and cereal, and we are looking to expand these offerings through licensing. However, I want our organization to stay focused on what we identify as the primary opportunity, which is ready-to-drink shakes and powders. Therefore, we do not plan to return to bars, as it's a highly competitive market with low entry barriers. We are enthusiastic about the space we are in and believe there is significant potential. Now, I’ll turn it over to Paul for insights on capital allocation.
Thank you, Darcy. Regarding capital allocation, our priorities remain largely unchanged. Our primary focus is always on investing in the business. As mentioned, we are making investments this year in trade and promotions to continue driving growth. Additionally, since we generate strong cash flow, we are not planning to alter our asset-light model, which allows us to maintain low capital expenditures. This enables us to allocate a significant amount of cash flow to share repurchases, which we see as the most appealing option right now. We are actively pursuing share repurchases. While we are always considering mergers and acquisitions and receive many proposals, we view M&A as more of a mid- to long-term priority. Having David on the Board enhances our capabilities in this area, which is beneficial for us. We are continually exploring M&A opportunities, and if the right one arises, we will certainly pursue it.
Yes. And on the Board side, we're really happy to have David on board. I think he brings a great skill set, and we're always looking at expanding and improving the skill set on our board. Our Board has been incredible over the years, and we just want to continue to make it better and increase the skill set. And I think David does that.
Operator
Our next question comes from John Baumgartner with Mizuho Securities.
Speaker 14
I'd like to ask about RTD category segmentation. Fairlife Core Power, they've established that Premium segment in ultrafiltered milk, but now we've seen two legacy competitors relaunch with ultrafiltered, some of the newer entrants, the insurgents private label, they're adopting ultrafiltered. So I'm curious, Darcy, why the category is making this shift with ultrafiltered becoming more of a standard recipe? Is it tied to raw materials availability? Is it due to the license to move more Premium? Is there a specific consumer you sense they're chasing? Just curious your thoughts there on that recipe shift? And how might this shift position Premier differently relative to history?
Yes, I believe the category is evolving. From our demand landscape study, it was clear that there are diverse preferences among consumers. Initially, everyone wanted similar products, but as the market expands, different tastes emerge. For example, some consumers prefer thick shakes while others like thinner options; some want dairy-based shakes, while others opt for plant-based alternatives. The good news is that our core 30-gram shake addresses the main consumer needs, but it doesn't satisfy every preference. As we grow, we are launching innovations to target these additional demands. A good example is our ultra-filtered milk, which offers a thinner, more beverage-like option compared to our thicker shake, which serves as a meal replacement. This illustrates why there's little overlap between the two products, as they cater to different consumer occasions. We also launched an almond milkshake, which is non-dairy. We recognized this as an opportunity, which is smaller than the dairy side but still adds incremental value. Early data from the almond milkshake indicates that it is reaching 50% new customers. This is a key part of our innovation strategy: ensuring our 30-gram core business remains strong while also addressing other consumer needs with new products and flavor innovations.
Operator
Our next question comes from Jon Andersen with William Blair.
Speaker 15
We discussed the insurgent brands earlier, and Darcy, you mentioned the expectation of a shakeout over time, which makes sense to me. There will be some winners and others that may not meet the necessary thresholds. In your experience, how long do you anticipate this process might take to unfold? I ask because the current competitive environment seems challenging, and it may continue to be so until this shakeout period takes place more widely in the market.
Yes, that's a great question. Currently, we're observing that some brands are not meeting the necessary thresholds. It's important to take a broader view of the situation. Even though insurgent and crossover brands are gaining attention, they only account for 10% of the category, and there are numerous such brands. What's crucial is understanding where growth is occurring: it's primarily driven by leading brands that are attracting more households and also capturing volume from the significant portion of the market held by declining legacy brands, which make up 30% of market share. While we can expect some fluctuation among the insurgent brands, with some succeeding and others not, this sector remains dynamic and interesting. A constant turnover is evident, especially in areas like energy. However, focusing on the leading brands, which have established themselves with high household penetration and repeat purchases, along with a robust national supply chain developed over many years, is key. We are currently investing in our brand and collaborating with retailers to optimize product placement and merchandising for this category. The leading brands will continue to thrive, while there may be turnover among insurgent ones. Legacy brands will likely continue to contribute, as they have for years, and this trend seems to be accelerating. Regarding the timeline for this shakeout, I believe there will always be some level of churn within insurgent brands. It's an exciting category that we closely monitor, but our primary focus should be on the anticipated consolidation, where the most successful brands will drive forward.
Operator
Our next question comes from Robert Moskow with TD Cowen.
Speaker 16
This is Jacob Henry on for Rob. Just one question for me. I think I heard you guys mention that your fifth pallet at the large club customer is transitioning out. I'm just wondering if you have any insight into when, and why that's happening.
Yes, it was always intended to be a temporary SKU. It will be phased out in Q2.
Operator
And I'm not showing any further questions at this time. And as such, this does end today's presentation. We thank you for your participation. You may now disconnect, and have a wonderful day.