
Two weeks, three new markets.
Equibles now covers crypto, forex and Brazilian companies, and stock charts open on today's session, minute by minute. Here's everything that's new since the last update.
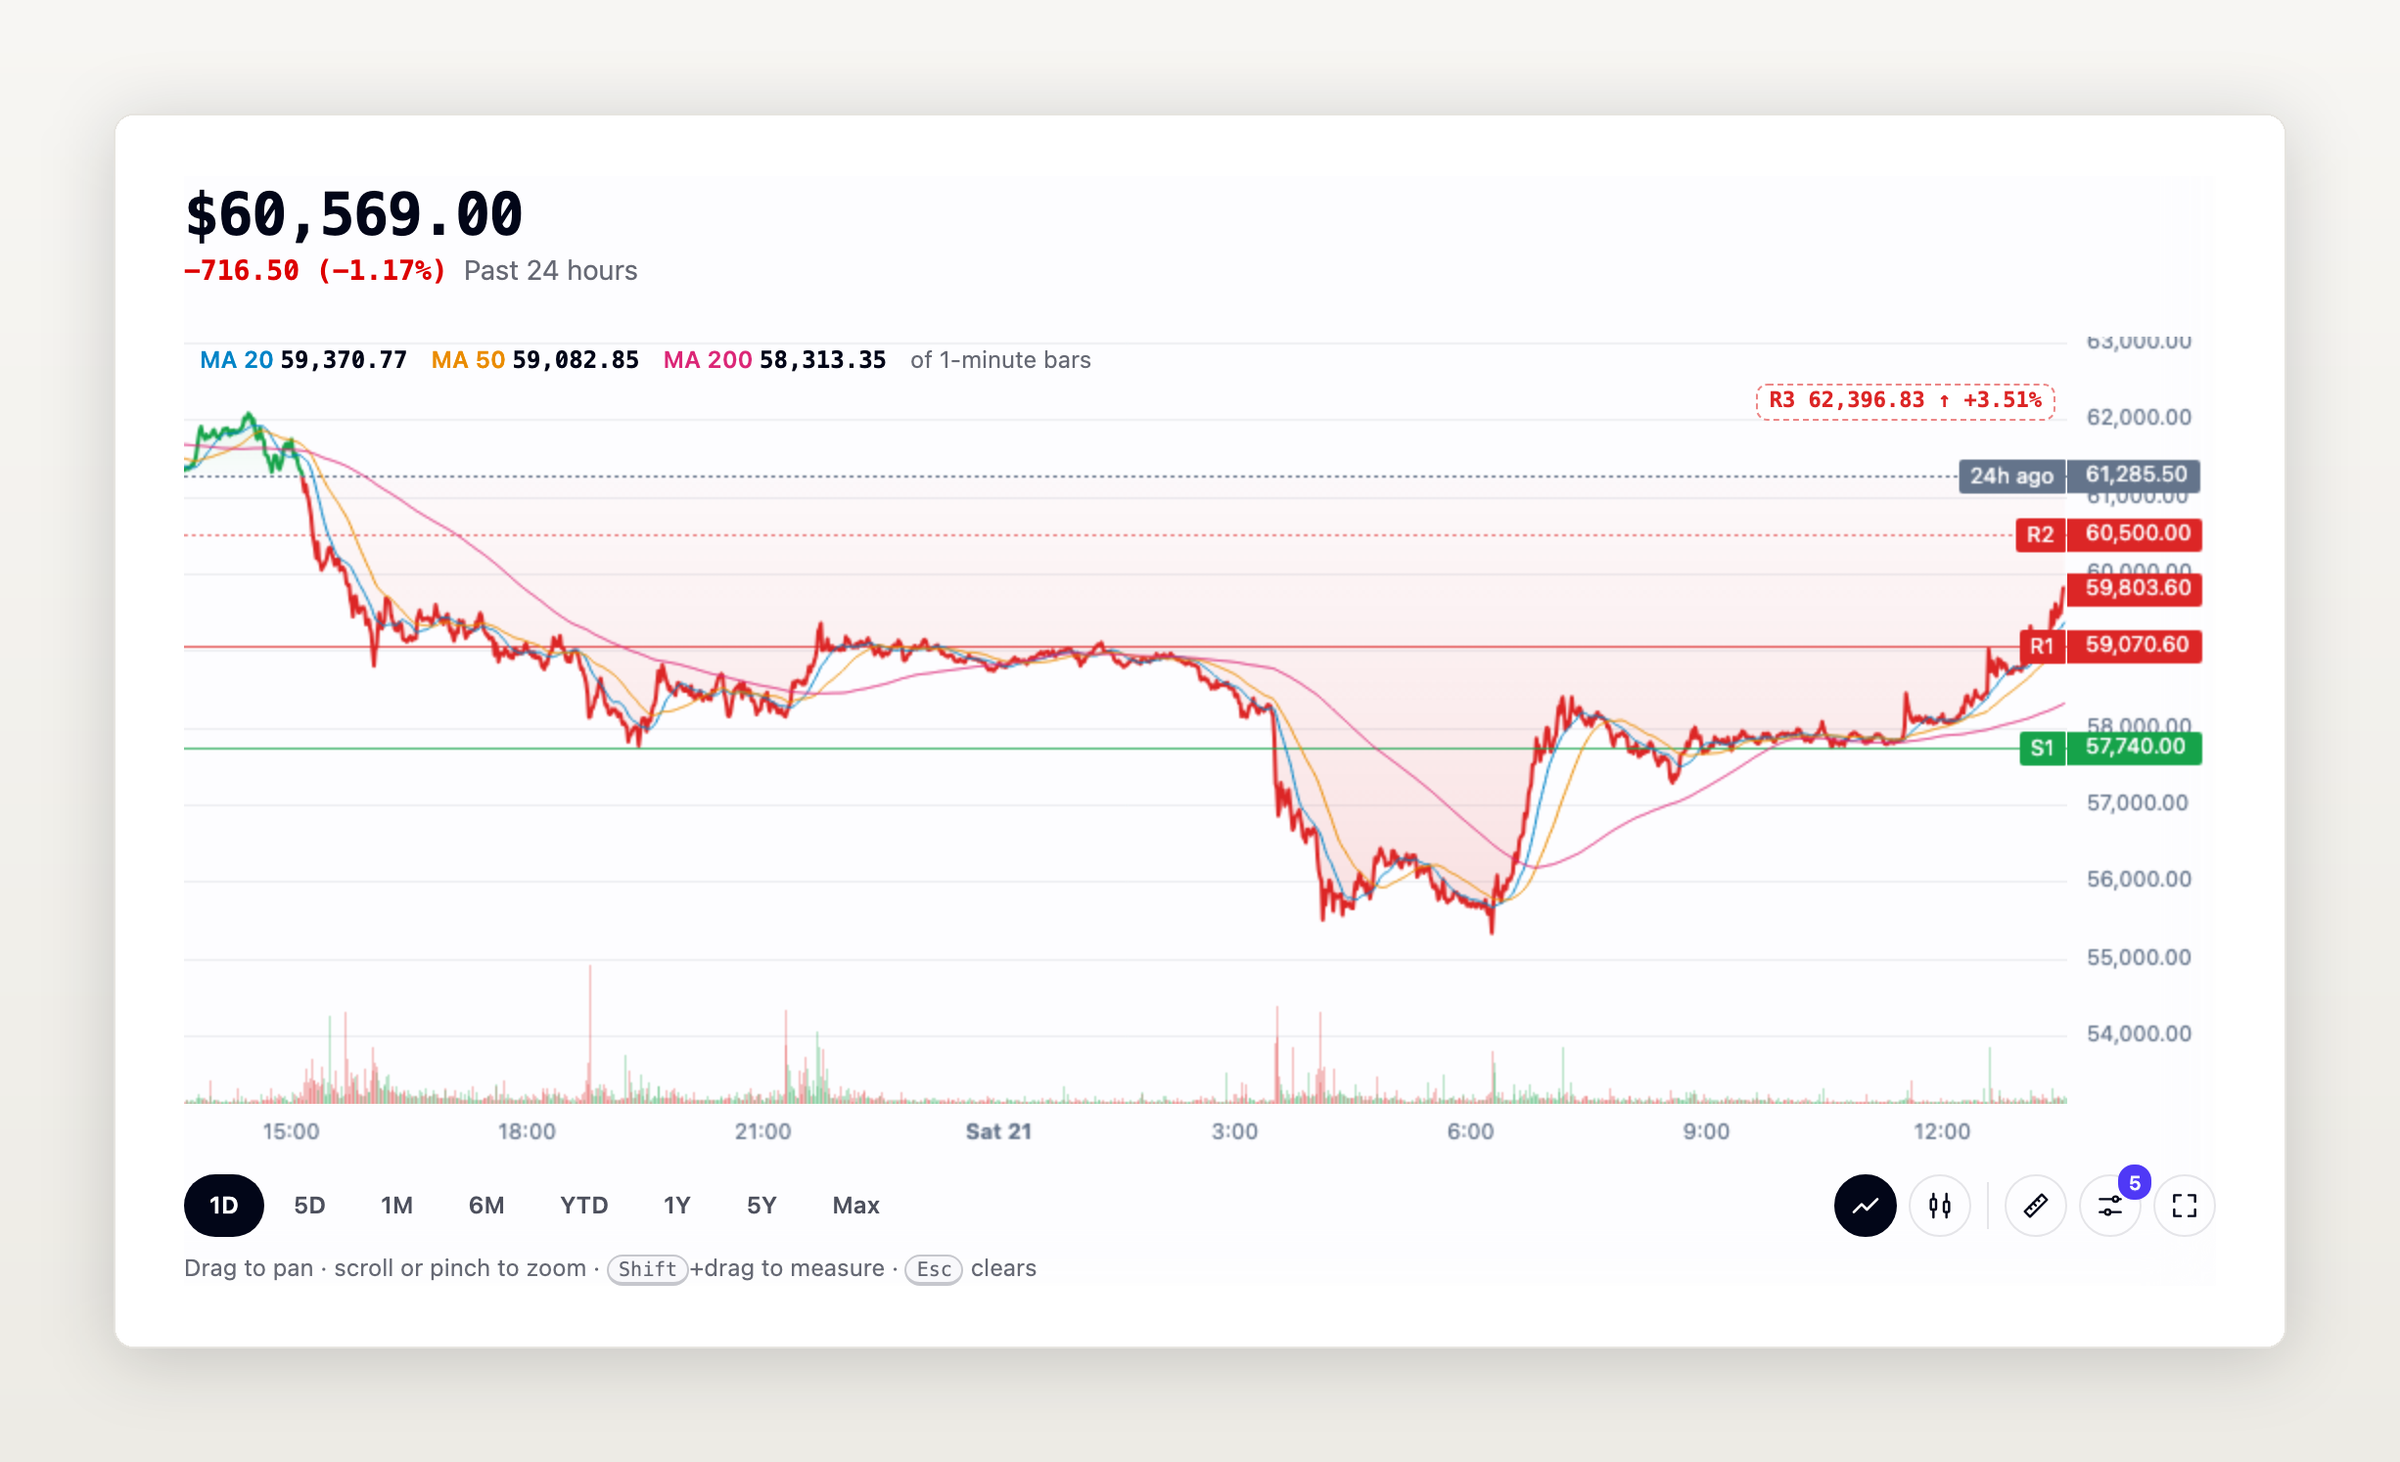
Stock charts, minute by minute
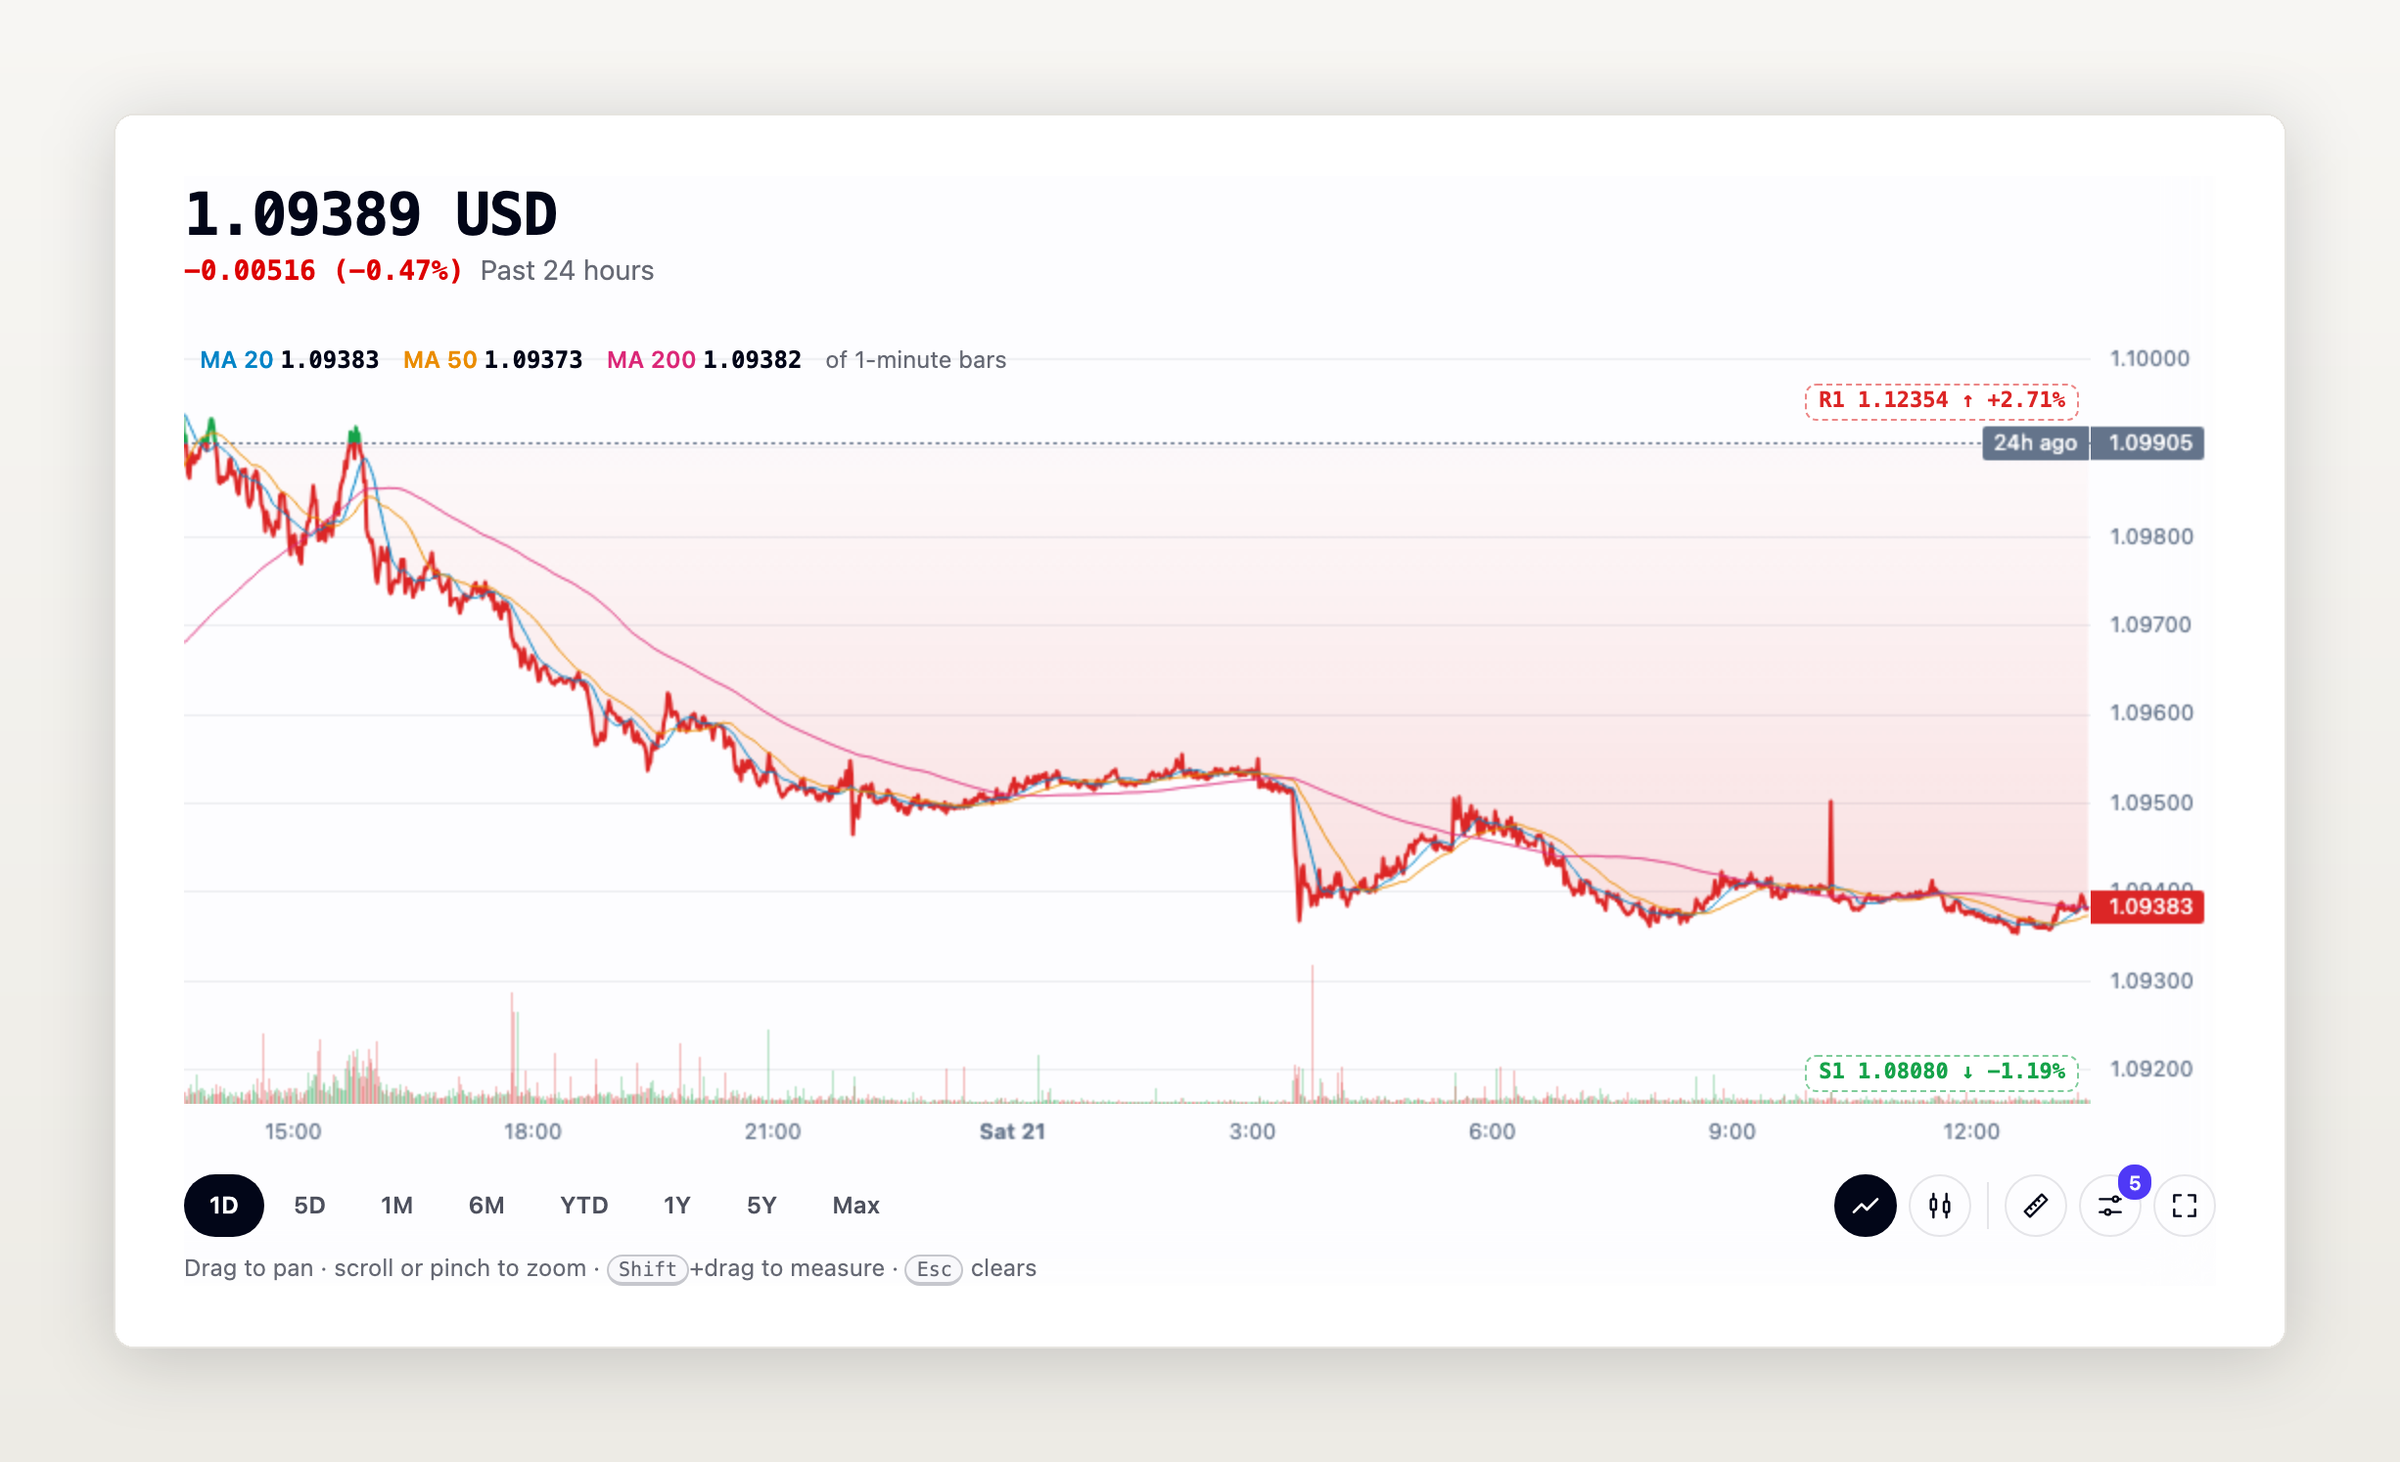
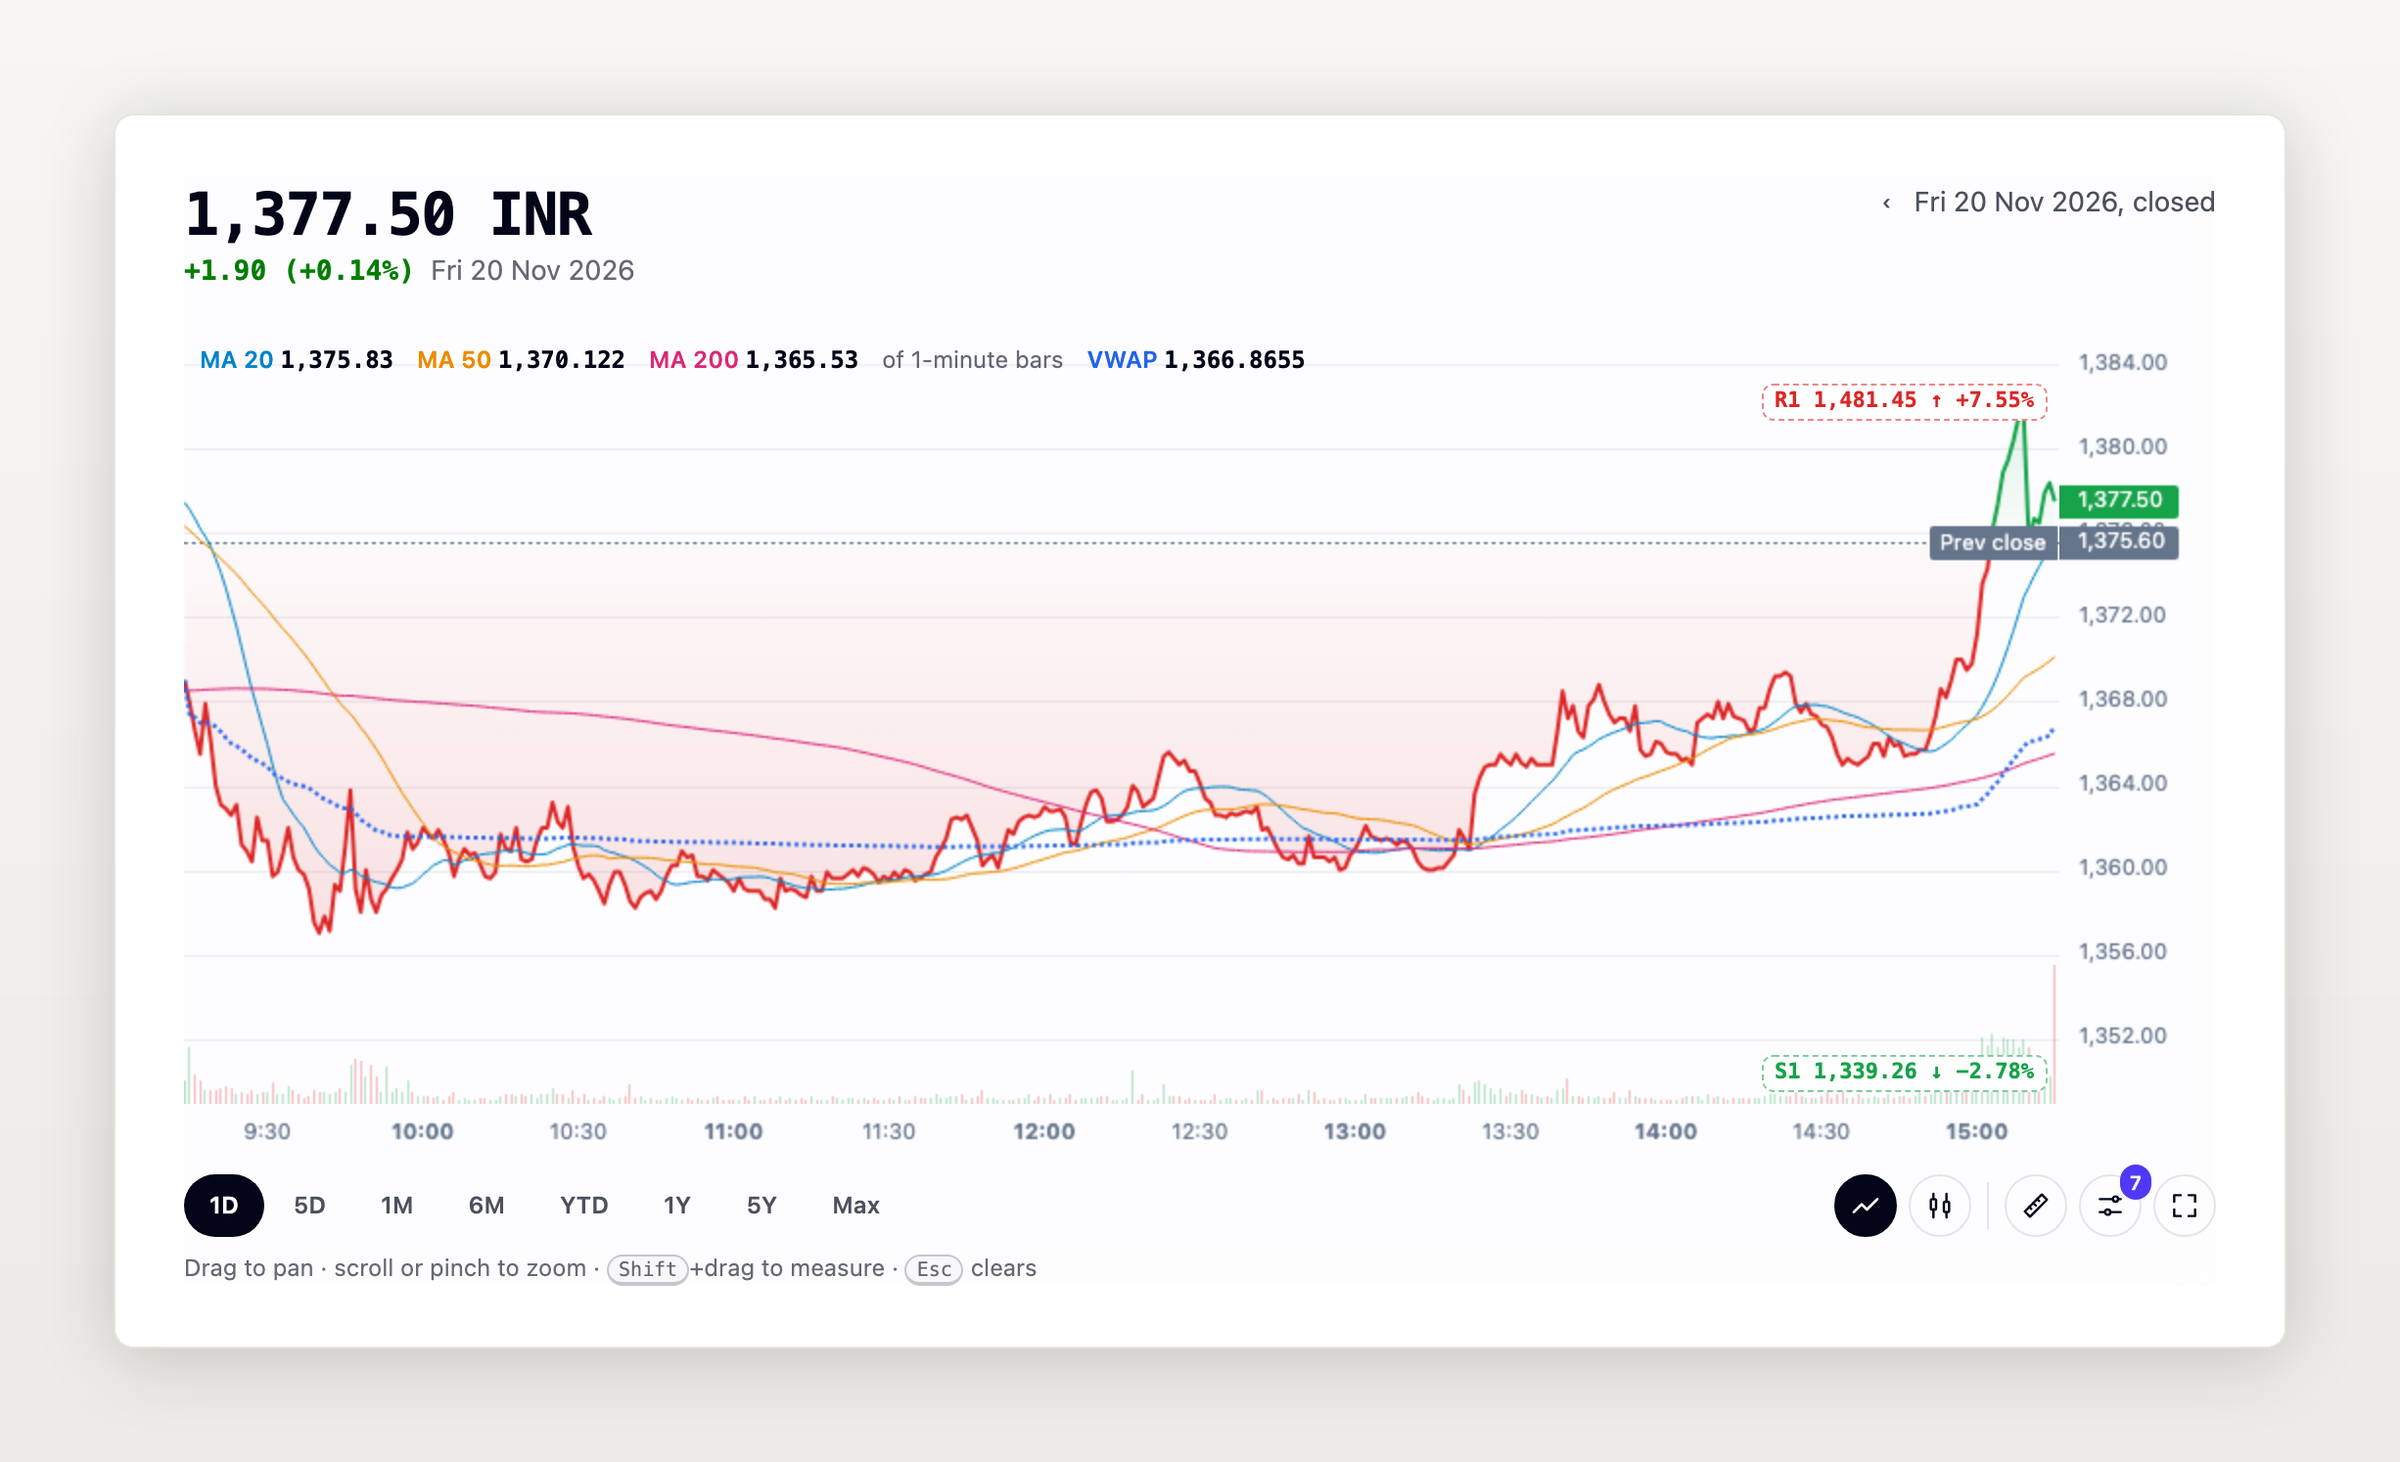
The price chart on every stock page now opens on 1D: today's session as a minute-by-minute line against the previous close, with the session's VWAP. US stocks add pre-market and after-hours as a slim, shaded stretch, and the after-hours price sits under the close. When the market is closed, the chart shows the last session with its date.
- Ranges: 1D, 5D, 1M, 6M, YTD, 1Y, 5Y and Max, as a line or candles. Moving averages, support and resistance, RSI, MACD and Bollinger bands work on every range. A searchable indicator picker adds EMA, Stochastic, ATR and OBV with your own periods and colours.
- Chart tools: drag to pan, scroll or pinch to zoom, and pan back to load older bars. Shift and drag, or the ruler, measures the move between two points. Full screen fills the window.
- Who sees what: everyone gets 1D and 5D on US stocks. Plus and Pro add 1M of 1-minute bars, candle sizes and older days.
- Key stats: headline figures, with the day and 52-week ranges drawn as tracks.
ETF pages use the same chart.
Crypto prices
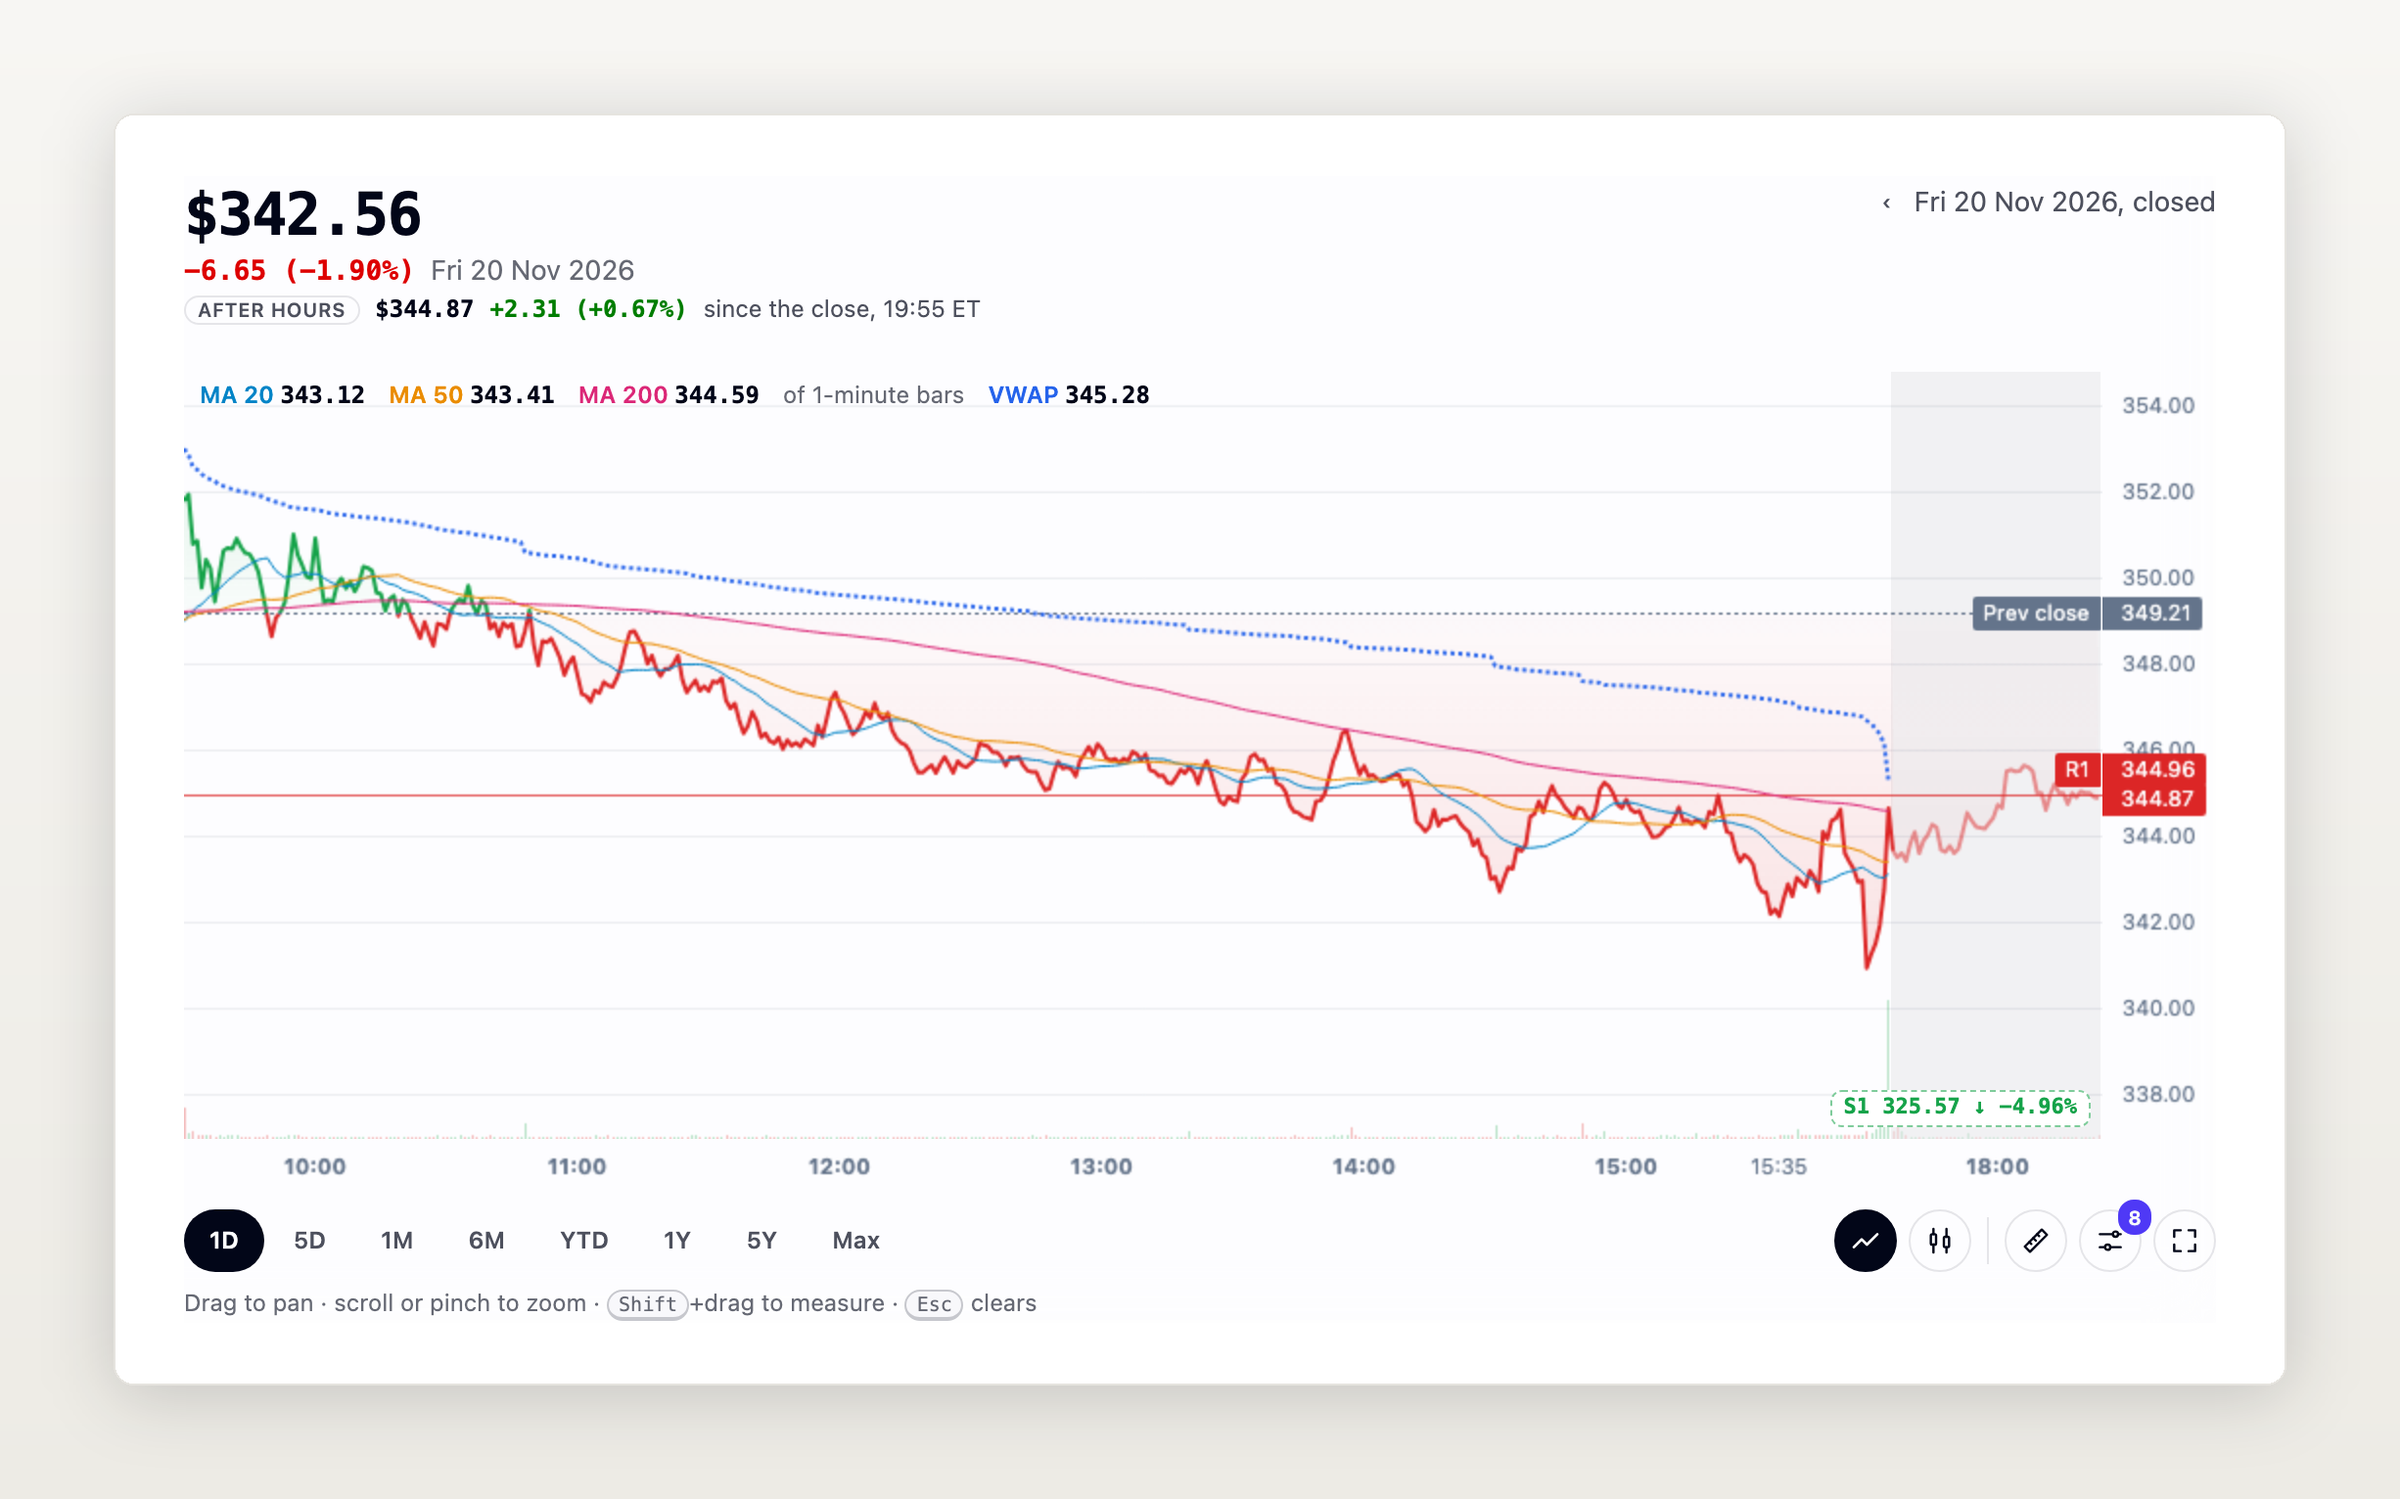
Crypto prices lists 661 coins priced in US dollars, most traded first. Each coin has a page with its live price, a chart from 1D to Max, technicals, its full daily history (back to 2013 for Bitcoin) and intraday candles from 1 minute to 4 hours. The coin pages are free to everyone, signed in or not. Coins are listed by symbol, and prices and volume come from one exchange, not the whole market.
The MCP server and the REST API read the same prices: daily candles on every plan, intraday candles and quotes 15 minutes delayed on Plus, and real time on Pro. The MCP and REST docs show how. ALVIS answers coin price questions, and portfolios hold coins beside stocks and options, valued at each coin's latest trade.
Forex rates
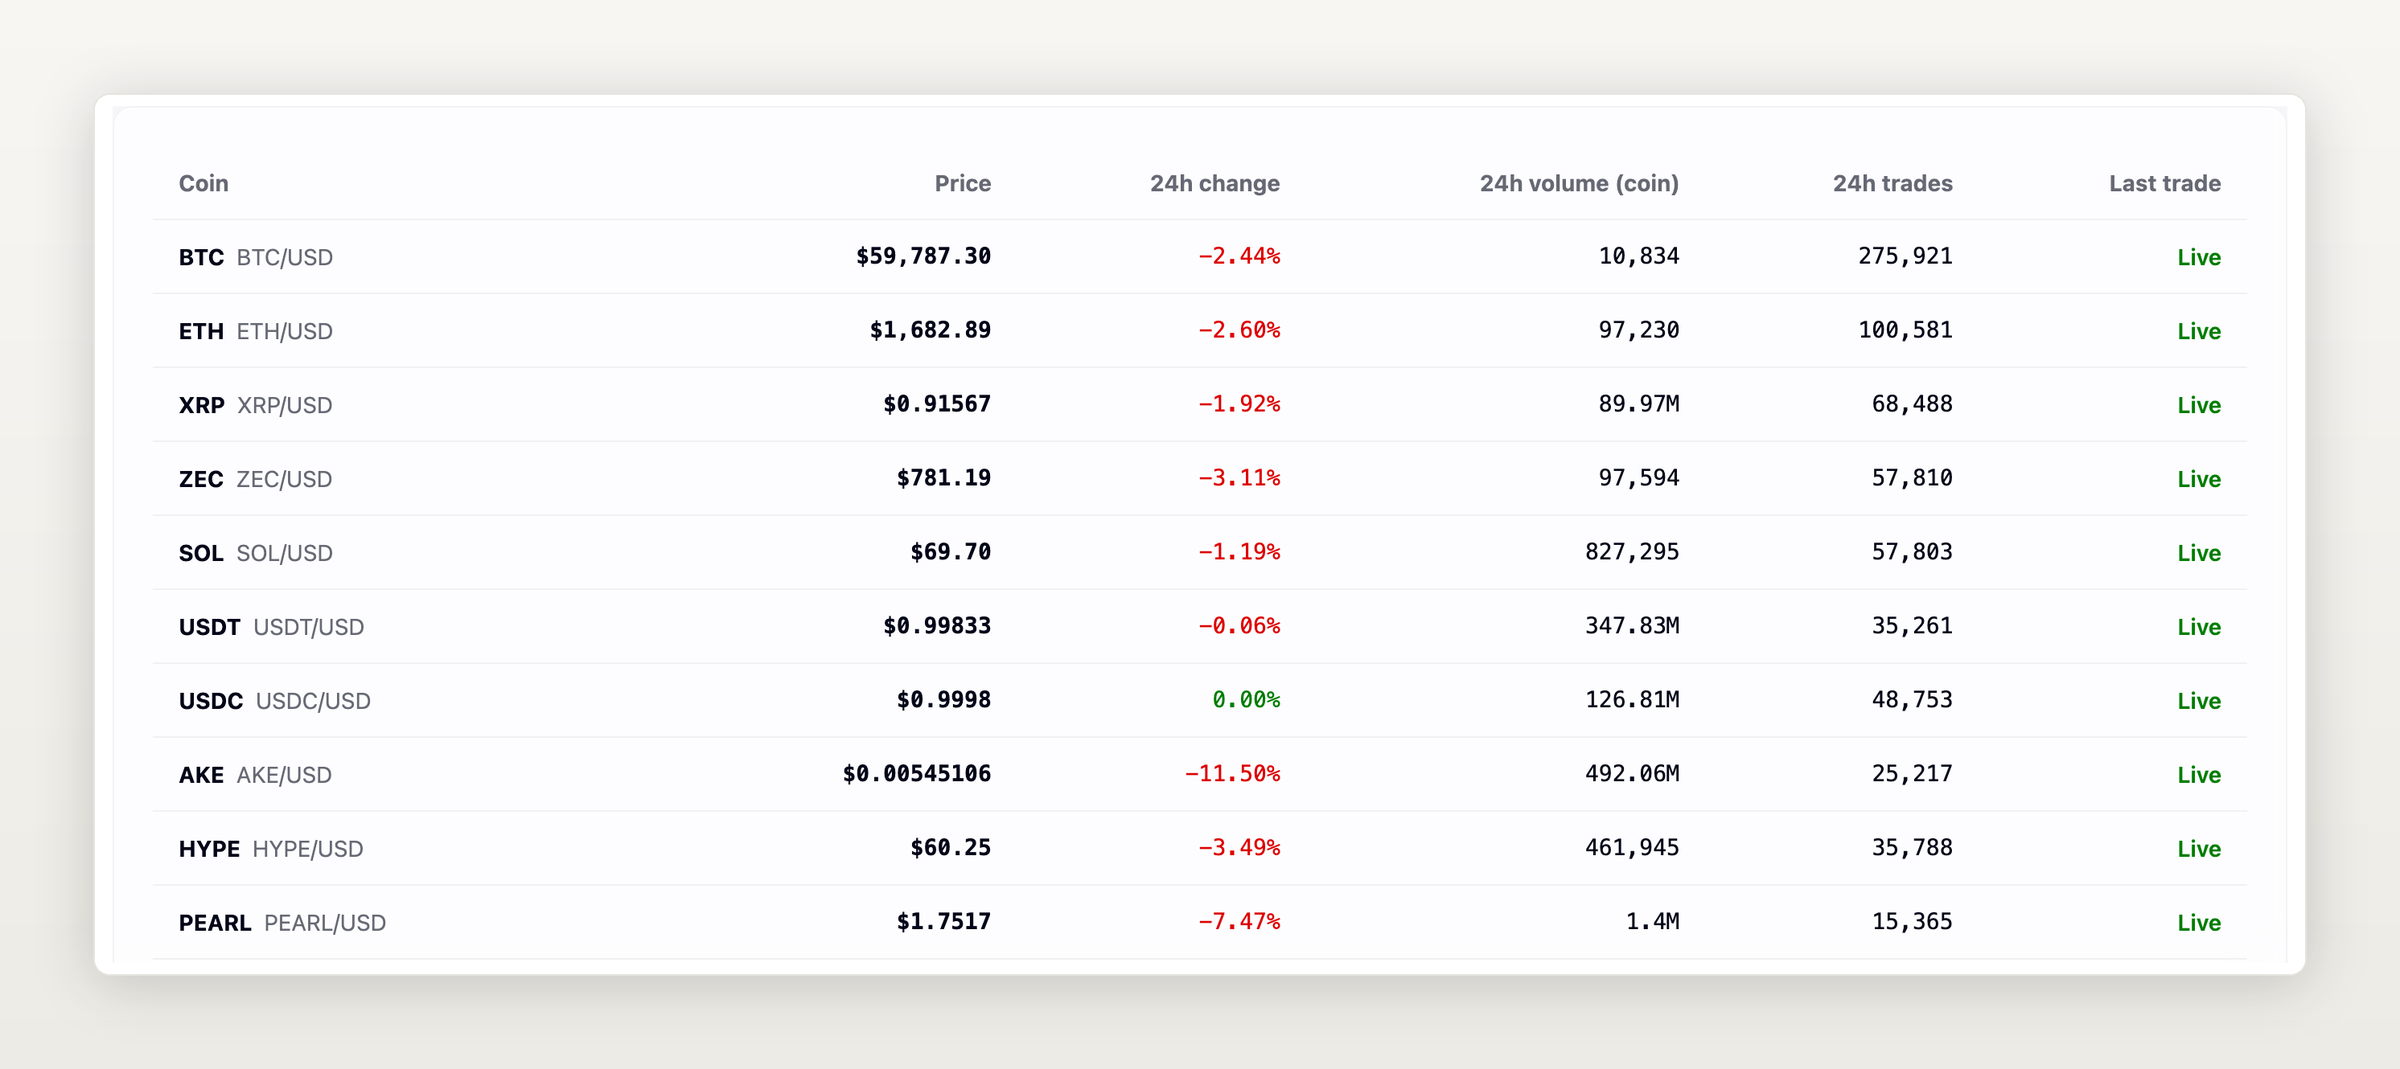
Forex rates covers 13 currency pairs, such as EUR/USD, GBP/USD, USD/CAD and AUD/USD, with a live rate, a chart from 1D to Max, daily history from 2020 and intraday candles. The pair pages are free to everyone. Each rate is one exchange's last trade, around the clock and through weekends, not an interbank or central bank rate.
The MCP server and the REST API read rates on the same plans as crypto (MCP and REST docs), and ALVIS reads rates too.
Brazilian companies
409 share lines of 311 companies listed on B3 have a stock page, and the MCP server and the REST API read them too. They carry what each company files with Brazil's securities regulator:
- Financial statements: annual and quarterly statements in reais for 289 companies, on the Financials tab. Companies that report to the SEC keep their SEC figures.
- Filings: more than 332,000 documents delivered since 2003 by all 311 companies, on the Documents tab; those delivered from 2026 on are searchable.
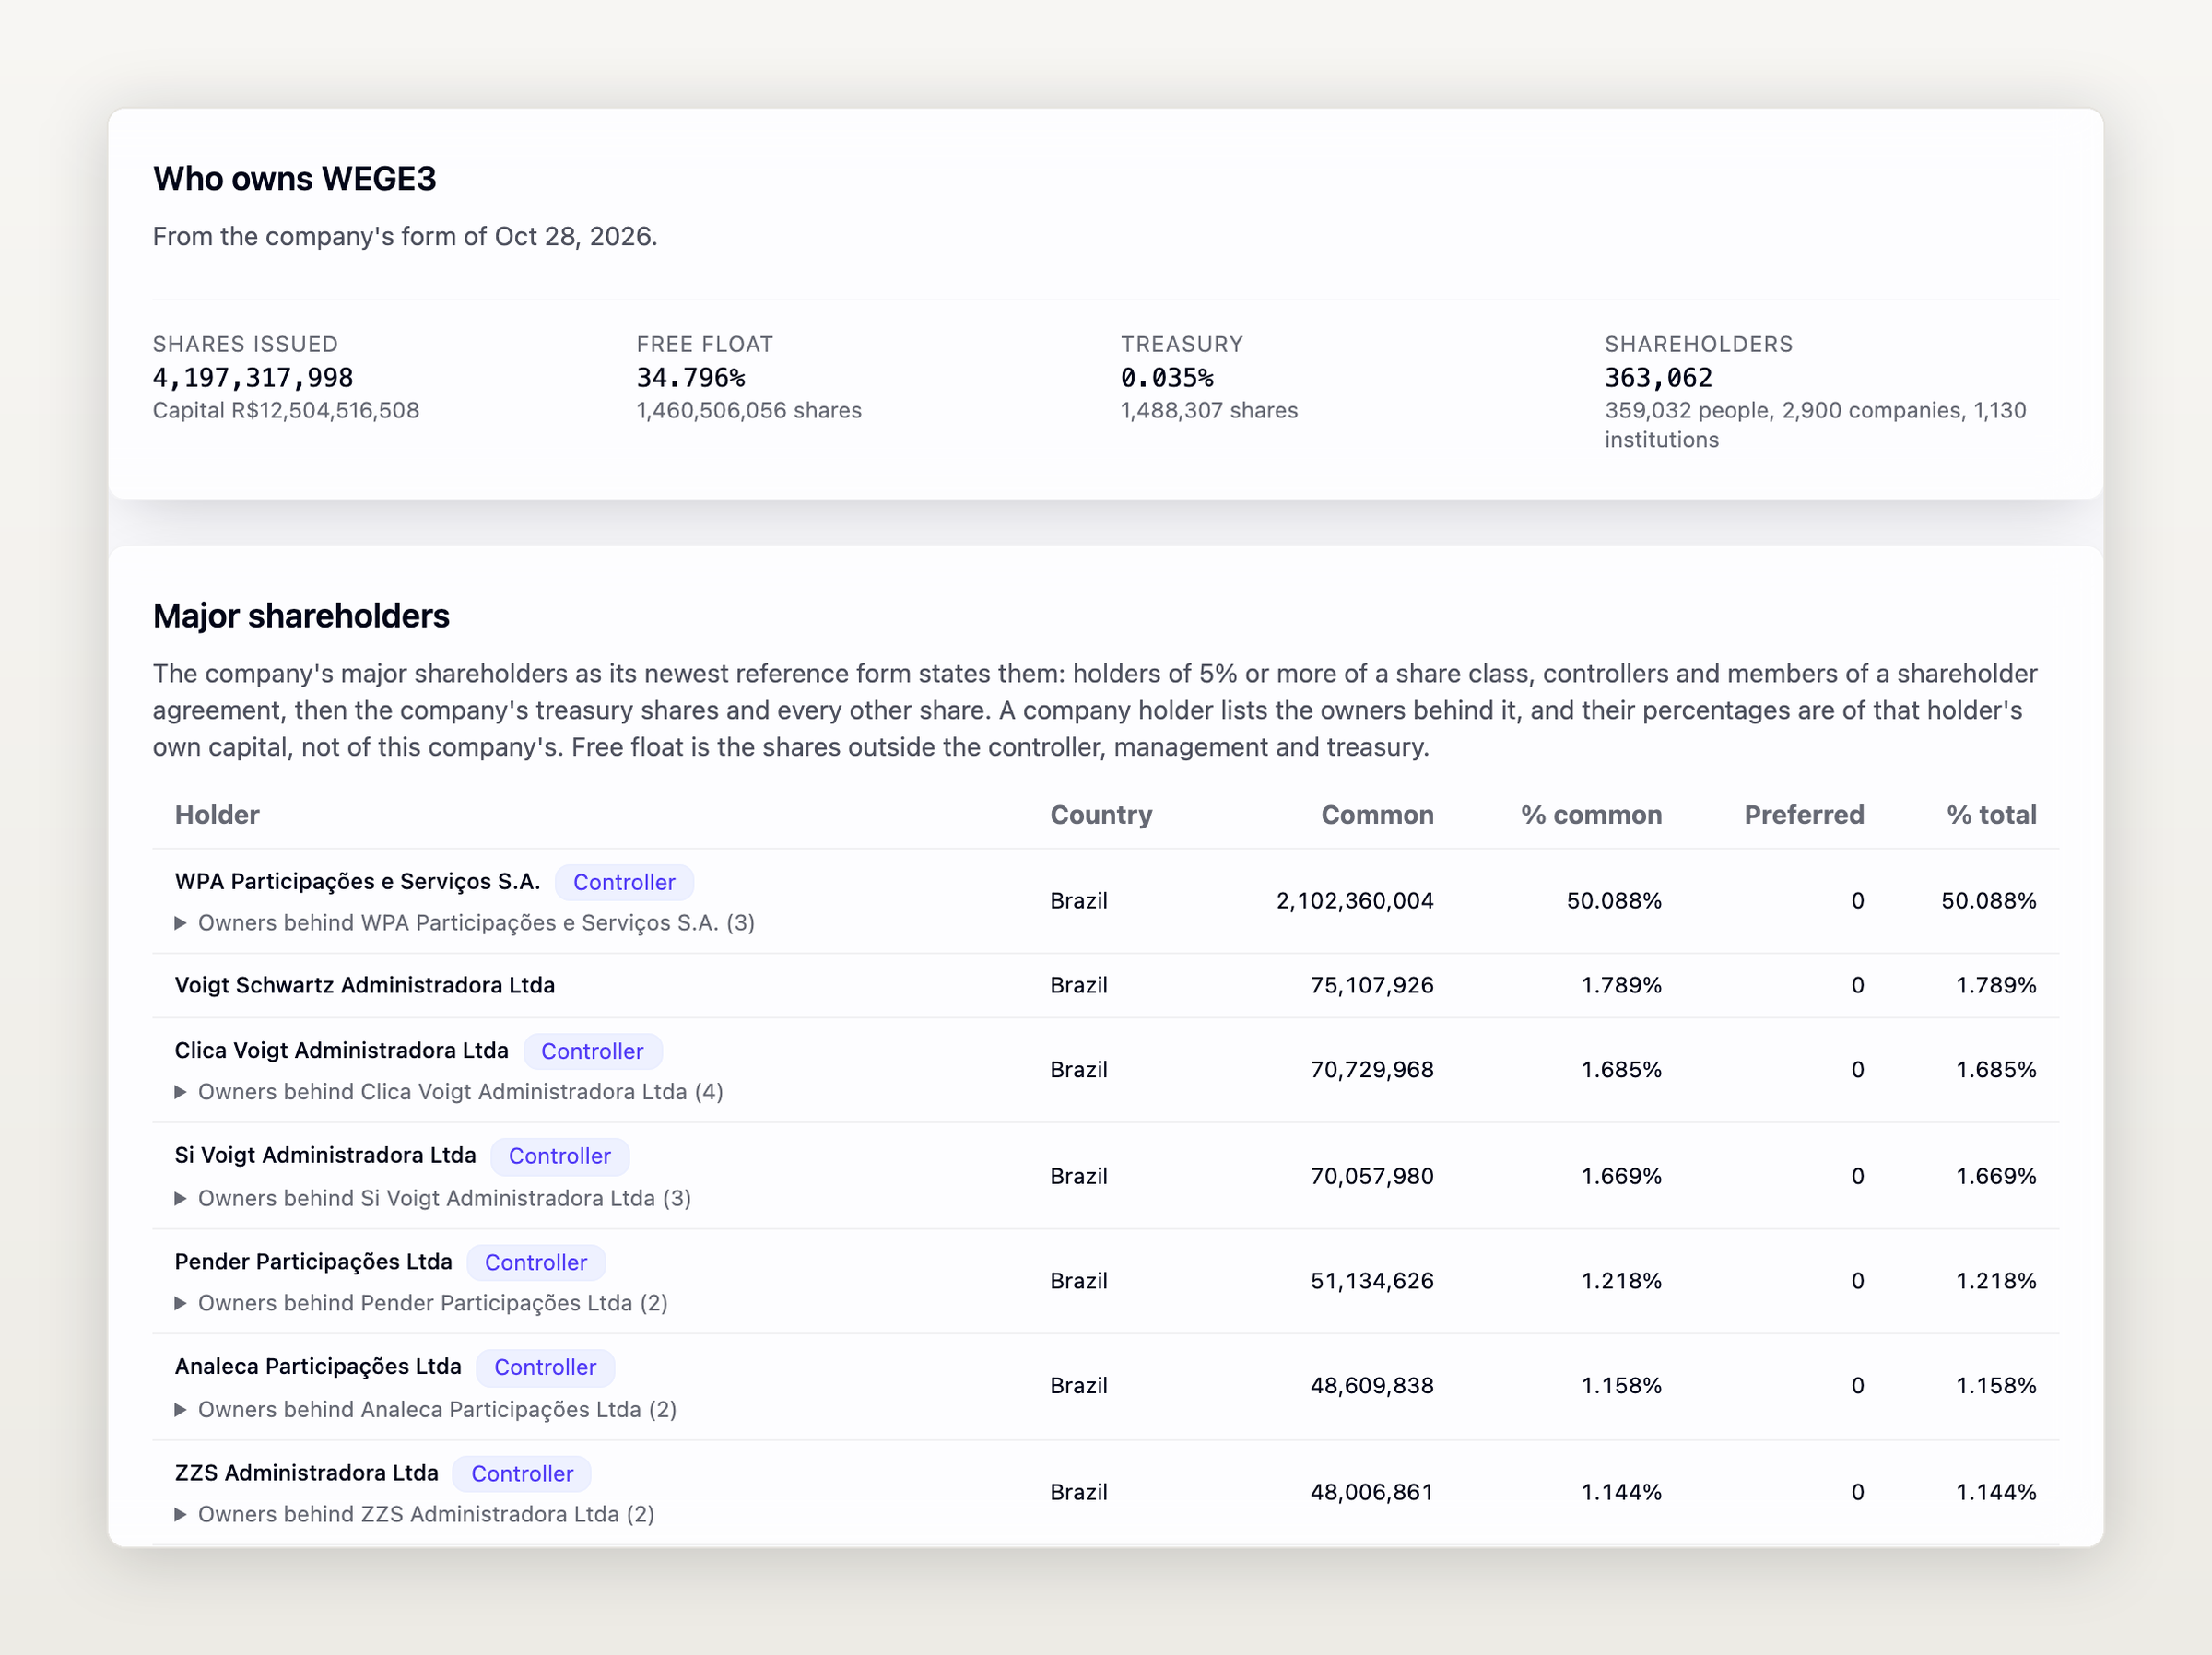
- Owners: for 310 companies, the major shareholders and controllers from the company's reference form, with free float, treasury shares and its count of shareholders, plus the notices filed since 2026 when a holder crosses 5%, 10%, 15% and so on.
- Insider trading: for 291 companies, the monthly reports of the controllers, board, executive officers and fiscal council since 2018, with each body's purchases, sales and month-end holding.
- Board and pay: for 304 companies, the board, officers and fiscal council, and what each body was paid.
- Buybacks: for 203 companies, each buyback program the board approved, with its dates, its limit per share class and whether it is in progress.
- Brazilian funds: the monthly share portfolios of more than 7,500 Brazilian investment funds since 2018, a page per fund, and the funds holding each B3 share.
B3 share prices are not included.
Indian stocks: live prices, minute bars and option chains
4,536 companies listed in India have a stock page with their daily prices: 2,506 on the National Stock Exchange of India and 2,030 listed only on BSE. On Plus and Pro, those pages now show the price during the session, and so do live quotes on the MCP server and the REST API. A BSE line that trades by periodic call auction has no price during the session.
- 1-minute bars: 2,499 NSE listings and 1,737 BSE-only listings keep each session's 1-minute bars after the close, on the stock page chart, the MCP server and the REST API, on Plus and Pro.
- Option chains: 218 NSE shares and 6 indices, including NIFTY and BANKNIFTY, on the MCP server, the REST API and ALVIS: each contract's last price, volume, open interest, implied volatility and best bid and ask in rupees, on Plus and Pro.
1-minute bars for backtests
The MCP server and the REST API return intraday bars in any whole number of minutes from 1 minute to 4 hours, for the regular session or with extended hours, split-adjusted or as traded. A CSV file holds up to 50,000 bars for a backtest. ALVIS reads the same bars, and the MCP and REST docs show how to request them.
- US stocks and ETFs: 16,668 listings, with history back to 2016.
- Canada: TSX, TSX Venture and CSE listings since November 2025.
- Europe: Euronext listings, stored after each session since November 13.
- India: NSE and BSE-only listings, stored after each session.
On US stocks, Plus receives each bar 15 minutes after it ends and Pro as it forms. Bars outside the US arrive after each session on both paid plans, and Free covers end-of-day data.
Implied volatility rank and percentile
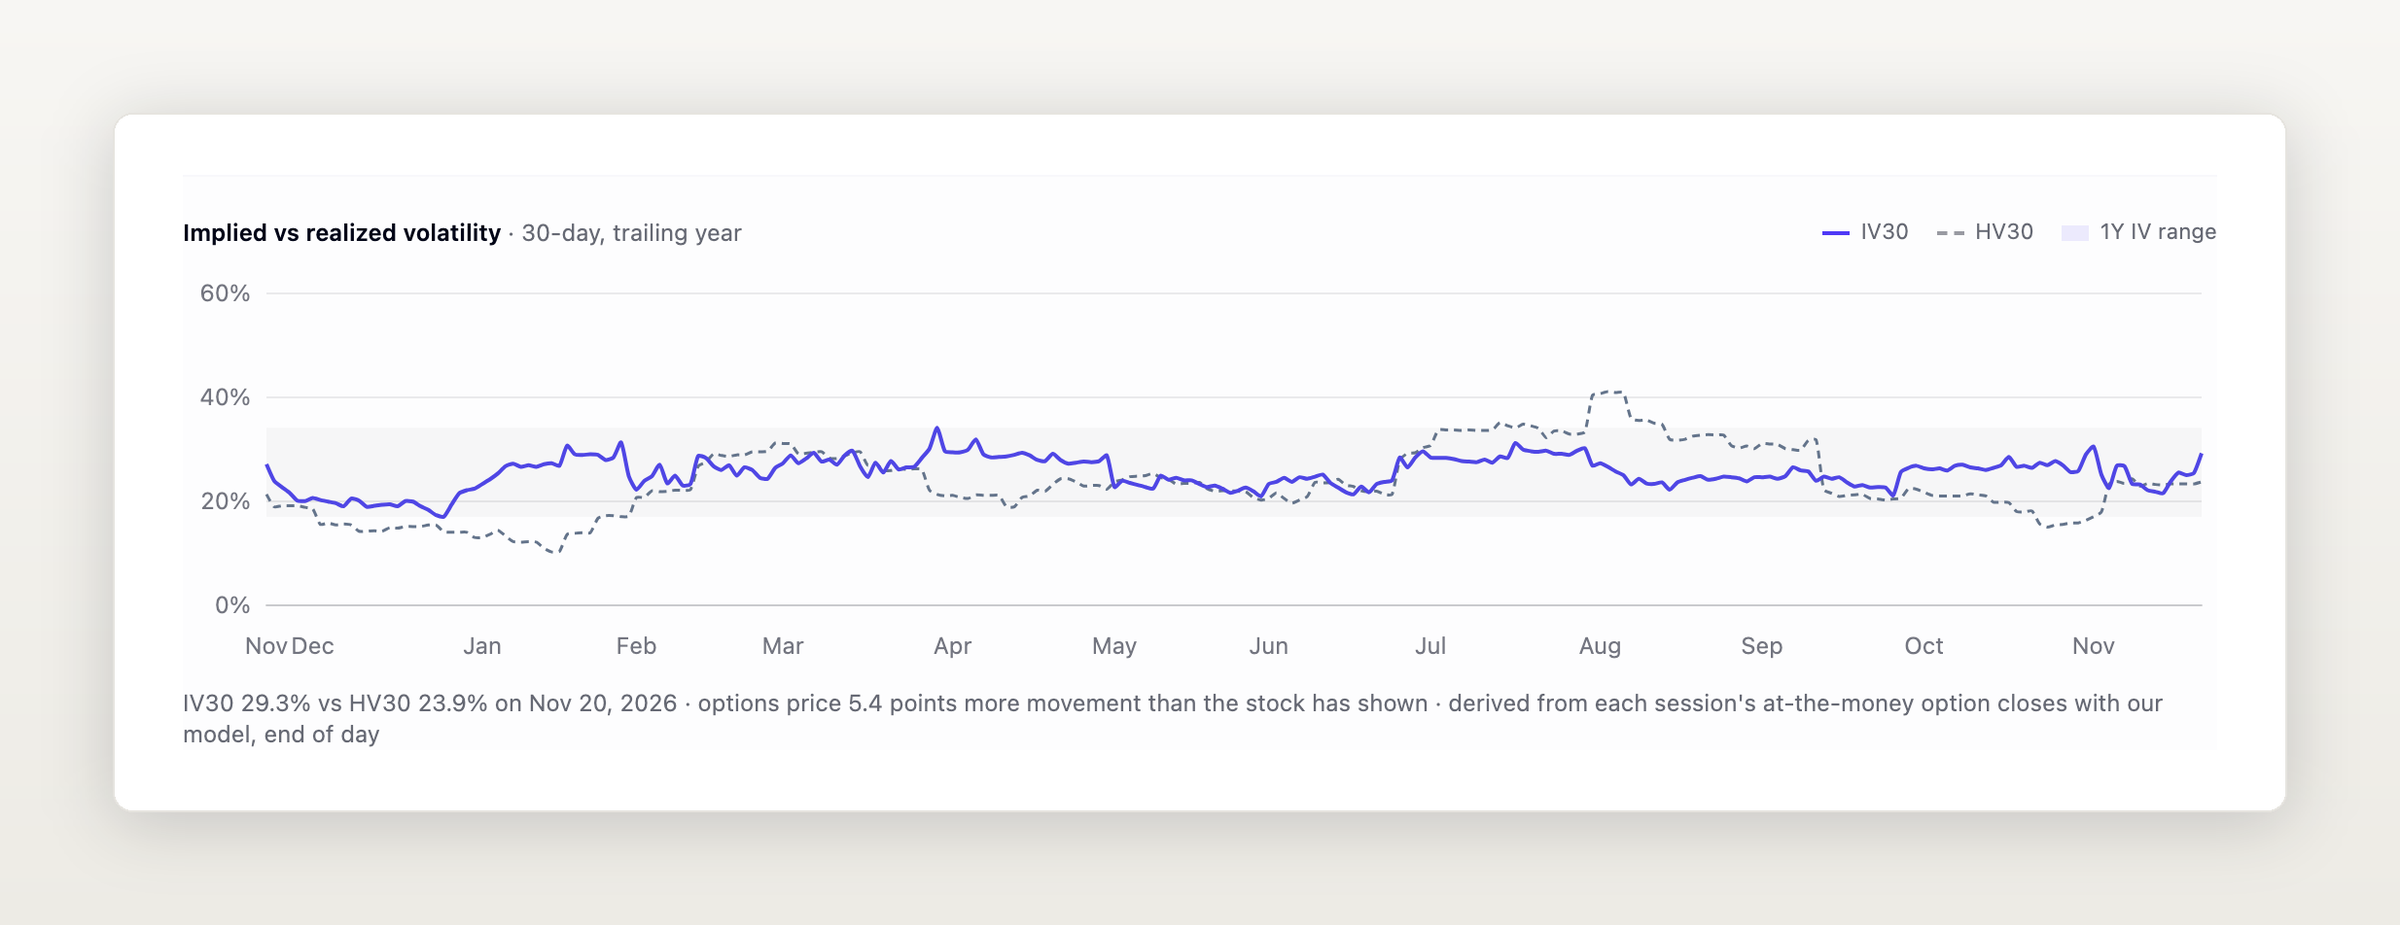
More than 5,800 US stocks with listed options now have a daily implied volatility series back to January 2024: 30-day implied volatility (IV30), IV rank and IV percentile over the trailing year, and 30-day realized volatility. The Options Chain tab shows IV rank beside at-the-money implied volatility and charts implied against realized volatility over the year. The screener filters and sorts on IV30, IV rank and IV percentile on every plan, and the MCP server and the REST API read the series on Plus and Pro.
Screener
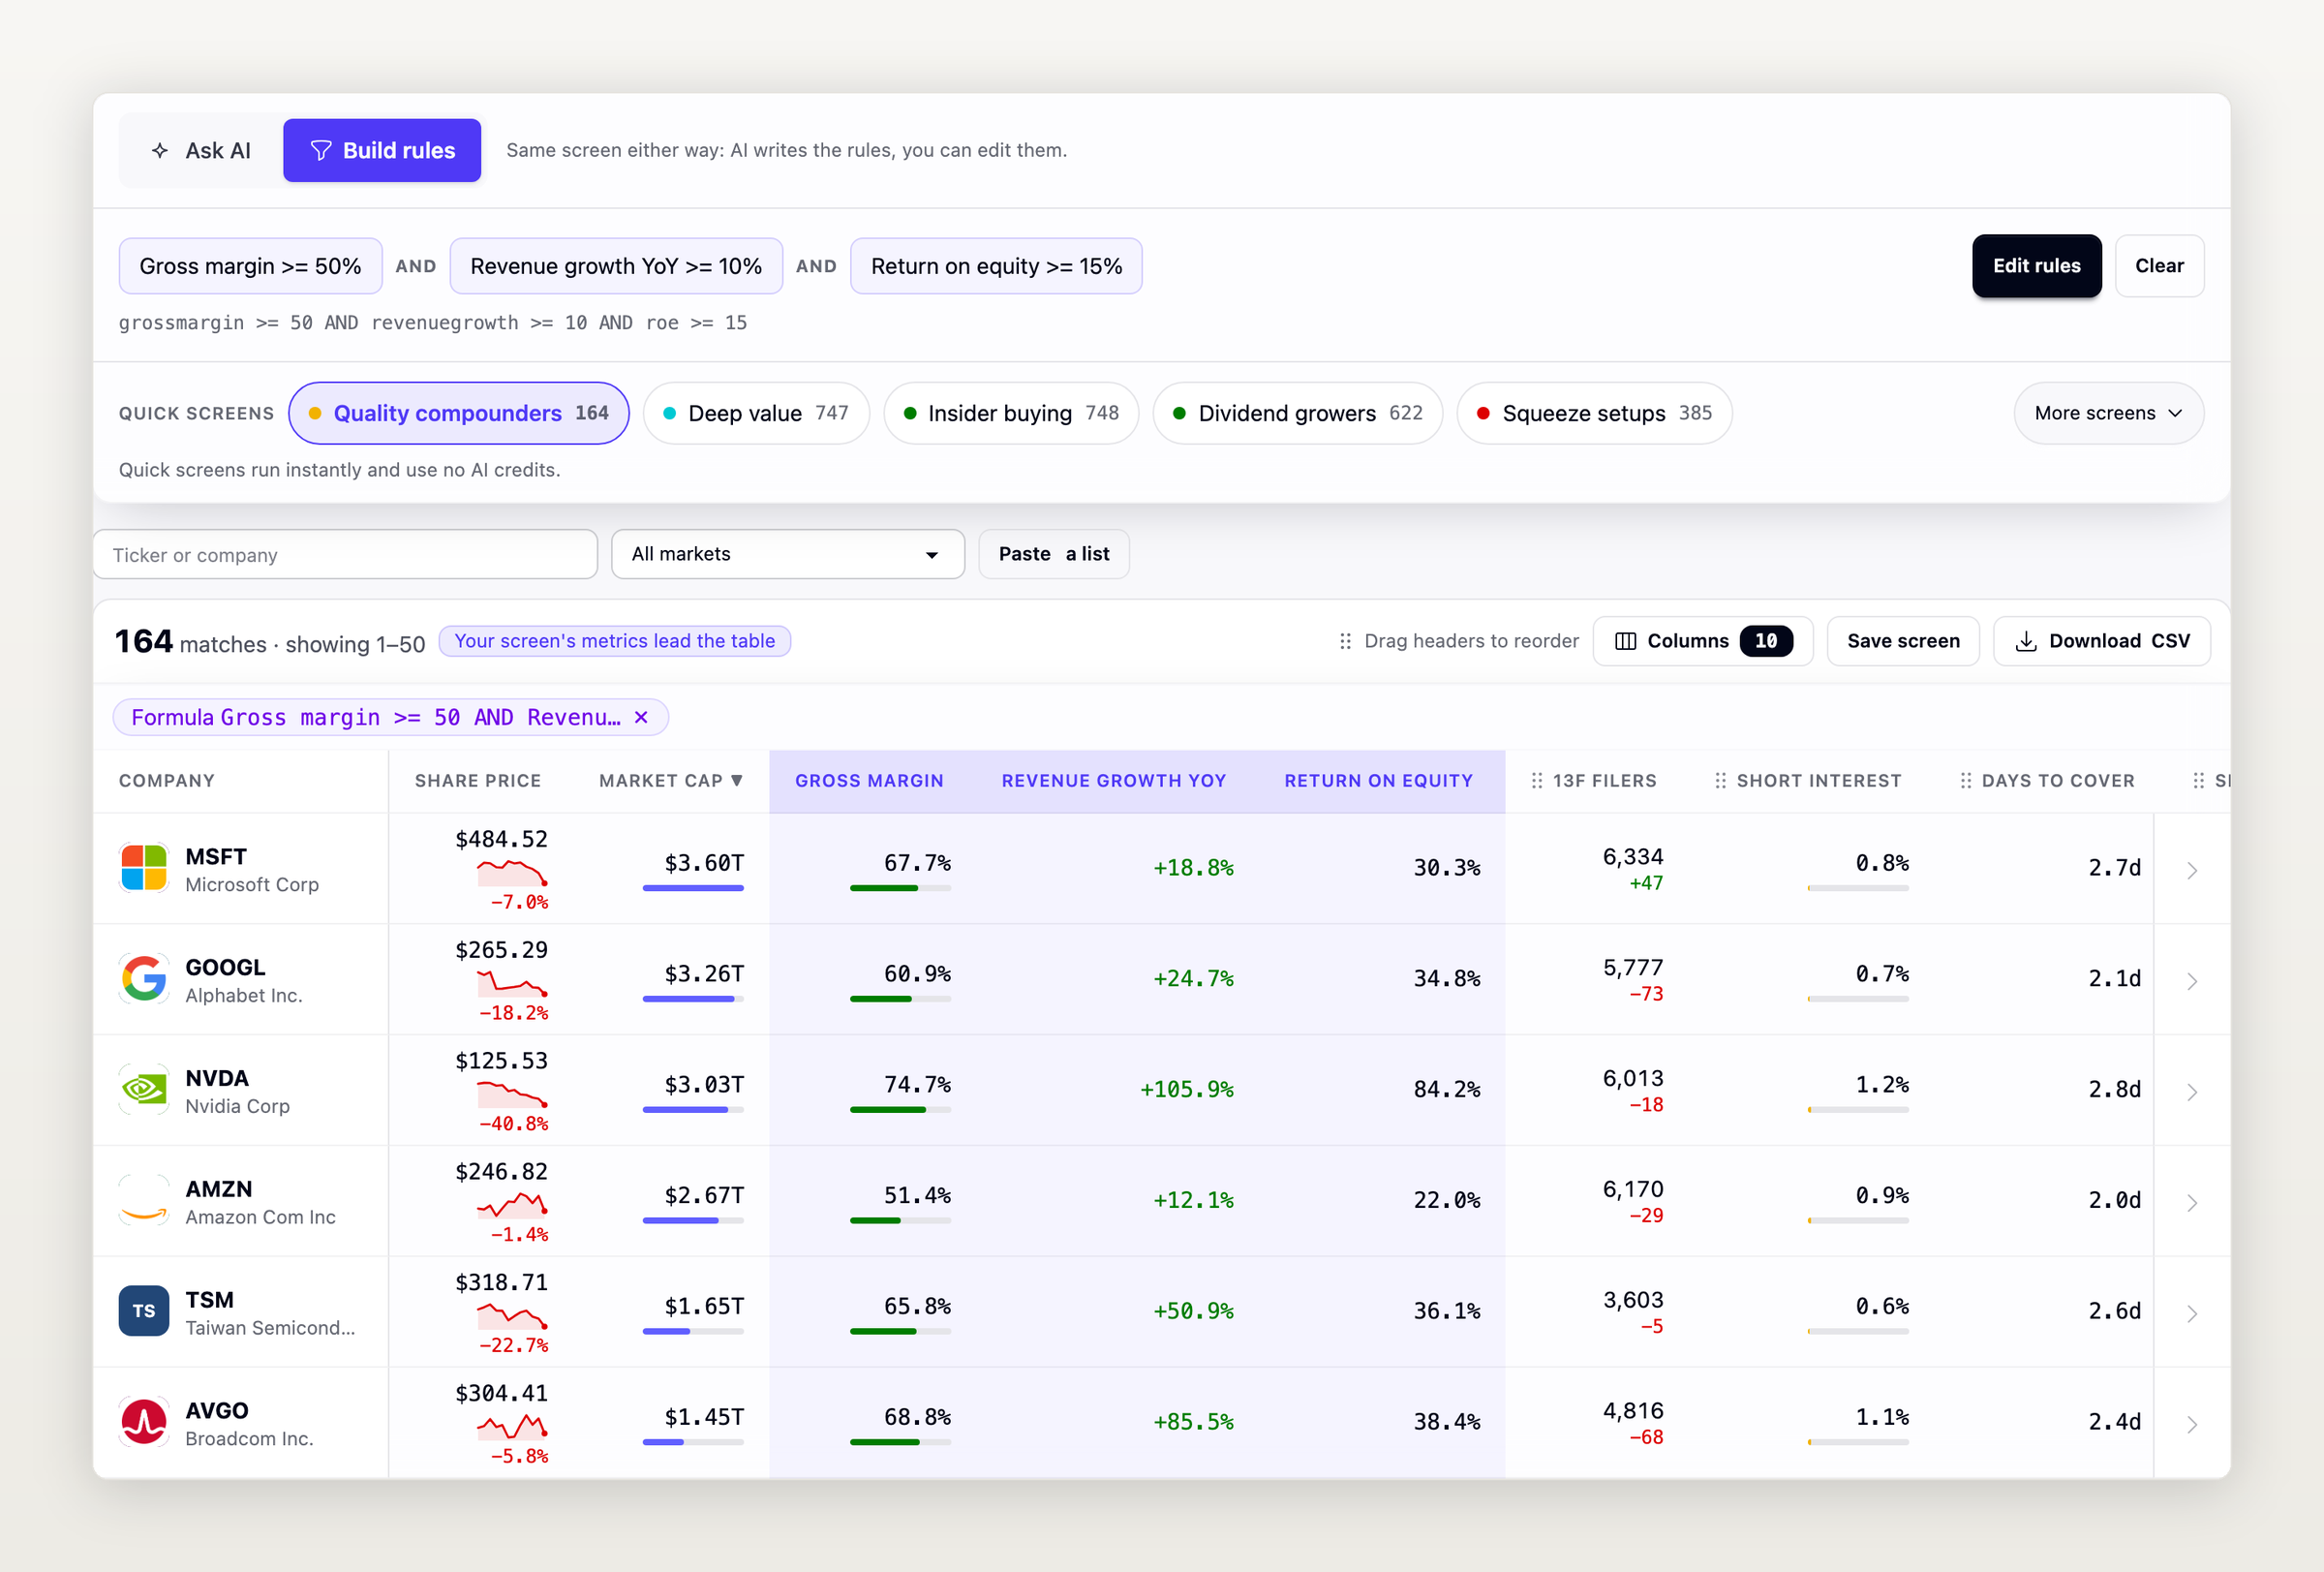
- One box to start: ask AI or build rules in the same place, with the quick screens in view and the applied rules on one line. The metrics your screen uses lead the table.
- Three conditions on Free: Free screens combine up to three conditions, up from one.
- Phones: results read as rows on a phone.
- Upgrades keep your screen: a screen over your plan's limit keeps its rules, and upgrading returns you to it.
- Same rules for assistants and the API: the MCP server and the REST API take the same rules as the screener page.
Trackers calculate values
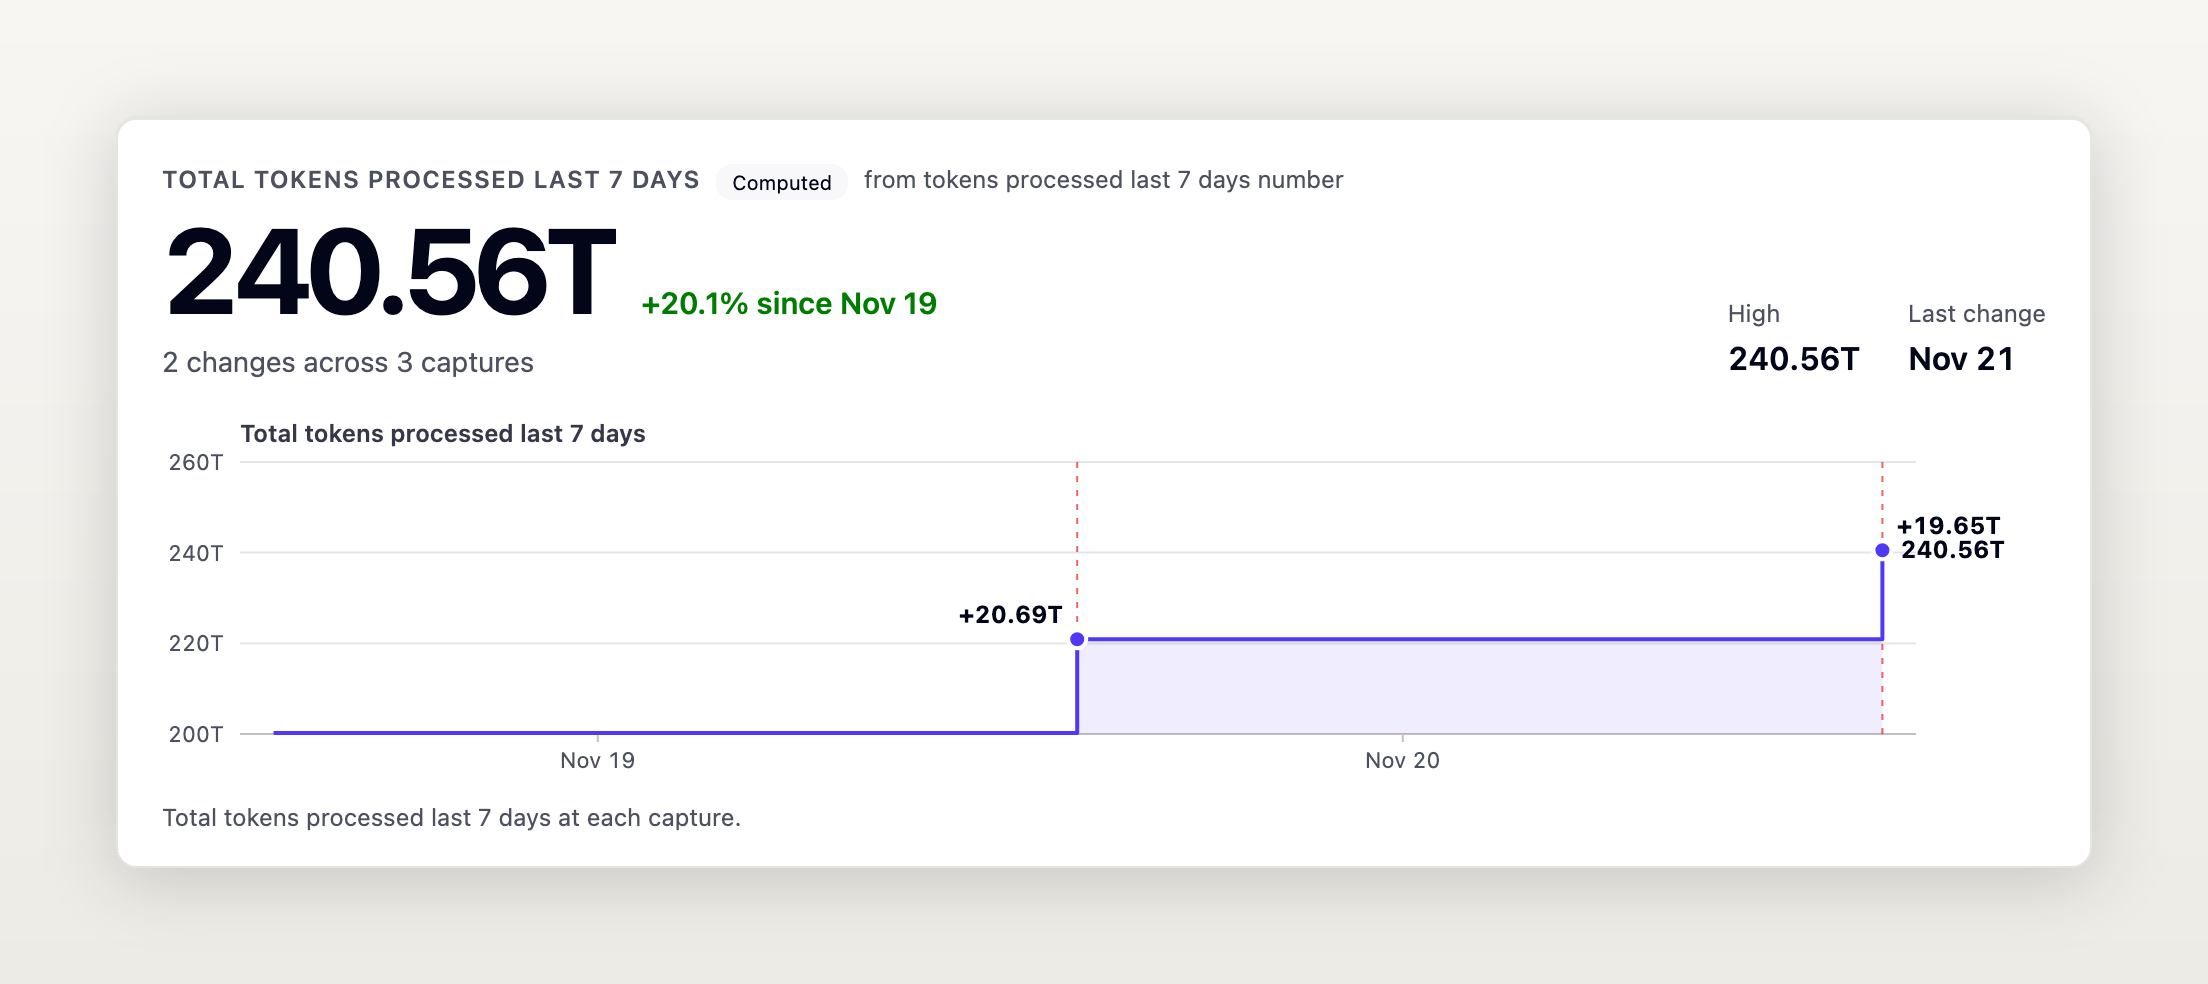
A tracker can now calculate what its page does not state, such as the full number behind "62.9T", a total across rows or a ratio, from the rows it verified. Each calculated value carries a Computed label, a tracker's total becomes its featured value with a chart over time, and the MCP and REST tracker reads return them. Trackers can also press tabs and buttons that change a page, read larger pages, say why a setup cannot work, and retry a network error within the hour.
Institutional holdings and IPOs
- 13F filings the same day: a 13F now loads the day it is filed, from the SEC's live filing feed, instead of the next morning. The MCP server lists the newest filings with their SEC filing and load times, and a fund's portfolio names the filing behind it.
- Withheld quarters: some filers, such as Norges Bank, withhold a quarter under confidential treatment and disclose it a year later. The ownership trend now counts such a filer at its last reported shares and marks the quarter, and holder lists, MCP, REST and ALVIS name the filers that withheld it.
- IPO filings before the listing: a company's S-1 or F-1, each amendment and its final prospectus are stored and readable from its IPO page before it lists, and appear in filing search; 190 companies waiting to list have theirs stored today. A company whose listing SEC's ticker file has not named yet is added from its own exchange registration filing.
Valuation
- EV/EBITDA and forward P/E: both join the valuation multiples, with peer medians and quartiles. Forward P/E names the fiscal year and the number of analysts behind it.
- Owner earnings and ROIC: the MCP server returns net income, depreciation, capital expenditure and owner earnings with return on invested capital for up to ten fiscal years, and the Financials tab charts ROIC over time.
Also new
- Index fund flows: index pages show the tracking fund's daily flows and its trades at the last rebalance, for indexes such as the S&P 500 and the Russell 2000, also on the MCP server and the REST API.
- Live call text: the MCP server and the REST API return an earnings call's text while the call runs.
- ALVIS: download an answer's table as an image or a CSV. Regenerate replaces the old answer, and long conversations keep a summary of their earlier turns.
- Canada: SEDAR+ filings and greeks on Canadian option chains on the MCP server and the REST API, and Canadian releases on the economic calendar.
- Documents: summaries of long documents, such as quarterly and annual reports, can run longer, with up to five facts.
- Insider trades: insider trades on the MCP server and the REST API show the day each trade was filed beside the day it happened.
- Pricing: the pricing page shows which markets we cover and what data each one has.
The changelog lists every new MCP tool and REST route.
What should we add next?
If a company, market or dataset you follow is missing, tell us. That is the gap we want to close next.