Operator
Good day, and thank you for standing by. Welcome to the Bellring Brand Second Quarter Fiscal Year 2026 Earnings Conference Call. At this time, all participants are in a listen-only mode. After the speaker's presentation, there will be a question and answer session. To ask a question during the session, you'll need to press star-11 on your telephone. You will then hear an automated message advising your hand is raised. To withdraw your question, please press star-11 again. Please be advised that today's conference is being recorded. I'd now like to hand the conference over to Jennifer Meyer, Investor Relations for Bellring Brands. Please go ahead.
Good morning, and thank you for joining us today for Bellring Brands' second quarter fiscal 2026 earnings call. With me today are Dorothy Davenport, our president and CEO, and Paul Rose, our CFO. Dorothy and Paul will begin with prepared remarks, and afterwards, we'll have a brief question and answer session. The press release and supplemental slide presentation that support these remarks are posted on our website in both the investor relations and the SEC filing sections at bellring.com. In addition, the release and slides are available on the SEC's website. Before we continue, I would like to remind you that this call will contain forward-looking statements which are subject to risks and uncertainties that should be carefully considered by investors as actual results could differ materially from these statements. These forward-looking statements are current as of the date of this call and management undertakes no obligation to update these statements. As a reminder, this call is being recorded and an audio replay will be available on our website. And finally, this call will discuss certain non-GAP measures. For reconciliation of these non-GAP measures to the nearest GAP measure, see our press release issued this morning posted on our website. With that, I will turn the call over to Darcy.
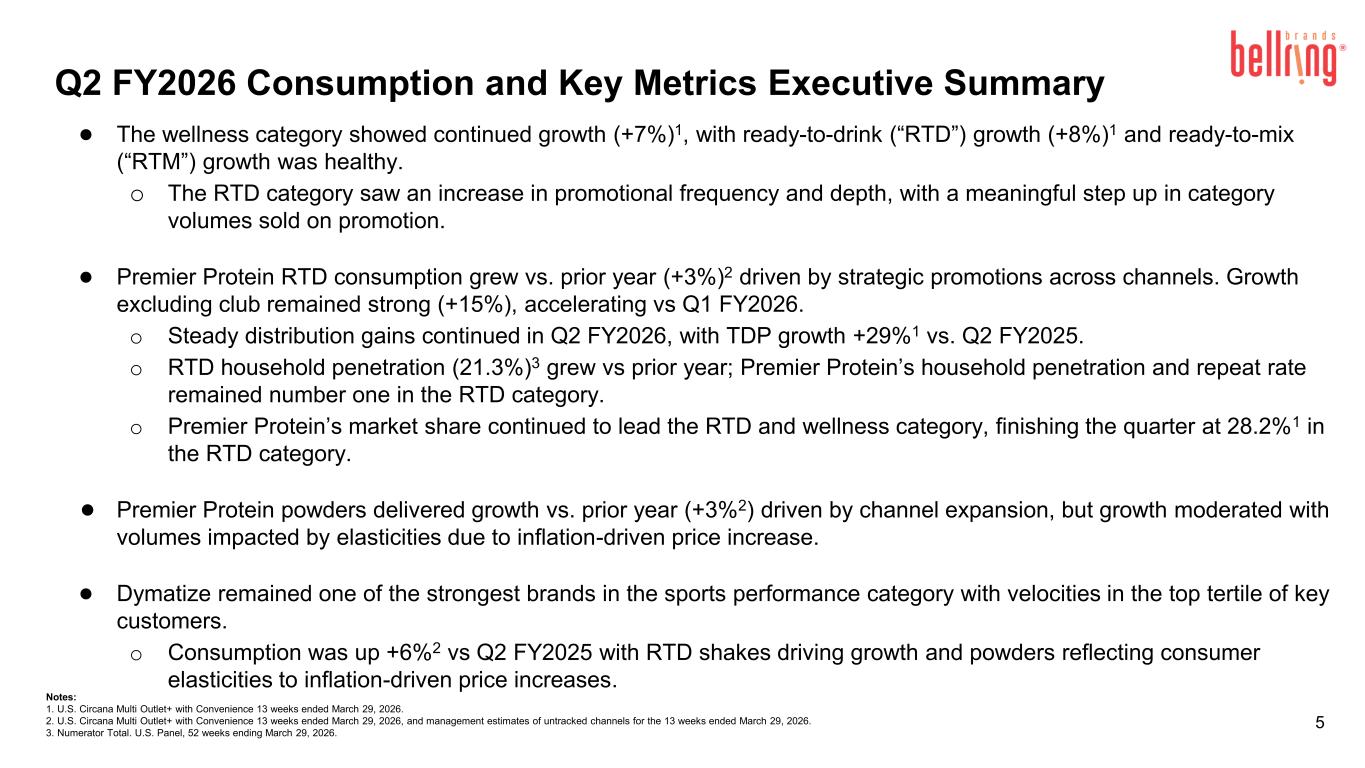
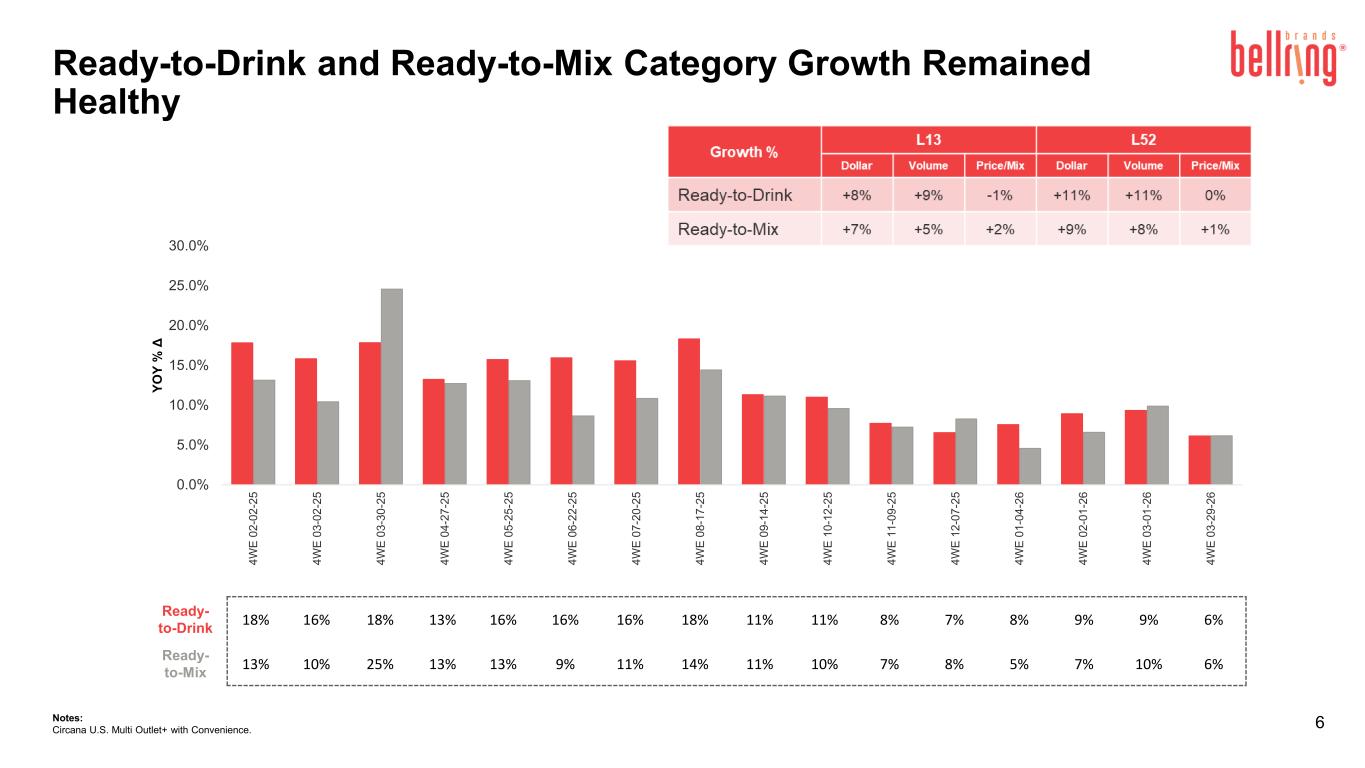
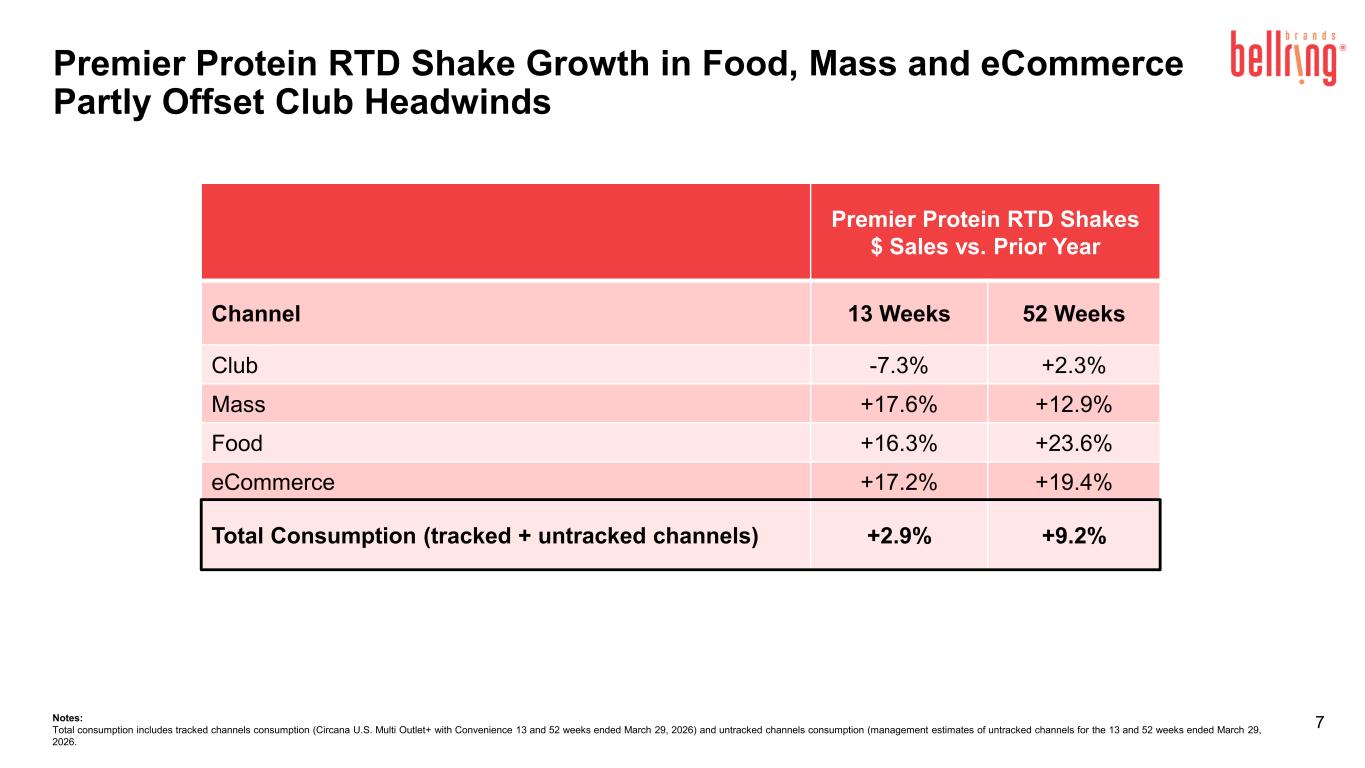
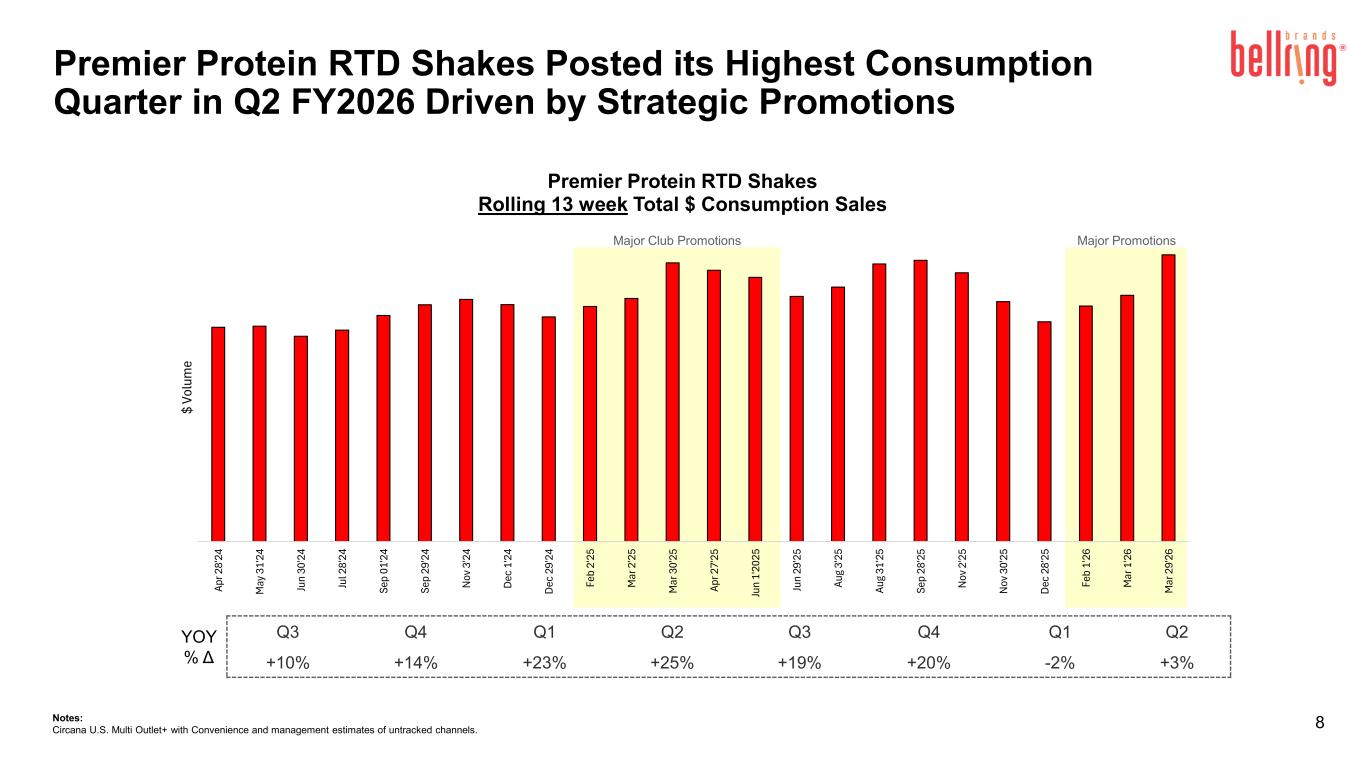
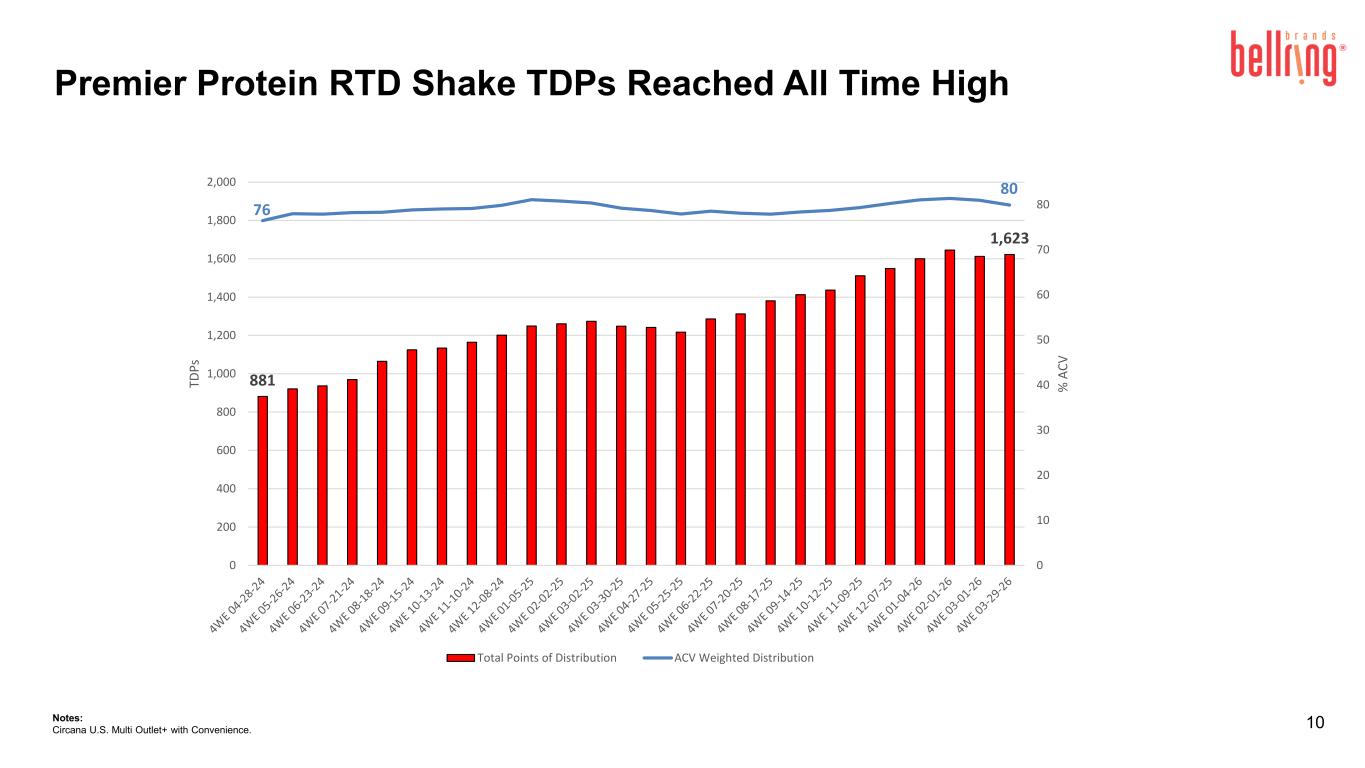
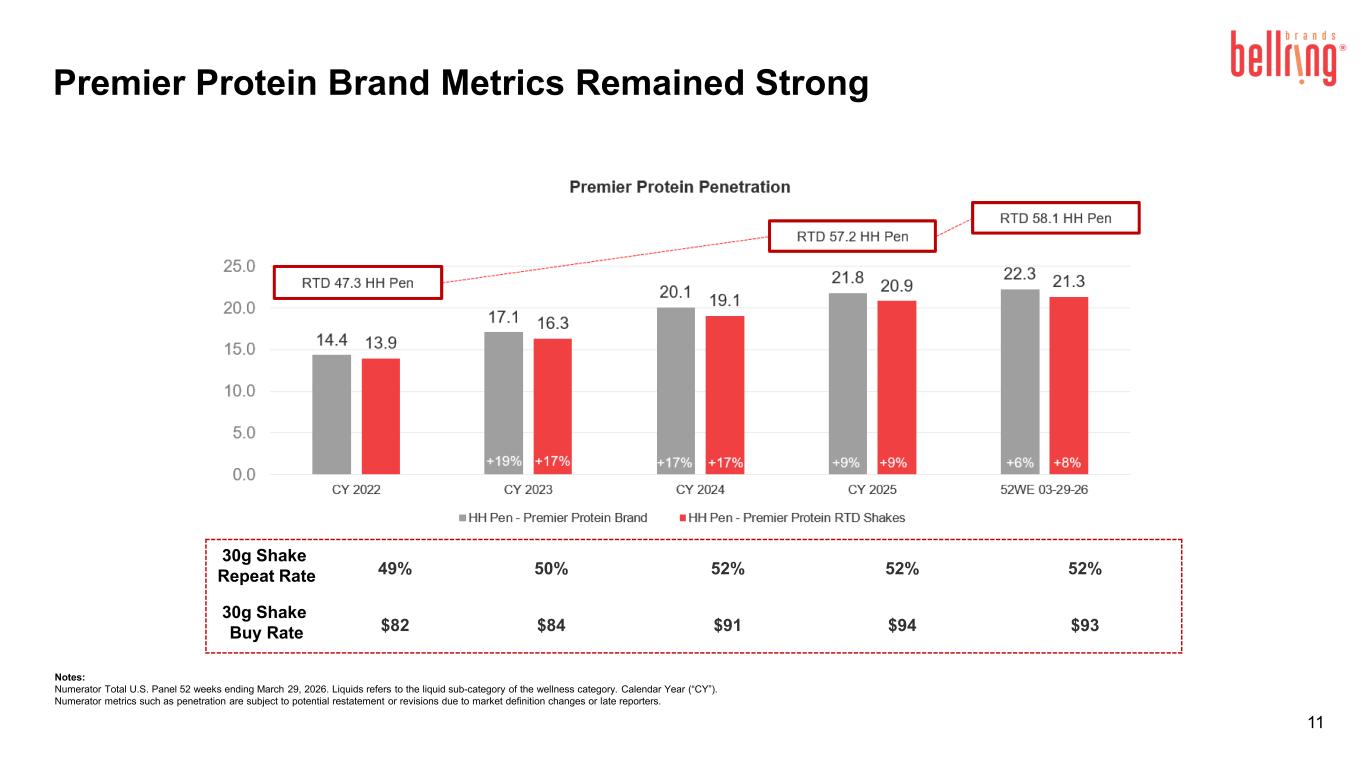
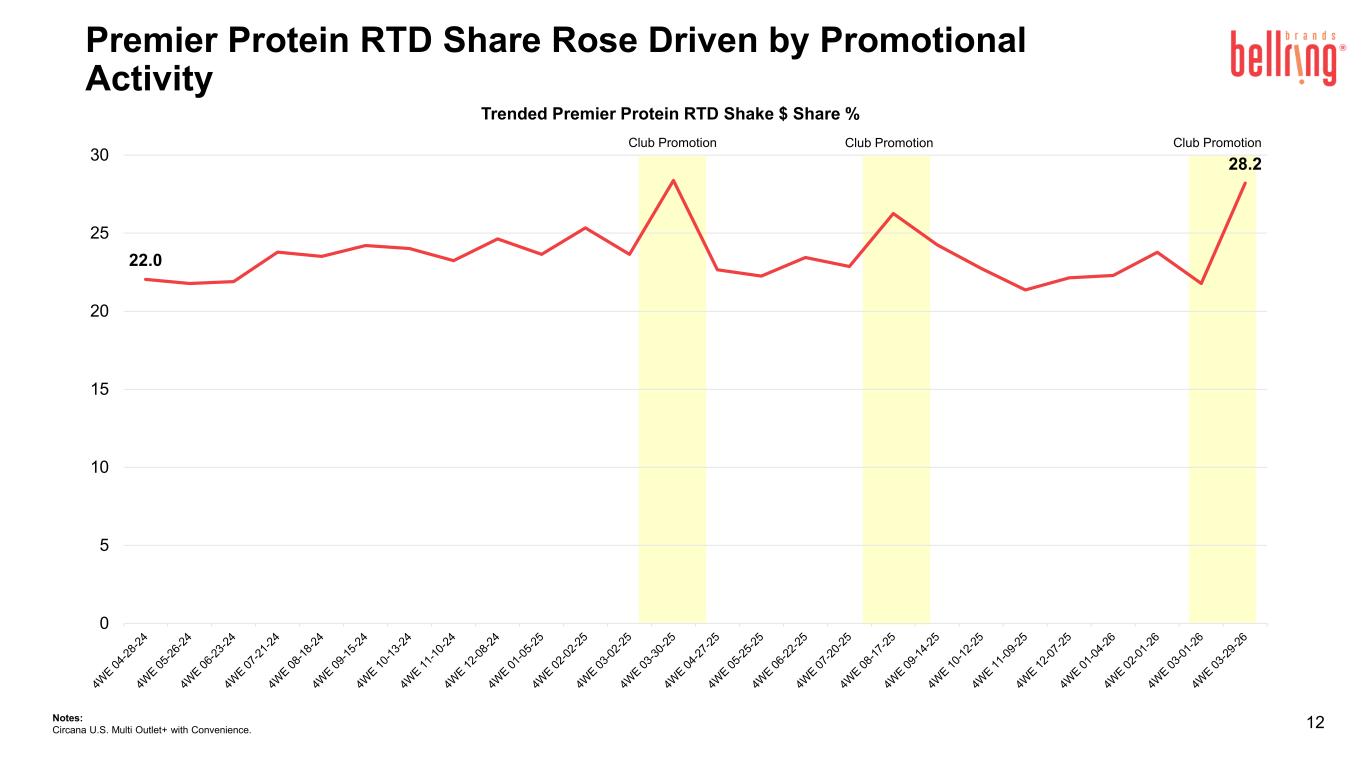
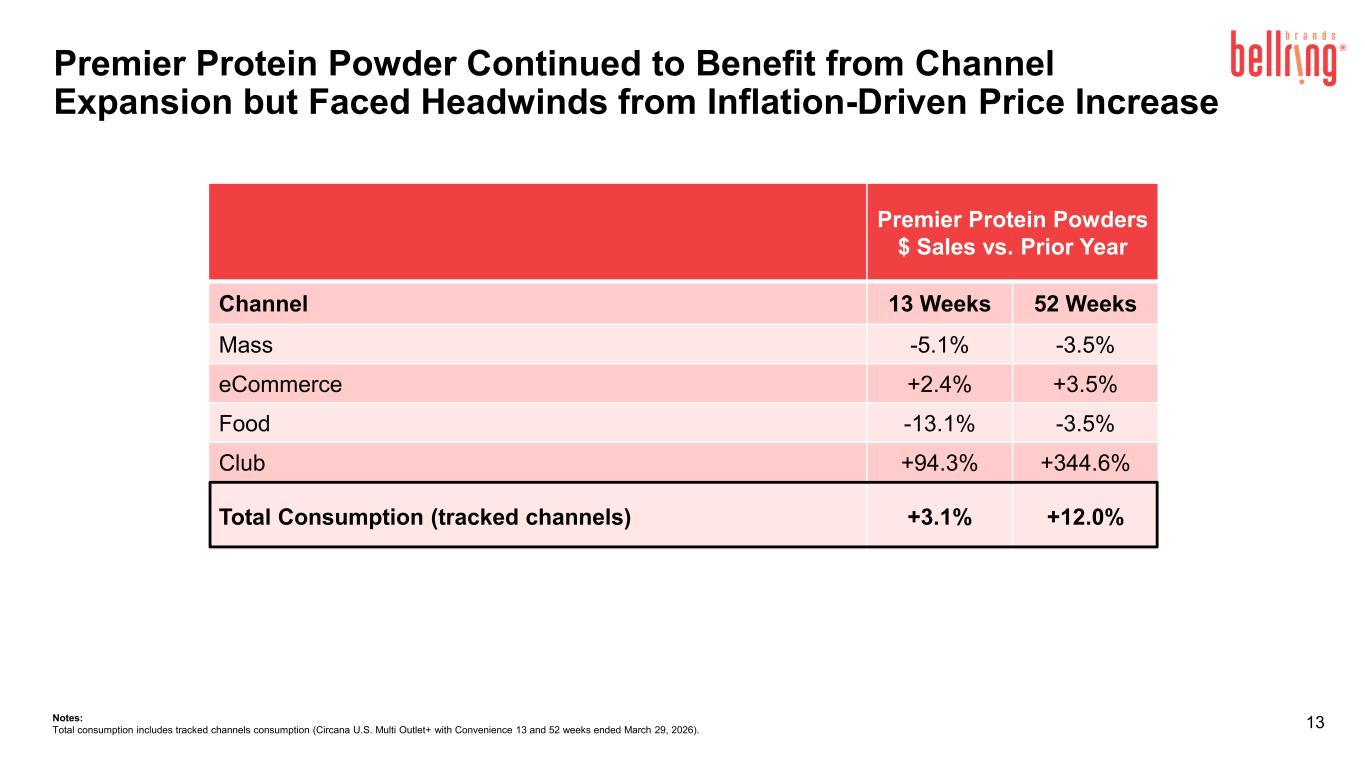
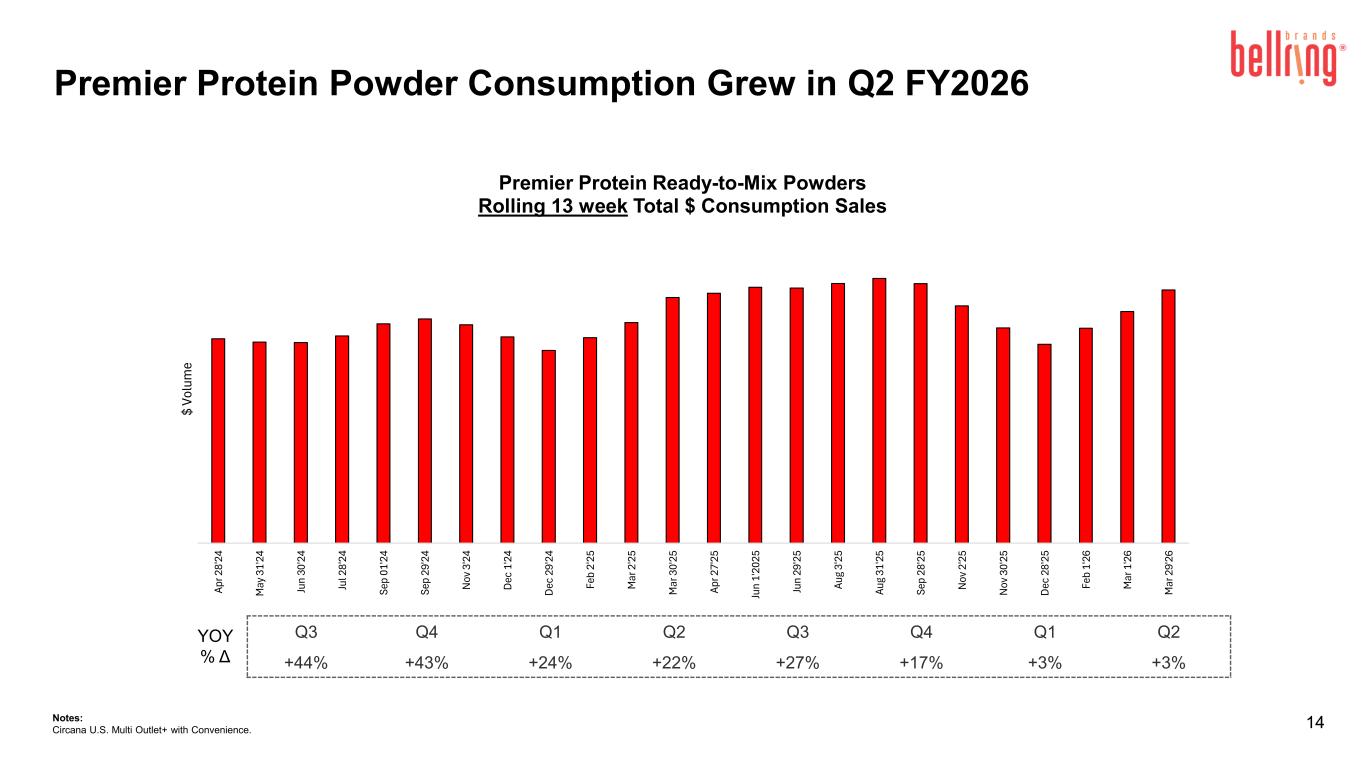
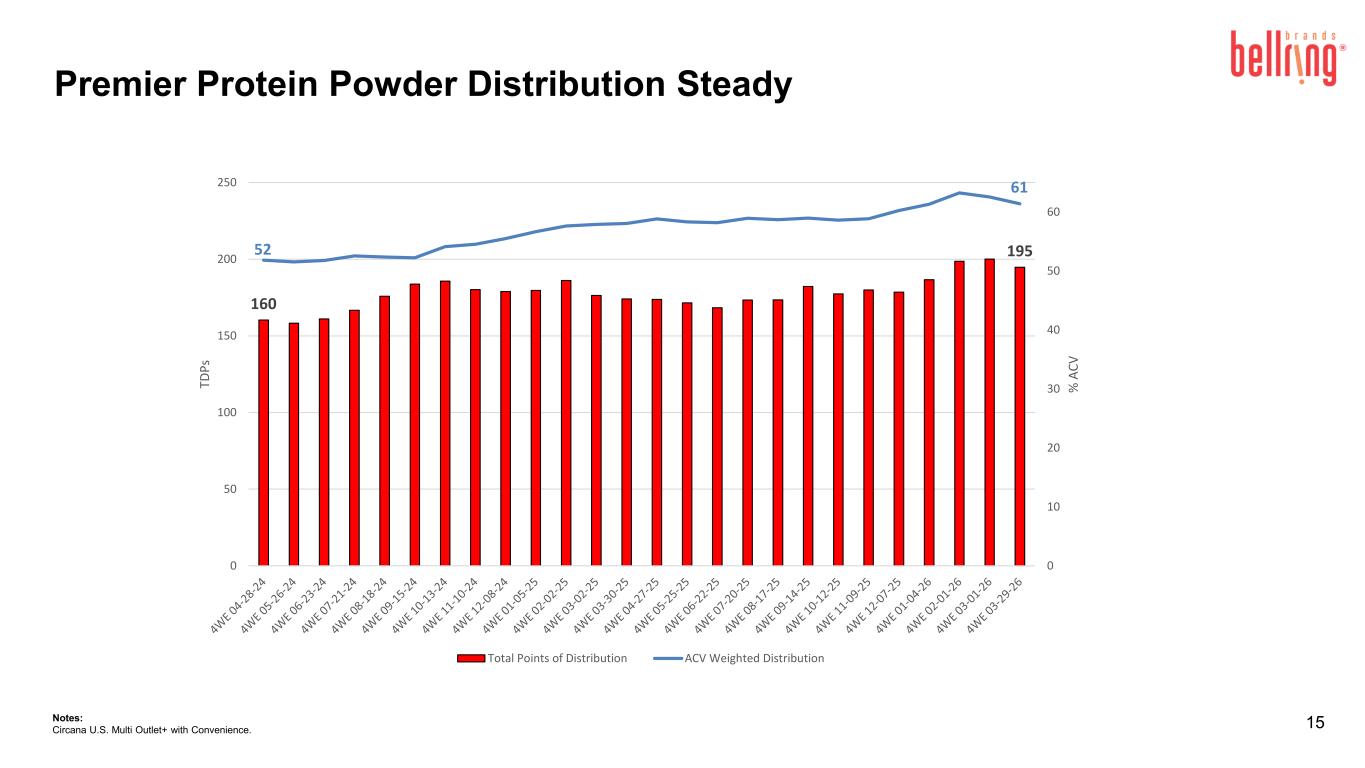
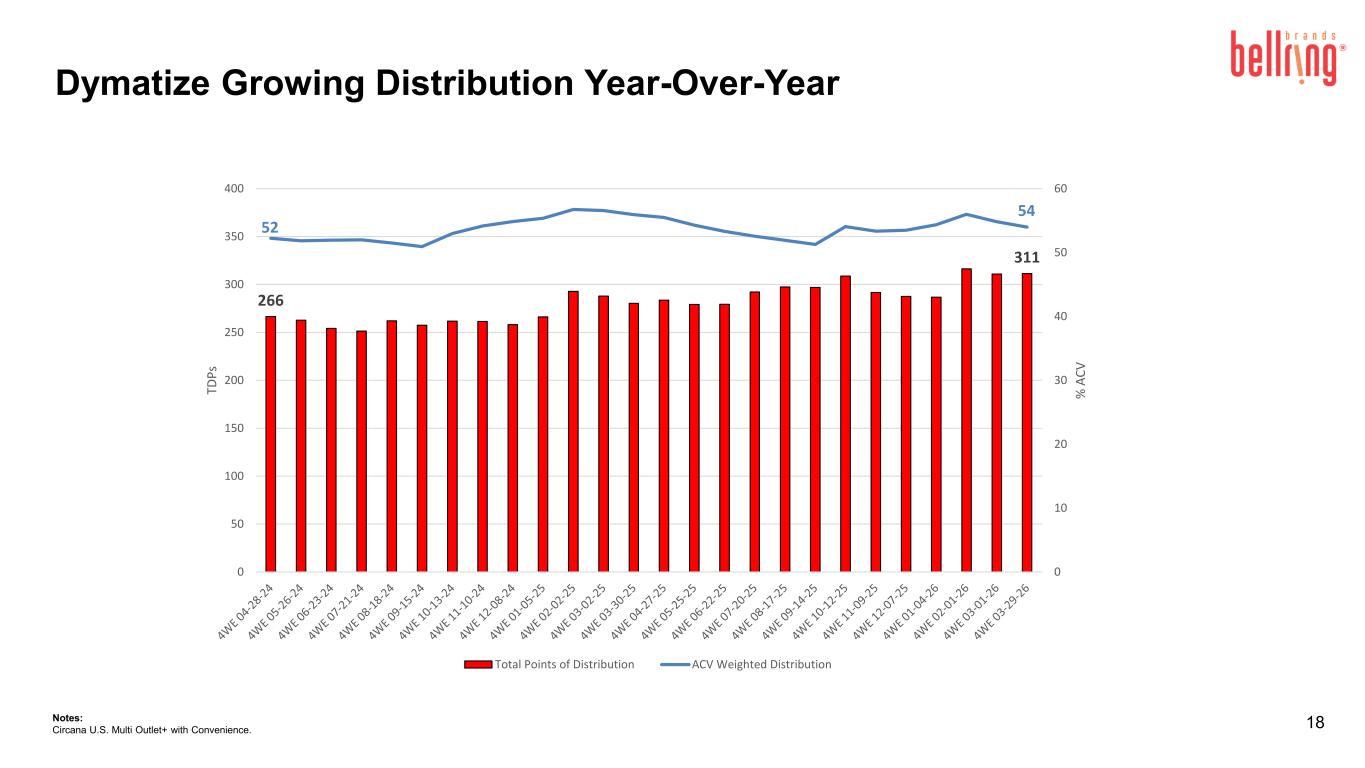
Thanks, Jennifer, and thank you all for joining us this morning. Our second quarter results came in below our expectations, and we were disappointed with our results. We faced a challenging operating environment, as multiple dynamics pressured our financial results. While net sales grew 2%, which was only modestly below expectations, the mix of our revenues differed meaningfully from both our forecast and what we've seen historically. The combination of negative sales mix, higher than expected freight costs, and an isolated inventory-related charge weighed significantly on our Q2 profitability. The challenging operating environment was driven by increased competitive intensity, a more pressured consumer, and macro-driven cost headwinds. Our updated outlook, which I'll discuss in greater detail, assumes these conditions persist through the back half and that our demand drivers will have a more muted impact on growth. We are also seeing protein-driven commodity inflation running above our expectations, which will impact us in the second half. Against this backdrop, we are making a deliberate choice to continue to invest in promotion and advertising to defend share and support our long-term growth. To put this in context, I'll step back and walk through how the environment has evolved over the course of the year. At the beginning of the fiscal year, the category was one of the fastest growing in CPG fueled by consumer health and wellness trends. Strong category growth combined with increased industry capacity attracted new competition. Retailers also expanded space, particularly in the club channel, which represents just over 40% of Bellring sales. As a result, we expected some higher levels of promotional investment. As the year progressed, the most meaningful change has been the rising cost required to maintain our leadership position. In the first quarter, we noted increased promotional frequency across the category, which largely played out as expected. This quarter, however, we saw a more pronounced share, including higher levels of trade down and a greater response to promoted price. These dynamics drove higher than expected promotional lifts across the category and pressured our baselines, further elevating the cost required to defend share. To illustrate, in Q2, promotional frequency and breadth increased sharply year over year as newer brands, particularly smaller entrants, continue to invest aggressively to gain traction. As a result, 27% of RTD's shake category volumes were sold on price promotion, up 8 percentage points versus last year, and a meaningful step up from Q1. Household penetration in protein shakes continues to grow, with little evidence of consumers shifting spend out of shakes into other protein-enhanced products. However, in recent months we have seen a contraction in RTD shake spend per household, marking the first decline in buy rate in five years. This reflects an increasingly value-focused consumer with greater reliance on promotions, low-priced brands, and value priced pack sizes. In short, the category remains strong with RTD shakes up eight percent, which is well ahead of the broader food and beverage industry. However, the impacts of increased competition are more pronounced than we anticipated at the start of the year, and the added factor of an increasingly price sensitive consumer has put near-term pressure on our business, especially the bottom line. That said, our category remains highly relevant to both consumers and retailers with meaningful runway for growth. For fiscal 26, we expect RTD's shape category to grow at the low end of high single digits, primarily driven by volume. While we expect heightened promotional intensity to continue, we also anticipate base pricing across the category to rise, considering the rapidly inflating input environment. Against this backdrop, I'll now turn to details on our second quarter results, operating plans, and an updated outlook. Net sales increased 2% in the second quarter, with Premier Protein net sales in line and Dymatize sales down 2%. Premier RTD Shake net sales increased 2.3 percent, with double-digit volume growth mostly offset by price mix declines. Premier powder and diametized net sales were consistent with expected consumer elasticities following our price increase. Premier shake dollar consumption was up 3 percent. Consumption outside of club continues to be strong, up 15 percent, with the mass channel up high teens, driven by distribution and incremental promotion. We were pleased with the performance of our key promotions this quarter with a club retailer and a large mass retailer driving a record quarter for both sales and consumption. Both events exceeded our expectations and delivered significant household gains with meaningful portion coming from out from new to category consumers. Consistent with category trends we saw softer velocities in non-promoted weeks and retailers reflecting shifts in consumer purchase behavior toward promotions and value priced options. This, coupled with increased promotional lifts, led to a higher-than-expected mix of promoted versus non-promoted volume. Our promotions in Q2 ran as we communicated in early February with no further events added during the quarter. I'll now turn to an update on our demand drivers which remain centered on growing our distribution both in and out of the aisle, increasing advertising investment while elevating its impact, and launching innovation that provides consumer excitement, ads, occasions, and drive trial. Distribution growth continued during the quarter and we remain on track for double-digit TDP growth in 26. It's worth noting that single-serve bottles represent a decent portion of these gains and while not as productive as larger pack sizes they drive trial and are a critical part of our display strategy our promotion with a large mass retailer which included extensive displays and end caps across both pharmacy and grocery aisles drove strong consumption increased household penetration and delivered solid trial for a coffeehouse innovation given these successes we now plan to repeat this promotion in the mass channel in the fourth quarter. Our second priority is advertising where we've increased investment and elevated our creatives. Our new Go Get Them campaign launched in late December is showing early signs of success with lifts in awareness, brand equity, and traffic to our website and e-commerce product pages. Our analysis indicates strong ROI and incremental sales from the campaign. We believe continued brand investment is the right strategy to strengthen brand equity and support long-term growth and we expect to maintain our investment this year at approximately four percent of sales with more tempered near-term returns given the more competitive promotional environment turning to innovation as i've discussed previously we conducted a comprehensive demand study to identify white space opportunities as the category evolves to meet a wider range of consumer needs and occasions two of the most attractive and underserved areas where performance protein and refreshing protein. I'm pleased to announce we will be launching new products in both spaces in the fourth quarter. The first, Premier Protein Ultimate, is a new 42-gram shake for consumers looking for high protein levels. Available in both multi-packs and single-serve bottles, the item targets a fast-growing 40-plus protein gram segment and launches in mass, e-commerce, and select food retailers. I'm especially excited about our second new offering, Premier Protein Sparkling Soda, which targets one of the most underserved segments of the category. Premier will be the first scaled player to enter this rapidly growing segment. Our sparkling soda is bubbly and refreshing with 15 grams of protein in a vibrant canned format in four different fruit flavors. It has a very clean label with only five ingredients. We expect our protein soda to bring in new, younger consumers, increase basket sizes, and expand usage, particularly the afternoon and midday occasions. The initial launch of this refreshing protein item will be in a significant mass retailer, e-commerce, and many other FDM retailers. It will be supported by strong display merchandising, targeted retail media, and an exciting social media campaign to drive awareness. I'll now move on to the details of our outlook. We expect Q3 premier shape conception to be relatively flat with continued double digit growth outside of club. Club remains challenged in Q3 with increased competitive promotional intensity and consumer trade down weighing on our performance in this channel. Our promotional activity in Q3 is expected to be fairly modest, slightly below last year's Q3 levels. We now expect full year 26 net sales growth of flat to up 2%. Our updated adjusted EBITDA margin outlook is 14%, inclusive of 50 basis points of impact from the Q2 inventory related charge. This assumes that price mix and freight cost headwinds continue in the second half of the year. Additionally, as consumer demand for protein remains strong and protein products continue to proliferate, demand for protein input has materially increased. This is a result, this is resulting in protein driven commodity inflation above our initial assumptions which will begin to impact us in the third quarter with a greater impact in our fourth quarter. In this environment, we are bouncing near-term investment to defend market share with actions to strengthen long-term profitability. We believe that our results this year are below the long-term potential of the business and closing that gap through innovation, pricing discipline and cost optimization is a clear priority. In closing, the near-term environment is challenging as we navigate competitive, consumer and macro inflation headwinds. However, consumer demand for protein remains healthy and while competitive intensity from insurgent brands remain elevated, we would expect it to gradually moderate over time. In the long term, we continue to expect scaled players with deep category expertise, mainstream appeal, and high repeats to be the winners as retailers consolidate shelf space behind the best-performing brands. Premier's strength across each of these attributes positions us well to capture our fair share of the long-term growth. Our team is acting with urgency to adapt to the evolving environment and position our business for long-term success. Now, I'll turn the call over to Paul.
Thanks, Darcy. Good morning, everyone. Total bell ring net sales for the second quarter were $599 million, up 2% year-over-year, with adjusted EBITDA of $54 million. As Darcy noted, sales were modestly below our expectations, while adjusted EBITDA margin of 9% was 400 basis points below our guide of 13%. An inventory-related charge of 11 million represented 190 basis points of the variance. The remainder was primarily driven by the composition of our Premier Protein RTD sales along with higher than expected freight costs. Premier Protein net sales grew 1.7 percent with RTD Shake net sales up 2.3 percent. Premier Shake volumes increased 12 percent with unfavorable price mix of 9 percent with the latter above expectations given higher promoted volumes coupled with lower baseline volume. Dymatized sales declined 2% impacted by elasticities due to inflation-driven price increases. Adjusted gross profit was $136 million with adjusted gross margin of 22.7% compared to 34.5% a year ago. The year-over-year decline was driven by significant input cost inflation, including tariffs, the unfavorable price mix I just described, higher freight, and the inventory-related charge. Compared to expectations for a cost for modestly above plan, and protein inflation was in line. SG&A expenses were $92 million at 15.3% of sales, in line with prior year on a percentage of sales basis. This is inclusive of an increase in advertising investment, which was up 140 basis points as a percentage of sales. Turning to our 2026 outlook, we now expect net sales of $2.325 to $2.365 billion, which represents flat to 2% growth. Adjustity of debt is expected to be $315 to $335 million, with a margin of approximately 14%, or 14.5%, excluding the inventory-related charge in Q2. Our revised guidance incorporates our second quarter results and our updated outlook for the second half, which I will now discuss. We now anticipate net sales growth of 1% in the second half, in line with the first half, versus 8% implied in our prior guide. The sales revision is primarily on Premier Protein, where we have reflected the consumer dynamics we saw in Q2 and a more muted contribution from demand drivers. Specifically, we have reduced our second-half baseline velocities for Premier Protein RTD shakes, which has an outsized impact in Q3. As a reminder, Q3 typically is a lower promotional quarter than Q2 and Q4. In Q4, we have added promotional activity, which increases trade spend and also unfavorably impacts mix, as we saw more volume on promotion than previously expected. As a result, we now expect volume growth and price mix headwinds in the second half to be relatively similar to the first half for Premier Protein, with high single-digit volume growth partially offset by mid-single-digit pricing headwinds. Regarding adjusted EBITDA, we expect second-half margins of 15% versus 20% implied in our prior guide. Four items drive this change in EBITDA margin. First, higher freight and protein costs represent approximately 200 basis points. Second, unfavorable mix and increased trade investment are approximately 160 basis points. Third, lower cost savings and other manufacturing costs are approximately 60 basis points. And last, lower SG&A leverage represents the remainder of the decline. Importantly, we are maintaining our advertising investment at approximately 4% of sales for the full year as we continue to support the Premier brand. For the third quarter, we expect net sales growth to be down approximately 1%, with Premier declining slightly, somewhat offset by diamond-sized growth. Third quarter, just EBITDA margins expect to be approximately 16% and reflect significant year-over-year commodity and freight inflation, tariffs, and higher planned advertising investment. Compared to the second quarter, Q3 margins benefit from better mix as less volume is sold on promotion. Additionally, we expect improved pricing and margins on our powder business as Q3 fully reflects the price increase implemented late in Q2 to address historic lay inflation, the key input in powders. Now I'll make a few comments on cash flow and liquidity. The first half was a modest use of cash in line with our expectations, and we ended the quarter at net leverage of three times. We return cash to shareholders who share repurchases with $26 million repurchased in the second quarter. We continue to expect strong cash flow generation in the second half of 26 in line with historical conversion. Recall we anticipate payment of a legal settlement in our Q4. As a result, we expect leverage to remain in the low threes during the remainder of our fiscal 26. In closing, we believe in the long-term potential of our category and the premier brand and are not satisfied with our current performance. The near-term environment is challenging, and we are investing in promotions and advertising this year to defend market share while managing through significant commodity cost headwinds. We are evaluating our pricing plans and cost structure to strengthen our economic model and continue to believe in the long-term attractiveness of our business. We hold a leadership position in the category, supported by a brand that remains highly relevant to consumers and retailers, and an attractive, scaled, asset-like model. We are acting with urgency to position the company for improved performance. I will now turn it over to the operator for questions.
Operator
As a reminder, if you'd like to ask a question at this time, please press star 11 on your telephone and wait for your name to be announced. To withdraw your question, please press star 11 again. Our first question comes from Andrew Lazar with Barclays.
Great. Thanks so much. I guess, Darcy, over the last couple of quarters, you've mentioned that it'll be gradual, but over time, the category will likely go through somewhat of a shakeout, right, as some of these insurgent brands ultimately don't prove to have the kind of velocity on the shelf to sort of maintain the shelf space, right, that they're currently paying up for. And I know that that takes some time. But we've seen that happen in other sort of growthier categories as well. I think maybe one of the, I guess, concerns that I've heard a lot about is what gives you the confidence that, I guess, the premier protein brand can be, right, and sustain its leadership or be among one of the leaders in this category if we're thinking two years out from now. So, you know, what are you seeing in the category that's, you know, making some of these insurgent brands so attractive, right, to consumers? Are there, is the innovation, right, that Premier's keeping up with? Or I'm trying to get a sense of, you know, if one thinks that Premier Protein is going to be a leadership brand two years from now in a category that clearly has a lot of runway, one would think, therefore, the stock wouldn't be at sort of levels where it is. So that's kind of the question I've got.
Yep. It's a great question. So first of all, the category itself, I mean, we have seen it is a healthy category with a ton of tailwinds. And so when you have those type of macro tailwinds and then you get added capacity into the market, there is going to be a ton of competition. As the number, I think our latest estimates were internally, you know, somewhere around 40 new competitors over the last 18 months. So it's tremendous. And as the number one player, you know, we are going to get affected by that. I think what gives me confidence is, first of all, you know, we're largely holding, you know, our share. we've had a modest share loss which is expected but we're actually gaining share outside of club but there's no doubt it's costing us more than we expected and that was evident in our results I think that when I step back and I think of the long-term potential of you know a the category and premier as a leader you know we truly believe that the reap there is going to be a shakeout there you know retailers or are going to consolidate the shelf around the most successful brands and we will be them and we will be be in that consideration set because we are right now have the highest awareness repeat household penetration we are the what the most well-known brand both with aided awareness and unaided awareness. From a GLP-1 standpoint, we are the brand that gets the most benefits from GLP-1 because of those things. We have great brand metrics and that has not changed. So we are the most trusted brand. We are the brand that people are willing to pay more for. We are the high quality. All of these things which take years to create that trust with consumers and given the amount of you know given the amount of competition and because we you know have been the number one you know we expect to have kind of we're getting next you know small next but we actually are not losing our more than our fair share to anyone which I think is, you know, encouraging. So I think that we built this national supply chain. We have tremendous knowledge about the category and overall, you know, the brand is ultimately what consumers are, you know, choose and I think right now we are having a shakeout and it's going to be the ones with these strong repeats that ultimately win and we're going to be one of those I think it's also just remember Andrew this is a growing category you know and you can have multiple winners so this is not just a zero-sum game I know we talked about this when we first IPO'd but I think that's a that's a big
Operator
that's a big factor great appreciate that thanks so much our next question comes from Megan Clapp with Morgan Stanley.
Hey, good morning. Thanks so much. Maybe we could just build on that and talk a little bit about the category and the promotional environment, which, you know, Darcy, I appreciate all the color you gave in the prepared remarks just around what has changed. And, you know, it does sound like promotions ran as planned. You didn't add any events, but that you're just seeing, you know, the cost of volume is higher as consumers are a little bit more price sensitive. So, you know, the category does feel like it's trending a little bit more towards the kind of traditional CPG promotional cadence, seeing that big move in terms of the volume sold on promo was pretty significant in the quarter. So, you know, I guess like the question is, do you view this as more macro driven and kind of likely to normalize and what gives you that confidence? Or is this, you know, maybe a bit more of the new normal for the category as it starts to scale and maybe attracts kind of a more mainstream price-sensitive consumer and related, and sorry for the multi-part question, you know, how do you expect kind of base pricing across the category to rise given what you're seeing right now? Thanks.
Yeah, I think this is macro-driven, so as you mentioned, the reason why I think it's macro-driven is just, well, first of all, that you highlighted that promotion materially increased in the quarter, up eight points, so it's a big number that's 40% higher than last year so it is a big number and so not only did the overall category but then you know we saw higher lifts and no we did not add any more events to compete it was simply the events that we had drove higher lifts and connected pressured our non-promoted baselines hence the impact to to the bottom line you know we think this is a direct impact of kind of consumer you know the broader consumer affordability issue I mean ultimately when you look at the our products they're a pretty inexpensive breakfast but the absolute pricing in club is about $30 so when you have you know a coupon that is 25% off that that's you know eight dollars so it matters to consumers so I think that's what you're seeing we do believe that this is kind of you know transitory I think that it will it will change but right now we're kind of in a bit of the perfect storm specifically with increased consumer price sensitivity you know sustained competitive intensity when you have these insurgent brands not acting very rationally and then the increased inflation. So that's the first piece. The second piece was just what do we expect pricing and because of the increased inflation and and you know I Paul and I both talked about how not only you know these are also macro so you're seeing you know freight increases and also protein increases that you know pricing has to follow and so you know I don't know exactly the timing but over the next you know whatever 12 12 plus months we there has there has to be some pricing that follows because the increases are just too big okay thanks Darcy our next
Operator
question comes from David Palmer with Evercore ISI.
Thank you. Sort of a follow-up on that and just what you would encourage us to be monitoring along the way, you know, with inflation increasing and maybe you give us some color about when you see some of these things flowing through. It sounds like your last comment about the 12 plus months. I'd love to get a sense of, you know, maybe the cadence of inflation increases that you're seeing. But really, I want to ask you about pricing power you know what's going to convince you that you have that when I look at base volume for in the all channel numbers it looks like it was up four percent four or five percent it looks not bad I mean compared to a lot of companies that we see in terms of base volume trends that would would more or less convince you that you have pricing power versus the down what high single digits versus the low single digits that you had so what what should we be following and thinking about to give us a sense of how you're thinking about pricing power going forward in the data thank you yeah I'll hit pricing power and then Paul you can address the inflation question yeah I think we've
shown that we have pricing power we have a fantastic brand with high repeat high loyalty, the highest loyalty in the category and we've taken pricing over time when we've had to and so and we see kind of expected elasticities and if you think of the last you know five years I think we've taken three or four price increases, and we've continued to grow. We try not to, but I think that given when you step back and you think of how much it costs, it's a healthy breakfast, and you think of a shake is about two dollars, so given all the kind of macro tailwinds around protein, and a $2 healthy, convenient breakfast is still, you know, pretty reasonable. And so, and again, I go back to just our loyalty and our history showing that we have pricing And then on, yeah, on inflation, David.
So a couple of things on inflation. So first, we, you know, we expected a healthy dose of inflation this year anyway with special especially on our whey proteins, which is the inputs on our powders. And so we had called kind of mid-single-digit inflation for the year. What has changed is, first, as Darcy highlighted a minute ago, freight has increased. A lot of that has to do with the Middle East conflict. We saw that kind of happen after kind of in the February timeframe and beyond. So that we expect to continue. That is not a huge driver because it's about 10% of our overall cost, but it's definitely a headwind. And the bigger piece is we've continued to see whey protein increase, so that's affecting our powders in the second half. And then over the last couple of months, the non-fat dry milk market on the CME has gone up significantly. So that's really the biggest new news on the inflation side is we've just seen a significant increase there. We were largely covered for the year, but we weren't fully covered. So there is some impact in the latter part of our year. And then as we look into next year, obviously we need to see where this plays out. It doesn't seem like it should stay at these levels and it should pull back, but obviously we can't make that prediction at this point. If they stay at these levels, then obviously we would have some headwinds in 27 that we would need to address. I think on the whey protein side, the headwinds in 27 should be less. They may not be zero, but they will at least not be as significant as we saw in 26. So really the big new news is just a ramp up on the cost side of nonfat dry milk, which is a key input cost into our milk proteins, which are in our shakes.
Operator
Our next question comes from Alexia Howard with Bernstein. Thank you and good morning.
Following up on the previous question on input cost inflation, do you have visibility into what competitors that are using ultra-filtered milk would be seeing? because my understanding is that the milk inflation has not been as sharp. So I'm just trying to think about how this might play out across the space in terms of competitiveness. Thank you.
Yeah, we believe over time that the dairy complex should be similar for ultrafilter milk as it is for milk protein concentrate. So over time, we don't believe that there's a structural difference. Now, to be fair, I don't have full visibility into some of our competitors and what they can achieve on a cost side. But, you know, we feel like we have strong advantages on scale with milk protein. We obviously source it not only domestically but internationally so that it's interesting. The U.S. markets right now are elevated compared to the international markets on some of the nonfat dry milk and skim milk powders. So that could give us some advantage. And I should have mentioned this on the last question, and I did not. But, you know, for 26, we're largely now covered on our protein side. But to answer your specific question, we do not believe there's a big structural advantage or disadvantage of ultra-filtered milk versus milk protein concentrate. They may not move exactly in lockstep, but we think over time they should.
Operator
Thank you very much. I'll pass it on. Our next question comes from Peter Grom with UBS.
Good morning, everyone. So, I kind of wanted to come back to the long-term targets. And several months ago, you outlined expectations for 7% to 9% on the top line, adjusted even down margins of 18% to 20%. Obviously, this year, it's far more challenged. But I guess based on what you've seen over the last several months, do you still view those as realistic targets? And if so, what is a reasonable timeline that we should expect to get back to those levels of growth or profitability?
So as a reminder, we reassess our long-term algorithm and outlook in November, and we'll plan to do the same thing this year. But I'm definitely acknowledging that, I mean, the near term is challenging from competitive consumer and commodity pressures kind of all hitting at the same time. but when I step back the category is remains healthy we have the number one brand with a very strong equity and we expect to get our fair share of that category growth over time and we believe that the category will be growing at those, you know, at those kind of levels. So I think, you know, I talked about this, you know, to Andrew's question is that, you know, in the long term, we expect the scaled players with mainstream appeal, high repeats to be the winners, and retailers to consolidate the shelf space behind the best performing brands. And Premier will definitely be one of those brands. So I think it will take we're in the middle you know in the near term and we need to get through some of these macro forces and we will continue to grow out of it and get back to that that the long-term estimate great thank you so much our next question comes from Matt Smith with Stiefel hi good morning thank you Paul you called out flat consumption for premier in the third quarter can you talk about shipment expectations in relation to the level of consumption.
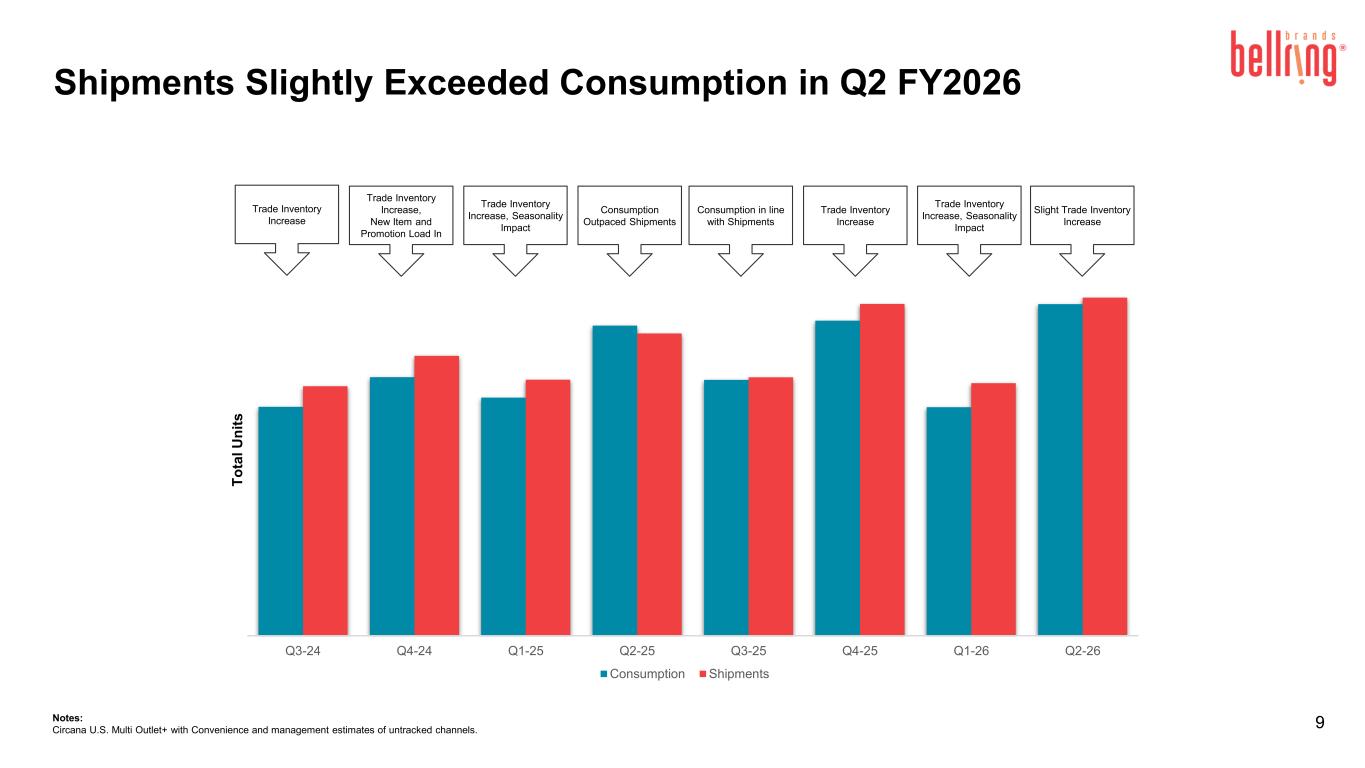
It looks like prior year consumption was roughly in line with shipments, but does the upcoming launch of two new products or the resumption of the MAS program in the fourth quarter, does that benefit shipments in the third quarter, or is that kind of contained as we get into the fourth quarter? Thank you.
Yeah, so most of the new product innovation shipments will occur in the fourth quarter, So we should get a little bit of a bump from that in the fourth quarter. So I would expect that shipments would be slightly ahead of consumption in the fourth quarter. And then in the third quarter, we would expect consumption growth on a dollar basis to be slightly above our shipment dollar growth. Nothing of major consequence there, just some minor rebalancing, you know, from some of the shipments we had in the first half. So then that's slightly below consumption in Q3, and I would expect to be slightly above in Q4.
Thank you. I'll pass it on.
Operator
Our next question comes from Steve Powers with Deutsche Bank.
Hey, great. Thank you. Good morning. I just want to clarify a little bit more on the current environment. I think what's going on is pretty clear from your remarks. Thank you for that. But I'm a little uncertain as to when it started. So, I mean, are these dynamics that, you know, you saw earlier in the quarter and they were evident when you reported the first quarter and it just didn't dissipate the way you expected? Or are these dynamics that evolved more late in the quarter and that you expect to continue? And if there's any clarity around where, is the incremental challenge concentrated still in club or has it now spread to those non-club channels that that would be helpful if i could while i'm at it um paul just as we net out the the pricing power and inflation commentary i guess when you net it all together and you think about the next 12 months um like what what percentage of of inflation that's building are do you think you're realistically able to price for you know if there's a hundred dollars of incremental inflation is it realistic that not a promotional environment you can price for a majority of that, or should we recalibrate our expectations, at least in the near term, that your kind of pricing power, so to speak, will be constrained by the competitive dynamics?
Yeah, so I'll start, and then I'll pass it to you. Yeah, so, okay, the new information that we had since our February guidance I think is important to hit. so the first of all we only had a few weeks of consumption data heading into our February call our largest club promotion hadn't occurred that occurred in March and then many weeks of the mass promotion was still ahead of us so that is really around kind of the consumption and the mix that we that we ended up seeing. From a cost perspective, you know, obviously none of us predicted the Iran War, which affected, you know, oil in our freight costs. And then protein costs have accelerated late in the quarter, specifically late in March, but really in April. And then the last thing is just this, you know, unanticipated inventory charge was discovered in late March so you know we recognize this is super dynamic and we recognize that this is a significant change but a lot of things have changed and so appreciate the question because and going through each one of those as far as your question around where we're seeing you know price the increased consumer price sensitivity is happening across channels. However, it is the most acute in clubs. And that is where we're seeing the highest promo lifts and the pressured baselines. And that's also where we're seeing, you know, the most competitive intensity. So, and obviously inflation is across the board.
Just adding on to that, you know, really it was a lot of that competitive intensity, which affects our baselines, really started occurring in the February and March timeframe. So kind of back to your question on timing, a lot of that occurred, you know, after our guidance. As far as your question around pricing, power, and our ability to pass cost increases through, I mean, historically, we have been able to do that. I don't expect that the current environment, you're right, is more competitive. So it will be something we'll have to think through and assess if, you know, if that affects how we want to pass through costs. But our current thinking is that we should be able to pass it through. We've seen competitors in our space that have taken fairly sizable increases recently as well. And so obviously that gives us another data point that we can look at to see. But overall, we would expect to continue to be able to pass through commodity costs.
Operator
Our next question comes from Yasmeen Deswandi with Bank of America.
Hey, guys. Morning. Thank you for the question. I just wanted to dig into the competitive landscape a little bit. I was just wondering if you could talk a little bit about the challenges that you're facing competing against the insurgent brands versus the legacy brands and if those challenges are the same or if they require different strategies. I guess I'm wondering, you know, when things moderate with, you know, when competitive intensity moderates from the insurgents, how are you planning to competitively or effectively compete against, you know, the legacy brands once the insurgents kind of moderate? Thank you.
So let me just kind of lay out the competitive set.
I've talked about this before, but I think it's helpful.
So about 50% of the category are kind of the leading brands, which includes Premier. About 30, 25 to 30% of the category is kind of what you described and what we described as legacy brands. and then about 10% are these kind of new insurgents and the remainder are you know our kind of private label as well as you know kind of branches growing with the category so if you you know for years the legacy brands have been donor brands and you see you've seen them decrease in market share the the larger brands have mostly grown with the category and the insurgent brands there is a there's a lot of they make a lot of noise and but they they they shake out meaning that the group of insurgent brands that we saw a year ago are different than the ones we see now. A couple of them are doing well and we will you know see them I think they will make it but there will be a lot of churn in that in that group. So I think that you know we will consider and the 30% of I think this is often overlooked because the insurgent brands make a lot of splash, there's a lot of splashiness. They're new but I think that it is, it's important to note that the legacy brands, we think they will continue to, you know, be donor brands in essence and we will continue to source volume from them. So that is, that's ongoing I think as we what's interesting about looking at some of the insurgent brands is you know it's innovation so meaning that we're seeing them bring in new consumers so which is good for the category and I think that that is an area that we are closely monitoring to see if if we should you launch innovation in those specific kind of product categories. So what we're seeing is, whereas the category used to be much more nutrition-led, nutrition focused, I think some of these insurgent brands are more beverage focused and therefore bringing in new consumers and new occasions. So we you know we monitor it and to see if it's something that we would want to put in our pipeline so when you talk about how do we compete we are you know continuing to we have a built-in customer base that is highly loyal and we will feed that but we also bring in new consumers around this kind of nutrition first and type of proposition but then through innovation we will compete in some of the areas that we think are incremental and interesting our next question
comes from jim solera with stevens good morning thanks for taking our question so i wanted to get a little more detail on the innovation and how we should think about that contributing on a go forward first of all are those innovation launches going to have similar unit economics to the core shake lineup and as we think about their presence on shelf is there going to be some swapping of lower term and core SKUs, or do you expect the innovation to be largely incremental to what you have on shelf right now?
I'll hit the incremental on shelf, and then Paul, pass it to you for the unit economics. I'll tell you what we're seeing so far is that they're incremental on the shelf. So they are not only, I mean, actually connected to the last question that I answered. They are incremental to our business and so we obviously communicate that to our retailers and we are getting them incremental on the shelf. And then do you want to talk about unit economics, Paul?
I mean, so, you know, it varies by various innovation.
Some are at par to higher from a unit economic perspective, and some are smaller or lower, you know, from a margin perspective in particular.
And keep in mind, I mean, obviously our 30-gram shake business has got a large scale to it where a lot of these other ones are smaller, so we would expect them to be lower margin at the beginning, but they should, as they grow, you know, the margin will improve over time you know just one other thing you know I talked about at our 42 gram item that we're launching as well as sparkling these are really different different propositions so if you think of the 42 gram line that that has been a void in our in our business in our portfolio and it is it's important when it comes to singles and specifically the convenience channel So I think that we needed that to really, you know, effectively play there. So that's one piece. I'm also important to kind of our single display strategy and getting new households. So that's one piece. And sparkling is a really exciting, every time we do more research on it, we get more excited about this this incremental kind of demand at what we call pallet but it's this really demand occasion because if you think of most of the category is really around a breakfast meal replacement this is for an afternoon refreshing time and you're seeing a lot of activity from small players but we're going to be the first kind of scaled player that's competing here and the product fantastic our next
question comes from john anderson with william blair good morning thanks for the question um darcy you mentioned um how things have evolved in the category where you know we've gone from a industry capacity shortage to it sounds like um uh more in industry capacity whether there's surplus you know i don't know but i i guess my question around is centered around capacity because it does seem to be driving the ability of perhaps these insurgents to play like in-club and also to the category overall to engage in more promotion. Do you give us kind of your perspective on where the industry or the category sits in terms of capacity? And the reason I ask is I'm kind of curious, you know, if what you're seeing in-club in terms of heightened promotion could begin to migrate to food, drug, and mass? Do these insurgents have the ability to scale? Is there enough capacity out there to take the competition in a bigger way beyond club?
You know, overall, I would say the capacity, it's a little bit mixed still. You know, certainly, I think on the tetra cartons, we've seen, you know, I believe there's more capacity available, so that's one. on bottles we've definitely seen some capacity added but there's also i think if you're trying to get into cans you know i think some of the the competitors i think are likely going to need to add capacity to continue to scale obviously um you know there's some there's some of our other competitors who are expanding facilities as well so so i think it's still mixed there's definitely more it's more in balance than it was before so i would say again i don't know if it's excess but there's definitely more in the tetra side than there was, and then bottles has been added over time. So that has obviously given some additional capacity out there available. But as we've talked about, it's one thing to get market share of three or four percentage points. It's a whole other one to get to the size and scale of our business. It just takes time. We've seen it. We've gone through two waves of extensive capacity additions to get to where we are now.
So it just takes time. so can they you know is there more available capacity absolutely than there was before um but you know they still have to scale to a sizable business there's going to be more capacity added for those brands to continue to grow and just just on that you know capacity is is definitely going to be you know a challenge i think for many of these kind of insurgent brands but just the cost that cost increases I mean the things that we're facing is not unique to us and I think that those they're highly reliant right now on value and they're highly reliant on promotion I think the the some of the insurgent brands are promoting at 60% of the time and so I think that with that is very expensive and when some of these some of the inflation becomes more meaningful toward the end of the year you know in the back half um that's going to have a big impact on those on those businesses thank you our next question comes from thomas palmer with jp morgan uh good morning
and thanks for the question i i did want to ask maybe on on some of those promotional plans you mentioned uh for 4q um one you you did have some other promotions running in the club channel and and just want to confirm are those going to be running again as we think about the fourth quarter or any any changes there and then second just the the promotion you mentioned in the mass channel how does it compare to what what ran um earlier this year in terms of the duration of it And then maybe how broad-based it might be across the category, because I think last time we did see some other brands participating, even if maybe you guys were more prominent.
Yeah, the promotional schedule in Q4 will be similar to Q2. So we have – that is when we have our two club promotions, and then we will also have the mass promotion which will which will mirror you know similarly to what we did in in q2 okay and any any color on kind of how broad-based it'll be with others um we don't have visibility to that um you know my expectation is that it was good for their category and so my expectation is it it will be it will be similar i mean maybe a little less um just because if you think of jan you know, the Jan-Feb-March timeframe, it is the time in the calendar in the year when the most new households enter into this category because of New Year, New You. So there's a lot of attention for the category in all retail. So, you You know, I think if you – the next big timeframe is that RQ4, so it might be a little bit less, but again, we don't necessarily have visibility. We just have visibility to what we're doing.
Operator
Our next question comes from John Baumgartner with Mizuho Securities.
Good morning. Thanks for the question. um darcy i wanted to revisit your comments on innovation between nutrition credentials and even surgeons bringing more of a beverage experience you know historically premiering the category have differentiated through protein content and flavor variety and i guess i'm hearing the strategy is offering more protein during more times of the day but you know at what point does the consumer look at the proposition as a commodity it becomes more sophisticated the demand pool goes the next level where maybe just offering high protein is no longer enough. Maybe to qualify as nutrition, you need high protein and maybe to be a true meal replacement with more vitamins, more minerals. Because I do wonder if part of this price sensitivity, yes, it's macro, but is it also a sign that consumers are longing for something more? And to wield that pricing power and defend market share, you need to redefine the category's proposition with more specialized innovation.
Yeah, I think you're seeing that. I mean, I think you're seeing, so that demand landscape that study that we did I mean it basically maps out I think it's like 10 to 15 different the demand moments kind of going from I mean what I call kind of nutrition focused with you know all the vitamins and minerals, complete nutrition, etc., all the way to more of a beverage moment, you know, like the refreshing protein. Those products and those demand moments are creating a product for a refreshing moment versus a nutrition focused moment are very different. I mean a refreshing moment you don't need vitamins and minerals just to use an example. So I think that what the you know as the category develops and matures what will happen is yes there will be more specific products, specialized, to use your word, specialized products for different demand moments. I think what is encouraging, what came through very clearly in this study was our 30 gram product does a really good job against a lot of demand moments. Not all, hence the refreshing, but it does a very good job against a lot of the demand moments, which is why it's a two billion dollar, you know, line. And so I think that, but that's, I think as the category evolves, that's what you're going to see. And I think you're already starting to see it, which is more specific, specialized products meeting a specific demand moment.
Thanks for that. And then to follow up, coming back to your comments on category buy rate, I think you stated that RTD is not losing share to other protein formats. But if buy rate for RTD is down and protein consumption is up overall, are you seeing consumers shifting out of processed protein into unprocessed, maybe more commodity products like eggs or meat? I guess, what are you seeing across the protein dynamic more broadly?
Yeah, so it was, as we looked, we dug into this, and what we saw, we didn't see a huge outflow of consumers leaving our category and, you know, RTD shakes into kind of more, protein-enhanced products that you see all over the store. And we also didn't see a decline in households entering, so into RTD shakes. So we're still seeing strong household growth showing the strength of the category, but what you're seeing is, like I said in my remarks, is that for the first time in five years you're seeing a decline in buy rate and that really happened this quarter. So I think that as far as the detail of if we're seeing consumers leave to go to more whole food with our category and like eggs depending on pricing but it's not significant. It's not significant. So I would just say that the biggest change this quarter, continued households coming in, but the buy rate did decline.
Operator
Our next question comes from Robert Mosca with TD Cowan.
Hey, thank you. I want to know, in most CPG categories, the market leaders set the price and that everyone follows. Would you say that it's harder to do that today, given the influx of so many smaller players that that may or may not play along and and you said that I think Paul you said that you have seen one of your competitors take significant pricing recently is that a big player or is it a small player and and does that make a difference thanks and it's a I mean I'll answer and it's It's a big player and I think that it was just this quarter, so it's pretty recent and yeah, I mean, I think that it's one of the leaders and it's pretty
significant pricing. So I think that right now this is all pretty new in that as I talked about the changes in the category and the environment is they're pretty significant and they're pretty new so we are we're evaluating really how to respond and and I think that this is not going to be I think ultimately I think that you know most players are going to need to re-evaluate their pricing given both freight and, but more importantly, the protein increases. We're seeing it in powder, where whey protein is at historic highs, and there's been pricing across the board. We've taken pricing a couple times, but now we're starting to see it come into also milk protein.
Operator
Thank you. That concludes today's question and answer session. This concludes today's conference call. Thank you for participating. You may now disconnect.