Operator
Hello, everyone. Thank you for joining us and welcome to the Bankwell Financial Group Second Quarter 2026 Earnings Call. After today's prepared remarks, we will host a question and answer session.
Operator
If you would like to ask a question, please press star one to raise your hand to withdraw your question press star one again i will now hand the conference over to courtney sacchetti executive vice president and chief financial officer courtney please go ahead thank you good morning everyone welcome to bankwell's second quarter 2026 earnings conference call to access the call over the internet and review the presentation materials that we will reference on the call, please visit our website at investor.mybankwell.com and go to the events and presentations tab for supporting materials. Our second quarter earnings release is also available on our website. Our remarks today may contain forward-looking statements and may refer to non-GAAP financial measures. All participants should refer to our SEC filings, including those found on forms 8K, 10Q, and 10K, for a complete discussion of forward-looking statements and any factors that could cause actual results to differ from those statements. And now, I will turn the call over to Chris Grisecki, Bankwell's Chief Executive Officer.
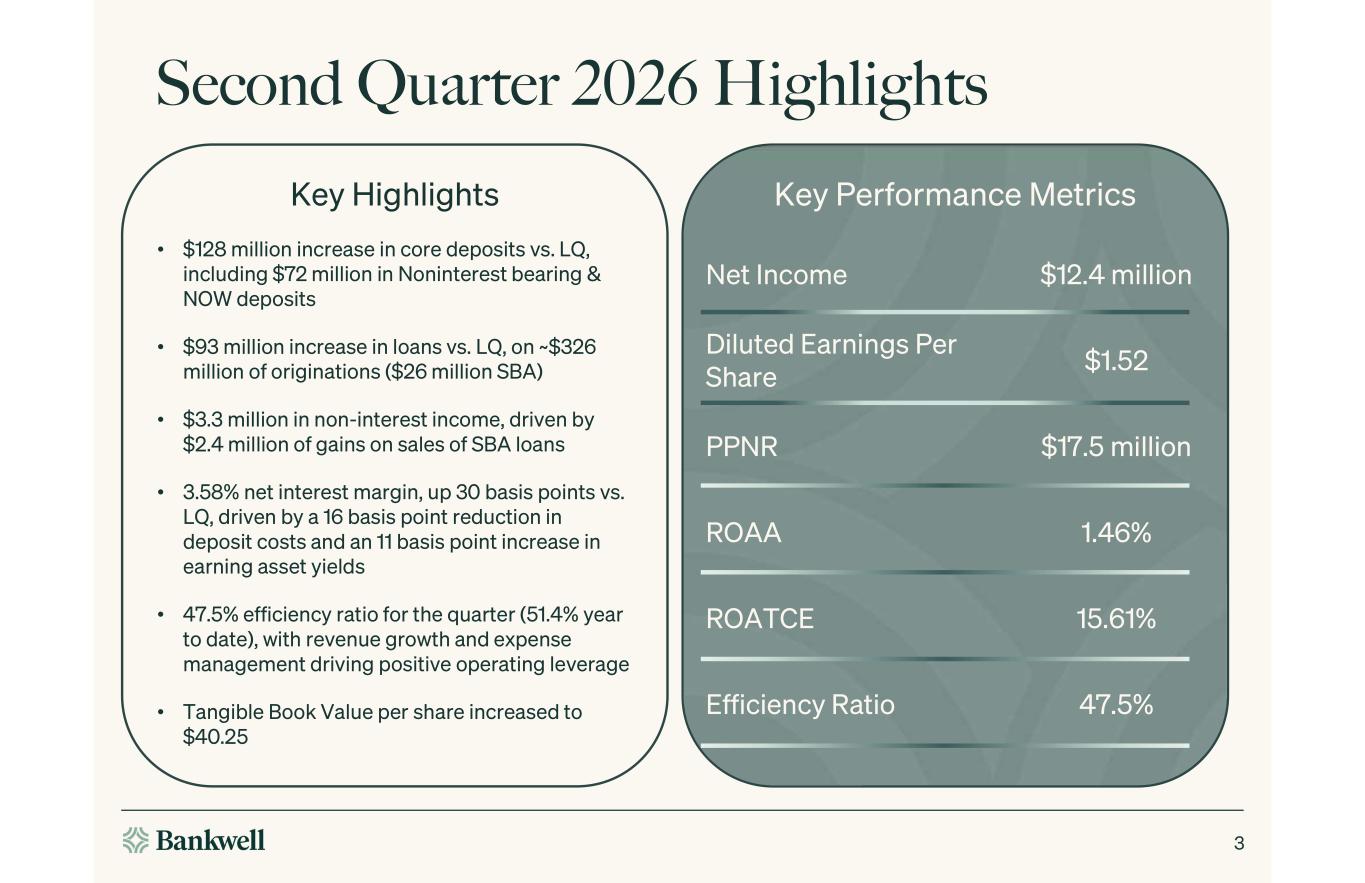
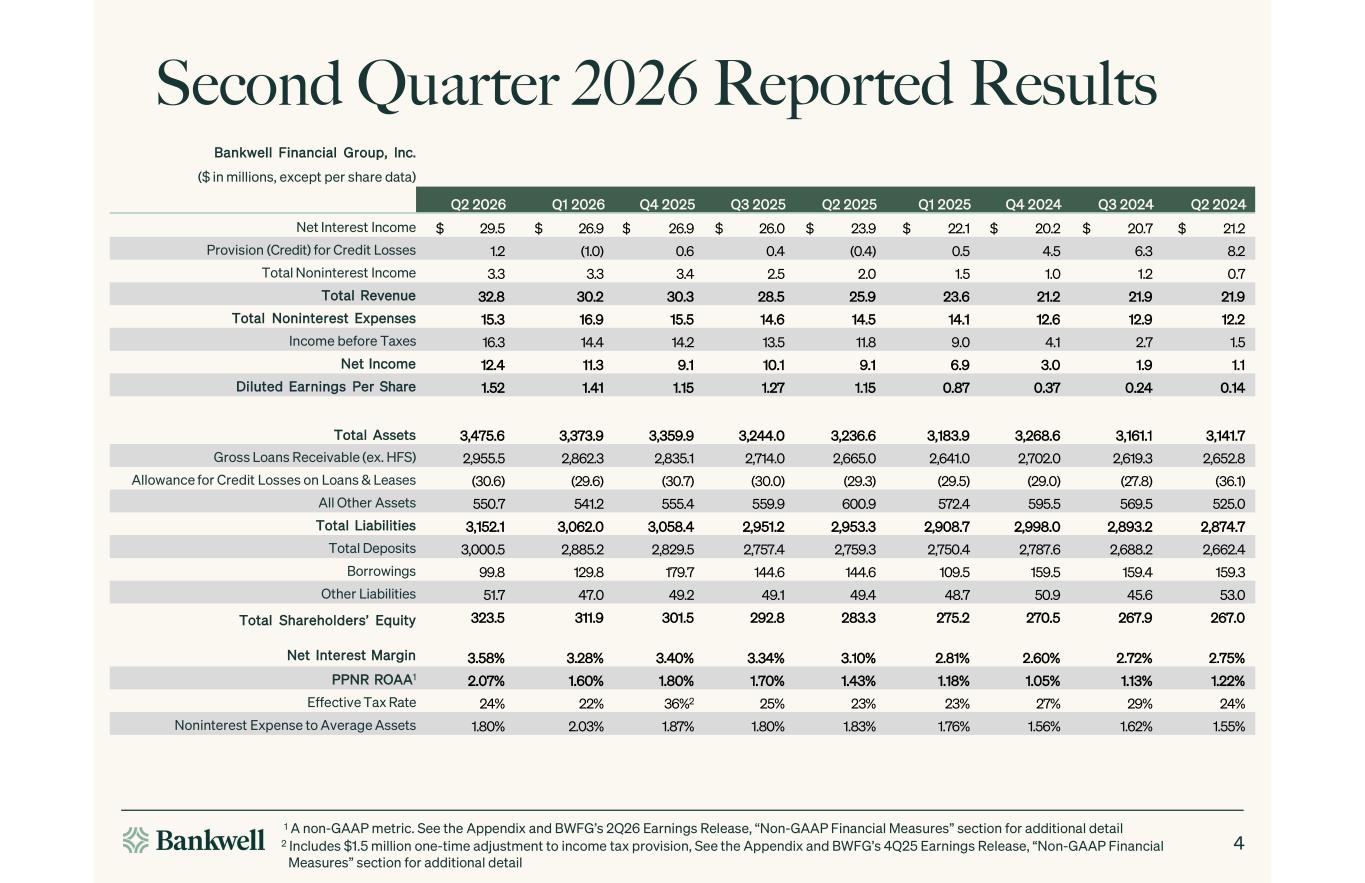
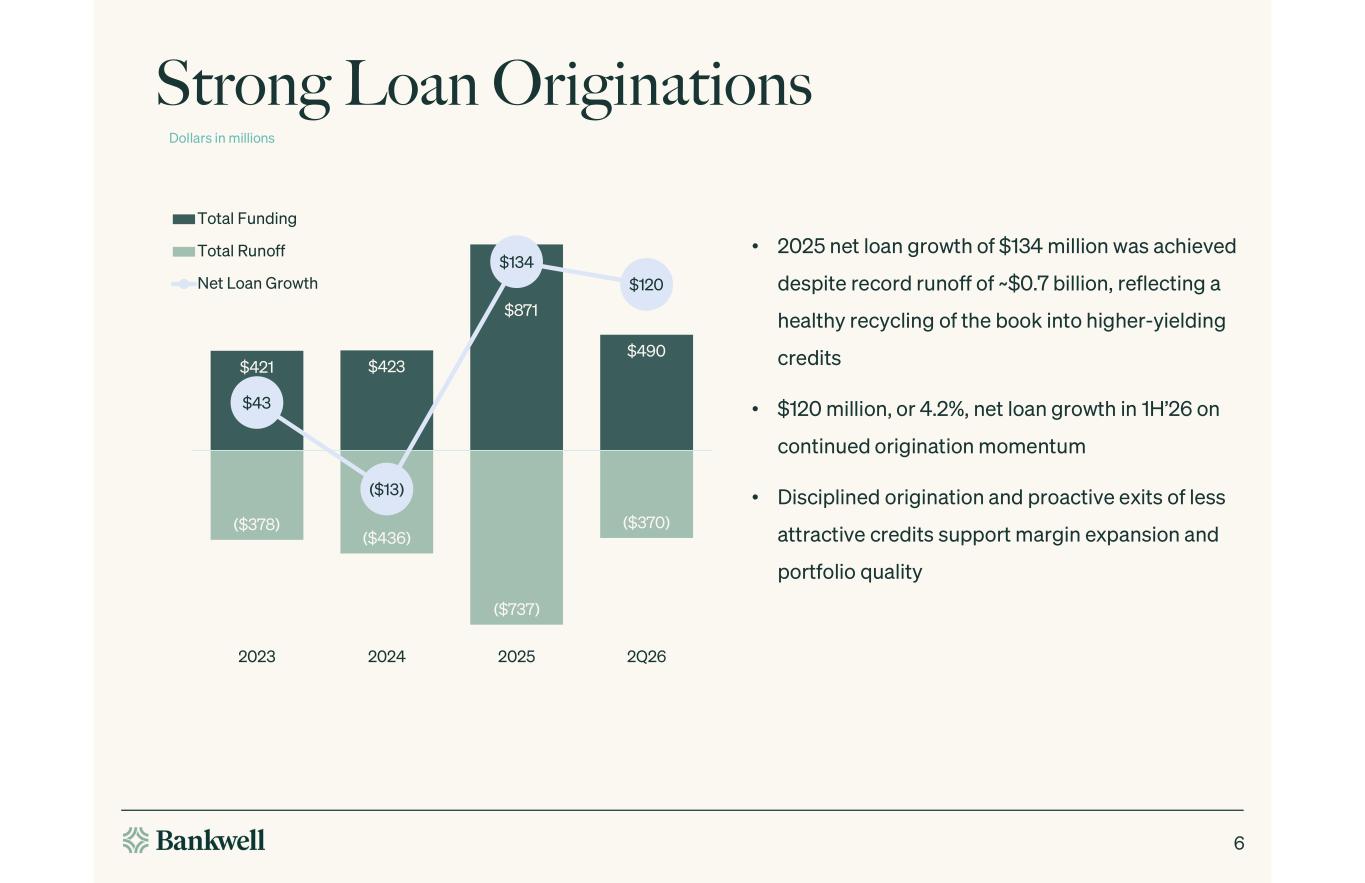
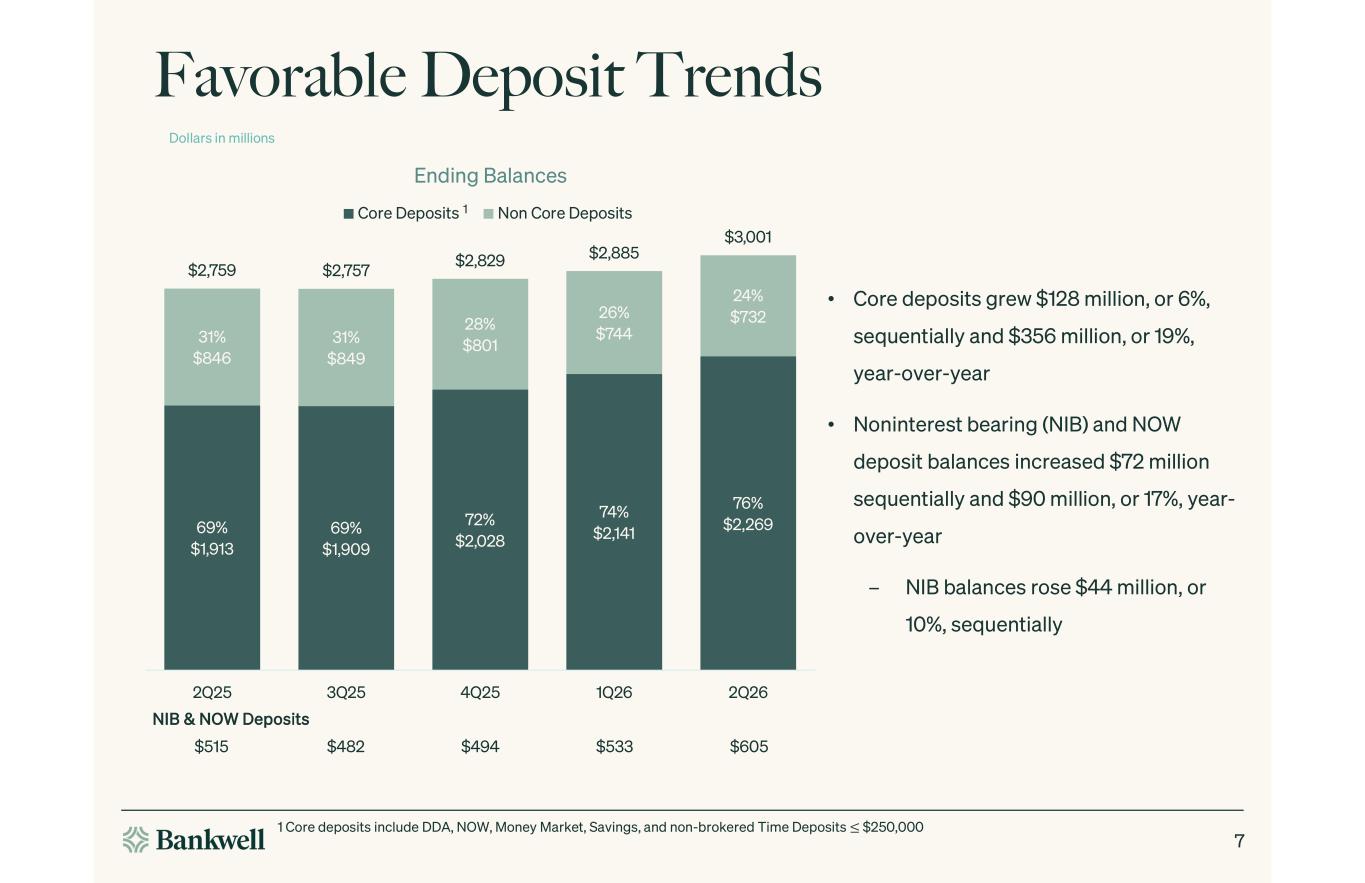
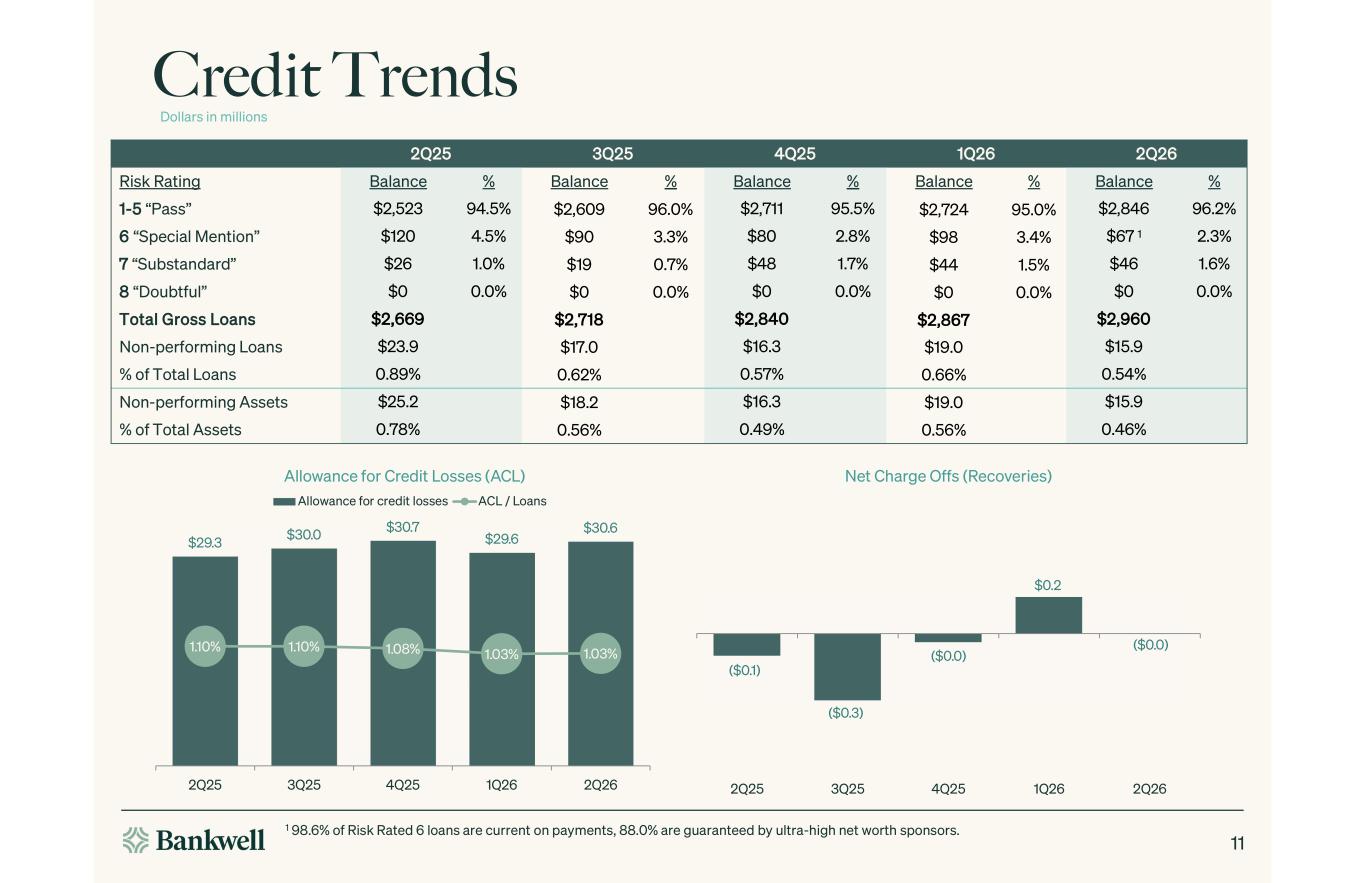
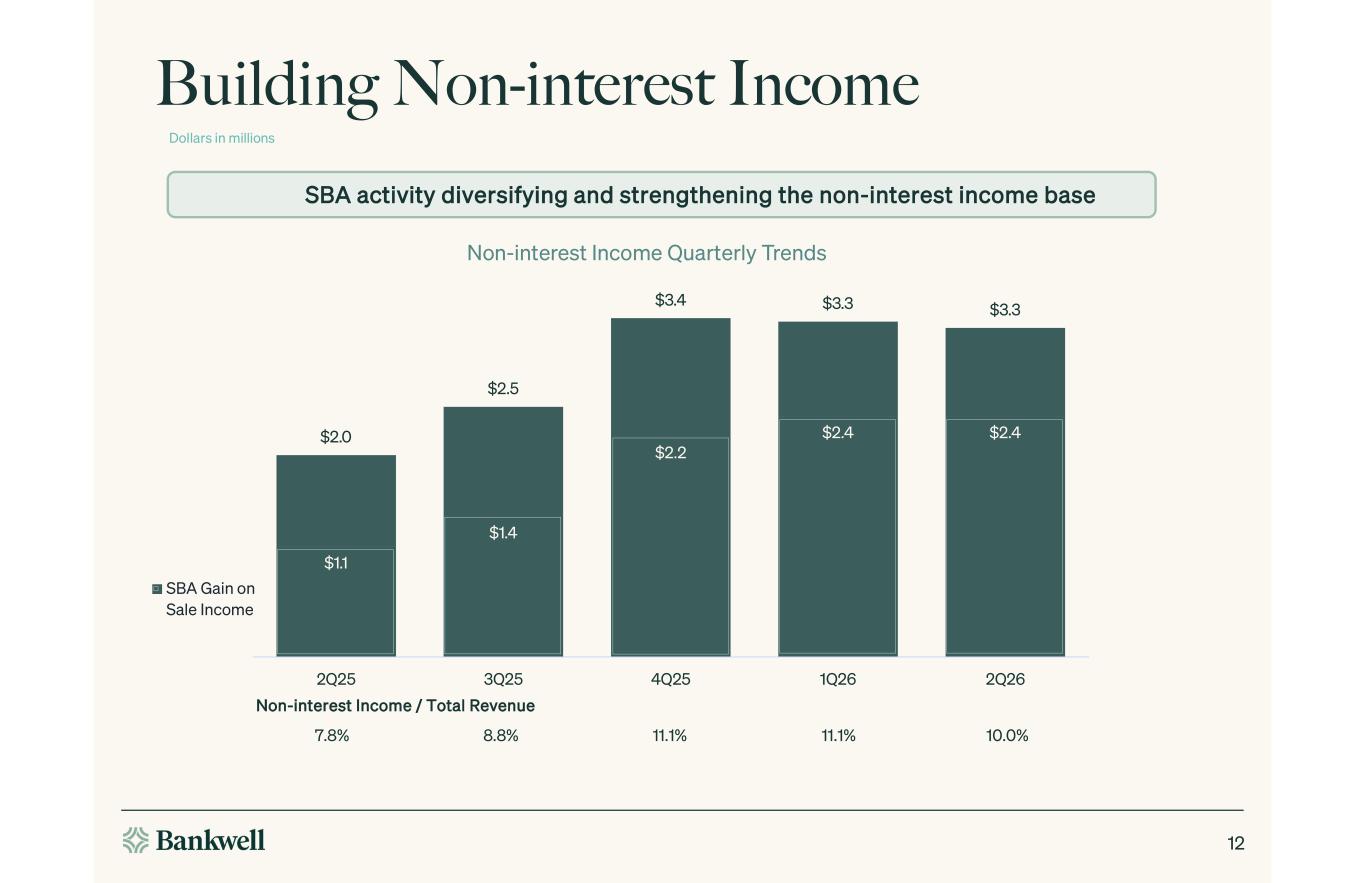
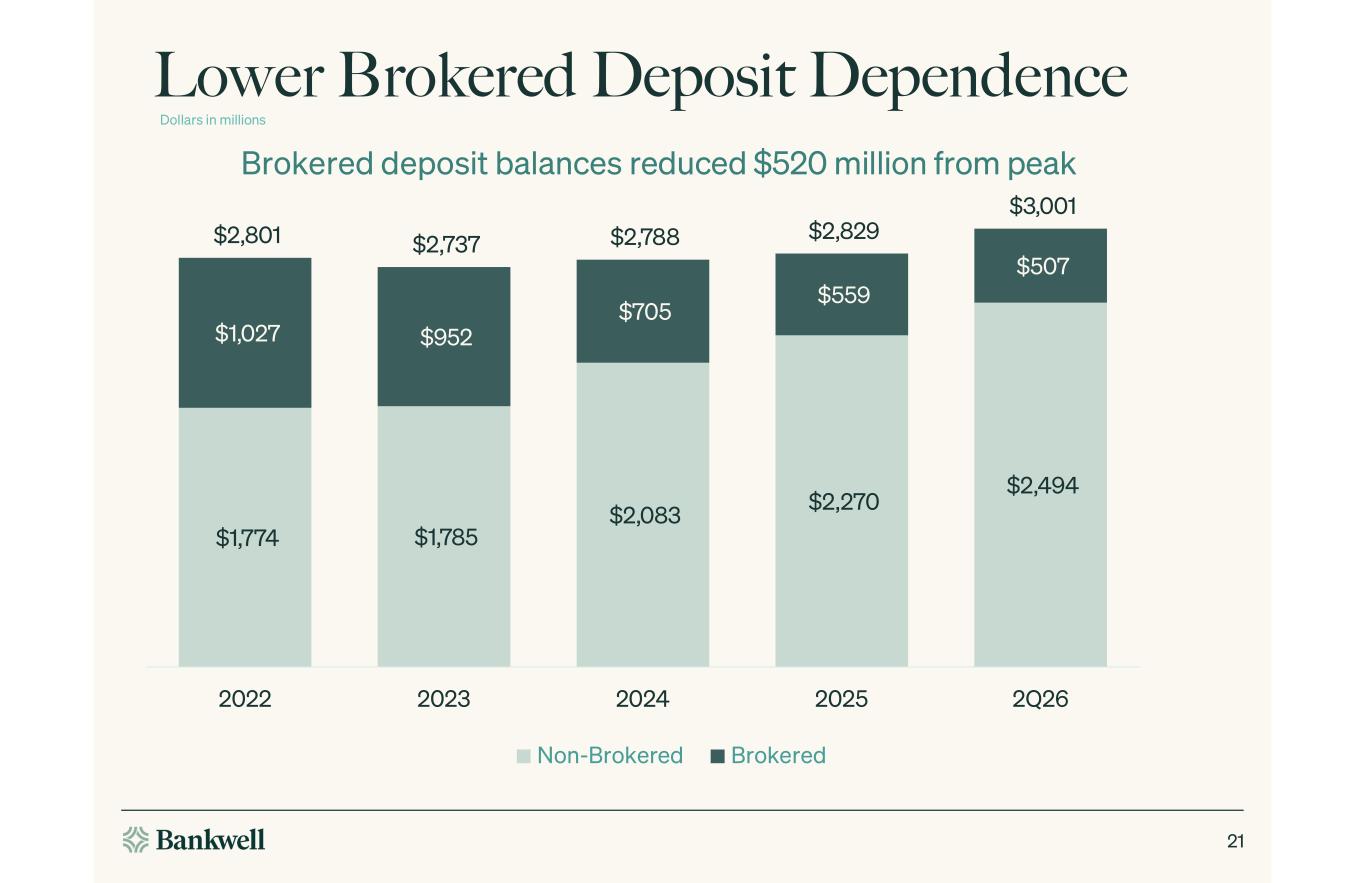
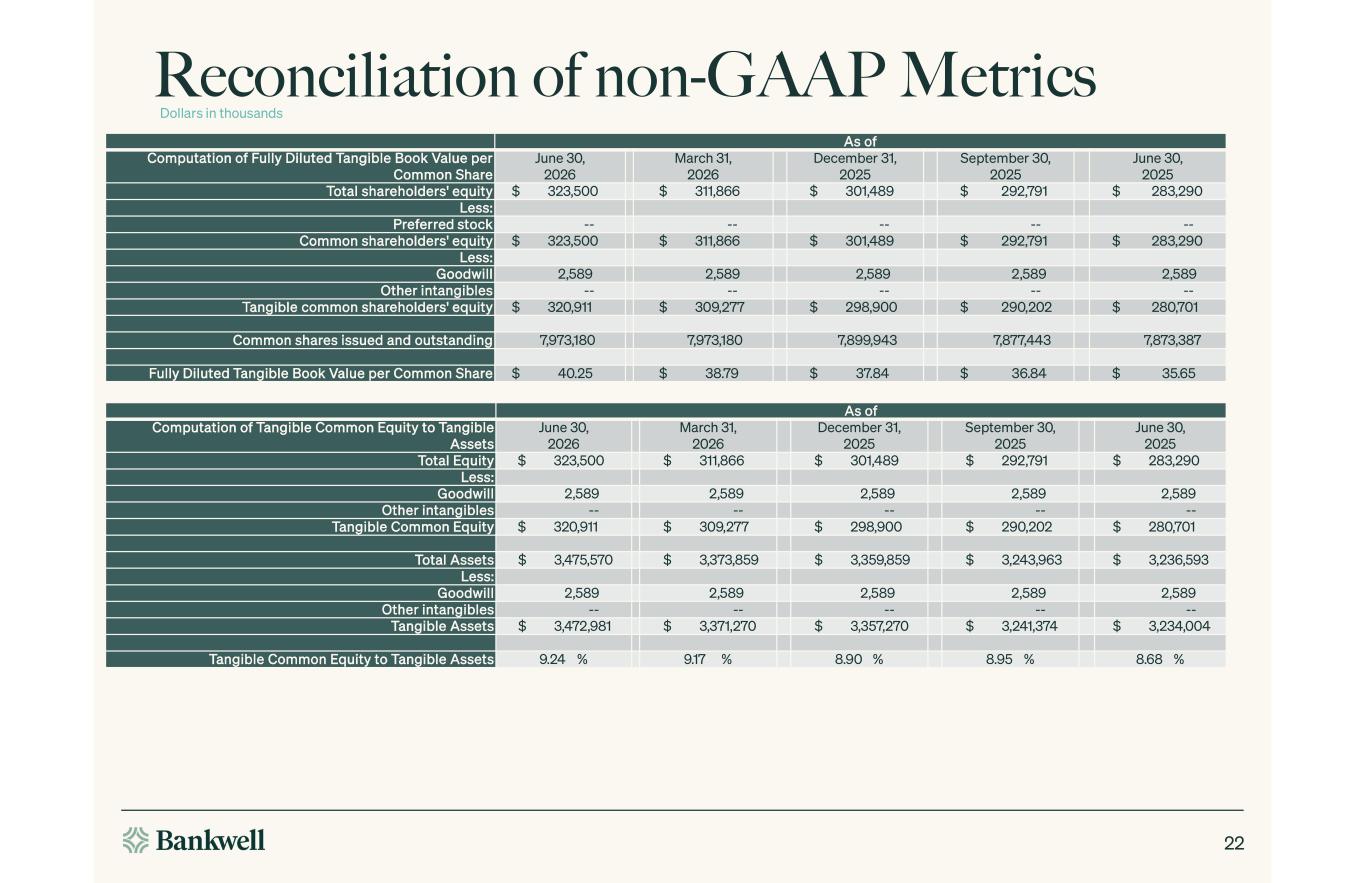
Thanks, Courtney. Welcome, and thank you to everyone for joining Bankwell's quarterly earnings call. This morning, I'm joined by Courtney Cicchetti, our CFO, and Matt McNeil, our President and Chief Banking Officer. Thank you for your continued interest in Bankwell and for the chance to share our second quarter results with you second quarter marked another period of strong execution with meaningful margin expansion robust core deposit and loan growth and continued progress on our strategic priorities including the continued success of our sba division for the second quarter we reported gap net income of 12.4 million dollars or a dollar and 52 cents per share compared to 11.3 million dollars or a dollar and 41 cents per share for Q1. Loan growth accelerated this quarter with balances growing by $93 million or by 3.2% sequentially. Gross loans stood at $3 billion a quarter end as new originations continue to outpace portfolio runoff. Core deposits increased by $128 million during the quarter. Importantly, this includes $72 million of growth in non-interest bearing and NOW accounts. Growth in non-interest-bearing deposits included approximately $44 million in increased analyzed checking balances. On a year-to-date basis, analyzed checking has grown by approximately $68 million, or roughly 17%. In addition to funding loan growth, our strong performance in growing core deposits has enabled us to reduce wholesale funding by $44 million this quarter. Since its peak at the end of 2022, we've now reduced brokered balances by $520 million, or by roughly 51%. This continued progress is a result of strong execution across the entire franchise as we continue to strengthen our funding base and deepen client relationships. Compared to the same quarter in the prior year, core deposits have grown by $356 million, or by 19%. The net interest margin was 358 basis points, an expansion of 30 basis points from the prior quarter, driven by favorable repricing dynamics on both sides of the balance sheet. Courtney will walk through those details in a couple of minutes. Non-interest income remained a meaningful contributor to our results, totaling $3.3 million for the quarter. This was led by our SBA division, which contributed $2.4 million of gain-on-sale income. For the first half of this year, SBA loan sale gains were $4.8 million compared to $1.5 million in the first half of 2025. This business remains an important and growing part of diversifying our revenue stream. Credit quality continues to improve. Total non-performing loans decreased by $3.2 million to $15.9 million and non-performing assets as a percentage of total assets declined by 10 basis points to 46 basis points. Reserve coverage of non-performing loans strengthened to approximately 193%. As stewards of our shareholders' capital, our primary focus has always been to maximize tangible book value per share while balancing the risks of running our business. We've added $2.41 to tangible book value per share in the first half of 2026 to reach $40.25 per share. I'll now turn the call back to Courtney to walk through the financial results in more detail.
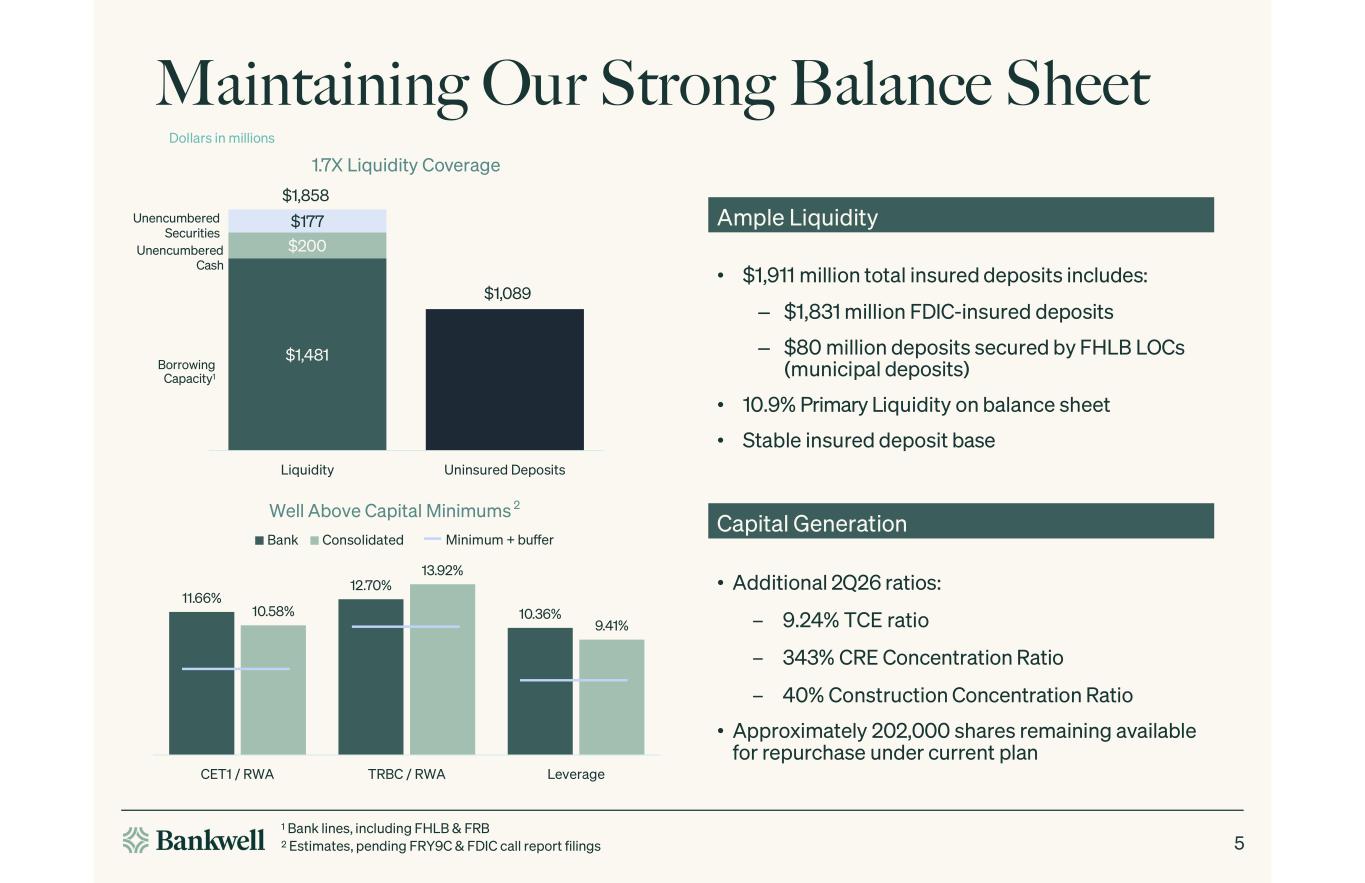
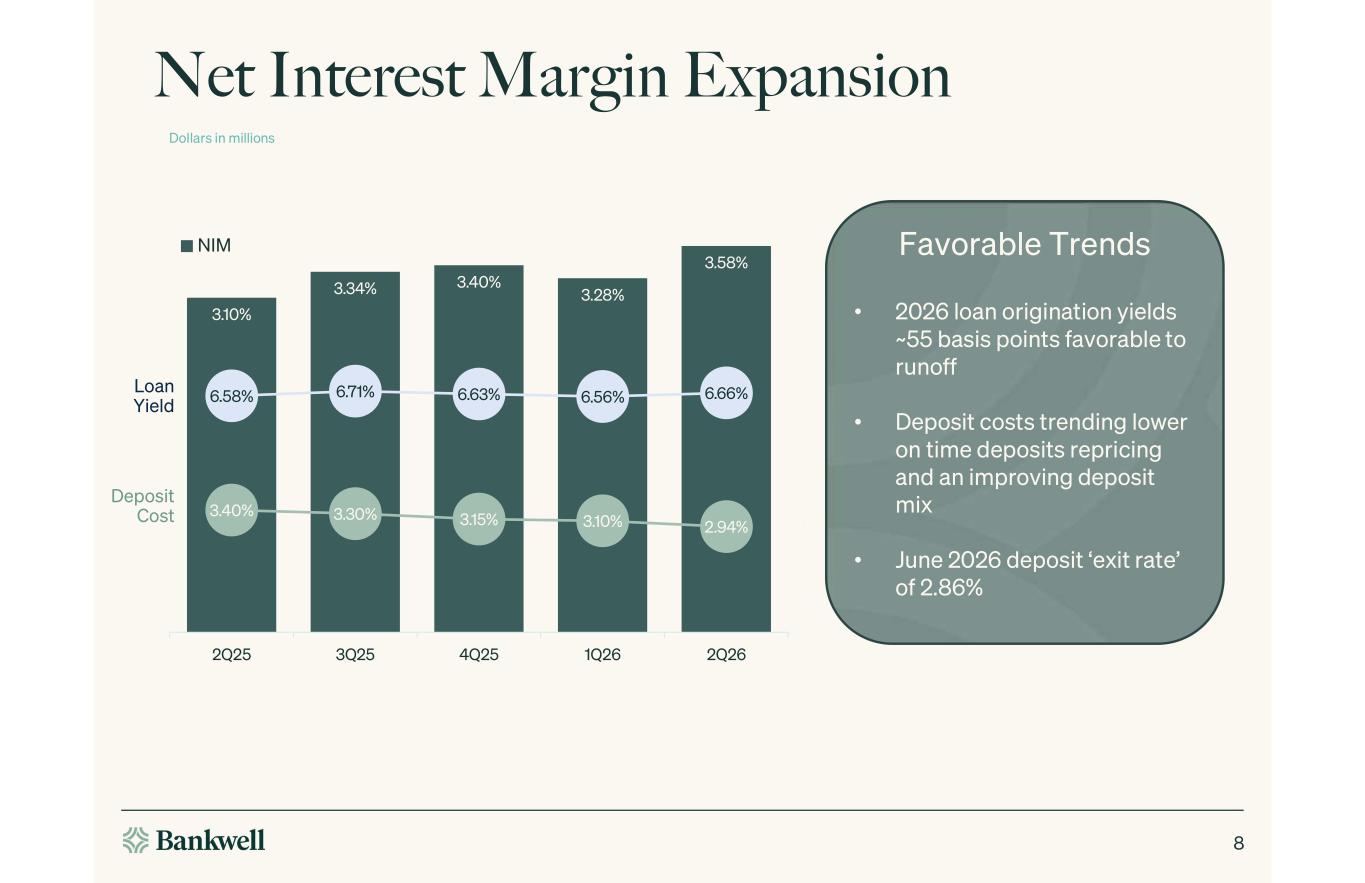
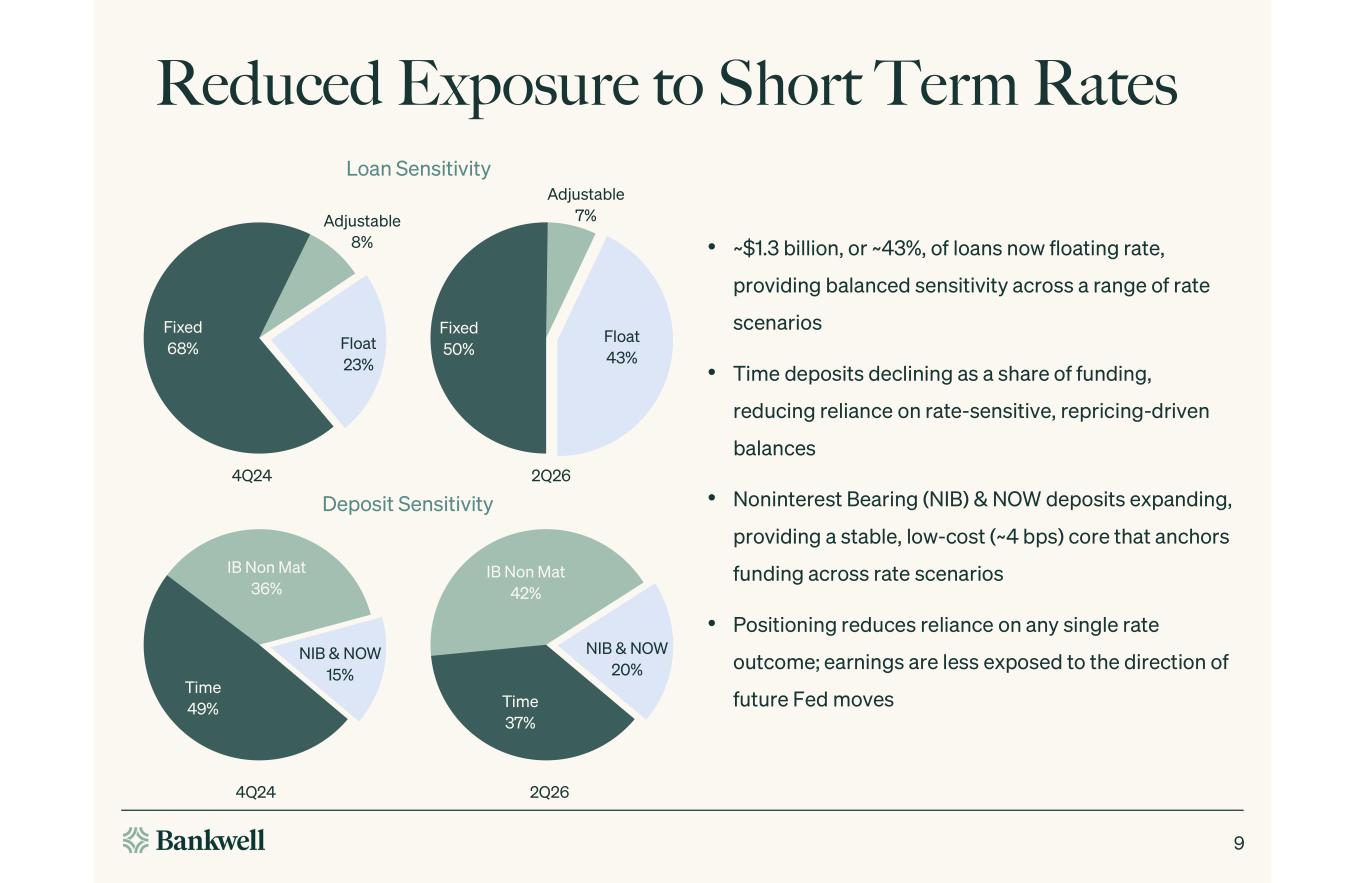
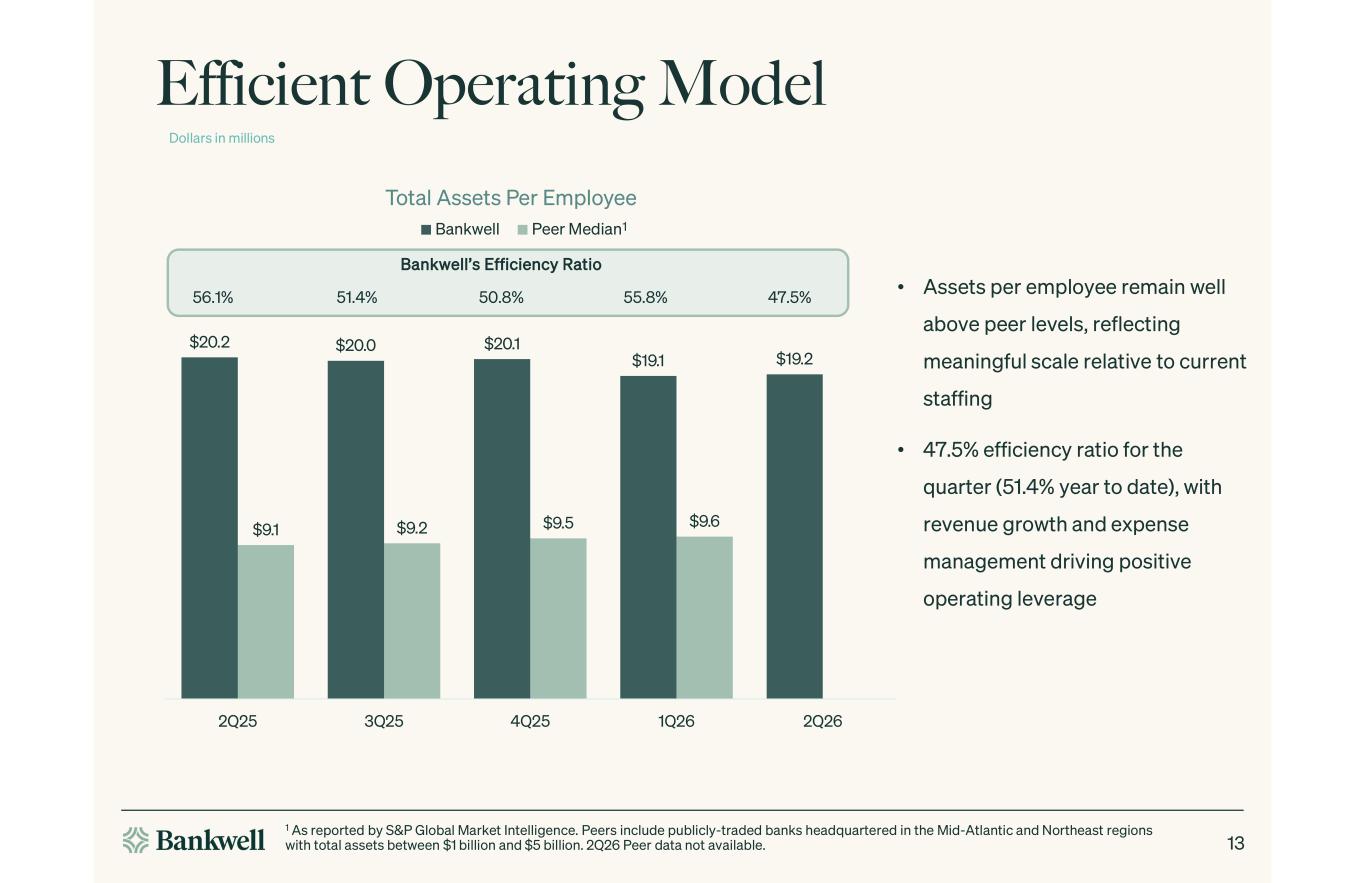
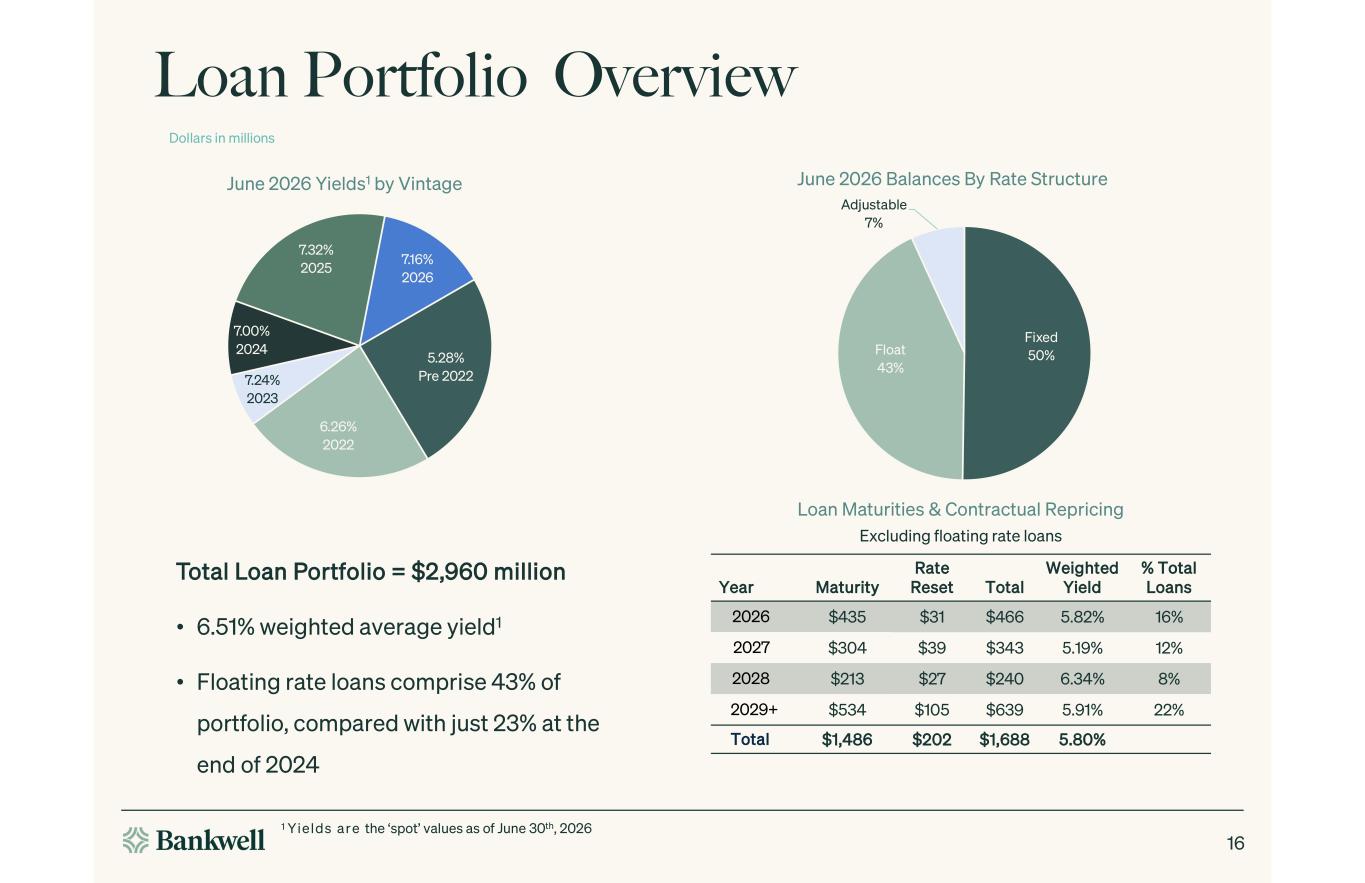
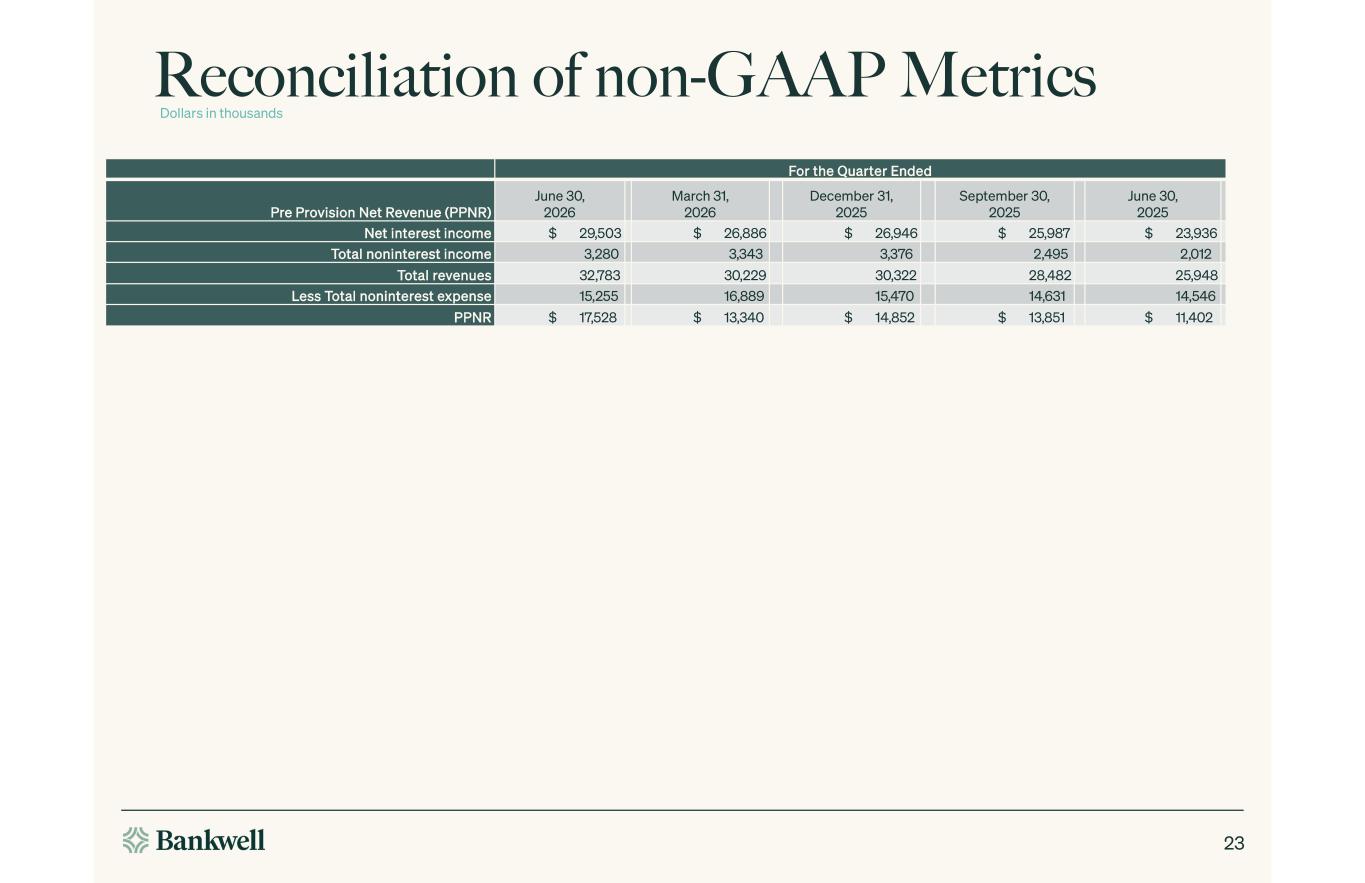
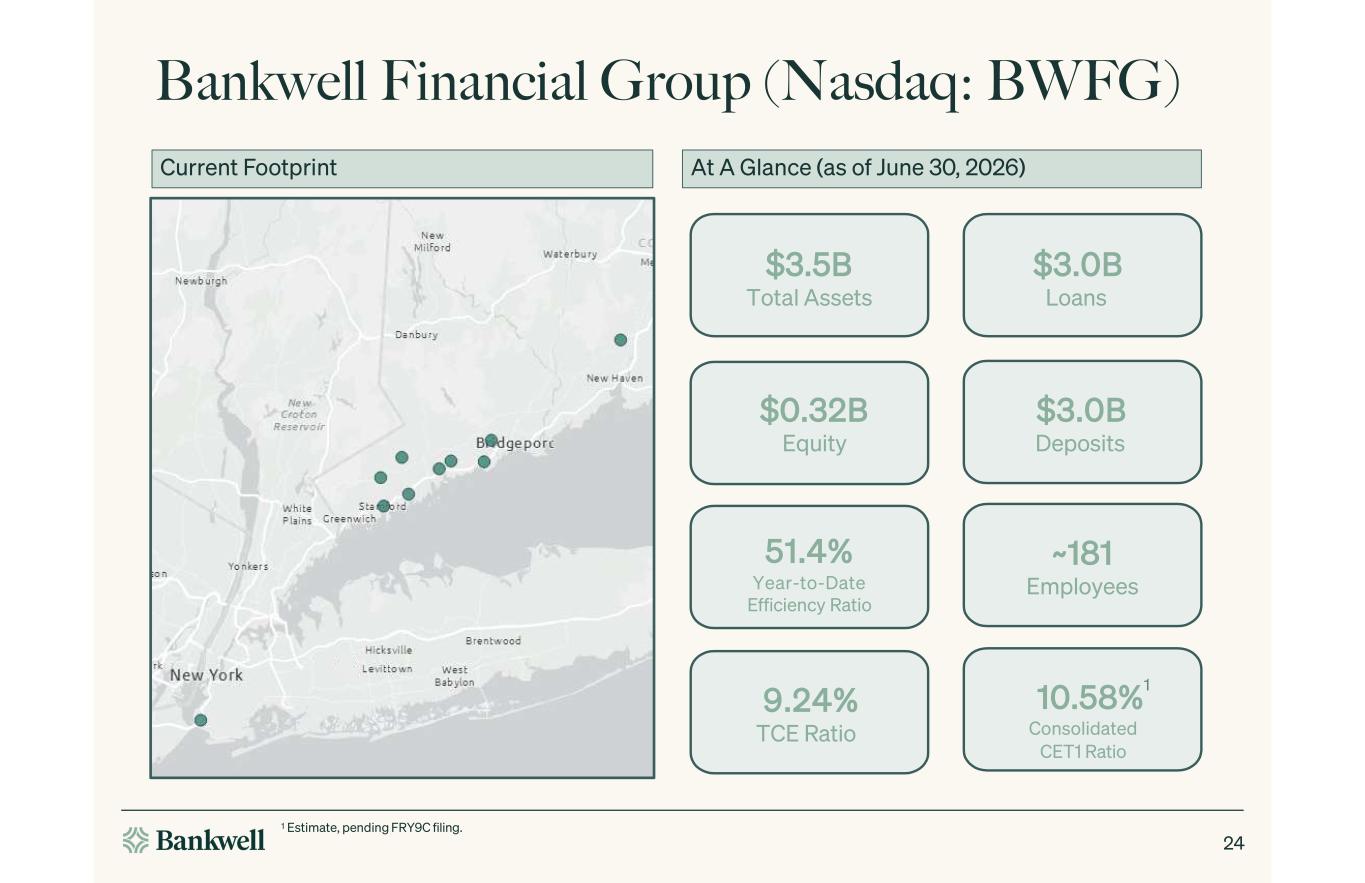
Thanks, Chris. Profitability for the quarter was outstanding. Return on average assets was 1.46% and return on average tangible common equity was 15.61%. Pre-provision net revenue rose 31.4% to $17.5 million or 2.07% of average assets. up from $13.3 million last quarter, driven by higher net interest income and improved efficiency. Net interest income totaled $29.5 million, up from $26.9 million in the prior quarter. Net interest margin expanded 30 basis points to 3.58%, driven by favorable repricing. Deposit cost improved 16 basis points to 2.94%, while our earning asset yields rose 11 basis points to 6.26%, as new loan production at an average rate of 7.16% continued to outpace runoff. Non-interest income totaled $3.3 million for the quarter, including $2.4 million of gains on SBA loan sales. Non-interest expense fell to $15.3 million from $16.9 million, primarily on lower salaries and benefits, as the first quarter carried seasonal compensation costs. Operating leverage continued to build, as evidenced by this quarter's 47.5 percent efficiency ratio, bringing the year-to-date ratio to 51.4 percent. Provision for credit losses was $1.2 million driven by loan growth. The allowance ended the quarter at 1.03 percent of total loans, with non-performing loan coverage of approximately 193 percent. The balance sheet remained strong. Total assets ended the quarter at $3.5 billion dollars and deposits at three billion dollars shareholders equity grew to three hundred and twenty three point five million dollars and as Chris commented our fully diluted tangible book value per share rose to forty dollars and twenty five cents both the bank and the holding company remain well capitalized with the bank's total capital ratio of twelve point seven percent common equity tier one ratio of eleven point six six percent and a leverage ratio of ten point three Finally, we repriced $0.6 billion of time deposits in the first half of the year at a 36 basis point improvement, representing an annualized benefit of $2.3 million. Looking ahead, that benefit will diminish as much of our higher cost time deposits have already been repriced and the remaining maturities carry rates closer to current market levels. As that benefit moderates, we are increasingly positioned towards a more rate neutral balance sheet. Approximately 43% or $1.3 billion of our loans are now floating rate, nearly double the 23% we carried at the end of 2024. This increase in floating rate assets provides a more balanced sensitivity across a range of rate scenarios. In the immediate term, we're modestly asset sensitive. Roughly $1.6 billion of loans in cash repriced right away, while $250 million of Fed Funds index deposits move with them. Over the following 12 months, that gap narrows towards neutral as $1.1 billion of time deposits mature and reprice and our core non-maturity deposits gradually adjust. That's the financial picture for the quarter. I'll turn it back to Chris for closing remarks.
Thanks, Courtney. Our second quarter results demonstrate the earnings power of the franchise we've been building deliberately over time. In our investor presentation for Q3 of 2024, we laid out plans to invest in our deposit franchise, pay down wholesale funding, increase non-interest income, and grow our consolidated Tier 1 capital ratio. We committed to invest in the people and technologies necessary for the company's ongoing success and to do so in a manner which would increase our operating leverage. Halfway through 2026, we're excited to have seen so many of our aspirations realized given our first half performance and the momentum we're carrying into the second half of the year we're pleased to increase our full year guidance across several measures we now expect loan growth of five to seven percent and we are raising our full year net interest income outlook to a range of 115 to 117 million dollars we affirm our previous full year guidance of 12 to 13 million dollars for non-interest income given our momentum this year we are making targeted investments in talent and infrastructure to support continued growth and to compensate appropriately our teams for the strong performance they've delivered accordingly we're raising our full year non-interest expense guide to 65 to 67 million dollars With our updated revenue guidance, we expect no negative impact to our efficiency ratio from our increased expense guide. None of the progress we've achieved can happen without the people behind it. I especially want to recognize our team whose dedication and efforts are what turn our strategy into results, our customers who place their trust in us, and the shareholders who share our long-term vision. We're grateful to all of you and remain focused on delivering pure leading results in the quarters to come. Now operator, we are ready to open the line for questions.
Operator
We will now begin the question and answer session. If you would like to ask a question, please press star 1 to raise your hand. To withdraw your question, press star 1 again. We ask that you pick up your handset when asking a question to allow for optimum sound quality. If you are muted locally, please remember to unmute your device. Please stand by while we compile the Q&A roster. Your first question comes from the line of Freddie Strickland with Havdi Group. Freddie, your line is open. Please go ahead.
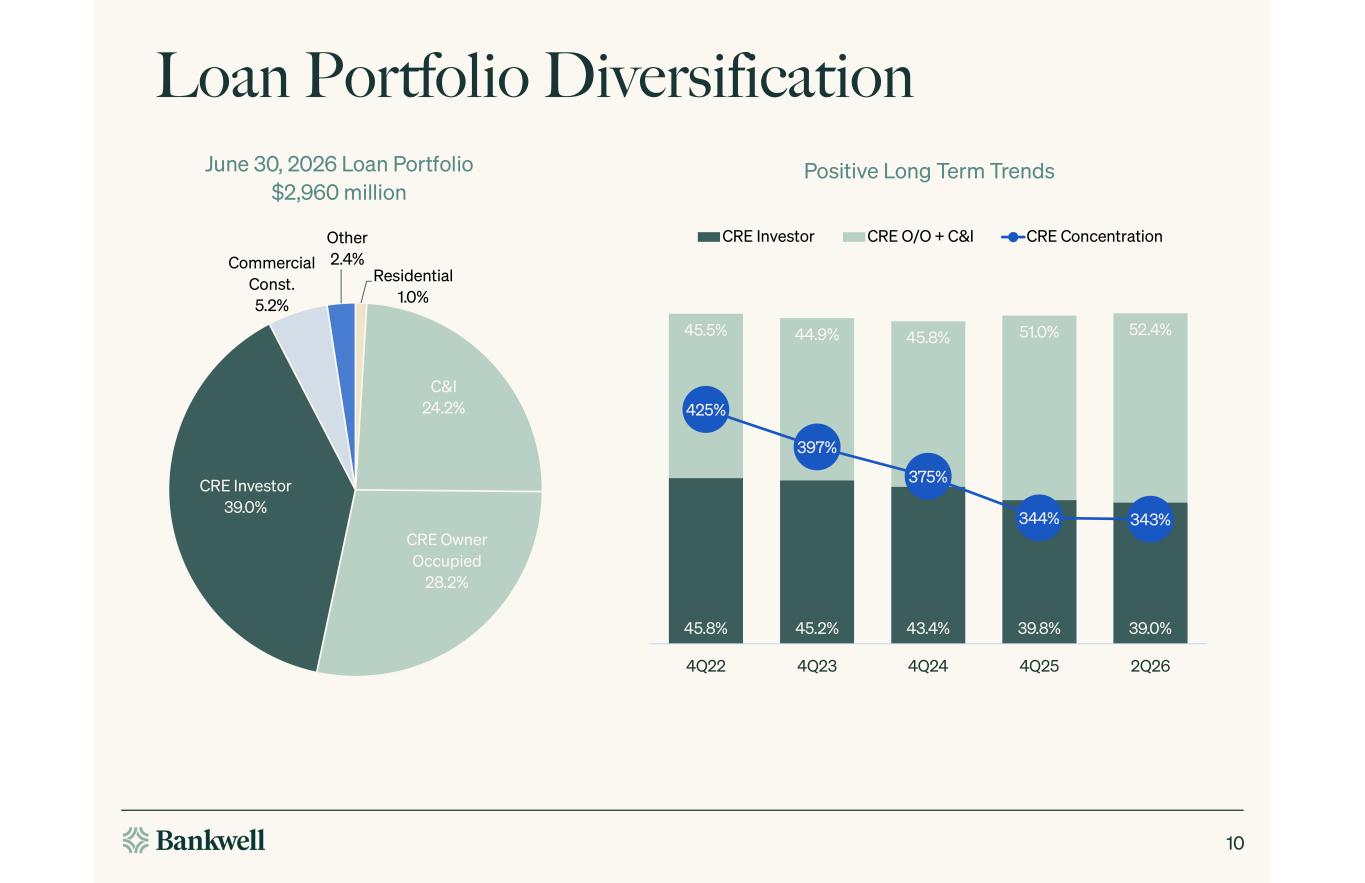
Hey, good morning, everybody. Just wanted to start off really on the loan growth here. I was just wondering if you could talk a little bit about what's changed to drive the higher loan growth, and is that future growth still predominantly C&I driven like this quarter?
Hi. Can you hand that to Matt? Really, the loan growth is a function of us, you know, raising our projections on assumptions on runoff. We had, you know, a lot of loans refinance away from us or leave the bank last year if you know impacted you know our ability to grow the loan book early in the year we we looked at those assumptions and raised them we've kept them raised through the first half of this year and that's that's really been the change just just just originating more loans to to fill the the expected runoff and is any of that you know is that driven by you know increased activity from existing customers or reaching out to new customers i guess i'm just trying to get a sense for you know maybe whether sentiment improved or anything else just as the originations increase we're very relationship driven we don't bring on large quantities of new customers focused on deepening relationships with existing customers and rinse and repeat you know asset classes so you know it's really driven by you know deepening relationships with our existing customers. That's across all that goes into Investor Cree, Z and I, all the places we originate.
So, Penny, it's more art than science. It's managing the flows. And when you have a feel for what the prepayments should be, and then we look forward the next quarter, we can prime the pump and price and speak accordingly to manage the flows.
All right, great. That's super helpful. Thank you. And switching to the other side of the balance sheet, you've made really good progress in reducing the broker funding over the past couple quarters. I think we're down to about 17% or so of deposits. How should we think about that broker number over time, over the next year or so?
Do you think you could get that sub-10 in the next 12 months, or is it just kind of too hard to tell at this point? it's not too hard to tell i think sub 10 would be that would sound aggressive i think it'll come down naturally over time um because we are you know still trying to build consolidated capital uh at the holdco uh so while we're on this kind of trajectory you know and the way it's gone the last several quarters it feels just like in organically we're we're generating more deposits than the amount of loans that we would want a book while still growing capital. So I'd expect to see it kind of drift down over time as that plays out. We don't have a target in mind.
Understood. And last quick question for me, just should we expect that a slight grind higher in the margin if the yield curve stays where it is, just getting you still got above portfolio yields and new production, and maybe it sounds like flattish deposit costs with some of the time deposits tailwind going away?
Hey, Fetty, it's Courtney. Yes, I would expect our margin to expand a little bit more into the third quarter. We still have some room left in our time deposits in the third quarter. It's really fourth quarter and beyond where we start to see, you know, the runoff kind of matching current market rates. So we do expect a margin expansion, given no other changes.
I appreciate it, Chris, Courtney, and Matt. And impressive quarter. I'll step back.
Operator
Thanks, Fetty. your next question comes from the line of mark shutley with kbw mark your line thanks good morning good morning mark hey um so i was surprised to see the expense guide move up um after expense control is really strong in the quarter um i know you talked about you know compensation drifting higher i just wondered if you could talk through um any other puts and takes there thanks Yeah, so, you know, without specifics of what comprises it, in the earnings release
we – or I think as well just now, we said that despite increasing the guide, you know, if you have numbers worked up based on our revenue guidance prior and now current, that we would not expect that to impact the efficiency ratio in a negative manner. So we're talking about – we're really talking about scale. As you have a year that's going well and doing better, we run a meritocratic incentive plan, and if people do better, we want them to get paid, so that's a good part of the increase. As well, we have been investing in technology and processes and bringing on additional people, but the scale is working for us. So, we wouldn't, I think early in the year we talked about expenses and said if we're adding expenses, it's because we're making more money and we're going to return the expense.
And Chris, I will just add to that is that our guidance from the last time we gave guidance, if you did a rough calculation of what that efficiency ratio would be, it was a range of 52.8 percent to 51.2 percent. This new guidance keeps that high end. It's exactly 52.8 and lowers the best case scenario to 50%. So it is in line with, from an efficiency ratio perspective. It actually is improved.
Okay, great. That's helpful.
Operator
And then maybe shifting over to credit, you know, MPA has improved again. I was wondering if you could update us on sort of that remaining non-performer bucket And then should we expect reserves to be, you know, relatively stable from here through the year?
Our outlook on the remaining non-performing loans is good. You know, we see some paths to, you know, reducing that number even further in the coming quarters. I'll let Courtney comment on the reserve.
We've taken the write-downs as appropriate. you know we don't really carry a lot of specific reserves specifically on our real estate portfolio so we feel it's marked um appropriately as based on the information we have okay great that's it for me thanks for taking my questions your next question comes from the line of steve moss with raymond james steve please go ahead good morning i'm maybe just starting with uh just the sba business here you know i i you know you guys didn't change your guide on non-interest income
but uh it's definitely turning strong and i really probably nitpicking a little bit but just kind of curious on any updated thoughts you have have there i'm sorry steve you broke up a little bit could you repeat that question sorry sorry about that no worries excuse me my phone today for some reason uh on the sba business here you know gains have been trending uh fairly strong i realize you guys didn't change the non-interest income guide. I'm just kind of curious here in terms of the business activity there, and maybe there's just some upside you want to see another quarter of trends before taking things up there.
We intentionally are keeping our SBA production controlled. We're still retaining a portion of non-SBA guaranteed portions of those loans. So you know, for risk management purposes, we're going slow and steady. We don't anticipate raising our origination targets there to try to keep up with the other side of the business. You know, it's really risk management. The new division, you know, we've only been after it for about two and a half years, although we've been originating SBA for more than 10. This new division is just two and a half years old.
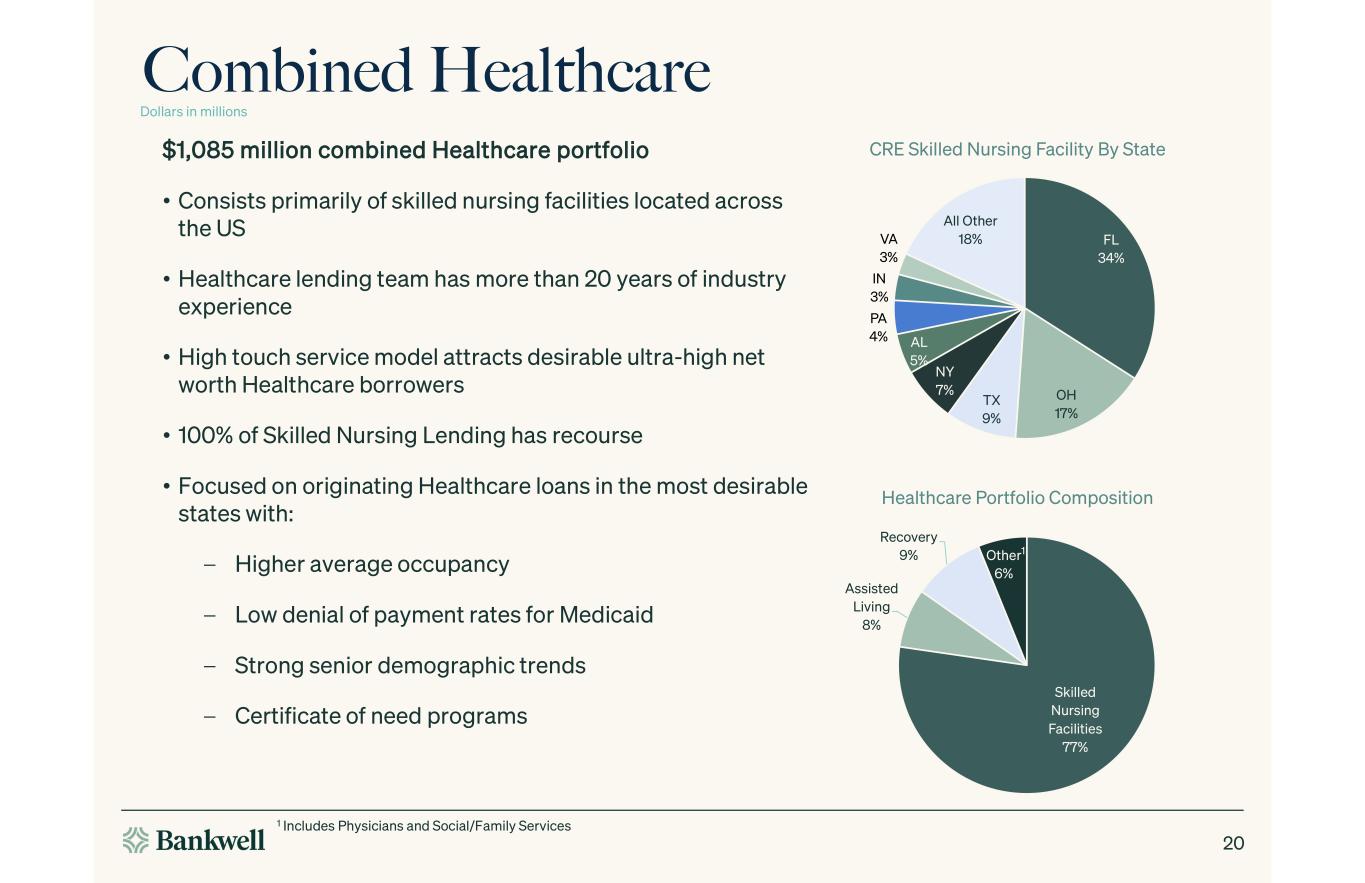
Appreciate that color there. And then And the other thing here, just in terms of the healthcare business, just kind of curious, you know, you just talked about the trends you're seeing, you know, how are businesses faring? You know, I know there were some challenges called six to 12 months ago in terms of the ability to refinance the permanent market and get revenues to where they wanted to be. You know, just curious on that aspect of things and also the competitive landscape for lending into that market.
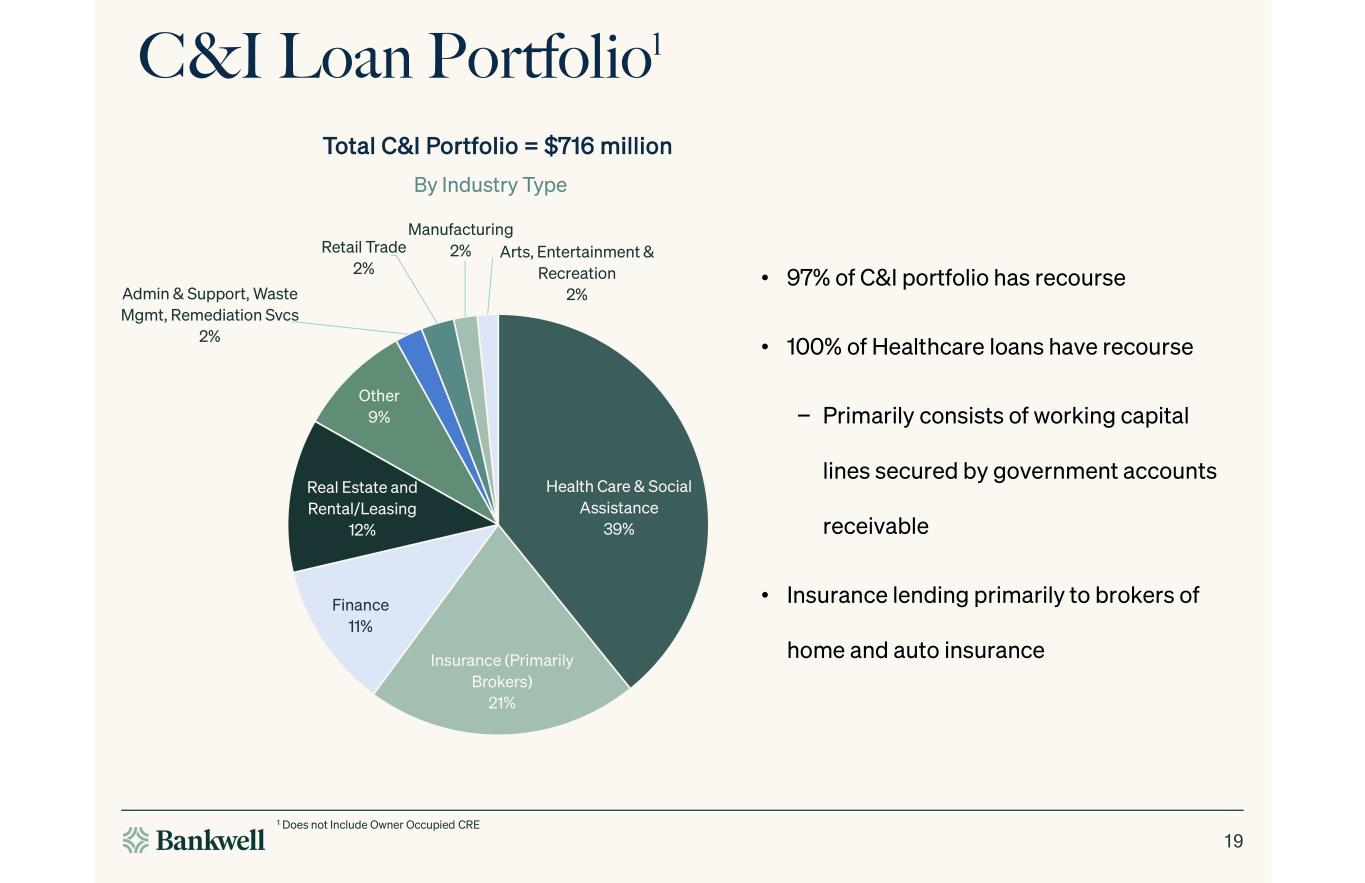
Very particular about the states where we originate for, you know, senior housing particularly, which is where the those headwinds are largely behind the industry. The places where we originate, you know, we're seeing a lot of strength in cash flows. We're seeing growth in revenue, you know, expenses being controlled, you know, the expense control is largely due to having enough labor to operate the facilities and not having to go to agency. So, all of those headwinds seem to be behind the operators for now in the states where we're originating our business. And, you know, we think this is a very good time to be in the business. Other banks have now come to that conclusion as well. And so the lending activity amongst, you know, other banks and non-bank lending, so many people have come back to the market. So it is more competitive. We are fortunate in the fact that, you know, we're, you know, our customers come to us for our strong execution. That hasn't changed. And, you know, we still have, you know, as much access as we want to the market.
Okay. And just in terms of pricing, is it incrementally more competitive or kind of, you know, spread tight and tight materially? Just kind of curious there.
We don't often compete on price. You know, like I said, execution is the strong driver of our value creation for our clients. And so we keep our spread, you know, where they are. And that hasn't been a problem for us.
Okay, great. I appreciate that.
And the rest of my question and answer here. so thank you very much nice quarter here thank you thank you we also have a follow-up from freddie strickland of havdi group freddie your line is open please go ahead two quick follow-ups uh one on expenses um totally understand um you know compensating folks for good production um but you know as i think through the back half 26 i know you haven't given 27 guidance but But if we see the expenses step up in the back half on maybe some incentive comp, should I expect that to carry through into 27, or is that kind of a one-time thing until we get through to 27? A long-winded way of asking, could we maybe see expenses step down a little bit in the first quarter of 27 after maybe a little bit higher expenses in the back half of the year, or is this more salary-related?
I would think it's more salary-related. I would think that our run rate will tick up as long as our production continues on the path that it's on, right? So, again, as we perform well, the company will compensate accordingly. So, the expectation would be the expense rate would start to – the run rate would start to tick up.
And that would be correlated with performance. So we'll come back to that number will grow to reflect comp incentive performance. But the only way that's going to happen is if the top line is growing and profitability metrics continue to increase. So we don't want to be in the business and won't be in the business of increasing expenses and decreasing our efficiency ratio. Just want to be clear, this is about scale.
Understood. So at the end of the day, it just sounds like I should really pay attention to efficiency really more than anything, because if you've got increased revenue, you may have some increased expenses just to make sure you're compensating folks.
Right now, we agree with that. Yes.
And one more for me, just, you know, in terms of overall profitability, 15% profit, you know, 146 ROA, really strong, you know, is a 140-ish, you know, 135, 140-ish ROA a good go-forward number for you guys? I know you haven't given formal guidance on those profitability metrics, but I'm just trying to think through whether this quarter's profitability carries forward or kind of what you expect in terms of those metrics.
Well, I think with a little bit of math, and I'm not trying to be a cute confetti, I think if we lay out the expenses and the revenue guidance that we've given, you can kind of get to the numbers pretty close, and yeah, we're not surprised that they increased this quarter, and we see no reason for them to decrease, you know, unless the world changes.
Fair enough. thanks for taking my follow-ups. I appreciate it. Thank you very much.
Operator
There are no further questions at this time. This concludes today's call. Thank you for attending. You may now disconnect.